Embed Size (px)
Citation preview
Vol.:(0123456789)1 3
Journal of Petroleum Exploration and Production (2021) 11:1123–1138 https://doi.org/10.1007/s13202-021-01115-3
ORIGINAL PAPER-EXPLORATION GEOPHYSICS
Geological mapping and mineral prospectivity using remote sensing and GIS in parts of Hamissana, Northeast Sudan
Mohamed Taha AlMakki Mohamed1 · Latifa Shaheen Al‑Naimi2 · Tochukwu Innocent Mgbeojedo3 · Chidiebere Charles Agoha4
Received: 19 November 2020 / Accepted: 8 February 2021 / Published online: 6 March 2021 © The Author(s) 2021
AbstractIn recent years, various geological activities and different mineral prospecting and exploration programs have been intensi-fied along the Red Sea hills in order to elucidate the geological maps and to evaluate the mineral potentials. This study is therefore aimed at testing the viability of using remote sensing and geographic information system (GIS) techniques for geological mapping and prospecting for gold mineralization in the area. The study area is located in northeast Sudan and covers an area of about 1379 km2. Different digital image processing techniques were applied to Landsat 8 Operational Land Imager image in order to increase the discrimination between various lithological units and to delineate wall rock alteration which represents target zones for gold mineralization. Image sharpening was performed to enhance the spatial resolution of the images for more detailed information. Contrast stretching was applied after the various digital processing procedures to produce more interpretable images. The principal component analysis transformations yielded saturated images and resulted in more interpretable images than the original data. Several ratio images were prepared, combined together and displayed in RGB color composite ratio images. This process revealed the existence of alteration zones in the study area. These zones extend from the northeast to the southwest in the acid meta-volcanic and silica barite rocks. The enhanced satellite images were implemented in the GIS environment to facilitate the final production of the geological map at scale 1:400,000. X-ray fluorescence analyses prove that selected samples taken from the wall rock alteration zones are gold-bearing.
Keywords Geographic information system · Remote sensing · Digital image · Landsat · X-ray fluorescence · Spatial resolution
Introduction
Remote sensing and GIS techniques have been used for geologic interpretations with resounding success. Remote sensing techniques are generally employed because they provide a cost-effective approach resulting from their abil-ity to access difficult terrains and landforms (such as some
mountains and forest terrains) and data collection can be done rapidly at frequent intervals on a large scale. This thus opened a new era in the mapping of lithologies and alteration zones. Previously, geological maps were developed from field observations derived from the conventional ground survey studies. The plotting of these maps and extrapola-tion of details were quite rigorous, leading to some unavoid-able errors and inaccuracies. The advent of remote sensing and GIS operations has resulted in continuous procedural changes in mapping activities. Now remote sensing tech-niques play an important role in mapping programs (Farina et al. 2005). Remote sensing is the science of acquiring, pro-cessing and interpreting images and related data, acquired from aircraft and satellites that record the interaction between matter and electromagnetic energy (Sabins 1997).
Using data acquired from remote sensing, geologists have focussed on global experiences in several fields of earth science such as environmental, mineral ore and
* Tochukwu Innocent Mgbeojedo [email protected]
1 Department of Geology, University of Khartoum, Khartoum, Sudan
2 Department of Chemistry and Earth Sciences, Qatar University, Doha, Qatar
3 Geotechnical Department, Arab Center for Engineering Studies, Doha, Qatar
4 Department of Geology, Federal University of Technology, PMB 1526, Owerri, Nigeria
1124 Journal of Petroleum Exploration and Production (2021) 11:1123–1138
1 3
hydrocarbon exploration (Aminzadeh and Samani 2006; Elsayed Zeinelabdein and Albiely 2008; Elsayed and El Nadi 2014; Omer and Elsayed Zeinelabdein 2018; Petrovic et al. 2012). The mapping of hydrothermal alteration is based on the examination of the spectral signatures of the mineral veins. It is now known that certain minerals associated with hydrothermal alterations have unique spectral features that allow them to be remotely identified and detected (Modab-beri et al. 2017). Lithological mapping and the recognition of hydrothermally altered minerals through the application of remotely sensed data have given encouraging results in the exploration of gold, magnetite and other ore deposits (Amer et al. 2012; Azizi et al. 2010; Rajendran et al. 2012 Van Ruitenbeek et al. 2012).
Remote sensing provides a great merit of synoptic view that is unachievable with most other geophysical prospecting methods. There is also the advantage associated with giving a regional and integrated perspective of the relationships among various land features.
Nowadays, multispectral and high-resolution data are available with digital image processing techniques with advanced capabilities. These have further enlarged the potential of remote sensing in delineating geological struc-tures and lithologies by generating enhanced and interpret-able images with a better accuracy level (Drury 1987). The existing multispectral satellite systems are designed and programmed to study natural resources with special focus on vegetative cover, lithology and mineral/ore exploration (Crippen and Blom 2001; Yousif and Shedid 1999; Abrams 1984).
Several applications of remote sensing in geological stud-ies involve delineating structures/structural features, min-eral resource exploration rock and soil type discrimination. (Kruse and Dietz 1991). The launch of Landsat Thematic Mapper (TM) in 1982 gave earth scientists access to better spatial (30 m) and spectral resolution (Abrams 1984), com-pared to the multispectral scanner (MSS) used, for detailed geological studies (Podwysocki et al. 1983). The Landsat TM and ETM+data have been used in various geological surveys for lithological discrimination, lineaments and min-eral mapping by using hyper-spectral laboratory (Abrams 1984). Multispectral remote sensing is essential in lithologi-cal mapping and zones of alteration, especially in regions of exposed bedrock and bedrock surfaces.
Landsat imagery has been employed for geological pur-poses by several authors including Elsayed Zeinelabdein and El Nadi (2014); Pournamdary et al. (2014); Safari et al. (2017); Pour and Hashim (2015).
Studies conducted in Southwest USA and elsewhere (Prost 1980; Rowan and Kahle 1982; Podwysocki et al. 1983; Abrams 1984) confirmed that the use of the ratio of TM bands 5 and 7 could make areas of hydrothermal altera-tions distinguishable.
Other studies utilized band ratioing method to deline-ate alteration zones around eastern Red Sea Hills (Elsayed Zeinelabdein and Albiely 2008), while lithological mapping was accomplished through image processing techniques in North Sudan (Ali et al. 2012). Remote sensing, GIS and geo-chemical techniques were used in prospecting for gold min-eralization in North Kordofan, Sudan, with results reveal-ing favourable hydrothermal mineral alteration signals, and the presence of auriferous host rocks (Elsayed Zeinelabdein et al. 2020).
These studies reveal that the spectral characteristics of TM bands make them well suited for lithological mapping.
Location, accessibility and geography
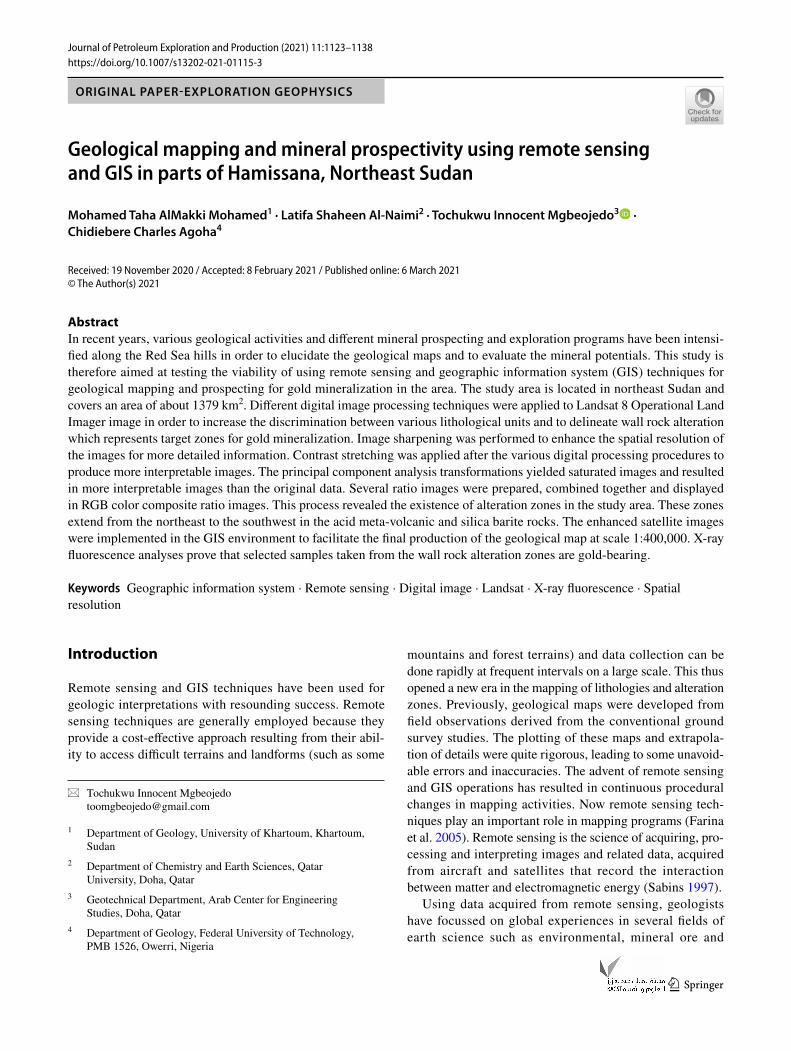
The area studied is in the west of Hamissana, Wadi Edom, which is located in the northwestern flanks of the Red Sea Hills bounded between latitudes 20° 22`N and 20° 50`N and longitudes 34° 00`E and 34° 45`E. The total area studied is approximately 1379 square kilometres (Fig. 1). It forms a part of the Gabgaba terrain that is known to be created among the other four terrains of Northeast Sudan (Tokar, Heya, Gebeit and Gerf) during the Pan-African event (950–500 Ma) due to subduction-related processes and col-lisional tectonics sutured together by dismembered-ophiolite belts and major shear zones.
Topography and drainage system
The study area (Wadi Eldoum) lies in the northern part of the Red Sea hills topographic terrain, which generally ranges in height between 500 and 1500 m above sea level with some isolated peaks that reach up to 2000 m.
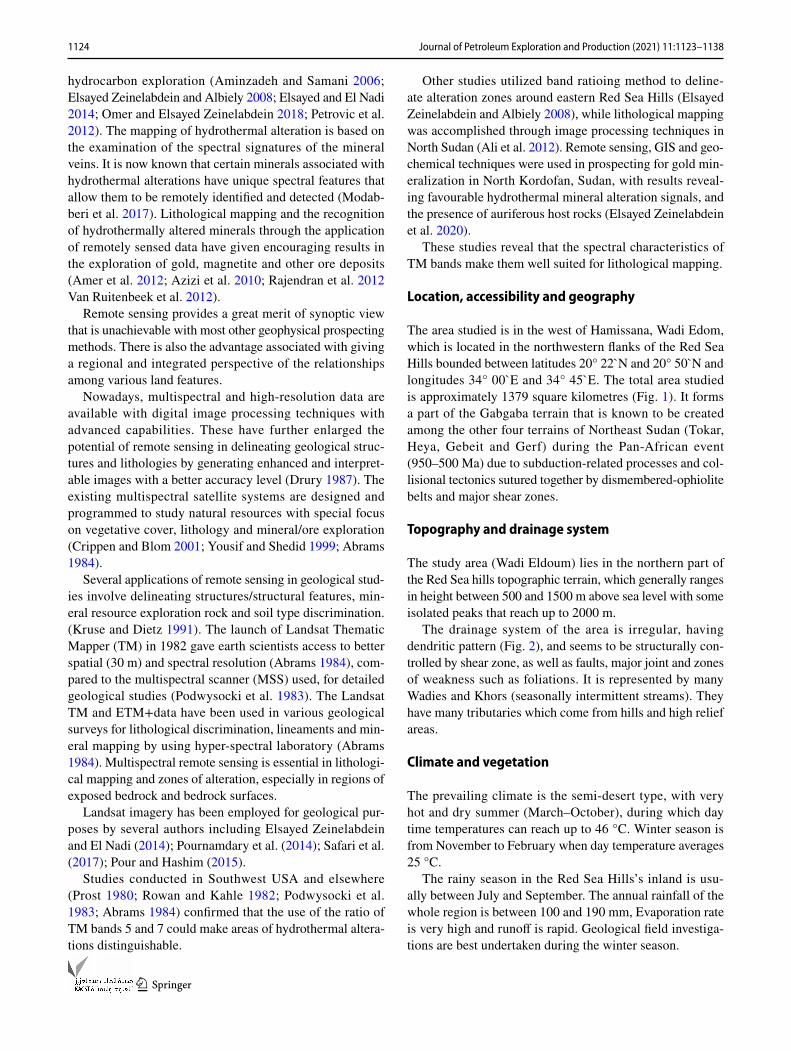
The drainage system of the area is irregular, having dendritic pattern (Fig. 2), and seems to be structurally con-trolled by shear zone, as well as faults, major joint and zones of weakness such as foliations. It is represented by many Wadies and Khors (seasonally intermittent streams). They have many tributaries which come from hills and high relief areas.
Climate and vegetation
The prevailing climate is the semi-desert type, with very hot and dry summer (March–October), during which day time temperatures can reach up to 46 °C. Winter season is from November to February when day temperature averages 25 °C.
The rainy season in the Red Sea Hills’s inland is usu-ally between July and September. The annual rainfall of the whole region is between 100 and 190 mm, Evaporation rate is very high and runoff is rapid. Geological field investiga-tions are best undertaken during the winter season.
1125Journal of Petroleum Exploration and Production (2021) 11:1123–1138
1 3
Fig. 1 Location map of the study area
Fig. 2 Drainage and digital elevation map (DEM) of the study area
1126 Journal of Petroleum Exploration and Production (2021) 11:1123–1138
1 3
Vegetation is poor and scarce. Bushes and small trees such as Acacia Nilotica, Acacia Etabacia and Xerophytes are confined to the seasonal water courses and some of the sandy plains. Short-lived grass flourishes following the occasional rains on the hill sides and in the plains.
Materials and method
Different data, materials and methods of data processing have been utilized in the study, and they are illustrated as follows.
Operational land imager (OLI) and thermal infrared sen-sor (TIRS), Landsat-8 (path 173/Raw 46) acquired on April 30, 2015, were downloaded from the United States Geo-logical Survey (USGS) in a digital format with 16-bit pixel values characteristics. It contains 11 bands. Nine bands with OLI (from band 2 to band 9) were carried in order to define the main lithological units, major structural elements, drain-age pattern and to delineate the zones of gold mineralization. Digital Terrain Model (DTM, 90 m resolution) of the area was obtained to enhance the interpretation process and to delineate the drainage system and lineaments. Digital image processing was carried out using the ERDAS IMAGINE® version 14.00 build 350, while ArcGIS 10.3 was used for data integration and geological mapping.
Visual interpretation of digitally enhanced images was done; different data types were integrated with the ERDAS IMAGINE® environment and then with the geographic information system (ArcGIS 10.3), in order to generate the final geological map and delineate zone of mineralization.
Thirty-six chip samples were collected from quartz veins and mylonitic rocks. Other rock types were collected for geo-chemical investigation and analyzed using the XRF method. Twenty-five rock hand specimens were collected for thin and polish sectioning of representative samples for petrographic work (using an optical microscope). This is in addition to 52 rock samples collected which represent different selected localities for petrographic interpretation.
Collections of ground control points, rock sampling and structural elements were recorded by GPS receiver during these geo-traverses.
Digital image processing
This is the manipulation of digital data by computer pro-grams in order to improve the appearance of an image (Gib-son 2000). The data used in digital image processing of the present study are the Operational Land Imager (OLI) and the Thermal Infrared Sensor (TIRS). The spatial resolution of OLI multispectral bands is 30 m, the panchromatic band is 15 m, and the thermal band is 100 m. The thermal infra-red band has not been used because of its coarse spatial
resolution. The software ERDAS IMAGINE is a revolution-ary image processing system used in processing the above-mentioned satellite data to enhance the quality of their raw digital data and produce images suitable for geological interpretation.
Image interpretation entails distinguishing features based mainly on tonal and textural variations. The following digital image processing techniques outlined below were used.
Image preparation
The image preparation for the present study included the following steps:
Image subseting
Using ERDAS IMAGINE®software, spatial subseting was performed on the raw digital images including band 2, 3, 4, 5, 6 and 7 in order to spatially resize the image to the following coordinates: longitude 34° 00ʹE–34°45ʹE and lati-tude 20° 22′N–20°50`N. This subset covers the study area and helped in tracing major structural elements over a wider regional area.
Resolution enhancement
The resolution of an image refers to the possible detail reflected by the imagery. This could be in the form of spa-tial resolution, spectral resolution and temporal resolution. In this study, image sharpening was used to automatically merge the low-resolution multispectral band with the high-resolution greyscale band (with resampling to the high-res-olution pixel size).
Contrast stretching
Contrast stretching modifies the grayscale to produce a more interpretable image (Sabins 2000). The number of actually recorded intensity levels in the scene is rather low, and the full dynamic range of the digital image (256 levels) is not fully utilized. It is worth mentioning that contrast stretching was applied in this study after various digital processing pro-cedures to enhance the resulting image, and was not applied as a separate enhancement process. This process basically increases the spatial frequency of the imagery by enhancing such high-frequency features like lineaments.
Principal component analysis (PCA)
Principal component analysis is often called PCA, or Kar-hunen–Loeve analysis. Principal components analysis is a change detection technique that converts a set of observa-tions of possibly correlated variables into a set of values of
1127Journal of Petroleum Exploration and Production (2021) 11:1123–1138
1 3
linearly uncorrelated variables, called principal components (El Zalaky et al. 2018). The transformation of the raw data using PCA can result in new principal component images that are more interpretable than the original data (Jensen 1996). The PCA is used to compress the information content of a number of bands of imagery or to reduce the dimension-ality from a number of bands in two or three PCs (Jensen 1996). In continuation, PCA is extensively applied in remote sensing to determine alterations in rocks and vegetation in a given area. It is also used to reduce the redundancy of information in highly correlated image set.
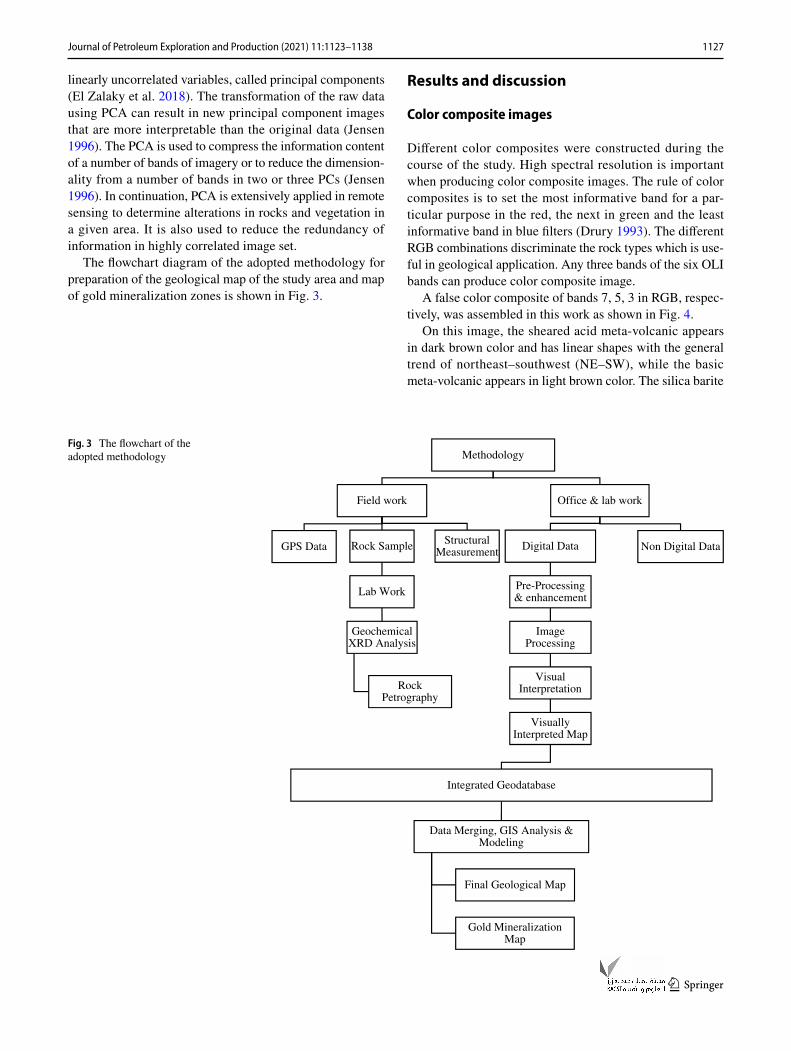
The flowchart diagram of the adopted methodology for preparation of the geological map of the study area and map of gold mineralization zones is shown in Fig. 3.
Results and discussion
Color composite images
Different color composites were constructed during the course of the study. High spectral resolution is important when producing color composite images. The rule of color composites is to set the most informative band for a par-ticular purpose in the red, the next in green and the least informative band in blue filters (Drury 1993). The different RGB combinations discriminate the rock types which is use-ful in geological application. Any three bands of the six OLI bands can produce color composite image.
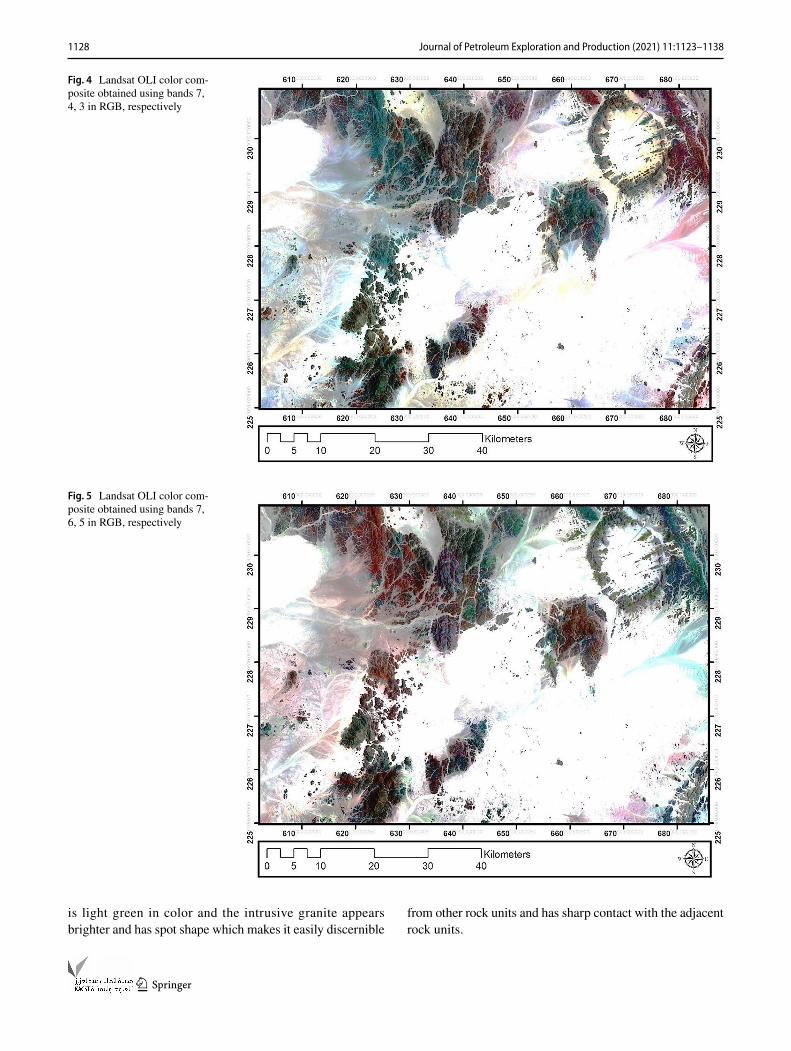
A false color composite of bands 7, 5, 3 in RGB, respec-tively, was assembled in this work as shown in Fig. 4.
On this image, the sheared acid meta-volcanic appears in dark brown color and has linear shapes with the general trend of northeast–southwest (NE–SW), while the basic meta-volcanic appears in light brown color. The silica barite
Fig. 3 The flowchart of the adopted methodology Methodology
Field work
GPS Data Rock Sample
Lab Work
Geochemical XRD Analysis
Rock Petrography
Structural Measurement
Office & lab work
Digital Data
Pre-Processing & enhancement
Image Processing
Visual Interpretation
Visually Interpreted Map
Integrated Geodatabase
Data Merging, GIS Analysis & Modeling
Gold Mineralization Map
Final Geological Map
Non Digital Data
1128 Journal of Petroleum Exploration and Production (2021) 11:1123–1138
1 3
is light green in color and the intrusive granite appears brighter and has spot shape which makes it easily discernible
from other rock units and has sharp contact with the adjacent rock units.
Fig. 4 Landsat OLI color com-posite obtained using bands 7, 4, 3 in RGB, respectively
Fig. 5 Landsat OLI color com-posite obtained using bands 7, 6, 5 in RGB, respectively
1129Journal of Petroleum Exploration and Production (2021) 11:1123–1138
1 3
Another color composite was prepared using the infrared bands of the image set. It was composed by employing bands 7, 6, 5 in RGB, respectively, as shown in Fig. 5. This band combination is termed the infrared image.
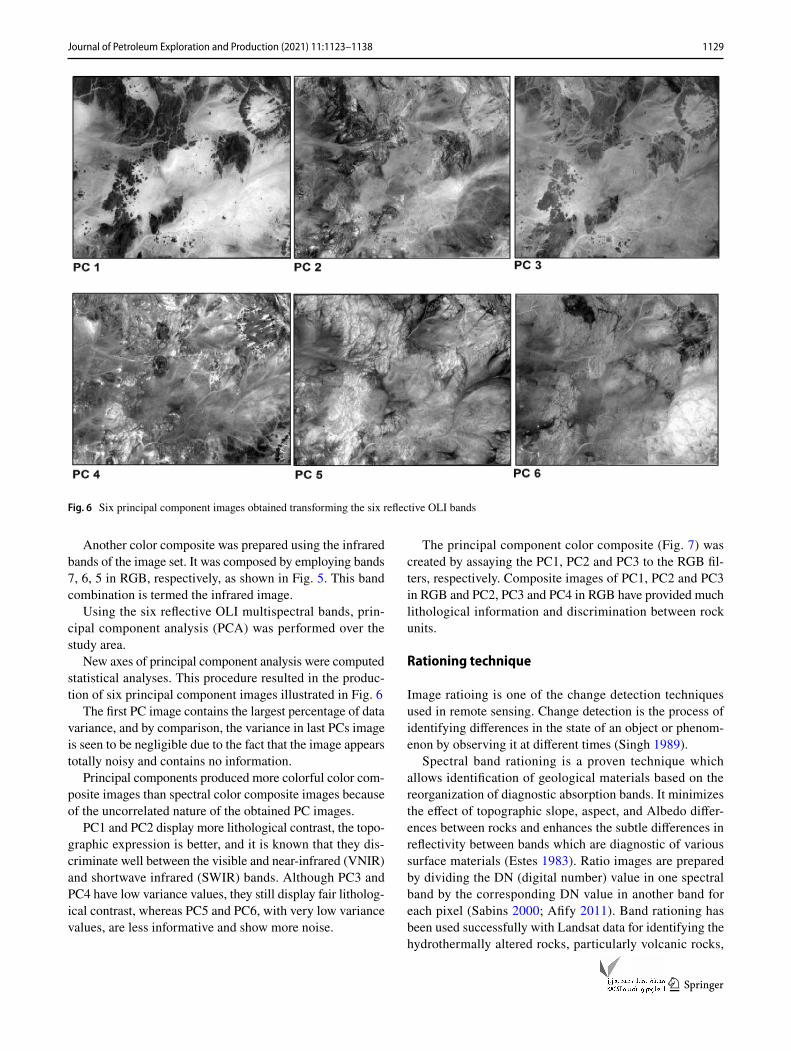
Using the six reflective OLI multispectral bands, prin-cipal component analysis (PCA) was performed over the study area.
New axes of principal component analysis were computed statistical analyses. This procedure resulted in the produc-tion of six principal component images illustrated in Fig. 6
The first PC image contains the largest percentage of data variance, and by comparison, the variance in last PCs image is seen to be negligible due to the fact that the image appears totally noisy and contains no information.
Principal components produced more colorful color com-posite images than spectral color composite images because of the uncorrelated nature of the obtained PC images.
PC1 and PC2 display more lithological contrast, the topo-graphic expression is better, and it is known that they dis-criminate well between the visible and near-infrared (VNIR) and shortwave infrared (SWIR) bands. Although PC3 and PC4 have low variance values, they still display fair litholog-ical contrast, whereas PC5 and PC6, with very low variance values, are less informative and show more noise.
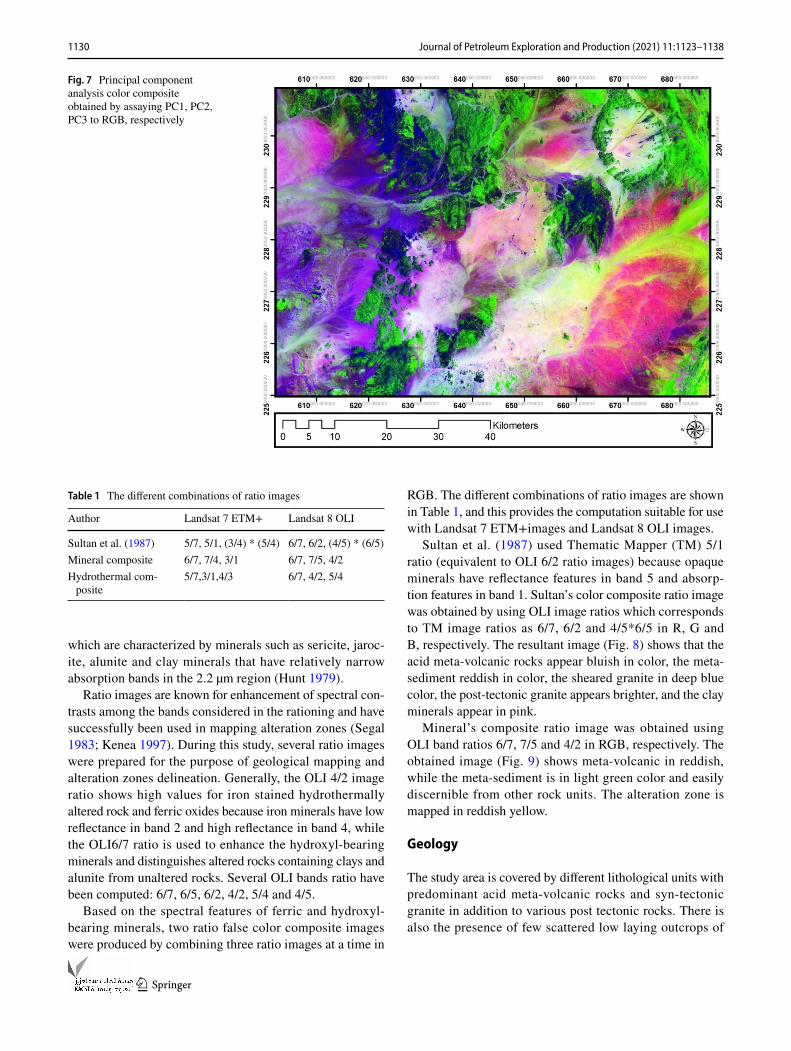
The principal component color composite (Fig. 7) was created by assaying the PC1, PC2 and PC3 to the RGB fil-ters, respectively. Composite images of PC1, PC2 and PC3 in RGB and PC2, PC3 and PC4 in RGB have provided much lithological information and discrimination between rock units.
Rationing technique
Image ratioing is one of the change detection techniques used in remote sensing. Change detection is the process of identifying differences in the state of an object or phenom-enon by observing it at different times (Singh 1989).
Spectral band rationing is a proven technique which allows identification of geological materials based on the reorganization of diagnostic absorption bands. It minimizes the effect of topographic slope, aspect, and Albedo differ-ences between rocks and enhances the subtle differences in reflectivity between bands which are diagnostic of various surface materials (Estes 1983). Ratio images are prepared by dividing the DN (digital number) value in one spectral band by the corresponding DN value in another band for each pixel (Sabins 2000; Afify 2011). Band rationing has been used successfully with Landsat data for identifying the hydrothermally altered rocks, particularly volcanic rocks,
Fig. 6 Six principal component images obtained transforming the six reflective OLI bands
1130 Journal of Petroleum Exploration and Production (2021) 11:1123–1138
1 3
which are characterized by minerals such as sericite, jaroc-ite, alunite and clay minerals that have relatively narrow absorption bands in the 2.2 µm region (Hunt 1979).
Ratio images are known for enhancement of spectral con-trasts among the bands considered in the rationing and have successfully been used in mapping alteration zones (Segal 1983; Kenea 1997). During this study, several ratio images were prepared for the purpose of geological mapping and alteration zones delineation. Generally, the OLI 4/2 image ratio shows high values for iron stained hydrothermally altered rock and ferric oxides because iron minerals have low reflectance in band 2 and high reflectance in band 4, while the OLI6/7 ratio is used to enhance the hydroxyl-bearing minerals and distinguishes altered rocks containing clays and alunite from unaltered rocks. Several OLI bands ratio have been computed: 6/7, 6/5, 6/2, 4/2, 5/4 and 4/5.
Based on the spectral features of ferric and hydroxyl-bearing minerals, two ratio false color composite images were produced by combining three ratio images at a time in
RGB. The different combinations of ratio images are shown in Table 1, and this provides the computation suitable for use with Landsat 7 ETM+images and Landsat 8 OLI images.
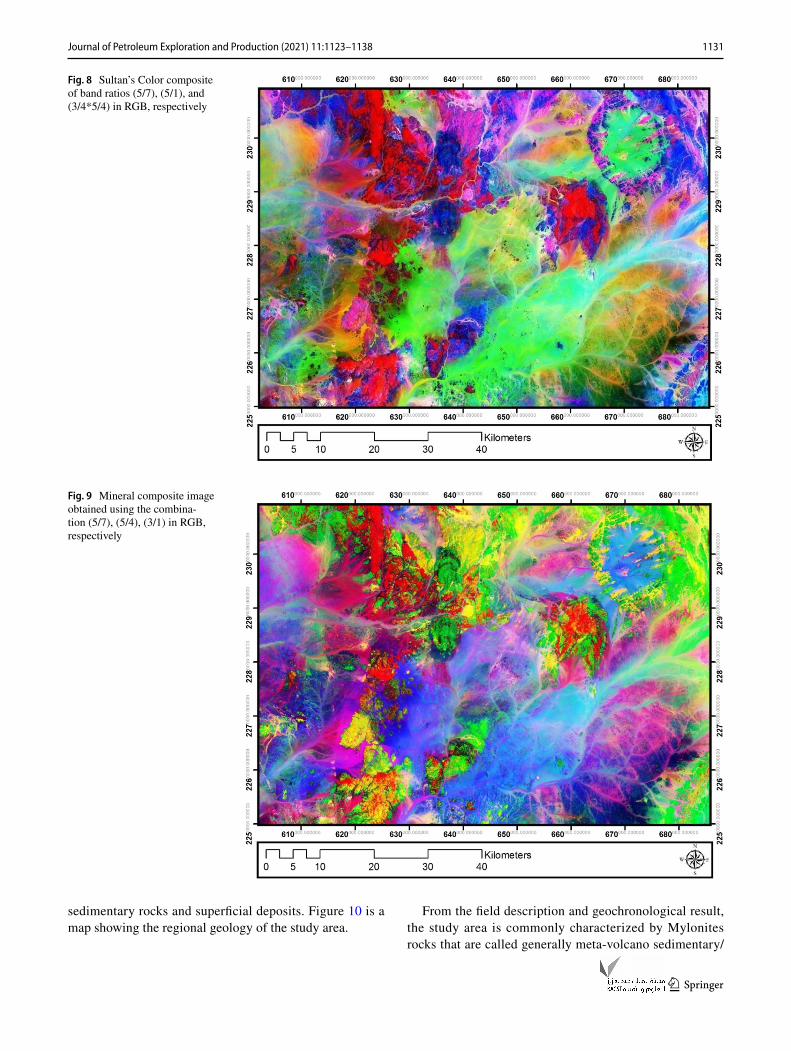
Sultan et al. (1987) used Thematic Mapper (TM) 5/1 ratio (equivalent to OLI 6/2 ratio images) because opaque minerals have reflectance features in band 5 and absorp-tion features in band 1. Sultan’s color composite ratio image was obtained by using OLI image ratios which corresponds to TM image ratios as 6/7, 6/2 and 4/5*6/5 in R, G and B, respectively. The resultant image (Fig. 8) shows that the acid meta-volcanic rocks appear bluish in color, the meta-sediment reddish in color, the sheared granite in deep blue color, the post-tectonic granite appears brighter, and the clay minerals appear in pink.
Mineral’s composite ratio image was obtained using OLI band ratios 6/7, 7/5 and 4/2 in RGB, respectively. The obtained image (Fig. 9) shows meta-volcanic in reddish, while the meta-sediment is in light green color and easily discernible from other rock units. The alteration zone is mapped in reddish yellow.
Geology
The study area is covered by different lithological units with predominant acid meta-volcanic rocks and syn-tectonic granite in addition to various post tectonic rocks. There is also the presence of few scattered low laying outcrops of
Fig. 7 Principal component analysis color composite obtained by assaying PC1, PC2, PC3 to RGB, respectively
Table 1 The different combinations of ratio images
Author Landsat 7 ETM+ Landsat 8 OLI
Sultan et al. (1987) 5/7, 5/1, (3/4) * (5/4) 6/7, 6/2, (4/5) * (6/5)Mineral composite 6/7, 7/4, 3/1 6/7, 7/5, 4/2Hydrothermal com-
posite5/7,3/1,4/3 6/7, 4/2, 5/4
1131Journal of Petroleum Exploration and Production (2021) 11:1123–1138
1 3
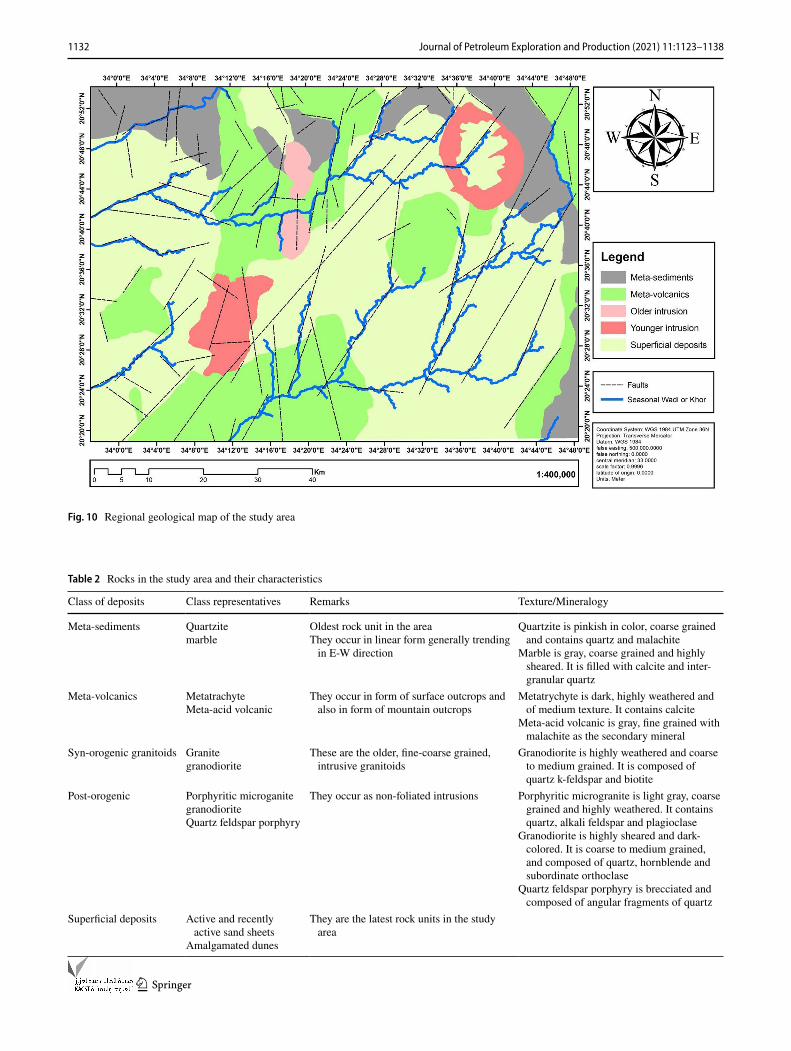
sedimentary rocks and superficial deposits. Figure 10 is a map showing the regional geology of the study area.
From the field description and geochronological result, the study area is commonly characterized by Mylonites rocks that are called generally meta-volcano sedimentary/
Fig. 8 Sultan’s Color composite of band ratios (5/7), (5/1), and (3/4*5/4) in RGB, respectively
Fig. 9 Mineral composite image obtained using the combina-tion (5/7), (5/4), (3/1) in RGB, respectively
1132 Journal of Petroleum Exploration and Production (2021) 11:1123–1138
1 3
Fig. 10 Regional geological map of the study area
Table 2 Rocks in the study area and their characteristics
Class of deposits Class representatives Remarks Texture/Mineralogy
Meta-sediments Quartzitemarble
Oldest rock unit in the areaThey occur in linear form generally trending
in E-W direction
Quartzite is pinkish in color, coarse grained and contains quartz and malachite
Marble is gray, coarse grained and highly sheared. It is filled with calcite and inter-granular quartz
Meta-volcanics MetatrachyteMeta-acid volcanic
They occur in form of surface outcrops and also in form of mountain outcrops
Metatrychyte is dark, highly weathered and of medium texture. It contains calcite
Meta-acid volcanic is gray, fine grained with malachite as the secondary mineral
Syn-orogenic granitoids Granitegranodiorite
These are the older, fine-coarse grained, intrusive granitoids
Granodiorite is highly weathered and coarse to medium grained. It is composed of quartz k-feldspar and biotite
Post-orogenic Porphyritic microganitegranodioriteQuartz feldspar porphyry
They occur as non-foliated intrusions Porphyritic microgranite is light gray, coarse grained and highly weathered. It contains quartz, alkali feldspar and plagioclase
Granodiorite is highly sheared and dark-colored. It is coarse to medium grained, and composed of quartz, hornblende and subordinate orthoclase
Quartz feldspar porphyry is brecciated and composed of angular fragments of quartz
Superficial deposits Active and recently active sand sheets
Amalgamated dunes
They are the latest rock units in the study area
1133Journal of Petroleum Exploration and Production (2021) 11:1123–1138
1 3
plutonic sequences. The table below highlights the occur-rence and properties of these rocks (Table 2).
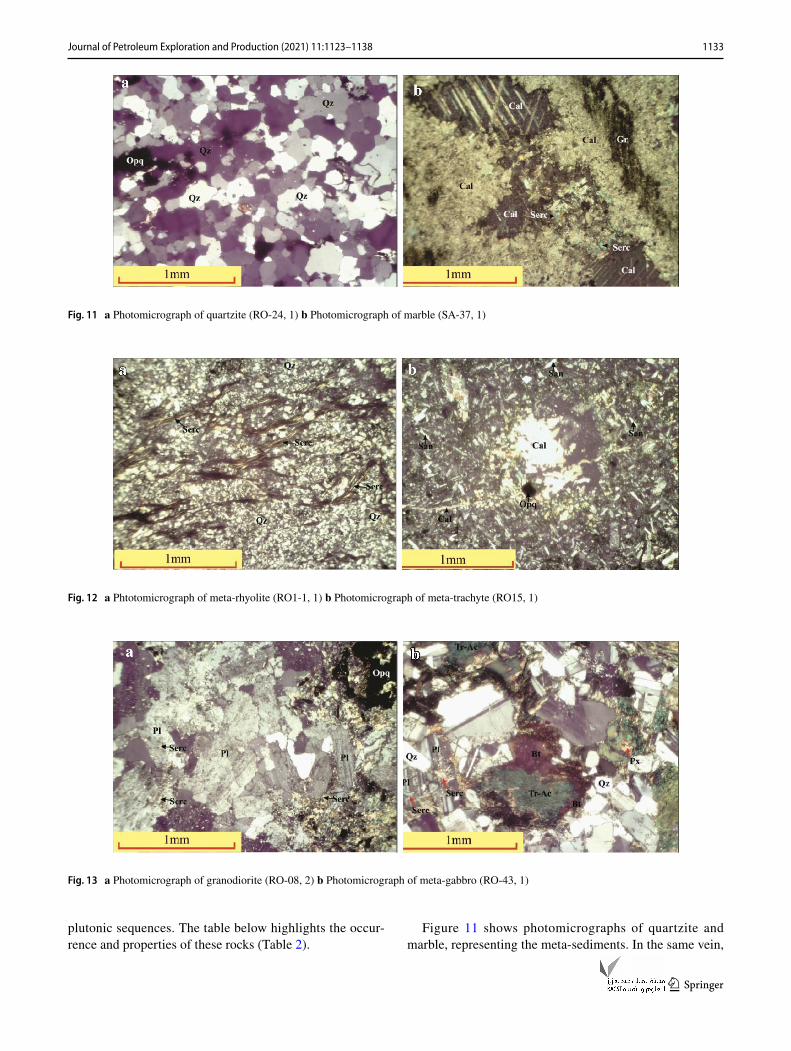
Figure 11 shows photomicrographs of quartzite and marble, representing the meta-sediments. In the same vein,
Fig. 11 a Photomicrograph of quartzite (RO-24, 1) b Photomicrograph of marble (SA-37, 1)
Fig. 12 a Phtotomicrograph of meta-rhyolite (RO1-1, 1) b Photomicrograph of meta-trachyte (RO15, 1)
Fig. 13 a Photomicrograph of granodiorite (RO-08, 2) b Photomicrograph of meta-gabbro (RO-43, 1)
1134 Journal of Petroleum Exploration and Production (2021) 11:1123–1138
1 3
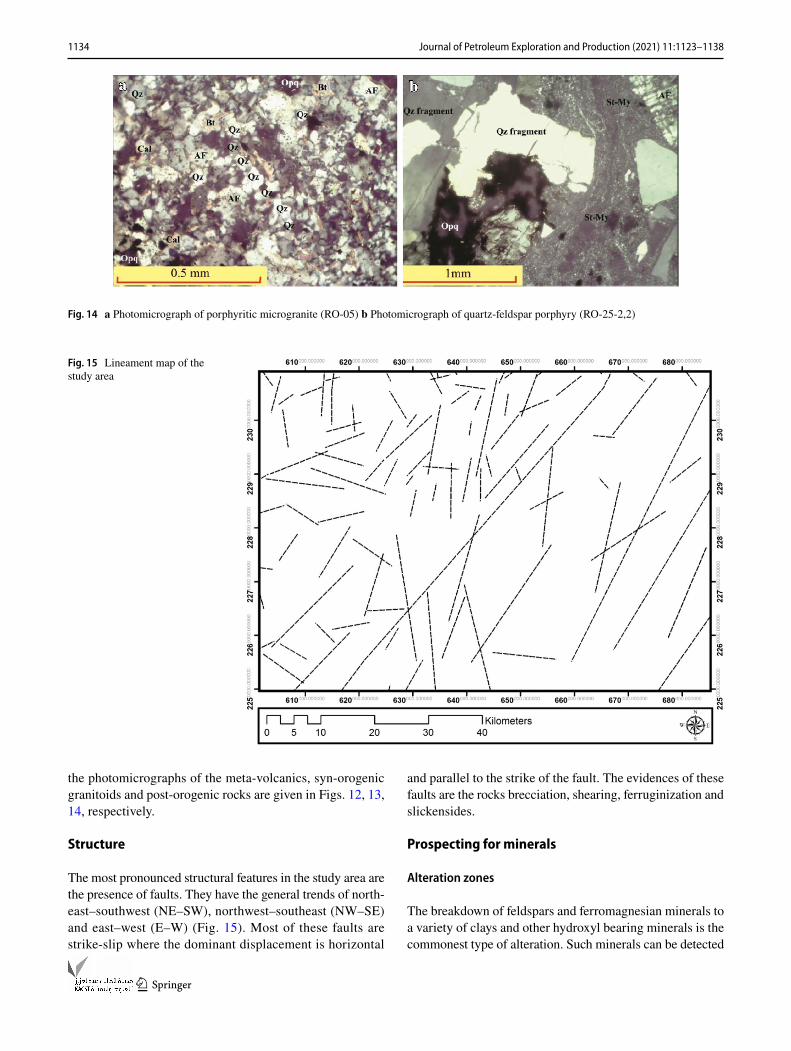
the photomicrographs of the meta-volcanics, syn-orogenic granitoids and post-orogenic rocks are given in Figs. 12, 13, 14, respectively.
Structure
The most pronounced structural features in the study area are the presence of faults. They have the general trends of north-east–southwest (NE–SW), northwest–southeast (NW–SE) and east–west (E–W) (Fig. 15). Most of these faults are strike-slip where the dominant displacement is horizontal
and parallel to the strike of the fault. The evidences of these faults are the rocks brecciation, shearing, ferruginization and slickensides.
Prospecting for minerals
Alteration zones
The breakdown of feldspars and ferromagnesian minerals to a variety of clays and other hydroxyl bearing minerals is the commonest type of alteration. Such minerals can be detected
Fig. 14 a Photomicrograph of porphyritic microgranite (RO-05) b Photomicrograph of quartz-feldspar porphyry (RO-25-2,2)
Fig. 15 Lineament map of the study area
1135Journal of Petroleum Exploration and Production (2021) 11:1123–1138
1 3
by remote sensing techniques since the shortwave infrared (SWIR) range of their spectra exhibit absorption (Drury 1993). It has been well established that ferric iron exhib-its pronounced absorption features at around 0.82 µm and 1.3 µm (infrared region), whereas ferrous iron has absorp-tion at 1.0 µm, 4.8–2.0 µm and 0.55–0.45 µm (Ultra-violet and violet range). Hydroxyl-bearing minerals such as clays have a major absorption feature around 1.9 µm, 2.35 µm and 2.5 µm (band 7) (Gupta 2003). Detection of the above men-tioned minerals has been used as prospecting guide for ore deposits.
To fulfil the objectives of the present study, alteration zone mapping was conducted using Landsat OLI image applying different digital image procedures, such as ration-ing technique and feature oriented principal component analysis. The results of the different techniques utilized to this end are presented in this section.
Mapping alteration zones using rationing techniques
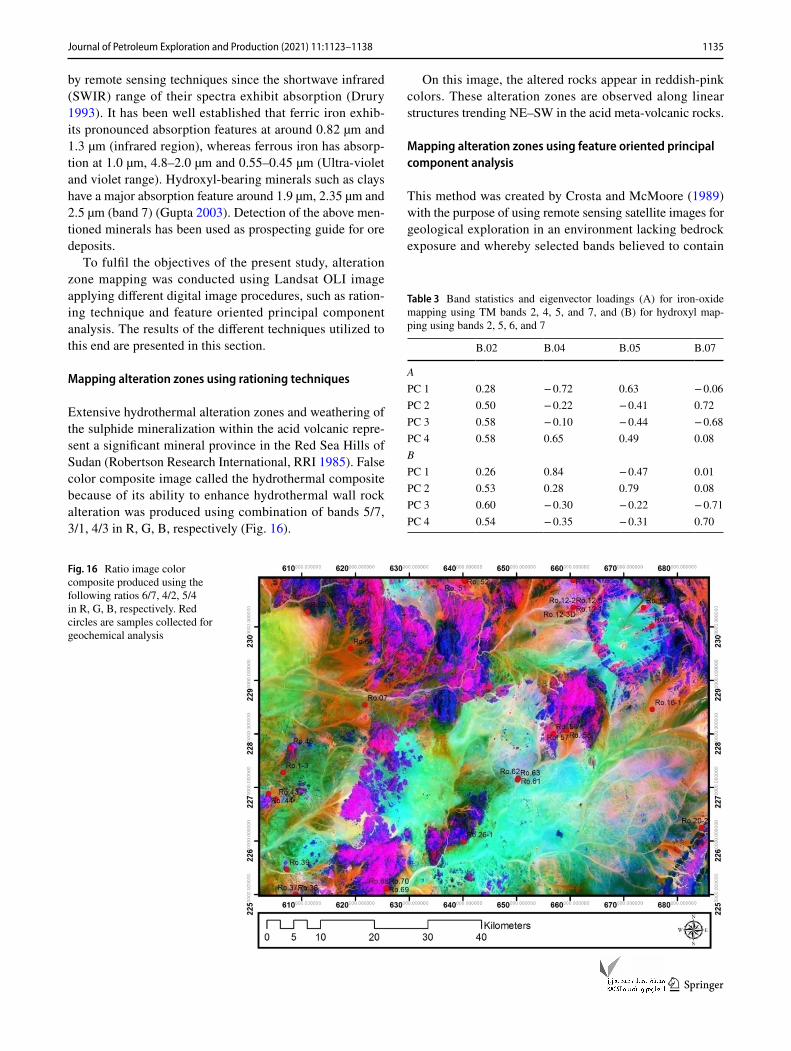
Extensive hydrothermal alteration zones and weathering of the sulphide mineralization within the acid volcanic repre-sent a significant mineral province in the Red Sea Hills of Sudan (Robertson Research International, RRI 1985). False color composite image called the hydrothermal composite because of its ability to enhance hydrothermal wall rock alteration was produced using combination of bands 5/7, 3/1, 4/3 in R, G, B, respectively (Fig. 16).
On this image, the altered rocks appear in reddish-pink colors. These alteration zones are observed along linear structures trending NE–SW in the acid meta-volcanic rocks.
Mapping alteration zones using feature oriented principal component analysis
This method was created by Crosta and McMoore (1989) with the purpose of using remote sensing satellite images for geological exploration in an environment lacking bedrock exposure and whereby selected bands believed to contain
Fig. 16 Ratio image color composite produced using the following ratios 6/7, 4/2, 5/4 in R, G, B, respectively. Red circles are samples collected for geochemical analysis
Table 3 Band statistics and eigenvector loadings (A) for iron-oxide mapping using TM bands 2, 4, 5, and 7, and (B) for hydroxyl map-ping using bands 2, 5, 6, and 7
B.02 B.04 B.05 B.07
APC 1 0.28 − 0.72 0.63 − 0.06PC 2 0.50 − 0.22 − 0.41 0.72PC 3 0.58 − 0.10 − 0.44 − 0.68PC 4 0.58 0.65 0.49 0.08BPC 1 0.26 0.84 − 0.47 0.01PC 2 0.53 0.28 0.79 0.08PC 3 0.60 − 0.30 − 0.22 − 0.71PC 4 0.54 − 0.35 − 0.31 0.70
1136 Journal of Petroleum Exploration and Production (2021) 11:1123–1138
1 3
spectral information over an intended target are used in PC transformation.
For enhancement of both iron-oxides and hydroxyl-bear-ing zones, two sets of four TM bands were selected: bands 1, 3, 4 and 7, and 1, 4, 5 and 7. This selection is based on the fact that the former have contrasting signatures in TM bands 1 and 3, and the latter in TM bands 5 and 7 (Loughlin 1991). The above described two PC transformations were conducted for the study area.
Table 3 summarizes the basic statistics of the bands involved in the transformation and gives the eigenvec-tor loadings of both band sets. As it is clear from Table 3, PC4 has mapped iron-oxides as negative loading (− 0.77) in TM-3 and as (0.13) in TM-1. For hydroxylated miner-als (Table 3), PC4 has relatively more contrasting signature loading (− 0.69) in TM-5 and (0.70) in TM-7.
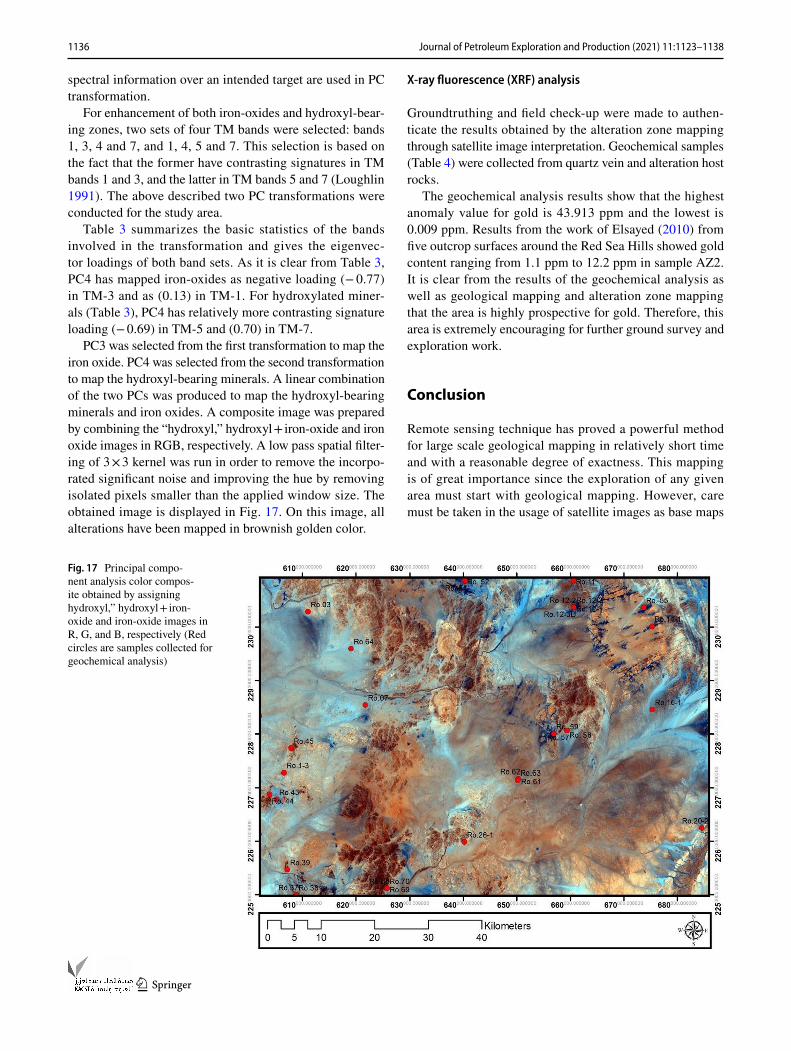
PC3 was selected from the first transformation to map the iron oxide. PC4 was selected from the second transformation to map the hydroxyl-bearing minerals. A linear combination of the two PCs was produced to map the hydroxyl-bearing minerals and iron oxides. A composite image was prepared by combining the “hydroxyl,” hydroxyl + iron-oxide and iron oxide images in RGB, respectively. A low pass spatial filter-ing of 3 × 3 kernel was run in order to remove the incorpo-rated significant noise and improving the hue by removing isolated pixels smaller than the applied window size. The obtained image is displayed in Fig. 17. On this image, all alterations have been mapped in brownish golden color.
X‑ray fluorescence (XRF) analysis
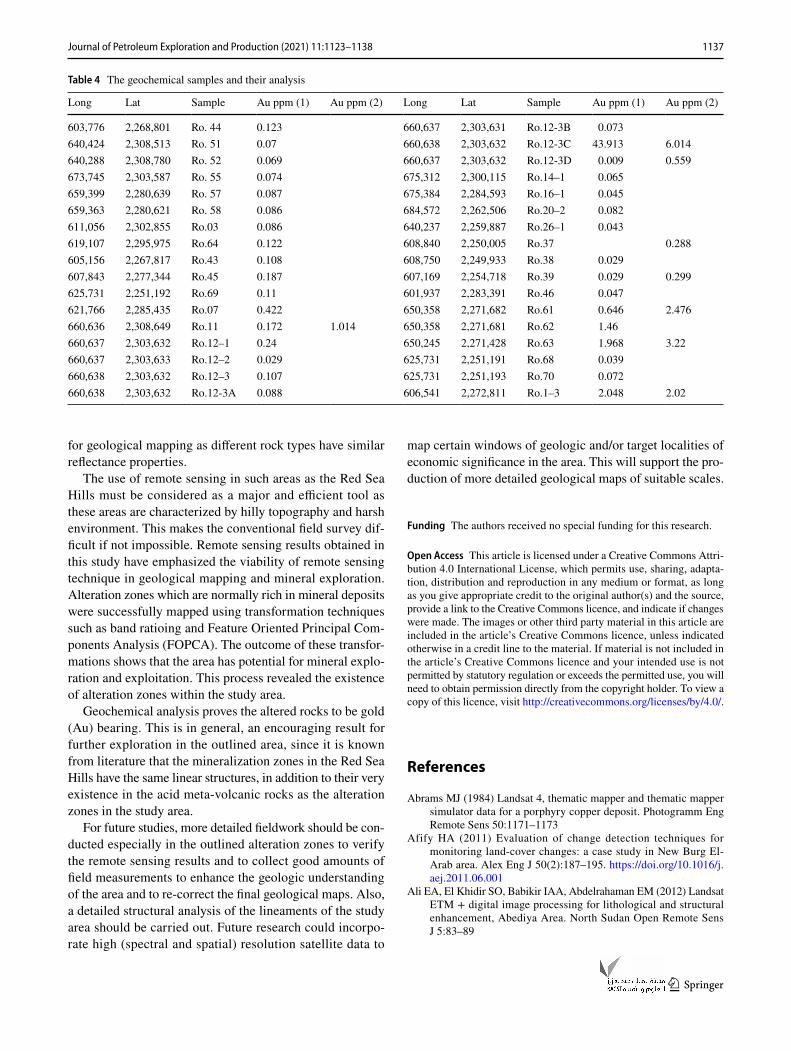
Groundtruthing and field check-up were made to authen-ticate the results obtained by the alteration zone mapping through satellite image interpretation. Geochemical samples (Table 4) were collected from quartz vein and alteration host rocks.
The geochemical analysis results show that the highest anomaly value for gold is 43.913 ppm and the lowest is 0.009 ppm. Results from the work of Elsayed (2010) from five outcrop surfaces around the Red Sea Hills showed gold content ranging from 1.1 ppm to 12.2 ppm in sample AZ2. It is clear from the results of the geochemical analysis as well as geological mapping and alteration zone mapping that the area is highly prospective for gold. Therefore, this area is extremely encouraging for further ground survey and exploration work.
Conclusion
Remote sensing technique has proved a powerful method for large scale geological mapping in relatively short time and with a reasonable degree of exactness. This mapping is of great importance since the exploration of any given area must start with geological mapping. However, care must be taken in the usage of satellite images as base maps
Fig. 17 Principal compo-nent analysis color compos-ite obtained by assigning hydroxyl,” hydroxyl + iron-oxide and iron-oxide images in R, G, and B, respectively (Red circles are samples collected for geochemical analysis)
1137Journal of Petroleum Exploration and Production (2021) 11:1123–1138
1 3
for geological mapping as different rock types have similar reflectance properties.
The use of remote sensing in such areas as the Red Sea Hills must be considered as a major and efficient tool as these areas are characterized by hilly topography and harsh environment. This makes the conventional field survey dif-ficult if not impossible. Remote sensing results obtained in this study have emphasized the viability of remote sensing technique in geological mapping and mineral exploration. Alteration zones which are normally rich in mineral deposits were successfully mapped using transformation techniques such as band ratioing and Feature Oriented Principal Com-ponents Analysis (FOPCA). The outcome of these transfor-mations shows that the area has potential for mineral explo-ration and exploitation. This process revealed the existence of alteration zones within the study area.
Geochemical analysis proves the altered rocks to be gold (Au) bearing. This is in general, an encouraging result for further exploration in the outlined area, since it is known from literature that the mineralization zones in the Red Sea Hills have the same linear structures, in addition to their very existence in the acid meta-volcanic rocks as the alteration zones in the study area.
For future studies, more detailed fieldwork should be con-ducted especially in the outlined alteration zones to verify the remote sensing results and to collect good amounts of field measurements to enhance the geologic understanding of the area and to re-correct the final geological maps. Also, a detailed structural analysis of the lineaments of the study area should be carried out. Future research could incorpo-rate high (spectral and spatial) resolution satellite data to
map certain windows of geologic and/or target localities of economic significance in the area. This will support the pro-duction of more detailed geological maps of suitable scales.
Funding The authors received no special funding for this research.
Open Access This article is licensed under a Creative Commons Attri-bution 4.0 International License, which permits use, sharing, adapta-tion, distribution and reproduction in any medium or format, as long as you give appropriate credit to the original author(s) and the source, provide a link to the Creative Commons licence, and indicate if changes were made. The images or other third party material in this article are included in the article’s Creative Commons licence, unless indicated otherwise in a credit line to the material. If material is not included in the article’s Creative Commons licence and your intended use is not permitted by statutory regulation or exceeds the permitted use, you will need to obtain permission directly from the copyright holder. To view a copy of this licence, visit http://creat iveco mmons .org/licen ses/by/4.0/.
References
Abrams MJ (1984) Landsat 4, thematic mapper and thematic mapper simulator data for a porphyry copper deposit. Photogramm Eng Remote Sens 50:1171–1173
Afify HA (2011) Evaluation of change detection techniques for monitoring land-cover changes: a case study in New Burg El-Arab area. Alex Eng J 50(2):187–195. https ://doi.org/10.1016/j.aej.2011.06.001
Ali EA, El Khidir SO, Babikir IAA, Abdelrahaman EM (2012) Landsat ETM + digital image processing for lithological and structural enhancement, Abediya Area. North Sudan Open Remote Sens J 5:83–89
Table 4 The geochemical samples and their analysis
Long Lat Sample Au ppm (1) Au ppm (2) Long Lat Sample Au ppm (1) Au ppm (2)
603,776 2,268,801 Ro. 44 0.123 660,637 2,303,631 Ro.12-3B 0.073640,424 2,308,513 Ro. 51 0.07 660,638 2,303,632 Ro.12-3C 43.913 6.014640,288 2,308,780 Ro. 52 0.069 660,637 2,303,632 Ro.12-3D 0.009 0.559673,745 2,303,587 Ro. 55 0.074 675,312 2,300,115 Ro.14–1 0.065659,399 2,280,639 Ro. 57 0.087 675,384 2,284,593 Ro.16–1 0.045659,363 2,280,621 Ro. 58 0.086 684,572 2,262,506 Ro.20–2 0.082611,056 2,302,855 Ro.03 0.086 640,237 2,259,887 Ro.26–1 0.043619,107 2,295,975 Ro.64 0.122 608,840 2,250,005 Ro.37 0.288605,156 2,267,817 Ro.43 0.108 608,750 2,249,933 Ro.38 0.029607,843 2,277,344 Ro.45 0.187 607,169 2,254,718 Ro.39 0.029 0.299625,731 2,251,192 Ro.69 0.11 601,937 2,283,391 Ro.46 0.047621,766 2,285,435 Ro.07 0.422 650,358 2,271,682 Ro.61 0.646 2.476660,636 2,308,649 Ro.11 0.172 1.014 650,358 2,271,681 Ro.62 1.46660,637 2,303,632 Ro.12–1 0.24 650,245 2,271,428 Ro.63 1.968 3.22660,637 2,303,633 Ro.12–2 0.029 625,731 2,251,191 Ro.68 0.039660,638 2,303,632 Ro.12–3 0.107 625,731 2,251,193 Ro.70 0.072660,638 2,303,632 Ro.12-3A 0.088 606,541 2,272,811 Ro.1–3 2.048 2.02
1138 Journal of Petroleum Exploration and Production (2021) 11:1123–1138
1 3
Amer R, Kusky T, El Mezayen A (2012) Remote sensing detection of gold related alteration zones of Um Rus Area, central eastern desert of Egypt. Adv Space Res 49:121–134
Aminzadeh B, Samani F (2006) Identifying the boundaries of the historical site of persepolis using remote sensing. Remote Sens Environ 102:52–62
Azizi H, Tarverdi MA, Akbarpour A (2010) Extraction of hydrother-mal alterations from ASTER SWIR data from east Zanjan. North Iran Adv Space Res 46:99–109
Crippen RE, Blom RG (2001) Unveiling the lithology of vegetated terrains in remotely sensed imagery. Photogramm Eng Remote Sens 67(8):935–946
Crosta AP, McMoore J (1989) Enhancement of landsat thematic Map-per imagery for residual soil mapping in SW Minais Gerais State, Brasil: a prospective case history in green stone belt terrain. In: Proceedings of the 7th (ERIM) Thematic Conference—Remote Sensing for Exploration Geology, Calgary, 1989, pp 1173–1187
Drury SA (1987) Image interpretation in geology, 2nd edn. Chapman & Hall, London. https ://doi.org/10.1007/978-94-010-9393-4
Drury SA (1993) Image interpretation in geology, 3rd edn. Chapman & Hall, London
Elsayed Zeinelabdein KA, Albiely AI (2008) Ratio image process-ing techniques: a prospecting tool for mineral deposits, Red Sea Hills, NE Sudan. Int Arch Photogram Remote Sens Spat Inf Sci 37:1295–1297
Elsayed Zeinelabdein KA (2010) Sudan experience in using remote sensing for mineral prospecting. In: Proceedings of the 11th Arab Conference for Mineral Resources, Arab Industrial Development and Mining Organization, Tripoli, Great Jamahiriya. p 636–644
Elsayed Zeinelabdein KA, El Nadi AH (2014) The use of landsat 8 OLI image for the delineation of gossanic ridges in the Red Sea Hills of NE Sudan. Am J Earth Sci 1(3):62–67
El Zalaky MA, Essam ME, El Arefy RA (2018) Assessment of band ratios and feature-oriented principal component selection (FPCS) techniques for iron oxides mapping with relation to radioactivity using landsat 8 at Bahariya Oasis. Egypt Res 10(4):1–10. https ://doi.org/10.7537/marsr sj100 418.01
Elsayed Zeinelabdein KA, El-Nadi AHH, Babiker IS (2020) Prospect-ing for gold mineralization with the use of remote sensing and GIS technology in North Kordofan State, central Sudan. Sci Afr 10:e00627
Estes JE (1983) Manual of remote sensing, 2nd edition-volume II. Interpretation and application. Pub. by American society of Pho-togrammetry-the Sheridan Press, USA
Farina P, Catani F, Colombo D, Fumagalli A, Kukavicic M, Marks F, Moretti S (2005) Remote sensing: a tool for landslide investiga-tions at a basin scale. Geophys Res Abstr 7:10157–10168
Gibson PJ (2000) Introductory remote sensing principles and concepts. Routledge, London
Gupta RP (2003) Remote sensing geology, 2nd edn. Springer, BerlinHunt GR (1979) Near infrared (1.3-2.4µm) spectra of altered minerals
potential for use in remote sensing. Geophysics 44:1984–1986. https ://doi.org/10.1190/1.14409 51
Jensen JR (1996) Introductory digital image processing: a remote sens-ing perspective, 2nd edn. Prentice-hall Inc., New Jersey
Kenea NH (1997) Digital Enhancement of Landsat data, spectral analy-sis and GIS data integration for geological studies of the Derudeb area, Southern Red Sea Hills, NE Sudan. Berliner Geowiss Abh., D14, Berlin
Kruse FA, Dietz JB (1991) Integration of diverse remote sensing data-sets for geologic mapping and resource exploration. In: Proceed-ing SPIE - The International Society for Optical Engineering, Earth and Atmospheric Remote Sensing 1492: 326-337
Loughlin WP (1991) Principal component analysis for altera-tion mapping. Photogramm Eng Remote Sens Photogramm 57(9):1163–1169
Modabberi S, Ahmadi A, Tangestani MH (2017) Sub-pixel mapping of alunite and jarosite using ASTER data: a case study from north of Semnan, north central Iran. Ore Geol Rev 80:429–436
Omer EAH, Elsayed Zeinelabdein KA (2018) Digital image processing of Landsat 8 and spectral analysis of ASTER data for mapping alteration minerals, Southern Hamisana, NE Sudan. Al Neelain J Geosci 2(1):10–20
Petrovic A, Khan SD, Thurmond AK (2012) Integrated hyperspec-tral remote sensing, geochemical and isotopic studies for under-standing hydrocarbon-induced rock alterations. Mar Pet Geol 35:292–308
Pour BA, Hashim M (2015) Integrating PALSAR and ASTER data for mineral deposits exploration in tropical environments: a case study from Central Belt, Peninsular Malaysia. Int J Image Data Fusion 6(2):170–188
Pournamdary M, Hashim M, Pour BA (2014) Application of ASTER and landsat TM data for geological mapping of Esfandagheh ophi-olite complex. South Iran Resour Geol 64(3):233–246
Podwysocki MH, Segal DB, Abrams MJ (1983) Use of multispectral Scanner images for assessment of hydrothermal alteration in the Marysvale, Utah Mining Area. Econ Geol 78:675–687
Prost G (1980) Alteration mapping with airborne multispectral scan-ners. Econ Geol 75:894–906. https ://doi.org/10.2113/gseco ngeo.75.6.894
Rajendran S, Al-Khirbasha S, Pracejusa B, Nasira S, Al-Abria AH, Kusky TM, Ghulam A (2012) ASTER detection of chromite bear-ing mineralized zones in Semail Ophiolite Massifs of the northern Oman mountains: exploration strategy. Ore Geol Rev 44:121–135
Roberson Research International (1985) Recent mineral discoveries in the Red Sea Hills, Sudan. Unpublished report
Rowan LC, Kahle AB (1982) Evaluations of 0.46-2.36 micrometer Multispectral scanners images of the East Tintic mining district, Utah, for mapping hydrothermally altered rocks. Econ Geol 77:441–452
Sabins FF (1997) Remote sensing: principles and interpretation, 3rd edn. W.H.Freeman and Company, New York
Sabins FF (2000) Remote sensing: principles and interpretation, 3rd edn. W.H.Freeman and Company, New York
Safari M, Maghsodi A, Pour AB (2017) Application of Landsat-8 and ASTER satellite remote sensing data for porphyry copper explo-ration: a case study from Shahr-e-Babak, Kerman, south of Iran. Geocarto Int 32:1–16
Segal DB (1983) Use of Landsat multispectral scanner data for defini-tion of Limonitic exposures in heavily vegetated areas. Econ Geol 78:711–722. https ://doi.org/10.2113/gseco ngeo.78.4.711
Singh A (1989) Digital change detection techniques using remotely sensed data. Int J Remote Sens 10:989–1003
Sultan M, Arvidson RE, Sturchio RC, Guinness EA (1987) Lithologic mapping in arid regions with Landsat thematic mapper data: mea-tiq dome, Egypt. Geol Soc Am Bull 99(6):748–762
Van Ruitenbeek FJA, Cudahy TJ, Van der Meer FD, Hale M (2012) Characterization of the hydrothermal systems associated with Archean VMS-mineralization at Panorama, Western Australia, using hyperspectral, geochemical and geothermometric data. Ore Geol Rev 45:33–46
Yousif MSM, Shedid GA (1999) Remote sensing signature of some selected basement rock units from the central eastern desert of Egypt. Egypt J Remote Sens Space Sci 1:132–141
Publisher’s Note Springer Nature remains neutral with regard to jurisdictional claims in published maps and institutional affiliations.