Embed Size (px)
Citation preview
GISMO/GEBndPlan Overview
Geographic Information System Mapping Object
GISMO
GISMO is the mapping and display application in Edulog
GISMO runs ElPlot and GEBndPlanElPlot allows you to access stops, runs,
boundaries, and students to produce plots or to analyze your data in a variety of ways
GEBndPlan
GEBndPlan allows you to perform boundary planning and enrollment projection tasks
Some things you can do with GEBndPlan: Map students by school grade and gender Select students by school and grade to obtain
tallies Use boundaries to select stops and students Produce reports and plots
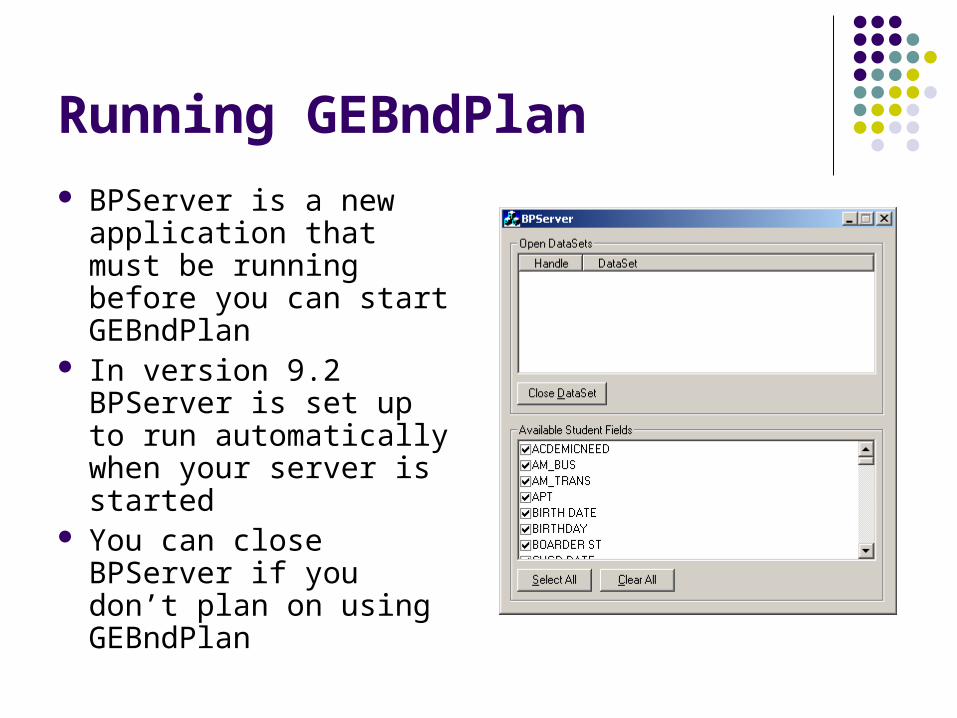
Running GEBndPlan
BPServer is a new application that must be running before you can start GEBndPlan
In version 9.2 BPServer is set up to run automatically when your server is started
You can close BPServer if you don’t plan on using GEBndPlan
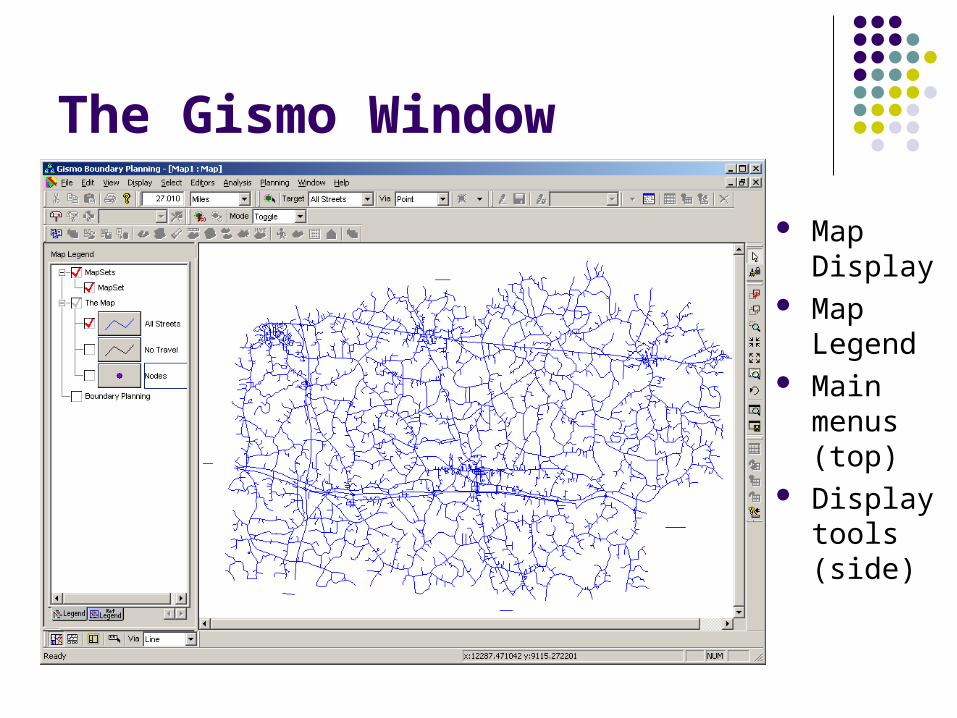
The Gismo Window
Map Display
Map Legend
Main menus (top)
Display tools (side)
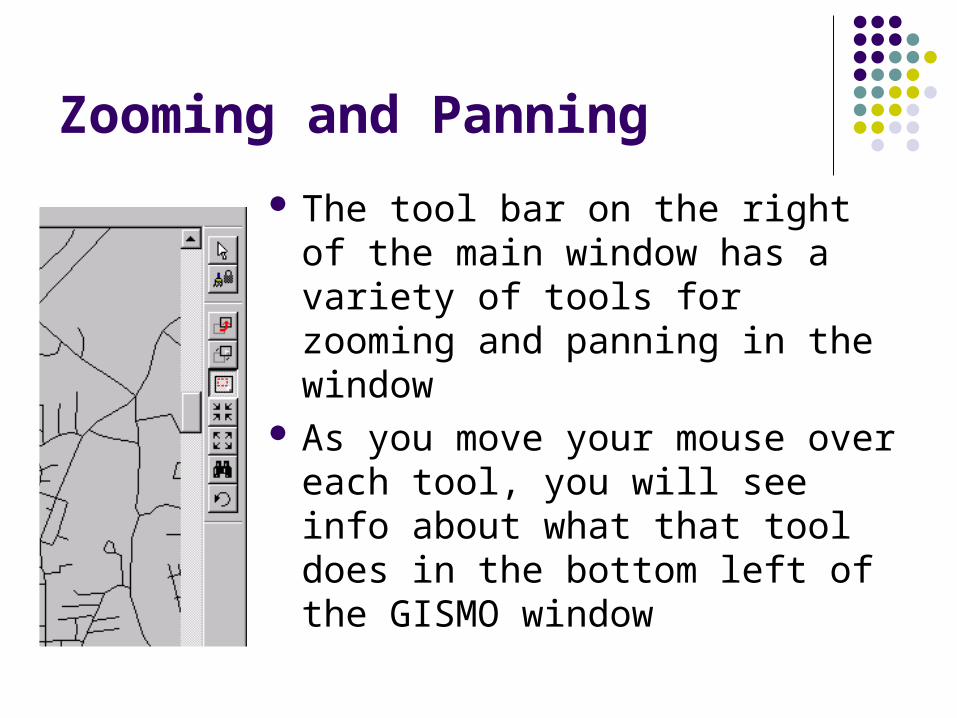
Zooming and Panning
The tool bar on the right of the main window has a variety of tools for zooming and panning in the window
As you move your mouse over each tool, you will see info about what that tool does in the bottom left of the GISMO window
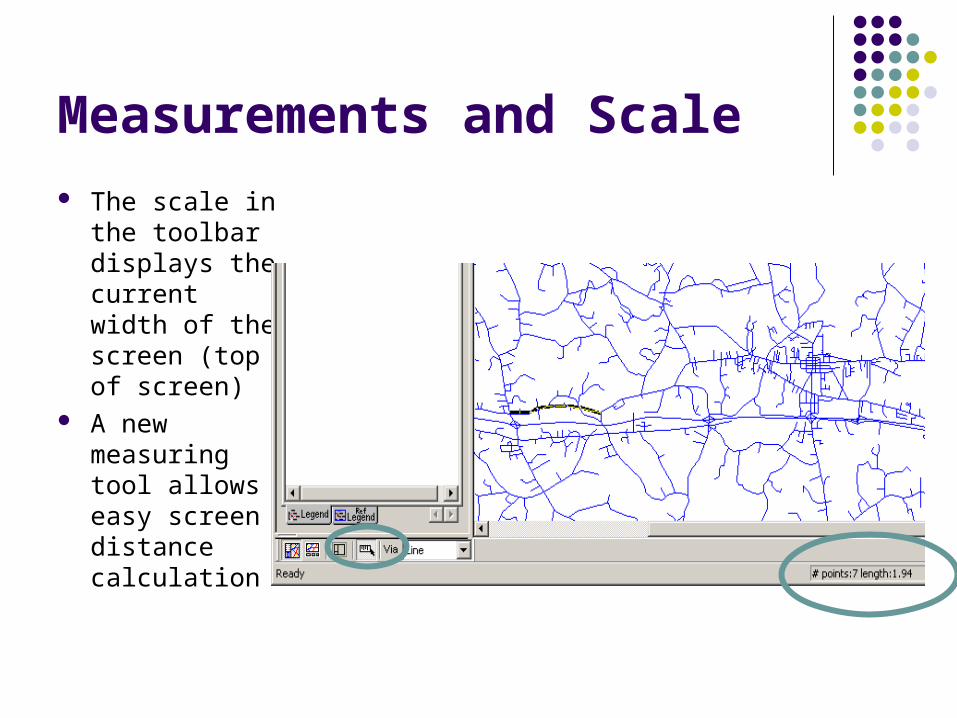
Measurements and Scale
The scale in the toolbar displays the current width of the screen (top of screen)
A new measuring tool allows easy screen distance calculation
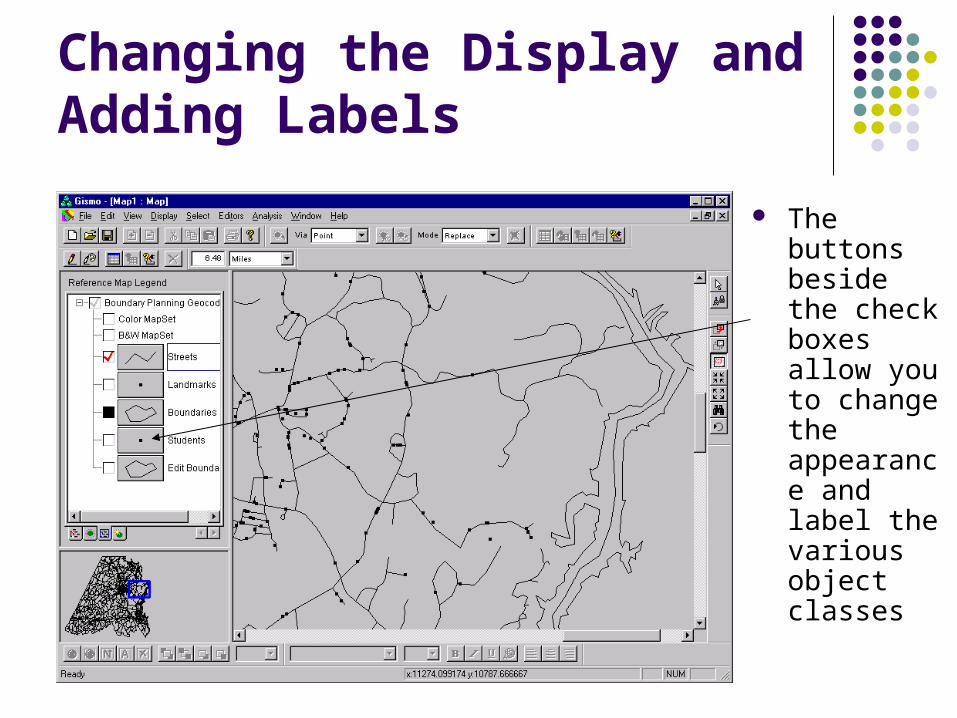
Changing the Display and Adding Labels
The buttons beside the check boxes allow you to change the appearance and label the various object classes
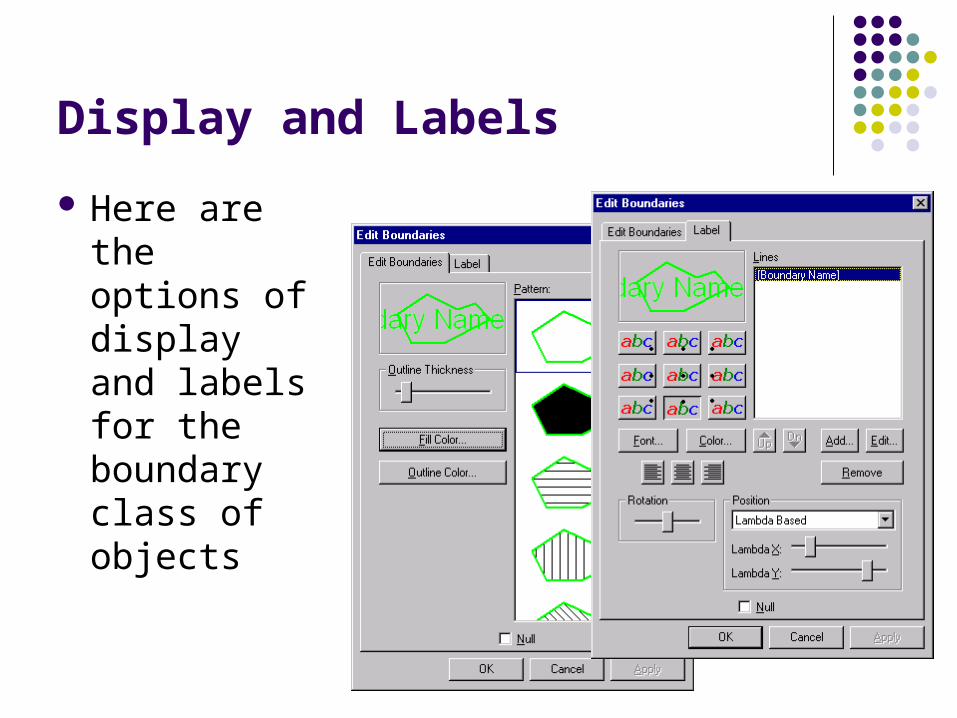
Display and Labels
Here are the options of display and labels for the boundary class of objects
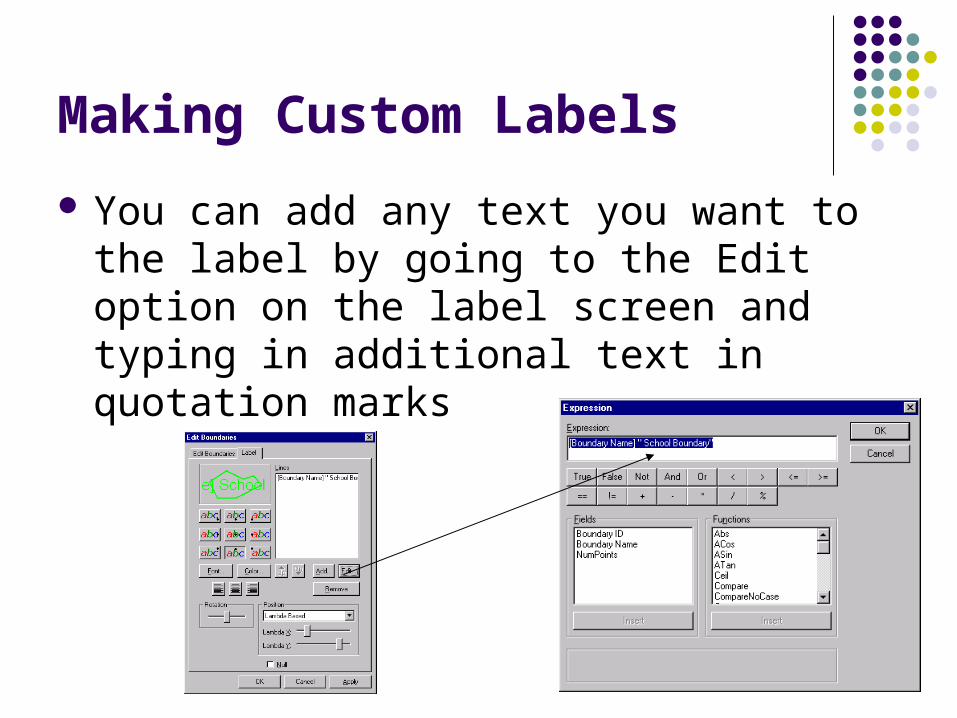
Making Custom Labels
You can add any text you want to the label by going to the Edit option on the label screen and typing in additional text in quotation marks
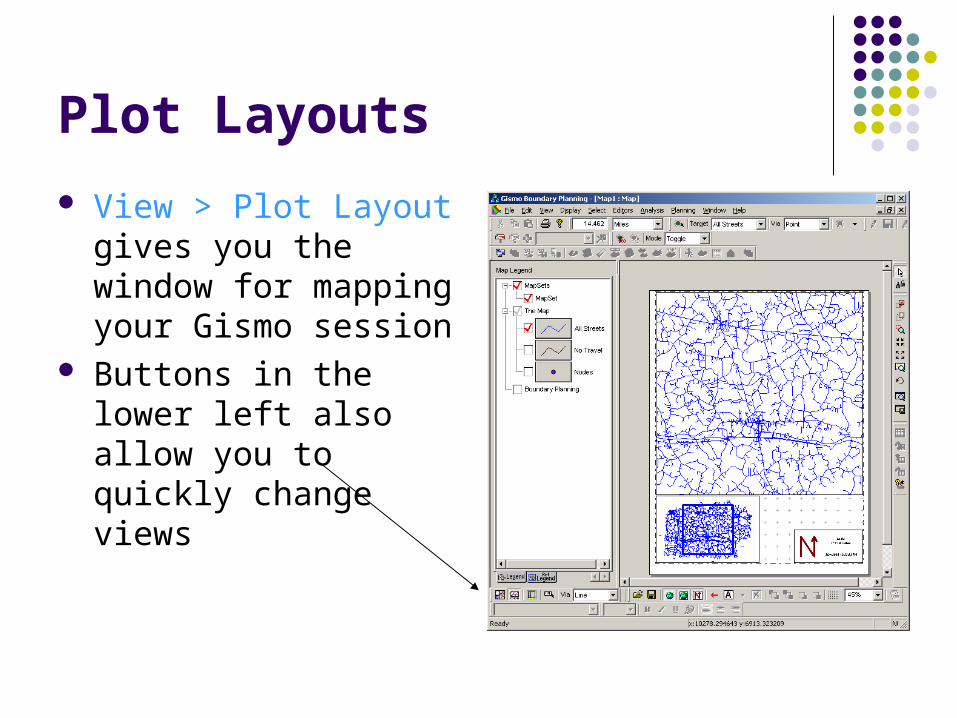
Plot Layouts
View > Plot Layout gives you the window for mapping your Gismo session
Buttons in the lower left also allow you to quickly change views
Mapping Themes
Themes allow you to show data subsets visually
In PTS 3, it was the “alternate tally field” Here you can create and save themes for a
variety of data subsets
Mapping Themes
Go to Editors > Theme then select the object class you want to work with
Edit each group in the class using the expression and display features
Exit the Theme Editor, then right click on the display button and “Apply Theme” on the main legend window
Select the theme you want and click on OK
Getting a Legend on Your Map
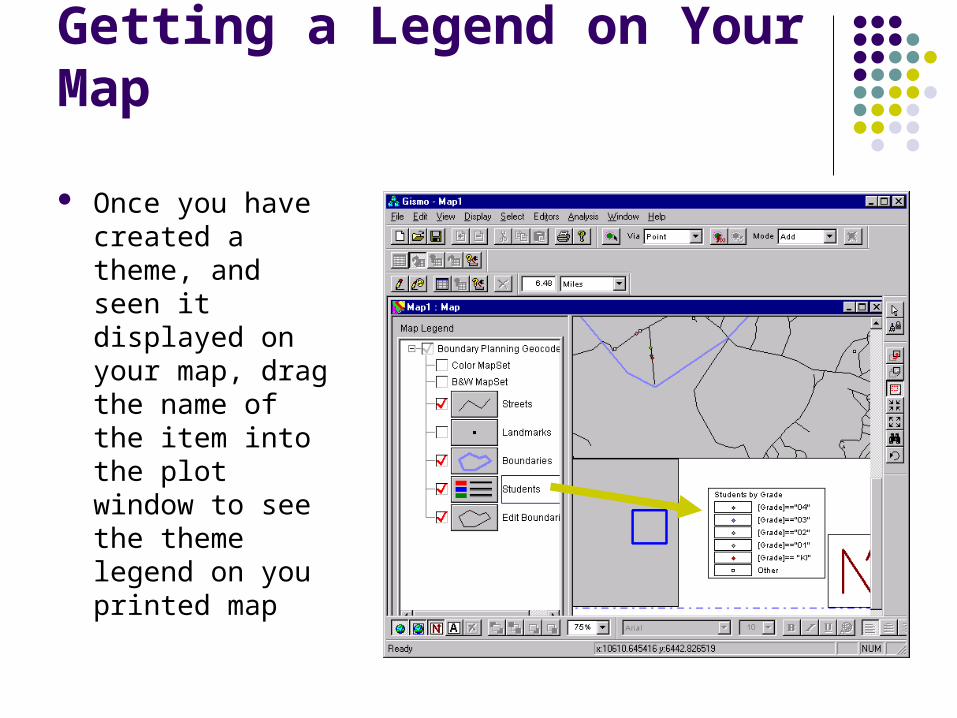
Once you have created a theme, and seen it displayed on your map, drag the name of the item into the plot window to see the theme legend on you printed map
Selecting Map Objects
Before you can edit objects on your map, analyze your data, or perform tallies you have to select items
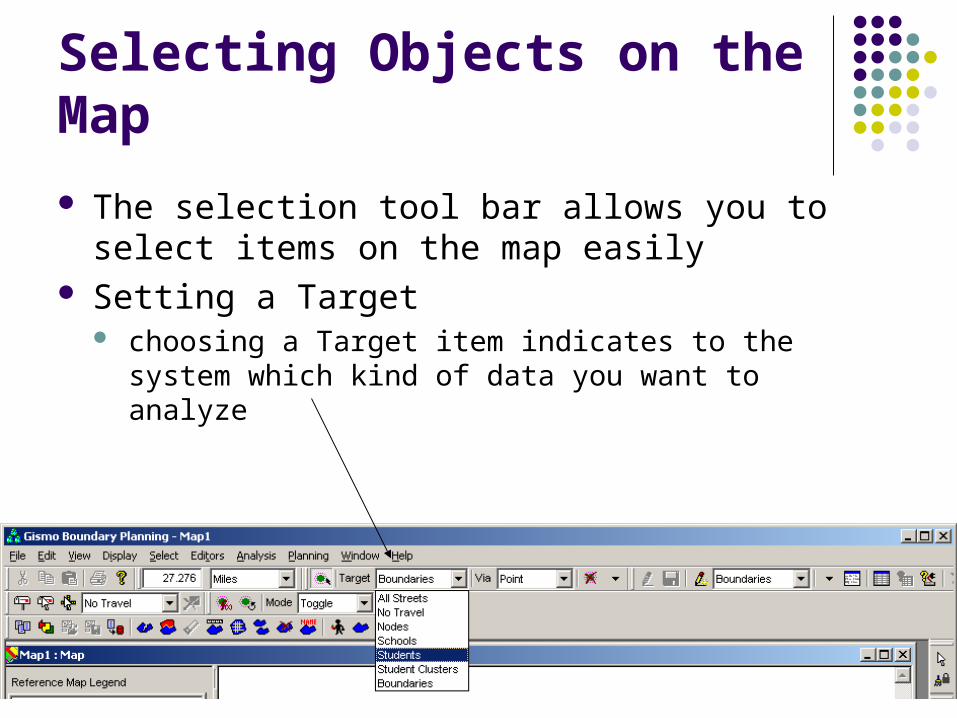
Selecting Objects on the Map
The selection tool bar allows you to select items on the map easily
Setting a Target choosing a Target item indicates to the system which kind
of data you want to analyze
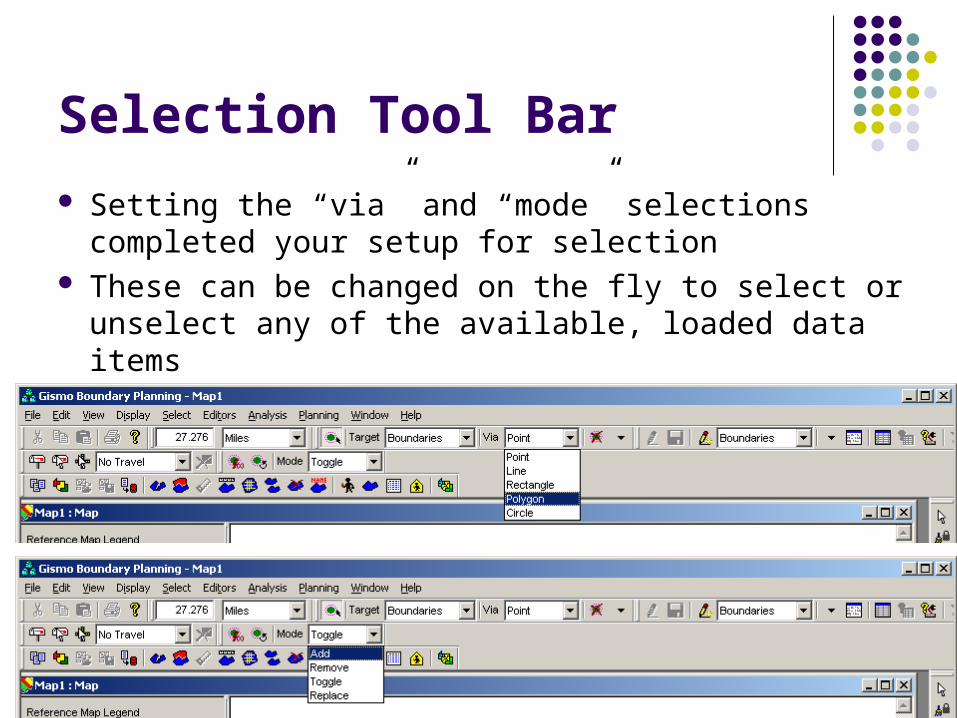
Selection Tool Bar
Setting the “via” and “mode” selections completed your setup for selection
These can be changed on the fly to select or unselect any of the available, loaded data items
GISMO Boundary Planning
Using GEBndPlan for Analysis
Using DataSets
In boundary planning, you work with snapshots of the master data called datasets
Datasets allow you to narrow your focus and improve performance
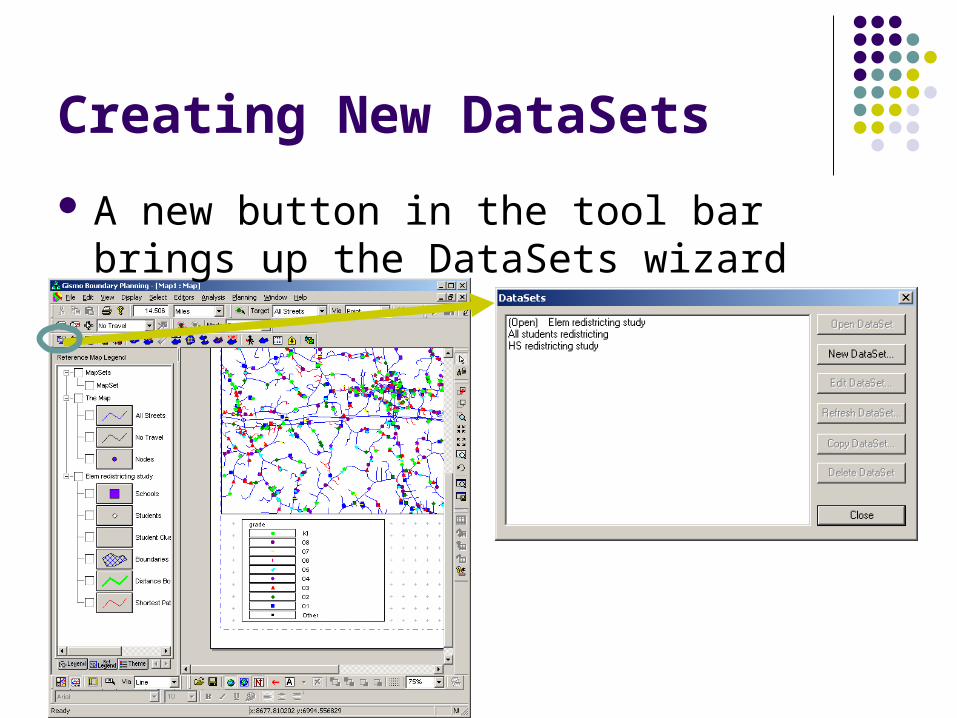
Creating New DataSets
A new button in the tool bar brings up the DataSets wizard
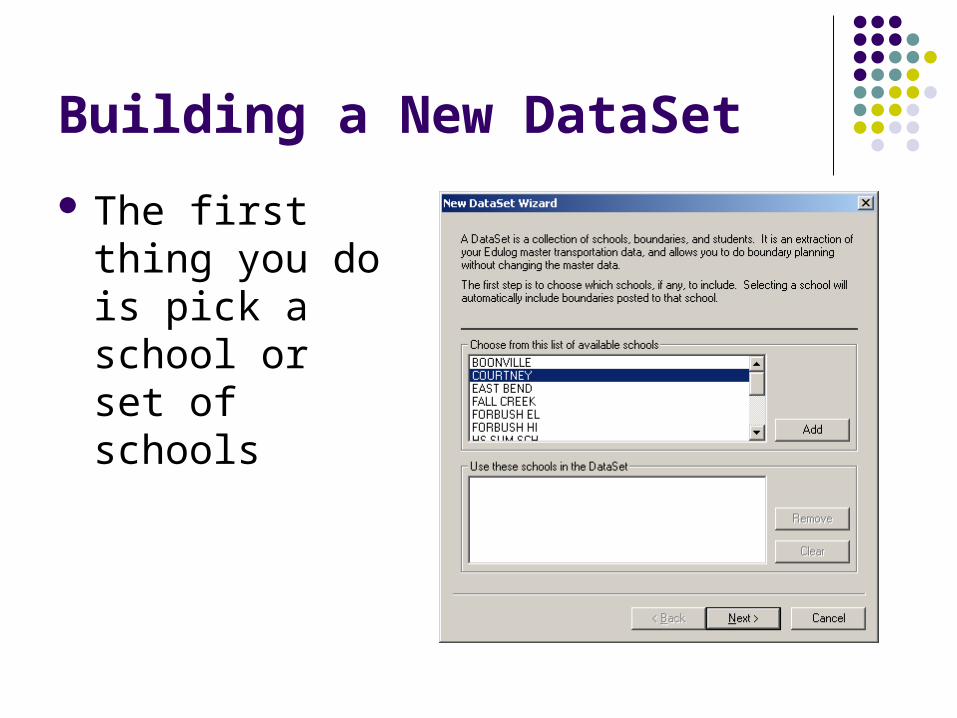
Building a New DataSet
The first thing you do is pick a school or set of schools
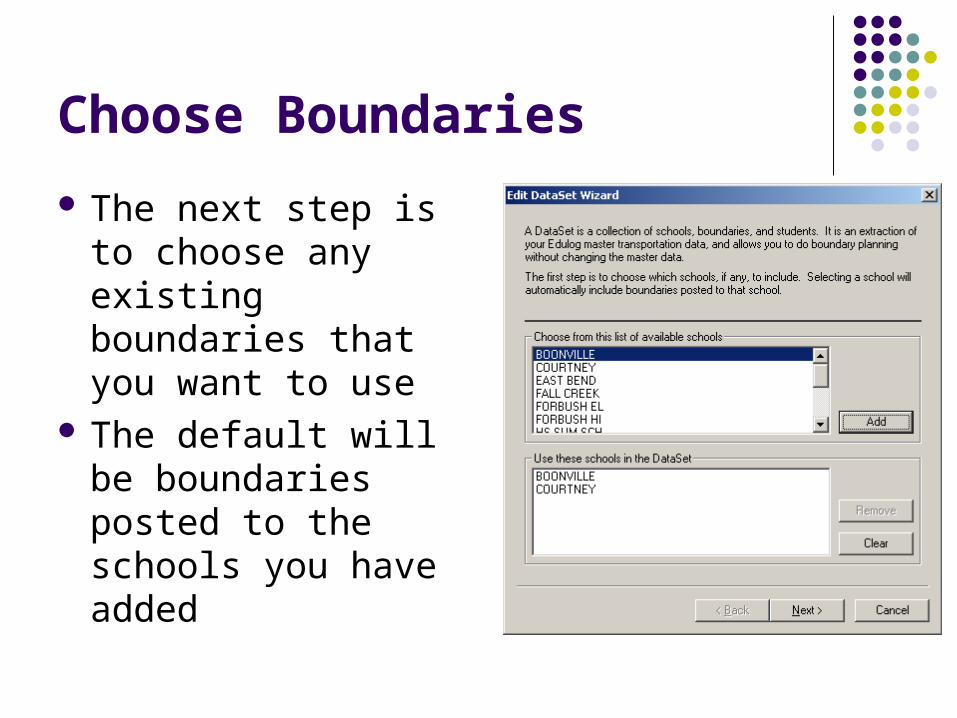
Choose Boundaries
The next step is to choose any existing boundaries that you want to use
The default will be boundaries posted to the schools you have added
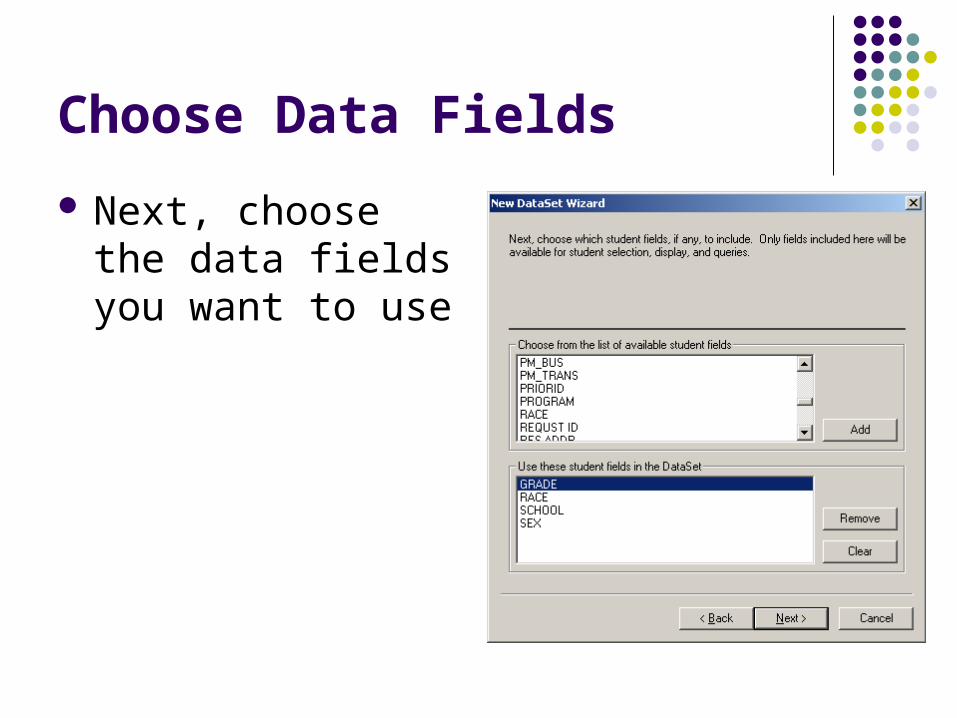
Choose Data Fields
Next, choose the data fields you want to use
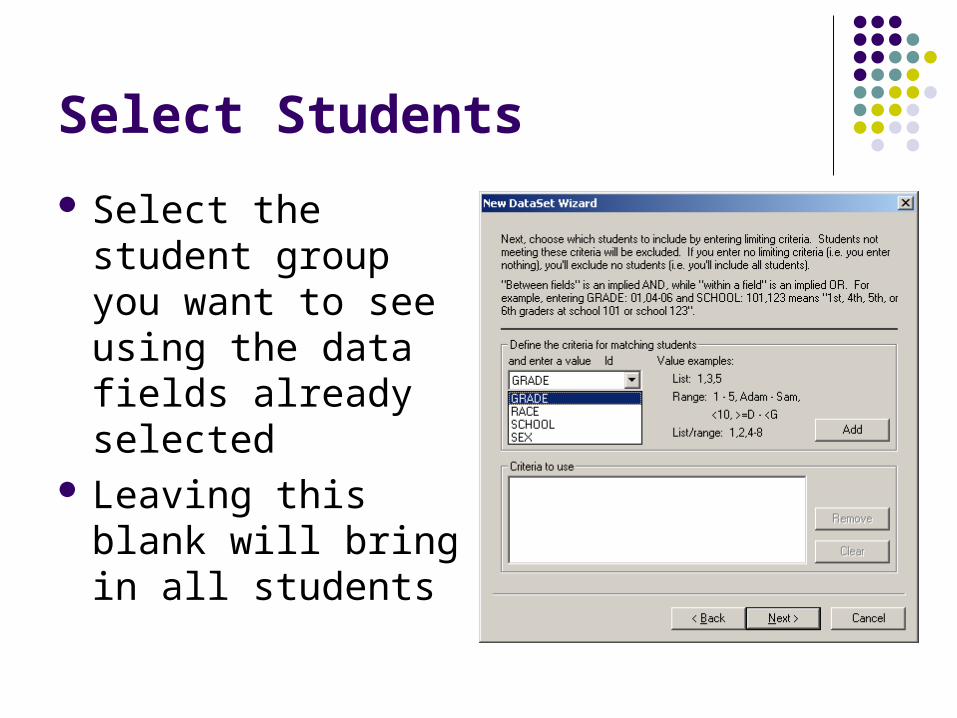
Select Students
Select the student group you want to see using the data fields already selected
Leaving this blank will bring in all students
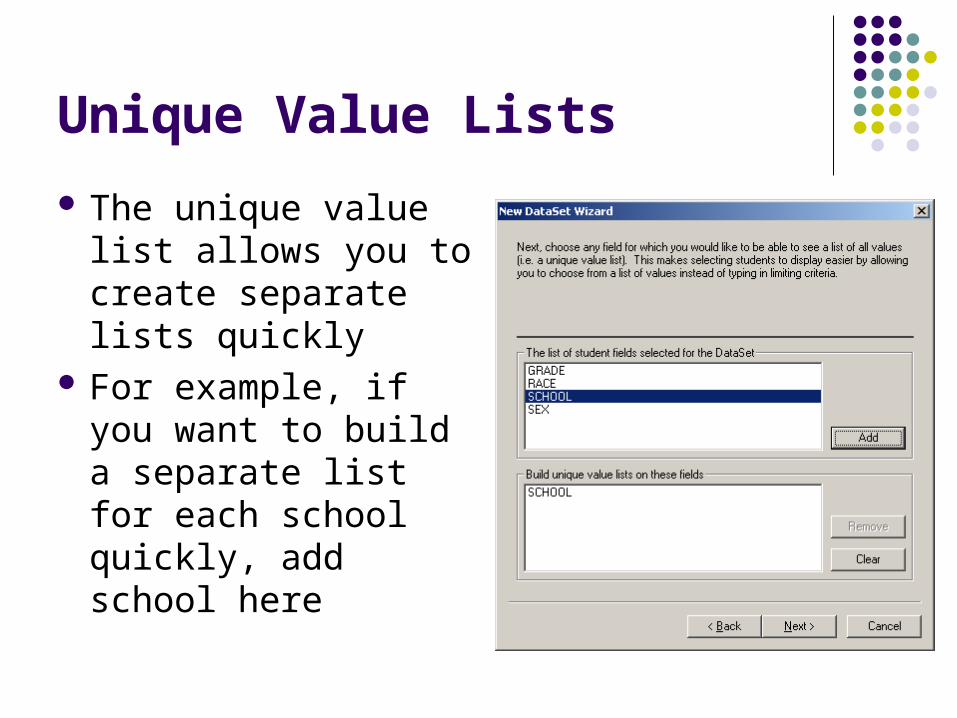
Unique Value Lists
The unique value list allows you to create separate lists quickly
For example, if you want to build a separate list for each school quickly, add school here
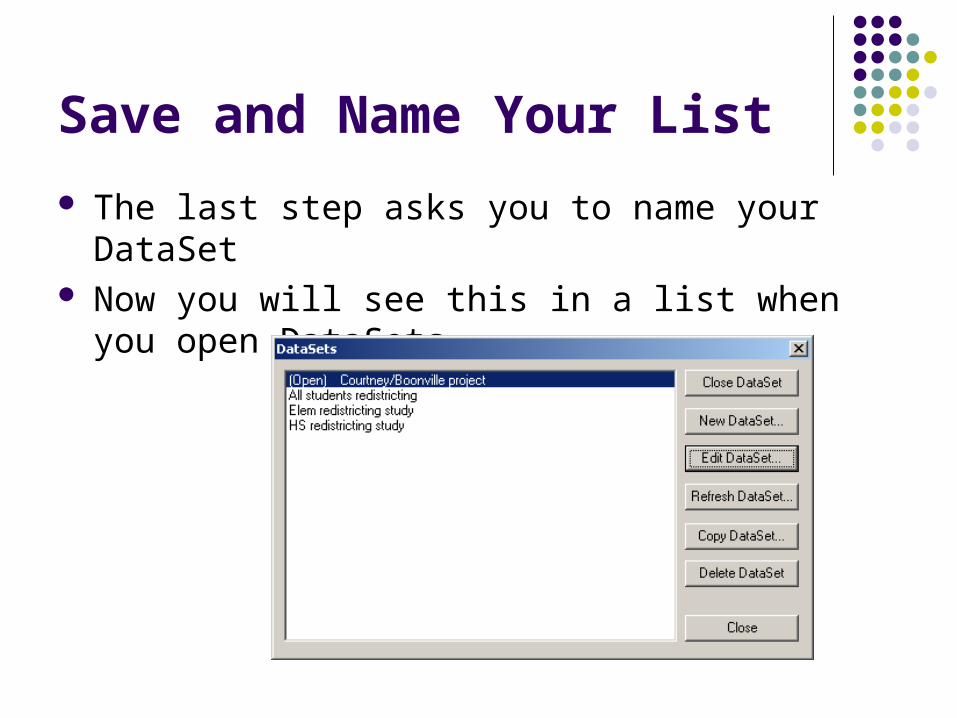
Save and Name Your List
The last step asks you to name your DataSet Now you will see this in a list when you open
DataSets
Working with DataSets
Once you have created your dataset, use the legend check the data items you want to see
Use the tool bar above the map to show the exact boundaries and students within your dataset you want to work with
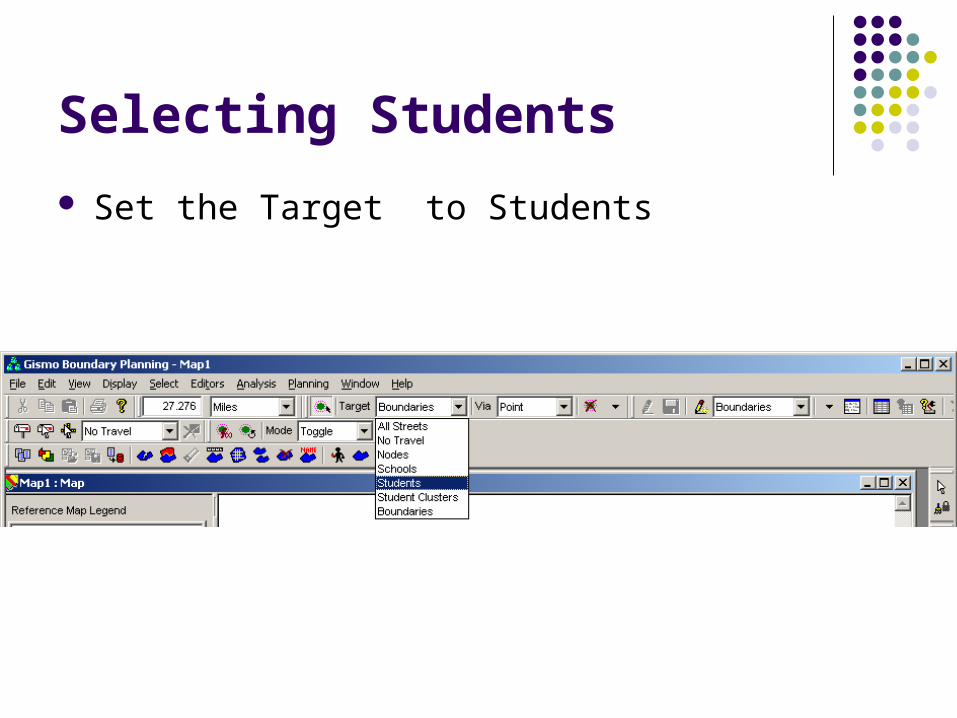
Selecting Students
Set the Target to Students
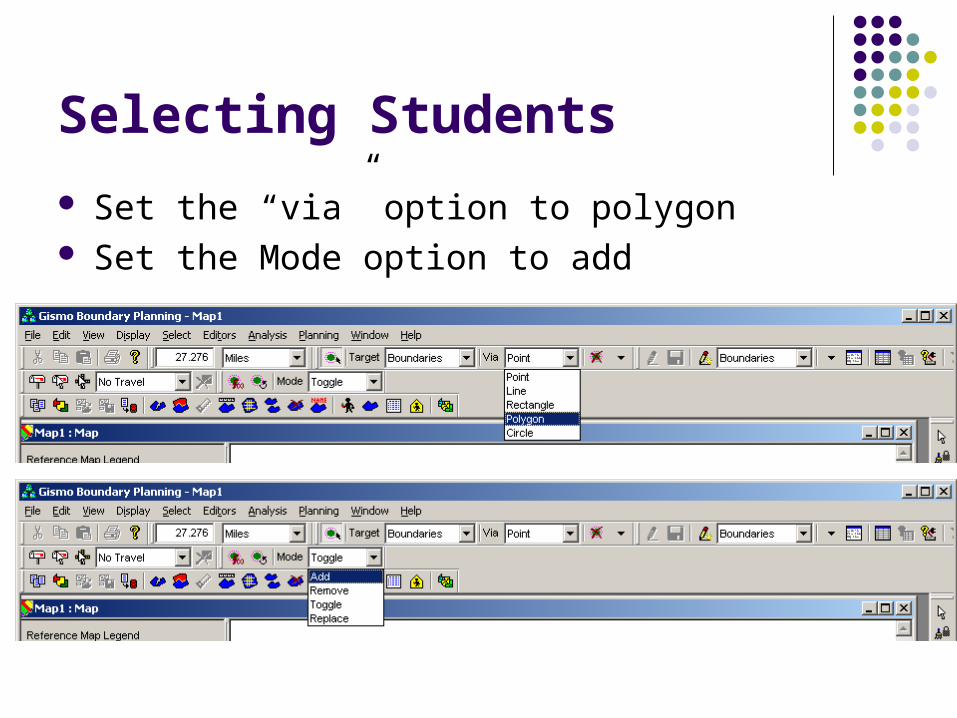
Selecting Students
Set the “via” option to polygon Set the Mode option to add
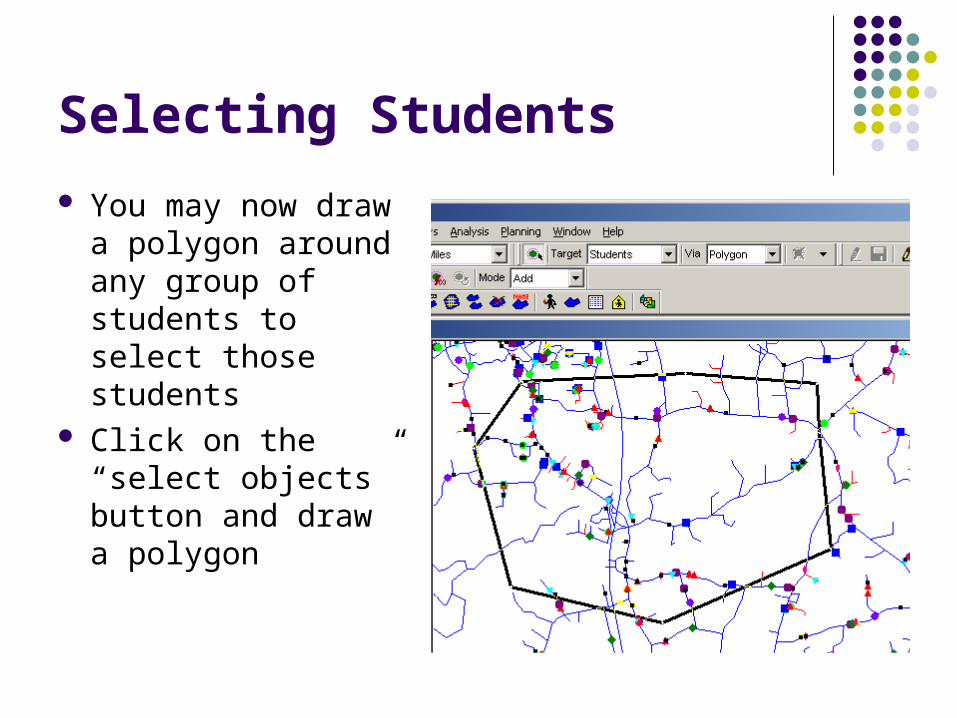
Selecting Students
You may now draw a polygon around any group of students to select those students
Click on the “select objects” button and draw a polygon
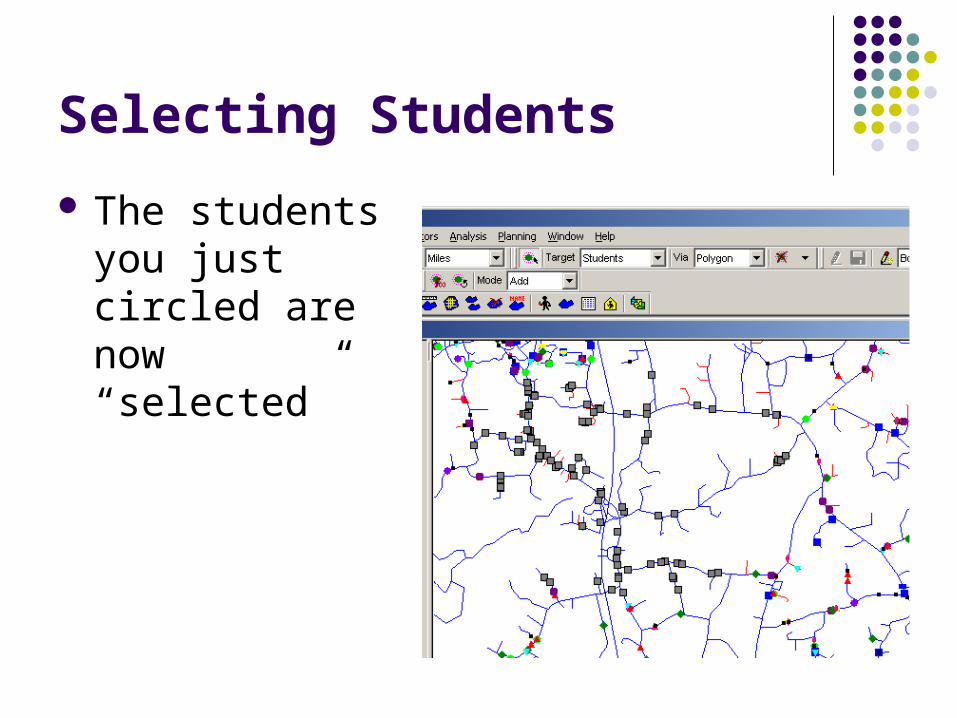
Selecting Students
The students you just circled are now “selected”
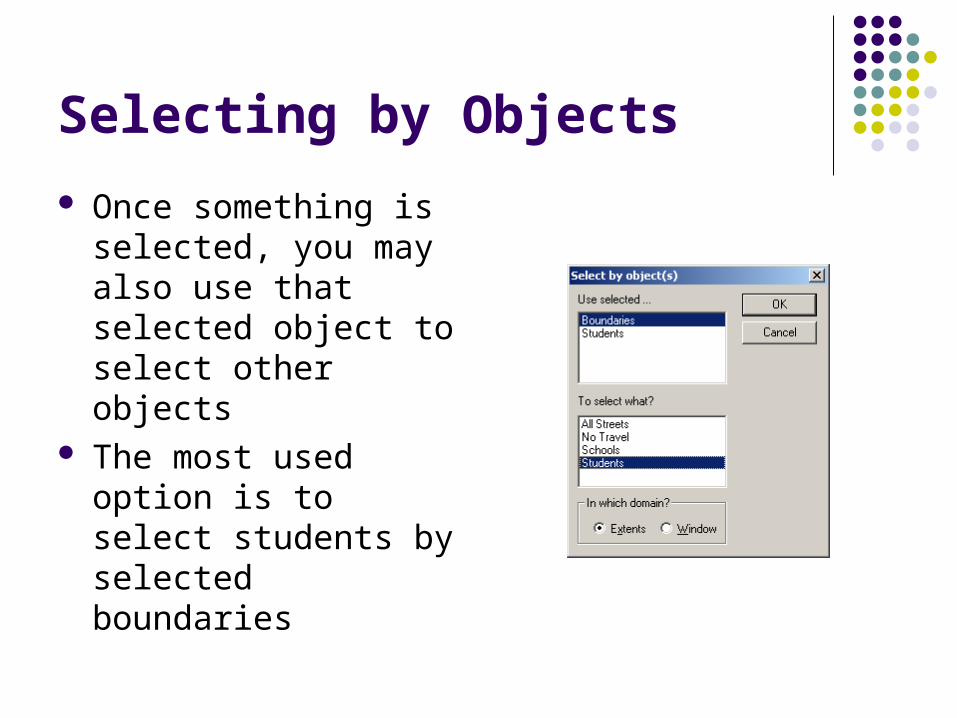
Selecting by Objects
Once something is selected, you may also use that selected object to select other objects
The most used option is to select students by selected boundaries
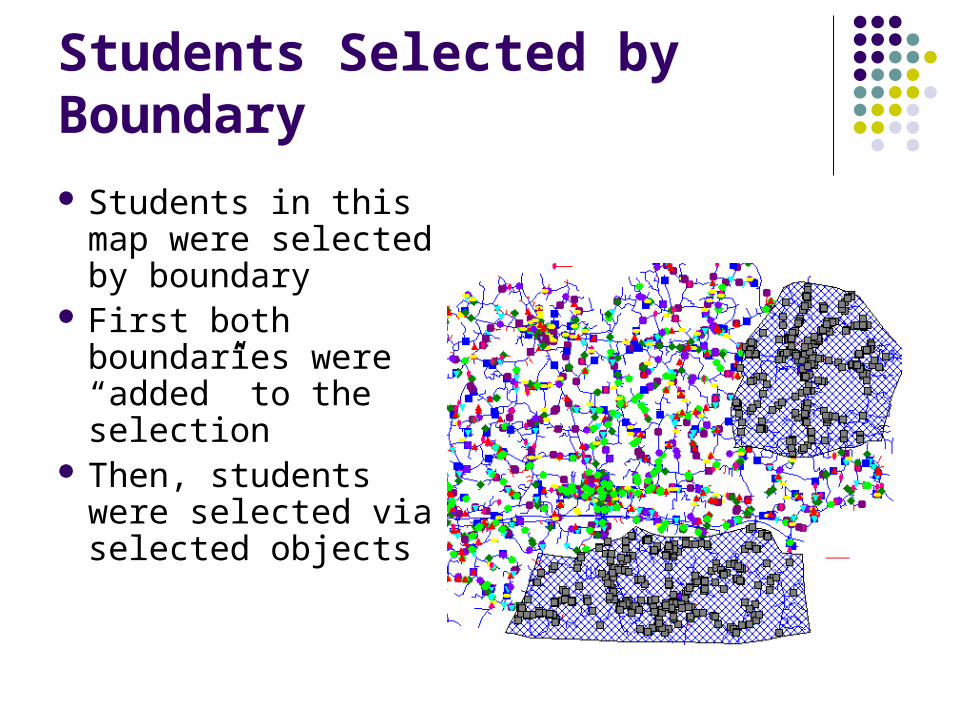
Students Selected by Boundary
Students in this map were selected by boundary
First both boundaries were “added” to the selection
Then, students were selected via selected objects
The Data Analysis Window
After any selection has been made (no matter how it is done), the data analysis window will show that selection in spreadsheet format
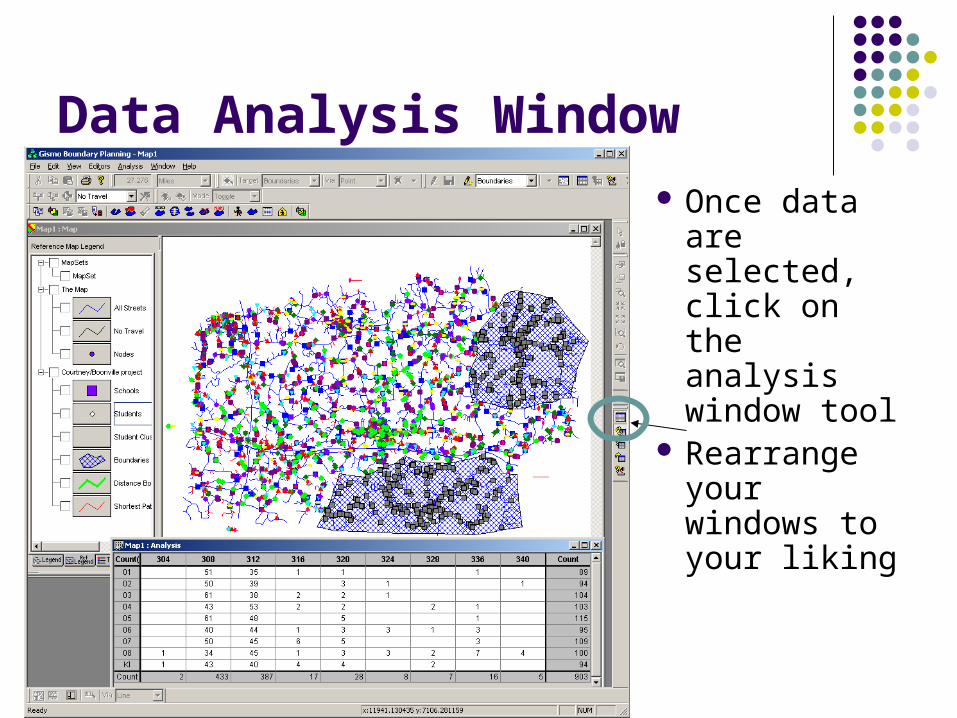
Data Analysis Window
Once data are selected, click on the analysis window tool
Rearrange your windows to your liking
A Data Analysis Tool
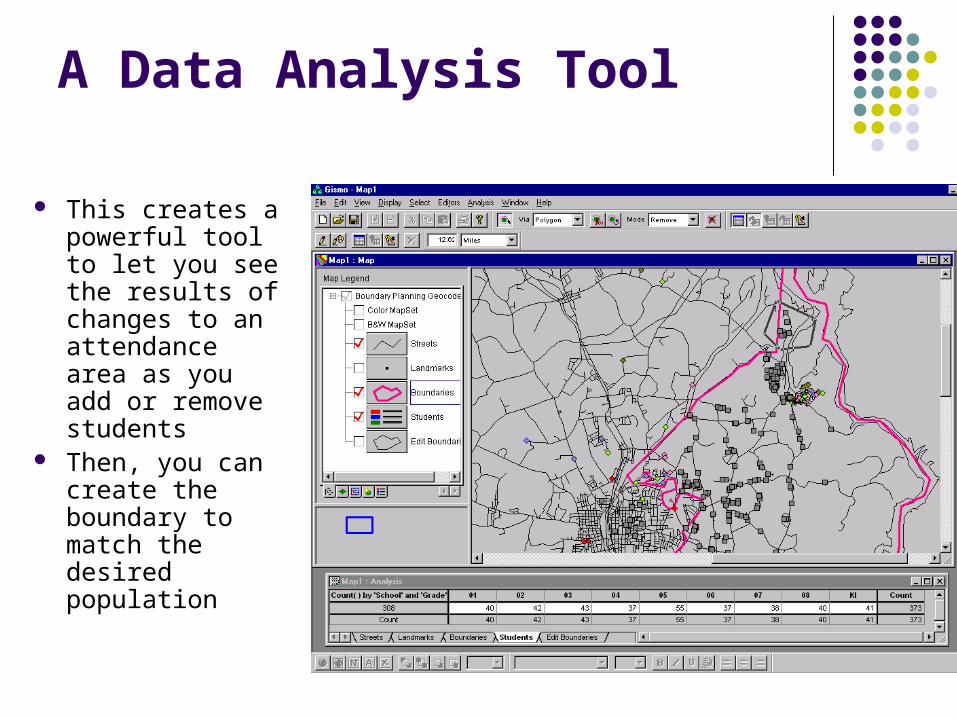
This creates a powerful tool to let you see the results of changes to an attendance area as you add or remove students
Then, you can create the boundary to match the desired population
Working With Analysis
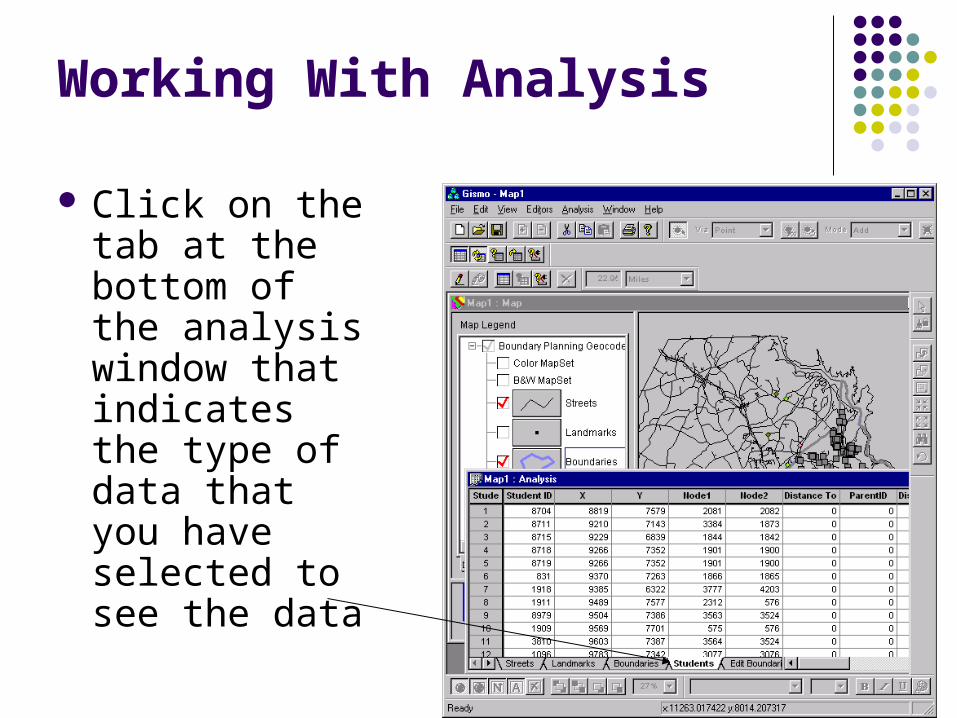
Click on the tab at the bottom of the analysis window that indicates the type of data that you have selected to see the data
Working With Analysis
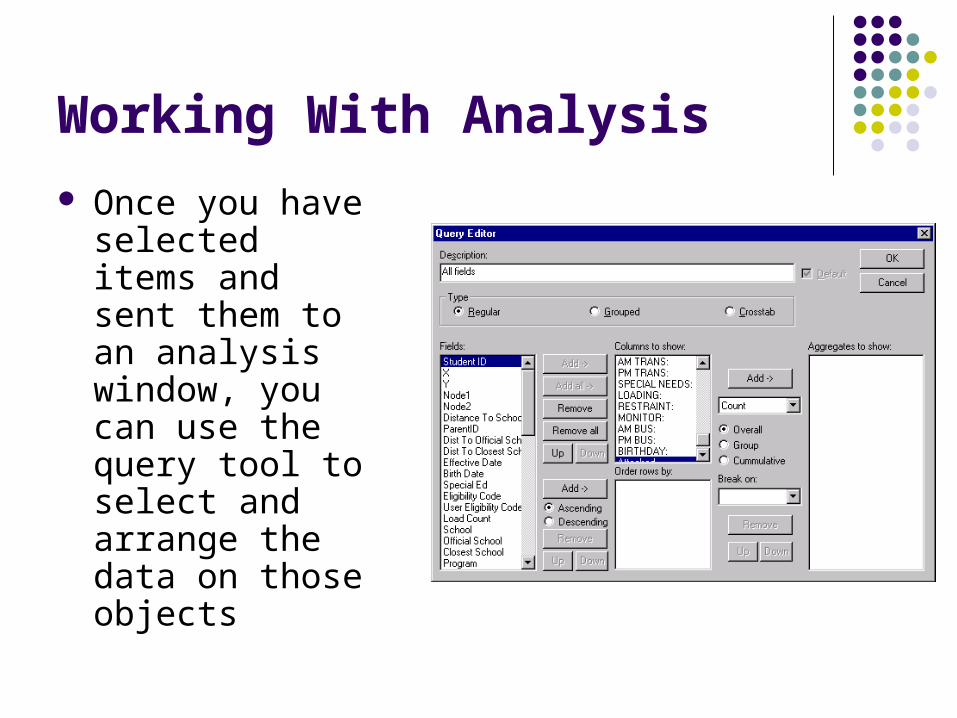
Once you have selected items and sent them to an analysis window, you can use the query tool to select and arrange the data on those objects
Tally Ho
Boundary Planning includes a feature for tallying students
Once you display students and boundaries, it is a snap
This is a great tool for quickly seeing data any way you want to see it
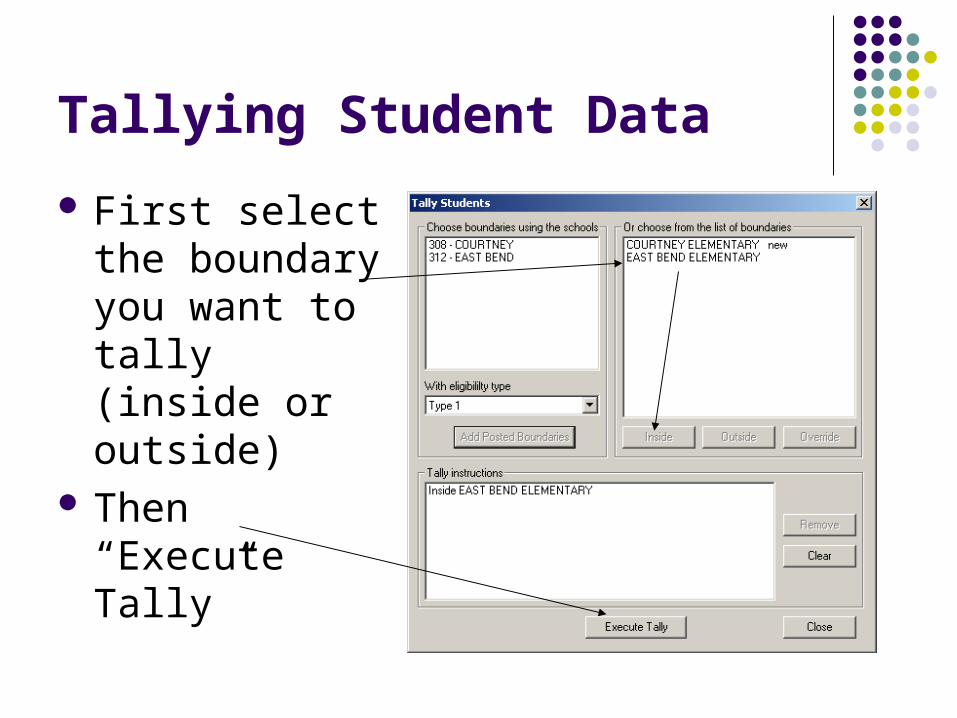
Tallying Student Data
First select the boundary you want to tally (inside or outside)
Then “Execute Tally”
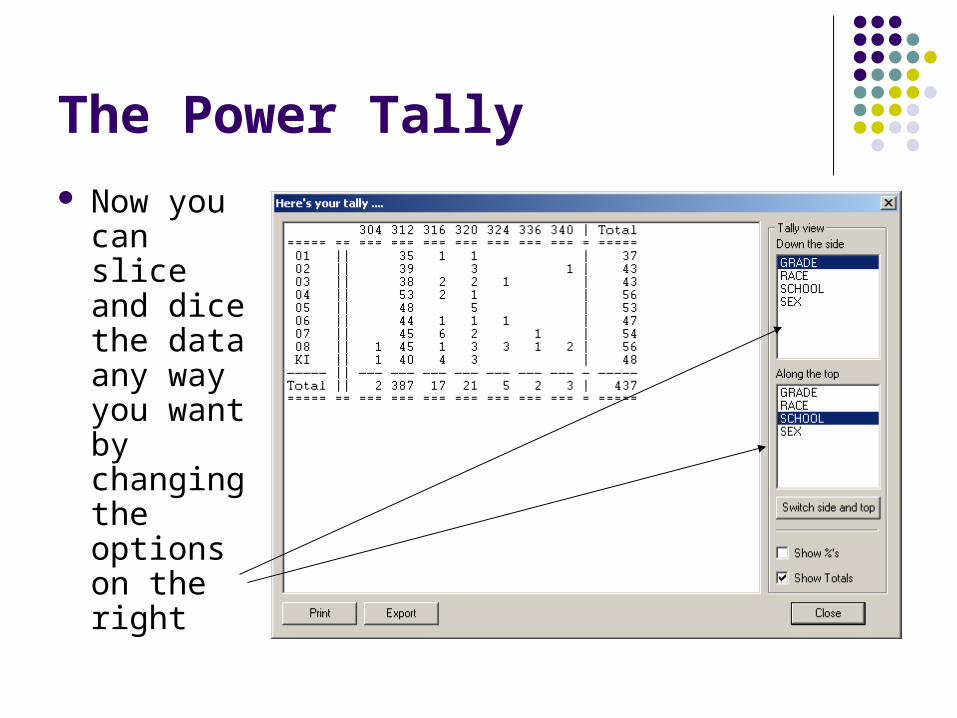
The Power Tally
Now you can slice and dice the data any way you want by changing the options on the right
Enrollment Analysis
While a group of students is selected, you may see that selection as it would fit into a school building
You may edit the configuration of each school to match current or projected size
You may also project the data several years ahead to see the impact as students progress through the school
Creating and Modifying Boundaries in GISMO
Creating New Boundaries
Remember that a DataSet must be loaded before you can create boundaries
Choose the create objects tool Boundaries require at least 3 points Once the boundary has 3 points you can
switch to edit mode by clicking the create objects button again to deselect it
Creating/Editing Boundaries
Remember to use <Ctrl z> to undo any steps you don’t like
Switch to the idle tool when you return to boundaries after zooming, panning, etc. (top of right side menu)
Modifying Boundaries
Display boundary Check boundary legend in tool Use show boundary tool to select what you want
to edit Select boundary (or boundaries)
Target – boundaries Via - point Mode – add Click on boundary with select objects tool
Modifying Boundaries
Choose the edit objects tool to switch edit mode
Move a point by clicking and dragging Add a point with a right-click Delete by selecting the point and clicking on
the delete tool or delete on the keyboard The highlighted area will change to your new
boundary when you save your changes
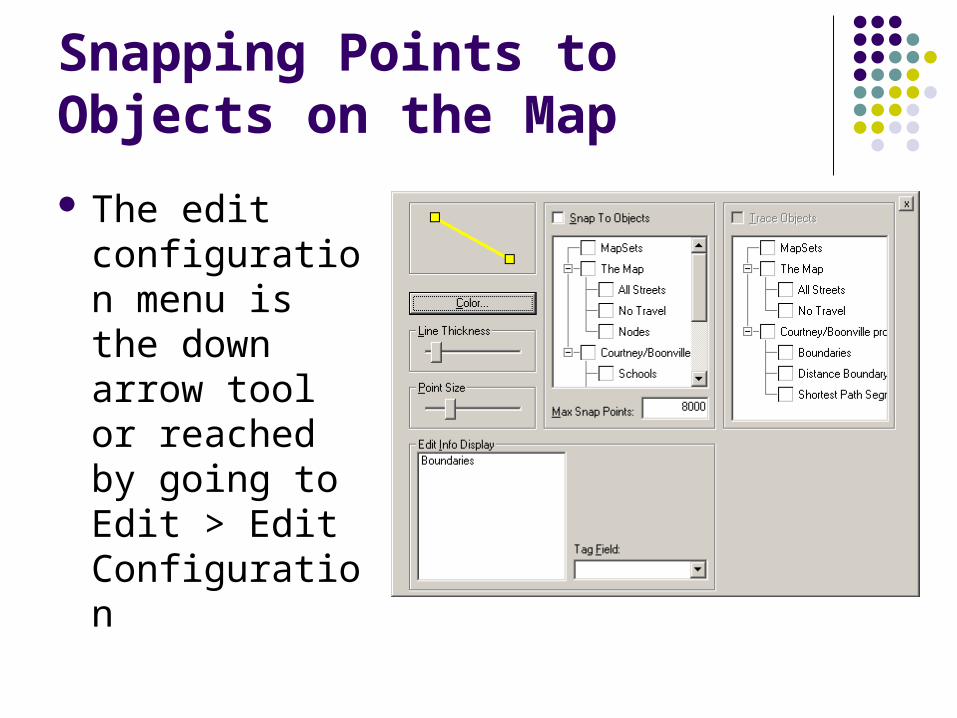
Snapping Points to Objects on the Map
The edit configuration menu is the down arrow tool or reached by going to Edit > Edit Configuration
Tracing Objects
The Edit Configuration menu is also where you set the tracing options
Working with Snap/Trace
You will find you go back and forth between using the snap/trace options and placing new points
You can use the <ctrl> key to temporarily take you out of snap/trace mode to place new points for your boundary
Master Data
While you are working with boundaries in GEBndPlan, your changes only exist in the datasets you have loaded
When you are happy with the edits you have made to your boundaries, you can “update master data”
You can choose which new or edited boundaries to save
Undo Comes to Boundary
Because of the way data is stored and saved in GEBndPlan, you can undo multiple steps of boundary edits
<Ctrl> z functions a the undo option This will take you back several steps of edits
in the boundary that is open
Documentation
An approximately 100 page manual is available for using GEBndPlan