Embed Size (px)
Citation preview
Chapter 13: Global Climate Change: Policy Responses 1
ENVIRONMENTAL AND NATURAL RESOURCE ECONOMICS:
A CONTEMPORARY APPROACH
JONATHAN M. HARRIS AND BRIAN ROACH
ADVANCE CHAPTERS FOR FOURTH EDITION
FOURTH EDITION CHAPTER 13: GLOBAL CLIMATE CHANGE: POLICY RESPONSES
REPLACES THIRD EDITION CHAPTER 19
(Due 2017: The final content and layout of the chapters may be subject to change.) COPYRIGHT © 2016 GLOBAL DEVELOPMENT AND ENVIRONMENT INSTITUTE, TUFTS UNIVERSITY.
CHAPTER 13
Global Climate Change: Policy Responses
Contributing author Anne-Marie Codur
CHAPTER 13 FOCUS QUESTIONS
• What are the possible policy responses to global climate change?
• What does economic theory suggest about appropriate policy response?
• What climate policies have been proposed and implemented at local, national, and global
levels?
adaptive measures/adaptive strategies actions designed to reduce the magnitude or risk of
damages from global climate change.
preventive measures/preventive strategies actions designed to reduce the extent of climate
change by reducing projected emissions of greenhouse gases.
13.1 ADAPTATION AND MITIGATION
As discussed in Chapter 12, the scientific evidence regarding the seriousness of global
climate change supports policy action. Economic analyses of climate change have generally
recommended policy changes, although with considerable variability. The Stern Review on
the Economics of Climate Change, in particular, calls for “an urgent global response.”1
Recent economic analyses of climate change have placed greater emphasis on insurance
against catastrophic risks and the need to adapt to inevitable climate change impacts.2
Policy responses to climate change can be broadly classified into two categories:
adaptive measures to deal with the consequences of climate change and mitigation, or
preventive measures intended to lower the magnitude or timing of climate change. Adaptive
measures include:
Chapter 13: Global Climate Change: Policy Responses 2
• Construction of dikes and seawalls to protect against rising seas and extreme weather
events such as floods and hurricanes.
• Shifting cultivation patterns in agriculture to adapt to changing weather conditions.
• Creating institutions that can mobilize the needed human, material, and financial
resources to respond to climate-related disasters.
Mitigation measures include:
• Reducing emissions of greenhouse gases by meeting energy demands from sources with
lower greenhouse gas emissions (e.g., switching from coal to wind energy for electricity).
• Reducing greenhouse gas emissions by increasing energy efficiency (e.g., demand-side
management, as discussed in Chapter 11).
• Enhancing natural carbon sinks. Carbon sinks are areas where carbon may be stored;
natural sinks include soils and forests. Human intervention can either reduce or expand
these sinks through forest management and agricultural practices. Forests recycle carbon
dioxide (CO2) into oxygen; preserving forested areas and expanding reforestation can
have a significant effect on net CO2 emissions. Soils are also vast carbon repositories,
with three times more carbon stored in soils than in the atmosphere. Restoring degraded
soils could capture large quantities of CO2.
carbon sinks portions of the ecosystem with the ability to absorb certain quantities of carbon
dioxide, including forests and oceans.
cost-benefit analysis (CBA) a tool for policy analysis that attempts to monetize all the costs
and benefits of a proposed action to determine the net benefit.
cost-effectiveness analysis a policy tool that determines the least-cost approach for achieving
a given goal.
pollution tax(es) a per-unit tax based on the level of pollution.
transferable (tradable) permits tradable permits that allow a firm to emit a certain quantity
of a pollutant.
Economic analysis can provide policy guidance for nearly any particular preventive or
adaptive measure. Cost-benefit analysis, discussed in Chapters 7 and 12, can present a basis
for evaluating whether a policy should be implemented. However, as discussed in Chapter 12,
economists disagree about the appropriate assumptions and methodologies for cost-benefit
analyses of climate change. A less controversial conclusion from economic theory is that we
should apply cost-effectiveness analysis in considering which policies to adopt. The use of
cost-effectiveness analysis avoids many of the complications associated with cost-benefit
analysis. While cost-benefit analysis attempts to offer a basis for deciding upon policy goals,
cost-effectiveness analysis accepts a goal as given by society and uses economic techniques
to determine the most efficient way to reach that goal.
In general, economists usually favor approaches that work through market mechanisms to
achieve their goals Early in the climate change debate, in 1997, a statement by leading
economists endorsed market-based policies to slow climate change (see Box 13.1). Market-
oriented approaches are considered cost effective; rather than attempting to control market
actors directly, they shift incentives so that individuals and firms will change their behavior
to take external costs and benefits into account. Examples of market-based policy tools
include pollution taxes and transferable, or tradable, permits. Both of these are potentially
useful tools for greenhouse gas reduction. Other relevant economic policies include measures
Chapter 13: Global Climate Change: Policy Responses 3
to create incentives for the adoption of renewable energy sources and energy-efficient
technology.
Most of this chapter focuses on mitigation policies, but it is becoming increasingly
evident that mitigation policies need to be supplemented with adaption policies. Climate
change is already occurring, and even if significant mitigation policies are implemented in the
immediate future, warming and sea-level rise will continue well into the future, even for
centuries.3 The urgency and ability to institute adaptive measures varies across the world. It is
the world’s poor who face the greatest need to adapt but also most lack the necessary
resources.
[Climate change’s] adverse impacts will be most striking in the developing nations
because of their geographical and climatic conditions, their high dependence on natural
resources, and their limited capacity to adapt to a changing climate. Within these
countries, the poorest, who have the least resources and the least capacity to adapt, are the
most vulnerable. Projected changes in the incidence, frequency, intensity, and duration of
climate extremes (for example, heat waves, heavy precipitation, and drought), as well as
more gradual changes in the average climate, will notably threaten their livelihoods—
further increasing inequities between the developing and developed worlds.4
BOX 13.1 ECONOMISTS’ STATEMENT ON CLIMATE CHANGE
In 1997, more than 2,500 economists, including eight Nobel laureates, signed the
following public statement calling for serious steps to deal with the risks of global climate
change:
I. The review conducted by a distinguished international panel of scientists under the
auspices of the Intergovernmental Panel on Climate Change has determined that “the balance
of evidence suggests a discernible human influence on global climate.” As economists, we
believe that global climate change carries with it significant environmental, economic, social,
and geopolitical risks, and that preventive steps are justified.
II. Economic studies have found that there are many potential policies to reduce
greenhouse-gas emissions for which the total benefits outweigh the total costs. For the United
States in particular, sound economic analysis shows that there are policy options that would
slow climate change without harming American living standards, and these measures may in
fact improve U.S. productivity in the longer run.
III. The most efficient approach to slowing climate change is through market-based
policies. In order for the world to achieve its climatic objectives at minimum cost, a
cooperative approach among nations is required—such as an international emissions trading
agreement. The United States and other nations can most efficiently implement their climate
policies through market mechanisms, such as carbon taxes or the auction of emissions
permits. The revenues generated from such policies can effectively be used to reduce the
deficit or to lower existing taxes.
Source: http//rprogress.org/publications/1997/econstatement.htm.
The Intergovernmental Panel on Climate Change (IPCC) has identified adaptation needs
by major sectors, as shown in Table 13.1. Some of the most critical areas for adaptation
include water, agriculture, and human health. Climate change is expected to increase
precipitation in some areas, mainly the higher latitudes including Alaska, Canada, and Russia,
but decrease it in other areas, including Central America, North Africa, and southern Europe.
Chapter 13: Global Climate Change: Policy Responses 4
A reduction in water runoff from snowmelt and glaciers could threaten the water supplies of
more than a billion people in areas such as India and parts of South America. Providing safe
drinking water in these regions may require building new dams for water storage, increasing
the efficiency of water use, and other adaptation strategies.
Changing precipitation and temperature patterns have significant implications for
agriculture. With moderate warming, crop yields are expected to increase in some colder
regions, including parts of North America, but overall the impacts on agriculture are expected
to be negative, and increasingly so with greater warming. In the US, climate change has
worsened and lengthened the episodes of droughts in the Western States, notably California,
which, as a result, has already forced farmers to adapt to less water-intensive crops, replacing
orange groves and avocado trees with other tree crops such as pomegranates or cactus-like
dragonfruit.5 Agricultural impacts are expected to be the most severe in Africa and Asia.
More research is necessary to develop crops that can grow under anticipated drier weather
conditions. Agriculture may need to be abandoned in some areas but expanded in others.64
Table 13.1 Climate Change Adaptation Needs, by Sector
Sector Adaptation strategies
Water Expand water storage and desalination
Improve watershed and reservoir management Increase water-use
and irrigation efficiency and water re-use
Urban and rural flood management
Agriculture Adjust planting dates and crop locations
Develop crop varieties adapted to drought, higher temperatures
Improved land management to deal with floods/droughts
Strengthen indigenous/traditional knowledge and practice
Infrastructure Relocate vulnerable communities
Build and strengthen seawalls and other barriers
Create and restore wetlands for flood control
Dune reinforcement
Human health Health plans for extreme heat
Increase tracking, early-warning systems for heat-related diseases
Address threats to safe drinking water supplies
Extend basic public health services
Transport Relocation or adapt transport infrastructure
New design standards to cope with climate change
Energy Strengthen distribution infrastructure
Address increased demand for cooling
Increase efficiency, increase use of renewables
Ecosystems Reduce other ecosystem stresses and human use pressures
Improve scientific understanding, enhanced monitoring
Reduce deforestation, increase reforestation
Increase mangrove, coral reef, and seagrass protection
Source: IPCC, 2007; IPCC, 2014b.
Chapter 13: Global Climate Change: Policy Responses 5
The impacts of climate change on human health are already occurring. The World Health
Organization (WHO) has estimated that more than 140,000 people per year are already dying
as a direct result of climate change, primarily in Africa and Southeast Asia. The WHO
estimates that after 2030, climate change will result in 250,000 additional deaths per years,
caused by malnutrition, malaria, diarrhea, and heat stress. The WHO estimates direct damage
costs to health at between US$ 2 ̶ 4 billion per year by 2030. WHO policy recommendations
include strengthening public health systems, including increased education, disease
surveillance, vaccination, and preparedness.7
Various estimates exist for the cost of appropriate adaptation measures. The United
Nations Environment Program (UNEP) estimates that the cost of adaptation for developing
nations could rise to between $140 and $300 billion per year by 2030, and between $280 and
$500 billion per year by 2050. These sums significantly exceed the $100 billion per year
pledged by developed nations in the 2015 Paris Agreement. UNEP warns that there will be a
significant finance gap, “likely to grow substantially over the coming decades, unless
significant progress is made to secure new, additional and innovative financing for
adaptation”. Adaptation costs are already two to three times higher than current international
public funding for adaptation. 8
13.2 CLIMATE CHANGE MITIGATION: ECONOMIC POLICY OPTIONS
The release of greenhouse gases in the atmosphere is a clear example of a negative
externality that imposes significant costs on a global scale. In the language of economic
theory, the current market for carbon-based fuels such as coal, oil, and natural gas takes into
account only private costs and benefits, which leads to a market equilibrium that does not
correspond to the social optimum. From a social perspective, the market price for fossil fuels
is too low and the quantity consumed too high, as discussed in Chapter 11.
carbon tax a per-unit tax on goods and services based on the quantity of carbon dioxide
emitted during the production or consumption process.
social cost of carbon an estimate of the financial cost of carbon emissions per unit, including
both present and future costs.
Carbon Taxes
A standard economic remedy for internalizing external costs is a per-unit tax on the pollutant.
In this case, what is called for is a carbon tax, levied on carbon-based fossil fuels in
proportion to the amount of carbon associated with their production and use. Such a tax will
raise the price of carbon-based energy sources and so give consumers incentives to conserve
energy overall (which would reduce their tax burden), as well as shifting their demand to
alternative sources of energy that produce lower carbon emissions (and are thus taxed at
lower rates). In economic terms, the level of such a tax should be based on the social cost of
carbon – an estimate of the financial impact on society of carbon emissions. The U.S.
Environmental Protection Agency estimates the social cost of carbon, based on varying
assumptions, as being between $11 and $212, with a median range around $50.9 (As noted in
Chapter 12, a major reason for differing estimates is assumptions regarding discount rates and
risk/uncertainty).
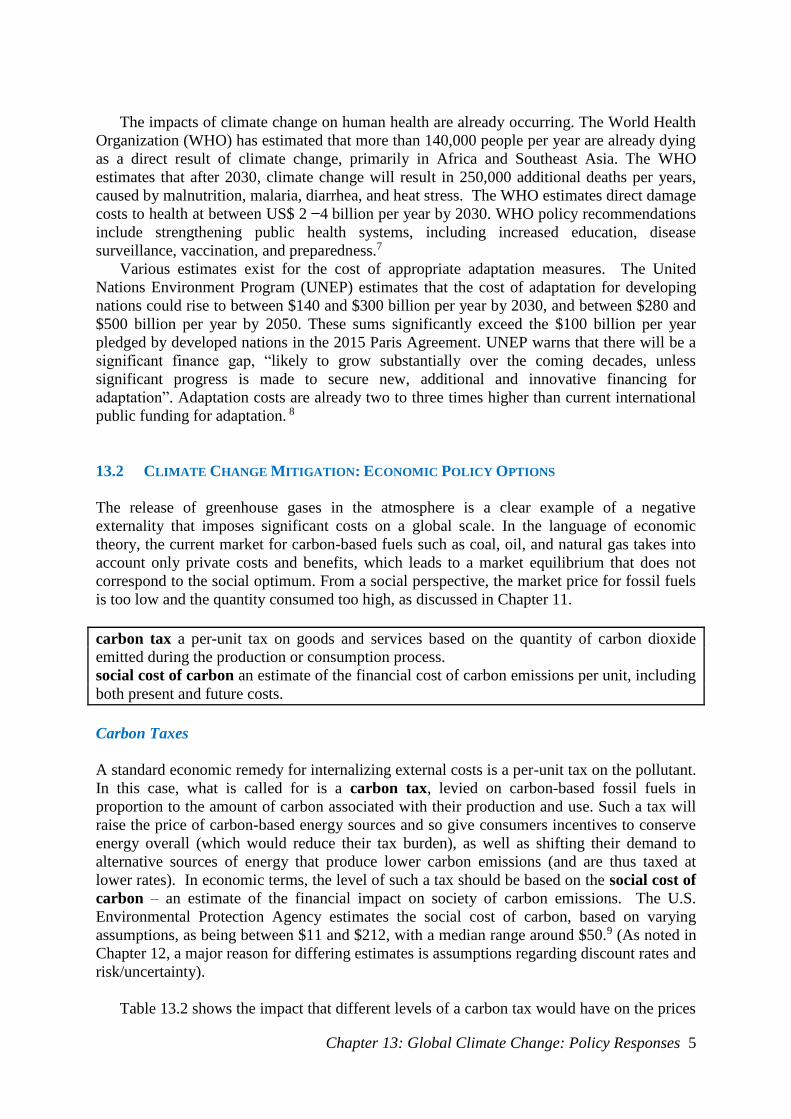
Table 13.2 shows the impact that different levels of a carbon tax would have on the prices
Chapter 13: Global Climate Change: Policy Responses 6
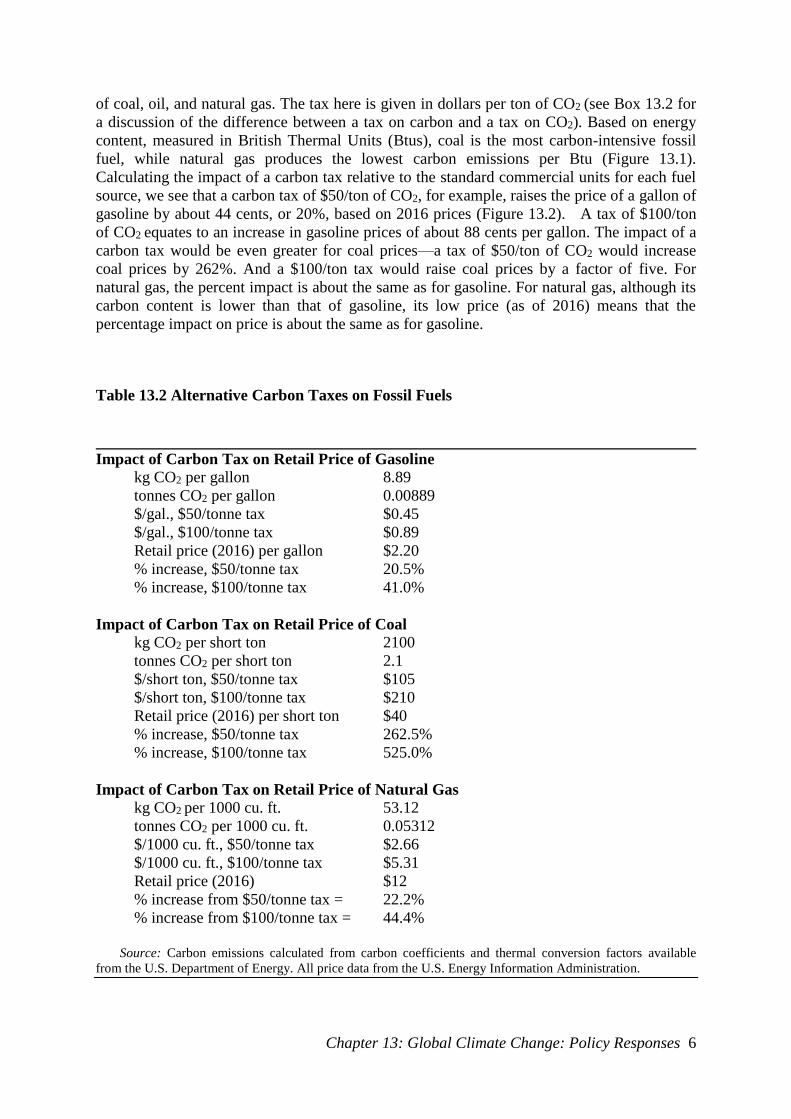
of coal, oil, and natural gas. The tax here is given in dollars per ton of CO2 (see Box 13.2 for
a discussion of the difference between a tax on carbon and a tax on CO2). Based on energy
content, measured in British Thermal Units (Btus), coal is the most carbon-intensive fossil
fuel, while natural gas produces the lowest carbon emissions per Btu (Figure 13.1).
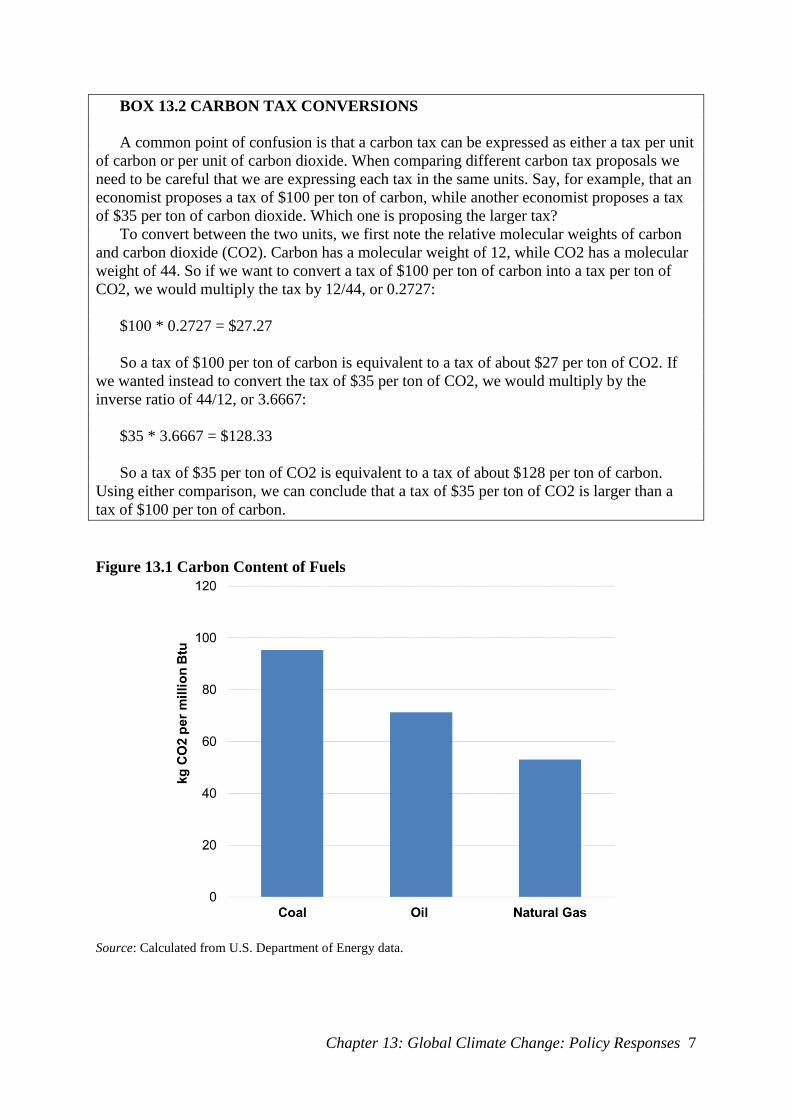
Calculating the impact of a carbon tax relative to the standard commercial units for each fuel
source, we see that a carbon tax of $50/ton of CO2, for example, raises the price of a gallon of
gasoline by about 44 cents, or 20%, based on 2016 prices (Figure 13.2). A tax of $100/ton
of CO2 equates to an increase in gasoline prices of about 88 cents per gallon. The impact of a
carbon tax would be even greater for coal prices—a tax of $50/ton of CO2 would increase
coal prices by 262%. And a $100/ton tax would raise coal prices by a factor of five. For
natural gas, the percent impact is about the same as for gasoline. For natural gas, although its
carbon content is lower than that of gasoline, its low price (as of 2016) means that the
percentage impact on price is about the same as for gasoline.
Table 13.2 Alternative Carbon Taxes on Fossil Fuels
Impact of Carbon Tax on Retail Price of Gasoline kg CO2 per gallon 8.89
tonnes CO2 per gallon 0.00889
$/gal., $50/tonne tax $0.45
$/gal., $100/tonne tax $0.89
Retail price (2016) per gallon $2.20
% increase, $50/tonne tax 20.5%
% increase, $100/tonne tax 41.0%
Impact of Carbon Tax on Retail Price of Coal
kg CO2 per short ton 2100
tonnes CO2 per short ton 2.1
$/short ton, $50/tonne tax $105
$/short ton, $100/tonne tax $210
Retail price (2016) per short ton $40
% increase, $50/tonne tax 262.5%
% increase, $100/tonne tax 525.0%
Impact of Carbon Tax on Retail Price of Natural Gas
kg CO2 per 1000 cu. ft. 53.12
tonnes CO2 per 1000 cu. ft. 0.05312
$/1000 cu. ft., $50/tonne tax $2.66
$/1000 cu. ft., $100/tonne tax $5.31
Retail price (2016) $12
% increase from $50/tonne tax = 22.2%
% increase from $100/tonne tax = 44.4%
Source: Carbon emissions calculated from carbon coefficients and thermal conversion factors available
from the U.S. Department of Energy. All price data from the U.S. Energy Information Administration.
Chapter 13: Global Climate Change: Policy Responses 7
BOX 13.2 CARBON TAX CONVERSIONS
A common point of confusion is that a carbon tax can be expressed as either a tax per unit
of carbon or per unit of carbon dioxide. When comparing different carbon tax proposals we
need to be careful that we are expressing each tax in the same units. Say, for example, that an
economist proposes a tax of $100 per ton of carbon, while another economist proposes a tax
of $35 per ton of carbon dioxide. Which one is proposing the larger tax?
To convert between the two units, we first note the relative molecular weights of carbon
and carbon dioxide (CO2). Carbon has a molecular weight of 12, while CO2 has a molecular
weight of 44. So if we want to convert a tax of $100 per ton of carbon into a tax per ton of
CO2, we would multiply the tax by 12/44, or 0.2727:
$100 * 0.2727 = $27.27
So a tax of $100 per ton of carbon is equivalent to a tax of about $27 per ton of CO2. If
we wanted instead to convert the tax of $35 per ton of CO2, we would multiply by the
inverse ratio of 44/12, or 3.6667:
$35 * 3.6667 = $128.33
So a tax of $35 per ton of CO2 is equivalent to a tax of about $128 per ton of carbon.
Using either comparison, we can conclude that a tax of $35 per ton of CO2 is larger than a
tax of $100 per ton of carbon.
Figure 13.1 Carbon Content of Fuels
Source: Calculated from U.S. Department of Energy data.
Chapter 13: Global Climate Change: Policy Responses 8
Figure 13.2 Impact of a Carbon Tax on Gasoline Price
Source: Calculated from U.S. Department of Energy data.
Will these tax amounts affect people’s driving or home heating habits very much, or
impact industry’s use of fuels? This depends on the elasticity of demand for these fuels. As
noted earlier (see Chapter 3 Appendix), elasticity of demand is defined as:
Percent change in quantity demandedElasticity of demand
percent change in price
Economists have measured the elasticity of demand for different fossil fuels, particularly
gasoline. (Elasticity of demand is generally negative, since a positive percent change in price
causes a negative percent change in quantity demanded.) Studies indicate that in the short
term (about one year or less) elasticity estimates ranged from −0.03 to −0.25.10 This means
that a 10 percent increase in the price of gasoline would be expected to decrease gasoline
demand in the short term by about −0.3 to −2.5 percent.10
In the long term (about five years or so) people are more responsive to gasoline price
increases, as they have time to purchase different vehicles and adjust their driving habits. The
average long-term elasticity of demand for motor fuels, based on fifty-one estimates, is –
−0.64.11 According to Table 13.2, a tax of $50 per ton of CO2 would increase the price of
gasoline by about 20 percent, adding 44 cents per gallon to the price of gasoline based on
2016 prices. A long-term elasticity of –0.64 suggests that after people have time to fully
adjust to this price change, the demand for gasoline should decline by about 13 percent.
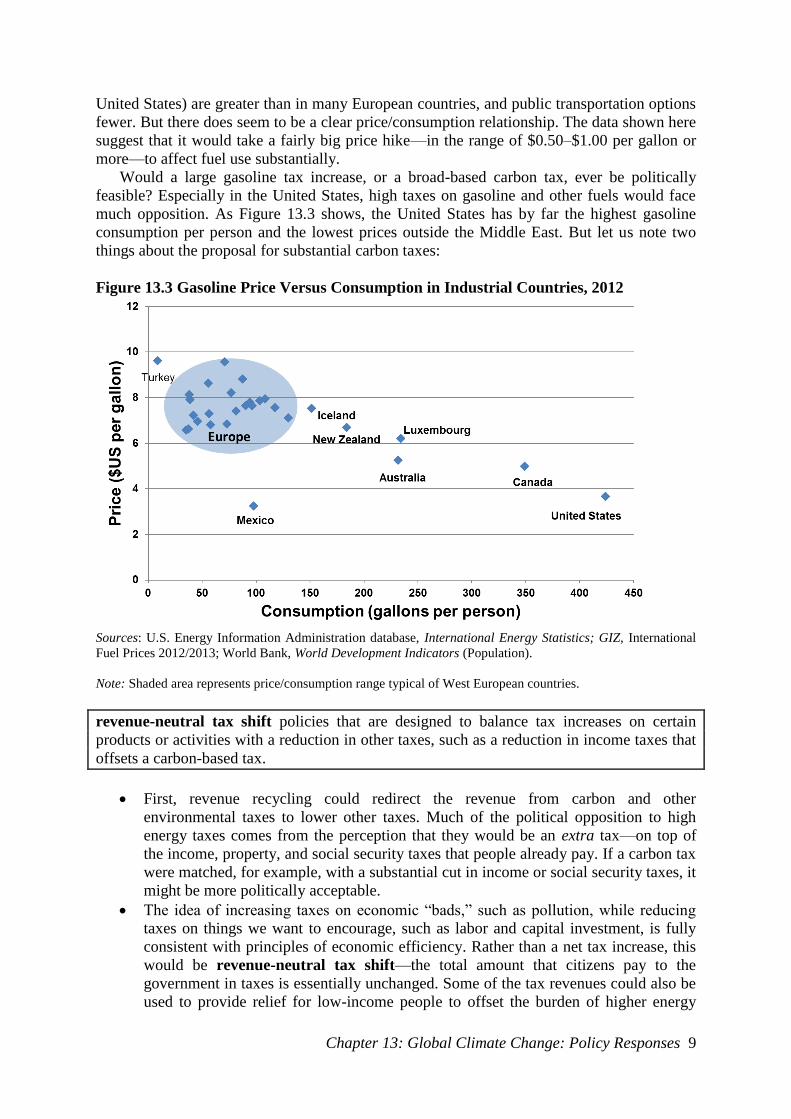
Figure 13.3 shows a cross-country relationship between gasoline prices and per capita
consumption. (Since the cost of producing a gallon of gasoline varies little across countries,
variations in the price of a gallon in different countries is almost solely a function of
differences in taxes.) Note that this relationship is similar to that of a demand curve: Higher
prices are associated with lower consumption, and lower prices with higher consumption.
The relationship shown here, however, is not exactly the same as a demand curve; since
we are looking at data from different countries, the assumption of “other things equal,” which
is needed to construct a demand curve, does not hold. Differences in demand may, for
example, be in part a function of differences in income levels rather than prices. Also, people
in the United States may drive more partly because travel distances (especially in the western
Chapter 13: Global Climate Change: Policy Responses 9
United States) are greater than in many European countries, and public transportation options
fewer. But there does seem to be a clear price/consumption relationship. The data shown here
suggest that it would take a fairly big price hike—in the range of $0.50–$1.00 per gallon or
more—to affect fuel use substantially.
Would a large gasoline tax increase, or a broad-based carbon tax, ever be politically
feasible? Especially in the United States, high taxes on gasoline and other fuels would face
much opposition. As Figure 13.3 shows, the United States has by far the highest gasoline
consumption per person and the lowest prices outside the Middle East. But let us note two
things about the proposal for substantial carbon taxes:
Figure 13.3 Gasoline Price Versus Consumption in Industrial Countries, 2012
Sources: U.S. Energy Information Administration database, International Energy Statistics; GIZ, International
Fuel Prices 2012/2013; World Bank, World Development Indicators (Population).
Note: Shaded area represents price/consumption range typical of West European countries.
revenue-neutral tax shift policies that are designed to balance tax increases on certain
products or activities with a reduction in other taxes, such as a reduction in income taxes that
offsets a carbon-based tax.
First, revenue recycling could redirect the revenue from carbon and other
environmental taxes to lower other taxes. Much of the political opposition to high
energy taxes comes from the perception that they would be an extra tax—on top of
the income, property, and social security taxes that people already pay. If a carbon tax
were matched, for example, with a substantial cut in income or social security taxes, it
might be more politically acceptable.
The idea of increasing taxes on economic “bads,” such as pollution, while reducing
taxes on things we want to encourage, such as labor and capital investment, is fully
consistent with principles of economic efficiency. Rather than a net tax increase, this
would be revenue-neutral tax shift—the total amount that citizens pay to the
government in taxes is essentially unchanged. Some of the tax revenues could also be
used to provide relief for low-income people to offset the burden of higher energy
Chapter 13: Global Climate Change: Policy Responses 10
costs.
Second, if such a revenue-neutral tax shift did take place, individuals or businesses
whose operations were more energy efficient would actually save money overall. The
higher cost of energy would also create a powerful incentive for energy-saving
technological innovations and stimulate new markets. Economic adaptation would be
easier if the higher carbon taxes (and lower income and capital taxes) were phased in
over time.
Tradable Permits
cap and trade a tradable permit system for pollution emissions
An alternative to a carbon tax is a system of tradable carbon permits, also called cap-and-
trade. A carbon trading scheme can be implemented at the state or national level, or could
include multiple countries. A national permit system could work as follows, as discussed in
Chapter 8:
Each emitting firm would be allocated a specific permissible level of carbon
emissions. The total number of carbon permits issued would equal the desired
national goal. For example, if carbon emissions for a particular country are
currently 40 million tons and the policy goal is to reduce this by 10 percent (4
million tons), then permits would be issued to emit only 36 million tons. Over
time, the goal could be increased, with the result that fewer permits would be
issued in future periods.
Permits are allocated to individual carbon-emitting sources. Including all carbon
sources (e.g., all motor vehicles) in a trading scheme is generally not practical. It
is most effective to implement permits as far upstream in the production process
as possible to simplify the administration of the program and cover the most
emissions. (“upstream” here denotes an early stage in the production process, as
discussed in Chapter 3 regarding a pollution tax). Permits could be allocated to
the largest carbon emitters, such as power companies and manufacturing plants,
or even further upstream to the suppliers through which carbon fuels enter the
production process—oil producers and importers, coal mines, and natural gas
drillers.
These permits could initially be allocated for free on the basis of past emissions or
auctioned to the highest bidders. As discussed in Chapter 8, the effectiveness of the
trading system should be the same regardless of how the permits are allocated.
However, there is a significant difference in the distribution of costs and benefits:
Giving permits out for free essentially amounts to a windfall gain for polluters, while
auctioning permits imposes real costs upon firms and generates public revenues.
Firms are able to trade permits freely among themselves. Firms whose emissions
exceed the number of permits they hold must purchase additional permits or else face
penalties. Meanwhile firms that are able to reduce their emissions below their
allowance at low cost will seek to sell their permits for a profit. A permit price will be
determined through market supply and demand. It may also be possible for
environmental groups or other organizations to purchase permits and retire them—
thus reducing overall emissions.
In an international system, countries and firms could also receive credit for financing
carbon reduction efforts in other countries. For example, a German firm could get
Chapter 13: Global Climate Change: Policy Responses 11
credit for installing efficient renewable electric generating equipment in China,
replacing highly polluting coal plants.
A tradable permit system encourages the least-cost carbon reduction options to be
implemented, as rational firms will implement those emission-reduction actions that are
cheaper than the market permit price. As discussed in Chapter 8, tradable permit systems
have been successful in reducing sulfur and nitrogen oxide emissions at low cost. Depending
on the allocation of permits in an international scheme, it might also mean that developing
countries could transform permits into a new export commodity by choosing a non-carbon
path for their energy development. They would then be able to sell permits to industrialized
countries that were having trouble meeting their reduction requirements. Farmers and
foresters could also get carbon credits for using methods that store carbon in soils or preserve
forests.
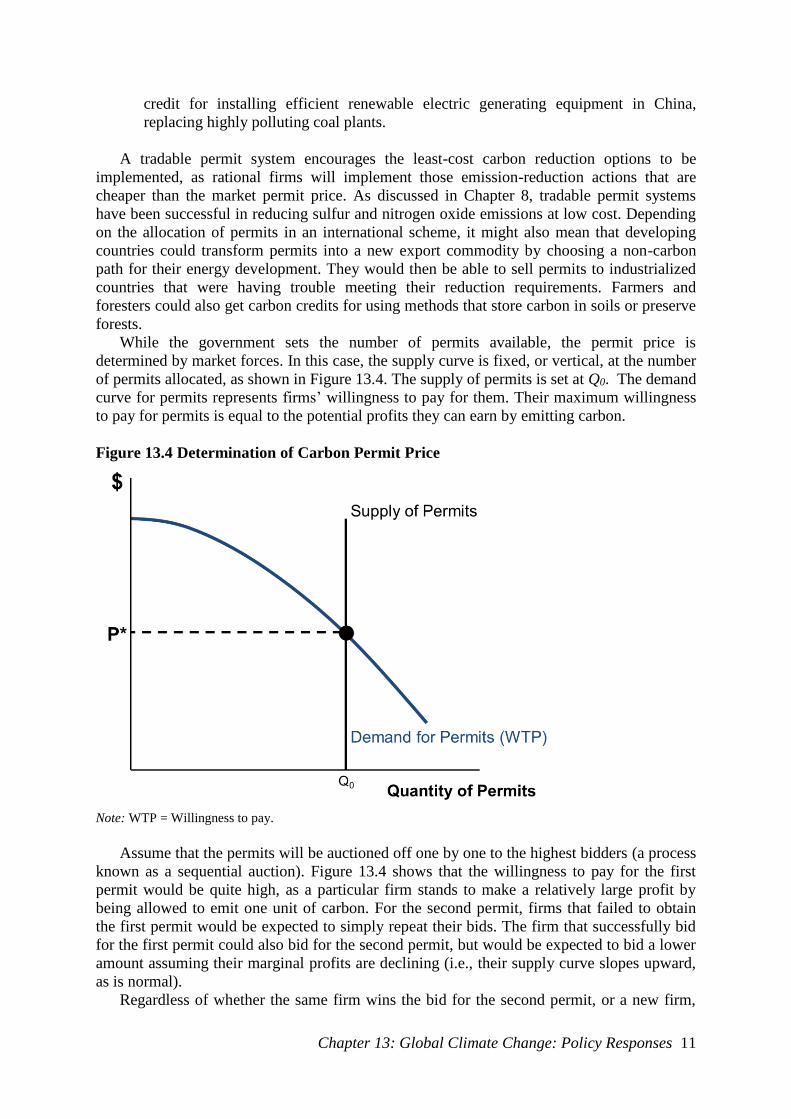
While the government sets the number of permits available, the permit price is
determined by market forces. In this case, the supply curve is fixed, or vertical, at the number
of permits allocated, as shown in Figure 13.4. The supply of permits is set at Q0. The demand
curve for permits represents firms’ willingness to pay for them. Their maximum willingness
to pay for permits is equal to the potential profits they can earn by emitting carbon.
Figure 13.4 Determination of Carbon Permit Price
Note: WTP = Willingness to pay.
Assume that the permits will be auctioned off one by one to the highest bidders (a process
known as a sequential auction). Figure 13.4 shows that the willingness to pay for the first
permit would be quite high, as a particular firm stands to make a relatively large profit by
being allowed to emit one unit of carbon. For the second permit, firms that failed to obtain
the first permit would be expected to simply repeat their bids. The firm that successfully bid
for the first permit could also bid for the second permit, but would be expected to bid a lower
amount assuming their marginal profits are declining (i.e., their supply curve slopes upward,
as is normal).
Regardless of whether the same firm wins the bid for the second permit, or a new firm,
Chapter 13: Global Climate Change: Policy Responses 12
the selling price for the second permit would be lower. This process would continue, with all
successive permits selling for lower prices, until the last permit is auctioned off. The selling
price of this permit, represented by P* in the graph, is the market-clearing permit price. We
can also interpret P* as the marginal benefit, or profit, associated with the right to emit the
Q0th unit of carbon.
While permits could theoretically sell for different prices in a sequential auction, tradable
permit markets are normally set up so that all permits sell for the market-clearing price. This
is the case for the acid rain program in the United States, which has operated since 1995 and
is widely considered to be a successful emissions trading program, as discussed in Chapter 8,
Box 8.2. In that program, all parties interested in purchasing permits make their bids,
indicating how many permits they are willing to purchase at what price. Whoever bids the
highest gets the number of permits that were requested. Then the second-highest bidders get
the number of permits they applied for, and so on until all permits are allocated. The selling
price of all permits is the winning bid for the very last permit available. This would be P* in
Figure 13.4. All bidders who bid below this price do not receive any permits.
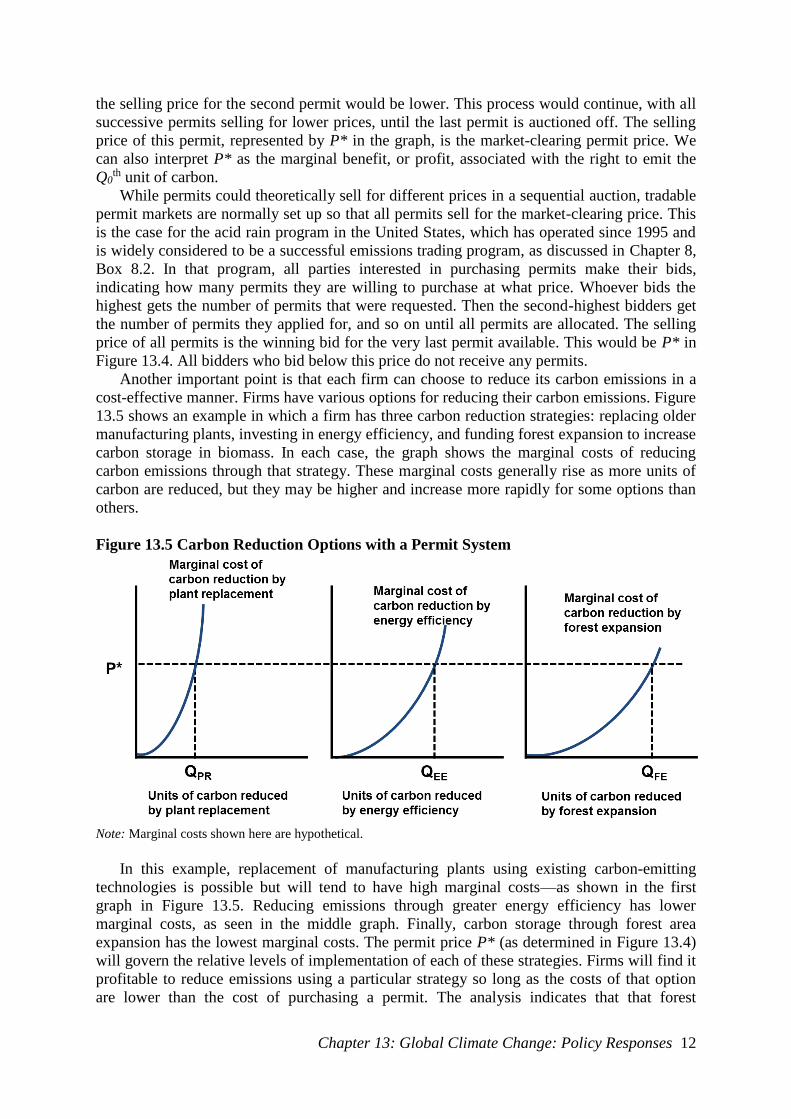
Another important point is that each firm can choose to reduce its carbon emissions in a
cost-effective manner. Firms have various options for reducing their carbon emissions. Figure
13.5 shows an example in which a firm has three carbon reduction strategies: replacing older
manufacturing plants, investing in energy efficiency, and funding forest expansion to increase
carbon storage in biomass. In each case, the graph shows the marginal costs of reducing
carbon emissions through that strategy. These marginal costs generally rise as more units of
carbon are reduced, but they may be higher and increase more rapidly for some options than
others.
Figure 13.5 Carbon Reduction Options with a Permit System
Note: Marginal costs shown here are hypothetical.
In this example, replacement of manufacturing plants using existing carbon-emitting
technologies is possible but will tend to have high marginal costs—as shown in the first
graph in Figure 13.5. Reducing emissions through greater energy efficiency has lower
marginal costs, as seen in the middle graph. Finally, carbon storage through forest area
expansion has the lowest marginal costs. The permit price P* (as determined in Figure 13.4)
will govern the relative levels of implementation of each of these strategies. Firms will find it
profitable to reduce emissions using a particular strategy so long as the costs of that option
are lower than the cost of purchasing a permit. The analysis indicates that that forest
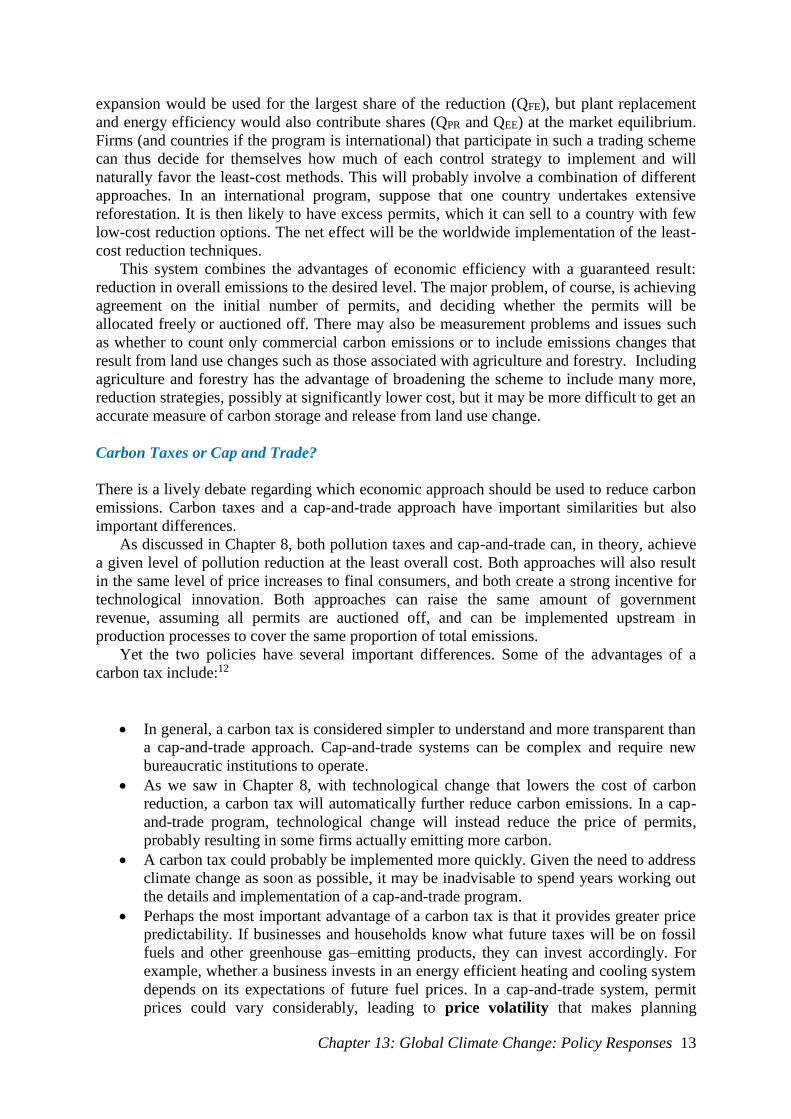
Chapter 13: Global Climate Change: Policy Responses 13
expansion would be used for the largest share of the reduction (QFE), but plant replacement
and energy efficiency would also contribute shares (QPR and QEE) at the market equilibrium.
Firms (and countries if the program is international) that participate in such a trading scheme
can thus decide for themselves how much of each control strategy to implement and will
naturally favor the least-cost methods. This will probably involve a combination of different
approaches. In an international program, suppose that one country undertakes extensive
reforestation. It is then likely to have excess permits, which it can sell to a country with few
low-cost reduction options. The net effect will be the worldwide implementation of the least-
cost reduction techniques.
This system combines the advantages of economic efficiency with a guaranteed result:
reduction in overall emissions to the desired level. The major problem, of course, is achieving
agreement on the initial number of permits, and deciding whether the permits will be
allocated freely or auctioned off. There may also be measurement problems and issues such
as whether to count only commercial carbon emissions or to include emissions changes that
result from land use changes such as those associated with agriculture and forestry. Including
agriculture and forestry has the advantage of broadening the scheme to include many more,
reduction strategies, possibly at significantly lower cost, but it may be more difficult to get an
accurate measure of carbon storage and release from land use change.
Carbon Taxes or Cap and Trade?
There is a lively debate regarding which economic approach should be used to reduce carbon
emissions. Carbon taxes and a cap-and-trade approach have important similarities but also
important differences.
As discussed in Chapter 8, both pollution taxes and cap-and-trade can, in theory, achieve
a given level of pollution reduction at the least overall cost. Both approaches will also result
in the same level of price increases to final consumers, and both create a strong incentive for
technological innovation. Both approaches can raise the same amount of government
revenue, assuming all permits are auctioned off, and can be implemented upstream in
production processes to cover the same proportion of total emissions.
Yet the two policies have several important differences. Some of the advantages of a
carbon tax include:12
In general, a carbon tax is considered simpler to understand and more transparent than
a cap-and-trade approach. Cap-and-trade systems can be complex and require new
bureaucratic institutions to operate.
As we saw in Chapter 8, with technological change that lowers the cost of carbon
reduction, a carbon tax will automatically further reduce carbon emissions. In a cap-
and-trade program, technological change will instead reduce the price of permits,
probably resulting in some firms actually emitting more carbon.
A carbon tax could probably be implemented more quickly. Given the need to address
climate change as soon as possible, it may be inadvisable to spend years working out
the details and implementation of a cap-and-trade program.
Perhaps the most important advantage of a carbon tax is that it provides greater price
predictability. If businesses and households know what future taxes will be on fossil
fuels and other greenhouse gas–emitting products, they can invest accordingly. For
example, whether a business invests in an energy efficient heating and cooling system
depends on its expectations of future fuel prices. In a cap-and-trade system, permit
prices could vary considerably, leading to price volatility that makes planning
Chapter 13: Global Climate Change: Policy Responses 14
difficult. A carbon tax, by contrast, provides a degree of price stability, especially if
carbon tax levels are published years into the future.
price volatility rapid and frequent changes in price, leading to market instability.
The advantages of a cap-and-trade system include:
Even though a cap-and-trade system ultimately results in the same level of price
increases to consumers and businesses, it avoids the negative connotations of a “tax.”
So a cap-and-trade system often generates less political opposition than a carbon tax.
Some businesses favor cap-and-trade because they believe that they can successfully
lobby governments for free permits, rather than having to purchase them at auction.
Distributing permits for free in the early stages of a cap-and-trade program can make
it more politically acceptable to businesses.
The greatest advantage of a cap-and-trade approach is that emissions are known with
certainty because the government sets the number of available permits. Since the
policy goal is ultimately to reduce carbon emissions, a cap-and-trade approach does
this directly while a carbon tax does it indirectly through price increases. Using a cap-
and-trade approach, we can achieve a specific emissions path simply by setting the
number of permits. In a carbon tax system, achieving a specific emissions target may
require numerous adjustments to the tax rates, which may be politically very difficult.
The choice of instrument—carbon tax or cap-and-trade—mainly depends on whether
policy makers are more concerned with price uncertainty or emissions uncertainty. (Recall
the discussion on price versus quantity instruments in Chapter 8). If you take the perspective
that price certainty is important because it allows for better long-term planning, then a carbon
tax is preferable. If you believe that the relevant policy goal is to reduce carbon emissions by
a specified amount with certainty, then a cap-and-trade approach is preferable, although it
may lead to some price volatility. Another practical difference appears to be that carbon tax
revenues are more often refunded to taxpayers or used in general government spending, while
cap-and-trade auction revenues are more often used to support such “green” investments as
renewable energy, energy efficiency, and forest conservation.12
Other Policy Tools: Subsidies, Standards, R&D, and Technology Transfer
Political hurdles may prevent the adoption of sweeping carbon taxes or transferable permit
systems. Fortunately, a variety of other policy measures have the potential to lower carbon
emissions. Even with implementation of a widespread carbon tax or cap-and-trade system,
supplemental policies may still be necessary to reduce carbon emissions sufficiently to keep
warming within acceptable levels. These policies are generally not considered to be sufficient
by themselves, but they may be important components of a comprehensive approach. To
some extent these policies are already being implemented in various countries. These policies
include:
• Shifting subsidies from carbon-based to non–carbon-based fuels. Many countries
currently provide direct or indirect subsidies to fossil fuels, as discussed in Chapter 11.
The elimination of these subsidies would alter the competitive balance in favor of
alternative fuel sources. If these subsidy expenditures were redirected to renewable
sources, especially in the form of tax rebates for investment, it could promote a boom in
Chapter 13: Global Climate Change: Policy Responses 15
investment in renewables.
• The use of efficiency standards for machinery and appliances, and fuel-economy
standards or requirements for low-carbon fuels. By imposing standards that require
greater energy efficiency or lower carbon use, technologies and practices can be altered in
favor of a low-carbon path.
• Research and development (R&D) expenditures promoting the commercialization of
alternative technologies. Both government R&D programs and favorable tax treatment of
corporate R&D for alternative energy can speed commercialization. The existence of non-
carbon “backstop” technologies significantly reduces the economic cost of measures such
as carbon taxes, and if the backstop were to become fully competitive with fossil fuels,
carbon taxes would be unnecessary.
• Technology transfer to developing countries. The bulk of projected growth in carbon
emissions will come in the developing world. Many energy development projects are now
funded by agencies such as the World Bank and regional development banks. To the
extent that these funds can be directed toward non-carbon energy systems, supplemented
by other funds dedicated specifically to alternative energy development, it will be
economically feasible for developing countries to turn away from fossil-fuel intensive
paths, achieving significant local environmental benefits at the same time.
efficiency standards regulations that mandate efficiency criteria for goods, such as fuel
economy standards for automobiles.
technology transfer the process of sharing technological information or equipment,
particularly among countries.
13.3 CLIMATE CHANGE: THE TECHNICAL CHALLENGE
Meeting the climate change challenge requires both behavioral change and technological
change. Economic policy instruments such as carbon taxes, cap and trade, and subsidies use
incentives to motivate changes in behavior. For example, a carbon tax that raises the price of
gasoline will create incentives to drive less or buy a more fuel-efficient vehicle. But we can
also look at climate change from a technical perspective rather than a behavioral perspective.
Economic policies can create powerful incentives for technological changes. Because of
higher gas prices as a result of a carbon tax, the increased demand for high-efficiency
vehicles would motivate automobile companies to direct more of their investments to hybrid
and electric vehicles.
It is worthwhile to consider what needs to be done in response to climate change from a
technical perspective—not just to gain a greater understanding of the issues but to also gain
some insights for appropriate policies. We now summarize two well-known analyses of the
technical aspects of carbon mitigation.
Climate Stabilization Wedges
Some proposals for carbon mitigation require significant technological advancement, such as
the widespread use of artificial photosynthesis, carbon capture and storage, or nuclear fusion.
The future cost and technical feasibility of these technologies remain uncertain. Ideally, we
could reduce carbon emissions sufficiently using existing technologies or those reasonably
expected to be available in the near future. One way of summarizing the potential for scaling
up existing technologies is the “carbon wedge” concept proposed by physical scientists
Stephen Pacala and Robert Socolow.13
Chapter 13: Global Climate Change: Policy Responses 16
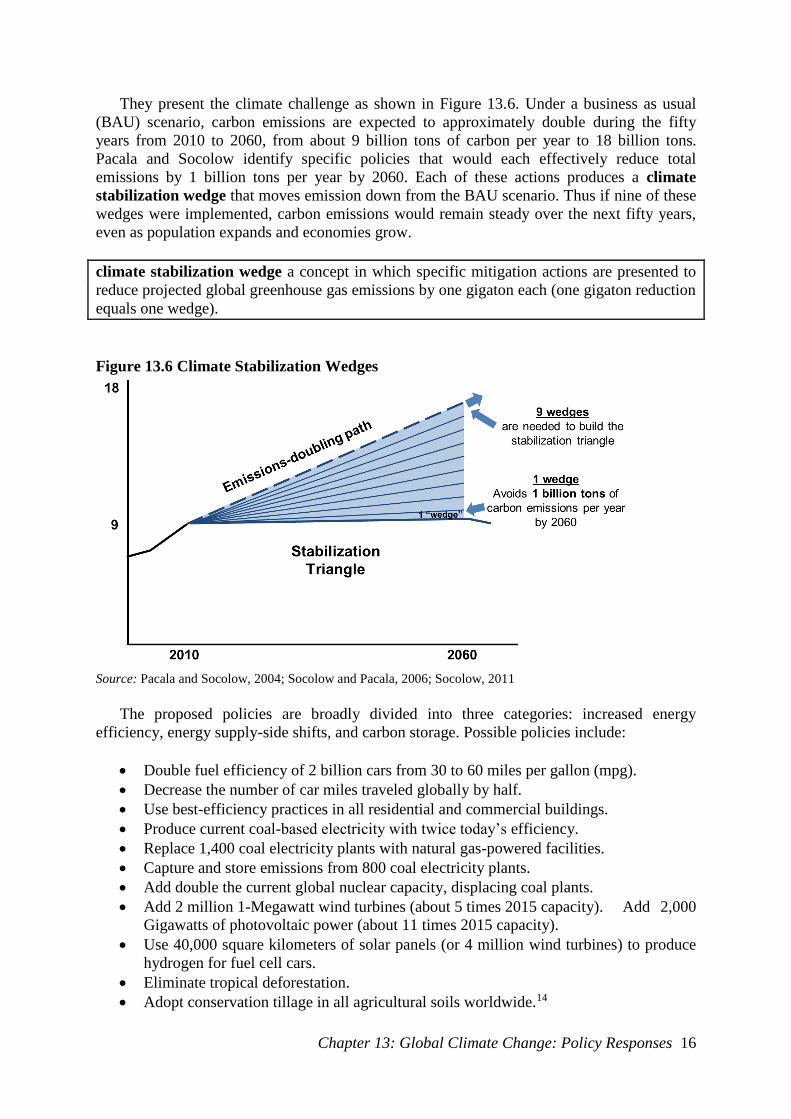
They present the climate challenge as shown in Figure 13.6. Under a business as usual
(BAU) scenario, carbon emissions are expected to approximately double during the fifty
years from 2010 to 2060, from about 9 billion tons of carbon per year to 18 billion tons.
Pacala and Socolow identify specific policies that would each effectively reduce total
emissions by 1 billion tons per year by 2060. Each of these actions produces a climate
stabilization wedge that moves emission down from the BAU scenario. Thus if nine of these
wedges were implemented, carbon emissions would remain steady over the next fifty years,
even as population expands and economies grow.
climate stabilization wedge a concept in which specific mitigation actions are presented to
reduce projected global greenhouse gas emissions by one gigaton each (one gigaton reduction
equals one wedge).
Figure 13.6 Climate Stabilization Wedges
Source: Pacala and Socolow, 2004; Socolow and Pacala, 2006; Socolow, 2011
The proposed policies are broadly divided into three categories: increased energy
efficiency, energy supply-side shifts, and carbon storage. Possible policies include:
Double fuel efficiency of 2 billion cars from 30 to 60 miles per gallon (mpg).
Decrease the number of car miles traveled globally by half.
Use best-efficiency practices in all residential and commercial buildings.
Produce current coal-based electricity with twice today’s efficiency.
Replace 1,400 coal electricity plants with natural gas-powered facilities.
Capture and store emissions from 800 coal electricity plants.
Add double the current global nuclear capacity, displacing coal plants.
Add 2 million 1-Megawatt wind turbines (about 5 times 2015 capacity). Add 2,000
Gigawatts of photovoltaic power (about 11 times 2015 capacity).
Use 40,000 square kilometers of solar panels (or 4 million wind turbines) to produce
hydrogen for fuel cell cars.
Eliminate tropical deforestation.
Adopt conservation tillage in all agricultural soils worldwide.14
Chapter 13: Global Climate Change: Policy Responses 17
All of these policies would need to be implemented on a global, rather than national,
scale. Also, as indicated by Figure 12.11 in the previous chapter, keeping emissions constant
over the next fifty years will not be sufficient to keep warming to acceptable levels. Thus
more than nine “wedges” will be required to stabilize atmospheric accumulations of carbon.
The wedges concept, though, does indicate significant potential from existing technologies:
None of the options is a pipe dream or an unproven idea. Today, one can buy electricity from a
wind turbine, PV array, gas turbine, or nuclear power plant. One can buy hydrogen produced with
the chemistry of carbon capture, biofuel to power one’s car, and hundreds of devices that improve
energy efficiency. One can visit tropical forests where clear-cutting has ceased, farms practicing
conservation tillage, and facilities that inject carbon into geologic reservoirs. Every one of these
options is already implemented at an industrial scale and could be scaled up further over 50 years
to provide at least one wedge.15
Significant policy changes will be needed to implement these wedges on a global scale.
Most important, Pacala and Socolow note the need for carbon to be properly priced, with a
suggested price of $100–$200 per ton of carbon ($27–$55 per ton of CO2). This would equate
to about 25 cents per gallon of gasoline.
They also address the path of carbon emissions for developing and developed countries. If
members of the Organization for Economic Cooperation and Development (OECD) were to
reduce their emissions by 60 percent over the next fifty years, emissions could theoretically
grow by 60 percent in the non-OECD countries over the same time period, allowing them
space for economic development while keeping total emissions stable. Yet even with this
allocation, per capita emissions would still be twice as high in the OECD countries as in the
developing countries. And, as noted in Chapter 12, stabilizing emissions will not be sufficient
to avert the worst impacts of climate change—significant overall global reduction will be
needed.
Greenhouse Gas Abatement Cost Curves
The climate stabilization wedges analysis does not address the costs of each wedge.
Obviously some wedges would be cheaper than others to implement. Depending on the social
cost of carbon emissions, some wedges may not provide net benefits to society. For a more
complete economic analysis, we also need to consider costs.
Another well-known analysis, by McKinsey & Company, estimates both the costs and the
potential carbon reduction of more than 200 greenhouse gas mitigation, or abatement, options
on a global scale. The various options are arranged in order of cost, from lowest cost to
highest. The economic logic is that it makes sense to implement actions that reduce carbon at
the lowest per-unit costs first and then proceed to more costly actions. The results of their
analysis are presented in Figure 13.7. The costs are estimated in euros, but the analysis covers
worldwide reduction possibilities.16
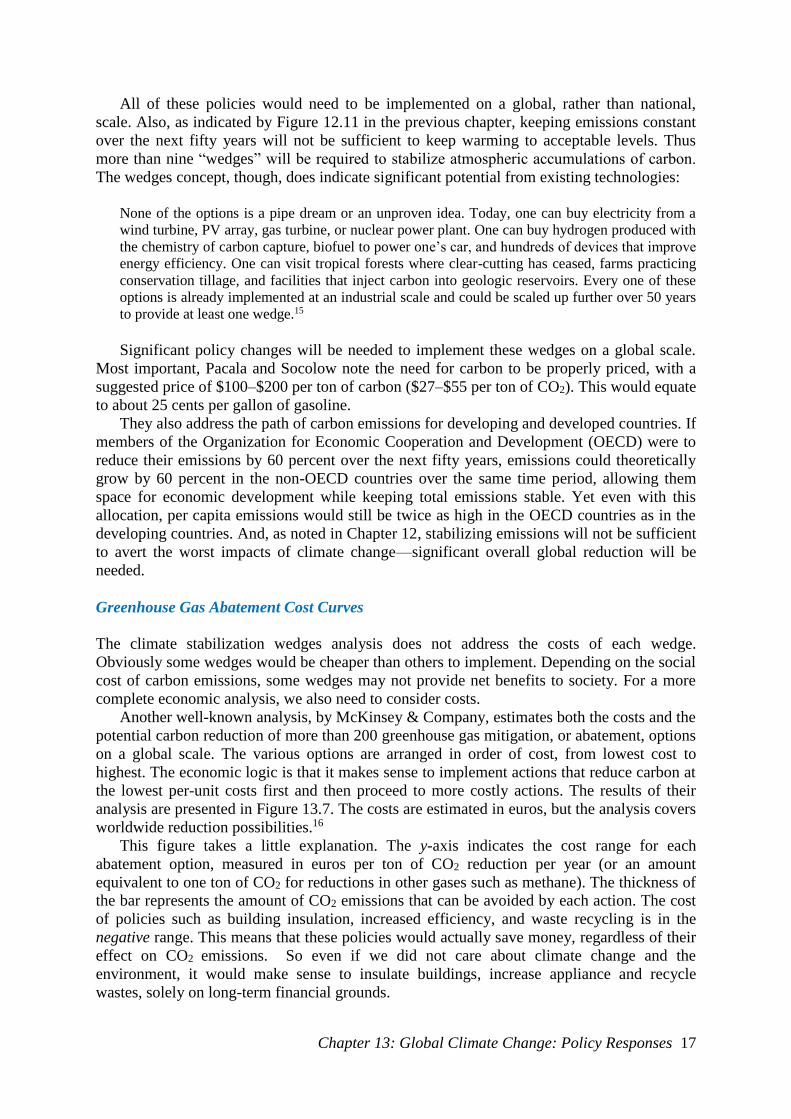
This figure takes a little explanation. The y-axis indicates the cost range for each
abatement option, measured in euros per ton of CO2 reduction per year (or an amount
equivalent to one ton of CO2 for reductions in other gases such as methane). The thickness of
the bar represents the amount of CO2 emissions that can be avoided by each action. The cost
of policies such as building insulation, increased efficiency, and waste recycling is in the
negative range. This means that these policies would actually save money, regardless of their
effect on CO2 emissions. So even if we did not care about climate change and the
environment, it would make sense to insulate buildings, increase appliance and recycle
wastes, solely on long-term financial grounds.
Chapter 13: Global Climate Change: Policy Responses 18
Figure 13.7 Global Greenhouse Gas Abatement Cost Curve for 2030
Source: Adapted from McKinsey & Company, 2009.
The x-axis tells us the cumulative reduction in CO2 equivalent emissions, relative to a
BAU scenario, if we were to implement all the actions to the left. So if we were to implement
all negative-cost options including improving efficiency of air-conditioning, lighting systems,
and water heating, total CO2 equivalent reduction would be about 10 billion tons (Gt) per
year, all while saving money!
Moving farther to the right, actions are identified that do entail positive costs. In other
words, for all these other actions it does cost us money to reduce CO2 emissions. Figure 13.7
shows all actions that reduce CO2 emissions for a cost of less than €60 per ton, including
expanding wind and solar energy, expanding nuclear energy, improved forest management
and reforestation, and implementing carbon capture and storage (CCS). (“Low penetration”
wind is defined as expanding wind energy to provide as much as 10 percent of electricity
supplies, while “high penetration” expands wind energy further, at slightly higher cost.)
If all these actions were implemented, total CO2-equivalent reduction would be 38 billion
tons/year. Total global CO2 equivalent emissions, including all greenhouse gases and
emissions from land use change, are currently about 50 billion tons per year, projected to rise
to about 70 Gt by 2030. Thus instead of emitting 70 Gt/year in 2030, we would be emitting
only 32 Gt—a decrease of 18 Gt below current levels. Further reduction could be achieved at
slightly higher cost, especially by more extensive expansion of wind and solar energy. (This
analysis does not take into account likely cost reductions for renewable energy). The total
cost of implementing all options in Figure 13.7, considering that some options actually save
money, is estimated to be less than 1 percent of global GDP in 2030. The report notes that
delaying action by just ten years makes keeping warming under 2°C extremely difficult.
Policy recommendations to achieve the reductions represented in Figure 13.7 include:
Establish strict technical standards for efficiency of buildings and vehicles.
Chapter 13: Global Climate Change: Policy Responses 19
Establish stable long-term incentives for power producers and industrial companies to
invest in and deploy efficient technologies.
Provide government support for emerging efficiency and renewable energy
technologies, through economic incentives and other policies.
Ensure efficient management of forests and agriculture, particularly in developing
countries.17
Again we see that instituting a carbon price is a part of a broader policy approach. A
carbon tax or cap-and-trade program would create an incentive for the actions in Figure 13.7,
but it does not guarantee that they will occur. In theory, we should already be using all the
negative-cost options even in the absence of a carbon price, yet we are not. Standards and
mandates can be an effective complement to a carbon price to ensure that cost-efficient
actions are implemented. Potential policies could include efficiency standards for appliances,
lighting, and building insulation.
How reliable is this abatement cost curve analysis? The McKinsey study has been subject
to criticism both for underestimating and overestimating some costs. Also, some actions that
are technically feasible, like reducing emissions from agricultural and forestry practices, may
be difficult to achieve in practice due to political and institutional barriers.18 Nonetheless,
abatement costs curves such as those presented in the McKinsey study illustrate the basic
principle that many low-cost or no-cost actions could be taken to reduce carbon emissions.
Emissions growth is therefore not inevitable; substantial emissions reduction below current
levels can be achieved at modest economic cost.
13.4 CLIMATE CHANGE POLICY IN PRACTICE
Climate change is an international environmental issue. In economic theory terms, as we
noted in Chapter 12, climate change is a public good issue, requiring global collaboration to
achieve effective results. Since the United Nations Framework Convention on Climate
Change (UNFCCC) was first established in 1992, there have been extensive international
discussions, known as “Conferences of the Parties” or COPs, aimed at reaching a global
agreement on emissions reduction (See Table13.3).
The first comprehensive international agreement on climate change was the Kyoto
Protocol, adopted at the third COP in 1997, which has now expired. Under the Kyoto treaty,
industrial countries agreed to emission reduction targets by 2008–2012 compared to their
baseline emissions, set to 1990 levels. For example, the United States agreed to a 7 percent
reduction, France to an 8 percent reduction, and Japan to a 6 percent reduction. The average
target was a cut of around 5% relative to 1990 levels. Developing countries such as China
and India were not bound to emissions targets under the treaty, an omission that the United
States and some other countries protested. Under President George W. Bush, the U.S. refused
to ratify the Kyoto Protocol. But despite the U.S. withdrawal, the Kyoto Protocol entered
into force in early 2005.
The results of the Kyoto Protocol were mixed. Some nations, such as Canada and the
U.S., increased rather than reduced emissions; Canada withdrew from the Protocol, and the
U.S. never entered it. Some European countries met or exceeded their targets, while others
fell short. Russia and most East European countries considerably exceeded their targets, not
as a result of deliberate policy but rather as a byproduct of communism’s economic collapse
in the early 1990s. The overall Kyoto target was technically achieved, but only as a result of
this significant drop in Russian and Eastern European emissions.
Chapter 13: Global Climate Change: Policy Responses 20
Table 13.3 Important Events in International Climate Change Negotiations
Year, Location Outcome
1992, Rio de
Janeiro
UN Framework Convention on Climate Change (UNFCCC). Countries
agree to reduce emissions with “common but differentiated
responsibilities.”
1995, Berlin The first annual Conference of the Parties to the framework, known as a
COP. U.S. agrees to exempt developing countries from binding
obligations.
1997, Kyoto At the third Conference of the Parties (COP-3) the Kyoto Protocol is
approved, mandating developed countries to cut greenhouse gas
emissions relative to baseline emissions by 2008-2012 period.
2001, Bonn (COP-6) reaches agreement on terms for compliance and financing. Bush
administration rejects the Kyoto Protocol; U.S.is only an observer at the
talks.
2009, Copenhagen COP-15 fails to produce a binding post-Kyoto agreement, but declares
the importance of limiting warming to under 2°C. Developed countries
pledge $100 billion in climate aid to developing countries.
2011, Durban (COP-17) participating countries agreed to adopt a universal legal
agreement on climate change as soon as possible, and no later than 2015,
to take effect by 2020.
2015, Paris COP-21 195 nations sign the Paris Agreement, providing for worldwide
voluntary actions (NDC’s) by individual countries.
In addition, we need to consider the effects of trade (discussed further in Chapter 21). In
the Kyoto framework, emissions released during production of goods were assigned to the
country where production takes place, rather than where goods are consumed. Therefore the
“outsourcing” of carbon emissions through imports from developing countries, especially
China, was not included in official accounting. Considering the full country carbon footprint
taking trade into account, the progress made under Kyoto was very limited, with Europe’s
savings reduced to just 1% from 1990 to 2008, and the developed world as a whole seeing its
emissions rise by 7% in the same period (25% for the US, when trade is included). Moreover,
Kyoto placed no restrictions on emissions from developing countries, meaning that overall
global emissions continued to grow during the Kyoto period, as shown in Figure 12.1 in the
previous chapter.19
But if the Kyoto protocol was a failure in its inability to slow down global emissions, it
nevertheless provided an important first step in global climate diplomacy, and from the
failures of Kyoto and its aftermath, countries learned lessons that proved useful in the later
phases of those global negotiations.
carbon footprint total carbon emissions, direct and indirect, resulting from the consumption
of a nation, institution, or individual.
Chapter 13: Global Climate Change: Policy Responses 21
The Paris Agreement of 2015
After efforts to secure a binding global agreement on emissions reductions failed at the
fifteenth COP in Copenhagen in 2009, it became increasingly obvious to negotiators that
another approach would be needed in order to win broad support. The Copenhagen
conference parties agreed only that the goal for future rounds of negotiations would be to
keep the global temperature warming below the threshold of 2°C above pre-industrial levels.
The most contentious point of disagreement was the question of whether developing
countries should be bound by mandatory cuts in emissions. While some countries,
particularly the United States, argued that all participants should agree to reductions,
developing countries contended that mandatory cuts would limit their economic development
and reinforce existing global inequities.
After the failure of Copenhagen, the idea of a binding agreement was rejected as
unfeasible. In its place, negotiators came up with the idea that countries would instead
propose their own voluntary goals, no matter how low or high – the hope being that countries
would eventually feel “peer-pressure” to set the most ambitious possible goals within their
reach. This new negotiating strategy laid the foundations for the global agreement reached at
the twenty-first Conference of the Parties (COP21) in Paris. In the months that preceded the
COP21, 186 countries submitted their NDCs – intended nationally determined contributions –
indicating their willingness to contribute to the reduction of global CO2 emissions.
nationally determined contribution (NDC) a voluntary planned reduction in CO2
emissions, relative to baseline emissions, submitted by participating countries at the Paris
Conference of the Parties (COP-21) in 2015.
The Paris Agreement, negotiated by 195 national delegations, formally expresses the
global aim of holding temperatures to no more than 2° C above preindustrial levels, with a
more ambitious target of 1.5° C. Since the current total of country pledges (NDCs) is not
sufficient to secure the global goal of keeping warming under 2° C, the agreement includes 5
year cycles for countries to review their goals and ratchet up their targets, in order to reach
more ambitious goals. The negotiating process has been designed to put pressure on every
country to comply with its own pledges and to increase them over time.
A strong transparency and accountability regime is built into the agreement, based on
regular inventories, regular reporting of the progress countries are making towards their
targets, and regular review by expert teams. The Paris agreement entered into force, with
over 80 countries representing over 60 percent of global emissions ratifying the agreement by
the end of 2016, just a year after it was negotiated, a record speed for international
agreements. Despite subsequent rejection of the agreement by the incoming Unites States
administration, the agreement remains in force – though compliance with the targets is
voluntary. A related binding agreement establishing specific timetables to eliminate the
production of hydrofluorocarbons (HFCs), powerful greenhouse gases used in air-
conditioners and refrigerators, was agreed on in October 2015.20
The Paris agreement also provides for continuing financial and technical support to
developing countries to help them adapt to the disruptive consequences of climate changes, as
well as support for a transition away from fossil fuels toward cleaner renewable energy
sources. The agreement included a loss-and-damage clause recognizing the importance of
addressing the adverse effects of climate change in developing countries. While the
agreement does not accept liability or provide for compensation, it does offer several
conditions where support may be given. Starting in 2020, industrialized nations have pledged
$100 billion a year in financial and technical aid to developing countries to fight climate
Chapter 13: Global Climate Change: Policy Responses 22
change.21
Many voices in the developing world have warned that $100 billion will fall far short of
what is really needed, and that a conservative figure would be closer to $600 billion, which is
about 1.5% of the GDP of industrialized nations. Some of the estimates, by organizations
from the World Bank to the International Applied Systems Analysis, in Vienna, suggest that
the sums needed would be as high as 1.7 or even 2.2 trillion dollars per year.22
Country Commitments for Action
Prior to the COP21, 186 delegations had submitted their NDCs to the UNFCCC. Because
these commitments were made on a voluntary basis, there are discrepancies in the approaches
adopted by different countries. Some countries have chosen their baseline year as 2005, and
others as 1990 (which was the baseline of the Kyoto Protocol), and calculate their future
emissions with reference to that baseline. Other countries have calculated their future
emissions compared to what they would have been emitting in a Business-As-Usual (BAU)
scenario. Some countries have pledged reductions of CO2 emissions in absolute terms, i.e.
reductions in actual volumes of emissions, and others in relative terms, or reductions in
carbon intensity (carbon emissions per unit of GDP).
Reductions in carbon intensity partly “decouple” emissions from growth, but overall
emissions can still increase with economic growth. This option has generally been chosen by
developing countries, including the biggest ones, such as China and India, as they are
unwilling to commit to measures that would slow down their economic growth. They seek an
increasing decoupling between economic growth and the growth of CO2 emissions, but in the
meantime CO2 emissions will continue to grow in most of these countries. This introduces
the important idea of “peaking” emissions in developing countries – allowing total emissions
to grow only for a specific period, after which they must decline. China has committed to
peaking emissions by 2030.
Commitments of Major Emitters
The NDC submitted in March 2015 by the U.S. to the UNFCCC states that:
“. . . the United States intends to achieve an economy-wide target of reducing its greenhouse
gas emissions by 26-28 per cent below its 2005 level in 2025 and to make best efforts to
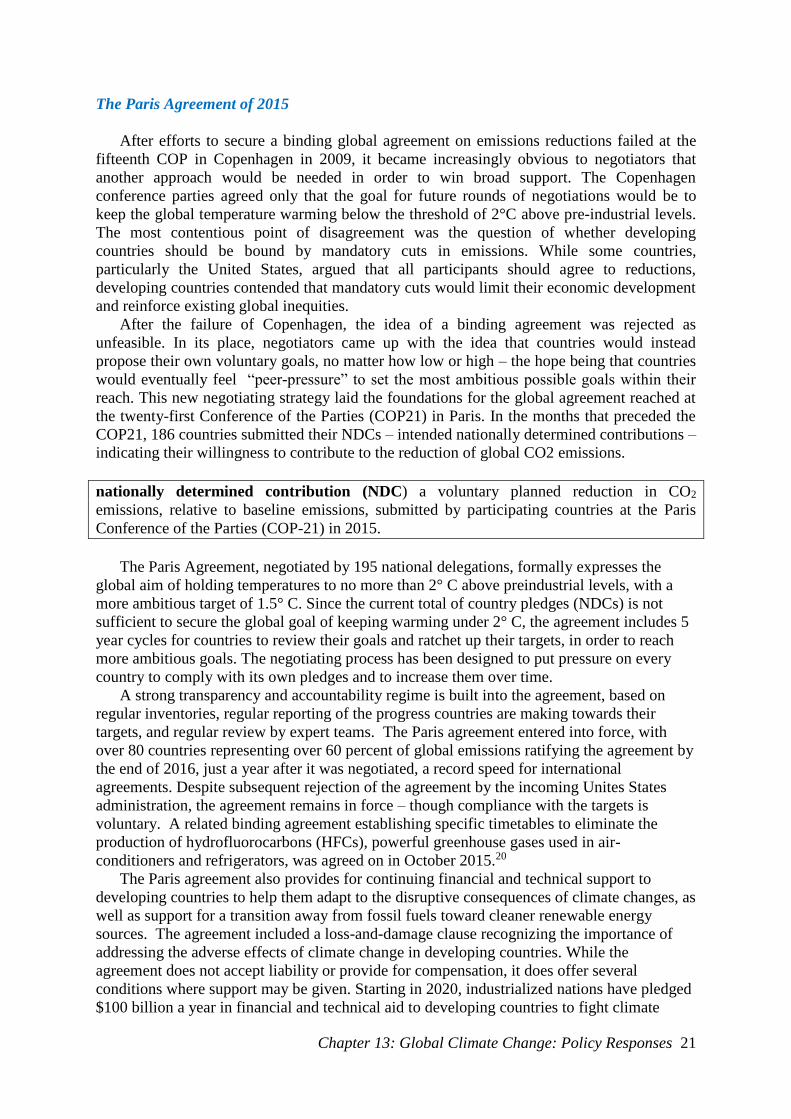
reduce its emissions by 28%.” %.” Stated U.S. emissions targets are shown in Figure 13.8.
These would continue and accelerate a declining trend already evident in actual U.S.
emissions. With an unsympathetic Congress blocking any attempt to pass a climate policy
bill, the Obama Administration pursued its climate agenda using administrative action. In
August 2015, the United States announced the Clean Power Plan, which aims to reduce CO2
emissions from the power sector to 32% below 2005 levels by 2030.23
In late 2016, however, the incoming Trump Administration indicated its
unwillingness to comply with the pledges made by the Obama Administration, throwing U.S.
climate actions into doubt – although it is still possible that U.S. emissions could decline
based on state policies and market developments (see for example discussion of the Northeast
and California commitments in the section on “Regional, national and local actions” below).
Chapter 13: Global Climate Change: Policy Responses 23
Figure 13.8: US Emissions Targets
Source: U.N Framework Convention on Climate Change, http://www4.unfccc.int/submissions/NDC/
China’s official commitment includes:
Peaking carbon dioxide emissions by around 2030 and making best efforts to peak
earlier.
Lowering carbon intensity (carbon dioxide emissions per unit of GDP) by 60% to
65% from the 2005 level.
Increasing the share of non-fossil fuels in primary energy consumption to around
20%.
Increasing forest stock volume by around 4.5 billion cubic meters above the 2005
level.24
The European Union and its member states are committed to a binding target of
reducing greenhouse gas emissions at least 40% by 2030 compared to 1990. “The EU and its
Member States have already reduced their emissions by around 19% [relative to] 1990 levels
while GDP has grown by more than 44% over the same period. As a result, average per
capita emissions across the EU and its Member States have fallen from 12 tonnes CO2-eq. in
1990 to 9 tonnes CO2-eq. in 2012 and are projected to fall to around 6 tonnes CO2-eq. in
2030. [Total] emissions in the EU and its Member States peaked in 1979.”25 Commitments by
major emitters are shown in Table 13.4.
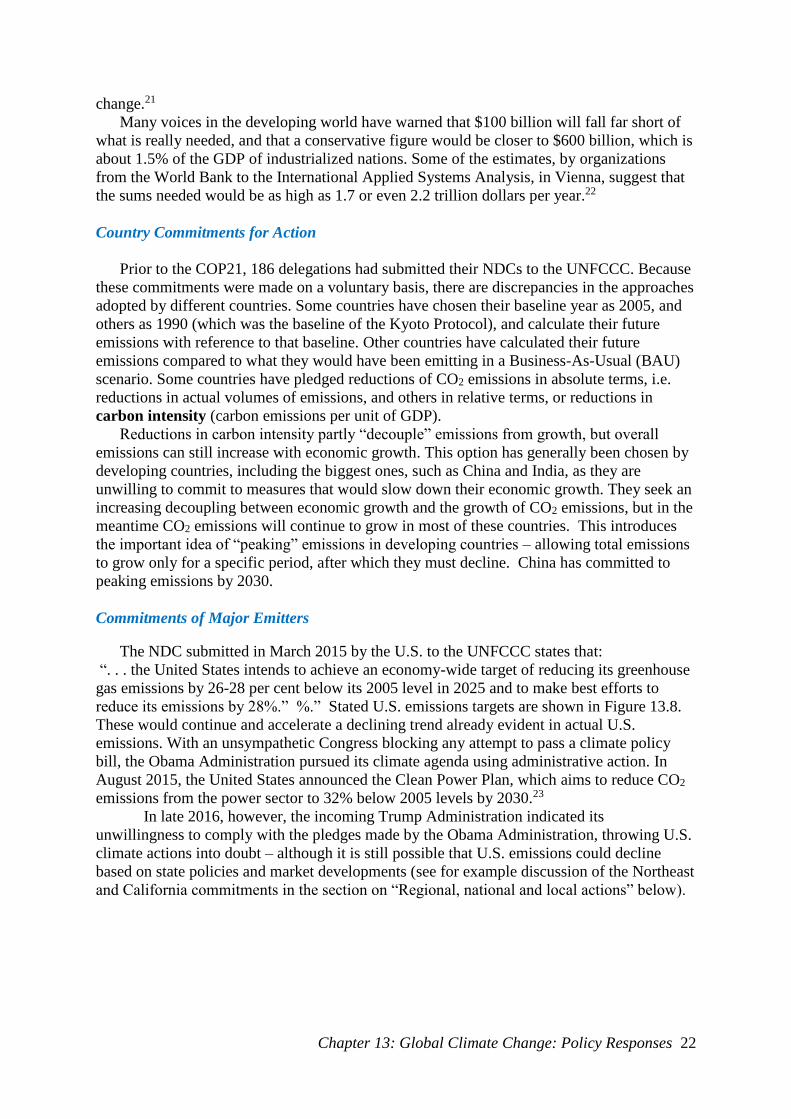
Table 13.4: NDC commitment by major emitters
Base Level Reduction Target Target Year
Land-use
inclusion/accounting
method:
China 2005
Emissions peaking
60-65% (carbon
intensity)
2030 (or before)
Target to increase
forest stock volume by
around 4.5 billion
cubic meters
Chapter 13: Global Climate Change: Policy Responses 24
United States 2005 26-28% 2025 “Net-net” approach
EU 1990 40% 2030
Policy on land-use
accounting to be
decided prior to 2020
India 2005
33-35% (carbon
intensity) 2030 Not specified
Russia 1990 25-30% 2030
Target depends on the
“maximum absorption
capacity of forests”
Japan 2013 26% 2030
Forest and agricultural
sectors are accounted
for using approaches
similar to those under
the Kyoto Protocol
Source: ww.c2es.org/NDC-comparison
How adequate or inadequate are the commitments?
An independent organization, Climate Action Tracker, provides assessments and ratings of
submitted NDCs. According to its grading system, the USA is rated “medium” for its
commitment, China is rated as “medium with inadequate carbon intensity target”, and the
European Union is also rated as “medium”. The Climate Action Tracker has rated as
“inadequate” the commitments of a long list of countries including Russia, Japan, Australia,
New Zealand, Canada, Argentina, South Africa, Chile, and Turkey.26
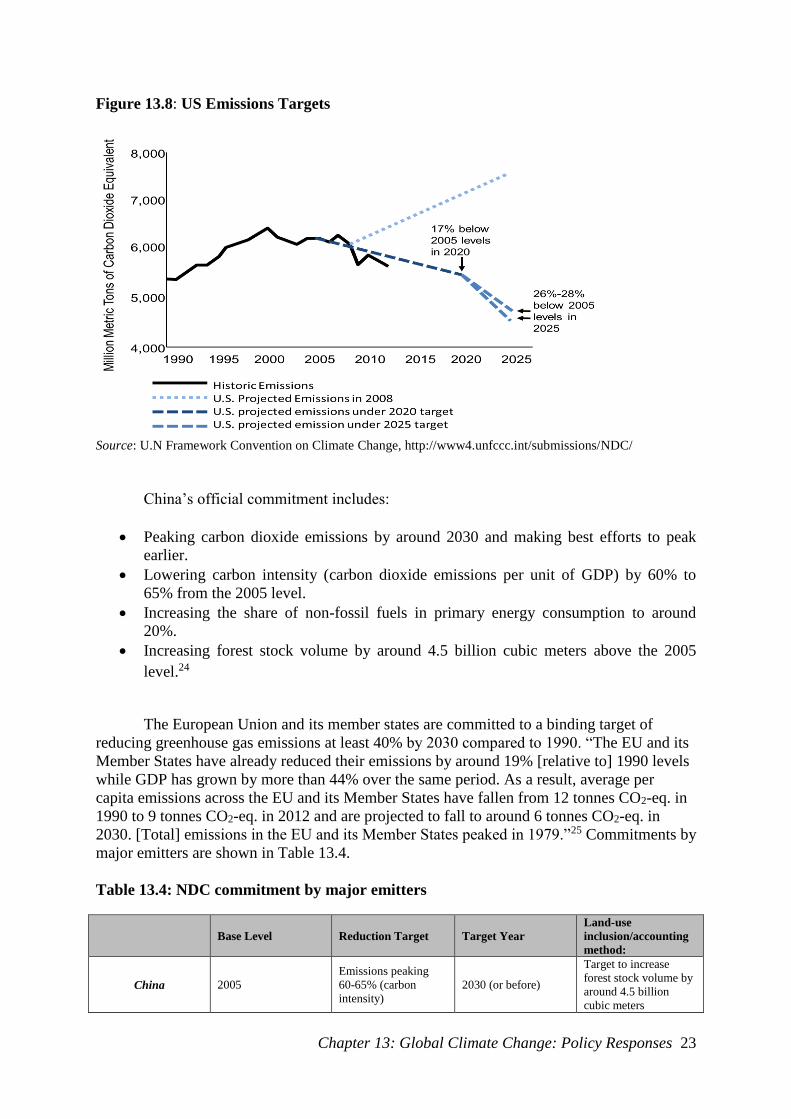
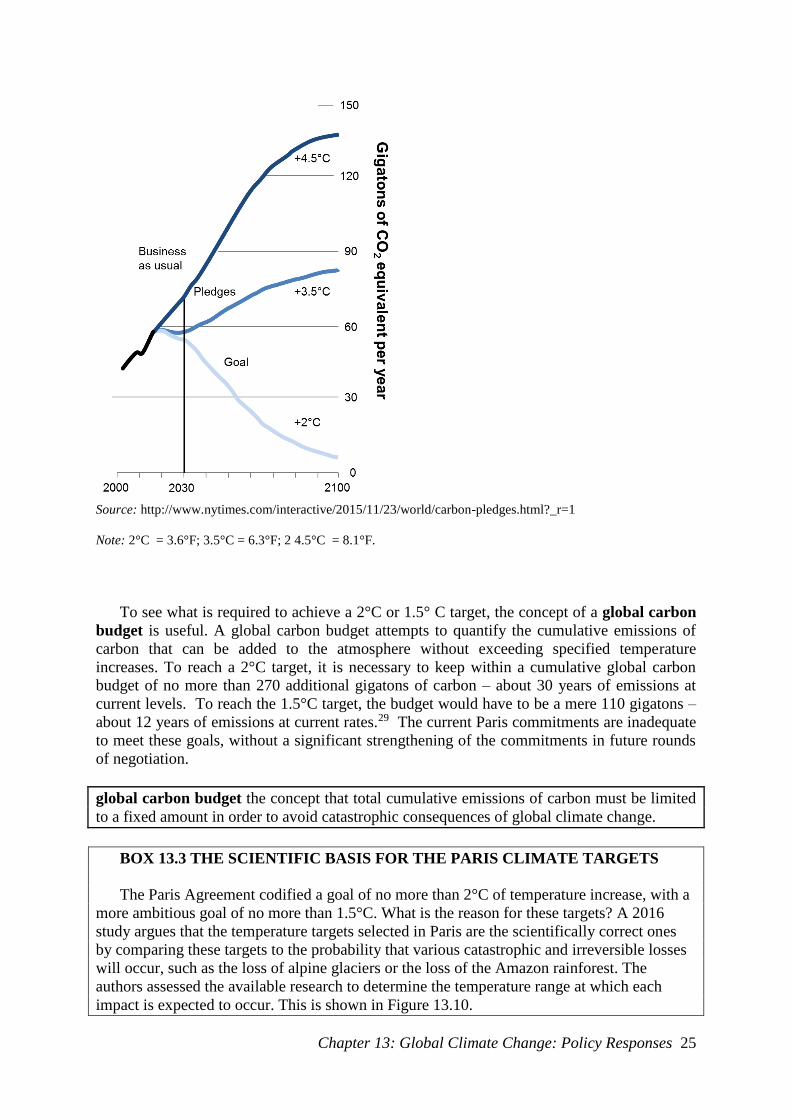
Figure 13.9 shows the differences between a business-as-usual emissions trajectory,
the trajectory that would result from the current aggregation of NDCs commitments, and the
path that would be necessary to reach 2°C (3.6°F) or less. Most current pledges do not
extend beyond 2030, which is why emissions start to rise again after 2030 in Figure 13.9.
Considerable strengthening of the pledges would clearly be needed before that date to keep
overall emissions on a 2°C track – let alone 1.5°C.27 According to analysis by the Climate
Action Tracker, if policies of comparable strength to those in the current NDCs were
maintained after 2030, they would lead to a median warming of about 2.7°C (4.8°F) by 2100
– better than the 3.5°C (6.3°F) shown in Figure 13.9, but still far exceeding the Paris
targets.28 (For a scientific perspective on the importance of reaching a 2°C or even 1.5°C
target, see Box 13.3.)
Figure 13.9: Business as Usual, Paris Pledges, and 2°C Path
Chapter 13: Global Climate Change: Policy Responses 25
Source: http://www.nytimes.com/interactive/2015/11/23/world/carbon-pledges.html?_r=1
Note: 2°C = 3.6°F; 3.5°C = 6.3°F; 2 4.5°C = 8.1°F.
To see what is required to achieve a 2°C or 1.5° C target, the concept of a global carbon
budget is useful. A global carbon budget attempts to quantify the cumulative emissions of
carbon that can be added to the atmosphere without exceeding specified temperature
increases. To reach a 2°C target, it is necessary to keep within a cumulative global carbon
budget of no more than 270 additional gigatons of carbon – about 30 years of emissions at
current levels. To reach the 1.5°C target, the budget would have to be a mere 110 gigatons –
about 12 years of emissions at current rates.29 The current Paris commitments are inadequate
to meet these goals, without a significant strengthening of the commitments in future rounds
of negotiation.
global carbon budget the concept that total cumulative emissions of carbon must be limited
to a fixed amount in order to avoid catastrophic consequences of global climate change.
BOX 13.3 THE SCIENTIFIC BASIS FOR THE PARIS CLIMATE TARGETS
The Paris Agreement codified a goal of no more than 2°C of temperature increase, with a
more ambitious goal of no more than 1.5°C. What is the reason for these targets? A 2016
study argues that the temperature targets selected in Paris are the scientifically correct ones
by comparing these targets to the probability that various catastrophic and irreversible losses
will occur, such as the loss of alpine glaciers or the loss of the Amazon rainforest. The
authors assessed the available research to determine the temperature range at which each
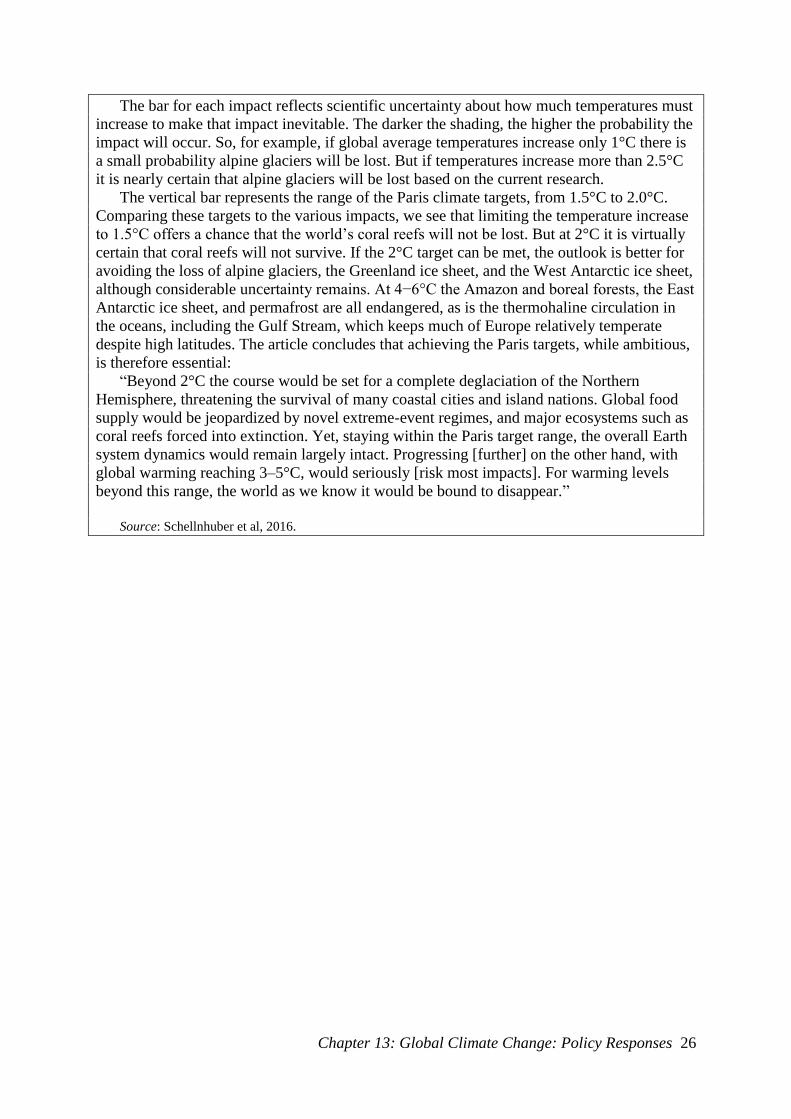
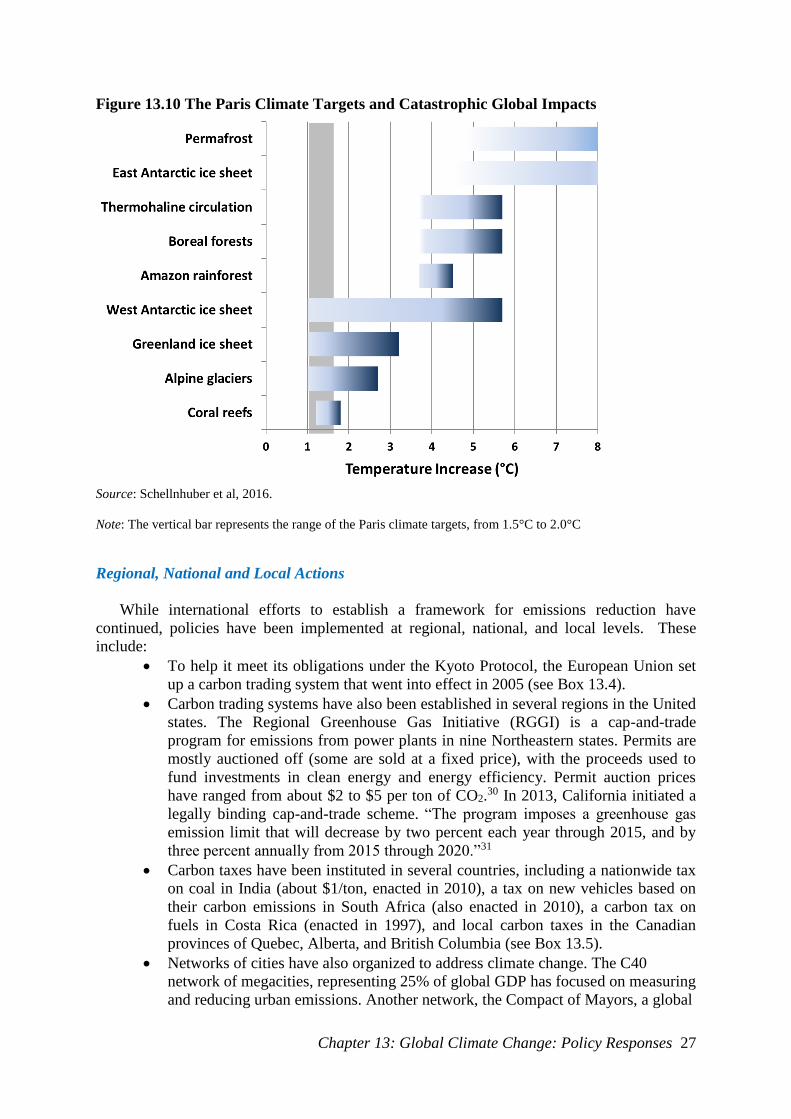
impact is expected to occur. This is shown in Figure 13.10.
Chapter 13: Global Climate Change: Policy Responses 26
The bar for each impact reflects scientific uncertainty about how much temperatures must
increase to make that impact inevitable. The darker the shading, the higher the probability the
impact will occur. So, for example, if global average temperatures increase only 1°C there is
a small probability alpine glaciers will be lost. But if temperatures increase more than 2.5°C
it is nearly certain that alpine glaciers will be lost based on the current research.
The vertical bar represents the range of the Paris climate targets, from 1.5°C to 2.0°C.
Comparing these targets to the various impacts, we see that limiting the temperature increase
to 1.5°C offers a chance that the world’s coral reefs will not be lost. But at 2°C it is virtually
certain that coral reefs will not survive. If the 2°C target can be met, the outlook is better for
avoiding the loss of alpine glaciers, the Greenland ice sheet, and the West Antarctic ice sheet,
although considerable uncertainty remains. At 4−6°C the Amazon and boreal forests, the East
Antarctic ice sheet, and permafrost are all endangered, as is the thermohaline circulation in
the oceans, including the Gulf Stream, which keeps much of Europe relatively temperate
despite high latitudes. The article concludes that achieving the Paris targets, while ambitious,
is therefore essential:
“Beyond 2°C the course would be set for a complete deglaciation of the Northern
Hemisphere, threatening the survival of many coastal cities and island nations. Global food
supply would be jeopardized by novel extreme-event regimes, and major ecosystems such as
coral reefs forced into extinction. Yet, staying within the Paris target range, the overall Earth
system dynamics would remain largely intact. Progressing [further] on the other hand, with
global warming reaching 3–5°C, would seriously [risk most impacts]. For warming levels
beyond this range, the world as we know it would be bound to disappear.”
Source: Schellnhuber et al, 2016.
Chapter 13: Global Climate Change: Policy Responses 27
Figure 13.10 The Paris Climate Targets and Catastrophic Global Impacts
Source: Schellnhuber et al, 2016.
Note: The vertical bar represents the range of the Paris climate targets, from 1.5°C to 2.0°C
Regional, National and Local Actions
While international efforts to establish a framework for emissions reduction have
continued, policies have been implemented at regional, national, and local levels. These
include:
To help it meet its obligations under the Kyoto Protocol, the European Union set
up a carbon trading system that went into effect in 2005 (see Box 13.4).
Carbon trading systems have also been established in several regions in the United
states. The Regional Greenhouse Gas Initiative (RGGI) is a cap-and-trade
program for emissions from power plants in nine Northeastern states. Permits are
mostly auctioned off (some are sold at a fixed price), with the proceeds used to
fund investments in clean energy and energy efficiency. Permit auction prices
have ranged from about $2 to $5 per ton of CO2.30 In 2013, California initiated a
legally binding cap-and-trade scheme. “The program imposes a greenhouse gas
emission limit that will decrease by two percent each year through 2015, and by
three percent annually from 2015 through 2020.”31
Carbon taxes have been instituted in several countries, including a nationwide tax
on coal in India (about $1/ton, enacted in 2010), a tax on new vehicles based on
their carbon emissions in South Africa (also enacted in 2010), a carbon tax on
fuels in Costa Rica (enacted in 1997), and local carbon taxes in the Canadian
provinces of Quebec, Alberta, and British Columbia (see Box 13.5).
Networks of cities have also organized to address climate change. The C40
network of megacities, representing 25% of global GDP has focused on measuring
and reducing urban emissions. Another network, the Compact of Mayors, a global
Chapter 13: Global Climate Change: Policy Responses 28
coalition of over 500 cities, was launched in 2014 with similar goals.32 By 2050,
between 65% and 75% of the world population is projected to be living in cities,
with more than 40 million people moving to cities each year. Urban population
will grow from approximately 3.5 billion people now to 6.5 billion by 2050.
Estimates suggest that cities are responsible for 75 percent of global CO2
emissions, with transport and buildings being among the largest contributors.33
BOX 13.4 THE EUROPEAN UNION CARBON TRADING SYSTEM
In 2005 the European Union (EU) launched its Emissions Trading Scheme (EU-ETS),
which covers more than 11,000 facilities that collectively emit nearly half the EU’s carbon
emissions. In 2012 the system was expanded to cover the aviation sector, including incoming
flights from outside the EU. Under the EU-ETS, each country develops a national allocation
plan to determine the overall number of permits available. Permits are both auctioned off and
allocated to some firms for free based on historical emissions. Any unneeded permits can be
sold on the open market.
The initial phase (2005–2007) of the EU-ETS produced disappointing results as permits
were over-allocated, leading to a drop in the permit price from more than €30 per tonne to
less than €1 by the end of 2007. In the second phase (2008–2012), fewer permits were
initially allocated, leading to relatively stable prices of around €15–€20/tonne for a few years.
But by mid-2012 prices had fallen to €5–€10/tonne as the market again experienced a glut of
permits. Despite the volatility in prices, according to the EU the EU-ETS led to a reduction in
emissions from large emitters of 8 percent between 2005 and 2010. Also, the costs of the EU-
ETS have been less than expected, around 0.5 percent of European gross domestic product
(GDP).
The EU has moved into the third phase of the ETS, covering 2013–2020. This phase will
require more of the permits to be auctioned, include more greenhouse gases, and set an
overall EU cap rather than allowing individual countries to determine their own cap. By the
end of the third phase, the program’s goal is to reduce overall EU emissions 21 percent
relative to 1990 levels, with a further goal of a 43% reduction by 2030.
Sources: EU-ETS, http://ec.europa.eu/clima/policies/ets/index_en.htm; Grubb et al, 2009.
BOX 13.5 BRITISH COLUMBIA’S CARBON TAX: A SUCCESS STORY
In 2008 the Canadian province of British Columbia, on the Pacific Coast, implemented a
carbon tax of $10 per ton of CO2 (Canadian dollars). The tax rose incrementally by $5 each
subsequent year, until it reached $30 in 2012. This translates into an additional 26 cents per
gallon of gasoline at the pump, with comparable price increases in other carbon-based energy
sources.
The carbon tax is revenue neutral, meaning that the province has cut income and
corporate taxes to offset the revenue it gets from taxing carbon. British Columbia now has the
lowest personal income tax rate in Canada, and one of the lowest corporate rates among
developed countries.
In the first six years of its implementation, consumption of fuels dropped by between 5%
and 15% in B.C., while it rose by about 3% in the rest of Canada. During that time, GDP per
capita continued to grow in British Columbia, at a slightly higher pace than for the rest of
Canada. By lowering taxes on income and on corporations, this policy encouraged
employment and investment, while discouraging carbon pollution.
British Columbia’s experience has been heralded by the OECD and the World Bank as a
Chapter 13: Global Climate Change: Policy Responses 29
successful example to follow. A recent study found that the tax had negligible effects on the
economy, and had overcome initial opposition to gain general public support. As of 2016, the
Canadian government planned to extend the tax to the whole of Canada.
Sources: The World Bank, Development in a changing climate. British Columbia’s carbon tax shift: an
environmental and economic success. Sept. 10, 2014; The Economist, British Columbia’s carbon tax: the
evidence mounts. July 31, 2014, Ministry of Finance, British Columbia, Carbon Tax: overview of the revenue-
neutral carbon tax; Murray and Rivers, 2015; Metcalf, 2015;
http://www.nationalobserver.com/2016/10/03/news/breaking-feds-announce-pan-canadian-carbon-price-plan-
2018.
Forests and Soils
While the major focus of climate policy has been on the reduction of emissions from carbon-
based fuels, the role of forests and soils is also crucial. Currently about 11% of greenhouse
gas emissions come from forest and land use change, especially tropical forest loss.34
International negotiations have also led to the adoption of a program known as REDD
(Reduction of Emissions from Deforestation and Degradation). The Copenhagen Accord
(2009) acknowledged the need to act on reducing emissions from deforestation and forest
degradation and established a mechanism known as REDD-plus. The Accord emphasizes
funding for developing countries to enable action on mitigation, including substantial finance
for REDD-plus, adaptation, technology development and transfer and capacity building
(discussed further in Chapter 19).
Reduction of Emissions from Deforestation and Degradation (REDD) a United Nations
program adopted as part of the Kyoto process of climate negotiations, intended to reduce
emissions from deforestation and land degradation through providing funding for forest
conservation and sustainable land use.
In addition to reducing emissions, forests and soils have huge potential for absorbing
and storing carbon. The Earth’s soils store 2500 billion tons of carbon – more carbon than the
atmosphere (780 billion tons) and plants (560 billion tons) combined. But it is estimated that
soils have been depleted of 50 to 70 percent of their natural carbon in the last century.
Globally, those depleted soils could reabsorb 80 to 100 billion metric tons of carbon per year,
through regenerative agriculture including: polyculture, cover cropping, agroforestry,
nutrient recycling, crop rotation, proper pasture management, and organic soil amendments
like compost and biochar (discussed further in Chapter 16).35 It is likely that this vast
unexploited potential for carbon storage will be a major focus of future climate policy – a
crucial factor in the effort to move from the intermediate “pledges” path in Figure 13.9 to the
“goals” path necessary to hold global temperature change to no more than 2°C.
regressive tax a tax in which the rate of taxation, as a percentage of income, decreases with
increasing income levels.
progressive taxes taxes that comprise a higher share of income with higher income levels.
distributionally neutral tax shift a change in the pattern of taxes that leaves the distribution
of income unchanged.
Chapter 13: Global Climate Change: Policy Responses 30
13.5 OTHER ECONOMIC POLICY PROPOSALS: ENVIRONMENT AND EQUITY
In the final section of this chapter, we take a look at proposals for balancing carbon reduction
with equity issues on a national and international scale. While these policies have not yet
been implemented on a national or global scale, they provide insight into economic principles
that can guide future policymaking.
A Distributionally Neutral Carbon Tax in the United States
Placing a price on carbon emissions in developed countries would result in unequal impacts
on households of different income levels. Specifically, a carbon tax would be a regressive
tax, meaning that as a percentage of income the tax would affect lower-income households
more than higher-income households. The reason is that lower-income households spend a
higher percentage of their income on carbon-intensive goods such as gasoline, electricity, and
heating fuels. Thus a carbon tax, implemented alone, would increase the overall level of
income inequality.
A carbon tax does not necessarily mean that overall taxes must increase. Instead,
implementing a carbon tax could be coupled with a decrease in one or more existing taxes
such that the overall amount of taxes paid by the average household stays the same. Thus a
carbon tax could be revenue neutral, meaning that the overall amount of tax revenue collected
by the government is unchanged.
The distributional impacts will depend on which tax is reduced. Some taxes are
regressive, affecting lower-income households more heavily, while other taxes are
progressive taxes, affecting higher-income households more heavily. Given that a carbon tax
is regressive and increases inequality, most proposals for a revenue-neutral carbon tax
suggest achieving revenue neutrality by decreasing a regressive tax. In the United States,
regressive taxes include sales taxes, the payroll tax, and excise taxes.36 Could one of these
taxes be reduced such that the overall distributional impact of a carbon tax would be
relatively constant across income levels?
An economic analysis by Gilbert Metcalf shows that offsetting a carbon tax in the United
States with a decrease in the payroll tax could produce a result that is approximately
distributionally neutral, meaning that the impact on households at different income levels
would be nearly the same as a percentage of income.37
Metcalf proposes offsetting the carbon tax by providing a tax credit for a worker’s payroll
tax up to a maximum credit of $560 per year per individual—an amount that allows the
overall effect on taxes to be revenue-neutral. For low-income households, this tax credit is
relatively large as a percentage of income (over 2 percent), but for higher-income households
this credit is only about 1 percent or less of income. The credit averages from about $200 to
over $1,000, depending on household income level. The net effect, considering both the
carbon tax and the tax credit, is never more than an average of $135 for any income group.
Households in the middle and upper-middle income groups tend to end up slightly ahead,
while households in the lowest income groups end up losing slightly. But the overall impact
is nearly distributionally neutral. Some further minor adjustments could be instituted to
eliminate the slightly negative impact on lower income households. Thus Metcalf’s analysis
demonstrates that a carbon tax in the United States could achieve carbon reductions without
increasing overall taxes or having a disproportionate impact on any income group.
Chapter 13: Global Climate Change: Policy Responses 31
Greenhouse Development Rights
On a global scale, equity issues relate to income differences between countries as well as
income distribution within countries. What principles should be used to determine how
emissions reductions and financing of mitigation and adaptation costs should be allocated
among countries? Various approaches are possible, taking into account fairness, efficiency,
and the concept of universally shared rights to the global commons.38 The greenhouse
development rights (GDR) framework proposes that only those people living above a
certain economic threshold of development should be obliged to address the climate change
problem.39 Those who live below the threshold should instead be allowed to focus on
economic growth, without any climate obligations.
greenhouse development rights (GDR) an approach for assigning the responsibility for past
greenhouse gas emissions and the capability to respond to climate change.
climate justice equitable sharing both of the burdens of climate change and the costs of
policy responses.
The GDR analysis essentially develops a methodology for assigning each country’s
obligation to provide financing for an international climate change mitigation and adaptation
fund. It considers two factors to determine a country’s obligation:
Capacity: The capacity of a country to provide financing is based on its GDP, yet all
income below a defined development threshold is excluded. The GDR analysis sets
the development threshold at $7,500 per capita, a level that generally allows one to
avoid the problems of severe poverty, such as malnutrition, high infant mortality, and
low educational attainment. Figure 13.11 illustrates the concept using China as an
example. The graph shows the income distribution curve for China, starting with the
person with the lowest income and moving to the right as incomes increase. All
income below the horizontal line at the $7,500 development threshold is excluded
from China’s capacity. The area above the development threshold line represents
China’s total capacity to provide financing for climate change.
Responsibility: The GDR approach defines responsibility for greenhouse gas
emissions as a country’s cumulative emissions since 1990, the same baseline year
used for the Kyoto Protocol. As with capacity, emissions associated with consumption
below the development threshold are excluded from the responsibility calculation.
Each country’s share of the global responsibility would be calculated by dividing its
cumulative emissions by the global total.
The results indicate each country’s share of the global capacity and responsibility. Then, a
responsibility-capacity index (RCI) is calculated as the unweighted average of the two values.
The RCI represents each country’s obligation for financing a response to climate change.
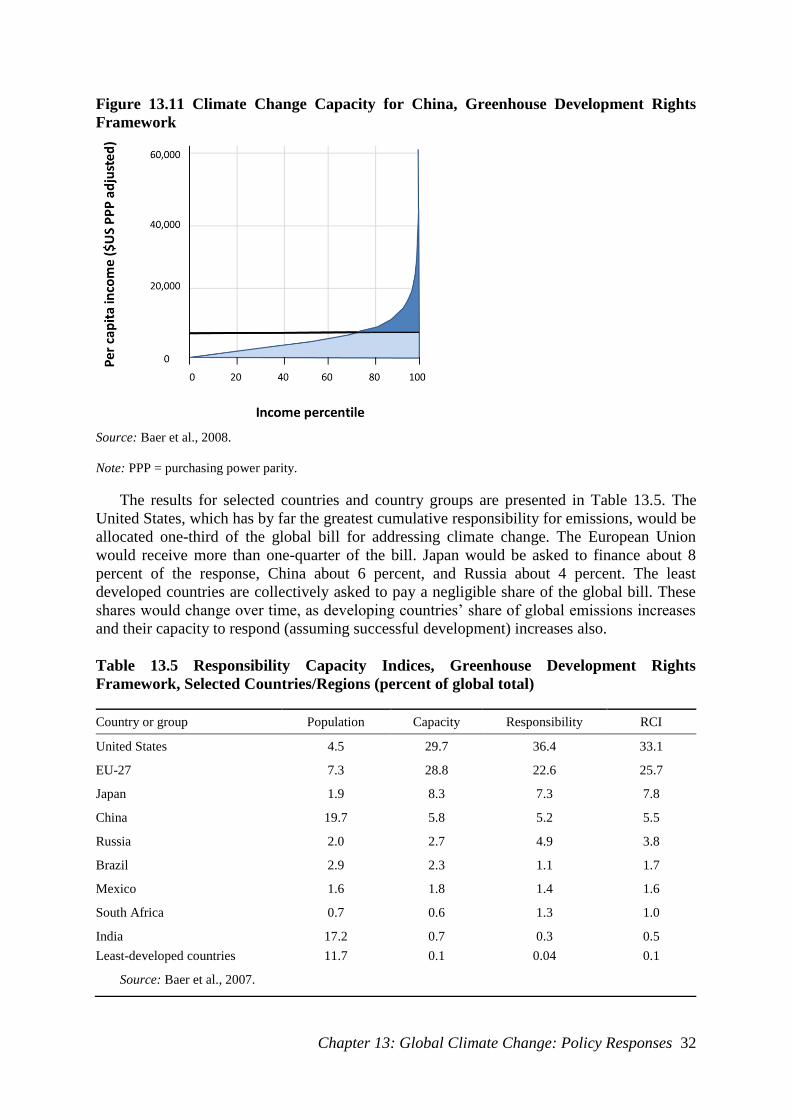
Chapter 13: Global Climate Change: Policy Responses 32
Figure 13.11 Climate Change Capacity for China, Greenhouse Development Rights
Framework
Source: Baer et al., 2008.
Note: PPP = purchasing power parity.
The results for selected countries and country groups are presented in Table 13.5. The
United States, which has by far the greatest cumulative responsibility for emissions, would be
allocated one-third of the global bill for addressing climate change. The European Union
would receive more than one-quarter of the bill. Japan would be asked to finance about 8
percent of the response, China about 6 percent, and Russia about 4 percent. The least
developed countries are collectively asked to pay a negligible share of the global bill. These
shares would change over time, as developing countries’ share of global emissions increases
and their capacity to respond (assuming successful development) increases also.
Table 13.5 Responsibility Capacity Indices, Greenhouse Development Rights
Framework, Selected Countries/Regions (percent of global total)
Country or group Population Capacity Responsibility RCI
United States 4.5 29.7 36.4 33.1
EU-27 7.3 28.8 22.6 25.7
Japan 1.9 8.3 7.3 7.8
China 19.7 5.8 5.2 5.5
Russia 2.0 2.7 4.9 3.8
Brazil 2.9 2.3 1.1 1.7
Mexico 1.6 1.8 1.4 1.6
South Africa 0.7 0.6 1.3 1.0
India 17.2 0.7 0.3 0.5
Least-developed countries 11.7 0.1 0.04 0.1
Source: Baer et al., 2007.
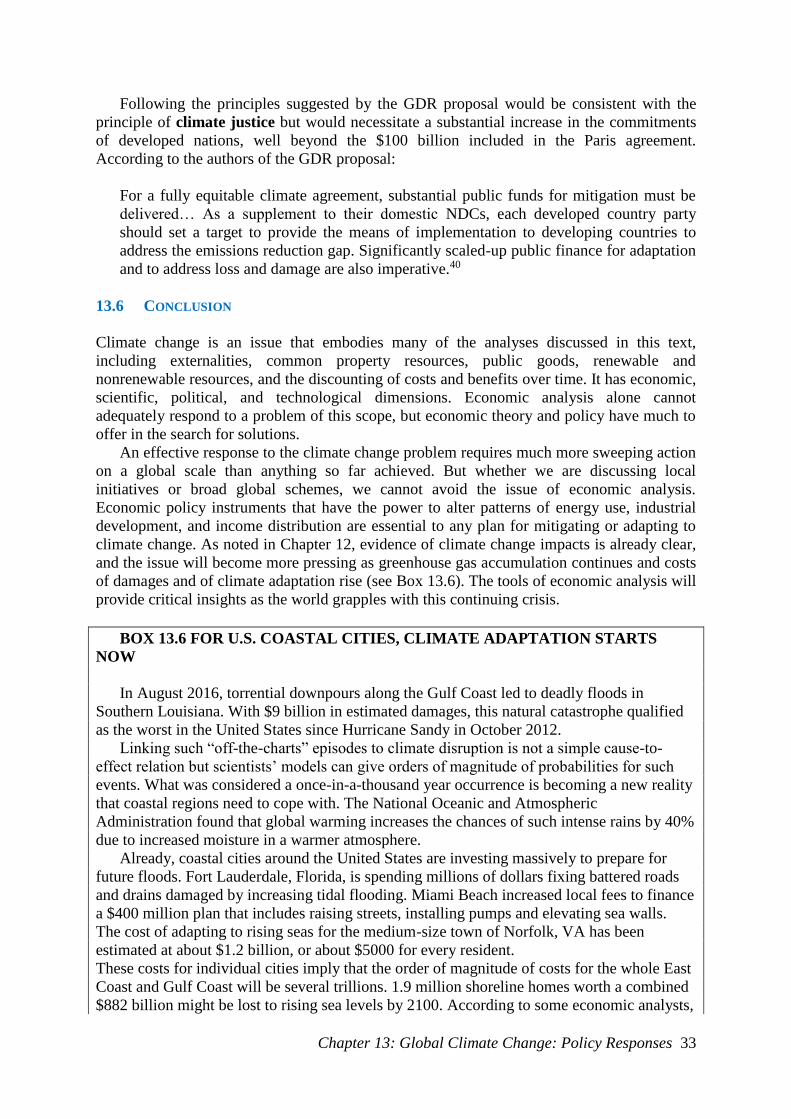
Chapter 13: Global Climate Change: Policy Responses 33
Following the principles suggested by the GDR proposal would be consistent with the
principle of climate justice but would necessitate a substantial increase in the commitments
of developed nations, well beyond the $100 billion included in the Paris agreement.
According to the authors of the GDR proposal:
For a fully equitable climate agreement, substantial public funds for mitigation must be
delivered… As a supplement to their domestic NDCs, each developed country party
should set a target to provide the means of implementation to developing countries to
address the emissions reduction gap. Significantly scaled-up public finance for adaptation
and to address loss and damage are also imperative.40
13.6 CONCLUSION
Climate change is an issue that embodies many of the analyses discussed in this text,
including externalities, common property resources, public goods, renewable and
nonrenewable resources, and the discounting of costs and benefits over time. It has economic,
scientific, political, and technological dimensions. Economic analysis alone cannot
adequately respond to a problem of this scope, but economic theory and policy have much to
offer in the search for solutions.
An effective response to the climate change problem requires much more sweeping action
on a global scale than anything so far achieved. But whether we are discussing local
initiatives or broad global schemes, we cannot avoid the issue of economic analysis.
Economic policy instruments that have the power to alter patterns of energy use, industrial
development, and income distribution are essential to any plan for mitigating or adapting to
climate change. As noted in Chapter 12, evidence of climate change impacts is already clear,
and the issue will become more pressing as greenhouse gas accumulation continues and costs
of damages and of climate adaptation rise (see Box 13.6). The tools of economic analysis will
provide critical insights as the world grapples with this continuing crisis.
BOX 13.6 FOR U.S. COASTAL CITIES, CLIMATE ADAPTATION STARTS
NOW
In August 2016, torrential downpours along the Gulf Coast led to deadly floods in
Southern Louisiana. With $9 billion in estimated damages, this natural catastrophe qualified
as the worst in the United States since Hurricane Sandy in October 2012.
Linking such “off-the-charts” episodes to climate disruption is not a simple cause-to-
effect relation but scientists’ models can give orders of magnitude of probabilities for such
events. What was considered a once-in-a-thousand year occurrence is becoming a new reality
that coastal regions need to cope with. The National Oceanic and Atmospheric
Administration found that global warming increases the chances of such intense rains by 40%
due to increased moisture in a warmer atmosphere.
Already, coastal cities around the United States are investing massively to prepare for
future floods. Fort Lauderdale, Florida, is spending millions of dollars fixing battered roads
and drains damaged by increasing tidal flooding. Miami Beach increased local fees to finance
a $400 million plan that includes raising streets, installing pumps and elevating sea walls.
The cost of adapting to rising seas for the medium-size town of Norfolk, VA has been
estimated at about $1.2 billion, or about $5000 for every resident.
These costs for individual cities imply that the order of magnitude of costs for the whole East
Coast and Gulf Coast will be several trillions. 1.9 million shoreline homes worth a combined
$882 billion might be lost to rising sea levels by 2100. According to some economic analysts,
Chapter 13: Global Climate Change: Policy Responses 34
the possibility of a collapse in the coastal real estate market could rival the impacts of the dot-
com and real estate crashes of 2000 and 2008. The Pentagon too faces major adaptation
issues, as many naval bases are facing serious threats and their land is at risk of disappearing
within this century. Sources: Jonah Engel Bromwich, “Flooding in the South looks a lot like climate
change” New York Times, August 16, 2016; Henry Fountain, “Scientists see push from climate change in
Louisiana flooding” New York Times September 7, 2016; Justin Willis, “Flooding of coast, caused by global
warming, has already begun” New York Times, September 3, 2016; Ian Urbina, “Perils of climate change could
swamp coastal real estate,” New York Times, November 24, 2016 ..
SUMMARY
Policies to respond to global climate change can be preventive or adaptive. One of the most
widely discussed policies is a carbon tax, which would fall most heavily on fuels that cause
the highest carbon emissions. The revenues from such a tax could be recycled to lower taxes
elsewhere in the economy, or they could be used to assist people in lower income brackets,
who will suffer most from higher costs of energy and goods. Another policy option is
tradable carbon emissions permits which can be bought and sold by firms or countries,
depending on their level of carbon emissions (also known as “cap-and-trade”). Both these
policies have the advantage of economic efficiency, but it can be difficult to obtain the
political support necessary to implement them. Other possible policy measures include
shifting subsidies from fossil fuels to renewable energy, strengthening energy efficiency
standards, and increasing research and development on alternative energy technologies.
Global carbon emissions could be stabilized by scaling up existing technologies,
according to the idea of climate stabilization wedges. The greenhouse gas abatement cost
curve indicates that numerous opportunities exist for actions that could reduce carbon
emissions and also save households and businesses money, and that billions of tons of
additional emissions can be avoided at low cost. One implication of the cost curve is that
efficiency standards can be an important complement to a carbon pricing policy.
The Paris Agreement of 2015 replaced the earlier Kyoto Protocol mandating reductions of
greenhouse gases by industrialized countries. Unlike Kyoto, which had limited success, the
Paris Agreement involves almost all the world’s countries, but its provisions are based on
voluntary pledges. It creates a framework for substantial reductions by industrialized
countries, and for reduction of emissions intensity (emissions per unit GDP) by China, India,
and other developing countries, with a target date for a “peaking” of emissions by China. A
review process is intended to strengthen the country commitments over time.
In addition to international commitments, many initiatives have been taken at regional,
national and local levels, involving carbon taxes, cap-and-trade, and other emission reduction
measures. Great potential for additional reductions exists through improving forest and
agricultural practices, resulting in less emissions and increased carbon storage in forests and
soils.
Well-designed economic analyses can provide potential blueprints for effective and
equitable national and international climate change policies. For example, a carbon tax in the
United States can be designed to be both revenue- and distributionally neutral. The
“greenhouse development rights” framework proposes allocating the financing for climate
change mitigation and adaptation based on each country’s responsibility for past emissions
and economic capacity, while still allowing poor countries to achieve economic development.
Chapter 13: Global Climate Change: Policy Responses 35
KEY TERMS AND CONCEPTS
adaptive measures
cap and trade
carbon footprint
carbon intensity
carbon sinks
carbon tax
climate justice
climate stabilization wedge
cost-benefit analysis
cost-effectiveness analysis
distributionally neutral tax shift
efficiency standards
elasticity of demand
greenhouse development rights (GDR)
global carbon budget
nationally determined contribution (NDC)
pollution taxes
preventive measures
price volatility
progressive taxes
reduction of emissions from deforestation and degradation (REDD)
regressive tax
revenue-neutral tax shift
social cost of carbon
technology transfer
transferable (tradable) permits
DISCUSSION QUESTIONS
1. Which economic climate change policy do you prefer: a carbon tax or a cap-and-trade
system? Why? What are the main barriers to effective policy implementation?
2. Climate change policies can focus on changing behaviors or changing technology. Which
approach do you think could be more effective? What policies can be used to encourage
changes in each?
3. The process for formulating and implementing international agreements on climate
change policy has been plagued with disagreements and deadlocks. What are the main
reasons for the difficulty in agreeing on specific policy actions? From an economic point
of view, what kinds of incentives might be useful to induce countries to enter and carry
out agreements? What kinds of “win-win” policies could be devised to overcome
negotiating barriers?
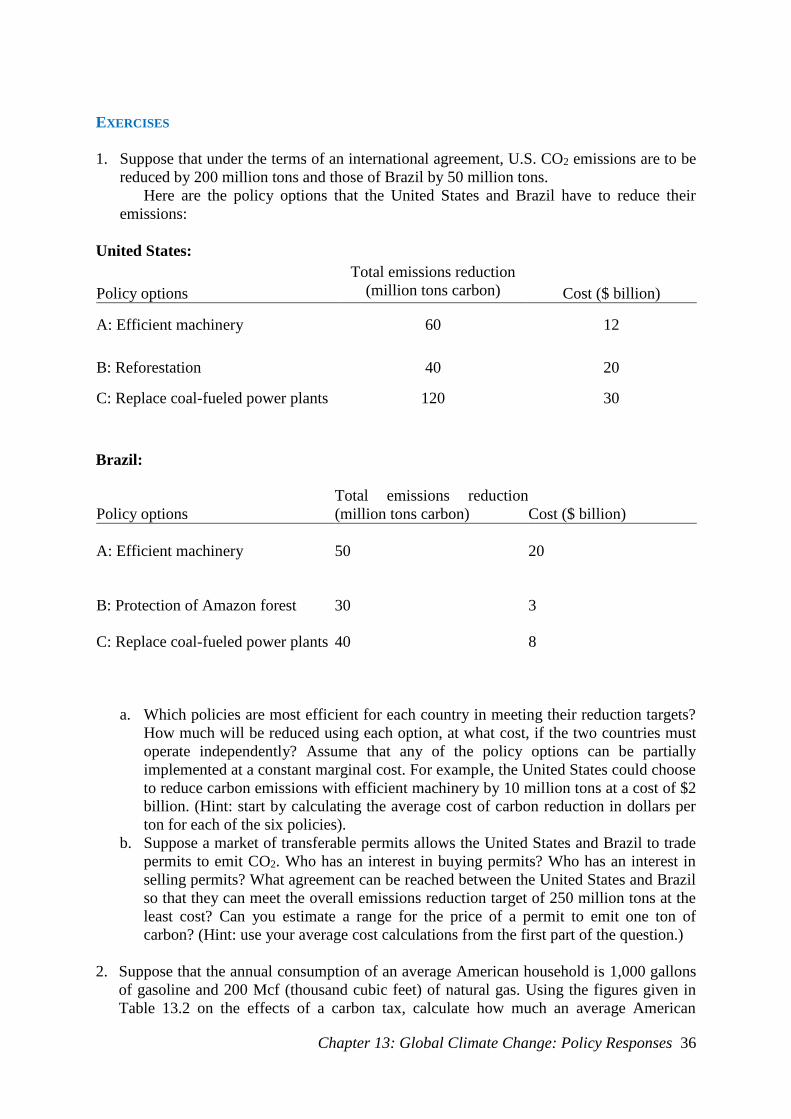
Chapter 13: Global Climate Change: Policy Responses 36
EXERCISES
1. Suppose that under the terms of an international agreement, U.S. CO2 emissions are to be
reduced by 200 million tons and those of Brazil by 50 million tons.
Here are the policy options that the United States and Brazil have to reduce their
emissions:
United States:
Policy options
Total emissions reduction
(million tons carbon) Cost ($ billion)
A: Efficient machinery 60 12
B: Reforestation 40 20
C: Replace coal-fueled power plants 120 30
Brazil:
Policy options
Total emissions reduction
(million tons carbon) Cost ($ billion)
A: Efficient machinery 50 20
B: Protection of Amazon forest 30 3
C: Replace coal-fueled power plants 40 8
a. Which policies are most efficient for each country in meeting their reduction targets?
How much will be reduced using each option, at what cost, if the two countries must
operate independently? Assume that any of the policy options can be partially
implemented at a constant marginal cost. For example, the United States could choose
to reduce carbon emissions with efficient machinery by 10 million tons at a cost of $2
billion. (Hint: start by calculating the average cost of carbon reduction in dollars per
ton for each of the six policies).
b. Suppose a market of transferable permits allows the United States and Brazil to trade
permits to emit CO2. Who has an interest in buying permits? Who has an interest in
selling permits? What agreement can be reached between the United States and Brazil
so that they can meet the overall emissions reduction target of 250 million tons at the
least cost? Can you estimate a range for the price of a permit to emit one ton of
carbon? (Hint: use your average cost calculations from the first part of the question.)
2. Suppose that the annual consumption of an average American household is 1,000 gallons
of gasoline and 200 Mcf (thousand cubic feet) of natural gas. Using the figures given in
Table 13.2 on the effects of a carbon tax, calculate how much an average American
Chapter 13: Global Climate Change: Policy Responses 37
household would pay per year with an added tax of $50 per ton of carbon dioxide if there
was no initial change in demand. Then assuming a short-term demand elasticity of −0.1,
and a long-term elasticity of −0.5, calculate the reductions in household demand for oil
and gas in the short and long term. If there are 100 million households in the United
States, what would be the revenue to the U.S. Treasury of such a carbon tax, in the short
and long term? How might the government use such revenues? What would the impact be
on the average family? Discuss the difference between the short-term and long-term
impacts.
REFERENCES
African Development Bank, Asian Development Bank, Department for International
Development (UK), Directorate-General for Development (European Commission),
Federal Ministry for Economic Cooperation and Development (Germany, Ministry of
Foreign Affairs), Development Cooperation (The Netherlands), Organization for
Economic Cooperation and Development, United Nations Development Programme,
United Nations Environment Programme, and World Bank, 2003. Poverty and Climate
Change: Reducing the Vulnerability of the Poor Through Adaptation.
www.unpei.org/PDF/Poverty-and-Climate-Change.pdf.
Baer, Paul, Tom Athanasiou, Sivan Kartha, and Eric Kemp-Benedict. 2008. “The Greenhouse
Development Rights Framework: The Right to Development in a Climate Constrained
World.” 2d ed. Heinrich Böll Foundation, Christian Aid, EcoEquity and the Stockholm
Environment Institute.
Barnes, Peter, Robert Costanza, Paul Hawken, David Orr, Elinor Ostrom, Alvaro Umana, and
Oran Young. 2008. “Creating an Earth Atmospheric Trust.” Science 319:724.
Carl, Jeremy, and David Fedor. 2016. “Tracking Global Carbon Revenues: A Survey of
Carbon Taxes versus Cap-and-trade in the Real World.” Energy Policy 96: 50-77.
Clark, Duncan. 2012. “Has the Kyoto Protocol made any difference to carbon emissions?”
The Guardian, November 26.
https://www.theguardian.com/environment/blog/2012/nov/26/kyoto-protocol-carbon-
emissions
Climate Equity Reference Project. 2015. Fair Shares: A Civil Society Review of NDCs.”
http://civilsocietyreview.org/wp-content/uploads/2015/11/CSO_FullReport.pdf
Cline, William R. 2007. Global Warming and Agriculture: Impact Estimates by Country.
Washington, D.C.: Center for Global Development and Petersen Institute for International
Economics. http://www.cgdev.org/content/publications/detail/14090.
Goodwin, Phil, Joyce Dargay, and Mark Hanly. 2004. “Elasticities of Road Traffic and Fuel
Consumption with Respect to Price and Income: A Review.” Transport Reviews 24(3):
275–292.
Grubb, Michael, Thomas L. Brewer, Misato Sato, Robert Heilmayr, and Dora Fazekas. 2009.
“Climate Policy and Industrial Competitiveness: Ten Insights from Europe on the EU
Emissions Trading System.” German Marshall Fund of the United States, Climate &
Energy Paper Series 09.
GIZ. 2013. “International Fuel Prices 2012/2013,” 8th ed., on behalf of Federal Ministry for
Economic Cooperation and Development (Germany).
Harris, Jonathan M., and Maliheh Birjandi Feriz, 2011. Forests, Agriculture, and Climate:
Economics and Policy Issues. Tufts University Global Development and Environment
Institute, http://www.ase.tufts.edu/gdae/education_materials/modules.html#REDD.
Chapter 13: Global Climate Change: Policy Responses 38
Heal, Geoffrey and Anthony Millner. 2014. “Uncertainty and Decision-Making in Climate
Change Economics.” Review of Environmental Economics and Policy 8.1: 120-137.
Hughes, Jonathan E., Christopher R. Knittel, and Daniel Sperling. 2008. “Evidence of a Shift
in the Short-Run Price Elasticity of Gasoline Demand.” Energy Journal 29 (1), 113–134.
Intergovernmental Panel on Climate Change (IPCC). 2007. Climate Change 2007: Synthesis
Report.
Intergovernmental Panel on Climate Change (IPCC). 2014a. Climate Change 2014 Synthesis
Report. http://ipcc.ch/
Intergovernmental Panel on Climate Change (IPCC). 2014b. Climate Change 2014: Impacts,
Adaptation and Vulnerability. http://ipcc.ch/
Kahn, Matthew E. 2016. “The Climate Change Adaptation Literature.” Review of
Environmental Economics and Policy 10.1: 166-178.
Kahsay, Goytom Abraha and Lars Gårn Hansen. 2016. “The Effect of Climate Change and
Adaptation Policy on Agricultural Production in Eastern Africa.” Ecological Economics
121: 54-64.
Kesicki, Fabian, and Paul Ekins. 2011. “Marginal Abatement Cost Curves: A Call for
Caution.” Climate Policy 12(2): 219–236.
Lal Rattan. 2010. “Managing soils and ecosystems for mitigating anthropogenic carbon
emissions and advancing global food security.” Bioscience 60.9: 708-21. Oxford Journals.
McKinsey & Company. 2007. “A Cost Curve for Greenhouse Gas Reduction.” The
McKinsey Quarterly 1: 35–45, available at
http://www.epa.gov/air/caaac/coaltech/2007_05_mckinsey.pdf.
———. 2009. Pathways to a Low-Carbon Economy. http://www.mckinsey.com/business-
functions/sustainability-and-resource-productivity/our-insights/pathways-to-a-low-
carbon-economy.
Metcalf, Gilbert E. 2007. “A Proposal for a U.S. Carbon Tax Swap.” Washington, DC:
Brookings Institution. Discussion Paper 2007–12.
———. 2015. “A Conceptual Framework for Measuring the Effectiveness of Green Tax
Reforms.” Green Growth Knowledge Platform Third Annual Conference on “Fiscal
Policies and the Green Economy Transition: Generating Knowledge – Creating Impact”.
Venice, Italy, January 29–30.
Millar, Richard, Myles Allen, Joeri Rogelj, and Pierre Friedlingstein. 2016. “The Cumulative
Carbon Budget and its Implications.” Oxford Review of Economic Policy 32(2): 323-342.
Murray, Brian, and Nicholas Rivers. 2015. “British Columbia’s Revenue-neutral Carbon Tax:
A Review of the Latest “Grand Experiment” in Environmental Policy. Energy Policy 86:
674-683.
Pacala, Stephen, and Robert H. Socolow. 2004. “Stabilization Wedges: Solving the Climate
Problem for the Next 50 Years with Current Technologies.” Science 305(5686): 968–972.
Roodman, David M. 1997. “Getting the Signals Right: Tax Reform to Protect the
Environment and the Economy.” Worldwatch Paper no. 134. Worldwatch Institute,
Washington, DC.
Rosen, Richard A. and Edeltraud Guenther. 2014. “The Economics of Mitigating Climate
Change: What Can We Know?” Challenge 57.4: 57-81.
Parry, Martin, Nigel Arnell, Pam Berry, David Dodman, Samuel Fankhauser, Chris Hope,
Sari Kovats, Robert Nicholls, David Satterthwaite, Richard Tiffin, and Tim Wheeler.
2009. “Assessing the Costs of Adaptation to Climate Change: A Review of the UNFCCC
and Other Recent Estimates.” Report by the Grantham Institute for Climate Change and
the International Institute for Environment and Development. London.
Sanchez, Luis F. and David I. Stern. 2016. “Drivers of Industrial and Non-industrial
Greenhouse Gas Emissions.” Ecological Economics 124: 17-24.
Chapter 13: Global Climate Change: Policy Responses 39
Schellnhuber, Hans Joachim, Stefan Rahmstorf, and Ricarda Winkelmann. 2016. “Why the
Right Climate Target was Agreed in Paris.” Nature Climate Change 6: 649-653.
Socolow, Robert H. 2011. “Wedges Reaffirmed.” Bulletin of the Atomic Scientists, 27
September, http://thebulletin.org/wedges-reaffirmed.
Socolow, Robert H., and Stephen W. Pacala. 2006. “A Plan to Keep Carbon in Check.”
Scientific American (September): 50–57.
Stern, Nicholas. 2007. The Economics of Climate Change: The Stern Review. Cambridge:
Cambridge University Press.
United Nations Environmental Programme (UNEP). 2016. The Adaptation Gap Report.
Nairobi, Kenya: UNEP. http://drustage.unep.org/adaptationgapreport/2016.United
Nations Framework Convention on Climate Change (UNFCCC). 2007. “Investment and
Financial Flows to Address Climate Change.” Climate Change Secretariat, Bonn.
United States Global Change Research Program. 2009. Second National Climate Assessment.
http://globalchange.gov/publications/reports/scientific-assessments/us-impacts.
Vale, Petterson Molina. 2016. “The Changing Climate of Climate Economics.” Ecological
Economics 121: 12-19.
World Bank. 2010. “The Costs to Developing Countries of Adapting to Climate Change:
New Methods and Estimates.” Consultation Draft.
World Health Organization. 2009. “Protecting Health from Climate Change: Connecting
Science, Policy, and People.”
Zhou, P. and M. Wang. 2016. “Carbon Dioxide Emissions Allocation: A Review.”
Ecological Economics 125: 47-59.
WEB SITES
1. http://climate.wri.org/climate. World Resource Institute’s Web site on climate and
atmosphere. The site includes numerous articles and case studies.
2. http://unfccc.int/2860.php. Home page for the United Nations Framework Convention
on Climate Change. The site provides data on the climate change issue and information
about the ongoing process of negotiating international agreements related to climate
change.
3. http://www.rff.org/research/topics/climate-change. Publications by Resources for the
Future on issues of energy and climate change. The site includes articles on carbon
pricing and cap-and-trade in practice, as well as climate adaptation.
NOTES 1 Stern, 2007. 2 Rosen and Guenther, 2014; Heal and Millner, 2014; Vale, 2016. 3 IPCC, 2007, p. 46; IPCC, 2014a Summary for Policymakers, p. 16; Kahn, 2016. 4 African Development Bank et al., 2003, p. 1. 5 http://www.npr.org/sections/thesalt/2015/07/28/426886645/squeezed-by-drought-california-farmers-switch-to-
less-thirsty-crops. 6 Cline, 2007; U. S. Global Change Research Program, 2009, Agriculture Chapter; Kahsay and Hansen, 2016.. 7 World Health Organization, 2009; WHO, Climate Change and Health, June 2016,
http://www.who.int/mediacentre/factsheets/fs266/en/ 8 UNEP, 2016. 9 U.S. EPA, The Social Cost of Carbon, https://www3.epa.gov/climatechange/EPAactivities/economics/scc.html 10 Goodwin et al., 2004; Hughes et al., 2008. 11 Goodwin et al., 2004.
Chapter 13: Global Climate Change: Policy Responses 40
12 Carl and Fedor, 2016. 13 Pacala and Socolow, 2004, Socolow and Pacala, 2006; Socolow, 2011. 14 Socolow and Pacala, 2006; Schellnhuber et al., 2016. 15 Socolow and Pacala, 2006. 16 McKinsey & Company, 2007 and 2009. 17 Ibid. 18 See Kesicki and Ekins, 2011, for a critique of marginal abatement cost curves. 19 Clark, 2012. 20 Coral Davenport, “Paris Climate Deal Reaches Milestone as 20 More Nations Sign On,” New York Times,
September 21, 2016; Coral Davenport, “Nations, Fighting Powerful Refrigerant that Warms Planet, Reach
Landmark Deal,” New York Times, October 15, 2016. 21 “Adoption of the Paris Agreement” http://unfccc.int/resource/docs/2015/cop21/eng/l09r01.pdf 22 www.scientificamerican.com/article/poorer-nations-demand-more-aid-to-deal-with-climate-change/;
http://roadtoparis.info/2014/11/06/climate-finance-too-little-too-late/ 23 https://www.whitehouse.gov/the-press-office/2015/09/25/us-china-joint-presidential-statement-climate-
change 24 U.N Framework Convention on Climate Change,
http://www4.unfccc.int/submissions/INDC/Submission%20Pages/submissions.aspx 25 Ibid. 26 http://climateactiontracker.org/methodology/85/Comparability-of-effort.html;
http://www.wri.org/blog/2015/07/japan-releases-underwhelming-climate-action-commitment 27 Millar et al., 2016. 28 http://climateactiontracker.org/assets/publications/briefing_papers/CAT_Temp_Update_COP21.pdf 29 The Global Carbon Project, “Global Carbon Budget,” http://www.globalcarbonproject.org/; Schellnhuber et
al, 2016. 30 www.rggi.org. 31 http://www.c2es.org/us-states-regions/key-legislation/california-cap-trade 32 http://www.c40.org/; https://www.compactofmayors.org/ 33 http://www.theguardian.com/cities/2015/nov/17/cities-climate-change-problems-solution;
http://www.unep.org/urban_environment/issues/climate_change.asp 34 IPCC, 2014a, Summary for Policymakers, p. 5; Harris and Feriz, 2011; Sanchez and Stern, 2016.. 35 Lal, 2010; Chris Mooney, “The Solution to Climate Change that has nothing to do with cars or coal”,
Washington Post, February 11, 2016; Beth Gardiner, “A boon for soils, and for the environment”, New York
Times, May 17, 2016; Center for Food Safety, “Soil & Carbon: Soil solutions to Climate problems”, 2015. 36 Excise taxes are taxes on specific products such as cigarettes and alcohol. 37 Metcalf, 2007. 38 Zhou and Wang, 2016. 39 Baer et al., 2008. 40 Climate Equity Reference Project, 2015, p. 2.