Embed Size (px)
Citation preview
Atmos. Chem. Phys., 16, 8939–8962, 2016www.atmos-chem-phys.net/16/8939/2016/doi:10.5194/acp-16-8939-2016© Author(s) 2016. CC Attribution 3.0 License.
Global combustion sources of organic aerosols: modelcomparison with 84 AMS factor-analysis data setsAlexandra P. Tsimpidi1, Vlassis A. Karydis1, Spyros N. Pandis2,3, and Jos Lelieveld1,4
1Max Planck Institute for Chemistry, Mainz, Germany2Department of Chemical Engineering, University of Patras, Patras, Greece3Department of Chemical Engineering, Carnegie Mellon University, Pittsburgh, PA, USA4Energy, Environment and Water Research Center, Cyprus Institute, Nicosia, Cyprus
Correspondence to: Alexandra P. Tsimpidi ([email protected])
Received: 8 December 2015 – Published in Atmos. Chem. Phys. Discuss.: 3 February 2016Revised: 30 May 2016 – Accepted: 20 June 2016 – Published: 20 July 2016
Abstract. Emissions of organic compounds from biomass,biofuel, and fossil fuel combustion strongly influence theglobal atmospheric aerosol load. Some of the organics aredirectly released as primary organic aerosol (POA). Most areemitted in the gas phase and undergo chemical transforma-tions (i.e., oxidation by hydroxyl radical) and form secondaryorganic aerosol (SOA). In this work we use the global chem-istry climate model ECHAM/MESSy Atmospheric Chem-istry (EMAC) with a computationally efficient module forthe description of organic aerosol (OA) composition and evo-lution in the atmosphere (ORACLE). The tropospheric bur-den of open biomass and anthropogenic (fossil and biofuel)combustion particles is estimated to be 0.59 and 0.63 Tg, re-spectively, accounting for about 30 and 32 % of the total tro-pospheric OA load. About 30 % of the open biomass burningand 10 % of the anthropogenic combustion aerosols originatefrom direct particle emissions, whereas the rest is formedin the atmosphere. A comprehensive data set of aerosolmass spectrometer (AMS) measurements along with factor-analysis results from 84 field campaigns across the NorthernHemisphere are used to evaluate the model results. Both theAMS observations and the model results suggest that overurban areas both POA (25–40 %) and SOA (60–75 %) con-tribute substantially to the overall OA mass, whereas furtherdownwind and in rural areas the POA concentrations de-crease substantially and SOA dominates (80–85 %). EMACdoes a reasonable job in reproducing POA and SOA levelsduring most of the year. However, it tends to underpredictPOA and SOA concentrations during winter indicating thatthe model misses wintertime sources of OA (e.g., residential
biofuel use) and SOA formation pathways (e.g., multiphaseoxidation).
1 Introduction
Organic aerosol (OA) is a major contributor to fine particu-late matter mass with potentially harmful effects on the en-vironment and human health (Lelieveld et al., 2013; Poschl,2005); however, the sources are poorly understood (Kanaki-dou et al., 2005; Goldstein and Galbally, 2007; Donahueet al., 2009; Tsigaridis et al., 2014). OA comprises pri-mary organic aerosol (POA), i.e., directly emitted in theparticulate phase, and secondary organic aerosol (SOA),formed within the atmosphere from the oxidation of gas-phase precursors. POA constitutes the particulate OA frac-tion emitted by anthropogenic combustion processes (i.e.,fossil fuels, biofuels) and open biomass burning (i.e., sa-vanna and forest fires). Anthropogenic combustion emis-sions of particulate organic carbon (OC) are estimated at13.9 Tg C yr−1 for the year 2005 (Clarke et al., 2007). OCemissions from open biomass burning range from 13.5 to21.4 Tg C yr−1 during the decade since 2000 (van der Werfet al., 2010). POA emitted from combustion sources canevaporate rapidly during atmospheric dilution dependingon ambient concentrations (Robinson et al., 2010; Ran-jan et al., 2012; May et al., 2014). The phase partition-ing of the emitted POA depends on the volatility dis-tribution of the emissions. This distribution includes lowvolatility (LVOC; C∗< 0.32 µg m−3), semivolatile (SVOC;
Published by Copernicus Publications on behalf of the European Geosciences Union.
8940 A. P. Tsimpidi et al.: Global combustion sources of organic aerosols
0.32 µg m−3<C∗< 320 µg m−3), and intermediate volatility(IVOC; 3.2× 10² µg m−3<C∗< 3.2× 10⁶ µg m6) organiccompounds. The corresponding emission factors can be mea-sured using dilution samplers and are estimated as a functionof the saturation concentration of the emitted organic com-pounds (Grieshop et al., 2009). Traditional emission inven-tories (e.g., Clarke et al., 2007; van Der Werf et al., 2010)account for only a small fraction of the emitted IVOCs sincethey are based on filter samples collected at aerosol concen-trations up to 104 µg m−3 (Shrivastava et al., 2008; Robin-son et al., 2010). The amount of IVOC emissions missing intraditional inventories is estimated to be between 0.25 and2.8 times POA emissions, depending on the type of thesource (Shrivastava et al., 2008; Robinson et al., 2010).
Organic emissions further downwind mix with back-ground air, resulting in cooling and dilution and altering thegas-particle partitioning. The organic compounds that remainin the gas phase can undergo chemical transformations (i.e.,oxidation by hydroxyl radical), become less volatile and maybe transferred into SOA (Donahue et al., 2006). Therefore,in addition to direct emissions of POA, it is important tounderstand the potential of combustion emissions to con-tribute to SOA formation. Numerous studies have indicatedthat SOA usually exceeds POA even in urban environmentswith substantial primary emissions (Jimenez et al., 2009;Stone et al., 2009; Sun et al., 2011; Mohr et al., 2012; Hayeset al., 2013). However, the overall contribution of combus-tion emissions to ambient SOA and OA remains uncertain(Chirico et al., 2010; Miracolo et al., 2011; Samy and Zielin-ska, 2010; Gentner et al., 2012; Bahreini et al., 2012; Gor-don et al., 2014). Together with the OA mass concentration,the hygroscopic, chemical and optical properties continue tochange because of chemical processing by gas-phase oxi-dants (Jimenez et al., 2009). These changes affect the OAradiative forcing on climate by direct and indirect effects, thelatter through cloud formation (Poschl, 2005; McFiggans etal., 2006; IPCC; 2013).
Mass spectrometry has been widely used in aerosol analy-ses because of the universal, sensitive, and rapid detection ofaerosol components (Suess and Prather, 1999). The aerosolmass spectrometer (AMS) (Jimenez et al., 2003) has beenthe most commonly used instrument in recent years. AMS iscapable of quantitatively measuring the OA mass concentra-tions with high time and particle size resolution (Takegawa etal., 2005; Zhang et al., 2005b). Several factor-analysis tech-niques have been employed to extract information about pro-cesses and sources of OA. These techniques include principalcomponent analysis (CPCA; Zhang et al., 2005a), multiplecomponent analysis (MCA; Zhang et al., 2007), hierarchicalcluster analysis (Marcolli et al., 2006), the multilinear engine(ME-2; Lanz et al., 2008), and positive matrix factorization(PMF; Paatero and Tapper, 1994; Paatero, 1997), with the lat-ter being the most commonly used (Lanz et al., 2007; Nemitzet al., 2008; Aiken et al., 2009; Ulbrich et al., 2009; DeCarlo
et al., 2010; Mohr et al., 2012; Hayes et al., 2013; Crippa etal., 2014; Carbone et al., 2014; Chen et al., 2015).
PMF allows for the classification of OA into severaltypes based on different temporal and mass spectral signa-tures. Two major components often resolved by the anal-ysis of the AMS measurements are hydrocarbon-like or-ganic aerosol (HOA) and oxygenated organic aerosol (OOA)(Zhang et al., 2007; Jimenez et al., 2009). Biomass burn-ing OA (BBOA), marine-related OA (MOA), and cookingOA (COA) are other OA components that PMF may iden-tify as important components of the observed OA (Lanz etal., 2010; Mohr et al., 2012; Kostenidou et al., 2013; Crippaet al., 2013a). HOA correlates with combustion tracers (e.g.,CO, elemental carbon, and NOx) and is considered as a sur-rogate for fossil fuel combustion POA (Lanz et al., 2007;Ulbrich et al., 2009; Crippa et al., 2014). BBOA correlateswith tracers from biomass burning (e.g., acetonitrile, lev-oglucosan, and potassium) and is considered a surrogate ofbiomass burning POA (Aiken et al., 2010; Lanz et al., 2010;Crippa et al., 2014). OOA often correlates with secondarypollutants (e.g., ozone, sulfate, and nitrate) and is consid-ered a surrogate for SOA (Jimenez et al., 2009; Ng et al.,2011). However, Crippa et al. (2014) have reported that theOOA correlation with secondary inorganic species might notbe very high in at least some field campaigns. OOA can in-clude SOA from various precursors, such as anthropogenicand biogenic volatile organic compounds (VOCs), as wellas SVOCs and IVOCs from fossil fuel, biofuel, and openbiomass burning. PMF often classifies OOA into two sub-types that differ in the degree of oxidation: a more stronglyoxygenated low-volatility OOA (LV-OOA) often correlatingwith sulfate, and a less oxygenated semivolatile OOA (SV-OOA) usually correlating with nitrate (Jimenez et al., 2009;Crippa et al., 2014). Field campaigns in the Northern Hemi-sphere have shown that HOA accounts for approximatelyone-third of the OA in urban sites and OOA accounts for theremaining two-thirds, while OOA represents roughly 95 % ofthe OA in rural/remote regions (Zhang et al., 2007).
Global chemistry climate and chemical transport modelssystematically underpredict OA levels, especially over anddownwind of anthropogenic source regions (Tsigaridis et al.,2014). At the same time, global models tend to predict adominance of POA at mid-latitudes in the Northern Hemi-sphere while measurements indicate the opposite (Henze etal., 2008; Tsigaridis et al., 2014). The same models indi-cate that the formation of SOA from biogenic sources greatlyexceeds that from anthropogenic sources. The shortcom-ings in many OA models are partially due to the assump-tion that POA is non-volatile and nonreactive (Kanakidouet al., 2005; Jimenez et al., 2009). To address these short-comings, Donahue et al. (2006) developed the volatility ba-sis set (VBS) framework, which assumes that POA emissionsare semivolatile and photochemically reactive and uses log-arithmically spaced volatility bins to distribute POA uponemission. Recently, several regional-scale modeling studies
Atmos. Chem. Phys., 16, 8939–8962, 2016 www.atmos-chem-phys.net/16/8939/2016/
A. P. Tsimpidi et al.: Global combustion sources of organic aerosols 8941
have accounted for the semivolatile nature and chemical ag-ing of organic compounds demonstrating improvements inreproducing the OA concentrations and chemical composi-tion (Robinson et al., 2007; Shrivastava et al., 2008; Murphyand Pandis, 2009; Tsimpidi et al., 2010, 2011; Hodzic et al.,2010; Fountoukis et al., 2011, 2014; Bergström et al., 2012;Athanasopoulou et al., 2013; Zhang et al., 2013). However,only few global modeling studies have yet adopted the VBSapproach to simulate the SOA formation from the chemi-cal aging of SVOC and IVOC emissions (Jathar et al., 2011;Tsimpidi et al., 2014; Shrivastava et al., 2015; Hodzic et al.,2016). According to these studies, the modeled troposphericburden of POA is 0.09–0.94 Tg and of SOA 1.8–2.8 Tg.
In this work we use ORACLE, a computationally efficientmodule for the description of organic aerosol compositionand evolution in the atmosphere (Tsimpidi et al., 2014), toestimate the impact of open biomass burning and anthro-pogenic combustion emissions and their chemical aging onglobal OA budgets and distributions. An extensive globaldata set of AMS measurements and factor-analysis resultsfrom 84 field campaigns in the Northern Hemisphere areused in combination with the model results during the pe-riod of 2001–2010. This integrated effort provides further in-sights into the temporal and geographical variability of theOA particles, emission strengths and the chemical process-ing of organics from combustion sources.
2 Model description and application
2.1 EMAC model
The ECHAM/MESSy Atmospheric Chemistry (EMAC)model is a numerical chemistry and climate simulationsystem that includes sub-models describing the lowerand middle atmosphere processes (Jöckel et al., 2006).EMAC includes submodels that describe gas-phase chem-istry (MECCA; Sander et al., 2011), inorganic aerosol mi-crophysics (GMXe; Pringle et al., 2010), cloud microphysics(CLOUD; Jöckel et al., 2006), aerosol optical properties(AEROPT; Lauer et al., 2007), dry deposition (DRYDEP;Kerkweg et al., 2006a), sedimentation (SEDI; Kerkweg et al.,2006a), cloud scavenging (SCAV; Tost et al., 2006), emis-sions (ONLEM and OFFLEM; Kerkweg et al., 2006b), andorganic aerosol formation and growth (ORACLE; Tsimpidiet al., 2014).
The removal of gas and aerosol organic compoundsthrough dry deposition is calculated with the DRYDEP sub-model (Kerkweg et al., 2006a) based on the big-leaf ap-proach, and the dry deposition velocities depend on phys-ical and chemical properties of the surface cover (e.g., theroughness length, soil pH, leaf stomatal exchange). The sed-imentation of aerosols is calculated with the SEDI submodel(Kerkweg et al., 2006a) using a first-order trapezoid scheme.In-cloud scavenging and rainout of gas and aerosol species
are treated by the SCAV submodel (Tost et al., 2006). The ef-fective Henry’s law coefficient used for calculating the scav-enging rates of LVOCs, SVOCs, and IVOCs is 105 M atm−1.
The spectral resolution used in this study is T63L31, cor-responding to a horizontal grid resolution of 1.875◦× 1.875◦
and 31 vertical layers extending to 10 hPa at about 25 kmaltitude. EMAC has been run for 11 years, covering theperiod 2000–2010, and the first year is used as spin-up.EMAC has been extensively described and evaluated againstin situ observations and satellite measurements that includefilter-based particulate matter concentrations, aerosol opti-cal depth, acid deposition, gas-phase mixing ratios, and me-teorological parameters (Jöckel et al., 2006; Pozzer et al.,2012a, b; Karydis et al., 2016). Tsimpidi et al. (2014) per-formed an in-depth evaluation of the EMAC calculated totalOA over different continents by using measurements fromthe EMEP network over Europe, the IMPROVE networkover North America, and several short-term field campaignsover East Asia, subtropical West Africa, the Amazon rainfor-est, and the Canadian boreal forest. The present work focuseson the model evaluation for the individual OA components(i.e., POA and SOA). In addition, the statistical evaluation ofEMAC results for the inorganic components summarized inTables S1–S3 in the Supplement.
2.2 ORACLE module
ORACLE is a computationally efficient submodel for thedescription of OA composition and evolution in the atmo-sphere, which has been implemented into the EMAC modelby Tsimpidi et al. (2014). ORACLE simulates a variety ofsemivolatile organic species and reaction products and sep-arates them into groups of compounds with logarithmicallyspaced effective saturation concentrations.
In this study, primary organic emissions from openbiomass burning and from anthropogenic sources (i.e., fos-sil fuel and biofuel) are simulated using separate surro-gate species for each source category. They are subdi-vided into three groups of organic compounds: LVOCs(10−2 µg m−3), SVOCs (100 and 102 µg m−3), and IVOCs(104 and 106 µg m−3). These organic compounds are allowedto partition between the gas and aerosol phases resultingin the formation of fPOA (anthropogenic POA from fos-sil fuel and biofuel combustion) and bbPOA (natural POAfrom open biomass burning). VOCs are distinguished intoanthropogenic and biogenic and their oxidation products aredistributed in four volatility bins with effective saturationconcentrations of 100, 101, 102, and 103 µg m−3 at 298 Kby using the aerosol mass yields (Table S4) by Tsimpidi etal. (2014). Gas-phase photochemical reactions that changethe volatility of the organics are taken into account and theiroxidation products (SOA-sv, SOA-iv, and SOA-v) are sim-ulated separately in the module to keep track of their ori-gin. The suffixes -sv, -iv and -v to the term SOA define acategory of precursors (SVOCs, IVOCs, and VOCs, respec-
www.atmos-chem-phys.net/16/8939/2016/ Atmos. Chem. Phys., 16, 8939–8962, 2016
8942 A. P. Tsimpidi et al.: Global combustion sources of organic aerosols
= fresh SOG-sv= fresh SOA-sv= fresh SOG-iv= fresh SOA-iv
= aged SOG-sv= aged SOA-sv= aged SOG-iv= aged SOA-iv
= Gas/particlepartitioning
= Aging reaction
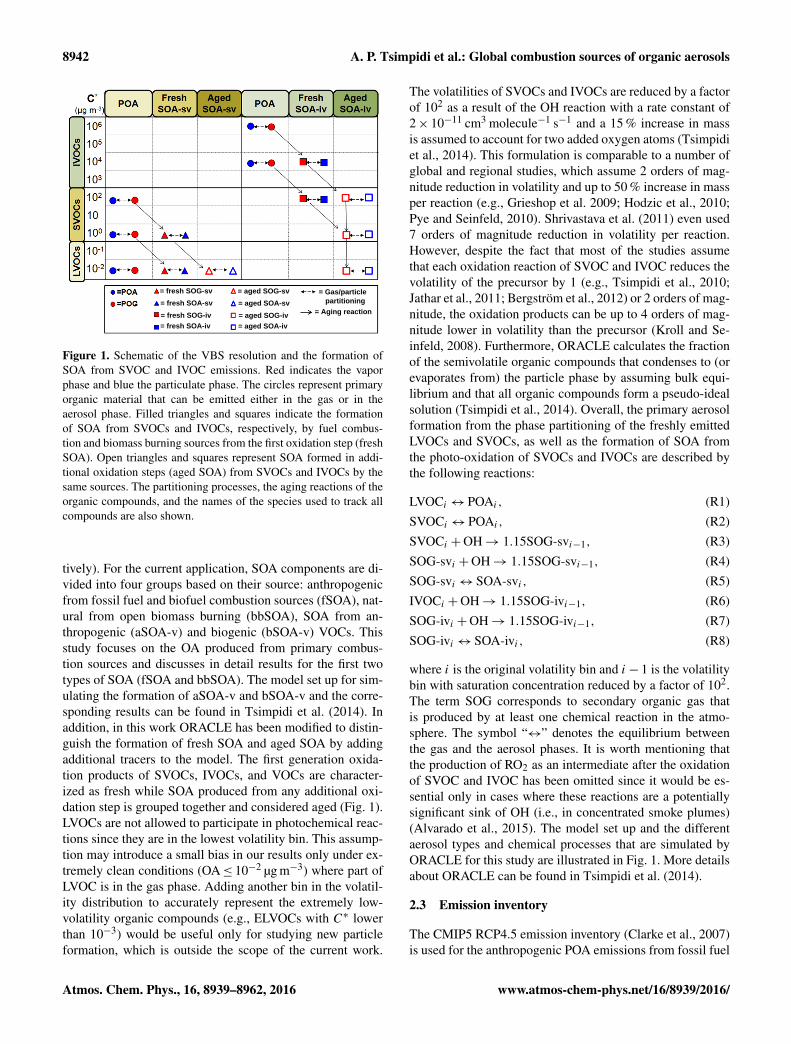
Figure 1. Schematic of the VBS resolution and the formation ofSOA from SVOC and IVOC emissions. Red indicates the vaporphase and blue the particulate phase. The circles represent primaryorganic material that can be emitted either in the gas or in theaerosol phase. Filled triangles and squares indicate the formationof SOA from SVOCs and IVOCs, respectively, by fuel combus-tion and biomass burning sources from the first oxidation step (freshSOA). Open triangles and squares represent SOA formed in addi-tional oxidation steps (aged SOA) from SVOCs and IVOCs by thesame sources. The partitioning processes, the aging reactions of theorganic compounds, and the names of the species used to track allcompounds are also shown.
tively). For the current application, SOA components are di-vided into four groups based on their source: anthropogenicfrom fossil fuel and biofuel combustion sources (fSOA), nat-ural from open biomass burning (bbSOA), SOA from an-thropogenic (aSOA-v) and biogenic (bSOA-v) VOCs. Thisstudy focuses on the OA produced from primary combus-tion sources and discusses in detail results for the first twotypes of SOA (fSOA and bbSOA). The model set up for sim-ulating the formation of aSOA-v and bSOA-v and the corre-sponding results can be found in Tsimpidi et al. (2014). Inaddition, in this work ORACLE has been modified to distin-guish the formation of fresh SOA and aged SOA by addingadditional tracers to the model. The first generation oxida-tion products of SVOCs, IVOCs, and VOCs are character-ized as fresh while SOA produced from any additional oxi-dation step is grouped together and considered aged (Fig. 1).LVOCs are not allowed to participate in photochemical reac-tions since they are in the lowest volatility bin. This assump-tion may introduce a small bias in our results only under ex-tremely clean conditions (OA≤ 10−2 µg m−3) where part ofLVOC is in the gas phase. Adding another bin in the volatil-ity distribution to accurately represent the extremely low-volatility organic compounds (e.g., ELVOCs with C∗ lowerthan 10−3) would be useful only for studying new particleformation, which is outside the scope of the current work.
The volatilities of SVOCs and IVOCs are reduced by a factorof 102 as a result of the OH reaction with a rate constant of2× 10−11 cm3 molecule−1 s−1 and a 15 % increase in massis assumed to account for two added oxygen atoms (Tsimpidiet al., 2014). This formulation is comparable to a number ofglobal and regional studies, which assume 2 orders of mag-nitude reduction in volatility and up to 50 % increase in massper reaction (e.g., Grieshop et al. 2009; Hodzic et al., 2010;Pye and Seinfeld, 2010). Shrivastava et al. (2011) even used7 orders of magnitude reduction in volatility per reaction.However, despite the fact that most of the studies assumethat each oxidation reaction of SVOC and IVOC reduces thevolatility of the precursor by 1 (e.g., Tsimpidi et al., 2010;Jathar et al., 2011; Bergström et al., 2012) or 2 orders of mag-nitude, the oxidation products can be up to 4 orders of mag-nitude lower in volatility than the precursor (Kroll and Se-infeld, 2008). Furthermore, ORACLE calculates the fractionof the semivolatile organic compounds that condenses to (orevaporates from) the particle phase by assuming bulk equi-librium and that all organic compounds form a pseudo-idealsolution (Tsimpidi et al., 2014). Overall, the primary aerosolformation from the phase partitioning of the freshly emittedLVOCs and SVOCs, as well as the formation of SOA fromthe photo-oxidation of SVOCs and IVOCs are described bythe following reactions:
LVOCi ↔ POAi, (R1)SVOCi ↔ POAi, (R2)SVOCi +OH→ 1.15SOG-svi−1, (R3)SOG-svi +OH→ 1.15SOG-svi−1, (R4)SOG-svi ↔ SOA-svi, (R5)IVOCi +OH→ 1.15SOG-ivi−1, (R6)SOG-ivi +OH→ 1.15SOG-ivi−1, (R7)SOG-ivi ↔ SOA-ivi, (R8)
where i is the original volatility bin and i− 1 is the volatilitybin with saturation concentration reduced by a factor of 102.The term SOG corresponds to secondary organic gas thatis produced by at least one chemical reaction in the atmo-sphere. The symbol “↔” denotes the equilibrium betweenthe gas and the aerosol phases. It is worth mentioning thatthe production of RO2 as an intermediate after the oxidationof SVOC and IVOC has been omitted since it would be es-sential only in cases where these reactions are a potentiallysignificant sink of OH (i.e., in concentrated smoke plumes)(Alvarado et al., 2015). The model set up and the differentaerosol types and chemical processes that are simulated byORACLE for this study are illustrated in Fig. 1. More detailsabout ORACLE can be found in Tsimpidi et al. (2014).
2.3 Emission inventory
The CMIP5 RCP4.5 emission inventory (Clarke et al., 2007)is used for the anthropogenic POA emissions from fossil fuel
Atmos. Chem. Phys., 16, 8939–8962, 2016 www.atmos-chem-phys.net/16/8939/2016/
A. P. Tsimpidi et al.: Global combustion sources of organic aerosols 8943Em
issi
on fa
ctor
-3Saturation concentration (µ m )
Emission rate (Tg yr )
-1
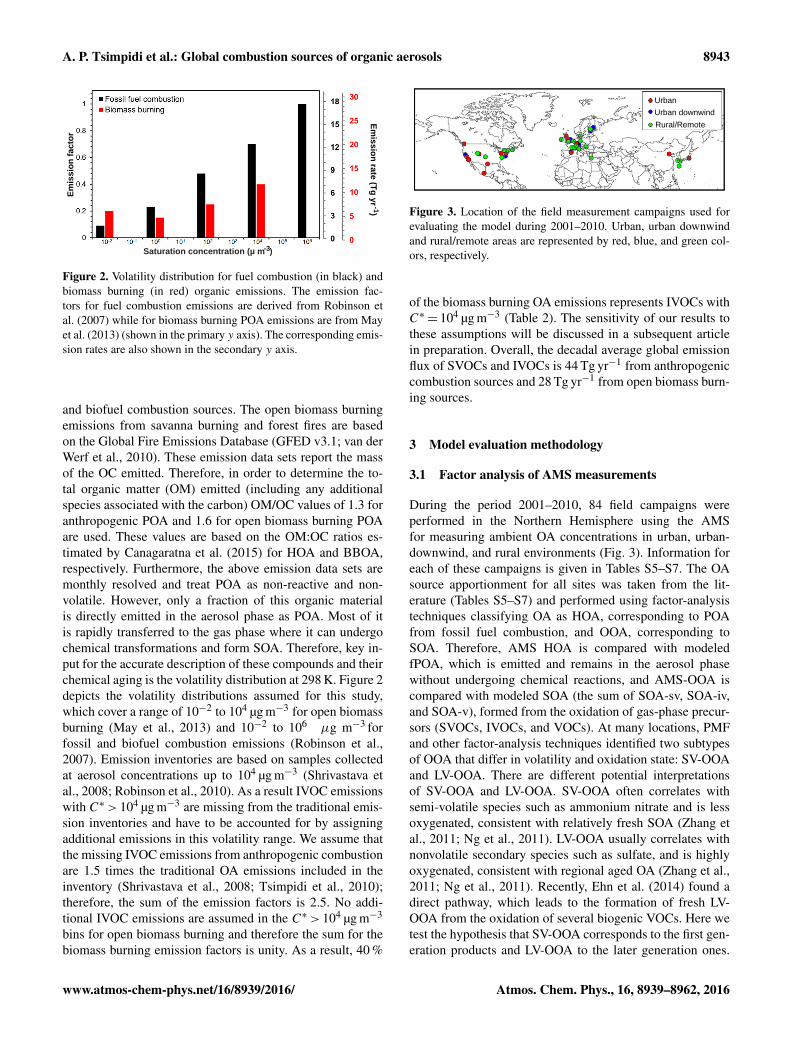
Figure 2. Volatility distribution for fuel combustion (in black) andbiomass burning (in red) organic emissions. The emission fac-tors for fuel combustion emissions are derived from Robinson etal. (2007) while for biomass burning POA emissions are from Mayet al. (2013) (shown in the primary y axis). The corresponding emis-sion rates are also shown in the secondary y axis.
and biofuel combustion sources. The open biomass burningemissions from savanna burning and forest fires are basedon the Global Fire Emissions Database (GFED v3.1; van derWerf et al., 2010). These emission data sets report the massof the OC emitted. Therefore, in order to determine the to-tal organic matter (OM) emitted (including any additionalspecies associated with the carbon) OM/OC values of 1.3 foranthropogenic POA and 1.6 for open biomass burning POAare used. These values are based on the OM:OC ratios es-timated by Canagaratna et al. (2015) for HOA and BBOA,respectively. Furthermore, the above emission data sets aremonthly resolved and treat POA as non-reactive and non-volatile. However, only a fraction of this organic materialis directly emitted in the aerosol phase as POA. Most of itis rapidly transferred to the gas phase where it can undergochemical transformations and form SOA. Therefore, key in-put for the accurate description of these compounds and theirchemical aging is the volatility distribution at 298 K. Figure 2depicts the volatility distributions assumed for this study,which cover a range of 10−2 to 104 µg m−3 for open biomassburning (May et al., 2013) and 10−2 to 106 µg m−3 forfossil and biofuel combustion emissions (Robinson et al.,2007). Emission inventories are based on samples collectedat aerosol concentrations up to 104 µg m−3 (Shrivastava etal., 2008; Robinson et al., 2010). As a result IVOC emissionswith C∗> 104 µg m−3 are missing from the traditional emis-sion inventories and have to be accounted for by assigningadditional emissions in this volatility range. We assume thatthe missing IVOC emissions from anthropogenic combustionare 1.5 times the traditional OA emissions included in theinventory (Shrivastava et al., 2008; Tsimpidi et al., 2010);therefore, the sum of the emission factors is 2.5. No addi-tional IVOC emissions are assumed in the C∗> 104 µg m−3
bins for open biomass burning and therefore the sum for thebiomass burning emission factors is unity. As a result, 40 %
UrbanUrban downwindRural/Remote
Figure 3. Location of the field measurement campaigns used forevaluating the model during 2001–2010. Urban, urban downwindand rural/remote areas are represented by red, blue, and green col-ors, respectively.
of the biomass burning OA emissions represents IVOCs withC∗= 104 µg m−3 (Table 2). The sensitivity of our results tothese assumptions will be discussed in a subsequent articlein preparation. Overall, the decadal average global emissionflux of SVOCs and IVOCs is 44 Tg yr−1 from anthropogeniccombustion sources and 28 Tg yr−1 from open biomass burn-ing sources.
3 Model evaluation methodology
3.1 Factor analysis of AMS measurements
During the period 2001–2010, 84 field campaigns wereperformed in the Northern Hemisphere using the AMSfor measuring ambient OA concentrations in urban, urban-downwind, and rural environments (Fig. 3). Information foreach of these campaigns is given in Tables S5–S7. The OAsource apportionment for all sites was taken from the lit-erature (Tables S5–S7) and performed using factor-analysistechniques classifying OA as HOA, corresponding to POAfrom fossil fuel combustion, and OOA, corresponding toSOA. Therefore, AMS HOA is compared with modeledfPOA, which is emitted and remains in the aerosol phasewithout undergoing chemical reactions, and AMS-OOA iscompared with modeled SOA (the sum of SOA-sv, SOA-iv,and SOA-v), formed from the oxidation of gas-phase precur-sors (SVOCs, IVOCs, and VOCs). At many locations, PMFand other factor-analysis techniques identified two subtypesof OOA that differ in volatility and oxidation state: SV-OOAand LV-OOA. There are different potential interpretationsof SV-OOA and LV-OOA. SV-OOA often correlates withsemi-volatile species such as ammonium nitrate and is lessoxygenated, consistent with relatively fresh SOA (Zhang etal., 2011; Ng et al., 2011). LV-OOA usually correlates withnonvolatile secondary species such as sulfate, and is highlyoxygenated, consistent with regional aged OA (Zhang et al.,2011; Ng et al., 2011). Recently, Ehn et al. (2014) found adirect pathway, which leads to the formation of fresh LV-OOA from the oxidation of several biogenic VOCs. Here wetest the hypothesis that SV-OOA corresponds to the first gen-eration products and LV-OOA to the later generation ones.
www.atmos-chem-phys.net/16/8939/2016/ Atmos. Chem. Phys., 16, 8939–8962, 2016
8944 A. P. Tsimpidi et al.: Global combustion sources of organic aerosols
Therefore, AMS SV-OOA is compared with the fraction ofSOA-sv, SOA-iv, and SOA-v from the first oxidation step ofSVOCs, IVOC, and VOCs as it is tracked separately (hence-forth EMAC fresh SOA). Then AMS LV-OOA is comparedwith the fraction of SOA-sv, SOA-iv, and SOA-v from anyadditional oxidation step (henceforth EMAC aged SOA). Fi-nally, in a few field campaigns, e.g., in the Alps (Lanz etal., 2010), residential wood burning was found to be a ma-jor source of OA. However, residential wood burning is in-cluded in EMAC as fPOA. To account for this inconsistencyfor the AMS data sets that include BBOA, we compare thesum of the simulated fPOA and bbPOA (henceforth EMACPOA) to the sum of the AMS HOA and BBOA (henceforthAMS POA). In data sets where OA from cooking activitieshas been resolved by the PMF analysis, AMS COA has notbeen taken into account for the model evaluation since theseemissions are not included in our emission inventory.
3.2 Evaluation metrics
The mean bias (MB), mean absolute gross error (MAGE),normalized mean bias (NMB), normalized mean er-ror (NME), and the root mean square error (RMSE) are usedto assess the model performance:
MAGE=1N
N∑i=1
|Pi −Oi | , (1)
MB=1N
N∑i=1
(Pi −Oi) , (2)
NME=
N∑i=1|Pi −Oi |
N∑i=1Oi
, (3)
NMB=
N∑i=1(Pi −Oi)
N∑i=1Oi
, (4)
RMSE=
[1N
N∑i=1
(Pi −Oi)2
] 12
, (5)
where Oi is the observed campaign average value of theith OA component, Pi is the corresponding modeled valueduring the same period, and N is the total number of com-parisons used for the evaluation. NME (in %) and MAGE (inµg m−3) provide an estimate of the overall discrepancy be-tween predictions and observations, while NMB (in %) andMB (in µg m−3) are sensitive to systematic errors. RMSE(in µg m−3) is the root of the mean square error, which in-corporates both the variance of the prediction and its bias.Both NME and MAGE inherently include the correspond-ing bias, which is the reason why their magnitude is equal
or larger than NMB and MB, respectively. For an unbiasedprediction, NME and MAGE express the variance. WhenNME and NMB or MAGE and MB are close, the discrepancyis explained as a systematic bias rather than scatter. WhenNME/MAGE exceeds NMB/MB, part of the discrepancy be-tween predictions and observations is explained as scatter. Todetermine the effects of the site type, geographical locationand the seasonal cycle on the model results, the evaluationmetrics are calculated separately for urban, urban-downwind,and rural sites; European, North American, and Asian sites;and for four seasons (winter, spring, summer, and autumn).
4 Model results
4.1 OA from anthropogenic combustion
4.1.1 Geographical distribution
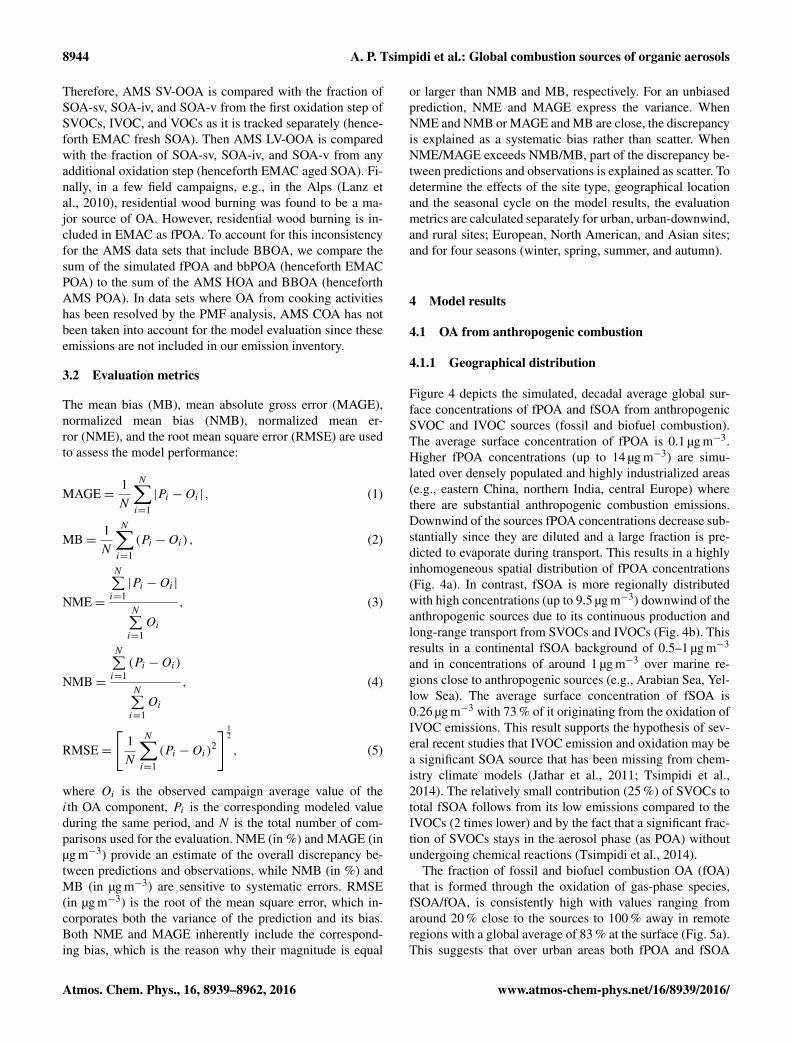
Figure 4 depicts the simulated, decadal average global sur-face concentrations of fPOA and fSOA from anthropogenicSVOC and IVOC sources (fossil and biofuel combustion).The average surface concentration of fPOA is 0.1 µg m−3.Higher fPOA concentrations (up to 14 µg m−3) are simu-lated over densely populated and highly industrialized areas(e.g., eastern China, northern India, central Europe) wherethere are substantial anthropogenic combustion emissions.Downwind of the sources fPOA concentrations decrease sub-stantially since they are diluted and a large fraction is pre-dicted to evaporate during transport. This results in a highlyinhomogeneous spatial distribution of fPOA concentrations(Fig. 4a). In contrast, fSOA is more regionally distributedwith high concentrations (up to 9.5 µg m−3) downwind of theanthropogenic sources due to its continuous production andlong-range transport from SVOCs and IVOCs (Fig. 4b). Thisresults in a continental fSOA background of 0.5–1 µg m−3
and in concentrations of around 1 µg m−3 over marine re-gions close to anthropogenic sources (e.g., Arabian Sea, Yel-low Sea). The average surface concentration of fSOA is0.26 µg m−3 with 73 % of it originating from the oxidation ofIVOC emissions. This result supports the hypothesis of sev-eral recent studies that IVOC emission and oxidation may bea significant SOA source that has been missing from chem-istry climate models (Jathar et al., 2011; Tsimpidi et al.,2014). The relatively small contribution (25 %) of SVOCs tototal fSOA follows from its low emissions compared to theIVOCs (2 times lower) and by the fact that a significant frac-tion of SVOCs stays in the aerosol phase (as POA) withoutundergoing chemical reactions (Tsimpidi et al., 2014).
The fraction of fossil and biofuel combustion OA (fOA)that is formed through the oxidation of gas-phase species,fSOA/fOA, is consistently high with values ranging fromaround 20 % close to the sources to 100 % away in remoteregions with a global average of 83 % at the surface (Fig. 5a).This suggests that over urban areas both fPOA and fSOA
Atmos. Chem. Phys., 16, 8939–8962, 2016 www.atmos-chem-phys.net/16/8939/2016/
A. P. Tsimpidi et al.: Global combustion sources of organic aerosols 8945
LongitudeLongitude
Latit
ude
Latit
ude
160º W 60º W 40º E 140º E 160º W 60º W 40º E 140º E
80º N
40º N
0º
40º S
80º S
80º N
40º N
0º
40º S
80º S
Figure 4. Predicted average surface concentrations (in µg m−3) of (a) POA from fuel combustion sources (fPOA) and (b) SOA from theoxidation of SVOCs and IVOCs from fuel combustion sources (fSOA) during the years 2001–2010.
LongitudeLongitude
Latit
ude
Latit
ude
100º W 0º 100º E
80º N
40º N
0º
40º S
80º S
80º N
40º N
0º
40º S
80º S
100º W 0º 100º E
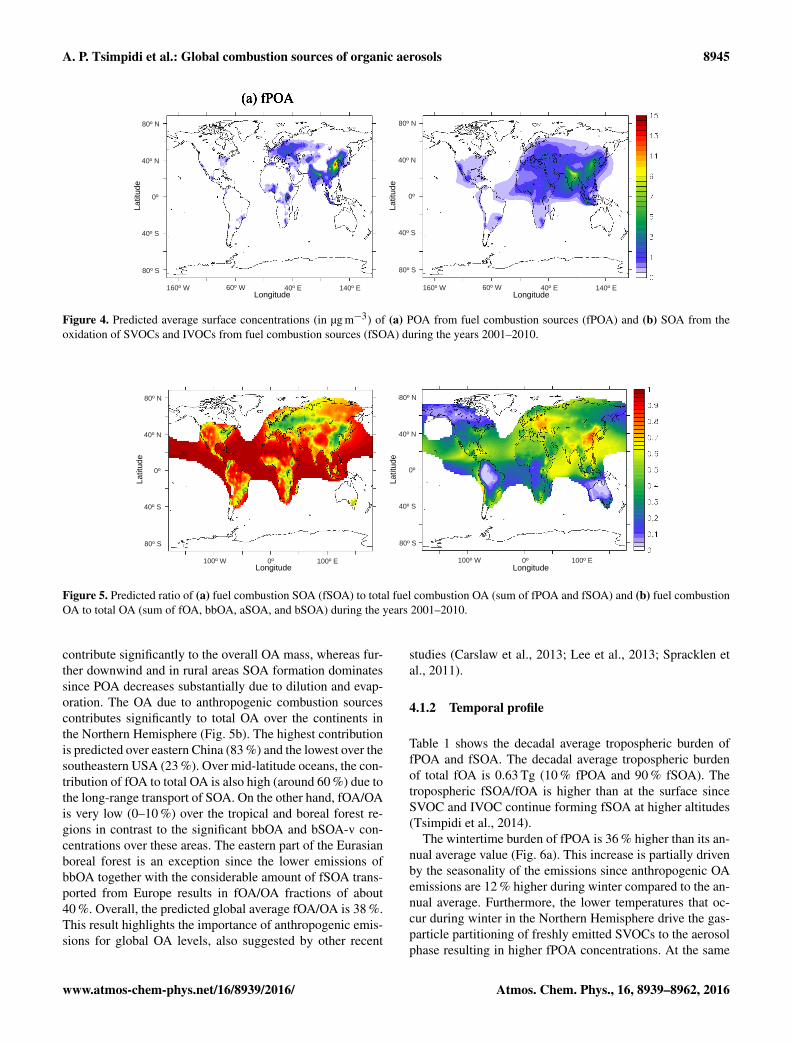
Figure 5. Predicted ratio of (a) fuel combustion SOA (fSOA) to total fuel combustion OA (sum of fPOA and fSOA) and (b) fuel combustionOA to total OA (sum of fOA, bbOA, aSOA, and bSOA) during the years 2001–2010.
contribute significantly to the overall OA mass, whereas fur-ther downwind and in rural areas SOA formation dominatessince POA decreases substantially due to dilution and evap-oration. The OA due to anthropogenic combustion sourcescontributes significantly to total OA over the continents inthe Northern Hemisphere (Fig. 5b). The highest contributionis predicted over eastern China (83 %) and the lowest over thesoutheastern USA (23 %). Over mid-latitude oceans, the con-tribution of fOA to total OA is also high (around 60 %) due tothe long-range transport of SOA. On the other hand, fOA/OAis very low (0–10 %) over the tropical and boreal forest re-gions in contrast to the significant bbOA and bSOA-v con-centrations over these areas. The eastern part of the Eurasianboreal forest is an exception since the lower emissions ofbbOA together with the considerable amount of fSOA trans-ported from Europe results in fOA/OA fractions of about40 %. Overall, the predicted global average fOA/OA is 38 %.This result highlights the importance of anthropogenic emis-sions for global OA levels, also suggested by other recent
studies (Carslaw et al., 2013; Lee et al., 2013; Spracklen etal., 2011).
4.1.2 Temporal profile
Table 1 shows the decadal average tropospheric burden offPOA and fSOA. The decadal average tropospheric burdenof total fOA is 0.63 Tg (10 % fPOA and 90 % fSOA). Thetropospheric fSOA/fOA is higher than at the surface sinceSVOC and IVOC continue forming fSOA at higher altitudes(Tsimpidi et al., 2014).
The wintertime burden of fPOA is 36 % higher than its an-nual average value (Fig. 6a). This increase is partially drivenby the seasonality of the emissions since anthropogenic OAemissions are 12 % higher during winter compared to the an-nual average. Furthermore, the lower temperatures that oc-cur during winter in the Northern Hemisphere drive the gas-particle partitioning of freshly emitted SVOCs to the aerosolphase resulting in higher fPOA concentrations. At the same
www.atmos-chem-phys.net/16/8939/2016/ Atmos. Chem. Phys., 16, 8939–8962, 2016
8946 A. P. Tsimpidi et al.: Global combustion sources of organic aerosols
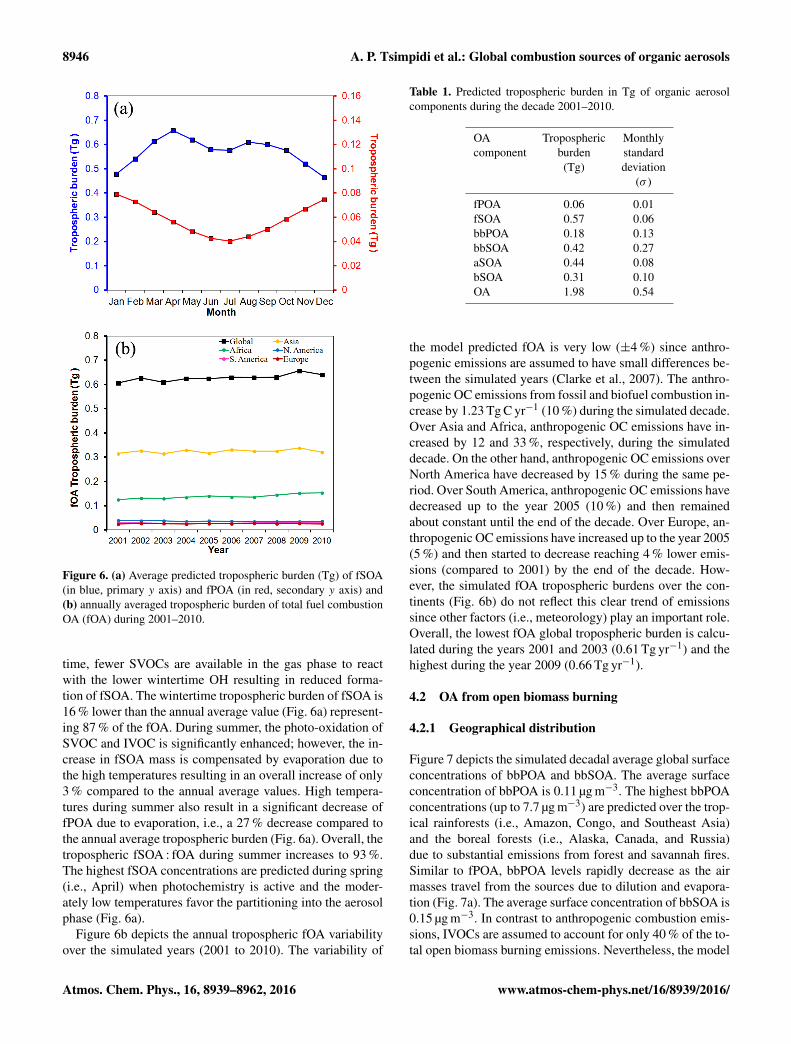
Figure 6. (a) Average predicted tropospheric burden (Tg) of fSOA(in blue, primary y axis) and fPOA (in red, secondary y axis) and(b) annually averaged tropospheric burden of total fuel combustionOA (fOA) during 2001–2010.
time, fewer SVOCs are available in the gas phase to reactwith the lower wintertime OH resulting in reduced forma-tion of fSOA. The wintertime tropospheric burden of fSOA is16 % lower than the annual average value (Fig. 6a) represent-ing 87 % of the fOA. During summer, the photo-oxidation ofSVOC and IVOC is significantly enhanced; however, the in-crease in fSOA mass is compensated by evaporation due tothe high temperatures resulting in an overall increase of only3 % compared to the annual average values. High tempera-tures during summer also result in a significant decrease offPOA due to evaporation, i.e., a 27 % decrease compared tothe annual average tropospheric burden (Fig. 6a). Overall, thetropospheric fSOA : fOA during summer increases to 93 %.The highest fSOA concentrations are predicted during spring(i.e., April) when photochemistry is active and the moder-ately low temperatures favor the partitioning into the aerosolphase (Fig. 6a).
Figure 6b depicts the annual tropospheric fOA variabilityover the simulated years (2001 to 2010). The variability of
Table 1. Predicted tropospheric burden in Tg of organic aerosolcomponents during the decade 2001–2010.
OA Tropospheric Monthlycomponent burden standard
(Tg) deviation(σ )
fPOA 0.06 0.01fSOA 0.57 0.06bbPOA 0.18 0.13bbSOA 0.42 0.27aSOA 0.44 0.08bSOA 0.31 0.10OA 1.98 0.54
the model predicted fOA is very low (±4 %) since anthro-pogenic emissions are assumed to have small differences be-tween the simulated years (Clarke et al., 2007). The anthro-pogenic OC emissions from fossil and biofuel combustion in-crease by 1.23 Tg C yr−1 (10 %) during the simulated decade.Over Asia and Africa, anthropogenic OC emissions have in-creased by 12 and 33 %, respectively, during the simulateddecade. On the other hand, anthropogenic OC emissions overNorth America have decreased by 15 % during the same pe-riod. Over South America, anthropogenic OC emissions havedecreased up to the year 2005 (10 %) and then remainedabout constant until the end of the decade. Over Europe, an-thropogenic OC emissions have increased up to the year 2005(5 %) and then started to decrease reaching 4 % lower emis-sions (compared to 2001) by the end of the decade. How-ever, the simulated fOA tropospheric burdens over the con-tinents (Fig. 6b) do not reflect this clear trend of emissionssince other factors (i.e., meteorology) play an important role.Overall, the lowest fOA global tropospheric burden is calcu-lated during the years 2001 and 2003 (0.61 Tg yr−1) and thehighest during the year 2009 (0.66 Tg yr−1).
4.2 OA from open biomass burning
4.2.1 Geographical distribution
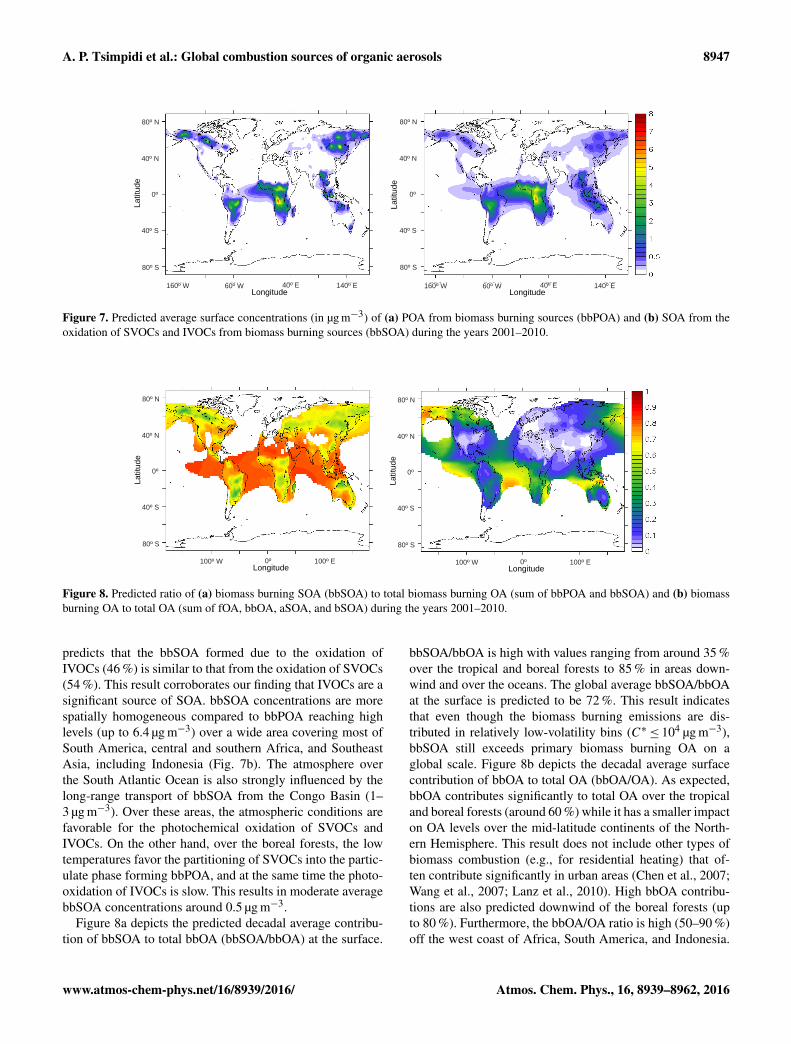
Figure 7 depicts the simulated decadal average global surfaceconcentrations of bbPOA and bbSOA. The average surfaceconcentration of bbPOA is 0.11 µg m−3. The highest bbPOAconcentrations (up to 7.7 µg m−3) are predicted over the trop-ical rainforests (i.e., Amazon, Congo, and Southeast Asia)and the boreal forests (i.e., Alaska, Canada, and Russia)due to substantial emissions from forest and savannah fires.Similar to fPOA, bbPOA levels rapidly decrease as the airmasses travel from the sources due to dilution and evapora-tion (Fig. 7a). The average surface concentration of bbSOA is0.15 µg m−3. In contrast to anthropogenic combustion emis-sions, IVOCs are assumed to account for only 40 % of the to-tal open biomass burning emissions. Nevertheless, the model
Atmos. Chem. Phys., 16, 8939–8962, 2016 www.atmos-chem-phys.net/16/8939/2016/
A. P. Tsimpidi et al.: Global combustion sources of organic aerosols 8947
Longitude
Latit
ude
160º W
80º N
40º N
0º
40º S
80º S
80º N
40º N
0º
40º S
80º S
140º E 60º W 40º E
Latit
ude
Longitude160º W 140º E 60º W 40º E
Figure 7. Predicted average surface concentrations (in µg m−3) of (a) POA from biomass burning sources (bbPOA) and (b) SOA from theoxidation of SVOCs and IVOCs from biomass burning sources (bbSOA) during the years 2001–2010.
Longitude
Latit
ude
100º W 0º
80º N
40º N
0º
40º S
80º S
100º E Longitude
Latit
ude
100º W 0º
80º N
40º N
0º
40º S
80º S
100º E
Figure 8. Predicted ratio of (a) biomass burning SOA (bbSOA) to total biomass burning OA (sum of bbPOA and bbSOA) and (b) biomassburning OA to total OA (sum of fOA, bbOA, aSOA, and bSOA) during the years 2001–2010.
predicts that the bbSOA formed due to the oxidation ofIVOCs (46 %) is similar to that from the oxidation of SVOCs(54 %). This result corroborates our finding that IVOCs are asignificant source of SOA. bbSOA concentrations are morespatially homogeneous compared to bbPOA reaching highlevels (up to 6.4 µg m−3) over a wide area covering most ofSouth America, central and southern Africa, and SoutheastAsia, including Indonesia (Fig. 7b). The atmosphere overthe South Atlantic Ocean is also strongly influenced by thelong-range transport of bbSOA from the Congo Basin (1–3 µg m−3). Over these areas, the atmospheric conditions arefavorable for the photochemical oxidation of SVOCs andIVOCs. On the other hand, over the boreal forests, the lowtemperatures favor the partitioning of SVOCs into the partic-ulate phase forming bbPOA, and at the same time the photo-oxidation of IVOCs is slow. This results in moderate averagebbSOA concentrations around 0.5 µg m−3.
Figure 8a depicts the predicted decadal average contribu-tion of bbSOA to total bbOA (bbSOA/bbOA) at the surface.
bbSOA/bbOA is high with values ranging from around 35 %over the tropical and boreal forests to 85 % in areas down-wind and over the oceans. The global average bbSOA/bbOAat the surface is predicted to be 72 %. This result indicatesthat even though the biomass burning emissions are dis-tributed in relatively low-volatility bins (C∗≤ 104 µg m−3),bbSOA still exceeds primary biomass burning OA on aglobal scale. Figure 8b depicts the decadal average surfacecontribution of bbOA to total OA (bbOA/OA). As expected,bbOA contributes significantly to total OA over the tropicaland boreal forests (around 60 %) while it has a smaller impacton OA levels over the mid-latitude continents of the North-ern Hemisphere. This result does not include other types ofbiomass combustion (e.g., for residential heating) that of-ten contribute significantly in urban areas (Chen et al., 2007;Wang et al., 2007; Lanz et al., 2010). High bbOA contribu-tions are also predicted downwind of the boreal forests (upto 80 %). Furthermore, the bbOA/OA ratio is high (50–90 %)off the west coast of Africa, South America, and Indonesia.
www.atmos-chem-phys.net/16/8939/2016/ Atmos. Chem. Phys., 16, 8939–8962, 2016
8948 A. P. Tsimpidi et al.: Global combustion sources of organic aerosols
These high values are due to the chemical aging of biomassburning SVOCs and IVOCs in contrast to the chemical prod-ucts of biogenic VOCs, which are not allowed to partici-pate in additional photochemical reactions (Tsimpidi et al.,2014). Overall, the global average bbOA/OA is predicted tobe 26 %.
4.2.2 Temporal evolution
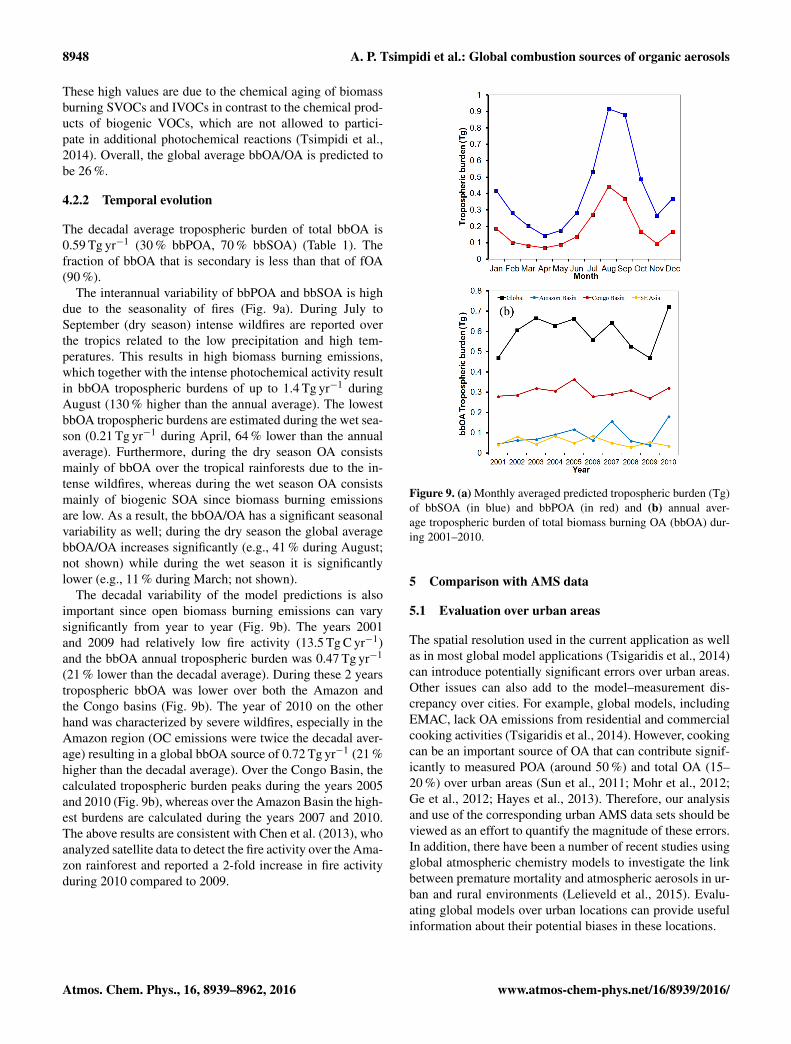
The decadal average tropospheric burden of total bbOA is0.59 Tg yr−1 (30 % bbPOA, 70 % bbSOA) (Table 1). Thefraction of bbOA that is secondary is less than that of fOA(90 %).
The interannual variability of bbPOA and bbSOA is highdue to the seasonality of fires (Fig. 9a). During July toSeptember (dry season) intense wildfires are reported overthe tropics related to the low precipitation and high tem-peratures. This results in high biomass burning emissions,which together with the intense photochemical activity resultin bbOA tropospheric burdens of up to 1.4 Tg yr−1 duringAugust (130 % higher than the annual average). The lowestbbOA tropospheric burdens are estimated during the wet sea-son (0.21 Tg yr−1 during April, 64 % lower than the annualaverage). Furthermore, during the dry season OA consistsmainly of bbOA over the tropical rainforests due to the in-tense wildfires, whereas during the wet season OA consistsmainly of biogenic SOA since biomass burning emissionsare low. As a result, the bbOA/OA has a significant seasonalvariability as well; during the dry season the global averagebbOA/OA increases significantly (e.g., 41 % during August;not shown) while during the wet season it is significantlylower (e.g., 11 % during March; not shown).
The decadal variability of the model predictions is alsoimportant since open biomass burning emissions can varysignificantly from year to year (Fig. 9b). The years 2001and 2009 had relatively low fire activity (13.5 Tg C yr−1)and the bbOA annual tropospheric burden was 0.47 Tg yr−1
(21 % lower than the decadal average). During these 2 yearstropospheric bbOA was lower over both the Amazon andthe Congo basins (Fig. 9b). The year of 2010 on the otherhand was characterized by severe wildfires, especially in theAmazon region (OC emissions were twice the decadal aver-age) resulting in a global bbOA source of 0.72 Tg yr−1 (21 %higher than the decadal average). Over the Congo Basin, thecalculated tropospheric burden peaks during the years 2005and 2010 (Fig. 9b), whereas over the Amazon Basin the high-est burdens are calculated during the years 2007 and 2010.The above results are consistent with Chen et al. (2013), whoanalyzed satellite data to detect the fire activity over the Ama-zon rainforest and reported a 2-fold increase in fire activityduring 2010 compared to 2009.
Figure 9. (a) Monthly averaged predicted tropospheric burden (Tg)of bbSOA (in blue) and bbPOA (in red) and (b) annual aver-age tropospheric burden of total biomass burning OA (bbOA) dur-ing 2001–2010.
5 Comparison with AMS data
5.1 Evaluation over urban areas
The spatial resolution used in the current application as wellas in most global model applications (Tsigaridis et al., 2014)can introduce potentially significant errors over urban areas.Other issues can also add to the model–measurement dis-crepancy over cities. For example, global models, includingEMAC, lack OA emissions from residential and commercialcooking activities (Tsigaridis et al., 2014). However, cookingcan be an important source of OA that can contribute signif-icantly to measured POA (around 50 %) and total OA (15–20 %) over urban areas (Sun et al., 2011; Mohr et al., 2012;Ge et al., 2012; Hayes et al., 2013). Therefore, our analysisand use of the corresponding urban AMS data sets should beviewed as an effort to quantify the magnitude of these errors.In addition, there have been a number of recent studies usingglobal atmospheric chemistry models to investigate the linkbetween premature mortality and atmospheric aerosols in ur-ban and rural environments (Lelieveld et al., 2015). Evalu-ating global models over urban locations can provide usefulinformation about their potential biases in these locations.
Atmos. Chem. Phys., 16, 8939–8962, 2016 www.atmos-chem-phys.net/16/8939/2016/
A. P. Tsimpidi et al.: Global combustion sources of organic aerosols 8949
Urban Urban downwind Rural/remote
Urban Urban downwind Rural/remote
Urban Urban downwind Rural/remote
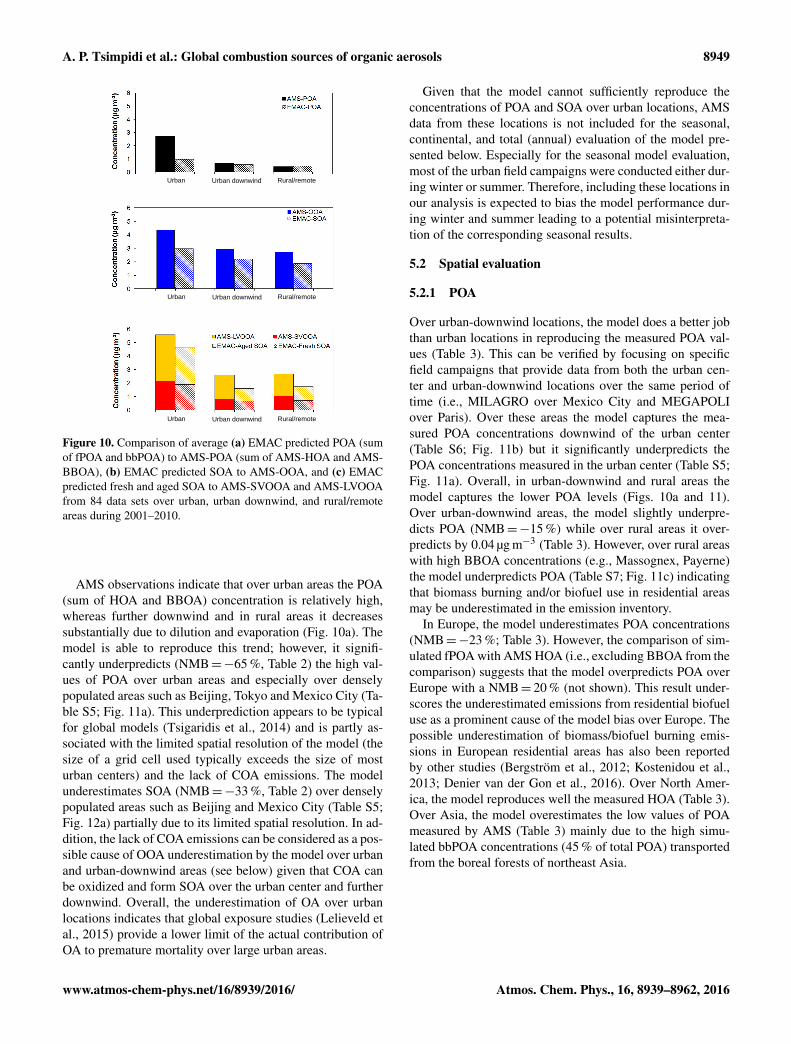
Figure 10. Comparison of average (a) EMAC predicted POA (sumof fPOA and bbPOA) to AMS-POA (sum of AMS-HOA and AMS-BBOA), (b) EMAC predicted SOA to AMS-OOA, and (c) EMACpredicted fresh and aged SOA to AMS-SVOOA and AMS-LVOOAfrom 84 data sets over urban, urban downwind, and rural/remoteareas during 2001–2010.
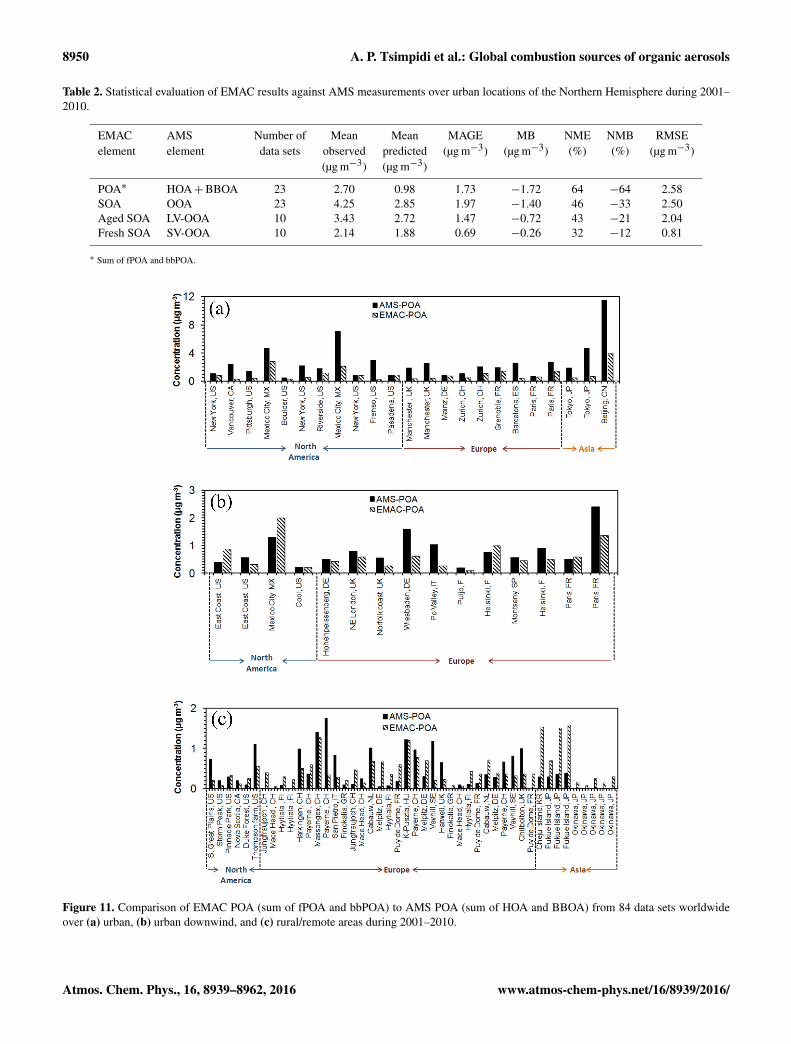
AMS observations indicate that over urban areas the POA(sum of HOA and BBOA) concentration is relatively high,whereas further downwind and in rural areas it decreasessubstantially due to dilution and evaporation (Fig. 10a). Themodel is able to reproduce this trend; however, it signifi-cantly underpredicts (NMB=−65 %, Table 2) the high val-ues of POA over urban areas and especially over denselypopulated areas such as Beijing, Tokyo and Mexico City (Ta-ble S5; Fig. 11a). This underprediction appears to be typicalfor global models (Tsigaridis et al., 2014) and is partly as-sociated with the limited spatial resolution of the model (thesize of a grid cell used typically exceeds the size of mosturban centers) and the lack of COA emissions. The modelunderestimates SOA (NMB=−33 %, Table 2) over denselypopulated areas such as Beijing and Mexico City (Table S5;Fig. 12a) partially due to its limited spatial resolution. In ad-dition, the lack of COA emissions can be considered as a pos-sible cause of OOA underestimation by the model over urbanand urban-downwind areas (see below) given that COA canbe oxidized and form SOA over the urban center and furtherdownwind. Overall, the underestimation of OA over urbanlocations indicates that global exposure studies (Lelieveld etal., 2015) provide a lower limit of the actual contribution ofOA to premature mortality over large urban areas.
Given that the model cannot sufficiently reproduce theconcentrations of POA and SOA over urban locations, AMSdata from these locations is not included for the seasonal,continental, and total (annual) evaluation of the model pre-sented below. Especially for the seasonal model evaluation,most of the urban field campaigns were conducted either dur-ing winter or summer. Therefore, including these locations inour analysis is expected to bias the model performance dur-ing winter and summer leading to a potential misinterpreta-tion of the corresponding seasonal results.
5.2 Spatial evaluation
5.2.1 POA
Over urban-downwind locations, the model does a better jobthan urban locations in reproducing the measured POA val-ues (Table 3). This can be verified by focusing on specificfield campaigns that provide data from both the urban cen-ter and urban-downwind locations over the same period oftime (i.e., MILAGRO over Mexico City and MEGAPOLIover Paris). Over these areas the model captures the mea-sured POA concentrations downwind of the urban center(Table S6; Fig. 11b) but it significantly underpredicts thePOA concentrations measured in the urban center (Table S5;Fig. 11a). Overall, in urban-downwind and rural areas themodel captures the lower POA levels (Figs. 10a and 11).Over urban-downwind areas, the model slightly underpre-dicts POA (NMB=−15 %) while over rural areas it over-predicts by 0.04 µg m−3 (Table 3). However, over rural areaswith high BBOA concentrations (e.g., Massognex, Payerne)the model underpredicts POA (Table S7; Fig. 11c) indicatingthat biomass burning and/or biofuel use in residential areasmay be underestimated in the emission inventory.
In Europe, the model underestimates POA concentrations(NMB=−23 %; Table 3). However, the comparison of sim-ulated fPOA with AMS HOA (i.e., excluding BBOA from thecomparison) suggests that the model overpredicts POA overEurope with a NMB= 20 % (not shown). This result under-scores the underestimated emissions from residential biofueluse as a prominent cause of the model bias over Europe. Thepossible underestimation of biomass/biofuel burning emis-sions in European residential areas has also been reportedby other studies (Bergström et al., 2012; Kostenidou et al.,2013; Denier van der Gon et al., 2016). Over North Amer-ica, the model reproduces well the measured HOA (Table 3).Over Asia, the model overestimates the low values of POAmeasured by AMS (Table 3) mainly due to the high simu-lated bbPOA concentrations (45 % of total POA) transportedfrom the boreal forests of northeast Asia.
www.atmos-chem-phys.net/16/8939/2016/ Atmos. Chem. Phys., 16, 8939–8962, 2016
8950 A. P. Tsimpidi et al.: Global combustion sources of organic aerosols
Table 2. Statistical evaluation of EMAC results against AMS measurements over urban locations of the Northern Hemisphere during 2001–2010.
EMAC AMS Number of Mean Mean MAGE MB NME NMB RMSEelement element data sets observed predicted (µg m−3) (µg m−3) (%) (%) (µg m−3)
(µg m−3) (µg m−3)
POA∗ HOA+BBOA 23 2.70 0.98 1.73 −1.72 64 −64 2.58SOA OOA 23 4.25 2.85 1.97 −1.40 46 −33 2.50Aged SOA LV-OOA 10 3.43 2.72 1.47 −0.72 43 −21 2.04Fresh SOA SV-OOA 10 2.14 1.88 0.69 −0.26 32 −12 0.81
∗ Sum of fPOA and bbPOA.
Figure 11. Comparison of EMAC POA (sum of fPOA and bbPOA) to AMS POA (sum of HOA and BBOA) from 84 data sets worldwideover (a) urban, (b) urban downwind, and (c) rural/remote areas during 2001–2010.
Atmos. Chem. Phys., 16, 8939–8962, 2016 www.atmos-chem-phys.net/16/8939/2016/
A. P. Tsimpidi et al.: Global combustion sources of organic aerosols 8951
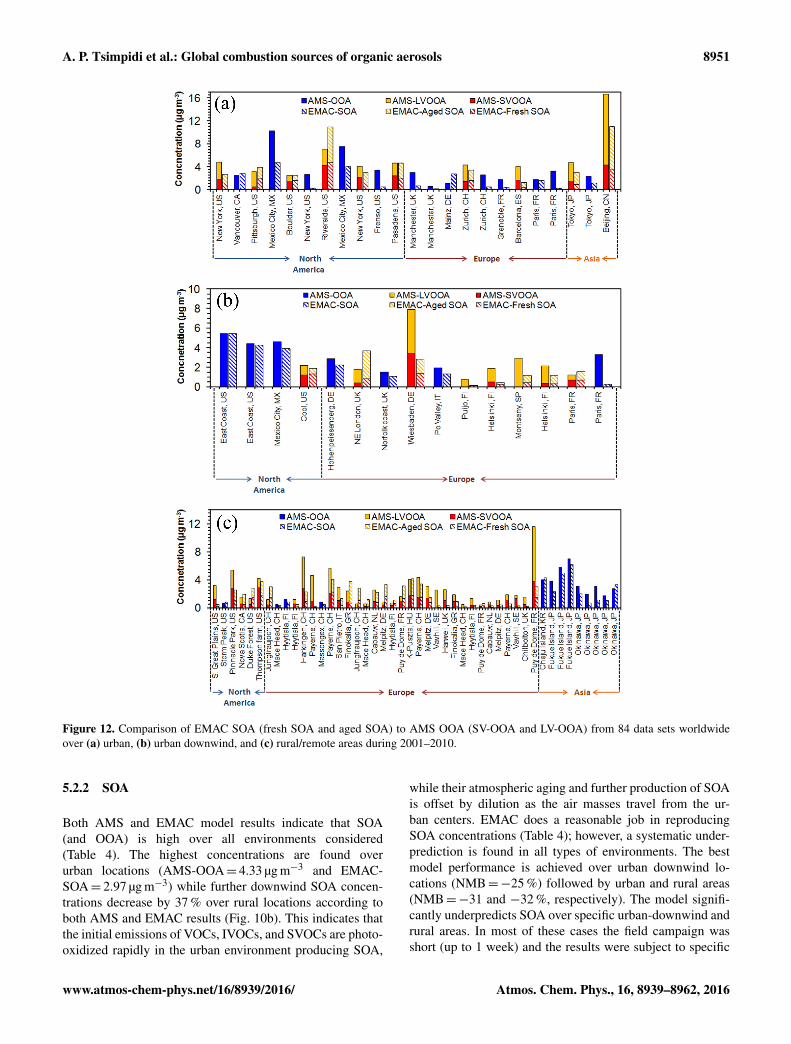
Figure 12. Comparison of EMAC SOA (fresh SOA and aged SOA) to AMS OOA (SV-OOA and LV-OOA) from 84 data sets worldwideover (a) urban, (b) urban downwind, and (c) rural/remote areas during 2001–2010.
5.2.2 SOA
Both AMS and EMAC model results indicate that SOA(and OOA) is high over all environments considered(Table 4). The highest concentrations are found overurban locations (AMS-OOA= 4.33 µg m−3 and EMAC-SOA= 2.97 µg m−3) while further downwind SOA concen-trations decrease by 37 % over rural locations according toboth AMS and EMAC results (Fig. 10b). This indicates thatthe initial emissions of VOCs, IVOCs, and SVOCs are photo-oxidized rapidly in the urban environment producing SOA,
while their atmospheric aging and further production of SOAis offset by dilution as the air masses travel from the ur-ban centers. EMAC does a reasonable job in reproducingSOA concentrations (Table 4); however, a systematic under-prediction is found in all types of environments. The bestmodel performance is achieved over urban downwind lo-cations (NMB=−25 %) followed by urban and rural areas(NMB=−31 and −32 %, respectively). The model signifi-cantly underpredicts SOA over specific urban-downwind andrural areas. In most of these cases the field campaign wasshort (up to 1 week) and the results were subject to specific
www.atmos-chem-phys.net/16/8939/2016/ Atmos. Chem. Phys., 16, 8939–8962, 2016
8952 A. P. Tsimpidi et al.: Global combustion sources of organic aerosols
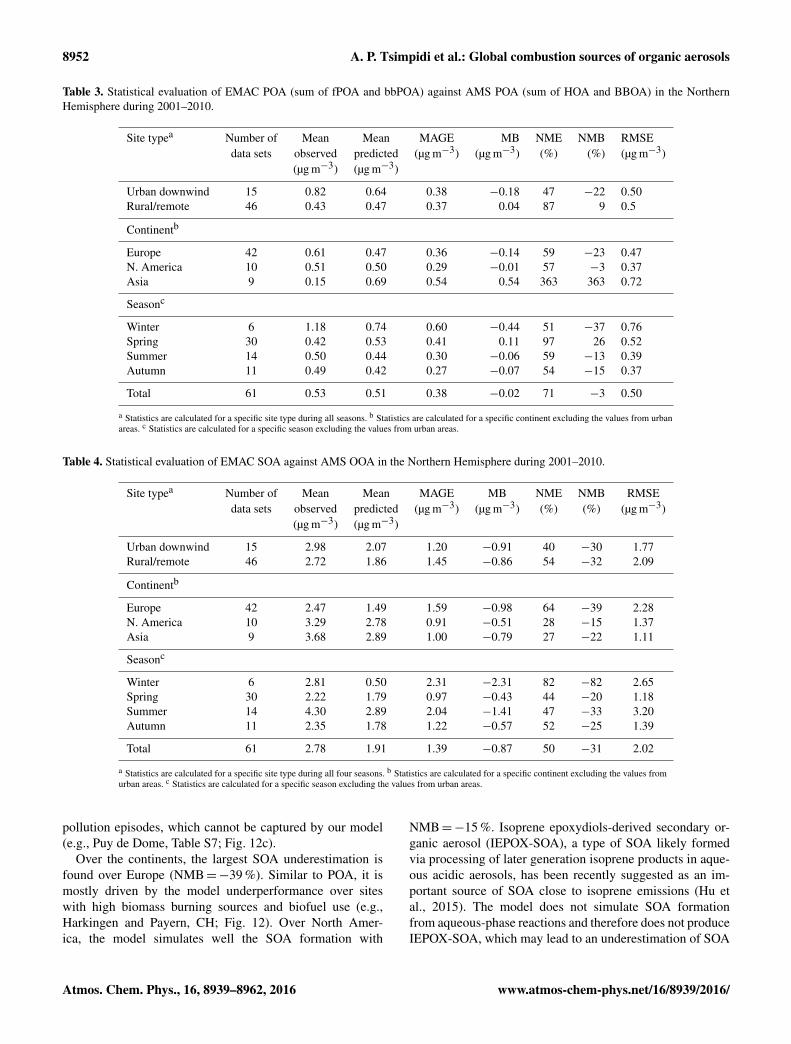
Table 3. Statistical evaluation of EMAC POA (sum of fPOA and bbPOA) against AMS POA (sum of HOA and BBOA) in the NorthernHemisphere during 2001–2010.
Site typea Number of Mean Mean MAGE MB NME NMB RMSEdata sets observed predicted (µg m−3) (µg m−3) (%) (%) (µg m−3)
(µg m−3) (µg m−3)
Urban downwind 15 0.82 0.64 0.38 −0.18 47 −22 0.50Rural/remote 46 0.43 0.47 0.37 0.04 87 9 0.5
Continentb
Europe 42 0.61 0.47 0.36 −0.14 59 −23 0.47N. America 10 0.51 0.50 0.29 −0.01 57 −3 0.37Asia 9 0.15 0.69 0.54 0.54 363 363 0.72
Seasonc
Winter 6 1.18 0.74 0.60 −0.44 51 −37 0.76Spring 30 0.42 0.53 0.41 0.11 97 26 0.52Summer 14 0.50 0.44 0.30 −0.06 59 −13 0.39Autumn 11 0.49 0.42 0.27 −0.07 54 −15 0.37
Total 61 0.53 0.51 0.38 −0.02 71 −3 0.50
a Statistics are calculated for a specific site type during all seasons. b Statistics are calculated for a specific continent excluding the values from urbanareas. c Statistics are calculated for a specific season excluding the values from urban areas.
Table 4. Statistical evaluation of EMAC SOA against AMS OOA in the Northern Hemisphere during 2001–2010.
Site typea Number of Mean Mean MAGE MB NME NMB RMSEdata sets observed predicted (µg m−3) (µg m−3) (%) (%) (µg m−3)
(µg m−3) (µg m−3)
Urban downwind 15 2.98 2.07 1.20 −0.91 40 −30 1.77Rural/remote 46 2.72 1.86 1.45 −0.86 54 −32 2.09
Continentb
Europe 42 2.47 1.49 1.59 −0.98 64 −39 2.28N. America 10 3.29 2.78 0.91 −0.51 28 −15 1.37Asia 9 3.68 2.89 1.00 −0.79 27 −22 1.11
Seasonc
Winter 6 2.81 0.50 2.31 −2.31 82 −82 2.65Spring 30 2.22 1.79 0.97 −0.43 44 −20 1.18Summer 14 4.30 2.89 2.04 −1.41 47 −33 3.20Autumn 11 2.35 1.78 1.22 −0.57 52 −25 1.39
Total 61 2.78 1.91 1.39 −0.87 50 −31 2.02
a Statistics are calculated for a specific site type during all four seasons. b Statistics are calculated for a specific continent excluding the values fromurban areas. c Statistics are calculated for a specific season excluding the values from urban areas.
pollution episodes, which cannot be captured by our model(e.g., Puy de Dome, Table S7; Fig. 12c).
Over the continents, the largest SOA underestimation isfound over Europe (NMB=−39 %). Similar to POA, it ismostly driven by the model underperformance over siteswith high biomass burning sources and biofuel use (e.g.,Harkingen and Payern, CH; Fig. 12). Over North Amer-ica, the model simulates well the SOA formation with
NMB=−15 %. Isoprene epoxydiols-derived secondary or-ganic aerosol (IEPOX-SOA), a type of SOA likely formedvia processing of later generation isoprene products in aque-ous acidic aerosols, has been recently suggested as an im-portant source of SOA close to isoprene emissions (Hu etal., 2015). The model does not simulate SOA formationfrom aqueous-phase reactions and therefore does not produceIEPOX-SOA, which may lead to an underestimation of SOA
Atmos. Chem. Phys., 16, 8939–8962, 2016 www.atmos-chem-phys.net/16/8939/2016/
A. P. Tsimpidi et al.: Global combustion sources of organic aerosols 8953
over some sites in North America that are strongly influencedby isoprene emissions (e.g., over the Pinnacle state park, NY;Table S7; Fig. 12c). Over Asia, the model slightly underesti-mates SOA with NMB=−22 % (Table 4; Fig. 12).
In most of the available data sets (41 out of 84), PMF pro-vides information for the two subtypes of OOA (LV-OOAand SV-OOA). Both PMF and EMAC results indicate thataged SOA (or LV-OOA) is higher than fresh SOA (or SV-OOA) regardless of the type of environment (Tables 5 and 6).However, in North America, AMS SV-OOA is slightly higherthan LV-OOA while EMAC calculations indicate the oppo-site (Tables 5 and 6). Despite this discrepancy, the modelreproduce well both the fresh SOA (NMB=−29 %) andaged SOA (NMB=−20 %) over North America while overEurope the underestimation is larger (Tables 5 and 6). TheEMAC performance is better over urban locations where itreproduces the high levels of aged SOA with NMB=−21 %and NME= 43 % (Table 2). Over urban-downwind and rurallocations EMAC underpredicts aged SOA with NMB=−47and −38 %, respectively (Table 5). The performance of themodel for fresh SOA is better compared to aged SOA (Ta-ble 5), with the exception of North America, indicating thatthe modeled OA aging parameterization may underestimatethe SOA produced from chemical reactions during transportand requires improvements. Similar to aged SOA, the bestperformance of the model for fresh SOA is obtained over ur-ban locations (NMB=−12 %).
5.3 Seasonal evaluation
5.3.1 POA
The model performs best during summer (RMSE= 0.4,NMB=−3 %), followed by autumn (RMSE= 0.37,NMB=−15 %) and spring (RMSE= 0.52, NMB= 21 %).During winter EMAC underpredicts POA withNMB=−34 % (Table 3; Fig. 13a). This result corrob-orates our hypothesis that residential biofuel emissions maybe underestimated in the inventory since residential heatingis expected during winter. Furthermore, since vehicle cata-lysts require a certain temperature to work to full efficiency,emissions from gasoline and diesel engines are significantlyhigher during the warm-up phase of the car (Westerholmet al., 1996). Typically, the additional emissions during thewarm-up phase (or cold-start emissions) are not accountedfor in emission inventories, which are based on measure-ments at an ambient temperature of 23 ◦C (Weilenmann etal., 2009). However, cold-start emissions increase consider-ably at lower ambient temperatures varying by more than 1order of magnitude between 23 and −20 ◦C (Weilenmannet al., 2009), and thus significant underestimations of OAemissions from the transport sector can be expected duringwintertime. Kopacz et al. (2010) provided a global estimateof CO sources by adjoint inversion of satellite data setsand reported an underestimation of CO sources during the
winter season due to larger than expected CO emissionsfrom vehicle cold starts and residential heating. Errors inthe POA volatility distributions can also explain parts of themodel–measurement discrepancy. An overestimation of thefresh POA volatility will favor its evaporation resulting inan underestimation of POA levels by the model. Anothersource of the POA underestimation by EMAC may be thetreatment of wet deposition. The sensitivity of the resultsto the emission and deposition parameterizations (e.g., theHenry’s law constants for the organic vapors) will be testedin a subsequent article in preparation.
According to recent studies (Cappa and Wilson, 2012; Au-mont et al., 2012; Zhang et al., 2013), not all oxidation prod-ucts of SVOCs and IVOCs can be assigned to the OOA massfraction since they are not sufficiently oxidized. Fountoukiset al. (2014) assumed that 50 % of the simulated SOA-svand SOA-iv is still considered as HOA by the AMS analy-sis and found significant improvements in view of the mod-eled bias for POA. In this study we tested this hypothesisand we considered POA to be the sum of fPOA and bbPOAand 50 % of the SOA-sv and SOA-iv produced from thefirst oxidation step of SVOCs and IVOCs, respectively. Weassumed that SOA-sv and SOA-iv produced during subse-quent oxidation steps together with all the SOA-v are suf-ficiently oxidized to be considered 100 % OOA. Followingthis hypothesis the model performance improved during win-ter (NME= 55 % µg m−3 and NMB=−28 %) and autumn(NME= 50 % µg m−3 and NMB= 1 %) and deterioratedduring spring (NME= 110 % µg m−3 and NMB= 49 %) andsummer (NME= 71 % µg m−3 and NMB= 16 %) when theoxidation of SVOCs and IVOCs is enhanced significantly.
5.3.2 SOA
The best performance of the model is found for spring(NME= 46 %, NMB=−24 %) followed by the autumn(NME= 52 %, NMB=−25 %) and summer (NME= 44 %,NMB=−28 %) (Table 4; Fig. 13b). However, during win-ter the model strongly underpredicts OOA concentrations(NME= 80 %, NMB=−80 %). The overall underpredictionof OOA concentrations indicates that the model is missing animportant source or formation pathway of SOA. Possible un-derestimation of residential biofuel emissions in our model,identified during the spatial and seasonal evaluation of sim-ulated POA, can lead to an underestimation of SOA formedfrom the oxidation of these emissions during winter. Foun-toukis et al. (2016) also reported low modeled SOA valuescompared to AMS OOA over the Paris region and attributedthis discrepancy to the transformation of BBOA to OOAwithout the presence of sunlight reported by some recentstudies (Bougiatioti et al., 2014; Crippa et al., 2013b). Un-derestimation of cold-start vehicle emissions during wintercan also lead to a significant underestimation of SOA, sinceSOA produced from organic compounds emitted during thewarm-up phase can be 3–7 times higher than SOA produced
www.atmos-chem-phys.net/16/8939/2016/ Atmos. Chem. Phys., 16, 8939–8962, 2016
8954 A. P. Tsimpidi et al.: Global combustion sources of organic aerosols
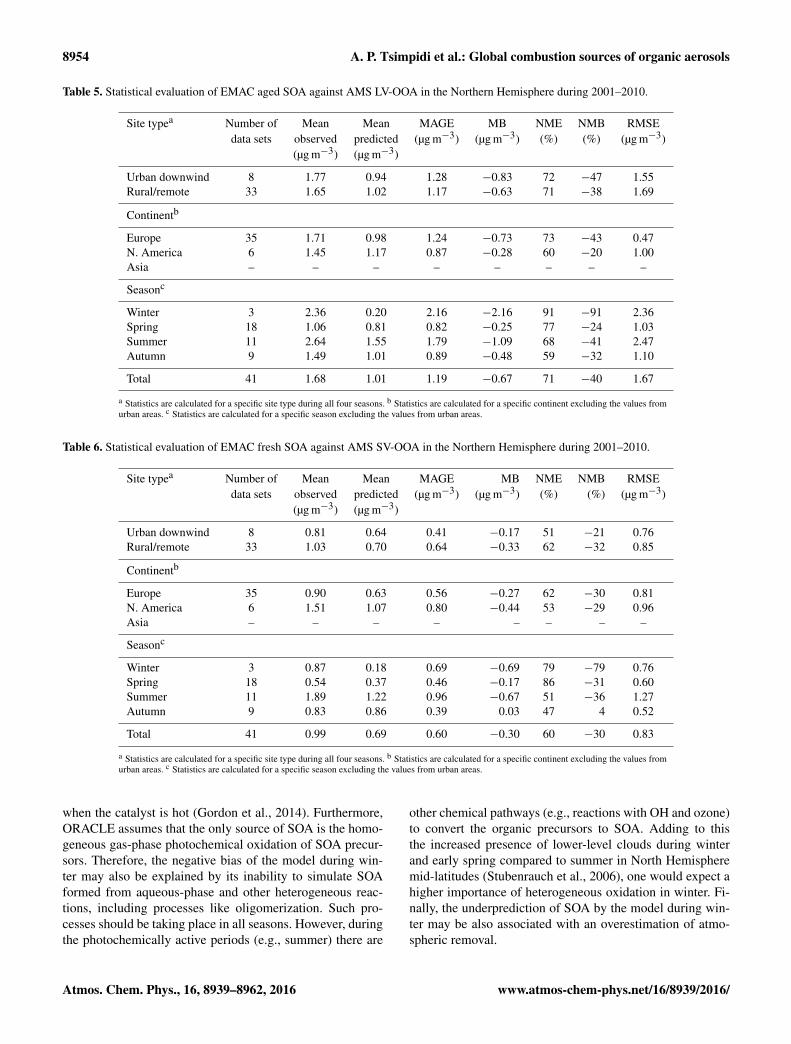
Table 5. Statistical evaluation of EMAC aged SOA against AMS LV-OOA in the Northern Hemisphere during 2001–2010.
Site typea Number of Mean Mean MAGE MB NME NMB RMSEdata sets observed predicted (µg m−3) (µg m−3) (%) (%) (µg m−3)
(µg m−3) (µg m−3)
Urban downwind 8 1.77 0.94 1.28 −0.83 72 −47 1.55Rural/remote 33 1.65 1.02 1.17 −0.63 71 −38 1.69
Continentb
Europe 35 1.71 0.98 1.24 −0.73 73 −43 0.47N. America 6 1.45 1.17 0.87 −0.28 60 −20 1.00Asia – – – – – – – –
Seasonc
Winter 3 2.36 0.20 2.16 −2.16 91 −91 2.36Spring 18 1.06 0.81 0.82 −0.25 77 −24 1.03Summer 11 2.64 1.55 1.79 −1.09 68 −41 2.47Autumn 9 1.49 1.01 0.89 −0.48 59 −32 1.10
Total 41 1.68 1.01 1.19 −0.67 71 −40 1.67
a Statistics are calculated for a specific site type during all four seasons. b Statistics are calculated for a specific continent excluding the values fromurban areas. c Statistics are calculated for a specific season excluding the values from urban areas.
Table 6. Statistical evaluation of EMAC fresh SOA against AMS SV-OOA in the Northern Hemisphere during 2001–2010.
Site typea Number of Mean Mean MAGE MB NME NMB RMSEdata sets observed predicted (µg m−3) (µg m−3) (%) (%) (µg m−3)
(µg m−3) (µg m−3)
Urban downwind 8 0.81 0.64 0.41 −0.17 51 −21 0.76Rural/remote 33 1.03 0.70 0.64 −0.33 62 −32 0.85
Continentb
Europe 35 0.90 0.63 0.56 −0.27 62 −30 0.81N. America 6 1.51 1.07 0.80 −0.44 53 −29 0.96Asia – – – – – – – –
Seasonc
Winter 3 0.87 0.18 0.69 −0.69 79 −79 0.76Spring 18 0.54 0.37 0.46 −0.17 86 −31 0.60Summer 11 1.89 1.22 0.96 −0.67 51 −36 1.27Autumn 9 0.83 0.86 0.39 0.03 47 4 0.52
Total 41 0.99 0.69 0.60 −0.30 60 −30 0.83
a Statistics are calculated for a specific site type during all four seasons. b Statistics are calculated for a specific continent excluding the values fromurban areas. c Statistics are calculated for a specific season excluding the values from urban areas.
when the catalyst is hot (Gordon et al., 2014). Furthermore,ORACLE assumes that the only source of SOA is the homo-geneous gas-phase photochemical oxidation of SOA precur-sors. Therefore, the negative bias of the model during win-ter may also be explained by its inability to simulate SOAformed from aqueous-phase and other heterogeneous reac-tions, including processes like oligomerization. Such pro-cesses should be taking place in all seasons. However, duringthe photochemically active periods (e.g., summer) there are
other chemical pathways (e.g., reactions with OH and ozone)to convert the organic precursors to SOA. Adding to thisthe increased presence of lower-level clouds during winterand early spring compared to summer in North Hemispheremid-latitudes (Stubenrauch et al., 2006), one would expect ahigher importance of heterogeneous oxidation in winter. Fi-nally, the underprediction of SOA by the model during win-ter may be also associated with an overestimation of atmo-spheric removal.
Atmos. Chem. Phys., 16, 8939–8962, 2016 www.atmos-chem-phys.net/16/8939/2016/
A. P. Tsimpidi et al.: Global combustion sources of organic aerosols 8955
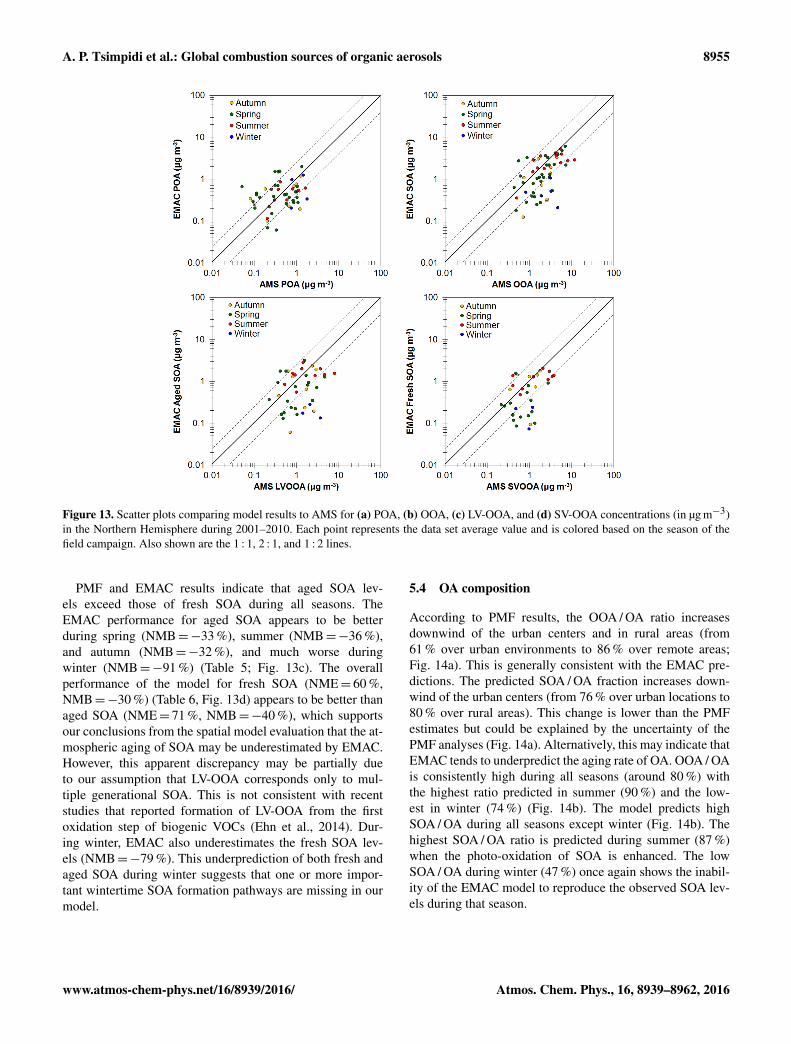
Figure 13. Scatter plots comparing model results to AMS for (a) POA, (b) OOA, (c) LV-OOA, and (d) SV-OOA concentrations (in µg m−3)in the Northern Hemisphere during 2001–2010. Each point represents the data set average value and is colored based on the season of thefield campaign. Also shown are the 1 : 1, 2 : 1, and 1 : 2 lines.
PMF and EMAC results indicate that aged SOA lev-els exceed those of fresh SOA during all seasons. TheEMAC performance for aged SOA appears to be betterduring spring (NMB=−33 %), summer (NMB=−36 %),and autumn (NMB=−32 %), and much worse duringwinter (NMB=−91 %) (Table 5; Fig. 13c). The overallperformance of the model for fresh SOA (NME= 60 %,NMB=−30 %) (Table 6, Fig. 13d) appears to be better thanaged SOA (NME= 71 %, NMB=−40 %), which supportsour conclusions from the spatial model evaluation that the at-mospheric aging of SOA may be underestimated by EMAC.However, this apparent discrepancy may be partially dueto our assumption that LV-OOA corresponds only to mul-tiple generational SOA. This is not consistent with recentstudies that reported formation of LV-OOA from the firstoxidation step of biogenic VOCs (Ehn et al., 2014). Dur-ing winter, EMAC also underestimates the fresh SOA lev-els (NMB=−79 %). This underprediction of both fresh andaged SOA during winter suggests that one or more impor-tant wintertime SOA formation pathways are missing in ourmodel.
5.4 OA composition
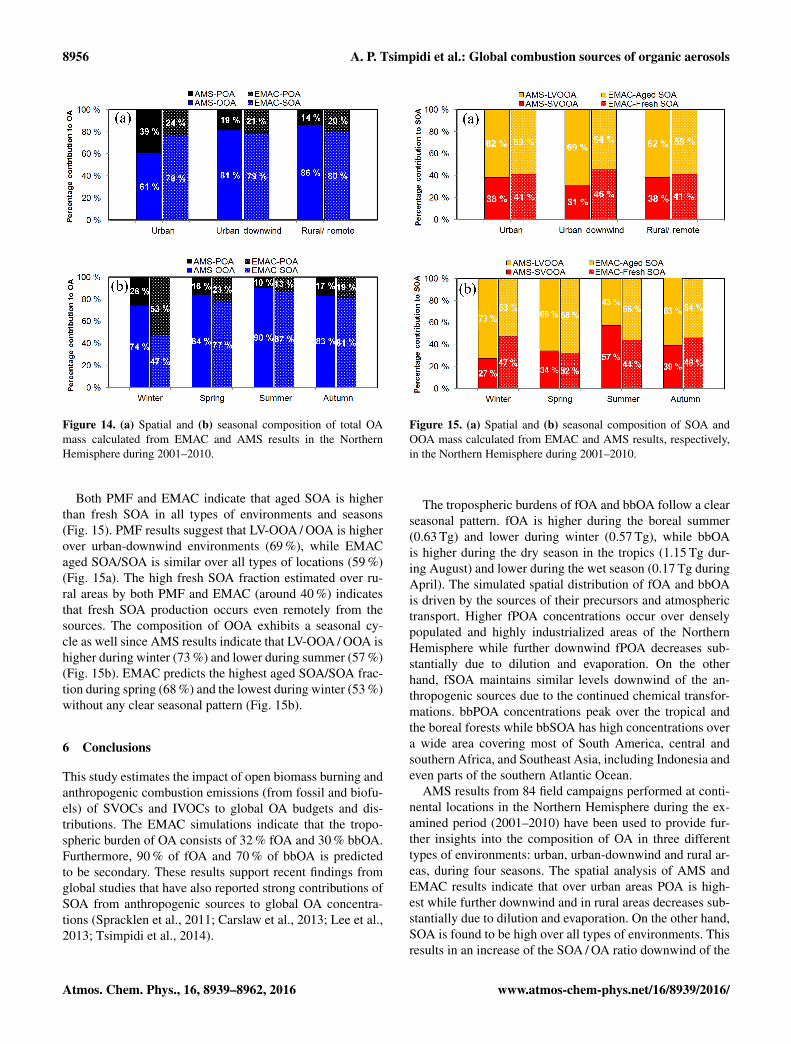
According to PMF results, the OOA / OA ratio increasesdownwind of the urban centers and in rural areas (from61 % over urban environments to 86 % over remote areas;Fig. 14a). This is generally consistent with the EMAC pre-dictions. The predicted SOA / OA fraction increases down-wind of the urban centers (from 76 % over urban locations to80 % over rural areas). This change is lower than the PMFestimates but could be explained by the uncertainty of thePMF analyses (Fig. 14a). Alternatively, this may indicate thatEMAC tends to underpredict the aging rate of OA. OOA / OAis consistently high during all seasons (around 80 %) withthe highest ratio predicted in summer (90 %) and the low-est in winter (74 %) (Fig. 14b). The model predicts highSOA / OA during all seasons except winter (Fig. 14b). Thehighest SOA / OA ratio is predicted during summer (87 %)when the photo-oxidation of SOA is enhanced. The lowSOA / OA during winter (47 %) once again shows the inabil-ity of the EMAC model to reproduce the observed SOA lev-els during that season.
www.atmos-chem-phys.net/16/8939/2016/ Atmos. Chem. Phys., 16, 8939–8962, 2016
8956 A. P. Tsimpidi et al.: Global combustion sources of organic aerosols
Figure 14. (a) Spatial and (b) seasonal composition of total OAmass calculated from EMAC and AMS results in the NorthernHemisphere during 2001–2010.
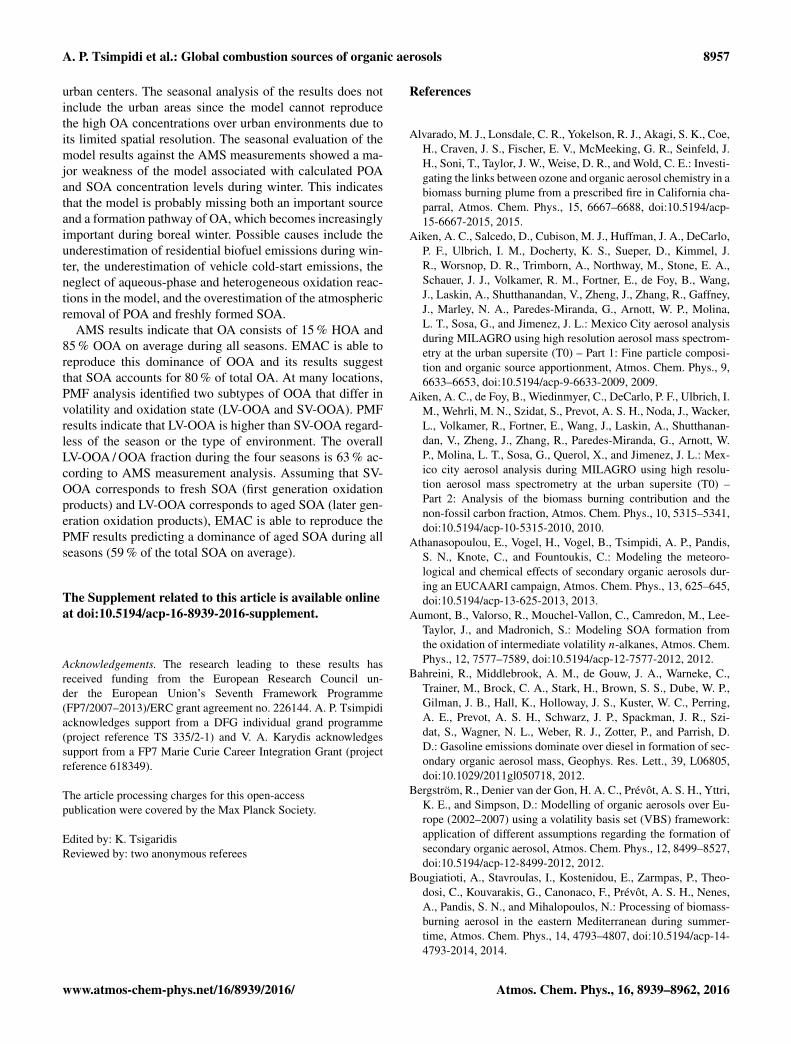
Both PMF and EMAC indicate that aged SOA is higherthan fresh SOA in all types of environments and seasons(Fig. 15). PMF results suggest that LV-OOA / OOA is higherover urban-downwind environments (69 %), while EMACaged SOA/SOA is similar over all types of locations (59 %)(Fig. 15a). The high fresh SOA fraction estimated over ru-ral areas by both PMF and EMAC (around 40 %) indicatesthat fresh SOA production occurs even remotely from thesources. The composition of OOA exhibits a seasonal cy-cle as well since AMS results indicate that LV-OOA / OOA ishigher during winter (73 %) and lower during summer (57 %)(Fig. 15b). EMAC predicts the highest aged SOA/SOA frac-tion during spring (68 %) and the lowest during winter (53 %)without any clear seasonal pattern (Fig. 15b).
6 Conclusions
This study estimates the impact of open biomass burning andanthropogenic combustion emissions (from fossil and biofu-els) of SVOCs and IVOCs to global OA budgets and dis-tributions. The EMAC simulations indicate that the tropo-spheric burden of OA consists of 32 % fOA and 30 % bbOA.Furthermore, 90 % of fOA and 70 % of bbOA is predictedto be secondary. These results support recent findings fromglobal studies that have also reported strong contributions ofSOA from anthropogenic sources to global OA concentra-tions (Spracklen et al., 2011; Carslaw et al., 2013; Lee et al.,2013; Tsimpidi et al., 2014).
Figure 15. (a) Spatial and (b) seasonal composition of SOA andOOA mass calculated from EMAC and AMS results, respectively,in the Northern Hemisphere during 2001–2010.
The tropospheric burdens of fOA and bbOA follow a clearseasonal pattern. fOA is higher during the boreal summer(0.63 Tg) and lower during winter (0.57 Tg), while bbOAis higher during the dry season in the tropics (1.15 Tg dur-ing August) and lower during the wet season (0.17 Tg duringApril). The simulated spatial distribution of fOA and bbOAis driven by the sources of their precursors and atmospherictransport. Higher fPOA concentrations occur over denselypopulated and highly industrialized areas of the NorthernHemisphere while further downwind fPOA decreases sub-stantially due to dilution and evaporation. On the otherhand, fSOA maintains similar levels downwind of the an-thropogenic sources due to the continued chemical transfor-mations. bbPOA concentrations peak over the tropical andthe boreal forests while bbSOA has high concentrations overa wide area covering most of South America, central andsouthern Africa, and Southeast Asia, including Indonesia andeven parts of the southern Atlantic Ocean.
AMS results from 84 field campaigns performed at conti-nental locations in the Northern Hemisphere during the ex-amined period (2001–2010) have been used to provide fur-ther insights into the composition of OA in three differenttypes of environments: urban, urban-downwind and rural ar-eas, during four seasons. The spatial analysis of AMS andEMAC results indicate that over urban areas POA is high-est while further downwind and in rural areas decreases sub-stantially due to dilution and evaporation. On the other hand,SOA is found to be high over all types of environments. Thisresults in an increase of the SOA / OA ratio downwind of the
Atmos. Chem. Phys., 16, 8939–8962, 2016 www.atmos-chem-phys.net/16/8939/2016/
A. P. Tsimpidi et al.: Global combustion sources of organic aerosols 8957
urban centers. The seasonal analysis of the results does notinclude the urban areas since the model cannot reproducethe high OA concentrations over urban environments due toits limited spatial resolution. The seasonal evaluation of themodel results against the AMS measurements showed a ma-jor weakness of the model associated with calculated POAand SOA concentration levels during winter. This indicatesthat the model is probably missing both an important sourceand a formation pathway of OA, which becomes increasinglyimportant during boreal winter. Possible causes include theunderestimation of residential biofuel emissions during win-ter, the underestimation of vehicle cold-start emissions, theneglect of aqueous-phase and heterogeneous oxidation reac-tions in the model, and the overestimation of the atmosphericremoval of POA and freshly formed SOA.
AMS results indicate that OA consists of 15 % HOA and85 % OOA on average during all seasons. EMAC is able toreproduce this dominance of OOA and its results suggestthat SOA accounts for 80 % of total OA. At many locations,PMF analysis identified two subtypes of OOA that differ involatility and oxidation state (LV-OOA and SV-OOA). PMFresults indicate that LV-OOA is higher than SV-OOA regard-less of the season or the type of environment. The overallLV-OOA / OOA fraction during the four seasons is 63 % ac-cording to AMS measurement analysis. Assuming that SV-OOA corresponds to fresh SOA (first generation oxidationproducts) and LV-OOA corresponds to aged SOA (later gen-eration oxidation products), EMAC is able to reproduce thePMF results predicting a dominance of aged SOA during allseasons (59 % of the total SOA on average).
The Supplement related to this article is available onlineat doi:10.5194/acp-16-8939-2016-supplement.
Acknowledgements. The research leading to these results hasreceived funding from the European Research Council un-der the European Union’s Seventh Framework Programme(FP7/2007–2013)/ERC grant agreement no. 226144. A. P. Tsimpidiacknowledges support from a DFG individual grand programme(project reference TS 335/2-1) and V. A. Karydis acknowledgessupport from a FP7 Marie Curie Career Integration Grant (projectreference 618349).
The article processing charges for this open-accesspublication were covered by the Max Planck Society.
Edited by: K. TsigaridisReviewed by: two anonymous referees
References
Alvarado, M. J., Lonsdale, C. R., Yokelson, R. J., Akagi, S. K., Coe,H., Craven, J. S., Fischer, E. V., McMeeking, G. R., Seinfeld, J.H., Soni, T., Taylor, J. W., Weise, D. R., and Wold, C. E.: Investi-gating the links between ozone and organic aerosol chemistry in abiomass burning plume from a prescribed fire in California cha-parral, Atmos. Chem. Phys., 15, 6667–6688, doi:10.5194/acp-15-6667-2015, 2015.
Aiken, A. C., Salcedo, D., Cubison, M. J., Huffman, J. A., DeCarlo,P. F., Ulbrich, I. M., Docherty, K. S., Sueper, D., Kimmel, J.R., Worsnop, D. R., Trimborn, A., Northway, M., Stone, E. A.,Schauer, J. J., Volkamer, R. M., Fortner, E., de Foy, B., Wang,J., Laskin, A., Shutthanandan, V., Zheng, J., Zhang, R., Gaffney,J., Marley, N. A., Paredes-Miranda, G., Arnott, W. P., Molina,L. T., Sosa, G., and Jimenez, J. L.: Mexico City aerosol analysisduring MILAGRO using high resolution aerosol mass spectrom-etry at the urban supersite (T0) – Part 1: Fine particle composi-tion and organic source apportionment, Atmos. Chem. Phys., 9,6633–6653, doi:10.5194/acp-9-6633-2009, 2009.
Aiken, A. C., de Foy, B., Wiedinmyer, C., DeCarlo, P. F., Ulbrich, I.M., Wehrli, M. N., Szidat, S., Prevot, A. S. H., Noda, J., Wacker,L., Volkamer, R., Fortner, E., Wang, J., Laskin, A., Shutthanan-dan, V., Zheng, J., Zhang, R., Paredes-Miranda, G., Arnott, W.P., Molina, L. T., Sosa, G., Querol, X., and Jimenez, J. L.: Mex-ico city aerosol analysis during MILAGRO using high resolu-tion aerosol mass spectrometry at the urban supersite (T0) –Part 2: Analysis of the biomass burning contribution and thenon-fossil carbon fraction, Atmos. Chem. Phys., 10, 5315–5341,doi:10.5194/acp-10-5315-2010, 2010.
Athanasopoulou, E., Vogel, H., Vogel, B., Tsimpidi, A. P., Pandis,S. N., Knote, C., and Fountoukis, C.: Modeling the meteoro-logical and chemical effects of secondary organic aerosols dur-ing an EUCAARI campaign, Atmos. Chem. Phys., 13, 625–645,doi:10.5194/acp-13-625-2013, 2013.
Aumont, B., Valorso, R., Mouchel-Vallon, C., Camredon, M., Lee-Taylor, J., and Madronich, S.: Modeling SOA formation fromthe oxidation of intermediate volatility n-alkanes, Atmos. Chem.Phys., 12, 7577–7589, doi:10.5194/acp-12-7577-2012, 2012.
Bahreini, R., Middlebrook, A. M., de Gouw, J. A., Warneke, C.,Trainer, M., Brock, C. A., Stark, H., Brown, S. S., Dube, W. P.,Gilman, J. B., Hall, K., Holloway, J. S., Kuster, W. C., Perring,A. E., Prevot, A. S. H., Schwarz, J. P., Spackman, J. R., Szi-dat, S., Wagner, N. L., Weber, R. J., Zotter, P., and Parrish, D.D.: Gasoline emissions dominate over diesel in formation of sec-ondary organic aerosol mass, Geophys. Res. Lett., 39, L06805,doi:10.1029/2011gl050718, 2012.
Bergström, R., Denier van der Gon, H. A. C., Prévôt, A. S. H., Yttri,K. E., and Simpson, D.: Modelling of organic aerosols over Eu-rope (2002–2007) using a volatility basis set (VBS) framework:application of different assumptions regarding the formation ofsecondary organic aerosol, Atmos. Chem. Phys., 12, 8499–8527,doi:10.5194/acp-12-8499-2012, 2012.
Bougiatioti, A., Stavroulas, I., Kostenidou, E., Zarmpas, P., Theo-dosi, C., Kouvarakis, G., Canonaco, F., Prévôt, A. S. H., Nenes,A., Pandis, S. N., and Mihalopoulos, N.: Processing of biomass-burning aerosol in the eastern Mediterranean during summer-time, Atmos. Chem. Phys., 14, 4793–4807, doi:10.5194/acp-14-4793-2014, 2014.
www.atmos-chem-phys.net/16/8939/2016/ Atmos. Chem. Phys., 16, 8939–8962, 2016
8958 A. P. Tsimpidi et al.: Global combustion sources of organic aerosols
Canagaratna, M. R., Jimenez, J. L., Kroll, J. H., Chen, Q., Kessler,S. H., Massoli, P., Hildebrandt Ruiz, L., Fortner, E., Williams, L.R., Wilson, K. R., Surratt, J. D., Donahue, N. M., Jayne, J. T.,and Worsnop, D. R.: Elemental ratio measurements of organiccompounds using aerosol mass spectrometry: characterization,improved calibration, and implications, Atmos. Chem. Phys., 15,253–272, doi:10.5194/acp-15-253-2015, 2015.
Cappa, C. D. and Wilson, K. R.: Multi-generation gas-phase oxida-tion, equilibrium partitioning, and the formation and evolution ofsecondary organic aerosol, Atmos. Chem. Phys., 12, 9505–9528,doi:10.5194/acp-12-9505-2012, 2012.
Carbone, S., Aurela, M., Saarnio, K., Saarikoski, S., Timonen, H.,Frey, A., Sueper, D., Ulbrich, I. M., Jimenez, J. L., Kulmala, M.,Worsnop, D. R., and Hillamo, R. E.: Wintertime Aerosol Chem-istry in Sub-Arctic Urban Air, Aerosol Sci. Tech., 48, 313–323,2014.
Carslaw, K. S., Lee, L. A., Reddington, C. L., Mann, G. W., andPringle, K. J.: The magnitude and sources of uncertainty in globalaerosol, Faraday Discuss., 165, 495–512, 2013.
Chen, L. W. A., Watson, J. G., Chow, J. C., and Magliano, K. L.:Quantifying PM2.5 source contributions for the San Joaquin Val-ley with multivariate receptor models, Environ. Sci. Technol., 41,2818–2826, 2007.
Chen, Q., Farmer, D. K., Rizzo, L. V., Pauliquevis, T., Kuwata, M.,Karl, T. G., Guenther, A., Allan, J. D., Coe, H., Andreae, M. O.,Pöschl, U., Jimenez, J. L., Artaxo, P., and Martin, S. T.: Submi-cron particle mass concentrations and sources in the Amazonianwet season (AMAZE-08), Atmos. Chem. Phys., 15, 3687–3701,doi:10.5194/acp-15-3687-2015, 2015.
Chen, Y., Morton, D. C., Jin, Y., Gollatz, G. J., Kasibhatla, P. S., vander Werf, G. R., DeFries, R. S., and Randerson, J. T.: Long-termtrends and interannual variability of forest, savanna and agricul-tural fires in South America, Carbon Management, 4, 617–638,2013.
Chirico, R., DeCarlo, P. F., Heringa, M. F., Tritscher, T., Richter,R., Prévôt, A. S. H., Dommen, J., Weingartner, E., Wehrle, G.,Gysel, M., Laborde, M., and Baltensperger, U.: Impact of af-tertreatment devices on primary emissions and secondary or-ganic aerosol formation potential from in-use diesel vehicles: re-sults from smog chamber experiments, Atmos. Chem. Phys., 10,11545–11563, doi:10.5194/acp-10-11545-2010, 2010.
Clarke, L., Edmonds, J., Jacoby, H., Pitcher, H., Reilly, J., andRichels, R.: Scenarios of greenhouse gas emissions and atmo-spheric concentrations (Part A) and review of integrated scenariodevelopment and application (Part B), A report by the US climatechange science program and the subcommittee on global changeresearch, Department of Energy, Office of Biological & Environ-mental Research, Washington, D.C., USA, 260 pp., 2007.
Crippa, M., El Haddad, I., Slowik, J. G., DeCarlo, P. F., Mohr,C., Heringa, M. F., Chirico, R., Marchand, N., Sciare, J., Bal-tensperger, U., and Prevot, A. S. H.: Identification of marine andcontinental aerosol sources in Paris using high resolution aerosolmass spectrometry, J. Geophys. Res.-Atmos., 118, 1950–1963,doi:10.1002/jgrd.50151, 2013a.
Crippa, M., DeCarlo, P. F., Slowik, J. G., Mohr, C., Heringa, M.F., Chirico, R., Poulain, L., Freutel, F., Sciare, J., Cozic, J.,Di Marco, C. F., Elsasser, M., Nicolas, J. B., Marchand, N.,Abidi, E., Wiedensohler, A., Drewnick, F., Schneider, J., Bor-rmann, S., Nemitz, E., Zimmermann, R., Jaffrezo, J.-L., Prévôt,
A. S. H., and Baltensperger, U.: Wintertime aerosol chemicalcomposition and source apportionment of the organic fractionin the metropolitan area of Paris, Atmos. Chem. Phys., 13, 961–981, doi:10.5194/acp-13-961-2013, 2013b.
Crippa, M., Canonaco, F., Lanz, V. A., Äijälä, M., Allan, J. D., Car-bone, S., Capes, G., Ceburnis, D., Dall’Osto, M., Day, D. A.,DeCarlo, P. F., Ehn, M., Eriksson, A., Freney, E., HildebrandtRuiz, L., Hillamo, R., Jimenez, J. L., Junninen, H., Kiendler-Scharr, A., Kortelainen, A.-M., Kulmala, M., Laaksonen, A.,Mensah, A. A., Mohr, C., Nemitz, E., O’Dowd, C., Ovadnevaite,J., Pandis, S. N., Petäjä, T., Poulain, L., Saarikoski, S., Sellegri,K., Swietlicki, E., Tiitta, P., Worsnop, D. R., Baltensperger, U.,and Prévôt, A. S. H.: Organic aerosol components derived from25 AMS data sets across Europe using a consistent ME-2 basedsource apportionment approach, Atmos. Chem. Phys., 14, 6159–6176, doi:10.5194/acp-14-6159-2014, 2014.
DeCarlo, P. F., Ulbrich, I. M., Crounse, J., de Foy, B., Dunlea,E. J., Aiken, A. C., Knapp, D., Weinheimer, A. J., Campos,T., Wennberg, P. O., and Jimenez, J. L.: Investigation of thesources and processing of organic aerosol over the Central Mex-ican Plateau from aircraft measurements during MILAGRO, At-mos. Chem. Phys., 10, 5257–5280, doi:10.5194/acp-10-5257-2010, 2010.
Denier van der Gon, H. A. C., Bergström, R., Fountoukis, C., Jo-hansson, C., Pandis, S. N., Simpson, D., and Visschedijk, A.J. H.: Particulate emissions from residential wood combustionin Europe – revised estimates and an evaluation, Atmos. Chem.Phys., 15, 6503–6519, doi:10.5194/acp-15-6503-2015, 2015.
Donahue, N. M., Robinson, A. L., Stanier, C. O., and Pandis,S. N.: Coupled partitioning, dilution, and chemical aging ofsemivolatile organics, Environ. Sci. Technol., 40, 2635–2643,2006.
Donahue, N. M., Robinson, A. L., and Pandis, S. N.: Atmosphericorganic particulate matter: From smoke to secondary organicaerosol, Atmos. Environ., 43, 94–106, 2009.
Ehn, M., Thornton, J. A., Kleist, E., Sipila, M., Junninen, H., Pulli-nen, I., Springer, M., Rubach, F., Tillmann, R., Lee, B., Lopez-Hilfiker, F., Andres, S., Acir, I.-H., Rissanen, M., Jokinen, T.,Schobesberger, S., Kangasluoma, J., Kontkanen, J., Nieminen,T., Kurten, T., Nielsen, L. B., Jorgensen, S., Kjaergaard, H. G.,Canagaratna, M., Maso, M. D., Berndt, T., Petaja, T., Wahner,A., Kerminen, V.-M., Kulmala, M., Worsnop, D. R., Wildt, J.,and Mentel, T. F.: A large source of low-volatility secondary or-ganic aerosol, Nature, 506, 476–479, doi:10.1038/nature13032,2014.
Fountoukis, C., Racherla, P. N., Denier van der Gon, H. A. C.,Polymeneas, P., Charalampidis, P. E., Pilinis, C., Wiedensohler,A., Dall’Osto, M., O’Dowd, C., and Pandis, S. N.: Evaluationof a three-dimensional chemical transport model (PMCAMx)in the European domain during the EUCAARI May 2008 cam-paign, Atmos. Chem. Phys., 11, 10331–10347, doi:10.5194/acp-11-10331-2011, 2011.
Fountoukis, C., Megaritis, A. G., Skyllakou, K., Charalampidis,P. E., Pilinis, C., Denier van der Gon, H. A. C., Crippa, M.,Canonaco, F., Mohr, C., Prévôt, A. S. H., Allan, J. D., Poulain, L.,Petäjä, T., Tiitta, P., Carbone, S., Kiendler-Scharr, A., Nemitz, E.,O’Dowd, C., Swietlicki, E., and Pandis, S. N.: Organic aerosolconcentration and composition over Europe: insights from com-parison of regional model predictions with aerosol mass spec-
Atmos. Chem. Phys., 16, 8939–8962, 2016 www.atmos-chem-phys.net/16/8939/2016/
A. P. Tsimpidi et al.: Global combustion sources of organic aerosols 8959
trometer factor analysis, Atmos. Chem. Phys., 14, 9061–9076,doi:10.5194/acp-14-9061-2014, 2014.
Fountoukis, C., Megaritis, A. G., Skyllakou, K., Charalampidis,P. E., Denier van der Gon, H. A. C., Crippa, M., Prévôt, A.S. H., Fachinger, F., Wiedensohler, A., Pilinis, C., and Pan-dis, S. N.: Simulating the formation of carbonaceous aerosolin a European Megacity (Paris) during the MEGAPOLI sum-mer and winter campaigns, Atmos. Chem. Phys., 16, 3727–3741,doi:10.5194/acp-16-3727-2016, 2016.
Ge, X., Setyan, A., Sun, Y., and Zhang, Q.: Primary and secondaryorganic aerosols in Fresno, California during wintertime: Resultsfrom high resolution aerosol mass spectrometry, J. Geophys.Res.-Atmos., 117, D19301, doi:10.1029/2012jd018026, 2012.
Gentner, D. R., Isaacman, G., Worton, D. R., Chan, A. W. H., Dall-mann, T. R., Davis, L., Liu, S., Day, D. A., Russell, L. M., Wil-son, K. R., Weber, R., Guha, A., Harley, R. A., and Goldstein, A.H.: Elucidating secondary organic aerosol from diesel and gaso-line vehicles through detailed characterization of organic carbonemissions, P. Natl. Acad. Sci. USA, 109, 18318–18323, 2012.
Goldstein, A. H. and Galbally, I. E.: Known and unexplored organicconstituents in the earth’s atmosphere, Environ. Sci. Technol., 41,1514–1521, 2007.
Gordon, T. D., Presto, A. A., May, A. A., Nguyen, N. T., Lip-sky, E. M., Donahue, N. M., Gutierrez, A., Zhang, M., Mad-dox, C., Rieger, P., Chattopadhyay, S., Maldonado, H., Maricq,M. M., and Robinson, A. L.: Secondary organic aerosol for-mation exceeds primary particulate matter emissions for light-duty gasoline vehicles, Atmos. Chem. Phys., 14, 4661–4678,doi:10.5194/acp-14-4661-2014, 2014.
Grieshop, A. P., Logue, J. M., Donahue, N. M., and Robinson, A.L.: Laboratory investigation of photochemical oxidation of or-ganic aerosol from wood fires 1: measurement and simulation oforganic aerosol evolution, Atmos. Chem. Phys., 9, 1263–1277,doi:10.5194/acp-9-1263-2009, 2009.
Hayes, P. L., Ortega, A. M., Cubison, M. J., Froyd, K. D., Zhao, Y.,Cliff, S. S., Hu, W. W., Toohey, D. W., Flynn, J. H., Lefer, B. L.,Grossberg, N., Alvarez, S., Rappenglueck, B., Taylor, J. W., Al-lan, J. D., Holloway, J. S., Gilman, J. B., Kuster, W. C., De Gouw,J. A., Massoli, P., Zhang, X., Liu, J., Weber, R. J., Corrigan, A.L., Russell, L. M., Isaacman, G., Worton, D. R., Kreisberg, N.M., Goldstein, A. H., Thalman, R., Waxman, E. M., Volkamer,R., Lin, Y. H., Surratt, J. D., Kleindienst, T. E., Offenberg, J. H.,Dusanter, S., Griffith, S., Stevens, P. S., Brioude, J., Angevine, W.M., and Jimenez, J. L.: Organic aerosol composition and sourcesin Pasadena, California, during the 2010 CalNex campaign, J.Geophy. Res.-Atmos., 118, 9233–9257, doi:10.1002/jgrd.50530,2013.
Henze, D. K., Seinfeld, J. H., Ng, N. L., Kroll, J. H., Fu, T.-M.,Jacob, D. J., and Heald, C. L.: Global modeling of secondaryorganic aerosol formation from aromatic hydrocarbons: high-vs. low-yield pathways, Atmos. Chem. Phys., 8, 2405–2420,doi:10.5194/acp-8-2405-2008, 2008.
Hodzic, A., Jimenez, J. L., Madronich, S., Canagaratna, M. R., De-Carlo, P. F., Kleinman, L., and Fast, J.: Modeling organic aerosolsin a megacity: potential contribution of semi-volatile and inter-mediate volatility primary organic compounds to secondary or-ganic aerosol formation, Atmos. Chem. Phys., 10, 5491–5514,doi:10.5194/acp-10-5491-2010, 2010.
Hodzic, A., Kasibhatla, P. S., Jo, D. S., Cappa, C. D., Jimenez, J.L., Madronich, S., and Park, R. J.: Rethinking the global sec-ondary organic aerosol (SOA) budget: stronger production, fasterremoval, shorter lifetime, Atmos. Chem. Phys., 16, 7917–7941,doi:10.5194/acp-16-7917-2016, 2016.
Hu, W. W., Campuzano-Jost, P., Palm, B. B., Day, D. A., Ortega,A. M., Hayes, P. L., Krechmer, J. E., Chen, Q., Kuwata, M.,Liu, Y. J., de Sá, S. S., McKinney, K., Martin, S. T., Hu, M.,Budisulistiorini, S. H., Riva, M., Surratt, J. D., St. Clair, J. M.,Isaacman-Van Wertz, G., Yee, L. D., Goldstein, A. H., Carbone,S., Brito, J., Artaxo, P., de Gouw, J. A., Koss, A., Wisthaler, A.,Mikoviny, T., Karl, T., Kaser, L., Jud, W., Hansel, A., Docherty,K. S., Alexander, M. L., Robinson, N. H., Coe, H., Allan, J. D.,Canagaratna, M. R., Paulot, F., and Jimenez, J. L.: Characteri-zation of a real-time tracer for isoprene epoxydiols-derived sec-ondary organic aerosol (IEPOX-SOA) from aerosol mass spec-trometer measurements, Atmos. Chem. Phys., 15, 11807–11833,doi:10.5194/acp-15-11807-2015, 2015.
IPCC – Intergovernmental Panel on Climate Change: The phys-ical science basis, in: Contribution of working group I to thefifth assessment report of the intergovernmental panel on climatechange, edited by: Stocker, T. F., Qin, D., Plattner, G.-K., Tignor,M., Allen, S. K., Boschung, J., Nauels, A., Xia, Y., Bex, V., andMidgley, P. M., Cambridge University Press, Cambridge, UK andNew York, NY, USA, 2013.
Jathar, S. H., Farina, S. C., Robinson, A. L., and Adams, P. J.:The influence of semi-volatile and reactive primary emissionson the abundance and properties of global organic aerosol, At-mos. Chem. Phys., 11, 7727–7746, doi:10.5194/acp-11-7727-2011, 2011.
Jimenez, J. L., Jayne, J. T., Shi, Q., Kolb, C. E., Worsnop, D. R.,Yourshaw, I., Seinfeld, J. H., Flagan, R. C., Zhang, X. F., Smith,K. A., Morris, J. W., and Davidovits, P.: Ambient aerosol sam-pling using the Aerodyne Aerosol Mass Spectrometer, J. Geophy.Res. Atmos., 108, 8425, doi:10.1029/2001jd001213, 2003.
Jimenez, J. L., Canagaratna, M. R., Donahue, N. M., Prevot, A. S.H., Zhang, Q., Kroll, J. H., DeCarlo, P. F., Allan, J. D., Coe,H., Ng, N. L., Aiken, A. C., Docherty, K. S., Ulbrich, I. M.,Grieshop, A. P., Robinson, A. L., Duplissy, J., Smith, J. D., Wil-son, K. R., Lanz, V. A., Hueglin, C., Sun, Y. L., Tian, J., Laak-sonen, A., Raatikainen, T., Rautiainen, J., Vaattovaara, P., Ehn,M., Kulmala, M., Tomlinson, J. M., Collins, D. R., Cubison, M.J., Dunlea, E. J., Huffman, J. A., Onasch, T. B., Alfarra, M. R.,Williams, P. I., Bower, K., Kondo, Y., Schneider, J., Drewnick,F., Borrmann, S., Weimer, S., Demerjian, K., Salcedo, D., Cot-trell, L., Griffin, R., Takami, A., Miyoshi, T., Hatakeyama, S.,Shimono, A., Sun, J. Y., Zhang, Y. M., Dzepina, K., Kimmel, J.R., Sueper, D., Jayne, J. T., Herndon, S. C., Trimborn, A. M.,Williams, L. R., Wood, E. C., Middlebrook, A. M., Kolb, C.E., Baltensperger, U., and Worsnop, D. R.: Evolution of organicaerosols in the atmosphere, Science, 326, 1525–1529, 2009.
Jöckel, P., Tost, H., Pozzer, A., Brühl, C., Buchholz, J., Ganzeveld,L., Hoor, P., Kerkweg, A., Lawrence, M. G., Sander, R., Steil,B., Stiller, G., Tanarhte, M., Taraborrelli, D., van Aardenne, J.,and Lelieveld, J.: The atmospheric chemistry general circulationmodel ECHAM5/MESSy1: consistent simulation of ozone fromthe surface to the mesosphere, Atmos. Chem. Phys., 6, 5067–5104, doi:10.5194/acp-6-5067-2006, 2006.
www.atmos-chem-phys.net/16/8939/2016/ Atmos. Chem. Phys., 16, 8939–8962, 2016
8960 A. P. Tsimpidi et al.: Global combustion sources of organic aerosols
Kanakidou, M., Seinfeld, J. H., Pandis, S. N., Barnes, I., Dentener,F. J., Facchini, M. C., Van Dingenen, R., Ervens, B., Nenes, A.,Nielsen, C. J., Swietlicki, E., Putaud, J. P., Balkanski, Y., Fuzzi,S., Horth, J., Moortgat, G. K., Winterhalter, R., Myhre, C. E.L., Tsigaridis, K., Vignati, E., Stephanou, E. G., and Wilson,J.: Organic aerosol and global climate modelling: a review, At-mos. Chem. Phys., 5, 1053–1123, doi:10.5194/acp-5-1053-2005,2005.
Karydis, V. A., Tsimpidi, A. P., Pozzer, A., Astitha, M., andLelieveld, J.: Effects of mineral dust on global atmosphericnitrate concentrations, Atmos. Chem. Phys., 16, 1491–1509,doi:10.5194/acp-16-1491-2016, 2016.
Kerkweg, A., Buchholz, J., Ganzeveld, L., Pozzer, A., Tost, H., andJöckel, P.: Technical Note: An implementation of the dry removalprocesses DRY DEPosition and SEDImentation in the Modu-lar Earth Submodel System (MESSy), Atmos. Chem. Phys., 6,4617–4632, doi:10.5194/acp-6-4617-2006, 2006a.
Kerkweg, A., Sander, R., Tost, H., and Jöckel, P.: Technicalnote: Implementation of prescribed (OFFLEM), calculated (ON-LEM), and pseudo-emissions (TNUDGE) of chemical species inthe Modular Earth Submodel System (MESSy), Atmos. Chem.Phys., 6, 3603–3609, doi:10.5194/acp-6-3603-2006, 2006b.
Kopacz, M., Jacob, D. J., Fisher, J. A., Logan, J. A., Zhang, L.,Megretskaia, I. A., Yantosca, R. M., Singh, K., Henze, D. K.,Burrows, J. P., Buchwitz, M., Khlystova, I., McMillan, W. W.,Gille, J. C., Edwards, D. P., Eldering, A., Thouret, V., andNedelec, P.: Global estimates of CO sources with high resolu-tion by adjoint inversion of multiple satellite datasets (MOPITT,AIRS, SCIAMACHY, TES), Atmos. Chem. Phys., 10, 855–876,doi:10.5194/acp-10-855-2010, 2010.
Kostenidou, E., Kaltsonoudis, C., Tsiflikiotou, M., Louvaris, E.,Russell, L. M., and Pandis, S. N.: Burning of olive tree branches:a major organic aerosol source in the Mediterranean, Atmos.Chem. Phys., 13, 8797–8811, doi:10.5194/acp-13-8797-2013,2013.
Kroll, J. H. and Seinfeld, J. H.: Chemistry of secondary organicaerosol: Formation and evolution of low-volatility organics in theatmosphere, Atmos. Environ., 42, 3593–3624, 2008.
Lanz, V. A., Alfarra, M. R., Baltensperger, U., Buchmann, B.,Hueglin, C., and Prévôt, A. S. H.: Source apportionment of sub-micron organic aerosols at an urban site by factor analytical mod-elling of aerosol mass spectra, Atmos. Chem. Phys., 7, 1503–1522, doi:10.5194/acp-7-1503-2007, 2007.
Lanz, V. A., Alfarra, M. R., Baltensperger, U., Buchmann, B.,Hueglin, C., Szidat, S., Wehrli, M. N., Wacker, L., Weimer, S.,Caseiro, A., Puxbaum, H., and Prevot, A. S. H.: Source attribu-tion of submicron organic aerosols during wintertime inversionsby advanced factor analysis of aerosol mass spectra, Environ.Sci. Technol., 42, 214–220, 2008.
Lanz, V. A., Prévôt, A. S. H., Alfarra, M. R., Weimer, S., Mohr,C., DeCarlo, P. F., Gianini, M. F. D., Hueglin, C., Schneider, J.,Favez, O., D’Anna, B., George, C., and Baltensperger, U.: Char-acterization of aerosol chemical composition with aerosol massspectrometry in Central Europe: an overview, Atmos. Chem.Phys., 10, 10453–10471, doi:10.5194/acp-10-10453-2010, 2010.
Lauer, A., Eyring, V., Hendricks, J., Jöckel, P., and Lohmann, U.:Global model simulations of the impact of ocean-going ships onaerosols, clouds, and the radiation budget, Atmos. Chem. Phys.,7, 5061–5079, doi:10.5194/acp-7-5061-2007, 2007.
Lee, L. A., Pringle, K. J., Reddington, C. L., Mann, G. W., Stier,P., Spracklen, D. V., Pierce, J. R., and Carslaw, K. S.: The mag-nitude and causes of uncertainty in global model simulations ofcloud condensation nuclei, Atmos. Chem. Phys., 13, 8879–8914,doi:10.5194/acp-13-8879-2013, 2013.
Lelieveld, J., Barlas, C., Giannadaki, D., and Pozzer, A.: Modelcalculated global, regional and megacity premature mortalitydue to air pollution, Atmos. Chem. Phys., 13, 7023–7037,doi:10.5194/acp-13-7023-2013, 2013.
Lelieveld, J., Evans, J. S., Fnais, M., Giannadaki, D., and Pozzer,A.: The contribution of outdoor air pollution sources to pre-mature mortality on a global scale, Nature, 525, 367–371,doi:10.1038/nature15371, 2015.
Marcolli, C., Canagaratna, M. R., Worsnop, D. R., Bahreini, R., deGouw, J. A., Warneke, C., Goldan, P. D., Kuster, W. C., Williams,E. J., Lerner, B. M., Roberts, J. M., Meagher, J. F., Fehsenfeld,F. C., Marchewka, M., Bertman, S. B., and Middlebrook, A. M.:Cluster Analysis of the Organic Peaks in Bulk Mass Spectra Ob-tained During the 2002 New England Air Quality Study with anAerodyne Aerosol Mass Spectrometer, Atmos. Chem. Phys., 6,5649–5666, doi:10.5194/acp-6-5649-2006, 2006.
May, A. A., Levin, E. J. T., Hennigan, C. J., Riipinen, I., Lee, T.,Collett, J. L., Jimenez, J. L., Kreidenweis, S. M., and Robin-son, A. L.: Gas-particle partitioning of primary organic aerosolemissions: 3. Biomass burning, J. Geophys. Res.-Atmos., 118,11327–11338, doi:10.1002/jgrd.50828, 2013.
May, A. A., Nguyen, N. T., Presto, A. A., Gordon, T. D., Lipsky,E. M., Karve, M., Gutierrez, A., Robertson, W. H., Zhang, M.,Brandow, C., Chang, O., Chen, S., Cicero-Fernandez, P., Dink-ins, L., Fuentes, M., Huang, S.-M., Ling, R., Long, J., Mad-dox, C., Massetti, J., McCauley, E., Miguel, A., Na, K., Ong,R., Pang, Y., Rieger, P., Sax, T., Tin, T., Thu, V., Chattopad-hyay, S., Maldonado, H., Maricq, M. M., and Robinson, A.L.: Gas- and particle-phase primary emissions from in-use, on-road gasoline and diesel vehicles, Atmos. Environ., 88, 247–260,doi:10.1016/j.atmosenv.2014.01.046, 2014.
McFiggans, G., Artaxo, P., Baltensperger, U., Coe, H., Facchini, M.C., Feingold, G., Fuzzi, S., Gysel, M., Laaksonen, A., Lohmann,U., Mentel, T. F., Murphy, D. M., O’Dowd, C. D., Snider, J. R.,and Weingartner, E.: The effect of physical and chemical aerosolproperties on warm cloud droplet activation, Atmos. Chem.Phys., 6, 2593–2649, doi:10.5194/acp-6-2593-2006, 2006.
Miracolo, M. A., Hennigan, C. J., Ranjan, M., Nguyen, N. T., Gor-don, T. D., Lipsky, E. M., Presto, A. A., Donahue, N. M., andRobinson, A. L.: Secondary aerosol formation from photochem-ical aging of aircraft exhaust in a smog chamber, Atmos. Chem.Phys., 11, 4135–4147, doi:10.5194/acp-11-4135-2011, 2011.
Mohr, C., DeCarlo, P. F., Heringa, M. F., Chirico, R., Slowik, J.G., Richter, R., Reche, C., Alastuey, A., Querol, X., Seco, R.,Peñuelas, J., Jiménez, J. L., Crippa, M., Zimmermann, R., Bal-tensperger, U., and Prévôt, A. S. H.: Identification and quan-tification of organic aerosol from cooking and other sources inBarcelona using aerosol mass spectrometer data, Atmos. Chem.Phys., 12, 1649–1665, doi:10.5194/acp-12-1649-2012, 2012.
Murphy, B. N. and Pandis, S. N.: Simulating the formation ofsemivolatile primary and secondary organic aerosol in a regionalchemical transport model, Environ. Sci. Technol., 43, 4722–4728, 2009.
Atmos. Chem. Phys., 16, 8939–8962, 2016 www.atmos-chem-phys.net/16/8939/2016/
A. P. Tsimpidi et al.: Global combustion sources of organic aerosols 8961
Nemitz, E., Jimenez, J. L., Huffman, J. A., Ulbrich, I. M., Cana-garatna, M. R., Worsnop, D. R., and Guenther, A. B.: An eddy-covariance system for the measurement of surface/atmosphereexchange fluxes of submicron aerosol chemical species – Firstapplication above an urban area, Aerosol Sci. Tech., 42, 636–657, 2008.
Ng, N. L., Canagaratna, M. R., Jimenez, J. L., Zhang, Q., Ulbrich,I. M., and Worsnop, D. R.: Real-Time Methods for EstimatingOrganic Component Mass Concentrations from Aerosol MassSpectrometer Data, Environ. Sci. Technol., 45, 910–916, 2011.
Paatero, P.: Least squares formulation of robust non-negative factoranalysis, Chemometr. Intel. Lab. Syst., 37, 23–35, 1997.
Paatero, P. and Tapper, U.: Positive matrix factorization-A nonneg-ative factor model with optimal utilization of error-estimates ofdata values, Environmetrics, 5, 111–126, 1994.
Poschl, U.: Atmospheric aerosols: Composition, transformation,climate and health effects, Angew. Chem.-Int. Edit., 44, 7520–7540, 2005.
Pozzer, A., Zimmermann, P., Doering, U. M., van Aardenne, J.,Tost, H., Dentener, F., Janssens-Maenhout, G., and Lelieveld,J.: Effects of business-as-usual anthropogenic emissions on airquality, Atmos. Chem. Phys., 12, 6915–6937, doi:10.5194/acp-12-6915-2012, 2012a.
Pozzer, A., de Meij, A., Pringle, K. J., Tost, H., Doering, U. M., vanAardenne, J., and Lelieveld, J.: Distributions and regional bud-gets of aerosols and their precursors simulated with the EMACchemistry-climate model, Atmos. Chem. Phys., 12, 961–987,doi:10.5194/acp-12-961-2012, 2012b.
Pringle, K. J., Tost, H., Message, S., Steil, B., Giannadaki, D.,Nenes, A., Fountoukis, C., Stier, P., Vignati, E., and Lelieveld, J.:Description and evaluation of GMXe: a new aerosol submodelfor global simulations (v1), Geosci. Model Dev., 3, 391–412,doi:10.5194/gmd-3-391-2010, 2010.
Pye, H. O. T. and Seinfeld, J. H.: A global perspective on aerosolfrom low-volatility organic compounds, Atmos. Chem. Phys., 10,4377–4401, doi:10.5194/acp-10-4377-2010, 2010.
Ranjan, M., Presto, A. A., May, A. A., and Robinson, A. L.: Tem-perature Dependence of Gas-Particle Partitioning of Primary Or-ganic Aerosol Emissions from a Small Diesel Engine, AerosolSci. Tech., 46, 13–21, doi:10.1080/02786826.2011.602761,2012.
Robinson, A. L., Donahue, N. M., Shrivastava, M. K., Weitkamp,E. A., Sage, A. M., Grieshop, A. P., Lane, T. E., Pierce, J. R., andPandis, S. N.: Rethinking organic aerosols: Semivolatile emis-sions and photochemical aging, Science, 315, 1259–1262, 2007.
Robinson, A. L., Grieshop, A. P., Donahue, N. M., and Hunt, S. W.:Updating the conceptual model for fine particle mass emissionsfrom combustion systems, J. Air Waste Manage., 60, 1204–1222,2010.
Samy, S. and Zielinska, B.: Secondary organic aerosol productionfrom modern diesel engine emissions, Atmos. Chem. Phys., 10,609–625, doi:10.5194/acp-10-609-2010, 2010.
Sander, R., Baumgaertner, A., Gromov, S., Harder, H., Jöckel, P.,Kerkweg, A., Kubistin, D., Regelin, E., Riede, H., Sandu, A.,Taraborrelli, D., Tost, H., and Xie, Z.-Q.: The atmospheric chem-istry box model CAABA/MECCA-3.0, Geosci. Model Dev., 4,373–380, doi:10.5194/gmd-4-373-2011, 2011.
Shrivastava, M. K., Lane, T. E., Donahue, N. M., Pandis, S.N., and Robinson, A. L.: Effects of gas particle partitioning
and aging of primary emissions on urban and regional organicaerosol concentrations, J. Geophys. Res.-Atmos., 113, D18301,doi:10.1029/2007jd009735, 2008.
Shrivastava, M., Fast, J., Easter, R., Gustafson Jr., W. I., Zaveri, R.A., Jimenez, J. L., Saide, P., and Hodzic, A.: Modeling organicaerosols in a megacity: comparison of simple and complex rep-resentations of the volatility basis set approach, Atmos. Chem.Phys., 11, 6639–6662, doi:10.5194/acp-11-6639-2011, 2011.
Shrivastava, M., Easter, R. C., Liu, X., Zelenyuk, A., Singh, B.,Zhang, K., Ma, P.-L., Chand, D., Ghan, S., Jimenez, J. L., Zhang,Q., Fast, J., Rasch, P. J., and Tiitta, P.: Global transformation andfate of SOA: Implications of low-volatility SOA and gas-phasefragmentation reactions, J. Geophys. Res.-Atmos., 120, 4169–4195, doi:10.1002/2014JD022563, 2015.
Spracklen, D. V., Jimenez, J. L., Carslaw, K. S., Worsnop, D. R.,Evans, M. J., Mann, G. W., Zhang, Q., Canagaratna, M. R.,Allan, J., Coe, H., McFiggans, G., Rap, A., and Forster, P.:Aerosol mass spectrometer constraint on the global secondaryorganic aerosol budget, Atmos. Chem. Phys., 11, 12109–12136,doi:10.5194/acp-11-12109-2011, 2011.
Stone, E. A., Zhou, J., Snyder, D. C., Rutter, A. P., Mieritz, M., andSchauer, J. J.: A Comparison of Summertime Secondary OrganicAerosol Source Contributions at Contrasting Urban Locations,Environ. Sci. Technol., 43, 3448–3454, 2009.
Stubenrauch, C. J., Chedin, A., Radel, G., Scott, N. A., andSerrar, S.: Cloud properties and their seasonal and diurnalvariability from TOVS path-B, J. Climate, 19, 5531–5553,doi:10.1175/jcli3929.1, 2006.
Suess, D. T. and Prather, K. A.: Mass spectrometry of aerosols,Chem. Rev., 99, 3007–3035, 1999.
Sun, Y.-L., Zhang, Q., Schwab, J. J., Demerjian, K. L., Chen, W.-N., Bae, M.-S., Hung, H.-M., Hogrefe, O., Frank, B., Rattigan,O. V., and Lin, Y.-C.: Characterization of the sources and pro-cesses of organic and inorganic aerosols in New York city witha high-resolution time-of-flight aerosol mass apectrometer, At-mos. Chem. Phys., 11, 1581–1602, doi:10.5194/acp-11-1581-2011, 2011.
Takegawa, N., Miyazaki, Y., Kondo, Y., Komazaki, Y., Miyakawa,T., Jimenez, J. L., Jayne, J. T., Worsnop, D. R., Allan, J. D.,and Weber, R. J.: Characterization of an Aerodyne Aerosol MassSpectrometer (AMS): Intercomparison with other aerosol instru-ments, Aerosol Sci. Tech., 39, 760–770, 2005.
Tost, H., Jöckel, P., Kerkweg, A., Sander, R., and Lelieveld, J.: Tech-nical note: A new comprehensive SCAVenging submodel forglobal atmospheric chemistry modelling, Atmos. Chem. Phys.,6, 565–574, doi:10.5194/acp-6-565-2006, 2006.
Tsigaridis, K., Daskalakis, N., Kanakidou, M., Adams, P. J., Ar-taxo, P., Bahadur, R., Balkanski, Y., Bauer, S. E., Bellouin, N.,Benedetti, A., Bergman, T., Berntsen, T. K., Beukes, J. P., Bian,H., Carslaw, K. S., Chin, M., Curci, G., Diehl, T., Easter, R.C., Ghan, S. J., Gong, S. L., Hodzic, A., Hoyle, C. R., Iversen,T., Jathar, S., Jimenez, J. L., Kaiser, J. W., Kirkevåg, A., Koch,D., Kokkola, H., Lee, Y. H., Lin, G., Liu, X., Luo, G., Ma, X.,Mann, G. W., Mihalopoulos, N., Morcrette, J.-J., Müller, J.-F.,Myhre, G., Myriokefalitakis, S., Ng, N. L., O’Donnell, D., Pen-ner, J. E., Pozzoli, L., Pringle, K. J., Russell, L. M., Schulz, M.,Sciare, J., Seland, Ø., Shindell, D. T., Sillman, S., Skeie, R. B.,Spracklen, D., Stavrakou, T., Steenrod, S. D., Takemura, T., Ti-itta, P., Tilmes, S., Tost, H., van Noije, T., van Zyl, P. G., von
www.atmos-chem-phys.net/16/8939/2016/ Atmos. Chem. Phys., 16, 8939–8962, 2016
8962 A. P. Tsimpidi et al.: Global combustion sources of organic aerosols
Salzen, K., Yu, F., Wang, Z., Wang, Z., Zaveri, R. A., Zhang,H., Zhang, K., Zhang, Q., and Zhang, X.: The AeroCom eval-uation and intercomparison of organic aerosol in global mod-els, Atmos. Chem. Phys., 14, 10845–10895, doi:10.5194/acp-14-10845-2014, 2014.
Tsimpidi, A. P., Karydis, V. A., Zavala, M., Lei, W., Molina, L.,Ulbrich, I. M., Jimenez, J. L., and Pandis, S. N.: Evaluation of thevolatility basis-set approach for the simulation of organic aerosolformation in the Mexico City metropolitan area, Atmos. Chem.Phys., 10, 525–546, doi:10.5194/acp-10-525-2010, 2010.
Tsimpidi, A. P., Karydis, V. A., Zavala, M., Lei, W., Bei, N., Molina,L., and Pandis, S. N.: Sources and production of organic aerosolin Mexico City: insights from the combination of a chemicaltransport model (PMCAMx-2008) and measurements during MI-LAGRO, Atmos. Chem. Phys., 11, 5153–5168, doi:10.5194/acp-11-5153-2011, 2011.
Tsimpidi, A. P., Karydis, V. A., Pozzer, A., Pandis, S. N., andLelieveld, J.: ORACLE (v1.0): module to simulate the or-ganic aerosol composition and evolution in the atmosphere,Geosci. Model Dev., 7, 3153–3172, doi:10.5194/gmd-7-3153-2014, 2014.
Ulbrich, I. M., Canagaratna, M. R., Zhang, Q., Worsnop, D. R., andJimenez, J. L.: Interpretation of organic components from Posi-tive Matrix Factorization of aerosol mass spectrometric data, At-mos. Chem. Phys., 9, 2891–2918, doi:10.5194/acp-9-2891-2009,2009.
van der Werf, G. R., Randerson, J. T., Giglio, L., Collatz, G. J., Mu,M., Kasibhatla, P. S., Morton, D. C., DeFries, R. S., Jin, Y., andvan Leeuwen, T. T.: Global fire emissions and the contribution ofdeforestation, savanna, forest, agricultural, and peat fires (1997–2009), Atmos. Chem. Phys., 10, 11707–11735, doi:10.5194/acp-10-11707-2010, 2010.
Wang, Q., Shao, M., Liu, Y., William, K., Paul, G., Li, X.,Liu, Y., and Lu, S.: Impact of biomass burning on ur-ban air quality estimated by organic tracers: Guangzhouand Beijing as cases, Atmos. Environ., 41, 8380–8390,doi:10.1016/j.atmosenv.2007.06.048, 2007.
Weilenmann, M., Favez, J.-Y., and Alvarez, R.: Cold-start emissionsof modern passenger cars at different low ambient temperaturesand their evolution over vehicle legislation categories, Atmos.Environ., 43, 2419–2429, 2009.
Westerholm, R., Christensen, A., and Rosen, A.: Regulated andunregulated exhaust emissions from two three-way catalystequipped gasoline fuelled vehicles, Atmos. Environ., 30, 3529–3536, 1996.
Zhang, Q., Alfarra, M. R., Worsnop, D. R., Allan, J. D., Coe, H.,Canagaratna, M. R., and Jimenez, J. L.: Deconvolution and quan-tification of hydrocarbon-like and oxygenated organic aerosolsbased on aerosol mass spectrometry, Environ. Sci. Technol., 39,4938–4952, 2005a.
Zhang, Q., Canagaratna, M. R., Jayne, J. T., Worsnop, D. R., andJimenez, J. L.: Time- and size-resolved chemical compositionof submicron particles in Pittsburgh: Implications for aerosolsources and processes, J. Geophys. Res.-Atmos., 110, D07S09,doi:10.1029/2004jd004649, 2005b.
Zhang, Q., Jimenez, J. L., Canagaratna, M. R., Allan, J. D., Coe,H., Ulbrich, I., Alfarra, M. R., Takami, A., Middlebrook, A.M., Sun, Y. L., Dzepina, K., Dunlea, E., Docherty, K., De-Carlo, P. F., Salcedo, D., Onasch, T., Jayne, J. T., Miyoshi,T., Shimono, A., Hatakeyama, S., Takegawa, N., Kondo, Y.,Schneider, J., Drewnick, F., Borrmann, S., Weimer, S., Demer-jian, K., Williams, P., Bower, K., Bahreini, R., Cottrell, L.,Griffin, R. J., Rautiainen, J., Sun, J. Y., Zhang, Y. M., andWorsnop, D. R.: Ubiquity and dominance of oxygenated speciesin organic aerosols in anthropogenically-influenced NorthernHemisphere midlatitudes, Geophys. Res. Lett., 34, D07S09,doi:10.1029/2007gl029979, 2007.
Zhang, Q., Jimenez, J. L., Canagaratna, M. R., Ulbrich, I. M., Ng, N.L., Worsnop, D. R., and Sun, Y. L.: Understanding atmosphericorganic aerosols via factor analysis of aerosol mass spectrometry:a review, Anal. Bioanal. Chem., 401, 3045–3067, 2011.
Zhang, Q. J., Beekmann, M., Drewnick, F., Freutel, F., Schneider,J., Crippa, M., Prevot, A. S. H., Baltensperger, U., Poulain, L.,Wiedensohler, A., Sciare, J., Gros, V., Borbon, A., Colomb, A.,Michoud, V., Doussin, J.-F., Denier van der Gon, H. A. C., Ha-effelin, M., Dupont, J.-C., Siour, G., Petetin, H., Bessagnet, B.,Pandis, S. N., Hodzic, A., Sanchez, O., Honoré, C., and Perrus-sel, O.: Formation of organic aerosol in the Paris region duringthe MEGAPOLI summer campaign: evaluation of the volatility-basis-set approach within the CHIMERE model, Atmos. Chem.Phys., 13, 5767–5790, doi:10.5194/acp-13-5767-2013, 2013.
Atmos. Chem. Phys., 16, 8939–8962, 2016 www.atmos-chem-phys.net/16/8939/2016/