Embed Size (px)
Citation preview
Global integrated droughtmonitoring and prediction systemZengchao Hao, Amir AghaKouchak, Navid Nakhjiri and Alireza Farahmand
Drought is by far the most costly natural disaster that can lead to widespread impacts, including water andfood crises. Here we present data sets available from the Global Integrated Drought Monitoring andPrediction System (GIDMaPS), which provides drought information based on multiple drought indicators.The system provides meteorological and agricultural drought information based on multiple satellite-, andmodel-based precipitation and soil moisture data sets. GIDMaPS includes a near real-time monitoringcomponent and a seasonal probabilistic prediction module. The data sets include historical drought severitydata from the monitoring component, and probabilistic seasonal forecasts from the prediction module. Theprobabilistic forecasts provide essential information for early warning, taking preventive measures, andplanning mitigation strategies. GIDMaPS data sets are a significant extension to current capabilities anddata sets for global drought assessment and early warning. The presented data sets would be instrumentalin reducing drought impacts especially in developing countries. Our results indicate that GIDMaPS data setsreliably captured several major droughts from across the globe.
Design Type(s) observation design • data integration
Measurement Type(s)meteorological drought index • agricultural droughtindex • integrated meteorological and agricultural drought index
Technology Type(s) data transformation
Factor Type(s) observation period • temporal resolution • spatial resolution
Sample Characteristic(s) global location • North America • terrestrial habitat
University of California, Irvine, E4130 Engineering Gateway Irvine, Irvine, CA 92697-2175, USA.
Correspondence and requests for materials should be addressed to A.A. (email: [email protected]).
OPENSUBJECT CATEGORIES
» Water resources
» Hydrology
Received: 12 November 2013
Accepted: 10 January 2014
Published: 11 March 2014
www.nature.com/scientificdata
SCIENTIFIC DATA | 1:140001 | DOI: 10.1038/sdata.2014.1 1

Background & SummaryA 2007 ministerial summit with representatives from 70 nations, held in Cape Town, South Africa,recognized the growing problem of drought and its impact on food security and sustainability of waterresources, and highlighted the need for a global drought early warning system1. Drought effects areincremental and happen over a long period of time, hence receive little attention in early phases2.
Each year droughts result in significant socioeconomic losses and ecological damage across the globe.Given the growing population and climate change, water and food security are major challenges facinghumanity3–7. Nearly 1 million people perished in East Africa in the mid-eighties because of a majordrought that led to a widespread famine. More recently, in 2010-2011, two events in East Africa andSoutheast Asia affected 9 million people, causing famine in East Africa and significant ecological impactsin Southeast Asia8,9. Production of adequate food to avoid food crises requires advanced drought earlywarning and prediction systems. In particular, a global model is needed that can support regions wherefamine and food crisis are prevalent because of economic and social instability and climatic variability10.
In recent years, several research and operational drought monitoring models have been developed.However, drought warning and prediction systems are still the least developed systems among othernatural disasters primarily because of the complex processes involved in drought onset and development2.On a regional scale, there are a number of drought monitoring tools tailored for local to continental scaleapplications such as, the U.S. Agency for International Development (USAID) Famine Early WarningSystem Network (FEWS Net)11, United States Drought Monitor12, African Drought Monitor13, and theUniversity of Washington Experimental Surface Water Monitor14,15.
In an interconnected world where a drought in the United States, Russia or Australia could affectglobal food prices16, a regional perspective to drought monitoring and prediction may not be sufficient.Currently, few global drought models are available, including the Global Information and Early WarningSystem on Food and Agriculture (GIEWS), Humanitarian Early Warning Service (HEWS) by the WorldFood Programme (WFP), Global Drought Monitor by the University College London (UCL), theStandardized Precipitation-Evapotranspiration Index Global Drought Monitor17, and the Global DroughtPortal (GDP) by the United States National Climatic Data Center18. The aforementioned models,however, do not provide probabilistic forecasts of drought condition for risk assessment (see ref. 2 for acomprehensive review). For example, the FAO-GIEWS provides monthly briefings on countries underdrought that are facing food crisis. The HEWS gathers drought information from various sources andsummarizes the information into brief descriptions of the current conditions. The UCL and GDP provideinteractive maps of the latest drought condition. While these outputs are valuable, probabilistic seasonaldrought forecasts can substantially improve drought early warning capability.
United Nations Environment Programme (UNEP) report calls for a drought prediction system basedon a comprehensive and integrated approach that would include multiple drought indicators2. Whiledroughts originate from a deficit in precipitation, an effective drought monitoring and prediction systemshould integrate multiple drought-related variables12,19–21. The United Nations (UN) Strategy forDisaster Reduction (ISDR) argues that an early warning system should have the following features22: (a)Monitoring and predicting components, (b) Risk knowledge, (c) Disseminating information, and (d)Response.
Following the above recommendation, the Global Integrated Drought Monitoring and PredictionSystem (GIDMaPS) is developed to provide drought information based on multiple drought indicatorsand input data sets. GIDMaPS includes a seasonal probabilistic prediction component that supports riskknowledge. The probabilistic forecasts offer essential information for early warning, preventive measures,and mitigation strategies. GIDMaPS provides both monitoring and prediction components, as well as adata dissemination interface.
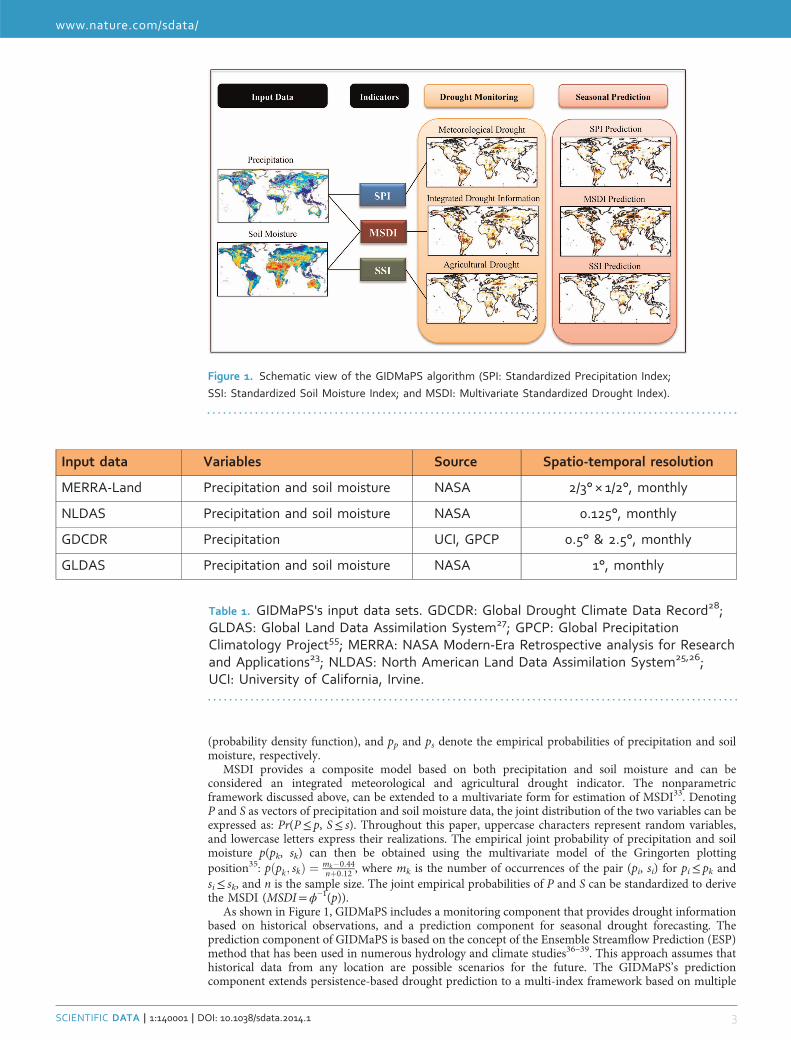
MethodsGIDMaPS drought monitoring and predictionThe algorithm of the GIDMaPS is schematically illustrated in Figure 1. GIDMaPS integrates precipitationand soil moisture data from model simulations and remote sensing observations including the Modern-Era Retrospective analysis for Research and Applications (MERRA-Land23,24), North American LandData Assimilation System (NLDAS25,26), Global Land Data Assimilation System (GLDAS27) and theGlobal Drought Climate Data Record (GDCDR28). GDCDR combines real-time Precipitation Estimationfrom Remotely Sensed Information using Artificial Neural Networks (PERSIANN) satellite data29,30 withlong-term GPCP31 observations using a Bayesian algorithm. Table 1 summarizes the input data sets, theirspatial resolutions, and providers.
GIDMaPS uses three drought indicators for monitoring and prediction: the Standardized PrecipitationIndex (SPI32), Standardized Soil Moisture Index (SSI20), and Multivariate Standardized Drought Index(MSDI33). SPI and SSI are indicators of meteorological and agricultural drought, respectively. Both SPIand SSI are derived using a nonparametric approach outlined in33. In this method, the marginalprobability distribution of precipitation and soil moisture are computed using the empirical Gringortenplotting position34. In other words, instead of fitting a parametric distribution function, the probabilitiesof observed precipitation and soil moisture are computed empirically. The empirical probabilities arethen standardized as SPI=ϕ�1(pp) and SSI=ϕ�1(ps) where ϕ is the standard normal distribution
www.nature.com/sdata/
SCIENTIFIC DATA | 1:140001 | DOI: 10.1038/sdata.2014.1 2
(probability density function), and pp and ps denote the empirical probabilities of precipitation and soilmoisture, respectively.
MSDI provides a composite model based on both precipitation and soil moisture and can beconsidered an integrated meteorological and agricultural drought indicator. The nonparametricframework discussed above, can be extended to a multivariate form for estimation of MSDI33. DenotingP and S as vectors of precipitation and soil moisture data, the joint distribution of the two variables can beexpressed as: Pr(P≤ p, S≤ s). Throughout this paper, uppercase characters represent random variables,and lowercase letters express their realizations. The empirical joint probability of precipitation and soilmoisture p(pk, sk) can then be obtained using the multivariate model of the Gringorten plottingposition35: pðpk; skÞ ¼ mk�0:44
nþ0:12 , where mk is the number of occurrences of the pair (pi, si) for pi≤ pk andsi≤ sk, and n is the sample size. The joint empirical probabilities of P and S can be standardized to derivethe MSDI (MSDI=ϕ−1(p)).
As shown in Figure 1, GIDMaPS includes a monitoring component that provides drought informationbased on historical observations, and a prediction component for seasonal drought forecasting. Theprediction component of GIDMaPS is based on the concept of the Ensemble Streamflow Prediction (ESP)method that has been used in numerous hydrology and climate studies36–39. This approach assumes thathistorical data from any location are possible scenarios for the future. The GIDMaPS’s predictioncomponent extends persistence-based drought prediction to a multi-index framework based on multiple
Figure 1. Schematic view of the GIDMaPS algorithm (SPI: Standardized Precipitation Index;
SSI: Standardized Soil Moisture Index; and MSDI: Multivariate Standardized Drought Index).
Input data Variables Source Spatio-temporal resolution
MERRA-Land Precipitation and soil moisture NASA 2/3° × 1/2°, monthly
NLDAS Precipitation and soil moisture NASA 0.125°, monthly
GDCDR Precipitation UCI, GPCP 0.5° & 2.5°, monthly
GLDAS Precipitation and soil moisture NASA 1°, monthly
Table 1. GIDMaPS's input data sets. GDCDR: Global Drought Climate Data Record28;GLDAS: Global Land Data Assimilation System27; GPCP: Global PrecipitationClimatology Project55; MERRA: NASA Modern-Era Retrospective analysis for Researchand Applications23; NLDAS: North American Land Data Assimilation System25,26;UCI: University of California, Irvine.
www.nature.com/sdata/
SCIENTIFIC DATA | 1:140001 | DOI: 10.1038/sdata.2014.1 3

variables, providing short-term forecasts based on both univariate (SPI, SSI) and multivariate (MSDI)drought indicators.
Let's assume an n-year climatology is available and drought condition in month m of year n+1 is to bepredicted. GIDMaPS utilizes 6 month accumulated precipitation (APn+1,m) and soil moisture (ASn+1,m)for month m of year n+1 as predictants:
APnþ1;m ¼ Pnþ1;m�5 þ Pnþ1;m�4 þ Pnþ1;m�3 þ Pnþ1;m�2 þ Pnþ1;m�1 þ Pnþ1;m ð1ÞASnþ1;m ¼ Snþ1;m�5 þ Snþ1;m�4 þ Snþ1;m�3 þ Snþ1;m�2 þ Snþ1;m�1 þ Snþ1;m ð2ÞHere, the terms Pn+1,m and Sn+1,m refer to precipitation and soil moisture in the target month m (1-monthlead). The other terms are initial conditions for the target month predictions (for m¼ 1 initial conditionswill be sampled from year n). In a persistence-based model, predictions of Pn+1,m and Sn+1,m for the targetmonth m can be sampled based on n previous observations of precipitation and soil moisture from theclimatology:
APinþ1;m ¼ Pnþ1;m�5 þ Pnþ1;m�4 þ Pnþ1;m�3 þ Pnþ1;m�2 þ Pnþ1;m�1 þ Pi;m; i ¼ 1; ¼ ; n ð3Þ
ASinþ1;m ¼ Snþ1;m�5 þ Snþ1;m�4 þ Snþ1;m�3 þ Snþ1;m�2 þ Snþ1;m�1 þ Si;m; i ¼ 1; ¼ ; n ð4ÞHaving AP1,m,…,APn,m and AS1,m,…,ASn m from equations 3 and 4, the MSDIi can be computed as:
MSDIi ¼ PðAP�APinþ1;m;AS�ASinþ1;mÞ; i ¼ 1; ¼ ; n ð5Þ
Basically, in this approach, an n-year climatology (historical observations) leads to an n-memberensemble. GIDMaPS uses the ensemble median as a measure of drought severity. Having an ensemble ofpredictions, GIDMaPS offers the probability of drought occurrence for any given drought threshold. Forexample, for a standardized index (e.g., SPI, SSI, MSDI), the occurrence probability of drought below acertain threshold can be estimated as the number of ensemble members nx below the choice of thresholddivided by the total number of members (nx/n). Source code is available from the figshare recordassociated with this publication (Data Citation 1).
Standardized index D-scale Description
−0.50 to −0.79 D0 Abnormally dry
−0.80 to −1.29 D1 Moderate drought
−1.30 to −1.59 D2 Severe drought
−1.60 to −1.99 D3 Extreme drought
−2.0 or less D4 Exceptional drought
Table 2. Drought severity information in both the original standardized scale and theircorresponding D-scale.
Data records Availability Resolution
MERRA-based SPI, SSI and MSDI 1980-present 2/3° × 1/2°
NLDAS-based SPI, SSI and MSDI 1979-present 0.125°
GDCDR-based SPI 1980-present 0.5° & 2.5°
GLDAS-based SPI, SSI and MSDI 1949-present 1°
Table 3. GIDMaPS's output data records. GDCDR: Global Drought Climate Data Record;GLDAS: Global Land Data Assimilation System; MERRA: NASA Modern-EraRetrospective analysis for Research and Applications; MSDI: Multivariate StandardizedDrought Index; NLDAS: North American Land Data Assimilation System; SPI:Standardized Precipitation Index; SSI: Standardized Soil Moisture Index.
www.nature.com/sdata/
SCIENTIFIC DATA | 1:140001 | DOI: 10.1038/sdata.2014.1 4

Data RecordsGIDMaPS's data records are standardized drought indices in which a negative (positive) value indicates arelatively dry (wet) spell. The monitoring component of GIDMaPS provides information on droughtseverity in both the original standardized scale and the so-called D-scale12 (see Table 2). The predictioncomponent offers probability of drought occurrence computed for different drought severity levels. Forexample, the prediction component provides the probability of a drought index below −0.8 or D1 droughtseverity.
GIDMaPS data sets are available to the public through an unrestricted repository at http://dx.doi.org/10.6084/m9.figshare.853801 (Data Citation 1) in a simple ASCII format (Longitude, Latitude, DroughtSeverity). These data sets provide a static representation of the data at the time of publication, as acomplement to the periodically updating data distribution system available at http://drought.eng.uci.edu/.The data distribution system delivers both graphical images and raw data. Table 3 summarizes theGIDMaPS drought information outputs. The prediction data sets provide 1 to 6 month lead forecastsbased on the indices shown in Table 3, and from the last monitoring data available. The system runs on adaily basis and updates the data record upon availability of new input data sets (Table 1).
Technical ValidationSample drought monitoring outputs based on GIDMaPS indicators are presented in Figure 2. The threerows in Figure 2 display global drought information based on SPI, SSI and MSDI for 2010 and 2011. Asshown, the 2010 Amazon drought40, 2010 Russian drought16, 2011 Texas-Mexico drought41 and 2011East Africa drought9 are well captured by GIDMaPS.
For events shown in Figure 2, the 2 month lead drought predictions are presented in Figure 3. Noticethat the scales of the two figures are different. The monitoring component provides drought severity,whereas the prediction component offers the probability of drought occurrence computed, as described inthe Methods section. It is worth pointing out that probability of drought occurrence can be computed fordifferent drought severity thresholds (Methods Section). Figure 3, for example, provides probability of
Figure 2. Drought monitoring based on multiple indicators: Standardized Precipitation Index (SPI; 1st row);
Standardized Soil Moisture Index (SSI; 2nd row); and Multivariate Standardized Drought Index (MSDI; 3rd
row). The SPI shows meteorological drought, whereas the SSI represents agricultural drought. MSDI is a
composite model of both meteorological-agricultural drought conditions. Input data sets include MERRA-
Land precipitation and soil moisture fields.
www.nature.com/sdata/
SCIENTIFIC DATA | 1:140001 | DOI: 10.1038/sdata.2014.1 5
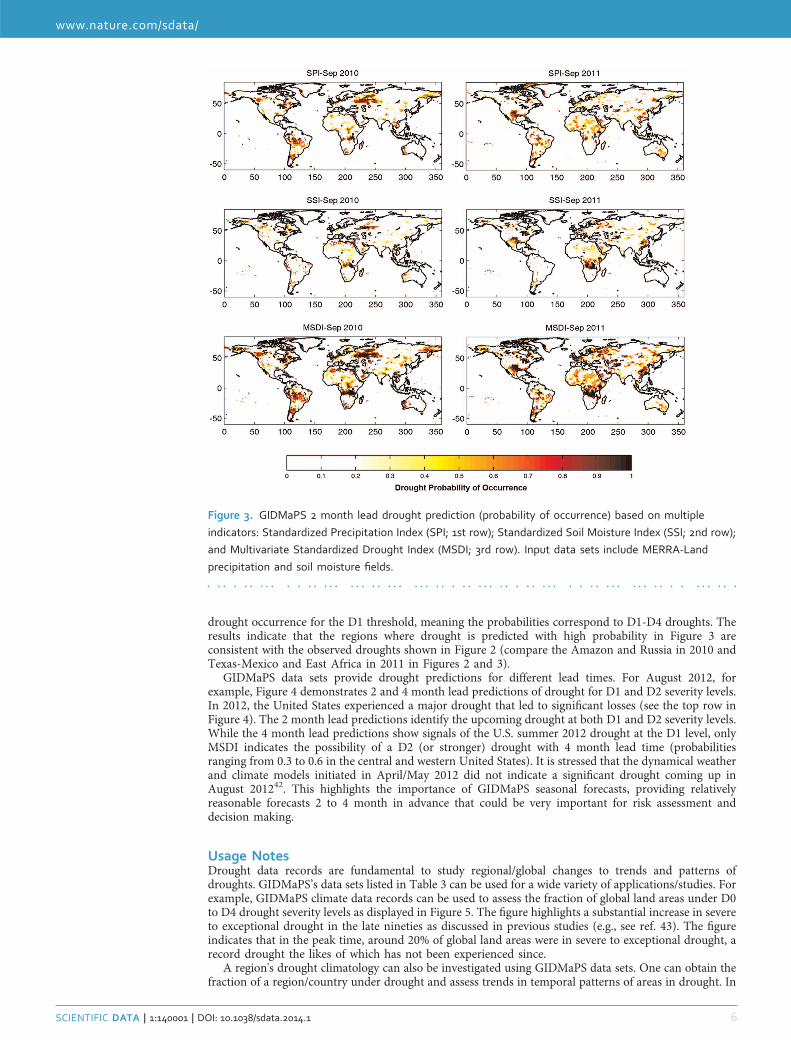
drought occurrence for the D1 threshold, meaning the probabilities correspond to D1-D4 droughts. Theresults indicate that the regions where drought is predicted with high probability in Figure 3 areconsistent with the observed droughts shown in Figure 2 (compare the Amazon and Russia in 2010 andTexas-Mexico and East Africa in 2011 in Figures 2 and 3).
GIDMaPS data sets provide drought predictions for different lead times. For August 2012, forexample, Figure 4 demonstrates 2 and 4 month lead predictions of drought for D1 and D2 severity levels.In 2012, the United States experienced a major drought that led to significant losses (see the top row inFigure 4). The 2 month lead predictions identify the upcoming drought at both D1 and D2 severity levels.While the 4 month lead predictions show signals of the U.S. summer 2012 drought at the D1 level, onlyMSDI indicates the possibility of a D2 (or stronger) drought with 4 month lead time (probabilitiesranging from 0.3 to 0.6 in the central and western United States). It is stressed that the dynamical weatherand climate models initiated in April/May 2012 did not indicate a significant drought coming up inAugust 201242. This highlights the importance of GIDMaPS seasonal forecasts, providing relativelyreasonable forecasts 2 to 4 month in advance that could be very important for risk assessment anddecision making.
Usage NotesDrought data records are fundamental to study regional/global changes to trends and patterns ofdroughts. GIDMaPS’s data sets listed in Table 3 can be used for a wide variety of applications/studies. Forexample, GIDMaPS climate data records can be used to assess the fraction of global land areas under D0to D4 drought severity levels as displayed in Figure 5. The figure highlights a substantial increase in severeto exceptional drought in the late nineties as discussed in previous studies (e.g., see ref. 43). The figureindicates that in the peak time, around 20% of global land areas were in severe to exceptional drought, arecord drought the likes of which has not been experienced since.
A region's drought climatology can also be investigated using GIDMaPS data sets. One can obtain thefraction of a region/country under drought and assess trends in temporal patterns of areas in drought. In
Figure 3. GIDMaPS 2 month lead drought prediction (probability of occurrence) based on multiple
indicators: Standardized Precipitation Index (SPI; 1st row); Standardized Soil Moisture Index (SSI; 2nd row);
and Multivariate Standardized Drought Index (MSDI; 3rd row). Input data sets include MERRA-Land
precipitation and soil moisture fields.
www.nature.com/sdata/
SCIENTIFIC DATA | 1:140001 | DOI: 10.1038/sdata.2014.1 6

Figure 4. 2 and 4 month lead predictions of moderate (D1) and severe (D2) drought conditions for
August 2012.
Figure 5. Fraction of the global land in D0 (abnormally dry), D1 (moderate), D2 (severe), D3 (extreme),
and D4 (exceptional) drought condition (Data: Standardized Precipitation Index data derived from
MERRA-Land).
www.nature.com/sdata/
SCIENTIFIC DATA | 1:140001 | DOI: 10.1038/sdata.2014.1 7

a recent study, global trends and spatial patterns of droughts are investigated using GIDMaPS data44.Additionally, users can evaluate drought duration and severity in historical records. As an example, thetime series of the 6 month SPI for Namibia and Melbourne, derived from GIDMaPS, are presented inFigure 6. The figure shows that both regions often experience multi-year dry and wet periods. Thisinformation can be used to place a specific drought, such as the Australian Millennium Drought45 (see1997–2009 in Figure 6), in perspective relative to historical observations. Combined with other data sets(e.g., global temperature data), GIDMaPS data can be used to assess changes in drought and heatwaves46
or warm/dry, cold/dry conditions47.GIDMaPS data records can also be of interest to ecologists for studying the effects of historical
droughts on vegetation growth, tree mortality, and ecosystem behavior. Furthermore, water and energyresources as well as the agricultural sector are sensitive to droughts48–50. The 2012 United States drought,for example, resulted in over $12 billion in economic loss, and significant indirect effects on the globalfood prices51. Seasonal prediction of drought conditions can provide resource managers with valuableinformation for decision making and disaster preparedness.
Finally, dynamic models that provide global seasonal drought forecasts exhibit very high uncertaintyand low seasonal prediction skill52–54. It is our vision that drought information should be based on a widevariety of sources, data, indicators, and models. GIDMaPS provides a different perspective using astatistical model extended for multivariate drought monitoring and prediction. We stress the purpose ofGIDMaPS is not to replace the currently available dynamic models. Rather, GIDMaPS data sets should beused as additional source of drought information to improve current capabilities in drought monitoringand prediction.
References1. Heim, R. R. Jr & Brewer, M. J. The global drought monitor portal: The foundation for a global drought information system. EarthInteractions 16, 1–28 (2012).
2. Grasso, V. F. & Singh, A. Early warning systems: State-of-art analysis and future directions. (United Nations EnvironmentProgramme, 2011).
3. Gilding, E. K. et al. Allelic variation at a single gene increases food value in a drought-tolerant staple cereal. Nat. Commun. 4: 1483doi: 10.1038/ncomms2450 (2013).
4. Wheeler, T. & von Braun, J. Climate change impacts on global food security. Science 341, 508–513 (2013).5. MacMillan, T. Food security: Eating globally. Nature 486, 30–31 (2012).6. Godfray, H. C. J et al. Food security: The challenge of feeding 9 billion people. Science 327, 812–818 (2010).7. Schmidhuber, J. & Tubiello, F. N. Global food security under climate change. Proc. Natl. Acad. Sci. 104, 19703–19708 (2007).8. Guha-Sapir, D., Vos, F., Below, R. & Ponserre, S. Annual disaster statistical review 2010: The numbers and trends. (Centre forResearch on the Epidemiology of Disasters, 2011).
9. Funk, C. We thought trouble was coming. Nature 476, 7 (2011).10. Lobell, D. B. et al., Prioritizing climate change adaptation needs for food security in 2030. Science 319, 607–610 (2008).11. Funk, C. New satellite observations and rainfall forecasts help provide earlier warning of african drought. The Earth Observer 21,
23–27 (2009).12. Svoboda, M. et al. The drought monitor. Bull. Amer. Meteor. Soc. 83, 1181–1190 (2002).13. Sheffield, J., Wood, E., Lettenmaier, D. & Lipponen, A. Experimental drought monitoring for Africa. GEWEX News 18,
4–6 (2008).14. Wood, A. W. & Lettenmaier, D. P. A test bed for new seasonal hydrologic forecasting approaches in the western United States.
Bull. Amer. Meteor. Soc. 87, 1699–1712 (2006).
Figure 6. Time series of the 6 month Standardized Precipitation Index (SPI) averaged over Namibia (top)
and Melbourne, Australia (bottom) between 1980–2012.
www.nature.com/sdata/
SCIENTIFIC DATA | 1:140001 | DOI: 10.1038/sdata.2014.1 8
15. Shukla, S., Steinemann, A. C. & Lettenmaier, D. P. Drought monitoring for Washington State: Indicators and applications.J. Hydrometeorol. 12, 66–83 (2011).
16. Wegren, S. K. Food security and Russia's 2010 drought. Eurasian Geography and Economics 2, 140–156 (2011).17. Vicente-Serrano, S. M., Begueria, S. & Lopez-Moreno, J. I. A multiscalar drought index sensitive to global warming: The
standardized precipitation evapotranspiration index. J. Climate 23, 1696–1718 (2010).18. Pozzi, W et al. Toward global drought early warning capability. Bull. Amer. Meteor. Soc. 94.19. Drought monitoring and early warning: Concepts, progress and future challenges. World Meteorological Organization (2006).20. Hao, Z. & AghaKouchak, A. Multivariate standardized drought index: A parametric multi-index model. Adv. Water Resour. 57,
12–18 (2013).21. Mishra, A. K & Singh, V. P. A review of drought concepts. J. Hydrol. 391, 204–216 (2010).22. United Nations. Global survey of early warning systems. (United Nations Report, 2006).23. Reichle, R. H et al. Assessment and Enhancement of MERRA land surface hydrology estimates. J. Climate. 24, 6322–6338 (2011).24. Bosilovich, M. G., Robertson, F. R. & Chen, J. Global Energy and Water Budgets in MERRA. J. Climate. 24, 5721–5739 (2011).25. Kumar, S et al. Land information system: An interoperable framework for high resolution land surface modeling. Environ. Modell.
Softw. 21, 1402–1415 (2006).26. Rodell, M. et al. The global land data assimilation system. Bull. Amer. Meteor. Soc. 85, 381–394 (2004).27. Peters-Lidard, C et al. High-performance Earth system modeling with NASA/GSFC's land information system. Innovations Syst.
Softw. Eng. 3, 157–165 (2007).28. AghaKouchak, A. & Nakhjiri, N. A near real-time satellite-based global drought climate data record. Environ. Res. Lett. 7,
044037 (2012).29. Sorooshian, S. et al. Evolution of the PERSIANN system satellite-based estimates of tropical rainfall. Bull. Amer. Meteor. Soc. 81,
2035–2046 (2000).30. Hsu, K., Gao, X., Sorooshian, S. & Gupta, H. Precipitation estimation from remotely sensed information using artificial neural
networks. J. Appl. Meteor. 36, 1176–1190 (1997).31. Adler, R., Kidd, C., Grant, P., Morissey, M. & Goodman, H. M. Intercomparison of global precipitation products: The third
precipitation intercomparison project (PIP-3). Bull. Amer. Meteor. Soc. 82, 1377–1396 (2001).32. McKee, T., Doesken, N. & Kleist, J. The relationship of drought frequency and duration to time scales. In Proceedings of the 8th
Conference of Applied Climatology. American Meteorological Society, 179–184 (1993).33. Hao, Z. & AghaKouchak, A. A multivariate multi-index drought modeling framework. J. Hydrometeor. 15, 89–101 (2014).34. Gringorten, I. I. A plotting rule for extreme probability paper. J. Geophys. Res. 68, 813–814 (1963).35. Yue, S., Ouarda, T., Bobee, B., Legendre, P. & Bruneau, P. The Gumbel mixed model for flood frequency analysis. J. Hydrol. 226,
88–100 (1999).36. Lyon, B. et al. Baseline probabilities for the seasonal prediction of meteorological drought. J. Appl. Meteor. Climatol. 51,
1222–1237 (2012).37. Shukla, S. & Lettenmaier, D. Seasonal hydrologic prediction in the United States: understanding the role of initial hydrologic
conditions and seasonal climate forecast skill. Hydrol. Earth Syst. Sci. 158, 3529–3538 (2011).38. Wood, A. & Lettenmaier, D. An ensemble approach for attribution of hydrologic prediction uncertainty. Geophys. Res. Lett. 35,
L14401 (2008).39. Day, G. N. Extended streamflow forecasting using NWSRFS. J. Water Resour. Plann. Manag. 111, 157–170 (1985).40. Lewis, S. L., Brando, P. M., Phillips, O. L., van der Heijden, G. M. F. & Nepstad, D. The 2010 Amazon drought. Science 331 (2011).41. Hoerling, M. et al. Anatomy of an extreme event. J. Climate. 26, 2811–2832 (2013).42. Hoerling, M et al. An interpretation of the origins of the 2012 central great plains drought. (National Oceanic and Atmospheric
Administration, Drought Task Force, 2013).43. Burke, E. J., Brown, S. J. & Christidis, N. Modeling the recent evolution of global drought and projections for the twenty-first
century with the hadley centre climate model. J. Hydrometeor. 7, 1113–1125 (2006).44. Damberg, L. & AghaKouchak, A. Global trends and patterns of drought from space. Theor. Appl. Climatol. 1–8 (2013).45. Grant, S. B et al. Adapting urban water systems to a changing climate: Lessons from the millennium drought in southeast
Australia. Environ. Sci. Technol. Lett. 47, 10727–10734 (2013).46. Coumou, D. & Robinson, A. Historic and future increase in the global land area affected by monthly heat extremes. Environ. Res.
Lett. 8, 034018 (2013).47. Hao, Z., AghaKouchak, A. & Phillips, T. J. Changes in concurrent monthly precipitation and temperature extremes. Environ. Res.
Lett. 8, 034014 (2013).48. MacDonald, G. M. Water. climate change, and sustainability in the southwest. Proc. Natl Acad. Sci. USA 107,
21256–21262 (2010).49. Madani, K. & Lund, J. R. Estimated impacts of climate warming on California’s high-elevation hydropower. Climatic Change 102,
521–538 (2010).50. Simelton, E., Fraser, E. D., Termansen, M., Forster, P. M. & Dougill, A. J. Typologies of crop-drought vulnerability: An empirical
analysis of the socio-economic factors that influence the sensitivity and resilience to drought of three major food crops in China(1961-2001). Environ. Sci. Pol. 12, 438–452 (2009).
51. Crutchfield, S. US drought 2012: Farm and food impacts. (United States Department of Agriculture, Economic Research Service,2012).
52. National Research Council. Completing the Forecast: Characterizing and Communicating Uncertainty for Better Decisions UsingWeather and Climate Forecasts. (National Academies Press, 2006).
53. Lavers, D., Luo, L. & Wood, E. F. A multiple model assessment of seasonal climate forecast skill for applications. Geophys. Res.Lett. 36, L23711 (2009).
54. Livezey, R. E. & Timofeyeva, M. M. The first decade of long-lead US seasonal forecasts: Insights from a skill analysis. Bull. Amer.Meteor. Soc. 89, 843–854 (2008).
55. Adler, R. et al. The version-2 global precipitation climatology project (GPCP) monthly precipitation analysis (1979-present).J. Hydrometeor. 4, 1147–1167 (2003).
Data Citations1. Hao, Z., AghaKouchak, A., Nakhjiri, N. & Farahmand, A. Figshare http://dx.doi.org/10.6084/m9.figshare.853801 (2013).
AcknowledgementsThis study is partially supported by the National Science Foundation (NSF) Awards No. EAR-1316536,and OISE-1243543, and the United States Bureau of Reclamation (USBR) Award No. R11AP81451.
www.nature.com/sdata/
SCIENTIFIC DATA | 1:140001 | DOI: 10.1038/sdata.2014.1 9

Author ContributionsZ.H. and A.A. conceived the study. Z.H. designed the monitoring and prediction components. A.A. wrotethe paper. N.N. developed the data distribution and visualization system. A.F. carried out the study anddata analysis.
Additional informationCompeting financial interests: The contents of this article are solely the opinions of the authors and arenot influenced by the funding agencies. GIDMaPS is a provisional patent, but this does not alter theauthors’ views and evaluation of the model, or adherence to Scientific Data and Nature policies onsharing data, codes and materials. The authors declare no other competing financial interests.
How to cite this article: Hao, Z. et al. Global integrated drought monitoring and prediction system. Sci.Data 1:140001 doi: 10.1038/sdata.2014.1 (2014).
This work is licensed under a Creative Commons Attribution 3.0 Unported License. Theimages or other third party material in this article are included in the article’s Creative
Commons license, unless indicated otherwise in the credit line; if the material is not included under theCreative Commons license, users will need to obtain permission from the license holder to reproduce thematerial. To view a copy of this license, visit http://creativecommons.org/licenses/by/3.0/
Metadata associated with this Data Descriptor is available at http://www.nature.com/sdata/ and isreleased under the CC0 waiver to maximize reuse.
www.nature.com/sdata/
SCIENTIFIC DATA | 1:140001 | DOI: 10.1038/sdata.2014.1 10