Embed Size (px)
Citation preview
Global Ocean Monitoring: Recent Evolution, Current Status, and
Predictions
Prepared byClimate Prediction Center, NCEP/NOAA
May 8, 2015
http://www.cpc.ncep.noaa.gov/products/GODAS/This project to deliver real-time ocean monitoring products is implemented
by CPC in cooperation with NOAA's Climate Observation Division (COD)
Outline• Overview
• Recent highlights– Pacific/Arctic Ocean
– Indian Ocean
– Atlantic Ocean
– Global SST Predictions
* ENSO evolution in 2014/2015
*Sea surface salinity (SSS) monitoring and possible role of ocean salinity on ENSO prediction
2
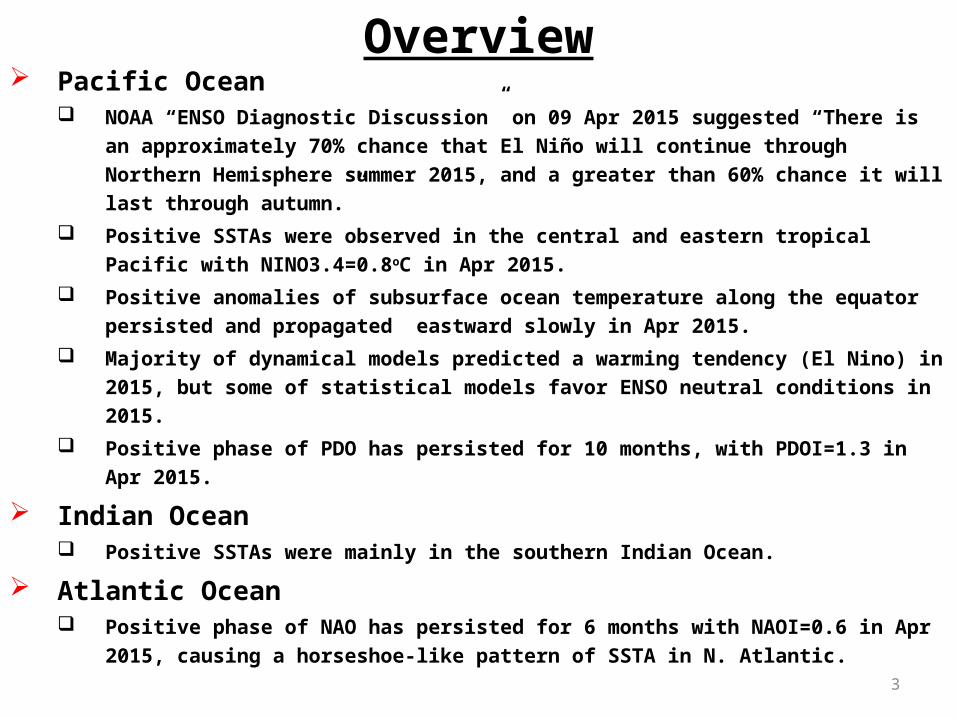
Overview Pacific Ocean
NOAA “ENSO Diagnostic Discussion” on 09 Apr 2015 suggested “There is an approximately 70% chance that El Niño will continue through Northern Hemisphere summer 2015, and a greater than 60% chance it will last through autumn.”
Positive SSTAs were observed in the central and eastern tropical Pacific with NINO3.4=0.8oC in Apr 2015.
Positive anomalies of subsurface ocean temperature along the equator persisted and propagated eastward slowly in Apr 2015.
Majority of dynamical models predicted a warming tendency (El Nino) in 2015, but some of statistical models favor ENSO neutral conditions in 2015.
Positive phase of PDO has persisted for 10 months, with PDOI=1.3 in Apr 2015.
Indian Ocean Positive SSTAs were mainly in the southern Indian Ocean.
Atlantic Ocean Positive phase of NAO has persisted for 6 months with NAOI=0.6 in Apr
2015, causing a horseshoe-like pattern of SSTA in N. Atlantic.3
Global Oceans
4
Global SST Anomaly (0C) and Anomaly Tendency
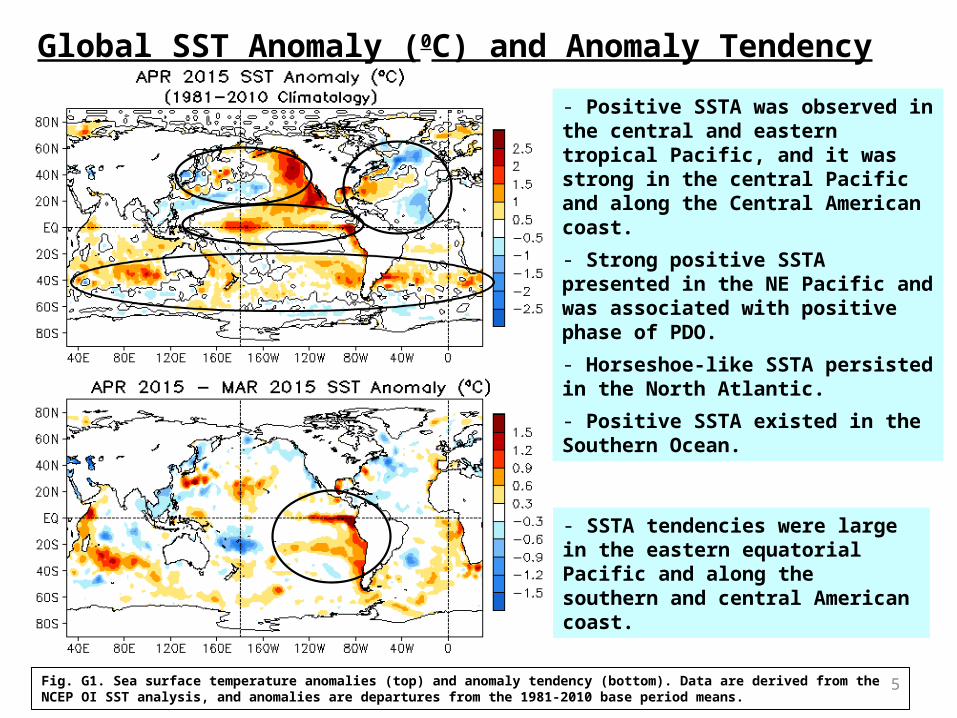
Fig. G1. Sea surface temperature anomalies (top) and anomaly tendency (bottom). Data are derived from the NCEP OI SST analysis, and anomalies are departures from the 1981-2010 base period means.
- Positive SSTA was observed in the central and eastern tropical Pacific, and it was strong in the central Pacific and along the Central American coast.
- Strong positive SSTA presented in the NE Pacific and was associated with positive phase of PDO.
- Horseshoe-like SSTA persisted in the North Atlantic.
- Positive SSTA existed in the Southern Ocean.
- SSTA tendencies were large in the eastern equatorial Pacific and along the southern and central American coast.
5
Longitude-Depth Temperature Anomaly and Anomaly Tendency in 2OS-2ON
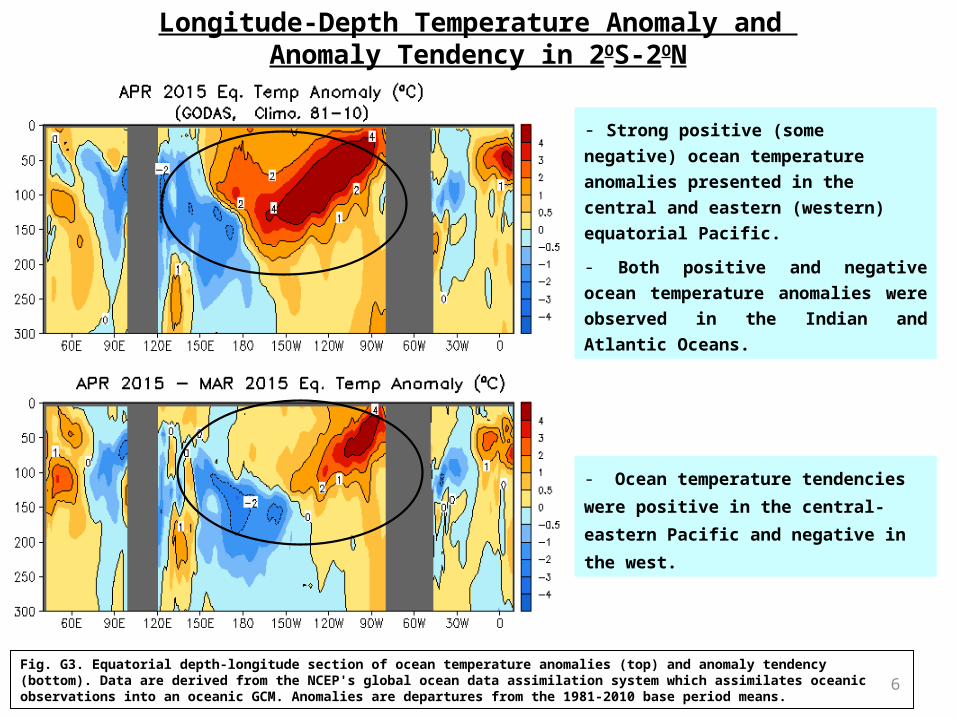
Fig. G3. Equatorial depth-longitude section of ocean temperature anomalies (top) and anomaly tendency (bottom). Data are derived from the NCEP's global ocean data assimilation system which assimilates oceanic observations into an oceanic GCM. Anomalies are departures from the 1981-2010 base period means.
- Strong positive (some negative)
ocean temperature anomalies
presented in the central and
eastern (western) equatorial
Pacific.
- Both positive and negative ocean
temperature anomalies were
observed in the Indian and
Atlantic Oceans.
- Ocean temperature tendencies
were positive in the central-
eastern Pacific and negative in the
west.
6
Tropical Pacific Ocean and ENSO Conditions
7
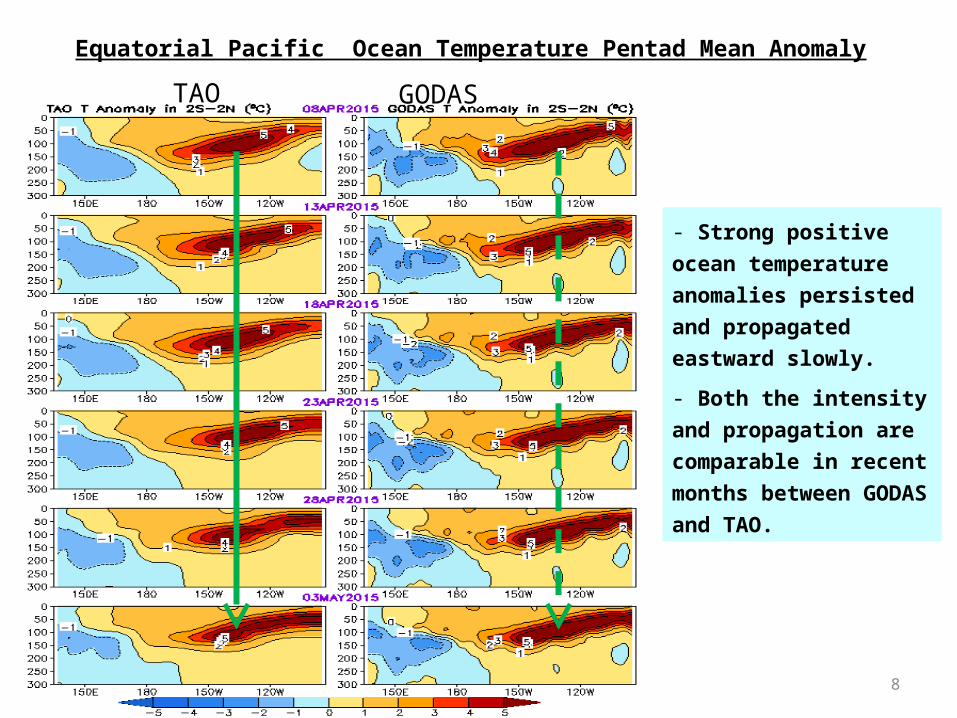
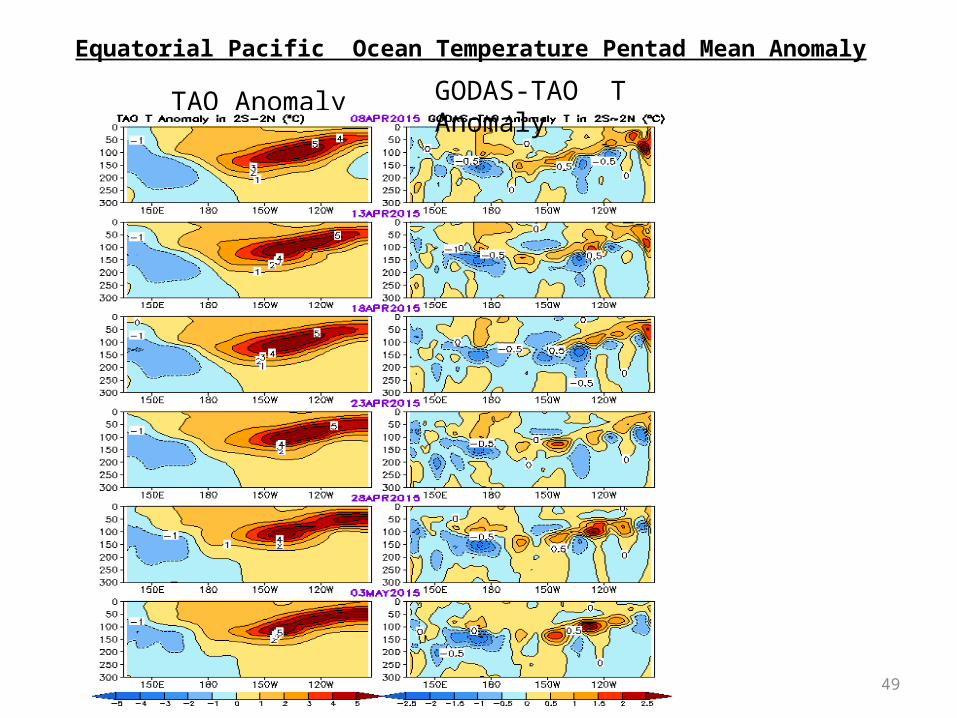
Equatorial Pacific Ocean Temperature Pentad Mean Anomaly
TAO GODAS
- Strong positive
ocean temperature
anomalies persisted
and propagated
eastward slowly.
- Both the intensity
and propagation are
comparable in recent
months between
GODAS and TAO.
8
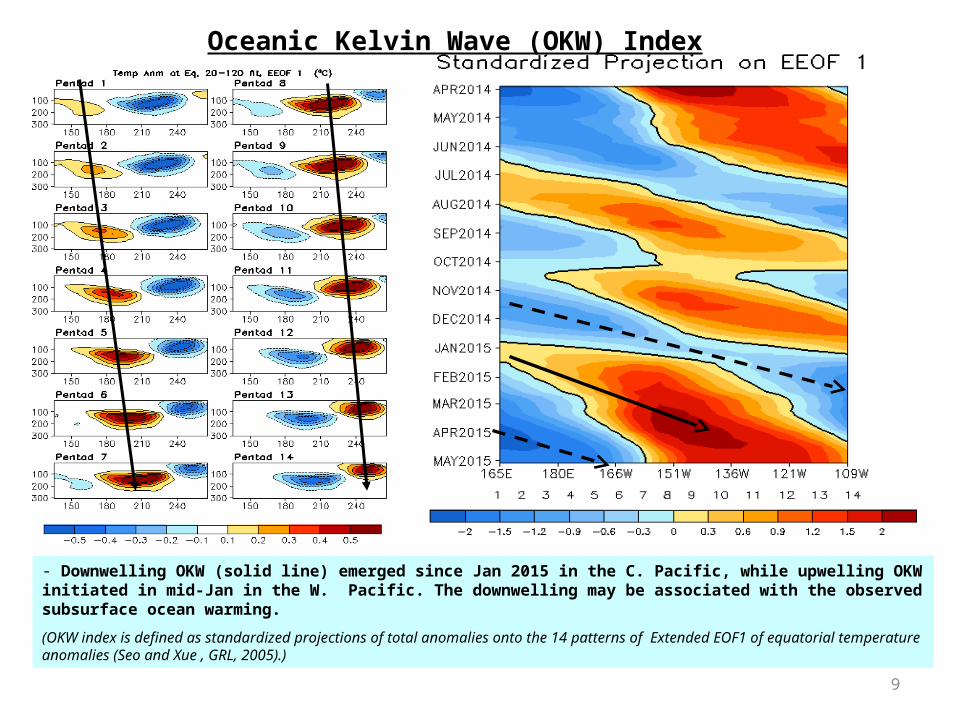
Oceanic Kelvin Wave (OKW) Index
- Downwelling OKW (solid line) emerged since Jan 2015 in the C. Pacific, while upwelling OKW initiated in mid-Jan in the W. Pacific. The downwelling may be associated with the observed subsurface ocean warming.
(OKW index is defined as standardized projections of total anomalies onto the 14 patterns of Extended EOF1 of equatorial temperature anomalies (Seo and Xue , GRL, 2005).)
9
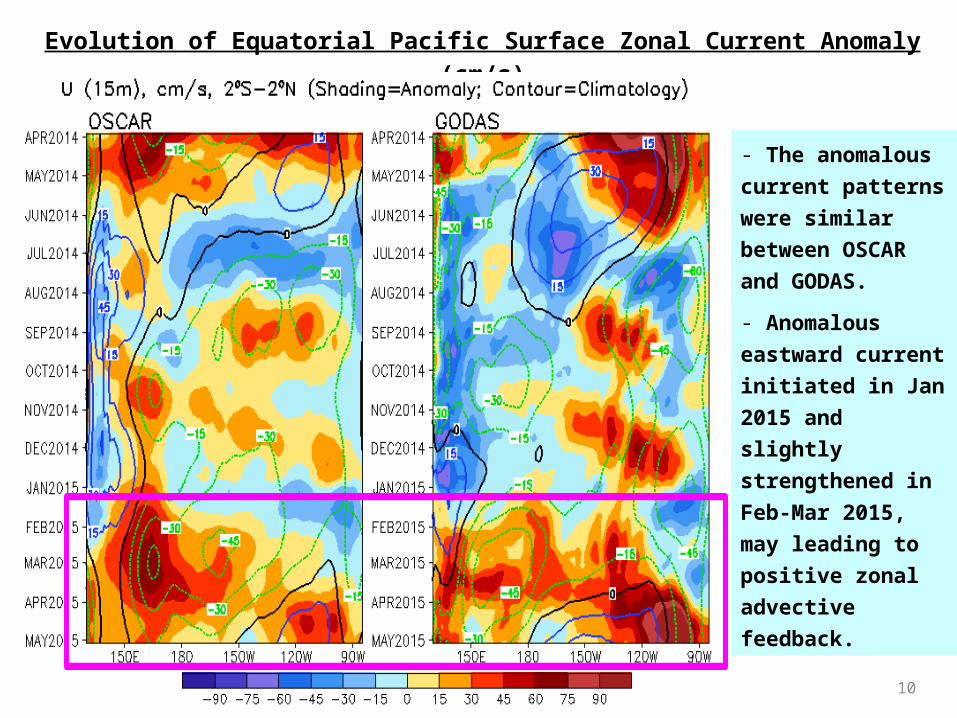
Evolution of Equatorial Pacific Surface Zonal Current Anomaly (cm/s)
- The anomalous
current patterns
were similar
between OSCAR
and GODAS.
- Anomalous
eastward current
initiated in Jan
2015 and
slightly
strengthened in
Feb-Mar 2015,
may leading to
positive zonal
advective
feedback.
10
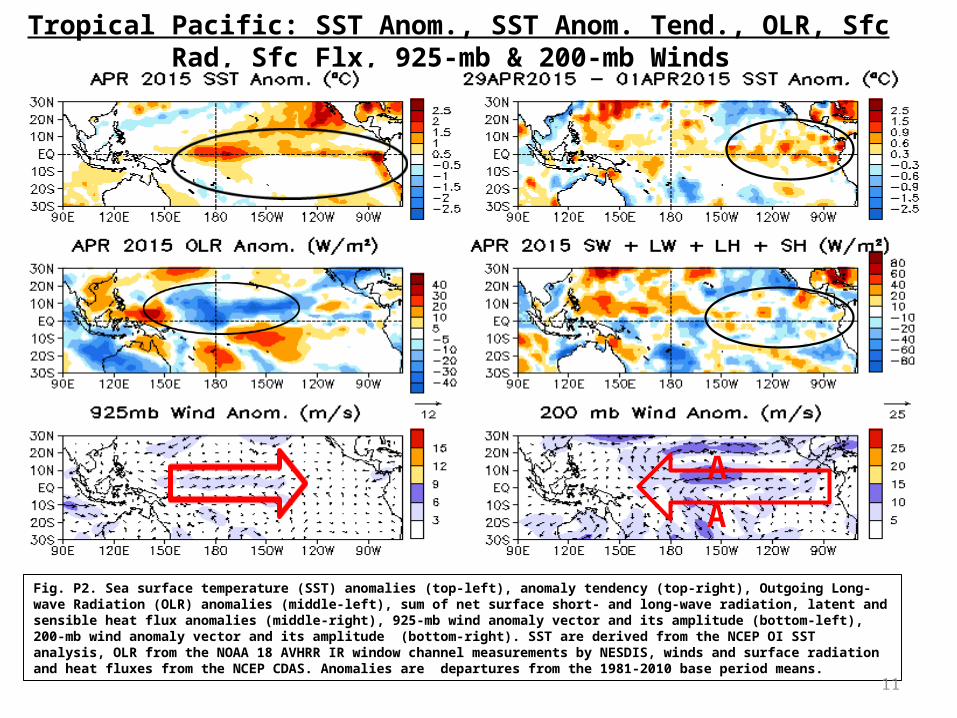
Tropical Pacific: SST Anom., SST Anom. Tend., OLR, Sfc Rad, Sfc Flx, 925-mb & 200-mb Winds
A
Fig. P2. Sea surface temperature (SST) anomalies (top-left), anomaly tendency (top-right), Outgoing Long-wave Radiation (OLR) anomalies (middle-left), sum of net surface short- and long-wave radiation, latent and sensible heat flux anomalies (middle-right), 925-mb wind anomaly vector and its amplitude (bottom-left), 200-mb wind anomaly vector and its amplitude (bottom-right). SST are derived from the NCEP OI SST analysis, OLR from the NOAA 18 AVHRR IR window channel measurements by NESDIS, winds and surface radiation and heat fluxes from the NCEP CDAS. Anomalies are departures from the 1981-2010 base period means.
A
11
A
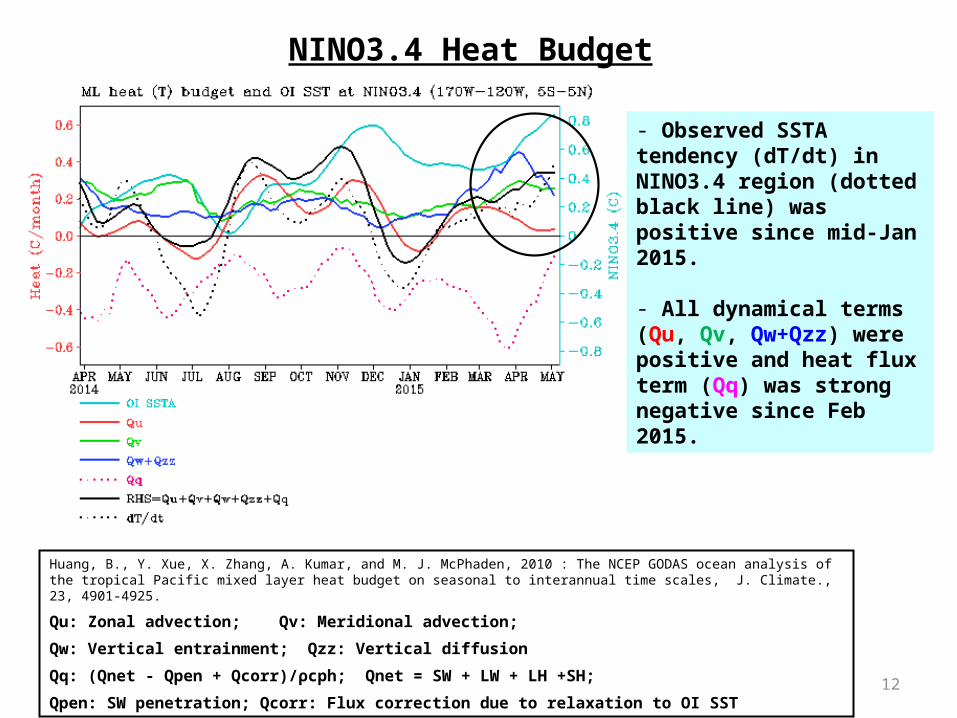
NINO3.4 Heat Budget
Huang, B., Y. Xue, X. Zhang, A. Kumar, and M. J. McPhaden, 2010 : The NCEP GODAS ocean analysis of the tropical Pacific mixed layer heat budget on seasonal to interannual time scales, J. Climate., 23, 4901-4925.
Qu: Zonal advection; Qv: Meridional advection;
Qw: Vertical entrainment; Qzz: Vertical diffusion
Qq: (Qnet - Qpen + Qcorr)/ρcph; Qnet = SW + LW + LH +SH;
Qpen: SW penetration; Qcorr: Flux correction due to relaxation to OI SST
- Observed SSTA tendency (dT/dt) in NINO3.4 region (dotted black line) was positive since mid-Jan 2015.
- All dynamical terms (Qu, Qv, Qw+Qzz) were positive and heat flux term (Qq) was strong negative since Feb 2015.
12
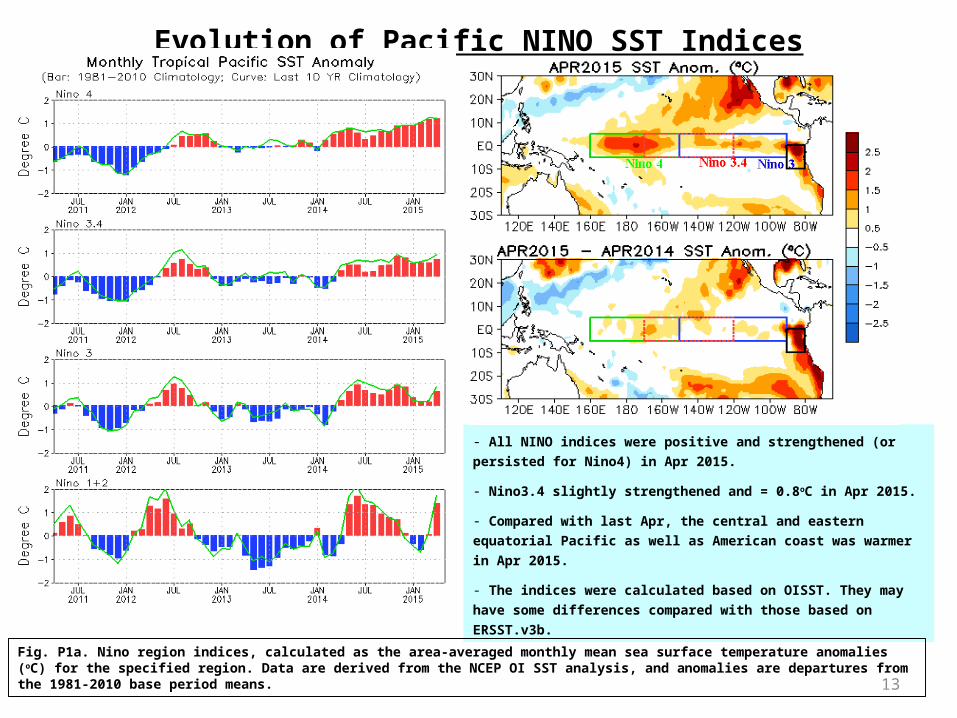
Evolution of Pacific NINO SST Indices
- All NINO indices were positive and strengthened (or
persisted for Nino4) in Apr 2015.
- Nino3.4 slightly strengthened and = 0.8oC in Apr 2015.
- Compared with last Apr, the central and eastern
equatorial Pacific as well as American coast was warmer in
Apr 2015.
- The indices were calculated based on OISST. They may
have some differences compared with those based on
ERSST.v3b.
Fig. P1a. Nino region indices, calculated as the area-averaged monthly mean sea surface temperature anomalies (oC) for the specified region. Data are derived from the NCEP OI SST analysis, and anomalies are departures from the 1981-2010 base period means. 13
North Pacific & Arctic Oceans
14
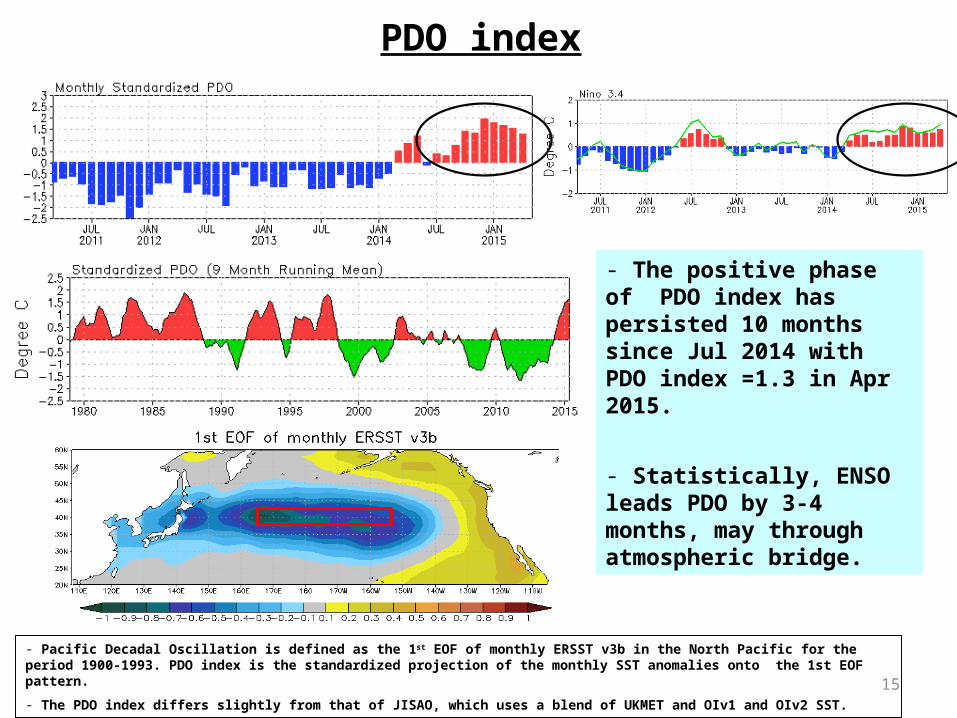
PDO index
- Pacific Decadal Oscillation is defined as the 1st EOF of monthly ERSST v3b in the North Pacific for the period 1900-1993. PDO index is the standardized projection of the monthly SST anomalies onto the 1st EOF pattern.
- The PDO index differs slightly from that of JISAO, which uses a blend of UKMET and OIv1 and OIv2 SST.
- The positive phase of PDO index has persisted 10 months since Jul 2014 with PDO index =1.3 in Apr 2015.
- Statistically, ENSO leads PDO by 3-4 months, may through atmospheric bridge.
15
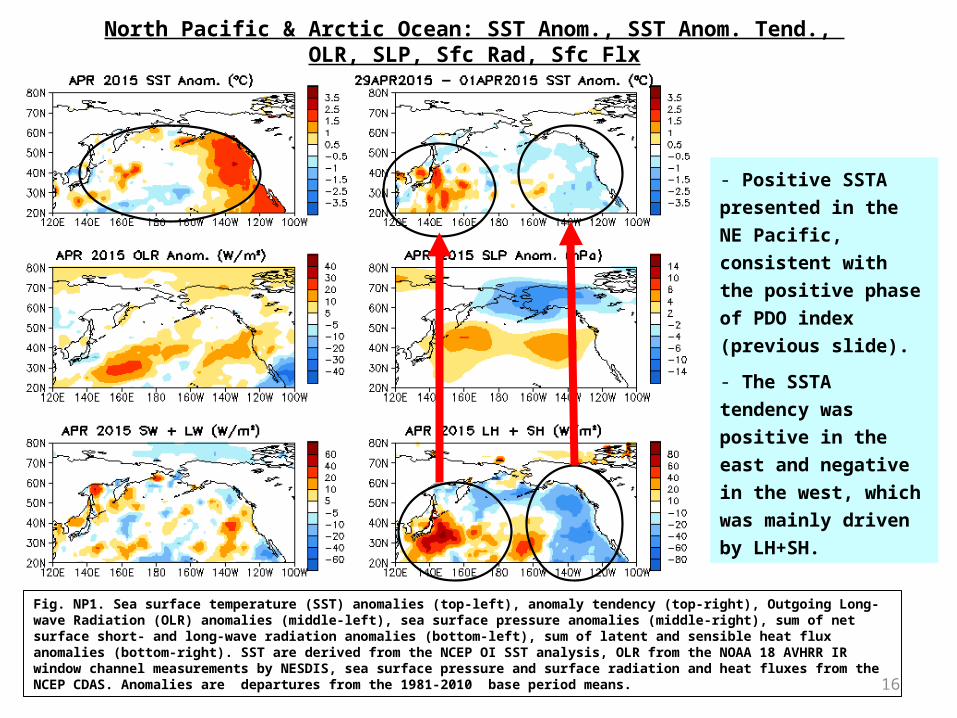
North Pacific & Arctic Ocean: SST Anom., SST Anom. Tend., OLR, SLP, Sfc Rad, Sfc Flx
- Positive SSTA
presented in the
NE Pacific,
consistent with the
positive phase of
PDO index
(previous slide).
- The SSTA
tendency was
positive in the east
and negative in the
west, which was
mainly driven by
LH+SH.
Fig. NP1. Sea surface temperature (SST) anomalies (top-left), anomaly tendency (top-right), Outgoing Long-wave Radiation (OLR) anomalies (middle-left), sea surface pressure anomalies (middle-right), sum of net surface short- and long-wave radiation anomalies (bottom-left), sum of latent and sensible heat flux anomalies (bottom-right). SST are derived from the NCEP OI SST analysis, OLR from the NOAA 18 AVHRR IR window channel measurements by NESDIS, sea surface pressure and surface radiation and heat fluxes from the NCEP CDAS. Anomalies are departures from the 1981-2010 base period means. 16
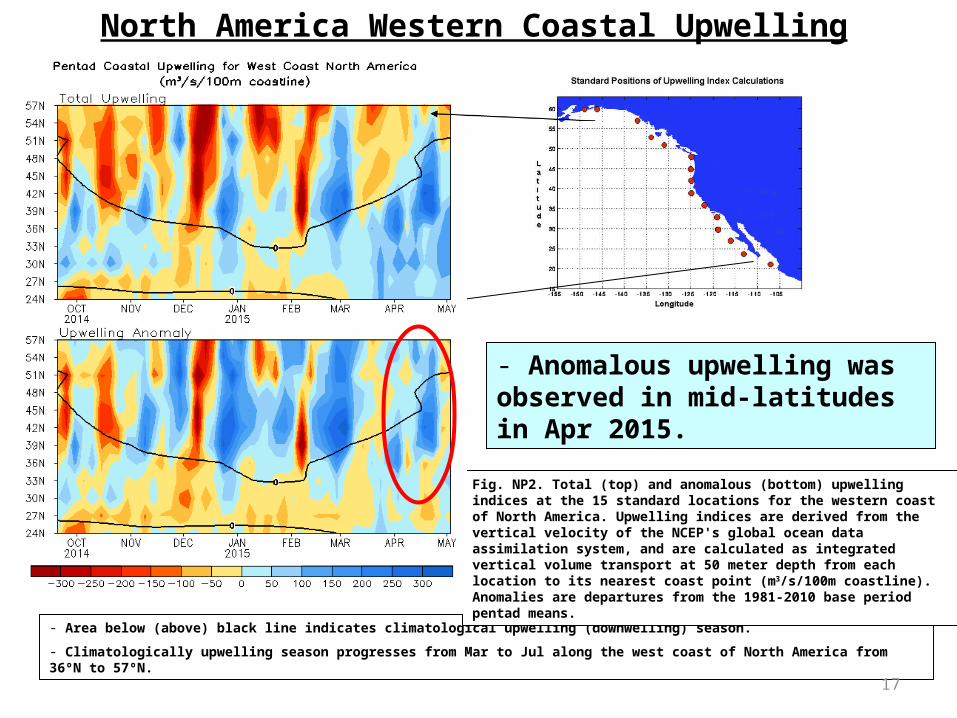
North America Western Coastal Upwelling
- Area below (above) black line indicates climatological upwelling (downwelling) season.
- Climatologically upwelling season progresses from Mar to Jul along the west coast of North America from 36ºN to 57ºN.
Fig. NP2. Total (top) and anomalous (bottom) upwelling indices at the 15 standard locations for the western coast of North America. Upwelling indices are derived from the vertical velocity of the NCEP's global ocean data assimilation system, and are calculated as integrated vertical volume transport at 50 meter depth from each location to its nearest coast point (m3/s/100m coastline). Anomalies are departures from the 1981-2010 base period pentad means.
- Anomalous upwelling was observed in mid-latitudes in Apr 2015.
17
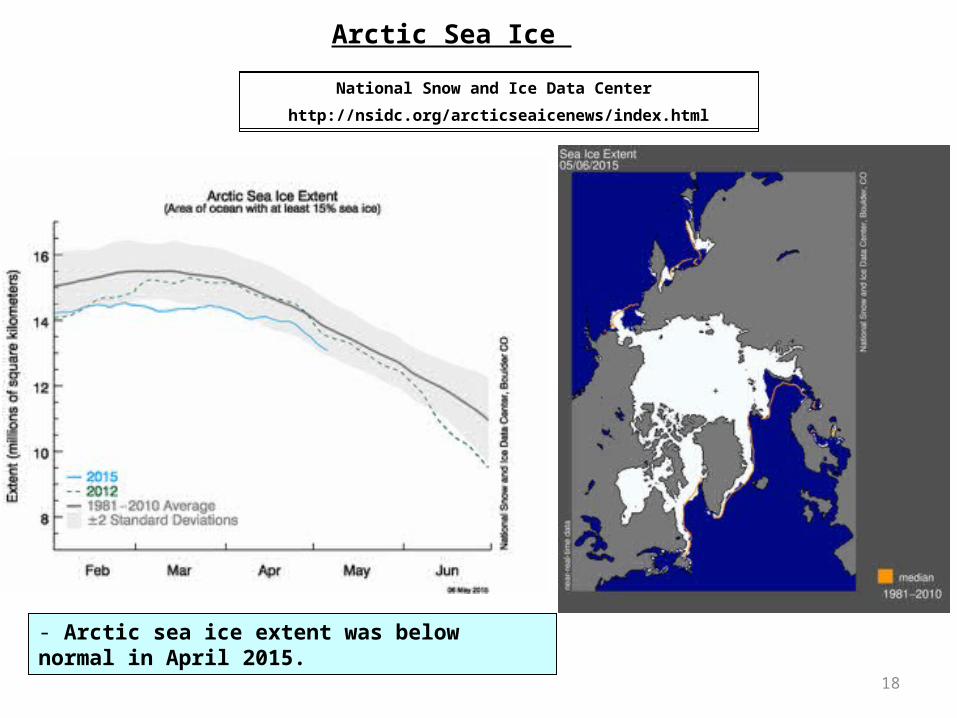
Arctic Sea Ice
National Snow and Ice Data Center
http://nsidc.org/arcticseaicenews/index.html
- Arctic sea ice extent was below normal in April 2015.
18

Indian Ocean
19
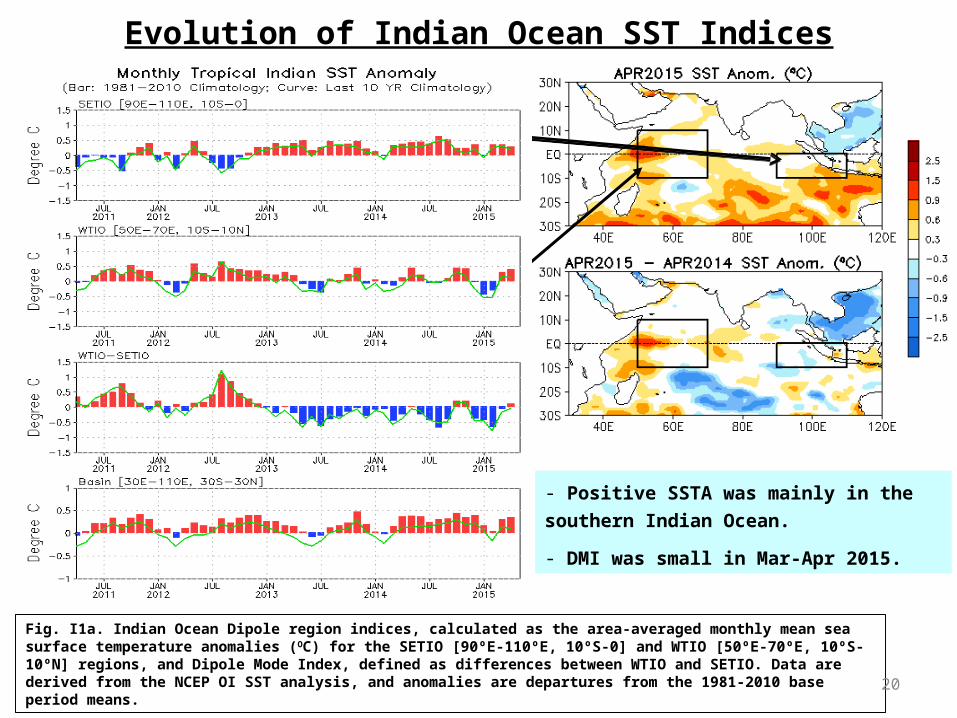
Evolution of Indian Ocean SST Indices
Fig. I1a. Indian Ocean Dipole region indices, calculated as the area-averaged monthly mean sea surface temperature anomalies (OC) for the SETIO [90ºE-110ºE, 10ºS-0] and WTIO [50ºE-70ºE, 10ºS-10ºN] regions, and Dipole Mode Index, defined as differences between WTIO and SETIO. Data are derived from the NCEP OI SST analysis, and anomalies are departures from the 1981-2010 base period means.
- Positive SSTA was mainly in the
southern Indian Ocean.
- DMI was small in Mar-Apr 2015.
20
Tropical and North Atlantic Ocean
21
Evolution of Tropical Atlantic SST Indices
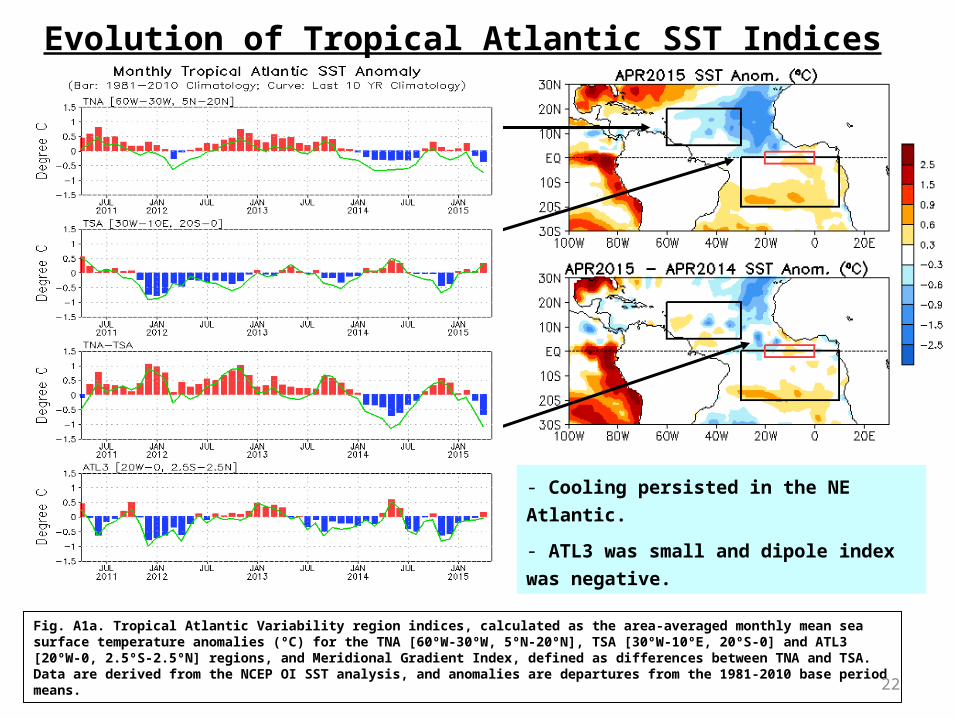
Fig. A1a. Tropical Atlantic Variability region indices, calculated as the area-averaged monthly mean sea surface temperature anomalies (ºC) for the TNA [60ºW-30ºW, 5ºN-20ºN], TSA [30ºW-10ºE, 20ºS-0] and ATL3 [20ºW-0, 2.5ºS-2.5ºN] regions, and Meridional Gradient Index, defined as differences between TNA and TSA. Data are derived from the NCEP OI SST analysis, and anomalies are departures from the 1981-2010 base period means.
- Cooling persisted in the NE
Atlantic.
- ATL3 was small and dipole index
was negative.
22
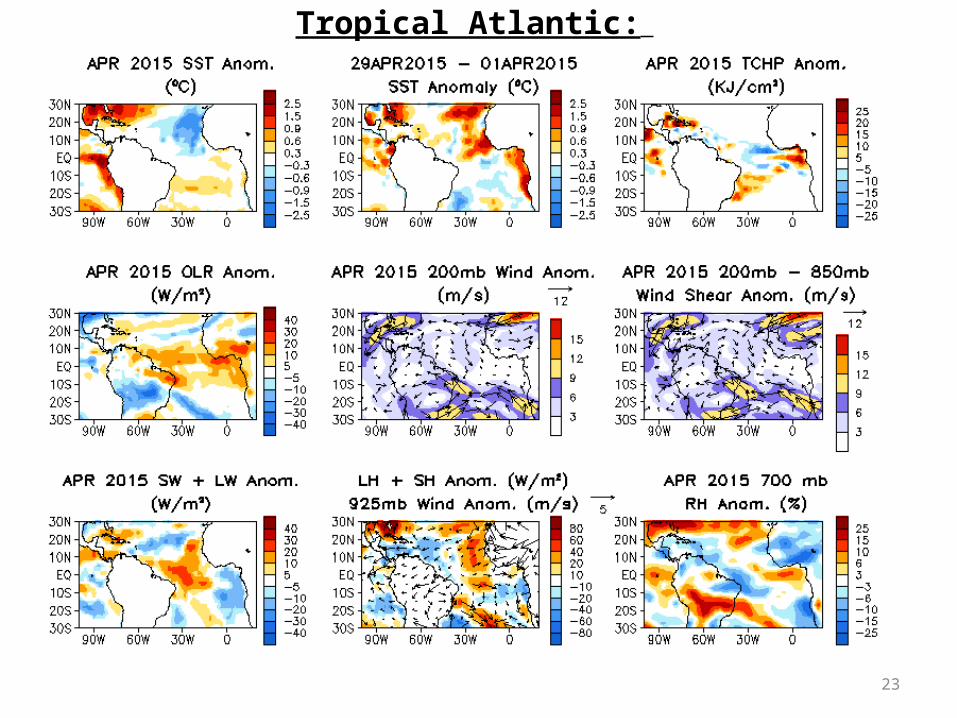
Tropical Atlantic:
23
NAO and SST Anomaly in North Atlantic
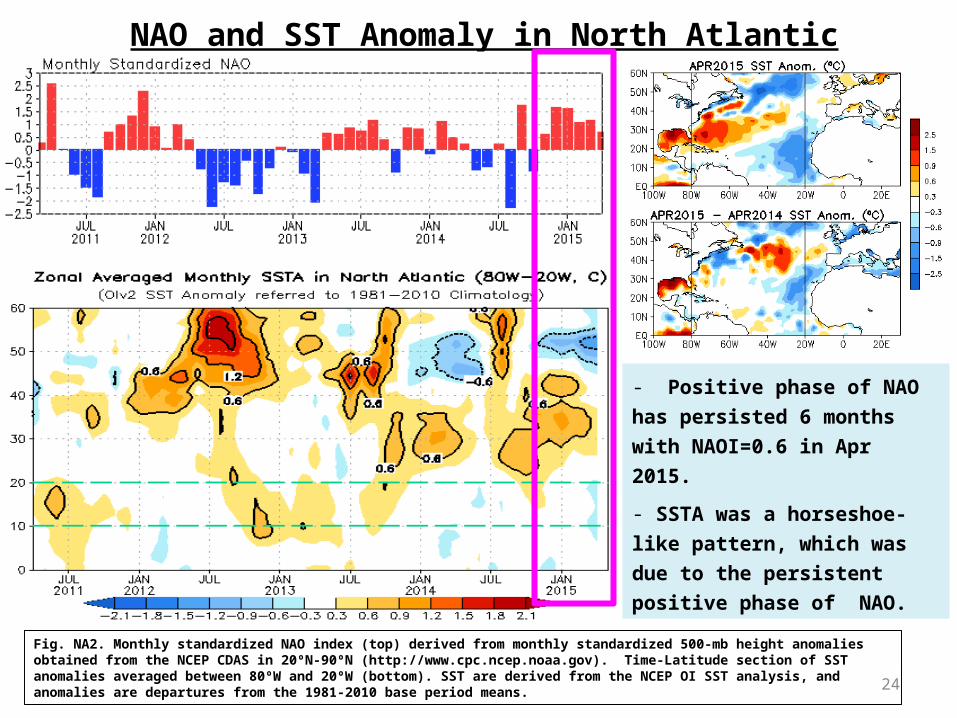
Fig. NA2. Monthly standardized NAO index (top) derived from monthly standardized 500-mb height anomalies obtained from the NCEP CDAS in 20ºN-90ºN (http://www.cpc.ncep.noaa.gov). Time-Latitude section of SST anomalies averaged between 80ºW and 20ºW (bottom). SST are derived from the NCEP OI SST analysis, and anomalies are departures from the 1981-2010 base period means.
- Positive phase of NAO has
persisted 6 months with NAOI=0.6
in Apr 2015.
- SSTA was a horseshoe-like
pattern, which was due to the
persistent positive phase of NAO.
24
North Atlantic: SST Anom., SST
Anom. Tend., OLR, SLP, Sfc Rad, Sfc Flx
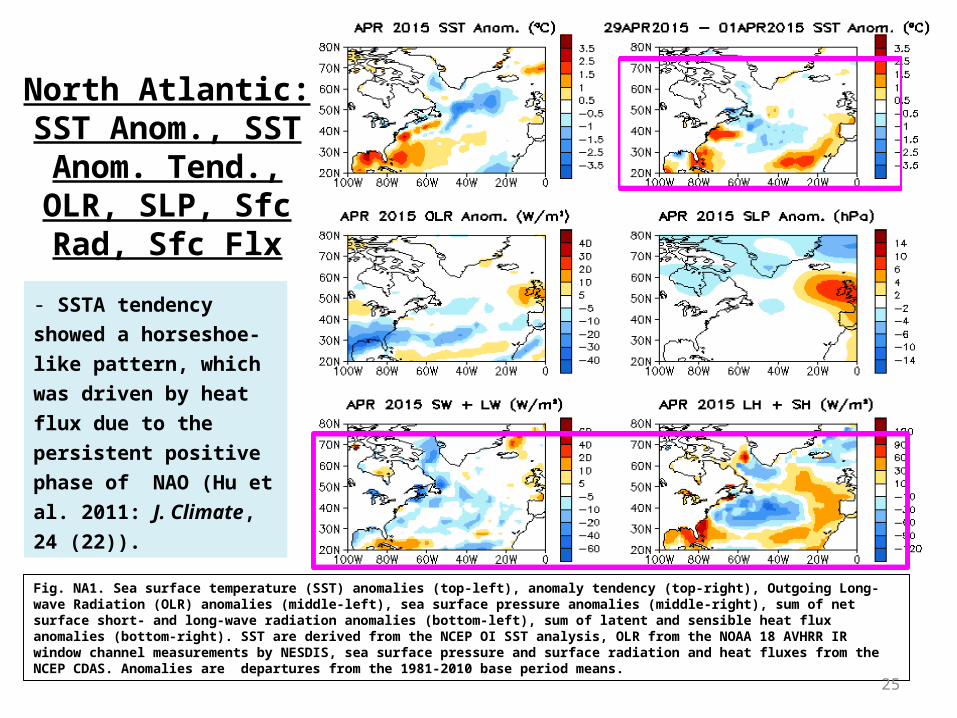
Fig. NA1. Sea surface temperature (SST) anomalies (top-left), anomaly tendency (top-right), Outgoing Long-wave Radiation (OLR) anomalies (middle-left), sea surface pressure anomalies (middle-right), sum of net surface short- and long-wave radiation anomalies (bottom-left), sum of latent and sensible heat flux anomalies (bottom-right). SST are derived from the NCEP OI SST analysis, OLR from the NOAA 18 AVHRR IR window channel measurements by NESDIS, sea surface pressure and surface radiation and heat fluxes from the NCEP CDAS. Anomalies are departures from the 1981-2010 base period means.
25
- SSTA tendency showed a
horseshoe-like pattern,
which was driven by heat
flux due to the persistent
positive phase of NAO (Hu
et al. 2011: J. Climate, 24
(22)).
ENSO and Global SST Predictions
26
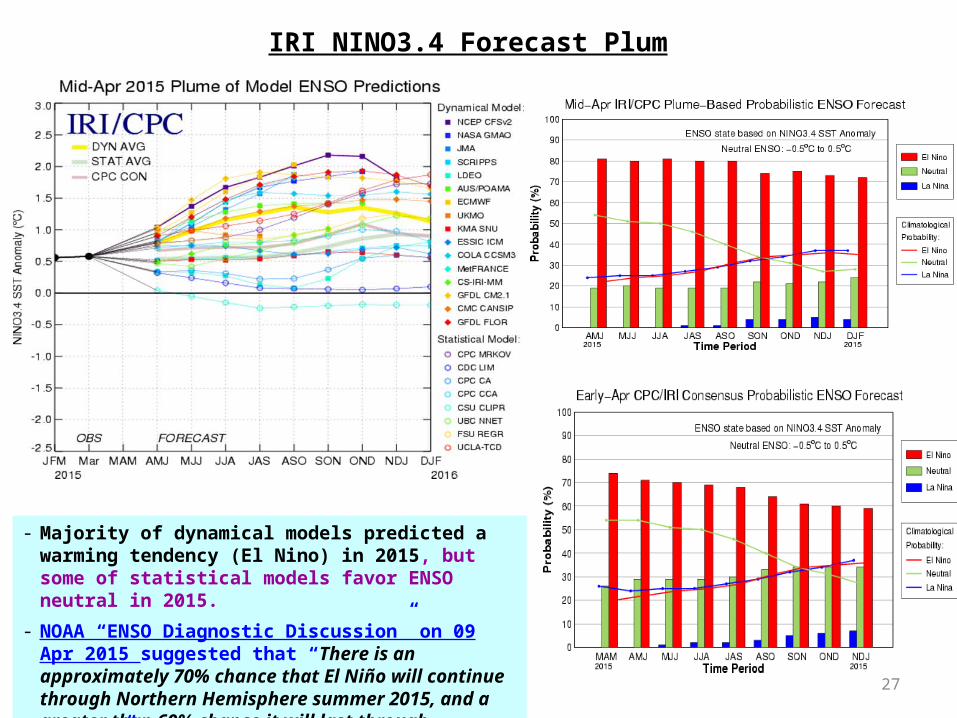
- Majority of dynamical models predicted a warming tendency (El Nino) in 2015, but some of statistical models favor ENSO neutral in 2015.
- NOAA “ENSO Diagnostic Discussion” on 09 Apr 2015 suggested that “There is an approximately 70% chance that El Niño will continue through Northern Hemisphere summer 2015, and a greater than 60% chance it will last through autumn.”
IRI NINO3.4 Forecast Plum
27
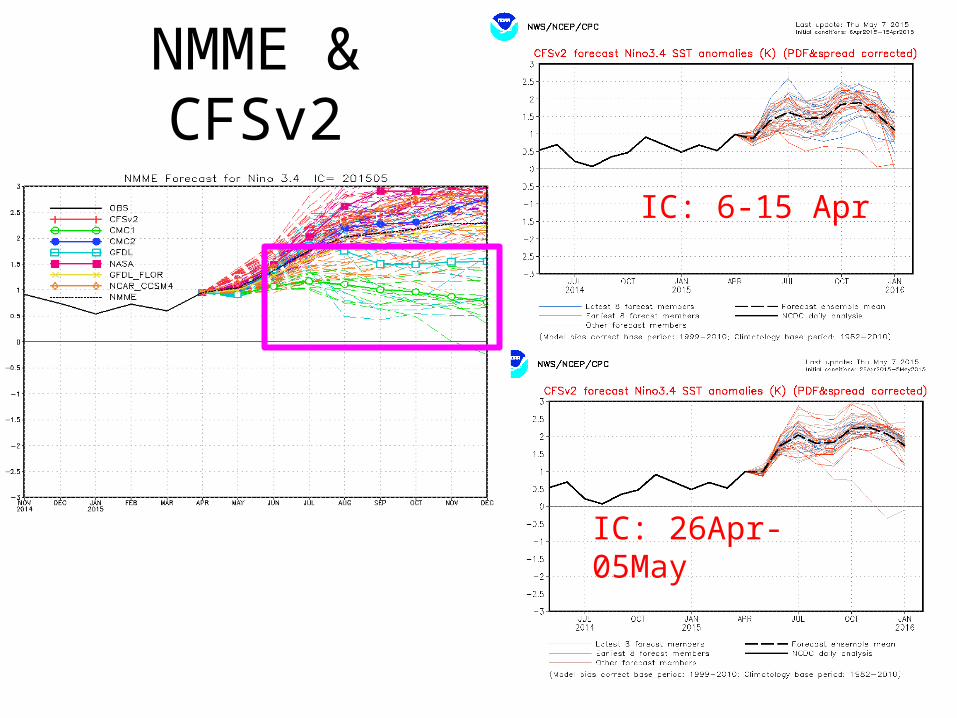
NMME & CFSv2
28
IC: 26Apr-05May
IC: 6-15 Apr
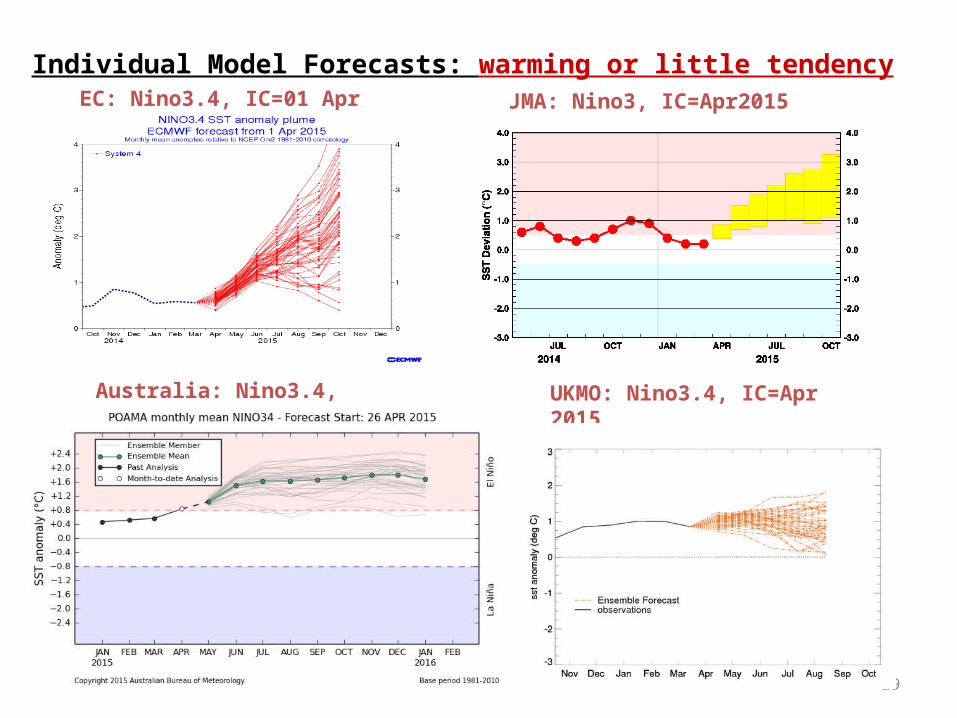
Individual Model Forecasts: warming or little tendencyJMA: Nino3, IC=Apr2015
Australia: Nino3.4, IC=26Apr 2015 UKMO: Nino3.4, IC=Apr 2015
EC: Nino3.4, IC=01 Apr 2015
29
http://origin.cpc.ncep.noaa.gov/products/people/yxue/ENSO_forecast_clim81-10_godas.html
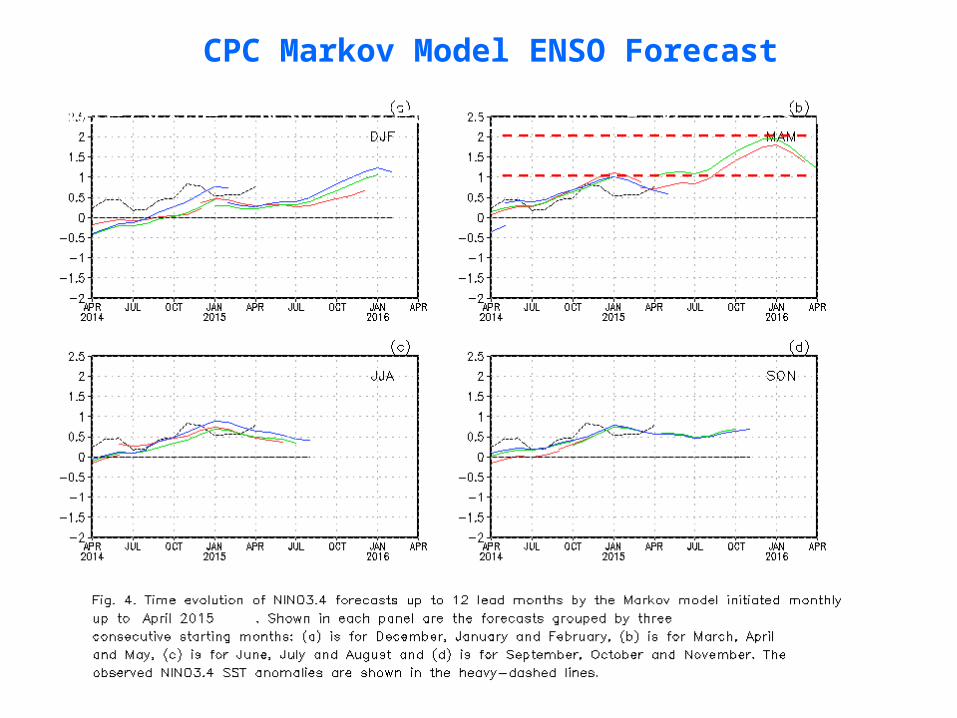
CPC Markov Model ENSO Forecast
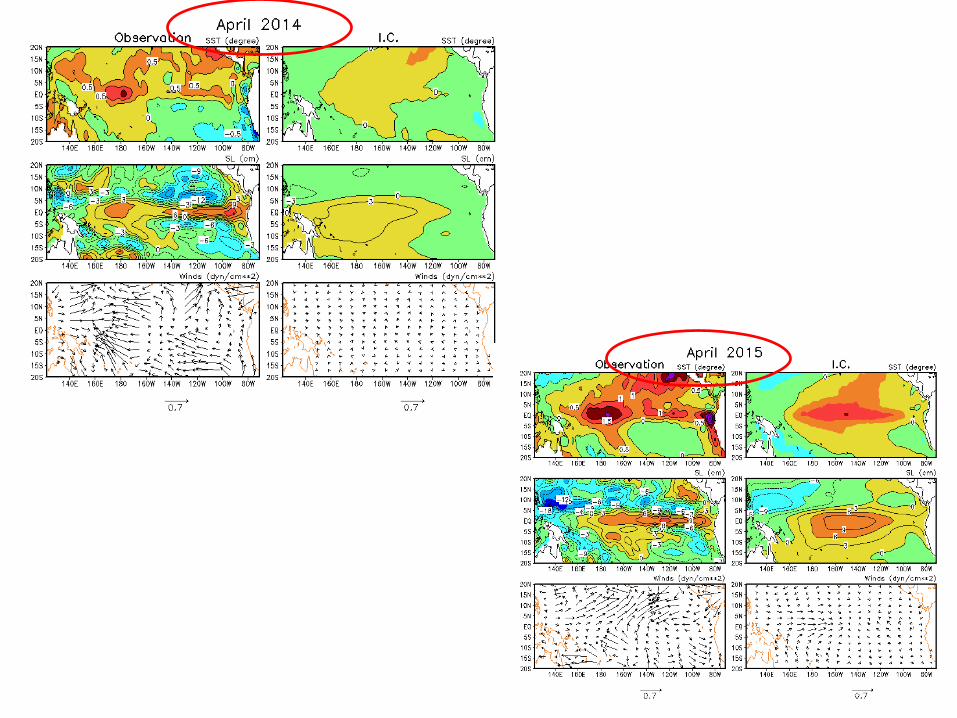
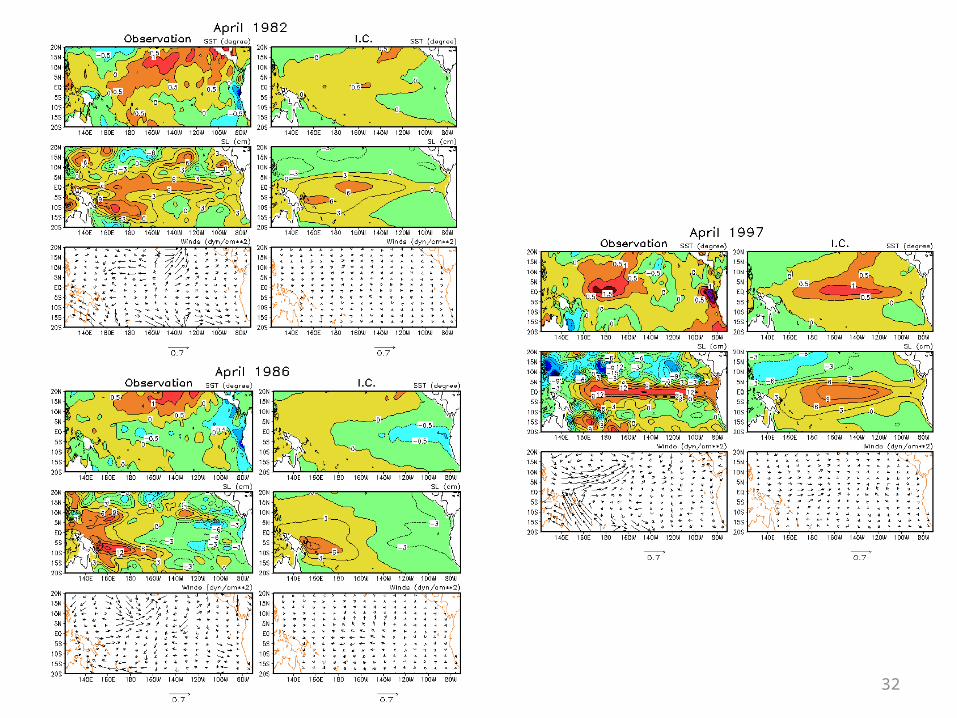
Initial Conditions for Markov Model (3 MEOF truncation)
32
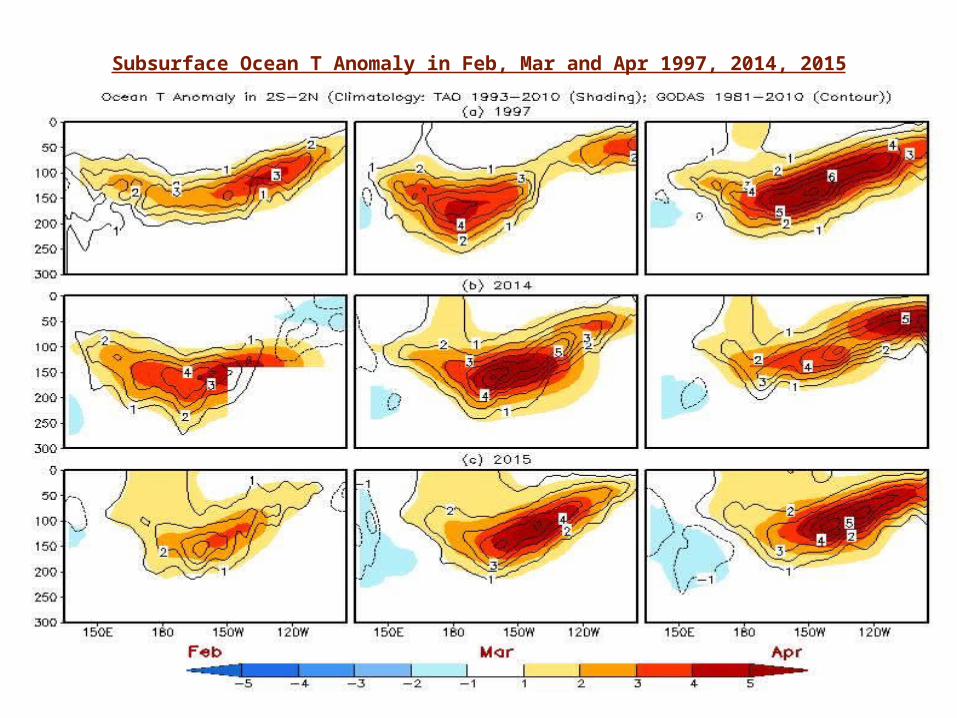
Subsurface Ocean T Anomaly in Feb, Mar and Apr 1997, 2014, 2015
33
34
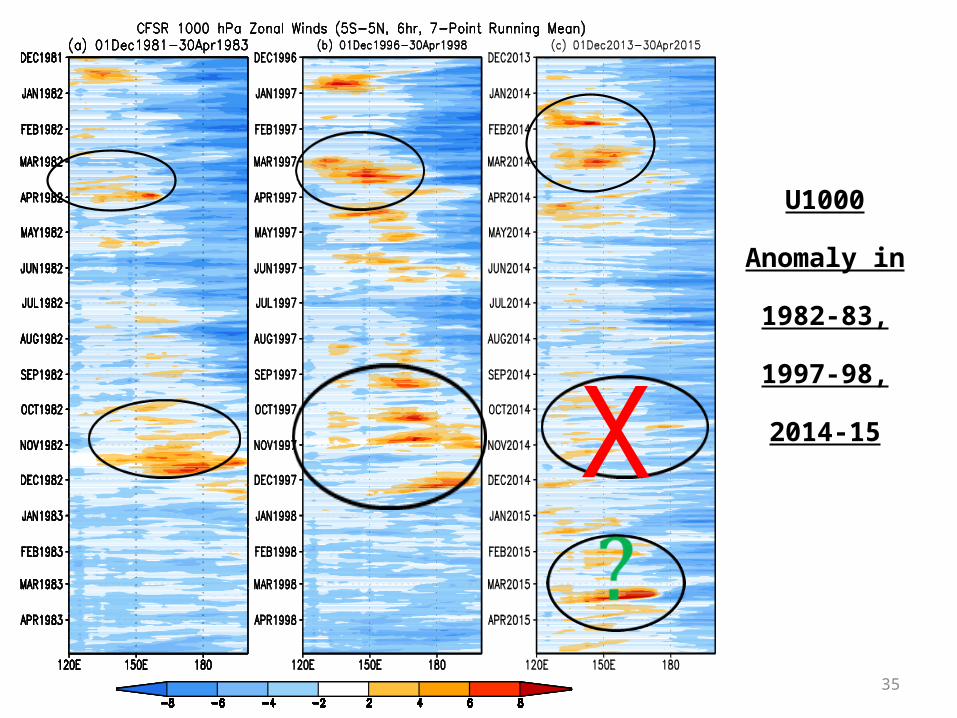
U1000
Anomaly in
1982-83,
1997-98,
2014-15
35
Χ
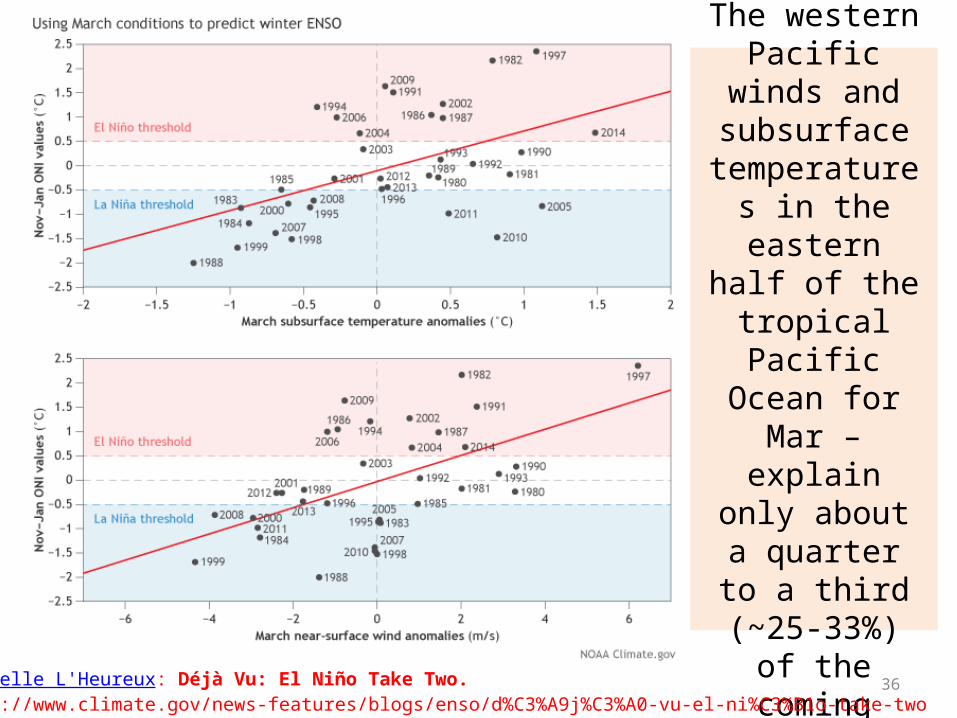
Prediction skill with IC in Mar:
The western Pacific winds and
subsurface temperatures in the eastern half of the tropical
Pacific Ocean for Mar – explain only about a
quarter to a third (~25-33%) of the
coming winter ENSO state.
36http://www.climate.gov/news-features/blogs/enso/d%C3%A9j%C3%A0-vu-el-ni%C3%B1o-take-twoMichelle L'Heureux: Déjà Vu: El Niño Take Two.http://www.climate.gov/news-features/blogs/enso/d%C3%A9j%C3%A0-vu-el-ni%C3%B1o-take-two
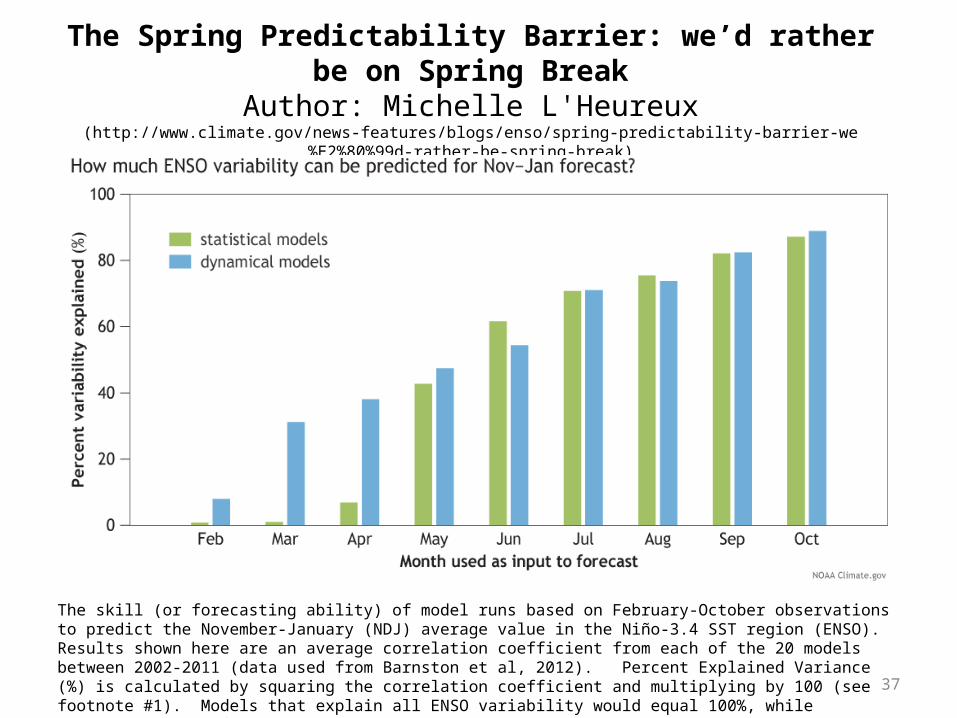
The Spring Predictability Barrier: we’d rather be on Spring BreakAuthor: Michelle L'Heureux
(http://www.climate.gov/news-features/blogs/enso/spring-predictability-barrier-we%E2%80%99d-rather-be-spring-break)
37
The skill (or forecasting ability) of model runs based on February-October observations to predict the November-January (NDJ) average value in the Niño-3.4 SST region (ENSO). Results shown here are an average correlation coefficient from each of the 20 models between 2002-2011 (data used from Barnston et al, 2012). Percent Explained Variance (%) is calculated by squaring the correlation coefficient and multiplying by 100 (see footnote #1). Models that explain all ENSO variability would equal 100%, while explaining none of the ENSO variance would equal 0%. Graphic by Fiona Martin based on data from NOAA CPC and IRI.
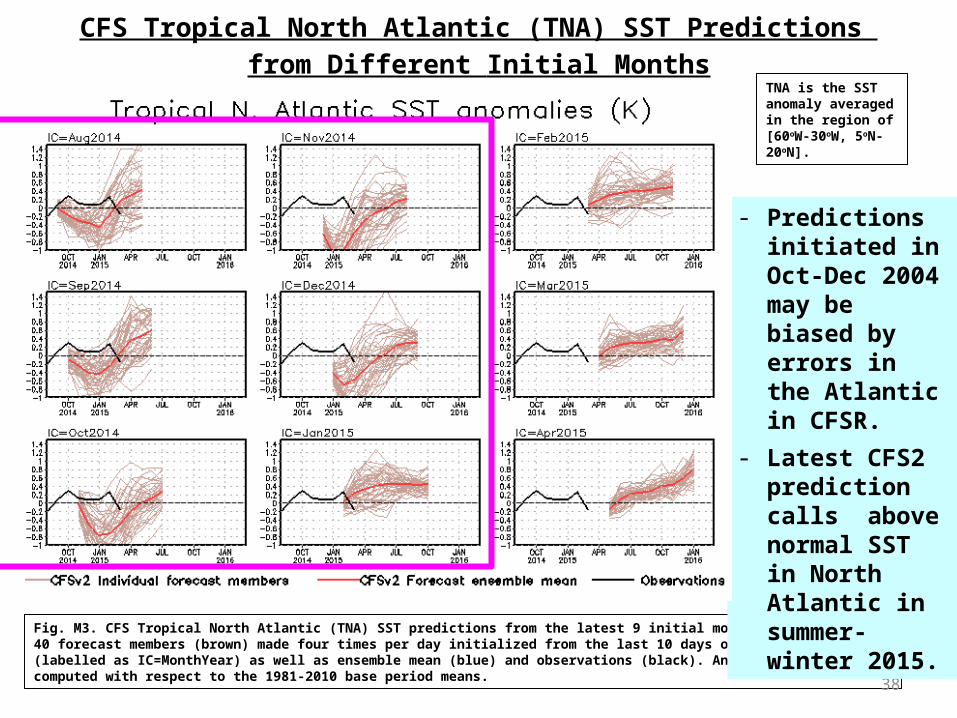
CFS Tropical North Atlantic (TNA) SST Predictions from Different Initial Months
TNA is the SST anomaly averaged in the region of [60oW-30oW, 5oN-20oN].
Fig. M3. CFS Tropical North Atlantic (TNA) SST predictions from the latest 9 initial months. Displayed are 40 forecast members (brown) made four times per day initialized from the last 10 days of the initial month (labelled as IC=MonthYear) as well as ensemble mean (blue) and observations (black). Anomalies were computed with respect to the 1981-2010 base period means.
38
- Predictions initiated in Oct-Dec 2004 may be biased by errors in the Atlantic in CFSR.
- Latest CFS2 prediction calls above normal SST in North Atlantic in summer-winter 2015.
Why we monitor sea surface salinity (SSS) ?
(possible role of SSS on ENSO prediction)
39
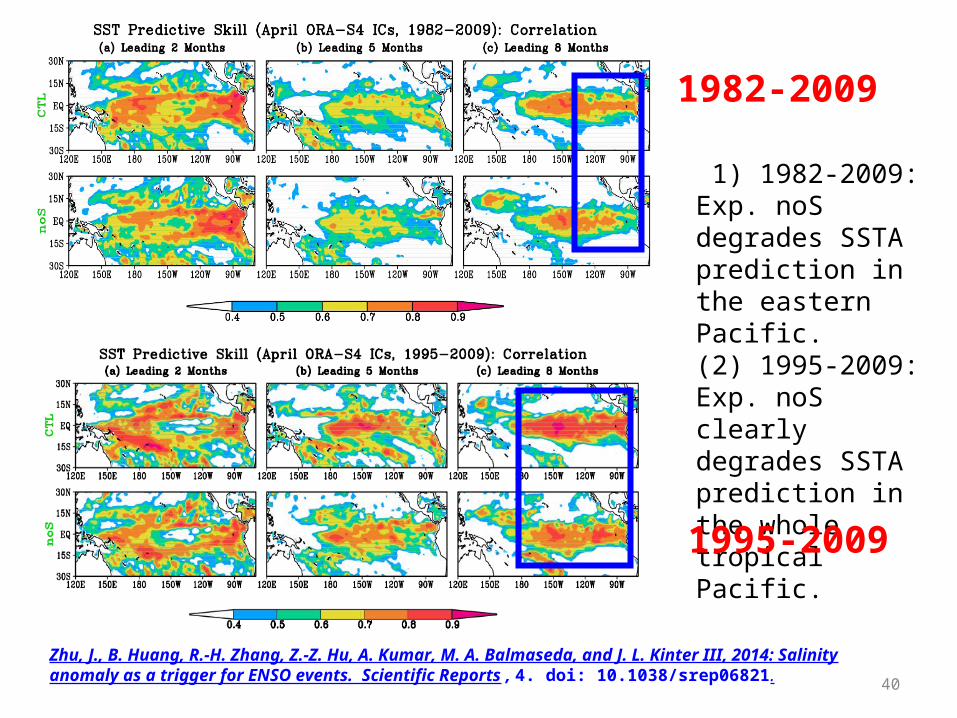
Zhu, J., B. Huang, R.-H. Zhang, Z.-Z. Hu, A. Kumar, M. A. Balmaseda, and J. L. Kinter III, 2014: Salinity anomaly as a trigger for ENSO events. Scientific Reports , 4. doi: 10.1038/srep06821. 40
(1) 1982-2009: Exp. noS degrades SSTA prediction in the eastern Pacific.(2) 1995-2009: Exp. noS clearly degrades SSTA prediction in the whole tropical Pacific.
1982-2009
1995-2009
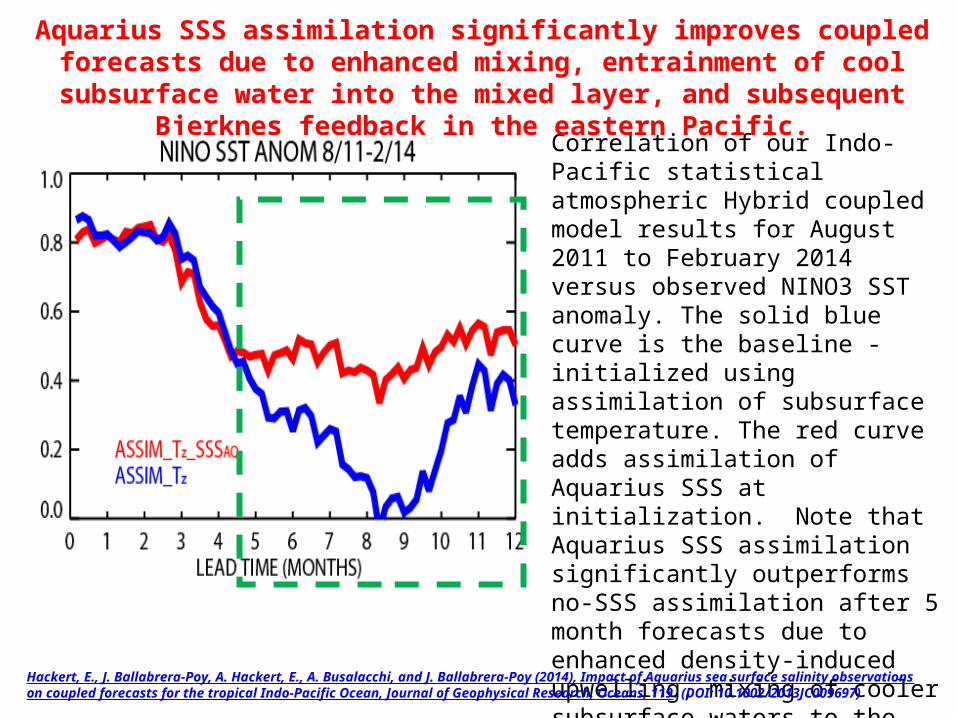
Correlation of our Indo-Pacific statistical atmospheric Hybrid coupled model results for August 2011 to February 2014 versus observed NINO3 SST anomaly. The solid blue curve is the baseline - initialized using assimilation of subsurface temperature. The red curve adds assimilation of Aquarius SSS at initialization. Note that Aquarius SSS assimilation significantly outperforms no-SSS assimilation after 5 month forecasts due to enhanced density-induced upwelling, mixing of cooler subsurface waters to the surface and subsequent Bjerknes feedback in the Pacific.
Aquarius SSS assimilation significantly improves coupled forecasts due to enhanced mixing, entrainment of cool subsurface water into the mixed layer,
and subsequent Bjerknes feedback in the eastern Pacific.
Hackert, E., J. Ballabrera-Poy, A. Hackert, E., A. Busalacchi, and J. Ballabrera-Poy (2014), Impact of Aquarius sea surface salinity observations on coupled forecasts for the tropical Indo-Pacific Ocean, Journal of Geophysical Research, Oceans, 119. (DOI: 10.1002/2013JC009697)
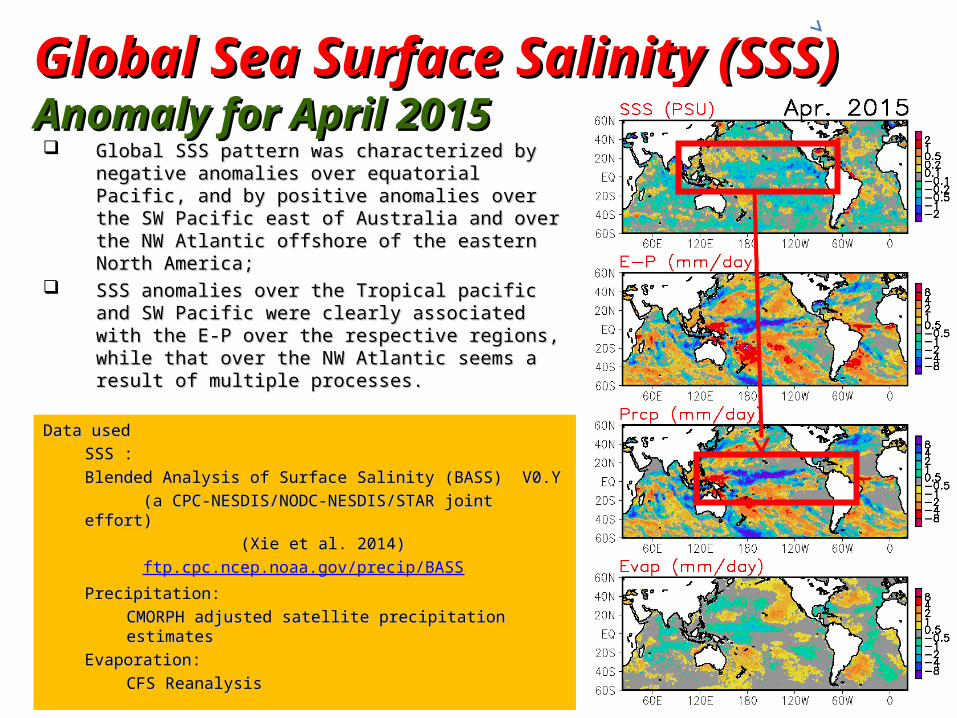
Global Sea Surface Salinity (SSS)Global Sea Surface Salinity (SSS)Anomaly for April 2015Anomaly for April 2015 Global SSS pattern was characterized by negative Global SSS pattern was characterized by negative
anomalies over equatorial Pacific, and by positive anomalies over equatorial Pacific, and by positive anomalies over the SW Pacific east of Australia anomalies over the SW Pacific east of Australia and over the NW Atlantic offshore of the eastern and over the NW Atlantic offshore of the eastern North America;North America;
SSS anomalies over the Tropical pacific and SW SSS anomalies over the Tropical pacific and SW Pacific were clearly associated with the E-P over Pacific were clearly associated with the E-P over the respective regions, while that over the NW the respective regions, while that over the NW Atlantic seems a result of multiple processes.Atlantic seems a result of multiple processes.
Data usedData used
SSS :SSS :
Blended Analysis of Surface Salinity (BASS) V0.YBlended Analysis of Surface Salinity (BASS) V0.Y
(a CPC-NESDIS/NODC-NESDIS/STAR joint (a CPC-NESDIS/NODC-NESDIS/STAR joint effort) effort)
(Xie et al. 2014) (Xie et al. 2014)
ftp.cpc.ncep.noaa.gov/precip/BASS
Precipitation:Precipitation:
CMORPH adjusted satellite precipitation estimatesCMORPH adjusted satellite precipitation estimates
Evaporation:Evaporation:
CFS ReanalysisCFS Reanalysis
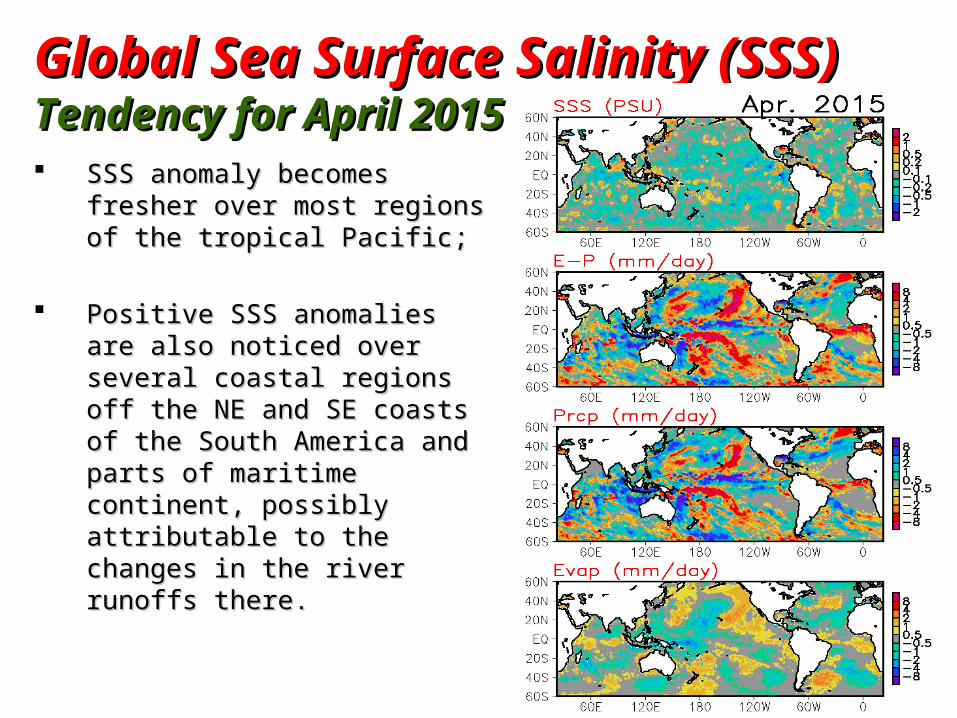
Global Sea Surface Salinity (SSS)Global Sea Surface Salinity (SSS)Tendency for April 2015Tendency for April 2015 SSS anomaly becomes fresher SSS anomaly becomes fresher
over most regions of the over most regions of the tropical Pacific;tropical Pacific;
Positive SSS anomalies are Positive SSS anomalies are also noticed over several also noticed over several coastal regions off the NE and coastal regions off the NE and SE coasts of the South SE coasts of the South America and parts of America and parts of maritime continent, possibly maritime continent, possibly attributable to the changes in attributable to the changes in the river runoffs there.the river runoffs there.
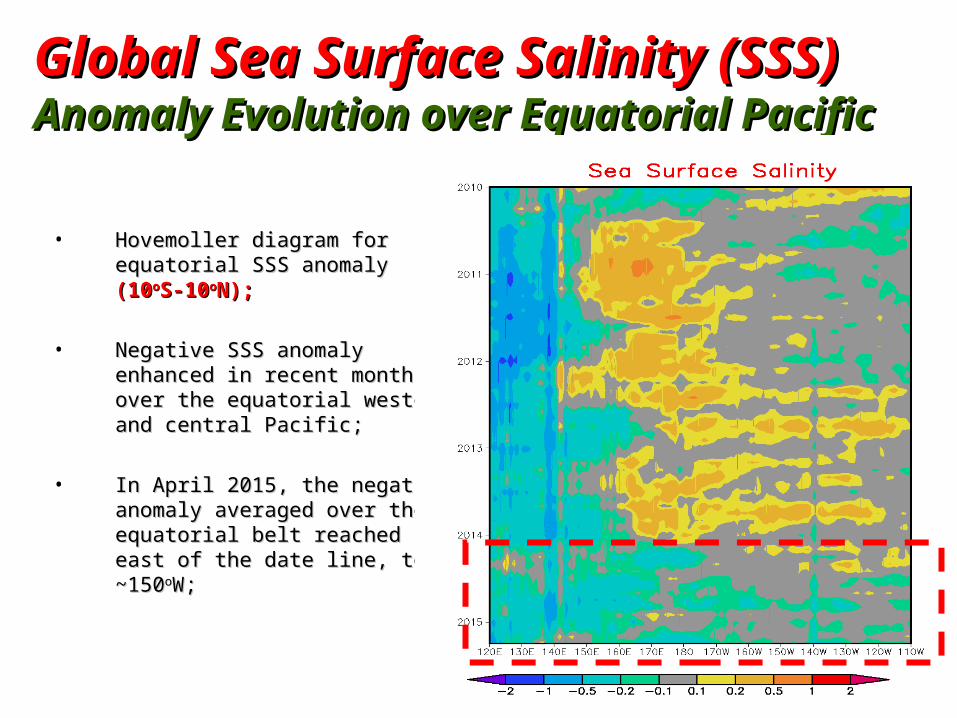
Global Sea Surface Salinity (SSS)Global Sea Surface Salinity (SSS)Anomaly Evolution over Equatorial PacificAnomaly Evolution over Equatorial Pacific
• Hovemoller diagram for equatorial SSS Hovemoller diagram for equatorial SSS anomaly anomaly (10(10ooS-10S-10ooN);N);
• Negative SSS anomaly enhanced in Negative SSS anomaly enhanced in recent months over the equatorial recent months over the equatorial western and central Pacific;western and central Pacific;
• In April 2015, the negative anomaly In April 2015, the negative anomaly averaged over the equatorial belt averaged over the equatorial belt reached east of the date line, to reached east of the date line, to ~150~150ooW; W;
Overview Pacific Ocean
NOAA “ENSO Diagnostic Discussion” on 09 Apr 2015 suggested “There is an approximately 70% chance that El Niño will continue through Northern Hemisphere summer 2015, and a greater than 60% chance it will last through autumn.”
Positive SSTAs were observed in the central and eastern tropical Pacific with NINO3.4=0.8oC in Apr 2015.
Positive anomalies of subsurface ocean temperature along the equator persisted and propagated eastward slowly in Apr 2015.
Majority of dynamical models predicted a warming tendency (El Nino) in 2015, but some of statistical models favor ENSO neutral in 2015.
Positive phase of PDO has persisted for 10 months, with PDOI=1.3 in Apr 2015.
Indian Ocean Positive SSTAs were mainly in the southern Indian Ocean.
Atlantic Ocean Positive phase of NAO has persisted for 6 months with NAOI=0.6 in Apr
2015, causing a horseshoe-like pattern of SSTA in N. Atlantic.
45
Backup Slides
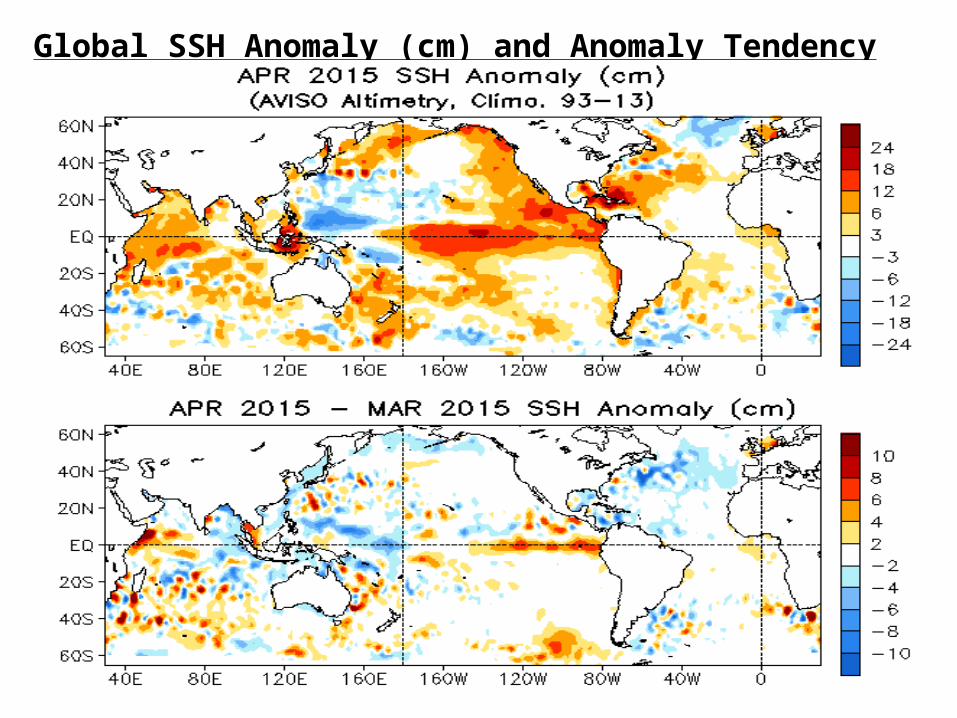
Global SSH Anomaly (cm) and Anomaly Tendency
47
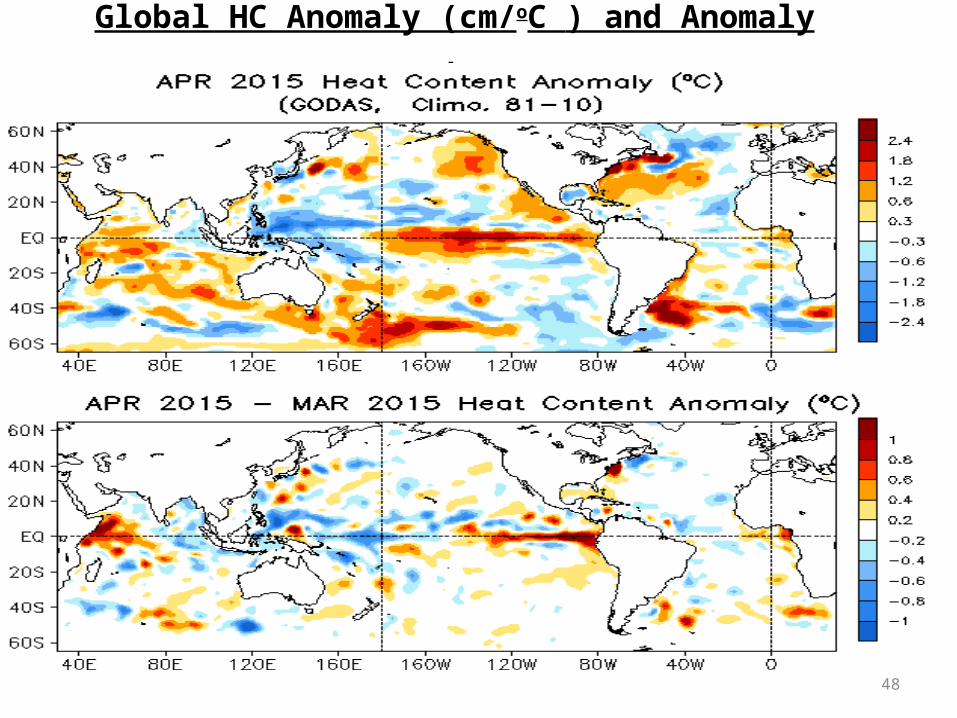
Global HC Anomaly (cm/oC ) and Anomaly Tendency
48
Equatorial Pacific Ocean Temperature Pentad Mean Anomaly
TAO Anomaly
49
GODAS-TAO T Anomaly
2009/10 El Nino
2010/11 La Nina2014
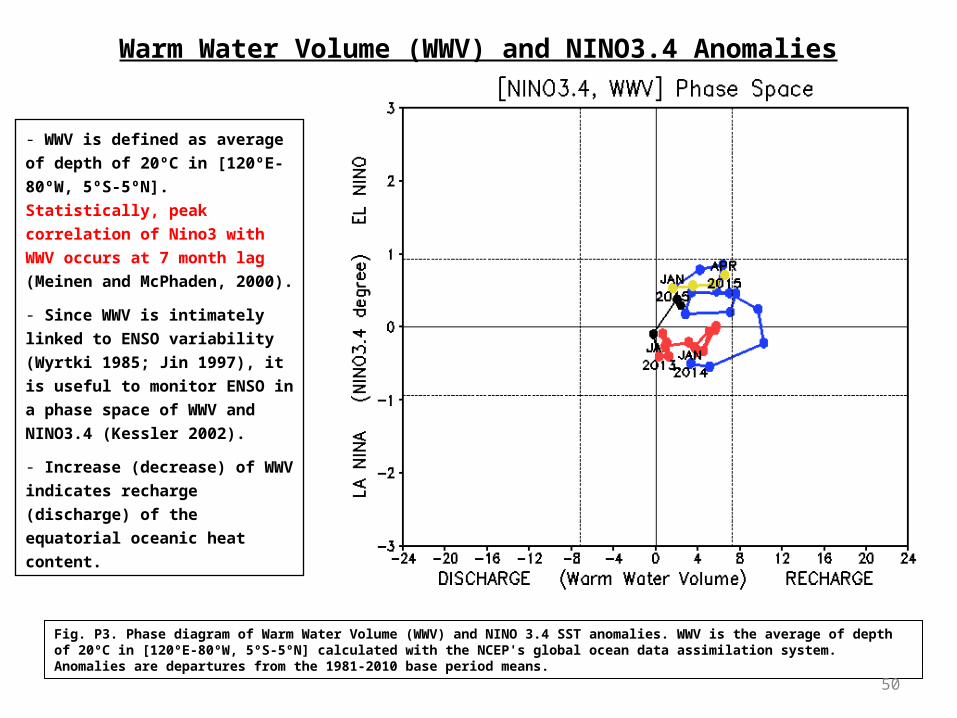
Warm Water Volume (WWV) and NINO3.4 Anomalies
Fig. P3. Phase diagram of Warm Water Volume (WWV) and NINO 3.4 SST anomalies. WWV is the average of depth of 20ºC in [120ºE-80ºW, 5ºS-5ºN] calculated with the NCEP's global ocean data assimilation system. Anomalies are departures from the 1981-2010 base period means.
- WWV is defined as average of depth
of 20ºC in [120ºE-80ºW, 5ºS-5ºN].
Statistically, peak correlation of Nino3
with WWV occurs at 7 month lag
(Meinen and McPhaden, 2000).
- Since WWV is intimately linked to
ENSO variability (Wyrtki 1985; Jin
1997), it is useful to monitor ENSO in a
phase space of WWV and NINO3.4
(Kessler 2002).
- Increase (decrease) of WWV
indicates recharge (discharge) of the
equatorial oceanic heat content.
50
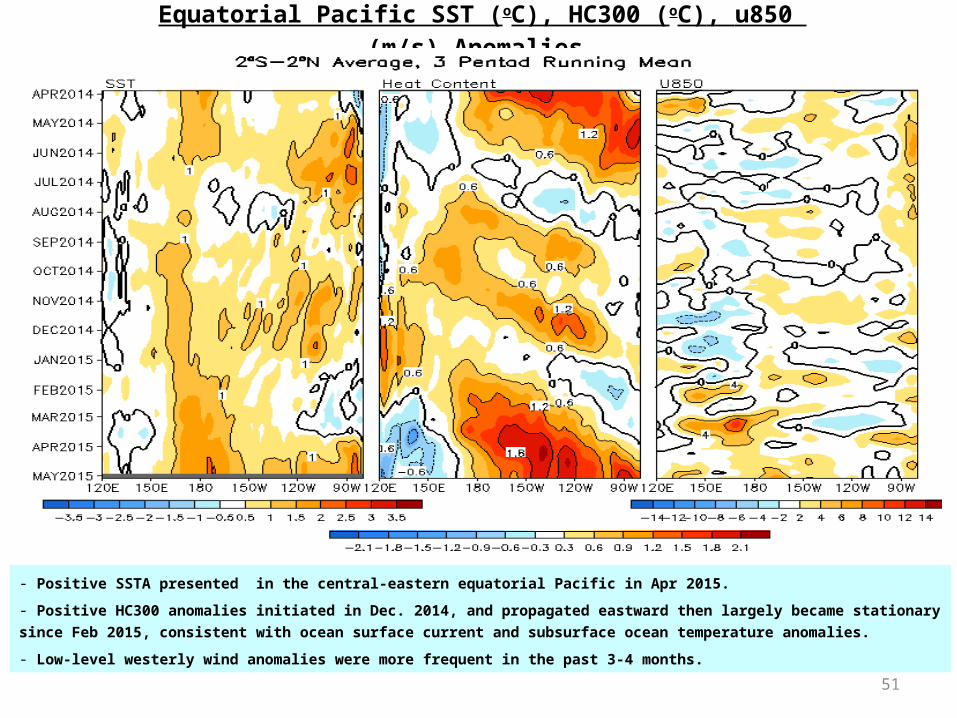
Equatorial Pacific SST (oC), HC300 (oC), u850 (m/s) Anomalies
- Positive SSTA presented in the central-eastern equatorial Pacific in Apr 2015.
- Positive HC300 anomalies initiated in Dec. 2014, and propagated eastward then largely became stationary
since Feb 2015, consistent with ocean surface current and subsurface ocean temperature anomalies.
- Low-level westerly wind anomalies were more frequent in the past 3-4 months.
51
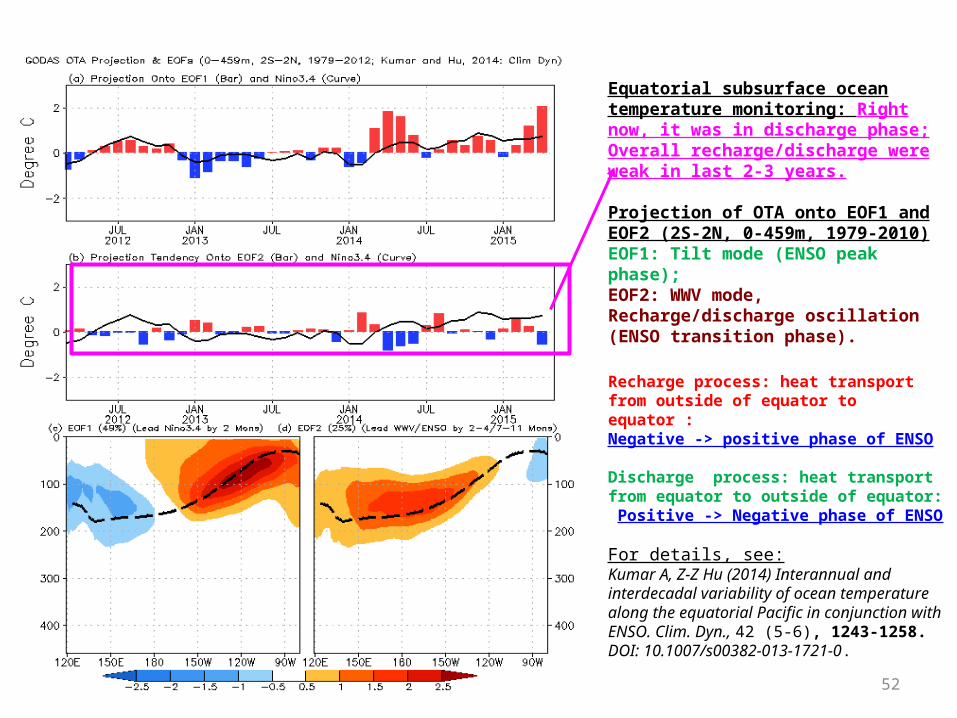
Equatorial subsurface ocean temperature monitoring: Right now, it was in discharge phase; Overall recharge/discharge were weak in last 2-3 years.
Projection of OTA onto EOF1 and EOF2 (2S-2N, 0-459m, 1979-2010)EOF1: Tilt mode (ENSO peak phase);EOF2: WWV mode, Recharge/discharge oscillation (ENSO transition phase).
Recharge process: heat transport from outside of equator to equator :Negative -> positive phase of ENSO
Discharge process: heat transport from equator to outside of equator: Positive -> Negative phase of ENSO
For details, see:Kumar A, Z-Z Hu (2014) Interannual and interdecadal variability of ocean temperature along the equatorial Pacific in conjunction with ENSO. Clim. Dyn., 42 (5-6), 1243-1258. DOI: 10.1007/s00382-013-1721-0.
52
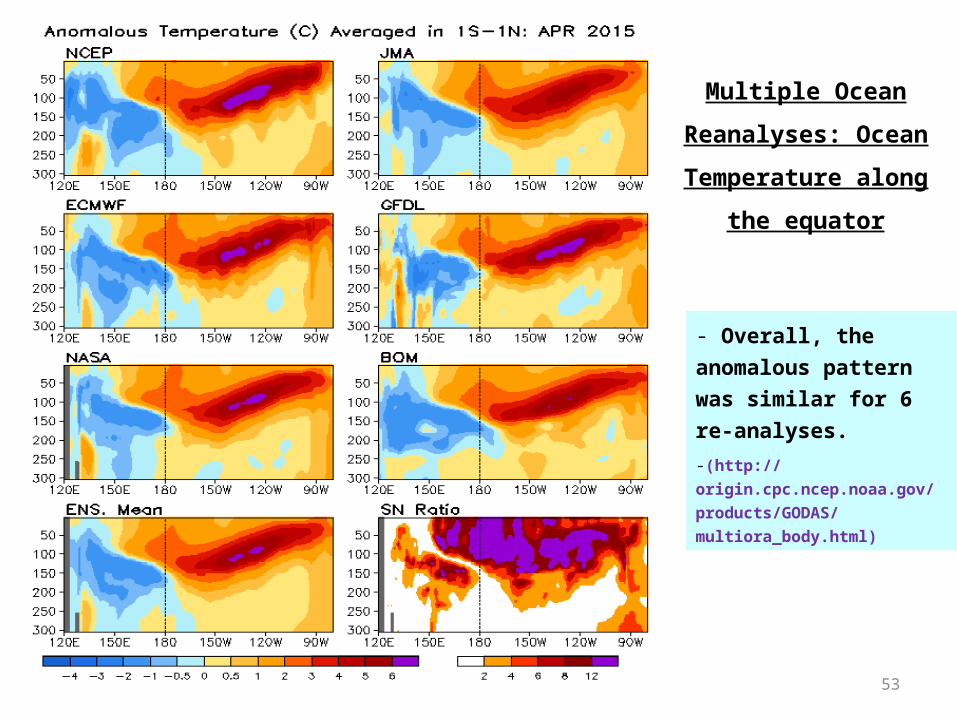
Multiple Ocean
Reanalyses: Ocean
Temperature along
the equator
- Overall, the
anomalous pattern
was similar for 6 re-
analyses.
-(http://
origin.cpc.ncep.noaa.gov/
products/GODAS/
multiora_body.html)
53
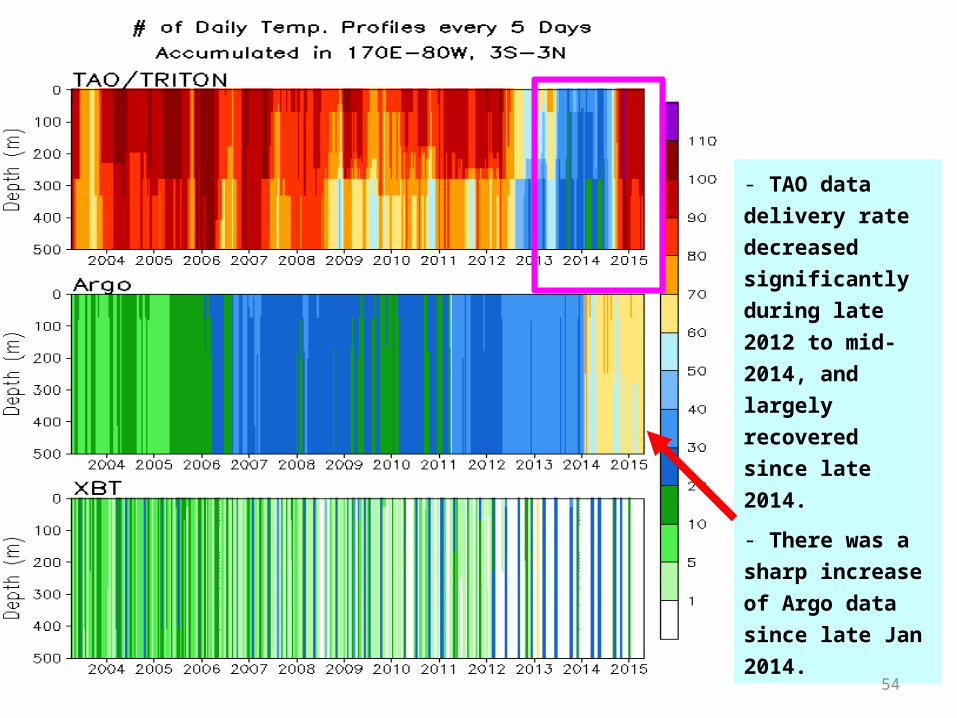
- TAO data
delivery rate
decreased
significantly
during late
2012 to mid-
2014, and
largely
recovered
since late
2014.
- There was a
sharp increase
of Argo data
since late Jan
2014.54
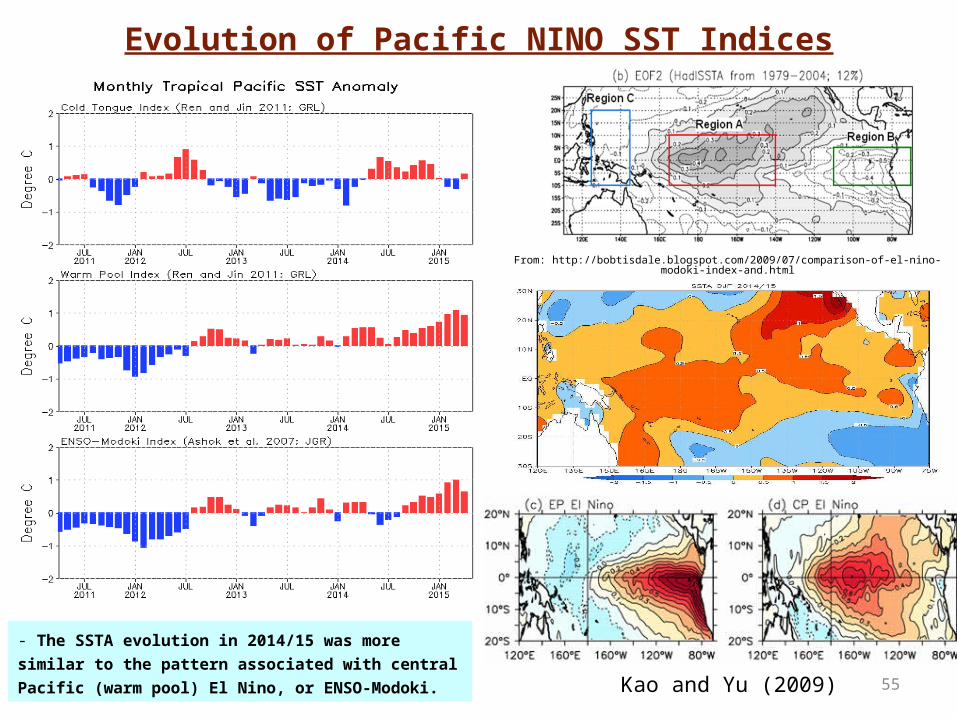
Evolution of Pacific NINO SST Indices
- The SSTA evolution in 2014/15 was more
similar to the pattern associated with central
Pacific (warm pool) El Nino, or ENSO-Modoki.
From: http://bobtisdale.blogspot.com/2009/07/comparison-of-el-nino-modoki-index-and.html
55Kao and Yu (2009)
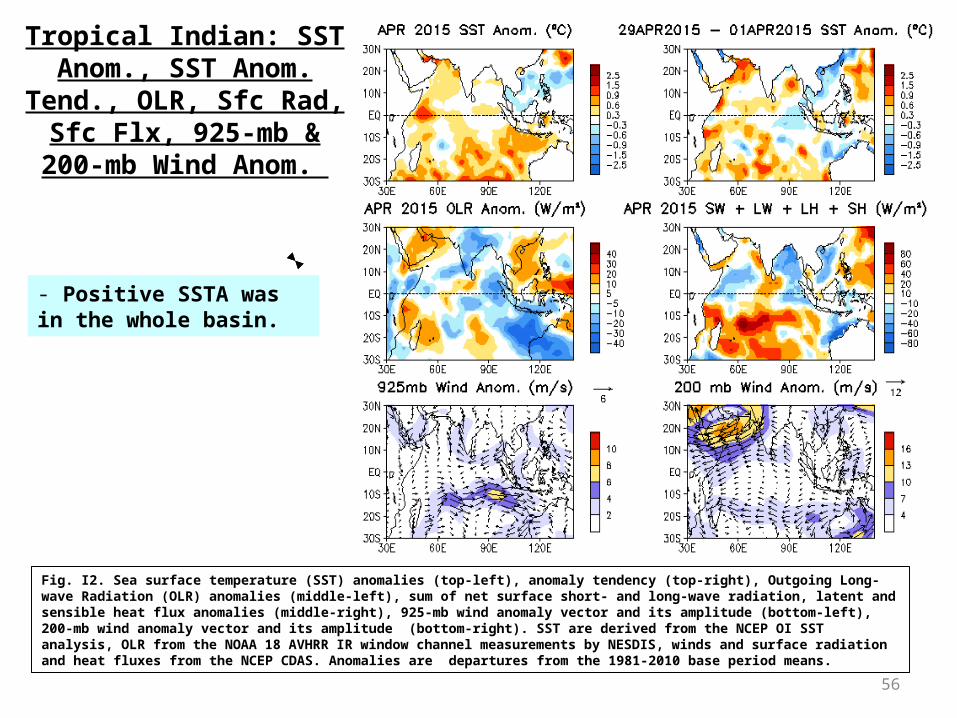
- Positive SSTA was in the whole basin.
Tropical Indian: SST Anom., SST Anom.
Tend., OLR, Sfc Rad, Sfc Flx, 925-mb &
200-mb Wind Anom.
Fig. I2. Sea surface temperature (SST) anomalies (top-left), anomaly tendency (top-right), Outgoing Long-wave Radiation (OLR) anomalies (middle-left), sum of net surface short- and long-wave radiation, latent and sensible heat flux anomalies (middle-right), 925-mb wind anomaly vector and its amplitude (bottom-left), 200-mb wind anomaly vector and its amplitude (bottom-right). SST are derived from the NCEP OI SST analysis, OLR from the NOAA 18 AVHRR IR window channel measurements by NESDIS, winds and surface radiation and heat fluxes from the NCEP CDAS. Anomalies are departures from the 1981-2010 base period means.
56
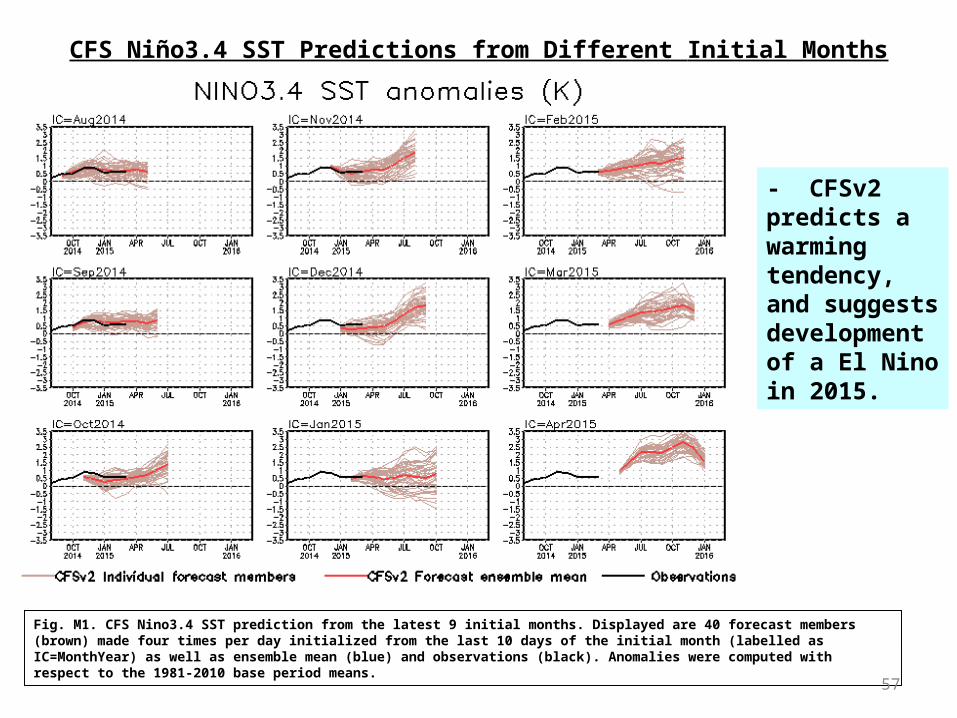
CFS Niño3.4 SST Predictions from Different Initial Months
Fig. M1. CFS Nino3.4 SST prediction from the latest 9 initial months. Displayed are 40 forecast members (brown) made four times per day initialized from the last 10 days of the initial month (labelled as IC=MonthYear) as well as ensemble mean (blue) and observations (black). Anomalies were computed with respect to the 1981-2010 base period means.
- CFSv2 predicts a warming tendency, and suggests development of a El Nino in 2015.
57
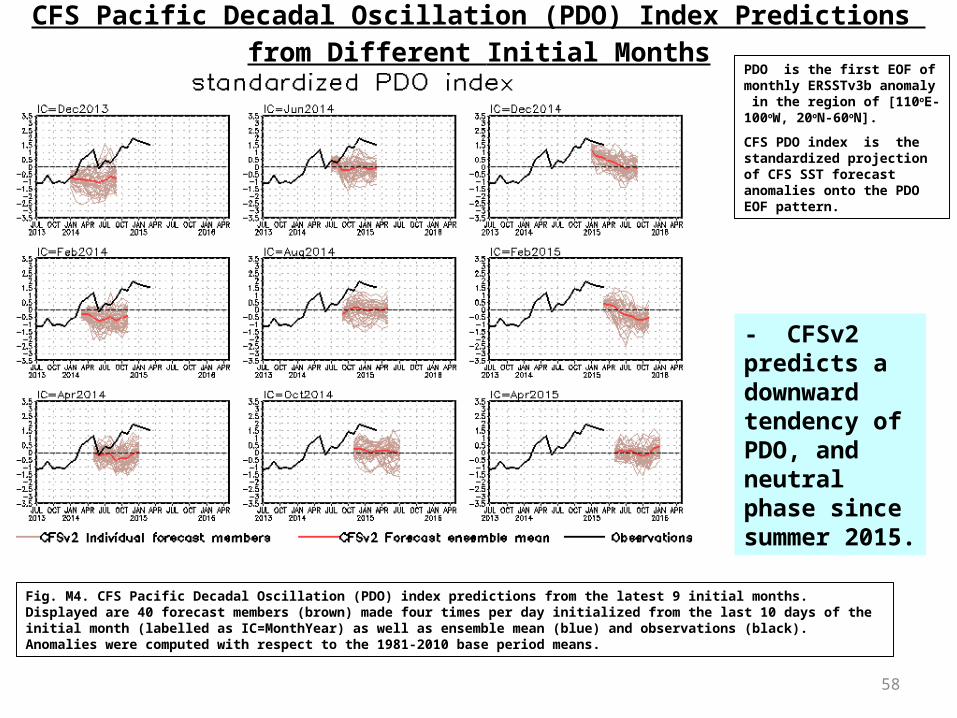
CFS Pacific Decadal Oscillation (PDO) Index Predictions from Different Initial Months
Fig. M4. CFS Pacific Decadal Oscillation (PDO) index predictions from the latest 9 initial months. Displayed are 40 forecast members (brown) made four times per day initialized from the last 10 days of the initial month (labelled as IC=MonthYear) as well as ensemble mean (blue) and observations (black). Anomalies were computed with respect to the 1981-2010 base period means.
PDO is the first EOF of monthly ERSSTv3b anomaly in the region of [110oE-100oW, 20oN-60oN].
CFS PDO index is the standardized projection of CFS SST forecast anomalies onto the PDO EOF pattern.
- CFSv2 predicts a downward tendency of PDO, and neutral phase since summer 2015.
58
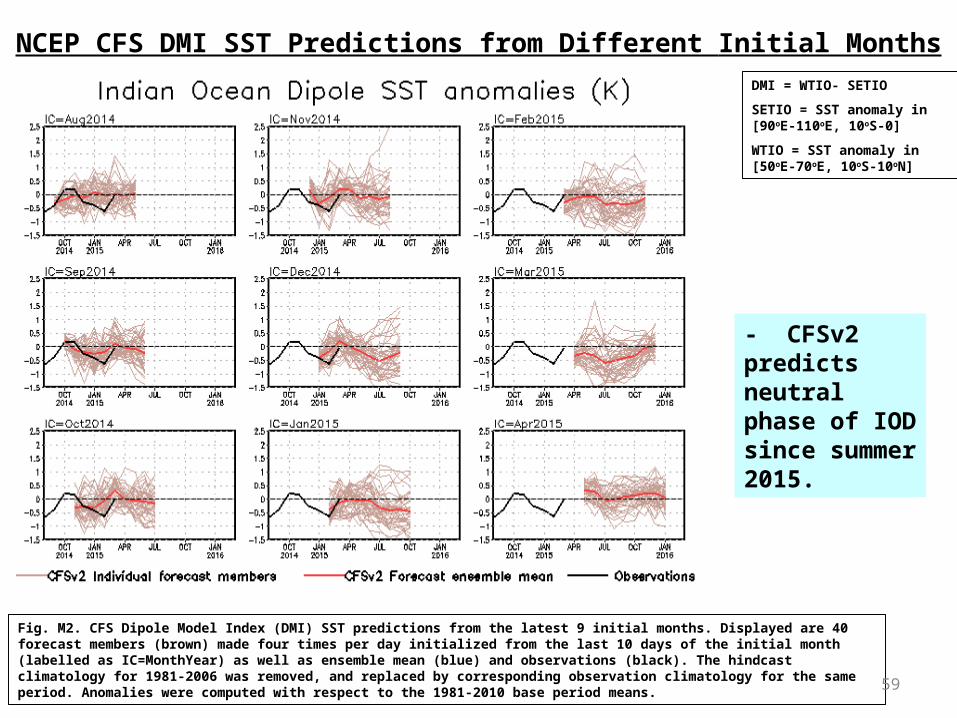
NCEP CFS DMI SST Predictions from Different Initial MonthsDMI = WTIO- SETIO
SETIO = SST anomaly in [90oE-110oE, 10oS-0]
WTIO = SST anomaly in [50oE-70oE, 10oS-10oN]
Fig. M2. CFS Dipole Model Index (DMI) SST predictions from the latest 9 initial months. Displayed are 40 forecast members (brown) made four times per day initialized from the last 10 days of the initial month (labelled as IC=MonthYear) as well as ensemble mean (blue) and observations (black). The hindcast climatology for 1981-2006 was removed, and replaced by corresponding observation climatology for the same period. Anomalies were computed with respect to the 1981-2010 base period means. 59
- CFSv2 predicts neutral phase of IOD since summer 2015.
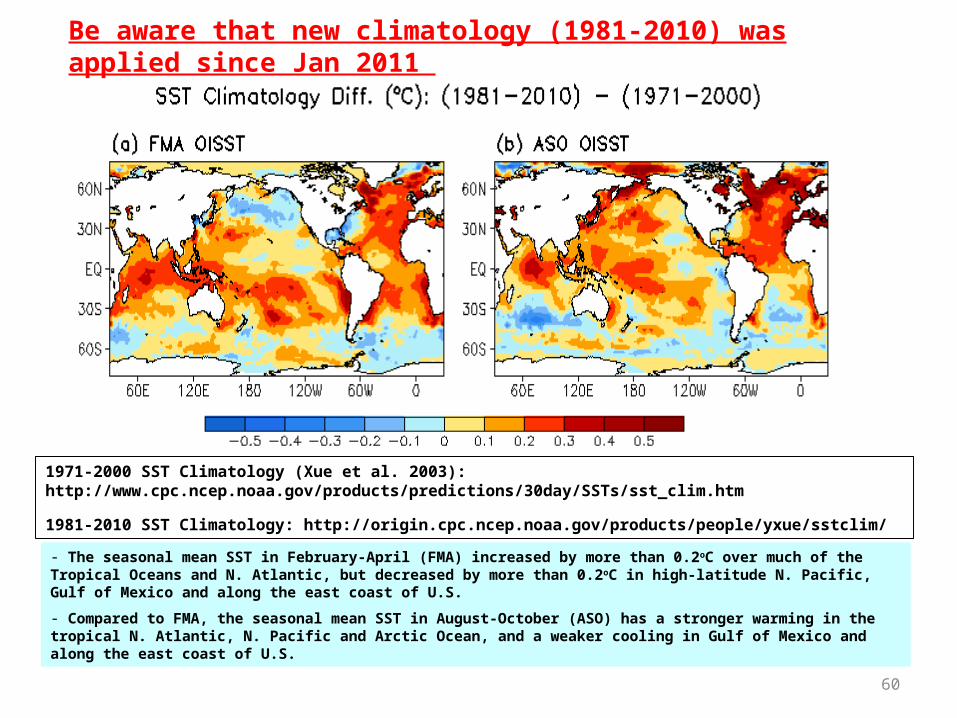
- The seasonal mean SST in February-April (FMA) increased by more than 0.2oC over much of the Tropical Oceans and N. Atlantic, but decreased by more than 0.2oC in high-latitude N. Pacific, Gulf of Mexico and along the east coast of U.S.
- Compared to FMA, the seasonal mean SST in August-October (ASO) has a stronger warming in the tropical N. Atlantic, N. Pacific and Arctic Ocean, and a weaker cooling in Gulf of Mexico and along the east coast of U.S.
1971-2000 SST Climatology (Xue et al. 2003): http://www.cpc.ncep.noaa.gov/products/predictions/30day/SSTs/sst_clim.htm
1981-2010 SST Climatology: http://origin.cpc.ncep.noaa.gov/products/people/yxue/sstclim/
Be aware that new climatology (1981-2010) was applied since Jan 2011
60
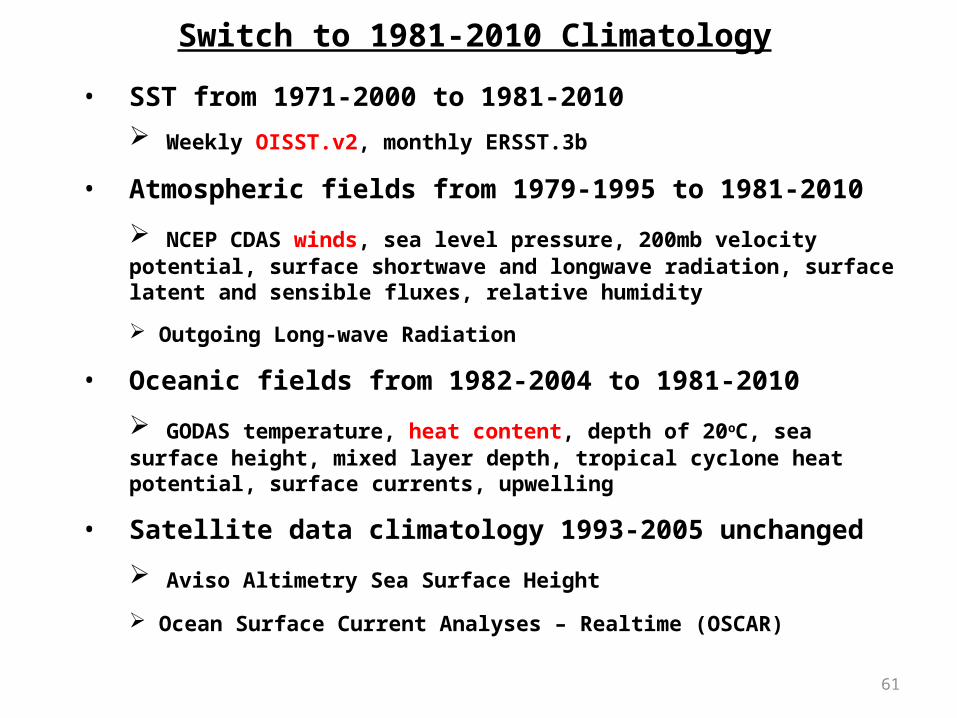
Switch to 1981-2010 Climatology
• SST from 1971-2000 to 1981-2010
Weekly OISST.v2, monthly ERSST.3b
• Atmospheric fields from 1979-1995 to 1981-2010
NCEP CDAS winds, sea level pressure, 200mb velocity potential, surface shortwave and longwave radiation, surface latent and sensible fluxes, relative humidity
Outgoing Long-wave Radiation
• Oceanic fields from 1982-2004 to 1981-2010
GODAS temperature, heat content, depth of 20oC, sea surface height, mixed layer depth, tropical cyclone heat potential, surface currents, upwelling
• Satellite data climatology 1993-2005 unchanged
Aviso Altimetry Sea Surface Height
Ocean Surface Current Analyses – Realtime (OSCAR)
61
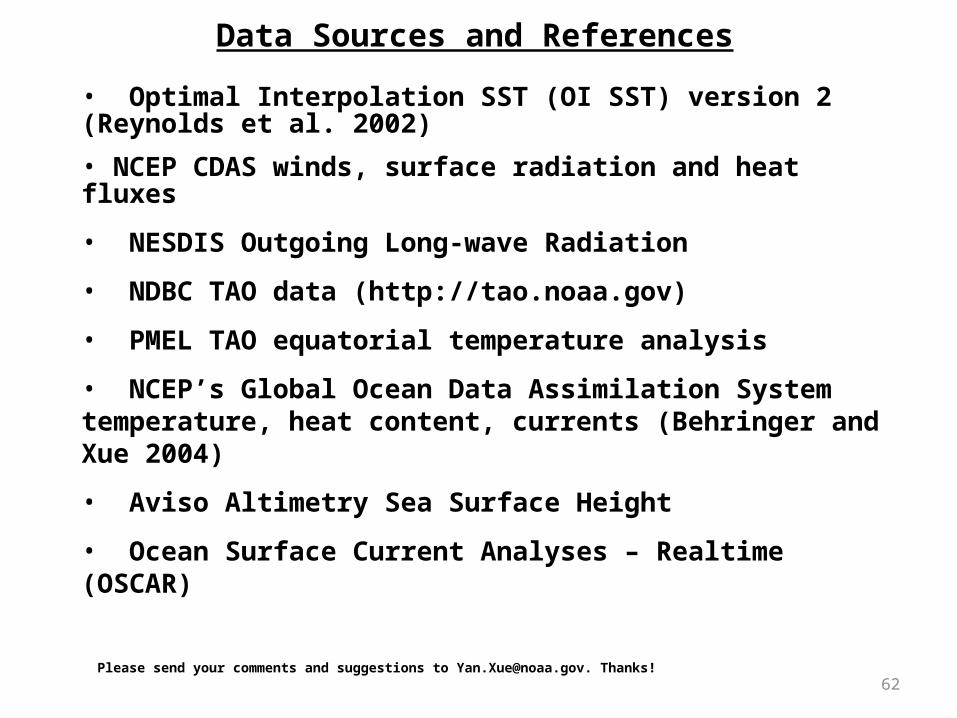
Data Sources and References
• Optimal Interpolation SST (OI SST) version 2 (Reynolds et al. 2002)
• NCEP CDAS winds, surface radiation and heat fluxes
• NESDIS Outgoing Long-wave Radiation
• NDBC TAO data (http://tao.noaa.gov)
• PMEL TAO equatorial temperature analysis
• NCEP’s Global Ocean Data Assimilation System temperature, heat content, currents (Behringer and Xue 2004)
• Aviso Altimetry Sea Surface Height
• Ocean Surface Current Analyses – Realtime (OSCAR)
Please send your comments and suggestions to [email protected]. Thanks!62