Embed Size (px)
Citation preview

GOLDCORP CANADA LTD HOLLINGER PROJECT
PRE-FEASIBILITY ENVIRONMENTAL BASELINE STUDIES
SURFACE WATER HYDROLOGY
Submitted to:
Goldcorp Canada Ltd. Porcupine Gold Mines
4315 Gold Mine Road, P.O. Box 70 South Porcupine, Ontario
P0N 1H0
Submitted by:
AMEC Earth & Environmental a Division of AMEC Americas Limited
160 Traders Blvd. E., Suite 110 Mississauga, Ontario
L4Z 3K7
January 2008 TC 71507

Goldcorp Canada Ltd. - Hollinger Project Pre-feasibility Environmental Baseline Studies Surface Water Hydrology January 2008
\\mis-fs1\ProjectF$\EM\Projects\2008\TC81525 Hollinger Permitting\Environmental Review\Final ERR\Appendices\Appendix E - Hydrology\HollingerProject_HydrologyBaselineRpt_Final_updatedintroJuly2010.doc Page i
TABLE OF CONTENTS
Page
1.0� INTRODUCTION ............................................................................................................ 1�
1.1� Site History ............................................................................................................ 2�1.2� Project Overview ................................................................................................... 2�1.3� General Setting ..................................................................................................... 3�1.4� Spatial and Temporal Boundaries ......................................................................... 5�
2.0� METHODS...................................................................................................................... 9�
2.1� Existing Data Sources ........................................................................................... 9�2.2� Data Analysis ...................................................................................................... 10�2.3� Field Surveys....................................................................................................... 11�
3.0� DATA ANALYSIS (RESULTS)..................................................................................... 12�
3.1� Climate ................................................................................................................ 12�3.2� Regional Hydrological Stations ........................................................................... 16�3.3� Local Watershed Analysis ................................................................................... 19�3.4� Porcupine River System – Detailed Hydrological Analysis.................................. 21�3.5� Terrain Unit Characterization .............................................................................. 25�3.6� Water Balance..................................................................................................... 26�
4.0� EVALUATION AND DISCUSSION .............................................................................. 30�
4.1� Hydrological Function.......................................................................................... 30�4.2� Surface Water – Groundwater Linkage ............................................................... 31�4.3� Environmental Constraints and Sensitivities ....................................................... 33�4.4� Mine Closure ....................................................................................................... 34�4.5� Recommendations .............................................................................................. 34�
5.0� REFERENCES ............................................................................................................. 38�

Goldcorp Canada Ltd. - Hollinger Project Pre-feasibility Environmental Baseline Studies Surface Water Hydrology January 2008
\\mis-fs1\ProjectF$\EM\Projects\2008\TC81525 Hollinger Permitting\Environmental Review\Final ERR\Appendices\Appendix E - Hydrology\HollingerProject_HydrologyBaselineRpt_Final_updatedintroJuly2010.doc Page ii
LIST OF FIGURES
Page
1.1� Site Location and Study Area............................................................................................ 6�1.2� Surficial Geology ............................................................................................................... 7�1.3� Study Area and City of Timmins Municipal Boundary ....................................................... 8�3.1� Watersheds .....................................................................................................................29�4.1� Historic Expression of Area Lakes and Ponds (Photo 1969) .......................................... 36�4.2� Recommended Surface Water Monitoring Locations...................................................... 37�
LIST OF TABLES
3.1 Timmins Airport (A) 30-year climate Normals ................................................................. 13 3.2 Timmins Area Extreme Rainfall Statistics (mm) .............................................................. 15 3.3 Timmins Area Evaporation and Evapotranspiration Data ............................................... 16 3.4 Regional Natural Flow WSC Gauging Stations............................................................... 16 3.5 Regional Station Stream Flow Data ................................................................................ 18 3.6 Porcupine River Monthly Flow Data (m3/s and mm/d) .................................................... 22 3.7 Porcupine River Monthly Average Low and High Flow Data........................................... 23 3.8 Porcupine River Extreme Low Flow Return Period Statistics.......................................... 24 3.9 Timmins Area Extreme Value Rainfall plus Snowmelt Runoff Model 1 Predictions (mm)24 3.10 Timmins Area Extreme Value Rainfall Predictions (mm) ................................................ 25 3.11 Terrain Unit Hydrological Characterization ..................................................................... 26 3.12 Hollinger Project General Water Balance – Monthly Runoff Distribution ........................ 27

Goldcorp Canada Ltd. - Hollinger Project Pre-feasibility Environmental Baseline Studies Surface Water Hydrology January 2008
Page 1
1.0 INTRODUCTION
Porcupine Gold Mines (PGM), a joint venture between Goldcorp Canada Ltd. (51%) and Goldcorp Inc. (49%) (Goldcorp), is conducting pre-feasibility level studies to determine the potential for re-developing the former Hollinger and McIntyre Mines area, in Timmins (see Figure 1.1), as a new open pit mine and underground (UG) mining complex. For the purpose of this report, this undertaking is referred to as the Hollinger Project.
The former Hollinger Mine is located immediately adjacent to downtown Timmins and the urban area of Schumacher, on the south side of Highway 101. The former McIntyre Mine is located directly north and east of the former Hollinger Mine site. Ore from the proposed Hollinger Project would be processed at the existing Dome ore processing facility (Dome Mill), located approximately 5 km east of the former Hollinger Mine site. Considerable residual gold resources have been identified at the Hollinger Project Site, and development of the Site would have the added advantage of removing a number of known mine hazards (open stopes, mini pits, and near surface underground workings) that are associated with past activities.
This document deals with Hydrology, and is one of a series of baseline and modelling reports prepared to describe existing environmental conditions, associated with the Hollinger site area, in part to assist with obtaining future environmental approvals to re-open the Hollinger Mine; as well as to assist with project planning and to provide further information for Closure planning.
This introduction, or an abbreviated version of it in some instances, is included in each document, such that the reports can be read independent of one another. Baseline reports are being prepared to describe the following environmental aspects:
� Air Quality; � Aquatic Environment; � Cultural Heritage Environment; � Noise; � Hydrology; � Hydrogeology; � Socio-Economic Setting; � Terrestrial Environment; and, � Vibration.
The reports have been prepared by AMEC Earth & Environmental, a Division of AMEC Americas Limited (AMEC), with the exception of the baseline reports related to noise and vibration (Valcoustics Canada Ltd.), the cultural heritage environment (Woodland Heritage Services Limited), and the socio-economic setting (planningAlliance). The latter three entities worked under the direction of AMEC to ensure an appropriate level of study integration.

Goldcorp Canada Ltd. - Hollinger Project Pre-feasibility Environmental Baseline Studies Surface Water Hydrology January 2008
Page 2
1.1 Site History
The Hollinger gold deposit was discovered in 1909, as one of the three original major Timmins properties, along with that of the Dome and McIntyre Mines. The main Hollinger Mine operated from 1910 to 1968 and further mining took place in the 1970's and 1980's. The Hollinger, McIntyre and Coniaurum underground mine workings are all interconnected, along with those of a number of other smaller mines in the area.
Because of their connection to the McIntyre Mine, the Hollinger underground workings were kept dry while McIntyre operations continued until 1988, when the McIntyre Mine was shut down. The pumps at Hollinger and McIntyre Mines were shut down in 1991, and the underground working allowed to flood. A surface pump was installed in the McIntyre No 11 Shaft in 2000 and currently the upper mine levels are dewatered to a level ranging between 24 to 34 m below ground surface (mbgs), to help manage near-surface groundwater levels in the area. Mine water from the Hollinger, McIntyre and Coniaurum Mines is managed through the McIntyre No. 11 Shaft, with discharge to Little Pearl Tailings Pond. The McIntyre Mine operated from 1911 to 1988.
1.2 Project Overview
Goldcorp, through PGM, is planning to develop the Hollinger Project by redeveloping the former Hollinger and McIntyre Mines area as a new open pit and UG mining complex. The open pit complex would involve the sequential development of an open pit, through a series of phased pushbacks that would be used to access shallow ore zones within 200 to 250 mbgs. The UG portion of the mine complex would involve the potential development of two new UG ramps and associated ventilation raises that would be used to access deeper ore zones.
Development of the new Hollinger Project would require comparatively limited new infrastructure, as ore from the Project Site would be hauled to and processed at the existing Dome Mill, with tailings from ore processing to be discharged to the existing Dome Mine tailings deposition area.
The UG operations would consist of the Millerton and Central Porphyry Zone (CPZ) UG operations. Ramps developed at the Millerton and CPZ locations would be developed to approximately 400 mbgs. Mining beyond that point would likely involve shaft hoisting. Opportunities to use existing infrastructure for the deeper mining could potentially involve using the existing Hollinger No. 26 Shaft to develop the Millerton UG, and the McIntyre No. 11 Shaft to develop the CPZ UG. Ramp development and associated UG exploration would be used to confirm UG ore resources, and the viability of UG mining.
Under the current open pit design, there would be a requirement for the disposal of approximately 37,000,000 m3 of mine rock. The majority of the mine rock (estimated at 20,000,000 to 30,000,000 m3) would be retained on the Hollinger Project Site and would be used to backfill and overfill the initially excavated phased mine pits. Rock will also be used to build the Environmental Control Berm and the Transportation Corridor with the remainder being stored at the Dome Mine site.

Goldcorp Canada Ltd. - Hollinger Project Pre-feasibility Environmental Baseline Studies Surface Water Hydrology January 2008
Page 3
Infrastructure used and/or developed to support the Hollinger Project would include:
� At the Hollinger Project Site: - permanent mine rock and overburden stockpiles; - site water collection and drainage systems (if required); - potentially some small fuel and petroleum product storage facilities (if required); - electrical connections from nearby, currently in place, Hydro One infrastructure; and, - natural gas (if required) from nearby, currently in place, Union Gas infrastructure.
� Off the Hollinger Project Site: - the approximately 4.8 km long Transportation Corridor linking the Hollinger Project Site with
the Dome Mill; - potentially additional mine rock stockpiles (at the Dome site) (if required); and, - mine dewatering system from McIntyre No. 11 Shaft to Little Pearl Tailings Pond.
In addition, the Project would include the construction of an Environmental Control Berm around the Hollinger Project Site. This is a key feature of the Project with the main purpose of the Environmental Control Berm being to manage noise and other effects on nearby receptors.
Throughout the operations phase, mine rock material would be used to progressively backfill the phased mined pits. At closure, the remaining pit will be allowed to flood, and the pit discharge will likely be routed by gravity flow south to either the Skynner Creek or Perch Lake systems, both of which drain to the Mountjoy River. All remaining Project infrastructure would be removed at closure, and the Project Site would be rehabilitated in accordance with established mine closure protocols. In addition, closure will be carried out such that existing safety hazards would be removed. Part of the Closure Plan would be to ensure, through stakeholder input and working collaboration with the City of Timmins’ Planning Department, that the Project Site would be landscaped in an aesthetically pleasing manner.
1.3 General Setting
The Timmins area is characterized by a mix of urban and industrial development superimposed on a forested background. The City of Timmins consists of a major downtown urban area, as well as a number of other smaller urban centres scattered throughout the area, with Schumacher, South Porcupine, and Porcupine being the more prominent of these smaller centres. Various other smaller hamlets also occur throughout the area. All of these areas were amalgamated in 1973 to form the City of Timmins.
South Porcupine and other communities to the east are linked to Timmins by Highway 101, with a commercial strip occurring along this highway between downtown Timmins and Schumacher. Highway 655 extends north from Highway 101, with linkages to the Timmins airport via Airport and Laforest Roads, and linkages further north to Xstrata Copper’s Kidd Mine site and Highway 11.

Goldcorp Canada Ltd. - Hollinger Project Pre-feasibility Environmental Baseline Studies Surface Water Hydrology January 2008
Page 4
Several major transmission, gas, water and sewer lines pass through the area, as well as local services.
Timmins was founded as a mining centre, with the three prominent original mines being the Hollinger Mine, the McIntyre Mine, and the Dome Mine. Of these, only the Dome Mine is still in operation. Numerous other smaller mines also operated in the local area (see Section 1.4); many of which were or became linked to the three major mines at one time or another. None of these smaller historic mines are currently active. Above and below grade tailings, associated with these active and former mine sites, are widespread throughout the study area (Figure 1.1). Prominent waste rock piles are associated with the Dome Mine. There is little evidence of waste rock piles associated with the other mining operations, because all the mines, except for the Dome open pit operation, were underground mines. Waste rock produced by these underground mines was typically used as material for construction and backfill operations.
Topography in the Timmins area is dominated by its location at the transition of Precambrian Shield terrain to the south and southwest, and by flat-lying glaciolactrine silt and clay plains to the north and east. An extensive glaciolacustrine sand plain area lies to the south of Timmins, including dune formations, and extends into the lower, southwest portion of the study area (Figure 1.2). A prominent esker system extends immediately adjacent and parallel to the east side of Highway 655, north from Highway 101. The local topography reaches a maximum of about 365 m above mean sea level (amsl) in the area just southeast of the Hollinger site and north of Gold Mine Road. Further east towards South Porcupine, and within the glaciolacustrine silt and clay plains, the local topography decreases to as little as 280 m elevation.
The geology of the Timmins area is structurally complex, and includes several major fault zones, and anticline/syncline systems, many of which control surface topographic expressions. The Pearl Lake/Little Pearl Pond and the Gillies Lake area are controlled by these features, and as a result are the location of deeper sediment accumulations. Bedrock exposures are widespread and frequent throughout the major portion of the study area, but with much reduced expression in the areas dominated by glaciolacustrine silt, clay and sand plains.
Several small lakes and numerous ponds are scattered throughout the area, with larger numbers of ponds having formed along low gradient creek valleys as a result of beaver activity. Most of the area’s drainage is captured by the Porcupine and South Porcupine Rivers, which flow east, converging just upstream of Porcupine Lake, northeast of the Dome Mine site. The Porcupine River is a low gradient system that has its headwaters in the area just north and east of the Hollinger site. The Porcupine River drains into Night Hawk Lake and the Frederick House River system. Areas south and west of the Hollinger site drain to either the Skynner Creek or Perch Lake systems, both of which drain to the Mountjoy River, which flows into the Mattagami River. Areas north and west of the Hollinger site drain to Gillies Lake and the Town Creek system, which drains to the Mattagami River; or slightly further north there are a number of smaller drainages that drain directly west to the Mattagami River.

Goldcorp Canada Ltd. - Hollinger Project Pre-feasibility Environmental Baseline Studies Surface Water Hydrology January 2008
Page 5
Virtually all drainages in the area have been affected by existing or past mining activities, which have affected water quality, and to a lesser extent drainage patterns themselves.
The majority of the landscape that has not been developed for urbanization or mining remains in forest cover, with the exception of principal agricultural areas to the north and south of Timmins, near to the Mattagami River, and a number of smaller parcels of land in and around the Porcupine Lake area. Forest communities in the area are virtually all second growth as a result of past logging activities, and fires. Throughout the generally lower-lying, eastern portion of the study area, forest communities are dominated by varying mixtures of Black Spruce and poplar (Trembling Aspen and Balsam Poplar), with White Spruce, Jack Pine, Balsam Fir, Larch and White Birch as common associates. Central portions of the study area, where rock outcroppings are common, show similar forest community types but with a somewhat stronger representation of Jack Pine. Sandy areas north of Gillies Lake bordering Highway 655, and south and west of the Kayorum (Hollinger) tailings stack, show a dominance of Jack Pine, or Jack Pine with poplar. The abundance of poplar in the area is indicative of the level of past disturbance, as poplar species are typically successional and not characteristic of mature forest communities. Virtually all major forest blocks are transected by roads, transmission lines, trails, or other such linear features.
1.4 Spatial and Temporal Boundaries
To encompass all potential development areas and immediate drainages there from, Local Study Area (LSA) boundaries for natural environment investigations were focused on watershed and riverine boundaries, with the exception of the northwest study area boundary, which was defined by Laforest Road and a narrow strip of land bordering the east side of Highway 655 (Figure 1.1). The narrow strip of land bordering the east side of Highway 655 was included because this area includes a small trailer park and a single residence north of the trailer park, which have the potential to be affected by possible Hollinger related developments. Biophysical environmental studies are limited to this larger area, but depending on the specific discipline, may focus only on the relevant portions of the LSA.
The socioeconomic study area (SESA) is based on the City of Timmins limits, which encompass both urban and rural areas (Figure 1.3).
TIM
MIN
SSC
HU
MA
CH
ER
GO
LDC
ENTR
EC
ON
NA
UG
HT
HIL
L
SOU
THPO
RC
UPI
NE
Pear
lLa
ke
Gill
ies
Lake
To
wnCreek
Skyn
ner
Lake
Skynne
r Cre
ek
Mountjo
yR
iver
Cle
arw
ater
Lake
P orc
upin
e River Si
mps
onLa
ke
Sout
hPorcupineRiver
Porc
upin
eLa
ke
McD
onal
dLa
ke
Perc
hLa
ke
MattagamiRiver
Lt.P
earl
Taili
ngs
Pond
LaFo
rest
Roa
d
Hig
hway
101
Highway655
McI
ntyr
eTa
iling
s
ERG
Taili
ngs
Dom
eTa
iling
s
Edw
ards
Lake
Mill
erLa
ke
Pero
liLa
ke
Cow
boy
Lake
Cha
rlebo
isLa
ke
Del
nite
Min
eA
unor
Min
e
Buf
falo
Ank
erite
Min
e
Hol
linge
rM
ine
Dom
eO
pen
Pit
1:52
,500
I
HO
LLIN
GER
BA
SELI
NE
STU
DIE
S
SCAL
E:
PRO
JEC
TN
o:TC
7150
7FI
GU
RE
:1.1
DAT
E:Se
ptem
ber2
007
1:52
,500
TIM
MIN
SO
NTA
RIO
RE
V:2
01
23
Kilo
met
ers
P:\EM\Projects\2008\TC81525HollingerPermitting\GIS_Data\BaselineEdits_July2010\Fig1.1_SiteLocation_StudyArea.mxd
Site
Loca
tion
and
Stud
yA
rea
Lege
nd: St
udy
Are
a(W
ater
shed
Bou
ndar
y)
Stud
yA
rea
(Riv
erin
ean
dR
oad
Boun
dary
)
Min
eO
peni
ngs
toS
urfa
ce
Exis
iting
Tailin
gsD
epos
its
Exis
ting
Was
teR
ock
Dep
osits
Riv
eror
Cre
ek
Prop
osed
Ope
nPi
t
Envi
ronm
enta
lCon
trolB
erm
Out
line

TIM
MIN
SSC
HU
MA
CH
ER
GO
LDC
ENTR
EC
ON
NA
UG
HT
HIL
L
SOU
THPO
RC
UPI
NE
T
LPc(
RP
)
T
RR
(GM
)
RN
(LP
c)
LPs
LPs(
RP
)
T
RR
(LP
s)
LPc(
RR
,OT)
T
LPc(
RN
)WR
GFo
T
RR
(LP
s)
T
LPs
T
RR
(GM
)
GFe
T
T
T
AP
ED
T
RR
T
T
T
RR
OT
RR
T
GFe
RR
LPc(
pOT)
AP
GFe
RR
RR
LPc(
RN
)
GFe
T
LPc(
RR
,OT)
LPc(
RP
)
LPc(
RP
)
1:53
,000
I
HO
LLIN
GER
BA
SELI
NE
STU
DIE
S
Surf
icia
lGeo
logy
SCA
LE:
PRO
JEC
TN
o:TC
7150
7FI
GU
RE:
1.2
DAT
E:O
ctob
er20
071:
53,0
00
TIM
MIN
SO
NTA
RIO
REV
:2
01
23
Kilo
met
ers
P:\EM\Projects\2008\TC81525HollingerPermitting\GIS_Data\BaselineEdits_July2010\Fig1.2_SurficialGeology.mxd
(sub
ordi
nate
land
form
type
sar
esh
own
inbr
acke
ts)
SOU
RC
E:N
orth
ern
Ont
ario
Engi
neer
ing
Geo
logy
Terra
inS
tudy
Base
Map
s-T
imm
ins
(Map
5029
)and
pam
our(
Map
5026
)
Lege
nd: Stu
dyA
rea
(Wat
ersh
edB
ound
ary)
Stu
dyA
rea
(Riv
erin
ean
dR
oad
Bou
ndar
y)
Surf
icia
lGeo
logy
Type
s
1,R
R-R
ock
ridge
2,R
R(G
M)-
Roc
krid
ge(g
roun
dm
orai
ne)
3,R
N(L
Pc)
-Roc
kkn
ob(la
cust
rine
plai
n-c
lay/
silt)
4,R
R(L
Ps)
-Roc
krid
ge(la
cust
rine
plai
n-s
and)
5,LP
c(R
R,O
T)-L
acus
trine
plai
n-c
lay/
silt
(rock
ridge
/org
anic
terra
in)
6,LP
c(R
N)-
Lacu
strin
epl
ain
-cla
y/si
lt(r
ock
knob
)
7,LP
c(R
P)-
Lacu
strin
epl
ain
-cla
y/si
lt(r
ock
plai
n)
8,LP
s(R
P)-
Lacu
strin
epl
ain
-san
d(ro
ckpl
ain)
9,LP
s-L
acus
trine
plai
n-s
and
10,L
Pc(
OT)
-Lac
ustri
nepl
ain
-cla
y/si
lt(o
rgan
icte
rrain
)
11,G
Fo-G
laci
al-fl
uvia
lout
was
h-s
and
12,G
Fe-G
laci
al-fl
uvia
lesk
er-s
and
13,E
D-D
unes
-san
d
14,A
P-A
lluvi
alpl
ain
15,O
T-O
rgan
icte
rrain
16,T
-Tai
lings
17,W
R-W
aste
rock
Pro
pose
dO
pen
Pit

1:25
0,00
0
I
HO
LLIN
GER
BA
SELI
NE
STU
DIE
S
Stud
yA
rea
and
City
ofTi
mm
ins
Mun
icip
alB
ound
ary
SCA
LE:
PRO
JEC
TN
o:TC
7150
7FI
GU
RE:
1.3
DAT
E:O
ctob
er20
071:
250,
000
TIM
MIN
SO
NTA
RIO
REV
:2
05
1015
Kilo
met
ers
P:\EM\Projects\2008\TC81525HollingerPermitting\GIS_Data\BaselineEdits_July2010\Fig1.3_MunicpalBoundaries.mxd
NO
TE:B
ase
map
supp
lied
byG
eom
atic
sC
anad
a,D
epar
tmen
tofN
atur
alR
esou
rce
Lege
nd: S
tudy
Are
a

Goldcorp Canada Ltd. - Hollinger Project Pre-feasibility Environmental Baseline Studies Surface Water Hydrology January 2008
Page 9
2.0 METHODS
Hydrological data were compiled from climatic records, creek and river flow records, and literature sources to provide a database that can be used to evaluate changes to the local hydrological condition that could result from development of the Hollinger mine, once project design concepts are available. The database is also intended for use in project design planning.
2.1 Existing Data Sources
Existing data sources which can be used to characterize Timmins area watersheds and hydrological conditions include:
� Detailed topographic mapping (Lidar imaging) conducted for the Timmins area for Goldcorp during 2006, with contour intervals at 0.3 m elevation;
� Regional watersheds exhibiting natural flow that are (or were) gauged by the Water Survey of Canada (WSC), namely those of the Porcupine, Blanche and La Vase Rivers and Farr Creek;
� Climatic statistics available from the Timmins airport and other local stations; and,
� Climatic statistics developed by Environment Canada.
The Lidar imaging is extremely valuable for delineating local watershed boundaries and conditions because of its digital format; high resolution coloured air photo background; and detailed contour mapping that can be manipulated to contour sets with detail down to 0.3 m.
The regional WSC natural flow gauging stations are useful to discern overall seasonal flow patterns and relationships, for smaller watersheds ranging in size from 62.9 km2 for the Farr Creek system at North Cobalt, to 401 km2 for the Porcupine River system at Hoyle. Porcupine River statistics, even though dated (1977 to 1994) are particularly useful because the major portion of the Hollinger project LSD is comprised of headwater portions of the Porcupine River system.
The Timmins airport climatic station meets World Meteorological Organization (WMO) standards for temperature and precipitation, and includes a nearly complete set of climatic parameters necessary for hydrological modeling, and is therefore regarded as a quality climate station. Where climatic data are not available for the Timmins airport, such as for sunshine, these data are available from other local sources, such as from Kapuskasing.
Environment Canada has developed various climatic statistics that are useful for characterizing local hydrological parameters. Theses include various aspects of temperature and precipitation, dewpoint, humidity, and sunshine.

Goldcorp Canada Ltd. - Hollinger Project Pre-feasibility Environmental Baseline Studies Surface Water Hydrology January 2008
Page 10
2.2 Data Analysis
Data analysis was carried out using:
� Geographic information systems (ArcView GIS) to conduct watershed mapping, and to define watershed details such as, slopes and general form;
� The ENGSOFT computer programs developed by Engineering Software Solutions, out of Waterloo, Ontario, to calculate low and high flow extreme watershed flow statistics on Porcupine River flow data;
� The Morton Model, developed by the National Hydrological Research Institute of Environment Canada, and run by Custom Climate Services, of Regina, to calculate evapotranspiration statistics;
� The Atmospheric Environment Service (AES) Extreme Value Rainfall plus Snowmelt Model for determining cumulative rainfall plus snowmelt runoff quantities for durations of 1 to 30 days and for return periods of from 2 to 100 years;
� The AES Extreme Rainfall Model for determining cumulative rainfall runoff quantities for durations of 1 to 30 days and for return periods of from 2 to 100 years; and,
� Microsoft Excel statistical packages.
ArcView GIS software was used to interpret the Lidar imaging and associated detailed topographic mapping, in order to derive watershed boundaries and local drainage paths. Even with these tools, there were still some areas where it was difficult to precisely define watershed boundaries. This was particularly the case in areas of exceptionally flat terrain, and in areas where natural drainage has been altered by roads, urban development, and past mining activities. Field reconnaissance was required to confirm drainage paths in some of these altered areas.
Statistical analyses of monthly average low and high flows for the Porcupine River system, for varying return periods, were carried out using the ENGSOFT Low Flow Frequency Analysis (ESLOFFAN), and the Flood Frequency Analysis (ESFFAN) programs, respectively. These computer programs compute hydrological return period statistics using the following statistical distributions: 2-parameter log-normal, 3-parameter log-normal, log Pearson Type-3 distribution, and the Gumbel distribution. Graphical comparisons allow the practitioner to select the most appropriate distribution to the data. The ESLOFFAN program was also used to compute 7-day low flow statistics.
The Morton model utilizes temperature, dew point and sunshine data to calculate actual evapotranspiration and potential evapotranspiration. The model takes into account interactions between evaporating surfaces and overpassing air.

Goldcorp Canada Ltd. - Hollinger Project Pre-feasibility Environmental Baseline Studies Surface Water Hydrology January 2008
Page 11
AES Extreme Value Rainfall, and Rainfall plus Snowmelt, models utilize the Gumbel extreme value statistical distribution. The models were run by the Canadian Climate Centre of AES and the results were provided to AMEC. Five different models are run, with Model 1 (Eastern Canadian Forested Basin) being the model most applicable to the Timmins area. The Model 1 snowmelt calculation is based solely on mean daily air temperature.
Excel statistic packages were used to augment certain aspects of the data analysis.
2.3 Field Surveys
All data presented in this report were derived from existing data sources. The only field surveys that were carried out were those used to confirm watershed drainages in areas where drainages had been altered by man-made structures such as ditching, that are sometimes difficult to discern on the Lidar imaging.

Goldcorp Canada Ltd. - Hollinger Project Pre-feasibility Environmental Baseline Studies Surface Water Hydrology January 2008
Page 12
3.0 DATA ANALYSIS (RESULTS)
The data presented in this section are intended for use in determining water balance and receiving water flow characteristics, once project designs are established. A variety of data are provided on local climatic and runoff statistics, including extreme value statistics. Discussions on local watersheds and terrain unit characterization are also provided to help with future environmental effects assessments.
3.1 Climate
Climate data for the Hollinger site are available from the Timmins airport (1971-2000, 30-year climate normals) (Table 3.1). The data set includes monthly information on:
� Temperature (average, minimum and maximum averages; extremes; days with minimum and maximum temperatures above selected threshold temperatures);
� Precipitation (rainfall fall; snowfall; extremes; days with rainfall and snowfall above selected threshold values);
� Snow depth (days with snow cover above selected threshold values);
� Wind (average speed; maximum hourly speed; maximum gust speed; direction);
� Degree days;
� Humidex;
� Wind chill;
� Humidity (vapour pressure; relative humidity);
� Pressure ;
� Visibility; and,
� Cloud cover.
The mean annual temperature for Timmins airport is 1.3oC. January is the coldest month (mean at -7.5oC, mean minimum at -23.9oC, and mean maximum at -11oC); and July the warmest month (mean at 17.4oC, mean minimum at 10.5oC, and mean maximum at 24.2oC). Recorded temperature extremes for the period are -45.6oC and 38.9oC.

Latitude: 48° 34.200' N Longitude: 81° 22.800' W Elevation: 294.70 m
Climate ID: 6078285 WMO ID: 71739 TC ID: YTS
Jan Feb Mar Apr May Jun Jul Aug Sep Oct Nov Dec Year
Daily Average (°C) -17.5 -14.4 -7.7 1.2 9.6 14.7 17.4 15.7 10.3 4.2 -4 -13.2 1.3
Standard Deviation 3 3.2 2.7 2.2 2.1 1.7 1.1 1.4 1.5 1.9 2.2 3.8 1
Daily Maximum (°C) -11 -7.5 -0.9 7.6 16.6 21.7 24.2 22.3 16.1 8.9 0.1 -7.8 7.5
Daily Minimum (°C) -23.9 -21.3 -14.5 -5.2 2.5 7.5 10.5 9.1 4.4 -0.6 -8.1 -18.7 -4.9
Extreme Maximum (°C) 6.4 11.7 19.9 29.9 33.3 38.8 38.9 36.7 32.2 28.3 18.9 14.2
Date (yyyy/dd) 1996/18 1994/19 1990/15+ 1986/28 1962/17 1995/18 1975/31 1976/20 1973/02 1968/16 1975/06 1982/03
Extreme Minimum (°C) -44.2 -45.6 -37.8 -29.4 -11.1 -3.2 -0.5 -1.7 -6.4 -13 -33.9 -43.9
Date (yyyy/dd) 1982/18 1962/01 1989/03 1964/01 1958/02 1980/19+ 1992/01 1965/30+ 2000/28 1981/24 1975/26 1975/19
Rainfall (mm) 2.9 1.6 14.7 26.6 62.7 89.1 91.5 82 86.7 64 29.5 7 558.1
Snowfall (cm) 61.7 40.6 49.9 27.5 6.7 0.4 0 0 1.6 14 45.7 65.4 313.4
Precipitation (mm) 53.9 36.6 59.4 52.8 69.2 89.4 91.5 82 88.3 76.8 69.6 61.9 831.3
Average Snow Depth (cm) 58 66 58 25 1 0 0 0 0 0 7 29 20
Median Snow Depth (cm) 58 66 58 25 0 0 0 0 0 0 6 29 20
Snow Depth at Month-end (cm) 67 62 44 6 0 0 0 0 0 0 14 44 20
Extreme Daily Rainfall (mm) 14.2 9 32.5 32.8 53.3 77.4 87.6 86.8 43.9 47.5 37.6 28.7
Date (yyyy/dd) 1995/14 1983/20 1973/11 1992/21 1972/29 1984/24 1990/29 1986/10 1961/01 1966/15 1988/05 1971/10
Extreme Daily Snowfall (cm) 33 37 48.2 36 17 2.6 0 0 7.2 19.3 28.4 39.6
Date (yyyy/dd) 1962/07 1999/28 1983/19 1985/06 1986/01 1980/10+ 1955/01+ 1955/01+ 1989/23 1976/15 1966/28 1985/01
Extreme Daily Precipitation (mm) 33 35.6 48.2 35.8 53.8 77.4 87.6 86.8 43.9 47.5 37.6 39.2
Date (yyyy/dd) 1962/07 1999/28 1983/19 1985/06 1972/29 1984/24 1990/29 1986/10 1961/01 1966/15 1988/05 1985/01
Extreme Snow Depth (cm) 127 137 130 96 70 0 0 0 4 15 64 157
Date (yyyy/dd) 1967/29 1960/27+ 1960/01 1978/02 1996/01 1955/01+ 1955/01+ 1955/01+ 1980/26+ 1969/27+ 1966/30+ 1968/24+
<= 0 °C 29 23.6 16.6 4.1 0.03 0 0 0 0 2 15.3 26.1 116.7
> 0 °C 2 4.7 14.4 25.9 31 30 31 31 30 29 14.7 4.9 248.5
> 10 °C 0 0.1 1.8 10.1 24.9 29.1 31 31 25.6 12.1 2.1 0.03 167.8
> 20 °C 0 0 0 1.6 10.3 18.8 25.6 20.7 7.4 1.3 0 0 85.7
> 30 °C 0 0 0 0 0.8 1.6 2.5 1.3 0.21 0 0 0 6.4
> 35 °C 0 0 0 0 0 0.03 0.14 0.07 0 0 0 0 0.24
> 0 °C 0 0.37 1.3 5.5 19.6 28 31 30.7 23.7 11.8 2.6 0.27 154.8
<= 2 °C 31 28.2 30.6 27.4 16.7 4.5 0.39 1.4 10.3 23.4 29 30.9 233.9
<= 0 °C 31 27.9 29.7 24.5 11.4 2 0.04 0.28 6.3 19.2 27.4 30.7 210.5
< -2 °C 30.9 27.5 28 20.2 5.6 0.27 0 0 1.9 12.4 23.7 29.9 180.3
< -10 °C 28.1 24.6 20.7 6.4 0 0 0 0 0 0.29 10.3 24.3 114.6
< -20 °C 20.8 17.4 8.8 0.57 0 0 0 0 0 0 1.9 14.1 63.7
< - 30 °C 8 4.6 0.86 0 0 0 0 0 0 0 0.03 4 17.4
>= 0.2 mm 1.6 1 3.3 6.5 11.1 14.4 14 13.9 16.3 13 6 2.1 103.1
>= 5 mm 0.2 0.07 0.93 2 4.1 5.5 5.4 4.9 5.8 4.5 1.9 0.4 35.7
>= 10 mm 0.03 0 0.4 0.73 2.3 2.8 3 2.7 2.7 1.8 0.9 0.2 17.5
>= 25 mm 0 0 0.03 0.03 0.17 0.47 0.63 0.59 0.37 0.21 0.1 0.07 2.7
>= 0.2 cm 18.1 13.9 11.9 7 2.2 0.3 0 0 0.87 6.6 15.6 19.1 95.6
>= 5 cm 4 2.5 3.1 1.9 0.43 0 0 0 0.1 0.68 2.5 4.6 19.6
>= 10 cm 1.4 0.77 1.4 0.53 0.17 0 0 0 0 0.18 1.1 1.5 7
>= 25 cm 0.03 0.03 0.13 0.07 0 0 0 0 0 0 0.03 0.03 0.32
>= 0.2 mm 17.7 13.6 13.3 11 12.1 14.4 14 13.9 16.6 16.4 18.7 19 180.7
>= 5 mm 3 2.2 3.8 3.8 4.6 5.5 5.4 4.9 5.9 5.2 4.2 3.9 52.4
>= 10 mm 1.2 0.6 1.7 1.4 2.6 2.8 3 2.7 2.7 2.1 2 1.3 23.9
>= 25 mm 0.03 0.03 0.17 0.2 0.27 0.47 0.63 0.59 0.37 0.25 0.21 0.1 3.3
>= 1 cm 31 28.3 30.8 22.3 2.2 0 0 0 0.13 3.1 20.7 30.4 168.9
>= 5 cm 30.8 28.3 30.2 19.5 1.4 0 0 0 0 0.93 12.7 28.3 152.1
>= 10 30.7 28.3 29.7 16.6 0.9 0 0 0 0 0.29 8.4 25.3 140.2
>= 20 30 28.3 28.7 13.6 0.4 0 0 0 0 0 3.2 19.7 123.9
Speed (km/h) 12.3 12.3 13.4 13.5 12.4 11.5 10.3 9.8 11.2 12.3 12.5 11.8 11.9
Most Frequent Direction W NW NW NW N S S S S S S S S
Maximum Hourly Speed 57 59 58 56 64 56 48 72 56 56 61 56
Date (yyyy/dd) 1978/26 2002/12 1974/03 1962/15+ 1956/22 1964/16 1956/28+ 1967/03 1955/06 1958/04+ 1955/10 1971/11
Maximum Gust Speed 105 96 108 89 93 158 85 105 105 89 89 105
Date (yyyy/dd) 1962/26 1999/12 1974/03 1967/02+ 1959/06 1956/14 2001/21 1969/23 1970/10 1962/16+ 1958/18+ 1970/02
TABLE 3.1 - TIMMINS AIRPORT (A) 30-YEAR CLIMATE NORMALSONTARIO
* This station meets WMO standardsWMO standards for temperature and precipitation.
Days with Snow Depth: Days with Snow Depth:
Wind: Wind:
Precipitation: Precipitation:
Days with Maximum Temperature: Days with Maximum Temperature:
Days with Minimum Temperature: Days with Minimum Temperature:
Days with Rainfall: Days with Rainfall:
Temperature: Temperature:
Days With Snowfall: Days With Snowfall:
Days with Precipitation: Days with Precipitation:
Jan Feb Mar Apr May Jun Jul Aug Sep Oct Nov Dec Year
Direction of Maximum Gust NW SW SW NW SW W N NW W SW S SW W
Days with Winds >= 52 km/hr 0.2 0.1 0.2 0 0.1 0.2 0 0.1 0.2 0 0.1 0.1 1.4
Days with Winds >= 63 km/hr 0.1 0 0.1 0 0 0 0 0 0 0 0 0 0.2
Above 24 °C 0 0 0 0 0.1 0.5 1.7 0.5 0.1 0 0 0 2.8
Above 18 °C 0 0 0 0.3 6.2 20.4 35.4 23 4.1 0.1 0 0 89.6
Above 15 °C 0 0 0 1.3 18.8 52 89.9 62.1 12.9 1.1 0 0 238
Above 10 °C 0 0 0.3 7 64.8 151.9 229.7 180 58.4 10.5 0.3 0 702.8
Above 5 °C 0 0.1 2.2 27.6 158.3 290.6 384.3 332.6 161.9 47.5 4.6 0.2 1409.9
Above 0 °C 0.1 3 18.3 90.9 297.1 439.8 539.3 487.6 305.6 140.7 27.1 1.8 2351.3
Below 0 °C 541.4 411.2 253.4 55 0.9 0 0 0 0.1 13.7 147.8 412.3 1835.7
Below 5 °C 696.3 549.7 392.3 141.7 17 0.8 0 0 6.4 75.5 275.3 565.7 2720.6
Below 10 °C 851.3 690.9 545.3 271.1 78.6 12.2 0.4 2.5 52.8 193.4 421 720.5 3839.9
Below 15 °C 1006.3 832.2 700.1 415.4 187.6 62.2 15.6 39.5 157.3 339 570.7 875.5 5201.4
Below 18 °C 1099.3 917 793.1 504.4 268 120.7 54.2 93.4 238.6 431 660.7 968.5 6148.8
Extreme Humidex 6.1 10.7 21.8 31.5 37.5 43 44 42 40.1 32.9 20.8 17.1
Date (yyyy/dd) 1975/11 1994/19 1990/15 1990/26 1962/16 1995/18 1963/01 1975/01 2002/08 1968/16 1961/03 1982/03
Days with Humidex >= 30 0 0 0 0 1.4 4.3 7.6 5.7 1.2 0.1 0 0 20.4
Days with Humidex >= 35 0 0 0 0 0.1 0.6 1.8 1 0.3 0 0 0 3.8
Days with Humidex >= 40 0 0 0 0 0 0.1 0.3 0.1 0 0 0 0 0.5
Extreme Wind Chill -54.2 -53.7 -45.8 -37.1 -18.8 -8.5 -2.4 -4 -9.3 -19.2 -38 -53.1
Date (yyyy/dd) 1957/13 1962/10 1967/18 1964/03 1986/02 1972/10 2001/01 1965/30 1965/27 1988/30 1958/30 1993/26
Days with Wind Chill < -20 26 21.7 15.6 2.6 0 0 0 0 0 0 5.1 20.1 91.1
Days with Wind Chill < -30 16.9 12.4 5.8 0.2 0 0 0 0 0 0 0.8 11 47.1
Days with Wind Chill < -40 5.6 2.7 0.3 0 0 0 0 0 0 0 0 1.8 10.4
Average Vapour Pressure (kPa) 0.2 0.2 0.3 0.4 0.8 1.1 1.4 1.4 1 0.7 0.4 0.2 0.7
Average Relative Humidity - 0600LST (%)
75 76.3 76.9 78.4 79.4 84.6 88.6 91.8 92.3 88.5 86.7 80.3 83.2
Average Relative Humidity - 1500LST (%)
68.2 61 55.3 49.1 46.3 49.8 52.4 55.6 61.7 65.7 74.6 74.7 59.5
Average Station Pressure (kPa) 97.8 98 98 97.9 97.9 97.8 97.8 98 98 98 97.9 97.9 97.9
Average Sea Level Pressure (kPa) 101.6 101.8 101.7 101.6 101.5 101.3 101.3 101.6 101.6 101.6 101.6 101.7 101.6
< 1 km 11.1 6.3 13.6 10.8 6.5 4 4.6 8.7 10.9 13.3 12.2 9.4
1 to 9 km 161.1 123.7 112.3 82.7 62.2 63.6 49.8 67.5 90.1 97.7 143.1 173.1
> 9 km 571.8 547.6 618.1 626.6 675.3 652.4 689.6 667.7 619 633 564.7 561.6
0 to 2 tenths 214.5 209.9 234.7 214.6 192.1 170.9 182.6 203.5 148.6 139.6 104.8 171.6
3 to 7 tenths 106.2 106.7 117.4 118.4 146.4 175.9 209 195.6 144.4 112.9 80.4 97
8 to 10 tenths 423.2 361 391.9 387 405.5 373.2 352.4 344.9 427 491.5 534.8 475.4
Pressure: Pressure:
Visibility (hours with): Visibility (hours with):
Cloud Amount (hours with): Cloud Amount (hours with):
Degree Days: Degree Days:
Humidex: Humidex:
Wind Chill: Wind Chill:
Humidity: Humidity:

Goldcorp Canada Ltd. - Hollinger Project Pre-feasibility Environmental Baseline Studies Surface Water Hydrology January 2008
Page 15
The mean annual total precipitation for Timmins is 831.3 mm, of which 558.1 mm (67.1%) falls as rain, and the remainder (32.9%) as snow. Peak precipitation occurs during the period of June through October. The extreme daily rainfall for the period is 87.6 mm, recorded on July 29, 1990. The extreme snowfall for the period was measured as 48.2 cm, recorded on March 19, 1983.
Statistical derivations of extreme rainfall events for the Timmins area are available from Hogg and Carr (1985 - Rainfall Frequency Atlas of Canada) for durations of 5 minutes through 24 hours, and for return periods of from 2 to 100 years (Table 3.2).
TABLE 3.2 TIMMINS AREA EXTREME RAINFALL STATISTICS (mm)
Return Period (years) Duration 2 5 10 15 20 25 50 100
5 min 6.5 9.0 10.7 11.6 12.2 12.7 14.3 15.8 10 min 9.4 12.7 15.0 16.2 17.1 17.8 19.8 21.9 15 min 10.6 15.0 17.9 19.6 20.7 21.6 24.4 27.1 30 min 14.7 21.8 26.4 29.1 30.9 32.4 36.7 41.1 1 hr 17.9 26.3 31.9 35.0 37.2 38.9 44.1 49.3 2 hr 21.6 29.1 34.1 36.9 38.9 40.4 45.0 49.7 6 hr 31.9 43.3 51.0 55.3 58.3 60.6 67.7 74.8 12 hr 39.3 53.9 63.5 69.0 72.8 75.7 84.8 93.8 24 hr 51.7 69.4 81.1 87.7 92.3 95.9 106.8 117.7
The regional design storm (Timmins Storm) occurred during August 31 to September 1, 1961. At the aerial centre of the storm, the 6, 12, 18, 24 and 30/36 hour durations produced accumulated precipitation values of approximately 102 mm, 156 mm, 175 mm, 187 mm and 201 mm, respectively (Environment Canada 1961).
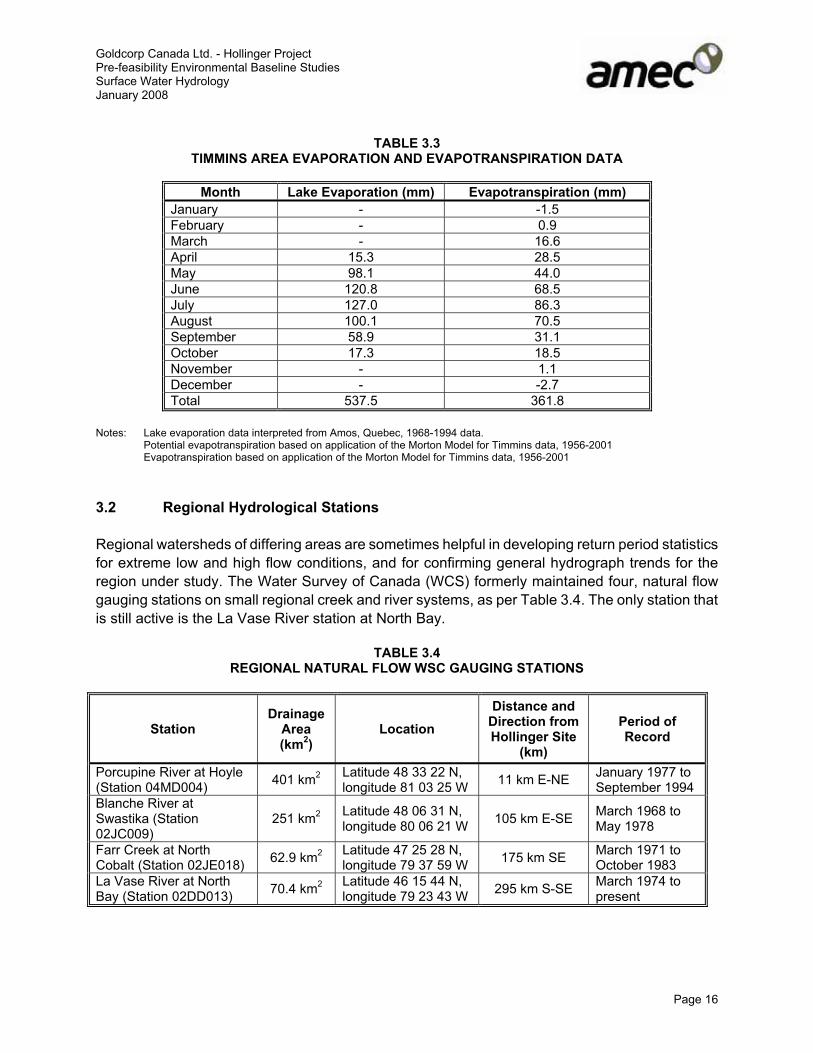
The nearest applicable lake evaporation data are from the Amos meteorological station in Quebec (Table 3.3). Evapotranspiration data were developed for the Timmins area using the Morton model, with data inputs from the Timmins Airport station (temperature and dewpoint data), and from the Kapuskasing CDA (sunshine). Morton model results were provided by Custom Climate Services (Table 3.3). The small negative winter values are reportedly indicative of condensation, as opposed to evaporation/sublimation, but could also be an artifact of model construction.
Winds are typically out of the west – northwest in winter and out of the south in the summer and fall. Mean monthly wind speeds are consistently in the 11 to 12 km/h range throughout the year.
Goldcorp Canada Ltd. - Hollinger Project Pre-feasibility Environmental Baseline Studies Surface Water Hydrology January 2008
Page 16
TABLE 3.3 TIMMINS AREA EVAPORATION AND EVAPOTRANSPIRATION DATA
Month Lake Evaporation (mm) Evapotranspiration (mm) January - -1.5 February - 0.9 March - 16.6 April 15.3 28.5 May 98.1 44.0 June 120.8 68.5 July 127.0 86.3 August 100.1 70.5 September 58.9 31.1 October 17.3 18.5 November - 1.1 December - -2.7 Total 537.5 361.8
Notes: Lake evaporation data interpreted from Amos, Quebec, 1968-1994 data. Potential evapotranspiration based on application of the Morton Model for Timmins data, 1956-2001 Evapotranspiration based on application of the Morton Model for Timmins data, 1956-2001
3.2 Regional Hydrological Stations
Regional watersheds of differing areas are sometimes helpful in developing return period statistics for extreme low and high flow conditions, and for confirming general hydrograph trends for the region under study. The Water Survey of Canada (WCS) formerly maintained four, natural flow gauging stations on small regional creek and river systems, as per Table 3.4. The only station that is still active is the La Vase River station at North Bay.
TABLE 3.4 REGIONAL NATURAL FLOW WSC GAUGING STATIONS
StationDrainage
Area(km2)
Location Distance and
Direction from Hollinger Site
(km)
Period of Record
Porcupine River at Hoyle (Station 04MD004) 401 km2 Latitude 48 33 22 N,
longitude 81 03 25 W 11 km E-NE January 1977 to September 1994
Blanche River at Swastika (Station 02JC009)
251 km2 Latitude 48 06 31 N, longitude 80 06 21 W 105 km E-SE March 1968 to
May 1978
Farr Creek at North Cobalt (Station 02JE018) 62.9 km2 Latitude 47 25 28 N,
longitude 79 37 59 W 175 km SE March 1971 to October 1983
La Vase River at North Bay (Station 02DD013) 70.4 km2 Latitude 46 15 44 N,
longitude 79 23 43 W 295 km S-SE March 1974 to present

Goldcorp Canada Ltd. - Hollinger Project Pre-feasibility Environmental Baseline Studies Surface Water Hydrology January 2008
Page 17
An analysis of monthly average flows (monthly runoff values are in mm to standardize for watershed area) for the above four stations, over their respective periods of record, is provided in Table 3.5. The seasonal flow patterns are essentially the same for all systems, with each showing low winter flows, followed by a pronounced spring freshet, followed by a summer low flow, and a fall increase in flows.
With all other factors being equal, there is an expected relationship between watershed area and seasonal flows, wherein smaller systems are expected to exhibit less runoff inertia compared with larger systems (Mosley and McKerchar 1993, Vogel and Kroll 1990). Accordingly, systems with smaller watershed areas would be expected to show stronger seasonal, per unit area flow extremes, compared with larger systems (i.e., smaller systems are expected to yield lower per unit area low flows, and higher per unit area high flows, compared with larger systems).
For the selected watersheds shown in Table 3.4 the above generalized watershed area relationship does not always hold, indicating that there are other more important factors controlling runoff in these different systems. In winter, for example, typically the extreme low flow period for the region, the lower series of charts in Table 3.5 show that smaller watersheds have higher per unit area flows, compared with larger watersheds. An analysis of the period of common record for the watersheds shows this same relationship. The observed winter low flow relationship between the four watersheds is contrary to generalized expectations based on watershed alone, indicating that there are other more important controlling factors. A major controlling factor appears to be latitude, with the more northern stations showing lower winter runoff rates compared with the more southern stations. Presumably this relationship is governed by the more severe and prolonged freezing conditions that characterize the more northerly stations.
For the summer low flow condition, where latitude is less important, the data show the expected relationship, with larger systems showing higher per unit area flow rates, compared with smaller systems. Peak spring, per unit area flow rates show essentially no relationship with watershed area.
Based on the above analysis, the Porcupine River system data are likely to provide the best measure expected sub-watershed hydrologic yields for the Timmins area, as this station is by far the closest to the Hollinger site (Table 3.4); and because the Porcupine River watershed, comprising a large portion of the project study area, is also likely to best characterize the local study area watersheds in terms of other factors affecting local runoff (e.g., climate, terrain and land use).
Data available from other systems (i.e., the Blanche River, Farr Creek and La Vase River watersheds) support the general seasonal hydrograph shown for the Porcupine River (Table 3.5), but are not helpful as modifiers for determining watershed area yields for Timmins area sub-watershed yields, because of latitude and other confounding effects. Further reference to these additional watersheds is therefore excluded, and the focus of more detailed analyses in Section 3.4 is on the Porcupine River system.

Month PorcupineRiver
La VaseRiver Farr Creek Blanche
RiverJan-00 7.3 12 10.4 12.9Feb-00 5.7 13.5 9 8.5Mar-00 10.3 52.3 28.2 10.2Apr-00 104.8 121.7 108.6 61.3May-00 117.7 46 79 114.2Jun-00 34.2 16.2 23 48.6Jul-00 22.5 13.4 9.3 25.7Aug-00 16.9 10.9 6.1 11Sep-00 22.6 19.6 7 8.9Oct-00 45 33.9 18.4 18.8Nov-00 34.5 47.4 19 32.2Dec-00 15.3 26 16.2 24.4Total 436.8 412.9 334.2 376.7
TABLE 3.5REGIONAL STATION STREAM FLOW DATA
(Flow equivalents - mm/month per unit watershed area, for period of record)
REGIONAL STREAM FLOW DATA
020406080
100120140
Jan-0
0
Feb-00
Mar-00
Apr-00
May-00
Jun-0
0Ju
l-00
Aug-00
Sep-00
Oct-00
Nov-00
Dec-00
DATE
RU
NO
FF (m
m) Porcupine
RiverLa VaseRiverFarr Creek
BlancheRiver
Winter Lowest Monthly Average Flow
y = -0.0138x + 11.501R2 = 0.744
02468
101214
0 100 200 300 400 500
Watershed Area (km2)
Run
off (
mm
)
Winter Lowest Monthly Average Flow
y = -2.486x + 127.11R2 = 0.9199
02468
101214
46 46.5 47 47.5 48 48.5 49
Latitude (km2)
Run
off (
mm
)
Summer Lowest Monthly Average Flow
y = 0.0224x + 6.3027R2 = 0.6266
0
5
10
15
20
0 100 200 300 400 500
Watershed Area (km2)
Run
off (
mm
)
Spring Peak Monthly Average Flow
y = 0.0066x + 114.25R2 = 0.0371
105
110
115
120
125
0 100 200 300 400 500
Watershed Area (km2)
Run
off (
mm
)

Goldcorp Canada Ltd. - Hollinger Project Pre-feasibility Environmental Baseline Studies Surface Water Hydrology January 2008
Page 19
3.3 Local Watershed Analysis
Watersheds that could potentially be affected by project related developments are shown in Figure 3.1. Potentially affected watersheds are defined to include those that could be affected by mine water discharge, runoff from possible waste rock pile areas, and Hollinger pit discharge at closure. The Hollinger site itself is located at the apex of three watersheds, namely those of the Porcupine River to the east, Skynner Creek to the southwest, and the Gillies Lake/Town Creek system to the northwest. The precise delineation of watershed boundaries in the immediate Hollinger site area is difficult, even with the benefit of 0.3 m Lidar contour intervals, because of extensive open-pitting and underground stope breakthroughs in this area. Gillies Lake is connected to Town Creek by way of a buried pipeline outfall that flows north from the lake.
Boundaries of a number of other LSA watersheds have also been influenced by past mining operations. This is especially true of areas in the vicinity of the Kayorum, McIntyre, ERG, Delnite and Dome tailings areas, as well as areas affected by the Dome open pit and waste rock piles.
Porcupine River System
The dominant watersheds draining the area surrounding the Hollinger site area are those of the Porcupine and South Porcupine Rivers, which to the point of their confluence just west of Porcupine Lake, measure 32.0 km2 and 42.7 km2, respectively (Figure 3.1). Beyond their confluence, these two systems pass into the southwest end Porcupine Lake. From Porcupine Lake, the Porcupine River flows in a north-northeasterly direction, looping around the Kidd Metsite tailings areas, before turning south to Night Hawk Lake, and the Frederick House River system. The North Porcupine River, which drains the northern portion of the ERG tailings area and adjacent areas north of the Porcupine watershed boundary shown in Figure 3.1, enters the main branch of the Porcupine River near the northwest margin of the Kidd Metsite tailings. Near where the Porcupine River crosses Highway 101, at Hoyle, just upstream of its confluence with Night Hawk Lake, Environment Canada formerly maintained the Porcupine River WSC flow gauging station (04MD004). This station was operated from January 1977 to September 1994 (Section 3.2).
Headwaters of the Porcupine River drain Little Pearl Tailings Pond, Pearl Lake, Clearwater Lake, and the southern portion of the ERG tailings area. Current underground pumping at the McIntyre headframe discharges to Little Pearl Tailings Pond, and hence to the Porcupine River. This pumping is carried out to control groundwater levels in the Hollinger mine site area. Underground workings of the former Hollinger, McIntyre and Coniaurum mines are all interconnected. Water quality within the Porcupine River is influenced by past mining activities, as is the water quality of virtually all other watersheds shown in Figure 3.1, except those of the Perch Lake system and the series of smaller creeks shown in the northwest portion of the figure.
The Porcupine River is a low gradient system, with the river mainstem, downstream of Pearl Lake exhibiting a gradient of 0.44 % (i.e., a drop of 4.4 m vertical per 1,000 m horizontal). The river flow and that of its tributaries is interrupted by numerous beaver dams, both active and historic. The elevations of Little Pearl Tailings Pond (313.2 m amsl) and Pearl Lake (313.0 m amsl) are important

Goldcorp Canada Ltd. - Hollinger Project Pre-feasibility Environmental Baseline Studies Surface Water Hydrology January 2008
Page 20
to future considerations involving the re-flooding of the Hollinger open pit, at mine closure, because both of these water bodies exhibit elevations which may, or may not be above any future pit lake water level.
The South Porcupine headwaters drain McDonald and Simpson Lakes, as well as the existing Dome tailings containment facility, and the Dome waste rock storage area (Figure 3.1). South Porcupine River characteristics are similar to those of the Porcupine River, being characterized by a mainstem gradient of 0.33 % (3.3 m vertical drop per 1,000 m horizontal), and numerous beaver dams.
Skynner Creek and Perch Lake System Watersheds
Skynner Creek originates at Skynner Lake in the extreme southeast of the watershed, but also drains the southern portion of the City of Timmins proper and the Kayorum tailings area. Its watershed measures approximately 13.4 km2 (Figure 3.1).The northeastern portion of the watershed has been strongly altered by the Kayorum tailings area, and by headwater channeling to the north in the vicinity of the Hollinger Golf Club. Skynner Creek drains to the Mountjoy River, which flows into the Mattagami River. This creek is also a low gradient system, being characterized by a mainstem gradient of 0.54 % (5.4 m vertical drop per 1,000 m horizontal), and numerous beaver dams.
Skynner Creek is of interest to the Hollinger project from three perspectives. First, the southernmost portion of the Hollinger site drains south to the Skynner Creek system. Second, much of the Skynner Creek drainage system passes through terrain dominated by glaciofluvial sand deposits. Hence, there is the potential for stronger surface water/groundwater interconnections in this area. And third, because of its lower elevation, it would be possible to induce gravity flow from a future flooded Hollinger pit (following mine closure) to the Skynner Creek system.
The Perch Lake system is a smaller drainage system, located adjacent to the Skynner Creek watershed, that also flows to the Mountjoy River. Similar to the Skynner Creek system, much of the Perch Lake watershed is founded on glaciofluvial sand deposits, and therefore potentially exhibits a strong surface water/groundwater interconnection. Similar to the Skynner Creek system, the Perch Lake system is positioned at a lower elevation such that it would also be possible to induce gravity flow from a future flooded Hollinger pit (following mine closure) to the Skynner Creek system.
Town Creek and Smaller North Mattagami River Watersheds
The Town Creek system drains Gillies Lake, low gradient tailings areas to the east of Highway 655, and significant portions of the City of Timmins proper (Figure 3.1). The connection between Gillies Lake and Town Creek is subsurface, by way of a buried pipeline that exits to the Town Creek drainage system in the area of Murray Street Park. The low gradient tailings to the east of Highway 655 (the Hollinger tailings) were reportedly deposited in the former northeastward extension of Gillies Lake during the 1920's and 1930's (Kees Pols per. comm., Mattagami Region Conservation Authority, October 5, 2007). These tailings are partially sulphide concentrate tailings and are

Goldcorp Canada Ltd. - Hollinger Project Pre-feasibility Environmental Baseline Studies Surface Water Hydrology January 2008
Page 21
therefore acid generating. Management of these tailings is being addressed through a separate closure plan.
Past consideration has been given to draining Hollinger Mine workings to the Gillies Lake/Town Creek system. However, concerns over the potential flooding of portions of the City adjacent to lower reaches of the Town Creek system argue against this proposal, and against directing passive drainage from any future flooded Hollinger pit lake (after mine closure) to the Town Creek system.
In addition to Town Creek, there are four other smaller watersheds that drain the area west of Highway 655 and north of the Town Creek system. All of these smaller watersheds drain directly or indirectly (through Craft Creek) to the Mattagami River. These smaller watersheds are included in the LSA for the sole reason that consideration was given to stockpiling waste rock in the area west of Highway 655 and north of the Timmins hospital. Further considerations argued against using this area for waste rock storage (discussed separately in AMEC 2007), hence no specific efforts have been directed at characterizing these smaller watersheds, other than to define their boundaries.
3.4 Porcupine River System – Detailed Hydrological Analysis
The Porcupine River watershed drains a large portion of the LSA and is the only watershed for which there are reliable flow records. These flow records, even though dated (1977 to 1994), together with other data derived from climatic parameters, are useful for characterizing generalized hydrological regimes for the Timmins area.
Monthly flow data (m3/s) and watershed runoff equivalents (mm/d/unit area) for the Porcupine River WSC Hoyle station are provided in Table 3.6 for the period of record. Projected return period low and high monthly flow rates are shown in Table 3.7. Statistical calculations were based on the 2-parameter log-normal distribution, which provided the best overall fit to the low and high flow data.
Extreme runoff statistics can be computed from (1) the Porcupine River WSC station for the standard 7-day low flow conditions, for various return periods; (2) the Atmospheric Environment Service (AES) for ‘Extreme Value Analysis of Rainfall Plus Snowmelt’ for the Timmins area (Model 1 statistics); and (3) the AES Rainfall Frequency Atlas for Canada for extreme rainfall statistics.
Standard 7-day low flow statistics generated from Porcupine River flow data, expressed as m3/d and as watershed runoff equivalents in mm/d/unit area, are shown in Table 3.8, for return periods of 2 through 100 years. Data were generated using the log Pearson Type-3 statistical distribution, as providing the best fit to the data.

Year
Jan
Feb
Mar
Apr
May
Jun
Jul
Aug
Sep
Oct
Nov
Dec
Mea
n
1977
0.82
60.
432
2.75
17.4
7.12
2.39
1.6
0.98
63.
037.
392.
084.
3219
780.
833
0.55
50.
412.
6127
.510
.27.
251.
331.
717.
672.
471.
45.
3819
790.
893
0.82
61.
3621
31.6
9.95
2.12
1.02
3.73
10.3
5.74
2.32
7.6
1980
1.06
1.21
0.59
522
.415
.54.
223.
11.
914.
566.
53.
091.
365.
4419
810.
736
1.47
3.19
25.9
132.
731.
30.
557
0.52
53.
473.
461.
364.
819
821.
070.
788
0.82
99.
3321
.12.
754.
750.
949
4.86
13.3
5.98
2.75
5.75
1983
0.97
60.
614
1.7
7.29
35.9
8.62
1.28
1.34
4.02
6.36
3.65
1.9
6.19
1984
1.13
1.83
1.77
19.5
6.54
11.7
6.64
1.19
1.25
2.51
5.03
3.67
5.2
1985
1.47
0.78
40.
811
18.1
12.6
3.36
6.98
2.91
1.59
5.28
6.62
2.12
5.23
1986
1.09
0.90
41.
0121
.712
.92.
421.
925.
044.
889.
044.
351.
895.
619
871.
310.
971
1.64
10.7
4.49
3.42
4.3
5.19
4.22
7.58
4.07
2.33
4.2
1988
1.41
1.26
1.29
16.7
22.6
2.57
1.07
7.62
5.66
6.63
13.9
4.07
7.07
1989
1.29
1.08
1.02
12.3
27.9
7.79
2.87
3.33
1.44
2.91
5.54
1.95
5.81
1990
1.26
1.09
5.1
20.7
17.1
6.62
6.72
1.76
2.51
11.5
6.89
2.81
7.04
1991
1.19
0.85
61.
4323
.98.
081.
480.
498
1.14
1.78
4.18
3.61
2.34
4.2
1992
0.95
70.
838
0.80
615
.117
.31.
260.
634
2.27
77.
355.
252.
485.
1119
931.
290.
649
0.94
913
.823
.47.
343.
852.
43.
686.
923.
642.
055.
8619
940.
852
0.80
21.
0413
.512
.56.
493.
874.
593.
54M
ean
1.09
10.
942
1.53
916
.218
17.6
185.
295
3.37
52.
529
3.49
86.
737
5.33
42.
287
5.57
6
Year
Jan
Feb
Mar
Apr
May
Jun
Jul
Aug
Sep
Oct
Nov
Dec
Mea
n
1977
0.17
80.
093
0.59
33.
749
1.53
40.
515
0.34
50.
211
1.29
30.
653
1.59
20.
448
0.93
119
780.
179
0.12
00.
088
0.56
25.
925
2.19
81.
562
0.28
70.
368
1.65
30.
532
0.30
21.
159
1979
0.19
20.
178
0.29
34.
525
6.80
92.
144
0.45
70.
220
0.80
42.
219
1.23
70.
500
1.63
819
800.
228
0.26
10.
128
4.82
63.
340
0.90
90.
668
0.41
20.
983
1.40
00.
666
0.29
31.
172
1981
0.15
90.
317
0.68
75.
580
2.80
10.
588
0.28
00.
120
0.11
30.
748
0.74
50.
293
1.03
419
820.
231
0.17
00.
179
2.01
04.
546
0.59
31.
023
0.20
41.
047
2.86
61.
288
0.59
31.
239
1983
0.21
00.
132
0.36
61.
571
7.73
51.
857
0.27
60.
289
0.86
61.
370
0.78
60.
409
1.33
419
840.
243
0.39
40.
381
4.20
11.
409
2.52
11.
431
0.25
60.
269
0.54
11.
084
0.79
11.
120
1985
0.31
70.
169
0.17
53.
900
2.71
50.
724
1.50
40.
627
0.34
31.
138
1.42
60.
457
1.12
719
860.
235
0.19
50.
218
4.67
62.
779
0.52
10.
414
1.08
61.
051
1.94
80.
937
0.40
71.
207
1987
0.28
20.
209
0.35
32.
305
0.96
70.
737
0.92
61.
118
0.90
91.
633
0.87
70.
502
0.90
519
880.
304
0.27
10.
278
3.59
84.
869
0.55
40.
231
1.64
21.
220
1.42
92.
995
0.87
71.
523
1989
0.27
80.
233
0.22
02.
650
6.01
11.
678
0.61
80.
717
0.31
00.
627
1.19
40.
420
1.25
219
900.
271
0.23
51.
099
4.46
03.
684
1.42
61.
448
0.37
90.
541
2.47
81.
485
0.60
51.
517
1991
0.25
60.
184
0.30
85.
150
1.74
10.
319
0.10
70.
246
0.38
40.
901
0.77
80.
504
0.90
519
920.
206
0.18
10.
174
3.25
33.
727
0.27
10.
137
0.48
91.
508
1.58
41.
131
0.53
41.
101
1993
0.27
80.
140
0.20
42.
973
5.04
21.
581
0.83
00.
517
0.79
31.
491
0.78
40.
442
1.26
319
940.
184
0.17
30.
224
2.90
92.
693
1.39
80.
834
0.98
90.
763
Mea
n0.
235
0.20
30.
332
3.49
43.
796
1.14
10.
727
0.54
50.
754
1.45
21.
149
0.49
31.
202
TAB
LE 3
.6A
POR
CU
PIN
E R
IVER
MO
NTH
LY F
LOW
DA
TA (m
3 /s)
TAB
LE 3
.6B
POR
CU
PIN
E R
IVER
WA
TER
SHED
MO
NTH
LY R
UN
OFF
EQ
UIV
ALE
NTS
(mm
/d)

Ret
urn
Perio
d(y
rs)
Jan
Feb
Mar
Apr
May
Jun
Jul
Aug
Sep
Oct
Nov
Dec
Mea
n
20.
231
0.19
10.
274
3.14
03.
286
0.92
70.
552
0.42
50.
630
1.30
41.
054
0.47
11.
184
50.
194
0.14
20.
164
1.97
82.
011
0.51
90.
275
0.23
20.
355
0.86
00.
747
0.36
41.
023
100.
178
0.12
20.
125
1.55
31.
556
0.38
40.
191
0.16
90.
263
0.69
20.
625
0.31
80.
947
200.
165
0.10
70.
100
1.27
21.
260
0.29
90.
141
0.13
00.
205
0.57
80.
539
0.28
40.
889
500.
152
0.09
30.
078
1.01
60.
992
0.22
60.
101
0.09
70.
155
0.47
20.
455
0.25
10.
828
100
0.14
40.
084
0.06
60.
875
0.84
70.
187
0.08
00.
080
0.12
90.
413
0.40
80.
230
0.79
0
20.
231
0.19
10.
274
3.14
03.
286
0.92
70.
552
0.42
50.
630
1.30
41.
054
0.47
11.
184
50.
274
0.25
70.
458
4.98
75.
367
1.65
31.
107
0.77
91.
119
1.97
71.
487
0.61
01.
372
100.
299
0.30
10.
598
6.35
06.
936
2.23
71.
593
1.06
81.
511
2.45
71.
779
0.69
81.
481
200.
322
0.34
20.
747
7.75
18.
570
2.87
12.
152
1.38
71.
936
2.94
02.
064
0.78
11.
578
500.
350
0.39
50.
959
9.70
910
.883
3.80
63.
020
1.86
22.
561
3.60
02.
440
0.88
51.
694
100
0.37
00.
434
1.13
211
.273
12.7
524.
589
3.78
32.
263
3.08
34.
118
2.72
60.
962
1.77
7
Not
e: D
ata
calc
ulat
ed u
sing
the
2 pa
ram
eter
log
norm
al d
istri
butio
n
TAB
LE 3
.7PO
RC
UPI
NE
RIV
ER M
ON
THLY
RET
UR
N P
ERIO
D F
LOW
DA
TA (m
m/d
)
Low
Flo
w C
ondi
tion
Hig
h Fl
ow C
ondi
tion

Goldcorp Canada Ltd. - Hollinger Project Pre-feasibility Environmental Baseline Studies Surface Water Hydrology January 2008
Page 24
TABLE 3.8 PORCUPINE RIVER EXTREME LOW FLOW RETURN PERIOD STATISTICS
Return Period (years)
Calculated River Station Flow Statistics
(m3/d)
Calculated Watershed Runoff Equivalents
(mm/d) 7Q2 47,304 0.118 7Q5 34,908 0.087
7Q10 28,848 0.072 7Q20 24,049 0.060 7Q50 18,865 0.047 7Q100 15,531 0.039
Extreme value rainfall plus snowmelt intensity, duration, frequency (IDF) data, generated from the AES Model 1 Extreme Value Analysis of Rainfall Plus Snowmelt database, are shown in Table 3.9 for return periods of 2 through 100 years, and for durations of 1 through 30 days.
TABLE 3.9 TIMMINS AREA EXTREME VALUE RAINFALL
PLUS SNOWMELT RUNOFF MODEL 1 PREDICTIONS (mm)
Return Period (years) Duration (days) 2 5 10 25 50 100
1 30.35 37.47 42.20 48.16 52.58 56.97 2 48.30 58.56 65.37 73.95 80.32 86.65 3 65.55 79.49 88.74 100.40 109.05 117.65 4 81.81 99.56 111.35 126.21 137.23 148.18 5 94.26 115.51 129.61 147.39 160.57 173.69 6 105.62 130.77 147.46 168.50 184.11 199.63 7 115.49 143.83 162.63 186.34 203.93 221.42 8 124.92 155.60 175.96 201.63 220.67 239.60 9 133.61 166.80 188.83 216.60 237.20 257.69 10 142.02 176.71 199.74 228.77 250.30 271.71 15 174.76 213.58 239.35 271.84 295.93 319.90 20 204.15 253.76 286.69 328.21 359.00 389.63 25 226.15 284.76 323.22 371.73 407.70 443.47 30 243.71 307.31 349.52 402.75 442.22 481.47
Notes: Data provided by AES for the period 1955 – 2006, based on the modified Gumbel statistical distribution.
Extreme value rainfall intensity, duration, frequency (IDF) data, generated by AES are shown in Table 3.10 for return periods of 2 through 100 years, and for the probable maximum precipitation event, for durations of 1 through 30 days.

Goldcorp Canada Ltd. - Hollinger Project Pre-feasibility Environmental Baseline Studies Surface Water Hydrology January 2008
Page 25
TABLE 3.10 TIMMINS AREA EXTREME VALUE RAINFALL PREDICTIONS (mm)
Return Period (years) Duration (days) 2 5 10 25 50 100 Probable
Maximum1 44.58 61.00 71.90 85.64 95.83 105.97 386.7 2 50.52 68.02 79.64 94.29 105.15 115.96 403.1 3 55.43 72.95 84.59 99.25 110.13 120.95 411.9 4 59.64 79.11 92.03 108.33 120.42 132.43 458.4 5 62.68 82.62 95.85 112.55 124.92 137.23 472.1 6 66.01 86.42 99.97 117.05 129.71 142.31 486.5 7 70.07 91.51 105.74 123.69 136.99 150.23 511.9 8 73.65 94.86 108.94 126.70 139.86 152.96 511.6 9 76.72 98.10 112.28 130.17 143.44 156.64 518.3 10 80.32 101.36 115.32 132.93 145.99 158.64 515.4 15 99.15 123.62 139.86 160.33 175.52 190.62 604.0 20 115.37 141.21 158.35 179.98 196.01 211.96 648.5 25 133.33 159.98 177.67 199.97 216.51 232.96 682.3 30 147.01 176.02 195.26 219.54 237.54 255.44 744.8
Notes: Data provided by AES for the period 1955 – 2006, based on the modified Gumbel statistical distribution.
3.5 Terrain Unit Characterization
Terrain unit characterization is important to the development of storm water runoff predictions, once project designs and layouts are available. Such characterization typically includes the consideration of cover types, slope, soil groups, curve numbers, and runoff coefficients, all of which are commonly used model parameter inputs for estimating storm generated runoff and peak flows for un-gauged watersheds.
General terrain types are shown in Figure 1.2. The majority of the area consists of bedrock dominated terrain, frequently in association with lacustrine plain terrain types (Units 1-4); and lacustrine plain areas dominated by either clay/silty or sand substrates, frequently in association with bedrock exposures (Units 5-8). Also scattered throughout the area are lacustrine plains dominated by either sand or clay/silt (Units 9-10); esker and other glacio-fluvial terrain types (Units 11-13); alluvial plain and organic terrain (Units 14-15); and tailings and waste rock deposition areas (Units 16-17).
Key terrain-based hydrologic parameters are provided in Table 3.11. Values for soil group, curve number, and runoff coefficient are adapted from Ward and Trimble (2003).

Goldcorp Canada Ltd. - Hollinger Project Pre-feasibility Environmental Baseline Studies Surface Water Hydrology January 2008
Page 26
TABLE 3.11 TERRAIN UNIT HYDROLOGICAL CHARACTERIZATION
Terrain Type Cover Type Slope(%)
SoilGroup1
Curve Number2
Runoff Coefficient3
Rock ridge Open forest 6+ D 83 0.80 Rock ridge (ground moraine)4 Mixed forest 6+ C 70 0.65 Rock knob (lacustrine plain – clay/silt) Mixed forest 2-6 D 77 0.55
Rock ridge (lacustrine plain – sand
Coniferous mixed forest 2-6 B 55 0.30
Lacustrine plain – clay/silt (rock ridge/organic terrain)
Coniferous mixed forest 0-2 (2-6)4 D 77 0.35
Lacustrine plain – clay/silt (rock knob) Coniferous forest 0-2 (2-6) D 77 0.35
Lacustrine plain – clay/silt (rock plain) Coniferous forest 0-2 D 77 0.35
Lacustrine plain – sand (rock plain) Coniferous forest 0-2 B 55 0.20
Lacustrine plain – sand Coniferous forest 0-2 B 55 0.08 Lacustrine plain – clay/silt (organic terrain) Coniferous forest 0-2 D 77 0.35
Glacial-fluvial outwash – sand Coniferous forest 2-6 A 25 0.10 Glacial-fluvial esker – sand Coniferous forest 6+ A 25 0.14 Dunes – sand Coniferous forest 2-6 A 25 0.10 Alluvial plain – clay/silt Mixed forest 0-2 C 70 0.30 Organic terrain Coniferous forest 0-2 na - - Tailings Grass/sparse 2-6 (6+) C 86 0.30 Waste rock Exposed 6+ A 50 0.20
Notes: 1-Soil Group: A – low runoff potential, high infiltration (mainly well-drained sands and gravels; B – moderately well drained, moderately fine to moderately coarse texture;
C – slow infiltration, moderately fine to fine texture; D – very slow infiltration, mainly clay soils, or shallow soils over rock
2-Curve Number: From MTO 1995-1997; Ward and Trimble 2003; 3-Runoff Coefficient: From MTO 1995 - 1997; 4-Bracketted values for terrain type, slope, and runoff coefficient are for sub-terrain units.
3.6 Water Balance
A summary, watershed water balance is provided in Table 3.12. This water balance is intended for use in the future calculation of runoff from localized catchment basins linked to development of the Hollinger Project, where the simple pro-ration of runoff statistics derived from Porcupine River flows would not be appropriate. The localized water balance uses precipitation and evapotranspiration data from Tables 3.1 and 3.3, together with runoff redistribution procedures to (1) redistribute the contribution from precipitation retained in a frozen state over the previous winter, and (2) to account for groundwater discharge (baseflow), and groundwater recharge (infiltration).
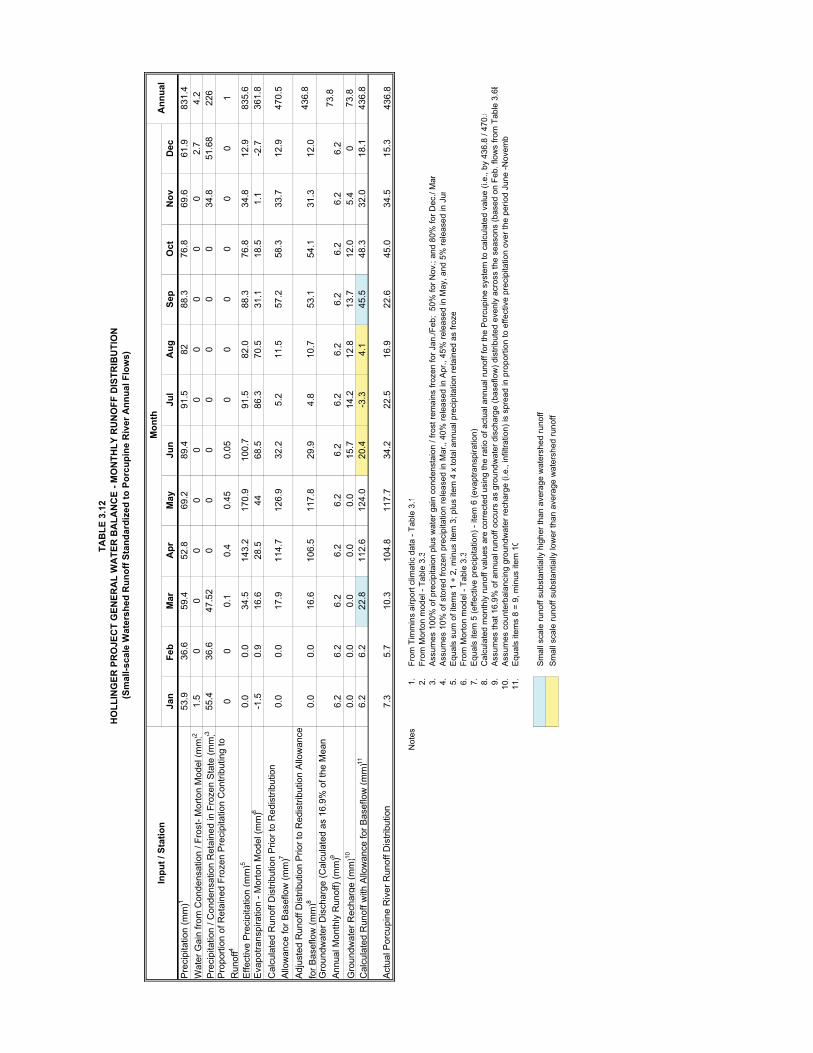
Jan
Feb
Mar
Apr
May
Jun
Jul
Aug
Sep
Oct
Nov
Dec
Pre
cipi
tatio
n (m
m)1
53.9
36.6
59.4
52.8
69.2
89.4
91.5
8288
.376
.869
.661
.983
1.4
Wat
er G
ain
from
Con
dens
atio
n / F
rost
- Mor
ton
Mod
el (m
m)2
1.5
00
00
00
00
00
2.7
4.2
Pre
cipi
tatio
n / C
onde
nsat
ion
Ret
aine
d in
Fro
zen
Sta
te (m
m)3
55.4
36.6
47.5
20
00
00
00
34.8
51.6
822
6P
ropo
rtion
of R
etai
ned
Froz
en P
reci
pita
tion
Con
tribu
ting
to
Run
off4
00
0.1
0.4
0.45
0.05
00
00
00
1
Effe
ctiv
e P
reci
pita
tion
(mm
)50.
00.
034
.514
3.2
170.
910
0.7
91.5
82.0
88.3
76.8
34.8
12.9
835.
6E
vapo
trans
pira
tion
- Mor
ton
Mod
el (m
m)6
-1.5
0.9
16.6
28.5
4468
.586
.370
.531
.118
.51.
1-2
.736
1.8
Cal
cula
ted
Run
off D
istri
butio
n P
rior t
o R
edis
tribu
tion
Allo
wan
ce fo
r Bas
eflo
w (m
m)7
0.0
0.0
17.9
114.
712
6.9
32.2
5.2
11.5
57.2
58.3
33.7
12.9
470.
5
Adj
uste
d R
unof
f Dis
tribu
tion
Prio
r to
Red
istri
butio
n A
llow
ance
fo
r Bas
eflo
w (m
m)8
0.0
0.0
16.6
106.
511
7.8
29.9
4.8
10.7
53.1
54.1
31.3
12.0
436.
8
Gro
undw
ater
Dis
char
ge (C
alcu
late
d as
16.
9% o
f the
Mea
n A
nnua
l Mon
thly
Run
off)
(mm
)96.
26.
26.
26.
26.
26.
26.
26.
26.
26.
26.
26.
273
.8
Gro
undw
ater
Rec
harg
e(m
m)10
0.0
0.0
0.0
0.0
0.0
15.7
14.2
12.8
13.7
12.0
5.4
073
.8C
alcu
late
d R
unof
f with
Allo
wan
ce fo
r Bas
eflo
w (m
m)11
6.2
6.2
22.8
112.
612
4.0
20.4
-3.3
4.1
45.5
48.3
32.0
18.1
436.
8
Act
ual P
orcu
pine
Riv
er R
unof
f Dis
tribu
tion
7.3
5.7
10.3
104.
811
7.7
34.2
22.5
16.9
22.6
45.0
34.5
15.3
436.
8
Not
es1.
From
Tim
min
s ai
rpor
t clim
atic
dat
a - T
able
3.1
2.Fr
om M
orto
n m
odel
- Ta
ble
3.3
3.A
ssum
es 1
00%
of p
reci
pita
ion
plus
wat
er g
ain
cond
enst
aion
/ fro
st re
mai
ns fr
ozen
for J
an./F
eb;
50%
for N
ov.;
and
80%
for D
ec./
Mar
4.A
ssum
es 1
0% o
f sto
red
froze
n pr
ecip
itatio
n re
leas
ed in
Mar
., 40
% re
leas
ed in
Apr
., 45
% re
leas
ed in
May
, and
5%
rele
ased
in J
un5.
Equ
als
sum
of i
tem
s 1
+ 2,
min
us it
em 3
; plu
s ite
m 4
x to
tal a
nnua
l pre
cipi
tatio
n re
tain
ed a
s fro
ze6.
From
Mor
ton
mod
el -
Tabl
e 3.
37.
Equ
als
item
5 (e
ffect
ive
prec
ipita
tion)
- ite
m 6
(eva
ptra
nspi
ratio
n)8.
Cal
cula
ted
mon
thly
runo
ff va
lues
are
cor
rect
ed u
sing
the
ratio
of a
ctua
l ann
ual r
unof
f for
the
Por
cupi
ne s
yste
m to
cal
cula
ted
valu
e (i.
e., b
y 43
6.8
/ 470
.59.
Ass
umes
that
16.
9% o
f ann
ual r
unof
f occ
urs
as g
roun
dwat
er d
isch
arge
(bas
eflo
w) d
istri
bute
d ev
enly
acr
oss
the
seas
ons
(bas
ed o
n Fe
b. fl
ows
from
Tab
le 3
.6B
10.
Ass
umes
cou
nter
bala
ncin
g gr
ound
wat
er re
char
ge (i
.e.,
infil
tratio
n) is
spr
ead
in p
ropo
rtion
to e
ffect
ive
prec
ipita
tion
over
the
perio
d Ju
ne -N
ovem
be11
.E
qual
s ite
ms
8 =
9, m
inus
item
10
Sm
all s
cale
runo
ff su
bsta
ntia
lly h
ighe
r tha
n av
erag
e w
ater
shed
runo
ffS
mal
l sca
le ru
noff
subs
tant
ially
low
er th
an a
vera
ge w
ater
shed
runo
ff
Inpu
t / S
tatio
n
TAB
LE 3
.12
HO
LLIN
GER
PR
OJE
CT
GEN
ERA
L W
ATE
R B
ALA
NC
E - M
ON
THLY
RU
NO
FF D
ISTR
IBU
TIO
N(S
mal
l-sca
le W
ater
shed
Run
off S
tand
ardi
zed
to P
orcu
pine
Riv
er A
nnua
l Flo
ws)
Ann
ual
Mon
th

Goldcorp Canada Ltd. - Hollinger Project Pre-feasibility Environmental Baseline Studies Surface Water Hydrology January 2008
Page 28
When compared with data for the Porcupine River, the localized water balance over-predicts annual runoff (470.5 mm - 7th data row of Table 3.12) compared with measured values for the Porcupine River (436.8 mm, Table 3.5). A major portion of this differential can be accounted for by lake and wetland areas, which would be expected to exhibit evaporation rates closer to those of lake evaporation results provided in Table 3.3, rather than evapotranspiration values used in Table 3.12 calculations. Lake and wetland evaporation affect the Porcupine River watershed as a whole, but were not taken into account in the Table 3.12 evapotranspiration values. To remedy the inconsistency between annual predictions for the two data sets (measured Porcupine River flows and the Table 3.12 water balance), the Table 3.12 data row 7 values were scaled by a factor of 436.8/470.5 to produce an adjusted runoff distribution consistent with Porcupine River data (i.e., Table 3.12 data row 8 values).
The adjusted runoff distribution was further amended to account for groundwater discharge/ recharge effects. In undertaking this adjustment, an estimate of groundwater discharge (effectively creek baseflow) was derived from Porcupine River, February average flows compared with mean annual flows, as provided in Table 3.6B. The February flow of 0.203 mm/d for the Porcupine River watershed is equivalent to 16.9% of the average annual flow of 1.202 mm/d.
The resultant localized catchment basin runoff distribution is shown in the last row in the table. For comparison, actual Porcupine River monthly runoff values are also shown. The localized catchment values are substantially higher than Porcupine River values for the months of March and September, and substantially lower for the summer months of June through August. These differentials mostly reflect lag times inherent in larger versus smaller systems.

kjTI
MM
INS
SCHU
MAC
HER
GO
LDCE
NTR
ECO
NNA
UGHT
HILL
SOUT
HPO
RCUP
INE
Pear
lLa
ke
Gill
ies
Lake
To
wn Creek
Skyn
ner
Lake
Skynne
r Cre
ek
Mountjoy
Riv
er
Clea
rwat
erLa
ke
Porc
upin
e Riv
er Sim
pson
Lake
Sout
h Porc
upine River
Porc
upin
eLa
ke
McD
onal
dLa
ke
Perc
hLa
ke
Mattagami River
Lt. P
earl
Lake
Taili
ngs
Pond
LaFo
rest
Roa
d
High
way
101
Highway 655
4.7
km2
4.4
km2
2.6
km2
1.4
km2
32.0
km
2
42.7
km
2
13.4
km
2
4.6
km210
.0 k
m2
1:53
,000
Lege
nd:
kjPi
t Cen
troid
Stud
y A
rea
(Wat
ersh
ed B
ound
ary)
Stud
y A
rea
(Riv
erin
e an
d R
oad
Bou
ndar
y)
Opt
ion
for P
ossi
ble
New
Hol
linge
r
Stud
y A
rea
(Riv
erin
e an
d R
oad
Bou
ndar
y)
Wat
ersh
eds
Riv
er o
r Cre
ek
I
HO
LLIN
GER
BA
SELI
NE
STU
DIE
S
Wat
ersh
eds
SCA
LE:
PRO
JEC
T N
o: T
C71
507
FIG
UR
E: 3
.1
DAT
E: S
epte
mbe
r 200
71:
53,0
00
TIM
MIN
SO
NTA
RIO
REV
: 1
01
23
Kilo
met
ers
P:\EM\Projects\2007\TC71507 Hollinger Baseline Studies\GIS data\Quaternary Geology\Figure 4 - Watershed.mxd
(Max
imum
Foo
tprin
t Und
er C
onsi
dera
tion)
Was
te R
ock
Stoc
kpile

Goldcorp Canada Ltd. - Hollinger Project Pre-feasibility Environmental Baseline Studies Surface Water Hydrology January 2008
Page 30
4.0 EVALUATION AND DISCUSSION
4.1 Hydrological Function
The hydrological ecosystem function is typically interpreted within the context of watersheds and subwatersheds, and includes, as a minimum, the following aspects (subfunctions):
� Landform development through material erosion and depositional processes; � Runoff storage and conveyance; � Recharging groundwater systems; � Providing systems for groundwater discharge; � Maintenance of soil moisture regimes and associated plant and animal life; � Provision of aquatic habitat; � Assisting with the cycling of nutrients and minerals; � Assisting with the removal and degradation of wastes; and, � Moderating local climates.
Altering the flow of water within watersheds can potentially affect all or most of the above functions.
Landform development tends to occur over longer time periods, but under more extreme flood conditions erosion at the local scale can become problematic. This is especially the case where fine sandy and silty soils are present, and where vegetation cover has be extensively disturbed, or removed entirely.
Runoff storage and conveyance is the principal means of moving received precipitation and snowmelt through the watershed. Runoff storage occurs on vegetated and other complex surfaces, as well as in lake, pond and wetland systems. All of these storage elements have the effect of helping to better distribute precipitation inputs over time, and therefore reduce the potential erosional effects of peak runoff events. Runoff storage also helps to maintain the balance of aquatic habitats by ameliorating the flows of creek and river systems. At the same time, drainage networks provide conveyance pathways for removing excess water from the landscape, which is an important aspect of flood control.
A third hydrological function is the recharging of groundwater systems, and the related aspect of groundwater discharge. Groundwater recharge is a special case of runoff storage, but on a longer time scale. Groundwater systems are important to the maintenance of vegetation communities, including wetlands, as well as to the maintenance of creek and river baseflows, when available precipitation is lacking, such as during periods of drought; and in the case of creek and river baseflow in winter when precipitation is largely locked up in the form of ice and snow. Groundwater systems are replenished through the infiltration of precipitation (and runoff) into the subsurface, the rate of which is a function of soil porosity and runoff storage potential. Groundwater release is similarly a function of soil porosity and other factors such as the expression of drainage networks and the presence of aquitards.

Goldcorp Canada Ltd. - Hollinger Project Pre-feasibility Environmental Baseline Studies Surface Water Hydrology January 2008
Page 31
The hydrological relationship between soil moisture regimes and associated plant and animal life is described above in terms of runoff storage and groundwater infiltration. Most, if not all, plant species show a range of tolerance for varying moisture conditions. If these conditions show appreciable change outside of seasonal norms, such as becoming drier due to groundwater interference or wetter due to changes in runoff regimes, plant communities and their associated animal communities can become adversely affected.
The relationship between runoff storage and conveyance and groundwater recharge and discharge has also been discussed above in relation to aquatic habitat. Aquatic habitats, particularly in small systems, are extremely sensitive to hydrological changes; hence the focus of government regulatory instruments on the protection of aquatic systems. Activities such as mine dewatering and other mine-related activities have the potential to alter hydrological systems, and the associated quantity and quality of aquatic habitats.
A further important hydrological function is the role of water movement in the cycling of nutrients within both terrestrial and aquatic systems. Precipitation, groundwater infiltration and runoff are all main drivers of geochemical and bacteriological processes which release important nutrients and minerals to terrestrial and aquatic ecosystems. These same drivers also help to degrade and remove wastes from the environment.
The last hydrological function listed above is the moderation of local climates. Forests and other plant communities that are maintained by hydrological functions affect microclimates in terms of such aspects as temperature, humidity, and light penetration. Water bodies and wetlands also affect temperatures and humidity at the local level.
All of the above hydrological functions are complex and interactive.
4.2 Surface Water – Groundwater Linkage
Of particular importance to the Hollinger Project is the linkage between surface water and groundwater systems. Mine dewatering has the potential to affect surface water systems through mechanisms outlined in Section 4.1. More specifically, by drawing down the local groundwater table, groundwater discharge sources that normally serve to maintain creek and river baseflow, and wetland environments, can potentially become depleted, or partially depleted. There is also the potential for enhanced direct leakage from surface water systems, such as lakes and ponds, to depressurized groundwater systems. To evaluate these potentials, it is important to determine the extent of expected groundwater removal, and subsurface soil conditions associated with local aquatic systems and wetlands.
Zones of porous soil are potentially the most problematic, where these exhibit a direct connection to bedrock. Areas of specific interest to the Hollinger Project include the Pearl Lake area and the Skynner Creek and Perch Lake systems. Sediments beneath Pearl Lake are comprised principally of sandy materials (AMEC 2008a). Areas to the south of the Hollinger site - in the vicinity of McDonald Lake and the Skynner Creek and Perch Lake systems – are also characterized by

Goldcorp Canada Ltd. - Hollinger Project Pre-feasibility Environmental Baseline Studies Surface Water Hydrology January 2008
Page 32
extensive sandy terrain (Figure 1.2). If these permeable deposits are in direct contact with the bedrock, and if the bedrock becomes depressurized as a result of mine dewatering activities, these surface hydrological systems could be adversely affected.
Hydrogeological studies conducted by AMEC predict a dewatering rate of 8,820 m3/d with development of the Hollinger open pit (AMEC 2008b). This compares with an historic dewatering rate for underground mining at the Hollinger and McIntyre sites of approximately 7,600 m3/d (AMEC 2008b), and a current dewatering rate averaging approximately 4,000 m3/d at the Dome Mine.
Figure 4.1 shows the extent of surface water features in 1969, when the Hollinger and McIntyre Mines were still in a dewatered state, compared with 2006 Lidar images of the principal lake area shoreline boundaries. The image shows that virtually all of the principal lakes and ponds within the study area had very similar perimeter outlines and hence similar depths (within seasonal norms), for the two timeframes (1969 and 2006), with the exception of Little Pearl Tailings Pond to the immediate north of the proposed Hollinger open pit, and Peroli Lake located approximately 3.5 km southwest of the proposed Hollinger open pit centroid. Little Pearl Tailings Pond was dredged by ERG Resources Inc. in 1989, and therefore has an expectedly larger current water surface area than that shown in the 1969 air photo (Figure 4.1). Peroli Lake is very shallow and is currently impounded by a small road at its north end, which is sufficient to account for the observed water level differences between 1969 and 2006.
The fact that lake area outlines were essentially the same in 1969, when the area was under drained, as they were in 2006 when there was only limited dewatering to manage near surface groundwater levels in the immediate Hollinger mine area (Section 1.1), strongly suggests that surface water bodies in the Hollinger area, including those associated with sandy terrain are unlikely to be significantly affected by dewatering of a future Hollinger open pit mine. The only potential exception to this is the Pearl Lake area. During historic dewatering of the Hollinger and McIntyre Mines, mine water was reportedly discharged to Pearl Lake. Such discharge would have maintained the water level of this lake and also likely the water level of Clearwater Lake, further downstream.
The current groundwater model for the proposed Hollinger open pit indicates that a substantial portion of the groundwater recharge to the open pit, calculated at 64%, or about 5,640 m3/d at full pit development (AMEC 2008b), is likely to derive from Pearl Lake (and the Little Pearl Tailings Pond). The above value compares to an average annualized surplus runoff of approximately 2,525 m3/d for the Pearl Lake watershed, measured at 2.1 km2. Given the generally steeper terrain and partially urbanized landscape, which characterizes much of this watershed, the 2,525 m3/d runoff estimate for the watershed is likely an underestimate. Nevertheless, it appears that unless mine water is returned directly, or indirectly, to these water bodies, there is a reasonable potential for lake water level reductions, especially during the winter when there is little or no natural recharge to the system. If mine water is discharged directly, or indirectly, to Pearl Lake, then water quality of the discharge will require consideration.

Goldcorp Canada Ltd. - Hollinger Project Pre-feasibility Environmental Baseline Studies Surface Water Hydrology January 2008
Page 33
4.3 Environmental Constraints and Sensitivities
Hydrological constraints and sensitivities, relating to development of the Hollinger project, potentially include:
� Mine water discharge will increase flows to the selected receiving water system, and suspended solids and ammonia will have to be reduced to acceptable levels prior to any such discharge;
� Mine dewatering will depressurize the surrounding bedrock, which could in turn lead to reductions in surface water flows, and to the associated water levels of lakes, ponds and wetland systems;
� Changes in terrain condition, such as through waste rock pile development, could alter runoff regimes at the local level; and,
� Open pit outflow at mine closure will be governed by topography, if passive discharge is to be employed.
Mine water discharge will mainly affect base flow conditions during the winter and summer months, when receiving water flows at are their lowest. Base flow augmentation could be beneficial for local receiving waters provided that the quality of the mine water discharge is consistent with applicable Ministry of the Environment guidelines. Water quality contaminants of potential concern are likely to include total suspended solids and possibly ammonia derived from blasting residuals.
Watercourse baseflows are dependant on groundwater discharge. Depressurization of the local bedrock aquifer is expected to reduce groundwater availability, and could therefore potentially affect local creek and river flows in headwater areas, especially during summer drought conditions and during the winter period; and could also potentially reduce the water levels of local ponds, lakes and wetlands. The extent of this concern relates to the potential radius of influence of the bedrock aquifer cone of depression, and to the nature of overburden materials. Where watercourses are beyond the cone of depression, no effects would occur. But, within the cone of depression, effects would have to be evaluated.
Also, where local lakes, ponds, wetlands and watercourses are developed in sandy terrain with direct bedrock connections, there is the potential for “leakage” losses to the depressurized bedrock zone. Areas of potential concern in this regard include Pearl Lake, which is underlain by mainly sand deposits sitting on bedrock; Clearwater Lake; and also possibly areas to the south of Hollinger including McDonald Lake, and the Skynner Creek and Perch Lake systems, all of which are developed in areas of sandy terrain (Figure 1.2). Hydrogeological studies indicate that such adverse effects, if any, are likely to be confined to the Pearl Lake area (AMEC 2008b). The Skynner Creek, Perch Lake and McDonald Lake systems are unlikely to be adversely affected by pit dewatering (Section 4.2). Gillies Lake and Edwards Lake are situated in lacustrine clay plain areas, and are therefore also not susceptible to dewatering effects.

Goldcorp Canada Ltd. - Hollinger Project Pre-feasibility Environmental Baseline Studies Surface Water Hydrology January 2008
Page 34
Runoff at the local level could potentially be altered by waste rock development. Where areas are already well drained, runoff rates could be reduced; but where runoff is extensively controlled by ponds and wetland systems, runoff rates could potentially increase. Any such changes, however, are likely to be small, and of limited consequence.
Open pit outflow at mine closure will be governed by topography, if passive discharge is to be employed. For a discussion of this topic see Section 4.4.
4.4 Mine Closure
At mine closure, the most likely method of open pit rehabilitation will be to flood the pit. An inspection of the local topography indicates that, depending on the final pit geometry, it may or may not be practicable to induce gravity flow from a future flooded Hollinger pit lake through the Porcupine River system. If passive pit lake drainage through the Porcupine River system proves impractical, then the only other options for passive outflow are (1) development of a constructed drainage way south to the Skynner Creek or Perch Lake systems; or (2) development of a constructed drainage way (or underground flow) to Gillies Lake.
A definitive evaluation of the various discharge options following mine closure will be dependent upon the final pit configuration, and other variables, which remain to be determined.
4.5 Recommendations
Flow records for the Porcupine River system are dated and there are no flow records for the Skynner Creek system. It is therefore recommended that three permanent flow monitoring stations be set up in the area, as per the following:
� Porcupine River near the Highway 101 crossing; � South Porcupine River near the Pamour pit haul road crossing; and, � Skynner Creek near the Pine Street South road crossing.
Suggested locations of flow monitoring stations are shown in Figure 4.2. Stations should be set up as stilling wells, with automatic data loggers (or equivalent) to ensure maximum accuracy and station security. Also, manual flow measurements should be taken at monthly intervals under the ice in winter, to allow correction for under-ice pressure effects.
In addition to flow monitoring stations, automatic data logger, lake water level recorders should be set up at a number of lakes in the area, potentially including Gillies Lake, Pearl Lake, Clearwater Lake, McDonald Lake, Skynner Lake, Perch Lake, and possibly also Simpson Lake and Edwards Lake. Staff gauges should also be set up at the transducer stations so that manual, winter under-ice water levels can be taken on a monthly basis.

Goldcorp Canada Ltd. - Hollinger Project Pre-feasibility Environmental Baseline Studies Surface Water Hydrology January 2008
Page 35
The data obtained from the above monitoring network will help to better define pre-development hydrological conditions in the area, and will also allow post development monitoring to be carried out.
Climatic data can continue to be obtained from the Timmins airport. It is therefore not necessary to set up a dedicated weather station, unless Goldcorp prefers to set up a station for greater ease of data access.

TIM
MIN
SSC
HU
MA
CH
ER
GO
LDC
ENTR
E
Pear
lLa
ke
Gill
ies
Lake
Town Cre
ek
Skyn
ner
LakeSky
nner
Cre
ek
Mountjo
y Ri
ver
Cle
arw
ater
Lake
Porc
upin
e Rive
r
Sim
pson
Lake
Sout
h P
orcupine River
McD
onal
dLa
ke
Perc
hLa
ke
Mattagami River
Hig
hway
101
Highway 655
Edw
ards
Lake
Mill
erLa
ke
Pero
liLa
ke
Cow
boy
Lake
4720
00.0
0000
047
5000
.000
000
4780
00.0
0000
048
1000
.000
000
4840
00.0
0000
0
5364000.0000005366000.0000005368000.0000005370000.0000005372000.000000
01
23
0.5
Kilo
met
res
P:\E
M\P
roje
cts\
2007
\TC
7150
7 H
ollin
ger B
asel
ine
Stud
ies\
GIS
dat
a\Aq
uatic
s M
appi
ng\1
969_
AirP
hoto
.mxd
HO
LLIN
GER
PR
OJE
CT
His
toric
Exp
ress
ion
of
Are
a La
kes
and
Pond
s(P
hoto
196
9)
SCA
LE:
PRO
JEC
T N
o: T
C71
507
FIG
UR
E: 4
.1
DAT
E: D
ecem
ber 2
007
1:40
,000
Lege
nd Lak
e Pe
rimet
re (2
006)
Wat
er F
eatu
re

TIM
MIN
SSC
HUM
ACHE
R
GO
LDCE
NTR
ECO
NNA
UGHT
HILL
SOUT
HPO
RCUP
INE
Pear
lLa
ke
Gill
ies
Lake
To
wn Creek
Skyn
ner
Lake
Skynne
r Cre
ek
Mountjoy
Riv
er
Clea
rwat
erLa
ke
Porc
upin
e Riv
er
Sim
pson
Lake
Sout
h Porc
upine River
Porc
upin
eLa
ke
McD
onal
dLa
kePe
rch
Lake
Mattagami River
Lt. P
earl
Lake
Taili
ngs
Pond
LaFo
rest
Roa
d
High
way
101
Highway 655
42.9
km
2
10.0
km
2
4.6
km2
2.6
km2
1.4
km2
4.4
km2
4.7
km2
32.0
km
2
13.2
km
2Ed
war
dsLa
ke
9
8
7
6
54
3
2
1
11
10
1:53
,000
Lege
nd: Pr
opos
ed H
ollin
ger P
it C
entro
id
Stud
y A
rea
(Wat
ersh
ed B
ound
ary)
Stud
y A
rea
(Riv
erin
e an
d R
oad
Bou
ndar
y)
Wat
ersh
eds
Riv
er o
r Cre
ek
FLO
W M
ON
ITO
RIN
G L
OC
ATIO
NS
Porc
upin
e R
iver
nea
r Hig
hway
101
Sout
h Po
rcup
ine
Riv
er n
ear P
amou
r pit
haul
road
Skyn
ner C
reek
nea
r the
Pin
e S
treet
Sou
th c
ross
ing
WAT
ER L
EVE
L M
ON
ITO
RIN
G L
OC
ATIO
NS
Gilli
es L
ake
Pear
l Lak
e
Cle
arw
ater
Lak
e
McD
onal
d La
ke
Skyn
ner l
ake
Perc
h La
ke
Sim
pson
Lak
e
Edw
ards
Lak
e
HO
LLIN
GER
BA
SELI
NE
STU
DIE
S
SCA
LE:
PRO
JEC
T N
o: T
C71
507
FIG
UR
E: 4
.2
DAT
E: J
anua
ry 2
008
1:53
,000
TIM
MIN
SO
NTA
RIO
REV
: 1
01
23
Kilo
met
ers
P:\EM\Projects\2007\TC71507 Hollinger Baseline Studies\GIS data\Hydrology\Figure 4-2 - Recommended Monitoring Locations.mxd
Rec
omm
ende
d Su
rfac
e W
ater
Mon
itorin
g Lo
catio
ns
1 2 3 4 5 6 7 8 9 10 11

Goldcorp Canada Ltd. - Hollinger Project Pre-feasibility Environmental Baseline Studies Surface Water Hydrology January 2008
Page 38
5.0 REFERENCES
AMEC. 2008a – Goldcorp Canada Ltd. Hollinger Project – Pre-feasibility Environmental Baseline Studies – Geotechnical Conditions Report.
AMEC. 2008b – Goldcorp Canada Ltd. Hollinger Project – Pre-feasibility Environmental Baseline Studies – Hydrogeology.
Environment Canada. 1961. Storm rainfall in Canada Analysis Code No. Ont. 9(2)-61.
Ferguson, S.A. 1968. Geology and Ore Deposits of Tisdale Township, District of Cochrane. Geological Report 58. Ontario Department of Mines. 177 pp plus maps.
Golder Associates. 1997. Timmins Mine Water Study. Prepared for the Mattagami Region Conservation Authority. 22 pp plus figures, tables and appendices.
Hogg, W.D. and D.A. Carr. 1985. Rainfall frequency atlas for Canada. Canadian Climate Program, Environment Canada.
Mosley, M.P. and A.I. McKerchar. 1993. Streamflow pp. 8-1 to 8-39 in D.R. Maidment (ed.). Handbook of Hydrology. McGraw-Hill, Inc.
Ontario Ministry of Transportation. 1995-1997. MTO Drainage Management Manual.
Vogel, R.M. and C.N. Kroll. 1990. Generalized Low-flow Frequency Relationships for Ungauged Sites in Massachusetts. Water Resources Bulletin 26(2) 241-253.
Ward, A.D. and S.W. Trimble. 2003. Environmental Hydrology, 2nd Ed. Lewis Publishers, Boca Raton. 504 pp.
Wright, P.C. 1979. A Historical Geography of Silver and Gold Mining in the Cobalt, the Porcupine and the Kirkland/Larder Lake Camps of Ontario, with Implications for an Interpretive Program. Mater of Arts Thesis, Wilfred Laurier University.