Embed Size (px)
Citation preview

Grid Connection of Solar PV
Technical and Economical Assessment
of Net-Metering in Kenya
Authors
Georg Hille et al.
Michael Franz (ed.)
December 2011
Editor
Deutsche Gesellschaft für Internationale
Zusammenarbeit (GIZ) GmbH
On behalf of the
German Federal Ministry
of Economics and Technology (BMWi)
Contact
Deutsche Gesellschaft für Internationale Zusammenarbeit (GIZ) GmbH
Potsdamer Platz 10, 10785 Berlin, Germany
Fax: +49 (0)30 408 190 22 253
Email: [email protected]
Web: www.gtz.de/projektentwicklungsprogramm
Web: www.exportinitiative.bmwi.de
This report is part of the Project Development Programme (PDP) East Africa. PDP East Africa is implemented by the Deutsche
Gesellschaft für Internationale Zusammenarbeit (GIZ) on behalf of the German Federal Ministry of Economics and Technology
(BMWi) under the Export Initiative Renewable Energies. More information about the PDP and about renewable energy markets in
East Africa: www.gtz.de/projektentwicklungsprogramm
This publication, including all its information, is protected by copyright. GIZ cannot be liable for any material or immaterial damages
caused directly indirectly by the use or disuse of parts. Any use that is not expressly permitted under copyright legislation requires
the prior consent of GIZ.
All contents were created with the utmost care and in good faith. GIZ assumes no responsibility for the accuracy, timeliness,
completeness or quality of the information provided.

Technical and Economical Assessment of Net-Metering in Kenya
Content
I. NET METERING IN KENYA – OUR RESULTS AT A GLANCE 1
II. RECOMMENDATIONS 2
III. METHODOLOGY 6
PART I: ANALYSIS OF THE ECONOMICS OF SOLAR PV IN KENYA 8
1. BACKGROUND AND CONTEXT 8
a. The Kenyan context 9
i. The Solar Resource ..................................................................................................................................... 9
ii. Status of the Kenyan Solar Market ......................................................................................................... 10
iii. Existing grid-connected PV plants........................................................................................................... 11
iv. The Kenyan Electricity Market - relevant customer tariff categories .................................................. 13
b. What is Net Metering 17
c. Net Metering or Feed-in-Tariffs 19
d. Solar PV system price development 20
2. ECONOMIC EVALUATION 23
a. Introduction 23
b. Reference case and input data 25
i. Reference case assumptions ................................................................................................................... 25
ii. PV generation cost assumptions ............................................................................................................. 26
c. Consumer perspective: economic viability of PV power generation 30
i. Investment today ........................................................................................................................................ 30
ii. Investment in future / Investment based on future cost ....................................................................... 32
d. Economic implications at system level 36
e. Optional compensation through “net-metering-fee” – a theoretical model 38
f. Other economic implications 40
g. A possible market development for grid connected PV 41

Technical and Economical Assessment of Net-Metering in Kenya
3. INTERNATIONAL EXPERIENCES IN NET-METERING 42
a. United States 42
b. Denmark 43
c. Mexico 44
d. Brazil 45
e. Morocco 45
f. Best practices 46
PART II: TECHNICAL ISSUES OF SOLAR PV GRID INTERCONNECTION 47
1. INTRODUCTION 47
2. COMPATIBILITY WITH THE KENYA GRID CODE 48
3. SOLAR PV AND THE GERMAN/EUROPEAN ELECTRICITY SUPPLY NETWORK 51
4. RELEVANT TECHNICAL ISSUES OF DISTRIBUTED PV GENERATION 53
5. APPLICABLE ASPECTS OF THE GERMAN LV GUIDELINE 56
6. FUTURE OPTIONS 61
REFERENCES 63

Technical and Economical Assessment of Net-Metering in Kenya
List of Tables
Table 1: Kenya Solar Market: > 1.2 MWp/a [16] ....................................................................................... 10
Table 2: Current tariff structure .................................................................................................................. 13
Table 3: Examples for impact of level of consumption on energy charge payment .................................. 14
Table 4: Electricity tariff charges and levies .............................................................................................. 15
Table 5: Relevant tariff groups and actual end-user prices ....................................................................... 16
Table 6: Characteristics, strengths and weaknesses of net-metering versus Feed-in Tariffs FIT ............ 20
Table 7: Prices for PV in Germany and Kenya in 10/2011 ........................................................................ 21
Table 9: Definition of the most relevant consumer cases for net metering, .............................................. 26
Table 10: PV input data and possible variations ......................................................................................... 27
Table 11: Economic input data and possible variations .............................................................................. 28
Table 12: Possible scenarios and input data variations .............................................................................. 30
Table 13: Current costs for PV Left side for Nairobi radiation conditions (Kisumu) versus
average of recent electricity tariff (10/2011) ................................................................................ 31
Table 15: Profit or losses by net-metering at system level .......................................................................... 37
Table 16: Avoided cost at system level in a mature PV market under net-metering .................................. 37
Table 17: Example how to calculate the surcharge/additional fee on the annual consumers bill ............... 39
Table 18: Cost/benefit of Net Metering for the GoK .................................................................................... 40
Table 19: Customers per relevant KPLC tariff groups ................................................................................. 41
Table 20: Assessment of possible PV market development ....................................................................... 42
Table 8: Set values and reaction time of protection relays ....................................................................... 60
List of Figures
Figure 1: Global Horizontal Solar Radiation in Kenya .................................................................................. 9
Figure 2: Electricity production and real production for the 60 kWp system for
September 2011 (www.sma.de) .................................................................................................. 12
Figure 3: Principle of PV electricity production and daily demand ............................................................. 17
Figure 4: PV system price decrease in Germany ....................................................................................... 21
Figure 5: Learning Curve for PV and future cost development projection.................................................. 22
Figure 11: Sensitivity analysis of a small grid-connected PV plant .............................................................. 25
Figure 12: Comparison of PV cost with increasing tariffs for Nairobi ........................................................... 31
Figure 13: Comparison of PV cost with increasing tariffs for Kisumu ........................................................... 32
Figure 14: Comparison and analysis of LCOE for a) customer categories, b) sites/ irradiation
regimes, c) exchange rates ......................................................................................................... 36
Figure 6: Development of PV installations in Germany 2000 – 2010 ......................................................... 47
Figure 7: Principle scheme of current flow over LV transformer and voltage gradient at
distributed generation. ................................................................................................................. 53
Figure 8: Active power reduction of renewable-based generating units in the case of over-frequency
(from [12]) .................................................................................................................................... 58
Figure 9: Example of a cos φ (P)-characteristic. This is the recommended default curve. ........................ 59
Figure 10: Operation voltage-time bands for DG on the MV grid. ................................................................ 61
Technical and Economical Assessment of Net-Metering in Kenya
Currency
1 EUR = 133 KES / 120 KES
Measurement
W Watt Wp Watt peak Wh Watt hour
kW Kilowatt kWp Kilowatt peak kWh Kilowatt hour
MW Megawatt MWp Megawatt peak MWh Megawatt hour
GW Gigawatt GWp Gigawatt peak GWh Gigawatt hour

Technical and Economical Assessment of Net-Metering in Kenya
List of Acronyms
BMZ Bundesministerium für wirtschaftliche Zusammenarbeit und Entwicklung
ENTSOE European common control area
€ Euro
EIRR Equity internal rate of return
PIRR Project internal rate of return
EPC equipment purchase contract
ERC Energy Regulatory Commission
ESCO energy services company
FIT Feed-in-Tariffs
FNN Forum network technology / network operation in the Association of Electrical,
Electronic and Information Technologies – VDE, Germany
GDP gross domestic product – BIP
GoK Government of Kenya
IFI International Financing Institutions
IPP independent power producer
IRR internal rate of return
KES Kenyan Shilling
KPLC Kenya Power and Lighting Company Limited
PPI power project implementation LCOE Levelised costs of electricity
LCP least cost planning
LEAP the Long range Energy Alternatives Planning System
MoE Ministry of Energy of Kenya
REAP Regional energy advisory platform East Africa
O&M operation and maintenance
SPV Special purpose vehicles
WASP The Wien Automatic Simulation Planning Package

Technical and Economical Assessment of Net-Metering in Kenya
I. Net Metering in Kenya – Our Results at a Glance
1 year is the duration for formulating and implementing a net-metering regulation, assuming fast and well-informed Government of Kenya (GoK) decision until end 2011, the first 30,000 MWh could be fed-in by end of year 2012!
1 EURO / Wp prices have meanwhile been reached in EU sales for high end modules in 2011-Q4, down from about 1,4 €/Wp in early 2011. This sharp decline makes PV in Kenya competitive! The medium term estimates for further cost reductions is 10% p.a.!
1.5 times better than Germany: the yield (“harvested energy” fed into the grid per installed nameplate power of generator) is about 1.5 times higher than Germany and about 1.1 times higher than that of the sunniest EU FIT markets.
2 years maximum until net metering will become the cheapest solution – based on LCOE comparison - for the consumer classes DC (> 1500 kWh/month), SC and CI1. GoK should pave the way for net metering now, so that these projects can gear up.
2 recently installed lighting projects (UNEP and SOS Children’s Village) prove that grid-connected PV works and performs well in Kenya, if it is planned and installed properly with high-end components. The quality standards for products and services of these two projects are equivalent to those recommended in the technical and economical analysis presented here.
2.2 billion KES p.a. avoided fuel cost and a correspondingly lower fuel cost charge could be realized if 100 MWp of solar PV would be installed. This estimate is based on the assumption that PV under net-metering would replace the energy & fuel charges paid to the three most expensive thermal power plants
3.5 KES/kWh could be the maximum for a “net-metering fee” to compensate additional administration expenditures for the utility Kenya Power. This fee should be paid once with the annual bill. However, net metering will not reduce KPLC profit!
50 Hz can be technically controlled and actively supported by modern inverters. Modern solar PV technology can play an active role in voltage control and should not to be seen longer as an “additive” power resource. With improving weather forecast, PV becomes a dispatchable power resource with a very low default rate.
200 MWp installed solar PV under net-metering is realistically feasible within a relatively short timeframe, assuming that only a small fraction of the consumers in the relevant consumer classes (DC, SC, CI1) of between 1% and 3% invest in solar PV under net-metering. However, we recommend starting with 75MWpas soon as possible, and then scale up quickly to allow benchmarking of development partner interventions, international PV manufacturer costs and system performance in Africa.
2,500 EURO investment costs per kWp are attainable today for 50 kWp plants with high-end components. Total turnkey PV generator costs of 2€/Wp are possible for Q1 2013 in Kenya, due to the oversupply and resulting drop in EPC prices worldwide.
300,000 possible PV investors are clients to KPLC in the tariff groups DC (with more than 1500 kWh/consumption), SC and CI1. They are willing to invest. The potential is 210 MWp and above. GoK should balance upfront costs with benefits such as saving the hydro reserves, bringing the national energy mix closer to the efficient frontier of optimal risk-return combinations, creating national employment, abating greenhouse gases, and improving the LV grid, in particular in cities and at the end of weak lines.

Technical and Economical Assessment of Net-Metering in Kenya
II. Recommendations
This report is about the potential for “net metering” to help support the electric grid and to help
grow the solar electric (PV) market in Kenya. “Net metering” is an incentive policy practice which
allows owners of small electric renewable energy systems (i.e. solar, wind, biogas, etc) to feed
excess power produced by their energy systems into the grid. Consumers, who purchase energy
systems themselves, receive credit from the utility at a retail rate for the portion of electricity they
feed on to the grid. At the end of a billing period, they are able to deduct this retail credit from
their overall bill. As a policy practice, net metering has been widely used in the US, Canada,
Europe and Australia to provide a low cost and unbureaucratic incentive for consumers who
desire solar PV systems.
A net metering policy would be a low cost and low risk way to introduce grid connected solar PV
(as well as small scale wind and biogas) into Kenya. It would allow residential, commercial and
industrial consumers to invest in small renewable energy systems on a competitive, free-market
based approach that would be administered by parastatals such as the ERC and KPLC. Such a
policy would allow Kenya to continue its leadership of East Africa’s commercial solar energy
development.
The team makes the following recommendations for the development of net-metering in Kenya:
A. Policy
aspects A1. PV is only financially competitive today (10/2011) under specific
circumstances, due to the high costs of financing for both equity and
debt capital, and due to the adverse development of the exchange
rate. In addition, PV could contribute to “greening” the power sector,
and to improved grid stability. With further price drops being a
certainty, GoK should pave the way now for net metering to prepare
the market within the very near future.
A2. Currently PV is exempted from VAT (16%). We recommend
maintaining the current situation for at least 2 years until a net
metering market is established.
A3. GoK could start with a 1000 – roof-program, by installing a second
meter on the PV plant and herewith monitoring the system
performance to gain experiences.
A4. Policy should encourage owners of suitable existing off-grid systems
to connect their systems to the grid under net-metering, once the grid
reaches their area and a net-metering policy is in place.
B. General
regulatory aspects
B1. Allow all customer classes to do net metering
B2. Allow all renewable energy sources to be tapped through net
metering
B3. Do not arbitrarily limit net metering as a percent of the utility’s peak
demand.

Technical and Economical Assessment of Net-Metering in Kenya
C. Economic aspects
C1. Allow KPLC an annual “net-metering” fee depending from the size of
the PV system to cover the lost profits (i.e. annual payment to KPLC
corresponding with the total amount of net-metered electricity)
C2. Allow monthly carryover of excess electricity at the utility’s full retail
rate – but prevent annual payments of the utility to the consumer
C3. Set fair fees that are proportional to a project’s size.
D. Procedural aspects
D1. In order to ensure quality and safety of PV systems connected to the
grid under net-metering, a qualified and competent entity should be in
charge of approving and inspecting all installed systems through a
standardized, transparent and efficient procedure. Preferably, this
entity could be KPLC, under supervision of ERC.
D2. Ensure that policies are transparent, uniform, detailed and public; and
that regulation sets out the required minimum without over-regulating
the market
D3. The approval process for net-metering projects should also be fully
transparent and fully standardized
D4. Applications should be processed quickly, decisions should occur
within a few days
D5. Customer / investor documentation must be comprehensive and
accessible. It is therefore recommended that the documentation for
net-metering projects is fully standardized
D6. Categorize applications by degree of complexity and adopt plug-and-
play rules for residential- scale systems and expedited procedures for
larger systems.
D7. A problem reported in a US-study1 was the billing systems and a lack
of proper documentation from the customer. The billing needs to
accommodate net-metered customers and adjustments may be
required.
D8. Ideal procedure to commission a PV plant on net metering
(equivalent to German procedure)
� Up to a certain rated power no permission or LV grid affirmation
from KPLC is required
� Either KPLC or a technician with a certificate from KPLC may
exclusively commission the plant
� The investor / tariff consumer has to prepare a proper documented
commissioning protocol provided by ERC
� KPLC will consider this consumer as net metering consumer once
the ERC commissioning protocol is given
1[14]

Technical and Economical Assessment of Net-Metering in Kenya
E. Technical aspects
E1. Kenya could adapt to standards recently set up in Germany. The
report doesn’t want to copy solutions; however other European
countries are now harmonizing their PV-guidelines according to the
German standards described here.
E2. We suggest adding a section to the Kenyan Grid Code for inverter
based generators, or generators connected to the LV grid. This would
clarify the requirements for potential Independent Power Producers.
E3. Modern inverters comply with the Kenyan Grid Code. These PV
inverters - meeting the 2012 German requirements - can perform
active filtering by injecting compensating current harmonics, reactive
power control, voltage level control, phase symmetry control, reduce
losses at the transmission and the distribution grid, support the grid
during disturbances (Fault-Ride-Through Capability), balance of non-
symmetric loads. We recommend allowing only PV inverters to the
Kenyan grid fulfilling all these requirements.
E4. In the short term, respectively for low PV capacities, PV can be
directly used through net metering without any adverse impact on the
power system. On mid-term basis settings for frequency bands and
over frequency behaviour should be adapted to the general network
settings such as 45 Hz for disconnection.
E5. Prohibit requirements for extraneous devices, such as redundant
disconnect switches, and do not require additional insurance.
E6. Apply existing technical standards, tapping international experience2
F. Capacity
develop-ment aspects
F1. Key personnel responsible for distribution networks should be trained
to be aware of grid supporting potential of the new inverters and to
use it for the benefit in their specific grid situation.
F2. A developing PV market requires strong available capacity for
services. Therefore, capacity building of technicians on design and
installation of grid-connected PV systems is strongly recommended.
G. Technical
risk mitigation
G1. In order to guarantee economic returns for investors, power
generation as projected for the utility and minimal grid stability
hazards, it is of utmost importance to proscribe high quality
installation and service standards for the grid-connected PV systems.
2It is worth noting that about 315,000 PV plants larger than 100 kWp will be upgraded In Germany in 2012
to the new technical requirements. In the vast majority of cases, the installer only has to update the software or change the parameter settings of the solar inverters. This means, that even later re-adjustment of technical standards does not automatically mean a replacement of expensive components of PV systems.

Technical and Economical Assessment of Net-Metering in Kenya
G2. High quality should also extend to comprehensive warranty, quality
assurance and after-sale-service mechanisms.
G3. The quality control of the installed systems should be ensured
through a procedure as described above, under supervision of ERC
G4. Consumer education should also be factored in, and undertaken by
mandated bodies such as the sectoral associations, as an important
instrument to achieve good quality in the installed systems and their
operation.

Technical and Economical Assessment of Net-Metering in Kenya
III. Methodology
The objective of this report is to provide quality technical and economical advisory on parameters
and feasibility for grid connection of solar photovoltaic systems through net-metering in Kenya. In
short, it is designed to answer the question: “Is net metering technically, economically and
socially feasible as an incentive policy in Kenya?” The report is subdivided into an economical
and a technical part.
All required data has been collected in a fruitful cooperation of the author, GIZ staff and local
stakeholders, including Ministry of Energy, Kenya Power (KPLC) and ERC. Data from the existing
power plant structure and electric network as well as future extension plans were provided by
KPLC and ERC mainly.
While it is desirable to allow investment into renewable energy power generation on the grid, grid
stability remains of paramount importance. Furthermore, the economic viability of the grid
operations, as well as potential economic implications of investments under a net-metering
regime has to be considered. The main questions for the introduction of grid-connected PV are
thus:
• Do many decentralized small scale PV installations interfere with the grid? • Is the (low voltage) grid stability disturbed by the fluctuating generation? • Can PV actively contribute to system services and security? • Does net metering avoid costs at customer level? • What is the impact of net metering on KPLC revenues?
This report aims at utilizing data generated by the aforementioned pilot projects, data obtained
from relevant sources in Kenya (e.g. the grid operator), as well as data from other (international
sources) to shed light on these issues. In doing so, the assignment is feeding directly into a larger
assignment by GoK, with funding support from the World Bank, on a review of regulatory options
for “Small Scale Power Generation from Renewable Energy Sources”.
The targeted activities and outcomes of the analysis and assessment included:
• Data access and collection
• Discussion with partners from MoE, ERC and KPLC
• Technical and economical data analysis
• Provide report and presentation materials
• Recommendations for intervention
Methodological considerations for the economic analysis comprise:
- To determine the advisability of a large scale grid connected PV market in Kenya,
discounted cash-flows have to be calculated and analyzed. For the (relatively
straightforward but somewhat extensive) PV cash-flow modelling (as done regularly for all

Technical and Economical Assessment of Net-Metering in Kenya
types of project finance), three essential elements have to be determined: (i) discount
factor, (ii) cost and (iii) benefits.
- For task iii we chose to largely mirror the calculation performed regularly by the
dispatcher, in order to determine the operational benefits of PV.
- They key to estimating the operational benefits of PV-plants integrated into the Kenyan
power system/grid is the optimal, least-cost multi-period commitment and dispatch of
available plants both in the absence and the presence of PV-loads, subject to load
balances and other operational constraints (spinning reserves, minimum maximum loads,
volume of dischargeable water).
- From this perspective, the PV-benefits to the system amount to avoided costs defined as
the difference between system minimum [operational] costs without PV and system
minimum [operational] costs in the presence of PV-loads.
- Accordingly, the specific PV benefits (KES/MWh) are given by the ratio of PV-benefits
(KES) to PV-loads (MW) injected.
- In the LCPDP 2011-2031, the optimum dispatch schedule yielding a cost minimum is
calculated through the Wien Automatic Simulation Planning Package (WASP). This study
could not use this or other software models such as MATHEMATICA (it is a simplex-
based de-commitment algorithm) due to time and budget restrictions. To simplify this here
we have used the merit order ranking of the existing power plants and defined the
incremental fuel costs as the average of the three most expensive power plants.
The report is based on the experiences in the world´s largest PV-market - Germany. It gives
recommendations based on the 25 year development of PV in Germany and Europe. Given that
net-metering has also been successfully implemented in many other countries around the world,
this report includes a chapter on lessons learned from other countries with experience in net-
metering, or where net-metering regulation is currently being formulated. While it is evident, that
solutions have to be tailored to the Kenyan context, it is still possible to derive lessons and
conclusions from abroad. The author firmly believes that the solutions for the German and
European context are also suitable for Kenya.
The report uses models that the author – with his team – has developed over 20 years of
studying and implementing solar PV projects in European electricity markets.

Technical and Economical Assessment of Net-Metering in Kenya
Part I: Analysis of the Economics of Solar PV in Kenya
1. Background and Context
This chapter looks at the context of solar energy in Kenya, existing electricity tariff and policy
structures, the overall concept of net metering (and how it relates to Feed In Tariff incentives),
and how net metering programs can positively affect solar electricity prices.
Solar electricity is not new to Kenya. The Kenyan power sector is characterized by a rapidly
growing demand, large geographical imbalances in power demand and supply, and accelerating
private sector involvement. The Government is investing in exploration of geothermal energy. In
addition, substantial potential exists for exploiting domestic potential of other renewable energy
sources, not least solar power. Interest in solar energy is rapidly increasing. In fact, Kenya and
Germany are alike in that they were among the first countries in the world to install hundreds of
thousands of solar electric systems for households. The primary difference is that in Kenya, all of
the PV systems were off-grid solar home systems (averaging under 50 Wp) while in Germany
virtually all of the installed systems were grid-connected (averaging over 4 kWp). Kenya has an
active market for solar equipment; however, there has been no systematic effort on the part of the
industry or Government to bring solar on to the grid --- which is where over 95% of the global
market for PV is today.
The experiences of two pilot net-metering systems in Mombasa and Nairobi are explored in this
chapter. Thus far, the systems have performed well and there have been no major problems in
their interactions with the KPLC grid.
Through the detailed study of electricity tariff categories and rate structures, this chapter provides
a basis for establishing whether indeed net metering is feasible in Kenya and if it is which
consumer categories hold the most promise for net-metering policy arrangements.
Finally, this chapter introduces the topic of net metering and the relevant opportunities and
difficulties that might arise from its introduction. It explores the difference between net metering
and feed in tariff as policy tools and it examines how these policy tools can actively grow solar
markets.

Technical and Economical Assessment of Net-Metering in Kenya
a. The Kenyan context
i. The Solar Resource
Kenya is located near the equator and has a great potential for solar power. The average
radiation is 4-6 kWh/m2/day. However, despite its relatively high solar resources, there are
significant local and seasonal variations in solar energy distribution. For example, Nairobi
experiences high seasonal fluctuations, with periods of relatively high radiation between
December and February and low periods between June and September. On the other hand,
Kisumu has a very good solar radiation throughout the year. It is important that solar consumers
are aware of solar resources in their area and on the long-term implications of these resources on
their purchase. In this report, we have chosen to model Nairobi and Kisumu as two sites
representing the conditions in most of the country.
Figure 1: Global Horizontal Solar Radiation in Kenya3
3Source: RETScreen 4, graph from SWERA
Location Longitude / Latitude kWh/m²*d
Nairobi 36.9E / -1.3N 5,01
Mombasa 39.6E / -4.0N 5,48
Kisumu 34.8E / -0.1N 6,48

Technical and Economical Assessment of Net-Metering in Kenya
ii. Status of the Kenyan Solar Market
The population is currently 41 Million with an annual growth of 2.5%. The electrification rate
ranges between 15-20 % at national level, with a rural electrification rate of only 5-10%. The
electricity demand is growing by 5-8% p.a. Off-grid commercial and institutional PV markets play
an important role in pre-electrification of areas not reached by the Kenya power grid. PV demand
created in this market has created a base market of several MW PV sales per year. However,
the potential for PV in grid-connect applications may be much greater than off-grid applications
and it offers a dynamic new stage of growth for the solar industry. However, these relatively new
markets for larger, commercial on- or off-grid applications are yet to begin to develop.
Solar PV Technology
Estimated
installed capacity
Estimated kWp
installed / year
(2008)
Degree of
Competition
Off-grid HH
electrification & small
scale commercial
>6-8MWp >700kW Extremely
competitive, many
players
Off-grid systems (incl.
institutional and
pumping)
>1.5MWp >250kW Dominated by
wholesaler / agent
partnerships
Telecom >300kWp >100kWp Emergent
Tourism >50kWp N/A Emergent
On-grid 560 kWp N/A Emergent
Table 1: Kenya Solar Market: > 1.2 MWp/a [16]
The current market structure is characterized by the following elements:
� Technicians play a key role in the market, some operating as re-sellers and as sales
agents.
� Established importers (±8) represent international PV companies, sell through distributors.
� Opportunistic importers import PV modules & distribute to retailers of electric goods and
shops.
� Sales agents target geographic and niche markets that they develop on behalf of the
wholesaler.
� High-end niche companies operate in NGO, UN and increasingly tourism and
telecommunication markets [16].
� While the market for solar home systems mostly comprises over-the-counter trade, the
market segment for electrification of social institutions is driven almost exclusively by
public procurement.

Technical and Economical Assessment of Net-Metering in Kenya
� Recently, through MoE, REA and KPLC, there has been a trend – in the face of growing
concerns about fuel costs – of hybridization of off-grid diesel-based power generation with
solar energy
Key challenges for the Kenyan PV market include a lack of technical capacity on the planning
and installation level to move beyond the traditional market segments, quality issues in terms of
products and services in the market, and a relatively weak (however improving) regulatory
framework with a view to both quality standards as well as incentives and regulations for private
sector investment in solar energy.
Specifically with regards to the regulatory framework, it is worth noting that the Government has
zero-rated import duty and removed Value Added Tax (VAT) on renewable energy, equipment
and accessories, including solar energy. Furthermore, a feed-in tariff for solar energy exists,
albeit at a relatively low level. Other than that, no specific incentives or regulatory instruments
tailored towards facilitating investment in solar energy are in place.
iii. Existing grid-connected PV plants
In the course of 2011, two lighthouse projects have been installed by private developers:
A. United Nations Environment Programme (UNEP) – 515 kW
UNEP’s rooftop solar plant (515 kWp) was designed to supply power mainly within the UN
compound in Nairobi. All the electricity produced by the system is absorbed by the large load of
the UN agencies. However, during weekends and on public holidays, there is a potential for
feeding excess electricity into the national grid.
Key facts:
- 515 kWp installed - Grid connection, but no feeding-in - Commercial procurement by UNEP
- Realized by: Energiebau
Solarstromsysteme GmbH - Components:
o Modules: Schott Solar, Kaneka o Inverters: SMA Solar Systems
Technical and Economical Assessment of Net-Metering in Kenya
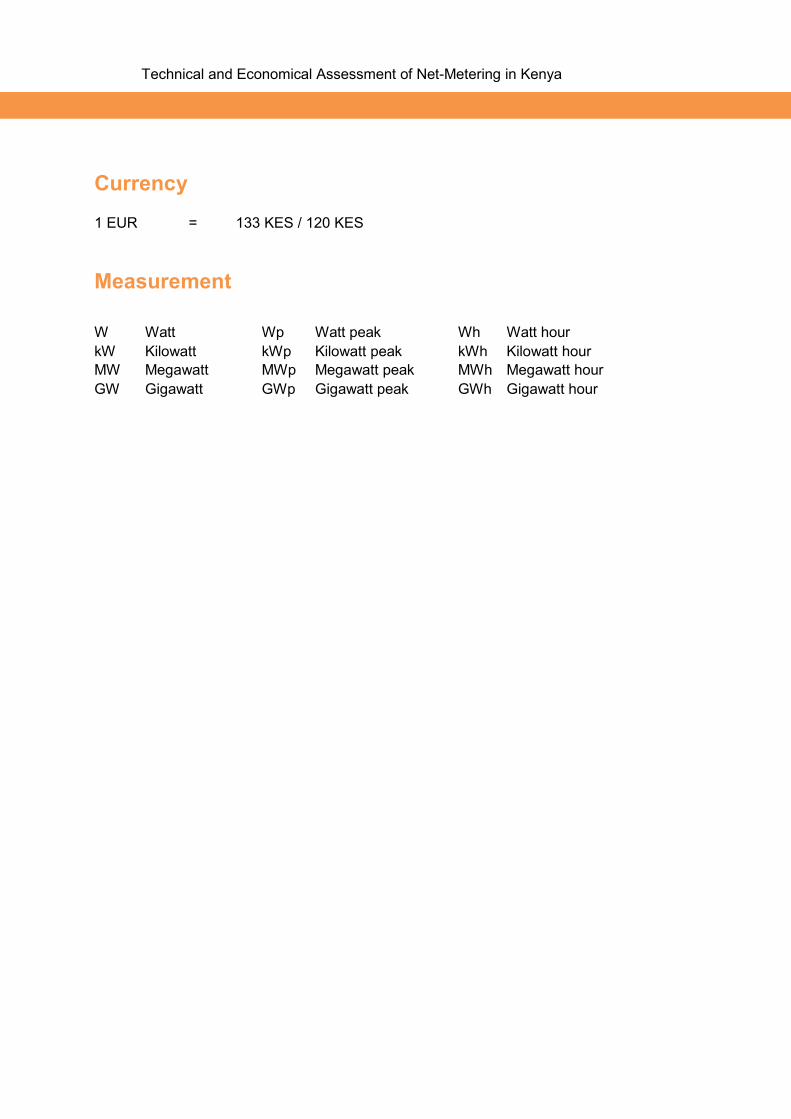
B. SOS Children’s Village Mombasa – 60 kWp
The investment at SOS Children’s village Nairobi aimed at both “Greening the SOS Children’s
Village” as well as at reducing the power bill. The project was designed from the onset in
anticipation of a net-metering or similar regime. The system produces a significant amount of
excess power during day time peak production.
Key facts:
- 60 kWp system - Grid connection, feeding-in at peak
production - Commercial procurement by SOS CV - Realized by: Asantys Systems GmbH,
African Solar Designs (ASD) Ltd. - Components:
o Modules: Centrosolar AG, o Inverters SMA Solar Systems
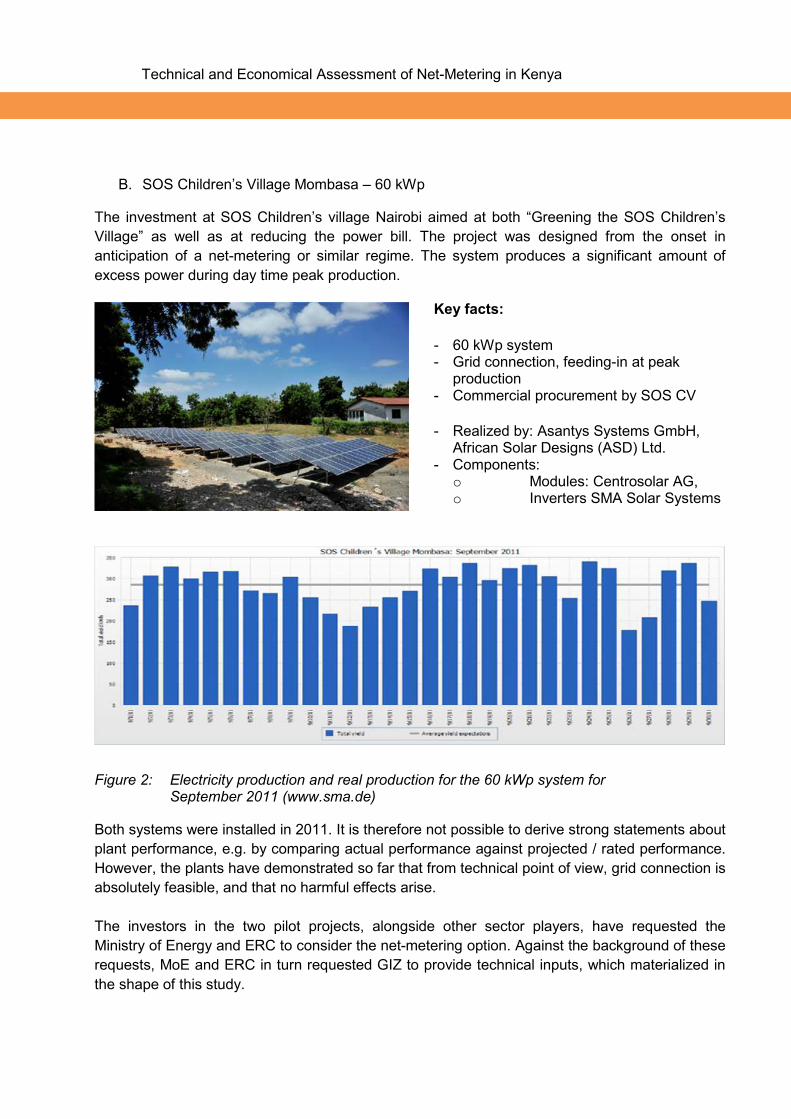
Figure 2: Electricity production and real production for the 60 kWp system for September 2011 (www.sma.de)
Both systems were installed in 2011. It is therefore not possible to derive strong statements about
plant performance, e.g. by comparing actual performance against projected / rated performance.
However, the plants have demonstrated so far that from technical point of view, grid connection is
absolutely feasible, and that no harmful effects arise.
The investors in the two pilot projects, alongside other sector players, have requested the
Ministry of Energy and ERC to consider the net-metering option. Against the background of these
requests, MoE and ERC in turn requested GIZ to provide technical inputs, which materialized in
the shape of this study.

Technical and Economical Assessment of Net-Metering in Kenya
iv. The Kenyan Electricity Market - relevant customer tariff categories
The tariffs for the electricity supply by Kenya Power and Lighting Company Limited (KPLC) are
set by the Energy Regulatory Commission (ERC). The current tariffs have been set in July 2008
and are still valid. Furthermore, ERC regulates taxes, third party levies and other cost items
which are charged by KPLC to the consumers. This also includes adjustment formulae which are
use to adapt the tariffs to fuel costs and other economic developments.
Under net-metering, the effective tariff for investors is the retail tariff rate, since power purchased
from the utility is substituted with self-generated electricity. Therefore, this sub-chapter analyses
the power tariff structure in Kenya and identifies relevant customer categories.
A. Identification of relevant customer categories
The general structure of the electricity tariff is shown in the following table B [18; p. 3 ff]
Tariff
Type of
Customer
Supply
Voltage (V)
Consumption
(kWh/month)
Fixed Charge
(KES/month)
Energy Charge
(KES/kWh)
Demand Charge
(KES/ kVA/ month)
DC Domestic
Consumers
240 or 415 0 – 50 120.00
2.00 -
51 – 1,500 8.10
Over 1,500 18.57
SC Small
Commercial
240 or 415 Up to 15,000 120.00
8.96 -
CI1 Commercial/
Industrial
415, 3 phase Over 15,000 800 5.75 600
CI2 11,000 2,500 4.73 400
CI3 33,000 /
40,000
2,900 4.49 200
CI4 66,000 4,200 4.25 170
CI5 132,000 11,000 4.10 170
IT Interruptible
off-peak
supplies
240 or 415 Up to 15,000 240 4.85 -
SL Street
Lighting
240 - 120.00 7.50 -
Table 2: Current tariff structure
The benefits of net metering are the avoided incremental energy costs which are related to the
consumption of units (kWh). Consequently, the fixed charge, households and small business
customers have to pay are not relevant to net metering or energy saving.

Technical and Economical Assessment of Net-Metering in Kenya
The higher the energy charge is, the more attractive is net-metering might be. Tariffs for
customers with a very small or a very high consumption (metered by the company at higher
voltage) are not relevant for net-metering due to lower energy charges.
For the DC tariff, low consumption of 0-50 units per month (2 KES/kWh) or 51-1500 per month
(8.1 KES/kWh will not lead to a competitive situation for PV applications. Similarly will the tariffs
CI2-5, due to the very low energy charges, not result in economic viability for PV for the
foreseeable future. Consequently, in the scenarios presented in chapter 6 this consumer group is
not considered.
Thus, the following groups are of particular interest, and in the following termed as “relevant” for
the purposes of this analysis:
• Domestic (DC) for >1500 kWh / month
• Small Commercial Consumers(SC) • Commercial and Industrial Consumers (CI) for supply voltage of 415 V (CI1)
Since the DC tariff group is structured in such a way that the level of consumption greatly impacts
on the actual energy charge payment, it has to be analyzed in greater details, using two
examples:
DC – customer X DC – customer Y
Electricity consumption per year in
kWh
26,000 100000
Electricity consumption per month in
kWh
2,142 8,334
PV-production for a 5 kWp plant per
year in kWh
6,855 6,855
Resulting demand customer in kWh 13,145 93,145
Avoided incremental cost (KES/kWh) 11,15 16,66
Table 3: Examples for impact of level of consumption on energy charge payment
Customer X could, for example, represent a household with air-conditioning. Customer Y would
be an extreme case, assuming a very high consumption for a large estate with security lighting,
air conditioning and many other electricity appliances. For the following calculations (see chapter
6) an average of 11.15 KES/kWh as the more conservative value was chosen.

Technical and Economical Assessment of Net-Metering in Kenya
B. Analysis of charges and levies
In addition to the tariffs set by ERC, all customers have to pay additional taxes and third party
levies:
Fuel Cost
Charge
The Fuel Cost Charge reflects the fuel costs for the thermal power plants. It is
calculated every month and charged to the customers as an add-on per
kWh.4 The Fuel Cost Charge is mainly dependent on following factors:
- Fraction of the electricity which is produced by thermal power plants.
This fraction is mostly dependent on the possibility to use the existing hydro power plants. During drought years there is less generation from hydro power (which has lower variable costs) and more generation from the more expensive thermal power plants and hence the fuel cost charge is higher.
- Efficiency factor of the thermal power plants in use. - Price for fuel for the thermal power plants, i.e. oil and gas price, at a
later stage – once coal fired power stations are operational – this will also include the coal price
Foreign
Exchange Rate
Fluctuation
Adjustment5
A number of factors influencing the cost of power generation are affected by
fluctuation in foreign exchange rates, for example loan repayments for some
electricity projects which have been financed and need to be paid back by
foreign currency. End-user electricity prices are therefore liable to an
adjustment factor for foreign exchange rate fluctuation, which reflects the
exchange rate of hard currencies against the Kenya Shilling.
Inflation
Adjustment
At the end of every six month period starting from 1st July, 2008, electricity
prices may be subject to an inflation adjustment.
Taxes and
Levies
Consumers have to pay other taxes, levies or duties including: - VAT at 12% charged to the fixed charge, the demand charge, the
forex adjustment and to the fuel cost charge. - Rural Electrification Programme (REP) levy at 5% of revenue from
Unit sales. - Energy Regulatory Commission (ERC) levy at 3 KES cents/kWh.
Table 4: Electricity tariff charges and levies
4The method is describe in detail in the Energy Act No.12 of 2006, page 5 ff

Technical and Economical Assessment of Net-Metering in Kenya
C. Actual end-user prices for relevant tariff groups
The following table 5 shows the relevant (as described above) tariffs and all applicable taxes and
levies:
Case 1 Case 2 Case 3
Domestic (DC) >
1500 kWh/month
Small
Commercial (SC)
Commercial and
Industrial
Customers (CI1)
KES/kWh KES/kWh KES/kWh
Basic consumption tariff 11,15 8,96 5,75
Fuel cost adjustment 5 7,30 7,30 7,30
Forex: Foreign exchange adjustments 1,23 1,23 1,23
Inflation adjustment 0,13 0,13 0,13
Total without ERC and REP 19,81 17,62 14,41
Total without ERC and REP incl. VAT 22,19 19,73 16,14
(ERC) levy 0,03 0,03 0,03
REP levy 0,56 0,45 0,29
Total 22,78 20,21 16,46
Table 5: Relevant tariff groups and actual end-user prices
For the fuel cost adjustment, this report assumes mean values over 6 months (April – September)
in 2011– below the values at the time of the compilation of this report, but higher than the
minimum observed after good hydrological conditions.
While it is the declared objective of the government to reduce the electricity costs, consultation
with stakeholders during the compilation of this report revealed that an actual decrease of costs
in current prices is not likely. The Least Cost Power Development Plant 2011-2031 states that
“comparing the future average energy generation cost (11.8USc/kWh in medium scenario) to
current average generation cost (9.3USc/kWh) shows that a 27% increase in the generation cost
should be anticipated. However the current generation cost is low due to the fact most of the
costs had been paid for by the government by the time the current generation tariff to KenGen
was determined, therefore the current average generation tariff doesn’t represent the actual cost
5 [23];current data see http://www.kplc.co.ke/index.php?id=104
Technical and Economical Assessment of Net-Metering in Kenya
of generation. The increase can also be attributed to the high reserve margin of 25% adopted by
the expansion plan, which should ensure an adequate quality of supply in the future years,
provided that the planned power plants are implemented in due time.”6 Should there be a delay in
power plant implementation, it is likely that the resulting shortfall will continue to be bridged by
relatively expensive thermal power generation.
We therefore believe that the assumptions of end-user electricity prices as well as the assumed
annual tariff increase presented below are realistic.
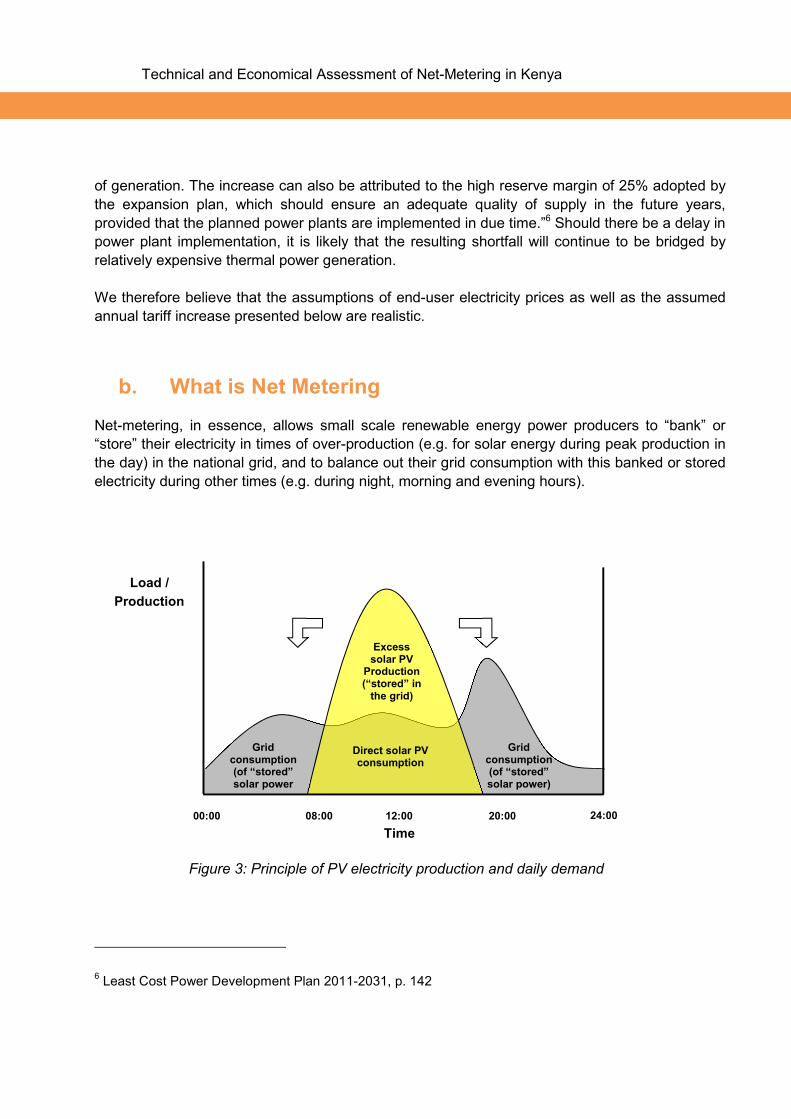
b. What is Net Metering
Net-metering, in essence, allows small scale renewable energy power producers to “bank” or
“store” their electricity in times of over-production (e.g. for solar energy during peak production in
the day) in the national grid, and to balance out their grid consumption with this banked or stored
electricity during other times (e.g. during night, morning and evening hours).
Figure 3: Principle of PV electricity production and daily demand
6 Least Cost Power Development Plan 2011-2031, p. 142
Excess solar PV Production (“stored” in the grid)
Grid consumption (of “stored” solar power
Grid consumption (of “stored” solar power)
Direct solar PV consumption
00:00 08:00 12:00 20:00 24:00
Time
Load /
Production

Technical and Economical Assessment of Net-Metering in Kenya
In theory, such a system is associated with a range of advantages:
� Generation of additional power in the
national grid, without the need for investment by the utilities or conventional IPP’s
� Promotion of small scale investments, value addition and market development
� No direct payment by the grid operator (as opposed to a FiT)
� Consumer savings on power bills
Of course there is also a number of open questions, e.g. with regards to
� Technical feasibility of grid connection and impact on grid stability � Revenue loss for the grid operator and potential compensation mechanisms � Other direct and indirect benefits for the grid operator
A simplified example for net-metering involves a single, 1960s-standard electro-mechanical
meter. Now imagine that a residential customer, Charles McSolar, added a rooftop
photovoltaic (PV) system (also known as a solar-electric system) to his home, on his side of
this meter. Charles wakes up early for his job; on most days, he is out of the house before
sunrise. In these dark morning hours, Charles makes his coffee and breakfast while watching
the morning news on TV. The electric meter spins forward as Charles is consuming electricity
from the grid.
Determined not to waste electricity, Charles shuts off all of his appliances as he heads off to
work. Charles’s solar panels now start churning out electricity as the sun rises—electricity
Charles sends back to the overstressed grid. His meter now spins in reverse. When Charles
returns at night to cook dinner and relax in front of the TV, the meter spins forward again as he
consumes more electricity than his system generates.
The result? Charles’s bill will show only his net consumption of electricity from the grid.
Whether it is a sunny month or a month in which Charles’s electricity use is low, any excess
electricity his system generates is rolled over to his next bill, just as he might rollover excess
cell phone minutes1

Technical and Economical Assessment of Net-Metering in Kenya
c. Net Metering or Feed-in-Tariffs
The success story of grid connected PV is largely based on Feed-in-Tariffs (FiT). More than 20
countries have opted towards that option. Net-metering is a different regulatory instrument, which
will open up a different market segment with different project types and regulatory requirements.
Even before FiTs were widely introduced, net-metering was actively practiced by PV installers in
many countries including Germany. Net-metering continues to be a driver of emergent PV
industries where Governments do not support consumer FiTs (i.e. in many US states). In the
following, both instruments are briefly characterized and pros and cons are presented.
Feed-in tariff FIT Net metering
Key
characteristics
(best practice)
Key elements:
- Fixed-price system, i.e. the producer tariff is specified in a legally binding document
- Tariff specified over a long timeframe, usually 15-20 years
- The tariff should be high enough to deliver return on investment typical to the national market – but not too high to devastate local resources, attract free riders, or impose unfair burdens on customers
- The tariffs (i.e. the difference costs, which are usually positive due to the higher renewable energy power generation costs) should not come from the national budget but come as a surcharge from all electricity consumers.
- Standardized and simplified procedure for investors to access the FiT
- Regular review of the FiT levels - May include annual legally fixed
decrease of the FIT-levels, depending on the technology learning curve
Optional / best practice elements:
- Fixed tariff contains an inflation factor (in case of countries with general inflation rates above 2% p.a.)
Key elements
- Flexible producer price, i.e. the electricity end-user tariff
- No actual payment of grid operator to the investor – investors collect their revenue through substituting power purchase from the utility with self-generated power
- No difference cost apply, thus no need to finance from end-users or taxpayers
- Commissioning procedure is very similar to that of a FiT-project (e.g. in terms of grid access / connection)
Strengths - Strong security of investment, both for project developers as well as for financiers
- Everyone can invest, including the utilities themselves
- Can be tailored and refined in order to channel investment into desired sub-sectors and project types
- Very easy to set-up and implement - Minimal administrative effort for the
utility - Can also tap the market segments
for power generation below the project sizes suitable to the FiT, and thereby leverage otherwise wasted natural / domestic resources
- No actual payments by the utility

Technical and Economical Assessment of Net-Metering in Kenya
and little risk of deceptive practices.
Weaknesses - Perception of FiT as a subsidy, even if it designed as a surcharge to all consumers
- Extra metering is required, which should be registered by remote sensing monthly (otherwise there must be monthly down-payments and annual control)
- Relatively complex regulatory instrument, requiring close management in order to effectively leverage investment while avoiding market distortions
- Not fair to all consumer classes -higher incentive and economic attractiveness for consumers with higher tariffs
- Does not provide very strong security of investment due to the (at least theoretical) possibility of fluctuating end-user tariffs
Table 6: Characteristics, strengths and weaknesses of net-metering versus Feed-in Tariffs FIT
d. Solar PV system price development
PV is the renewable technology with the most dynamic development in the last years. The mass
production of its key component – the module – is the driving force. The module costs are
causing up to 70% of the total system costs in large green-field installations, on roof-tops the
share differs depending from size and system design7.
It is strongly advised for any study to update costs of PV – and related prices – frequently. PV
prices have to be updated very recently as the costs are decreasing rapidly. 2011 is a year of
tremendous price decreases in the 2nd half.
The following figure shows that system prices in Germany have halved over the last 5 years. The
German market accounts for approx. 40% of the world´s grid-connected market. Moreover,
Germany is a well established competitive market with well established legal boundary conditions
and a dense network of craftsmen, installers, wholesalers and manufacturers. Therefore, prices
for grid connected plan are lower than in most other PV markets in the world.
7Historically, PV prices in Kenya have been much higher than European prices because they are “off-grid”
and include battery storage. The prices shown above are for grid-connected PV systems and do not include battery storage at all. It is important to note that PV prices have been dropping dramatically, while battery prices have remained stable.
Technical and Economical Assessment of Net-Metering in Kenya
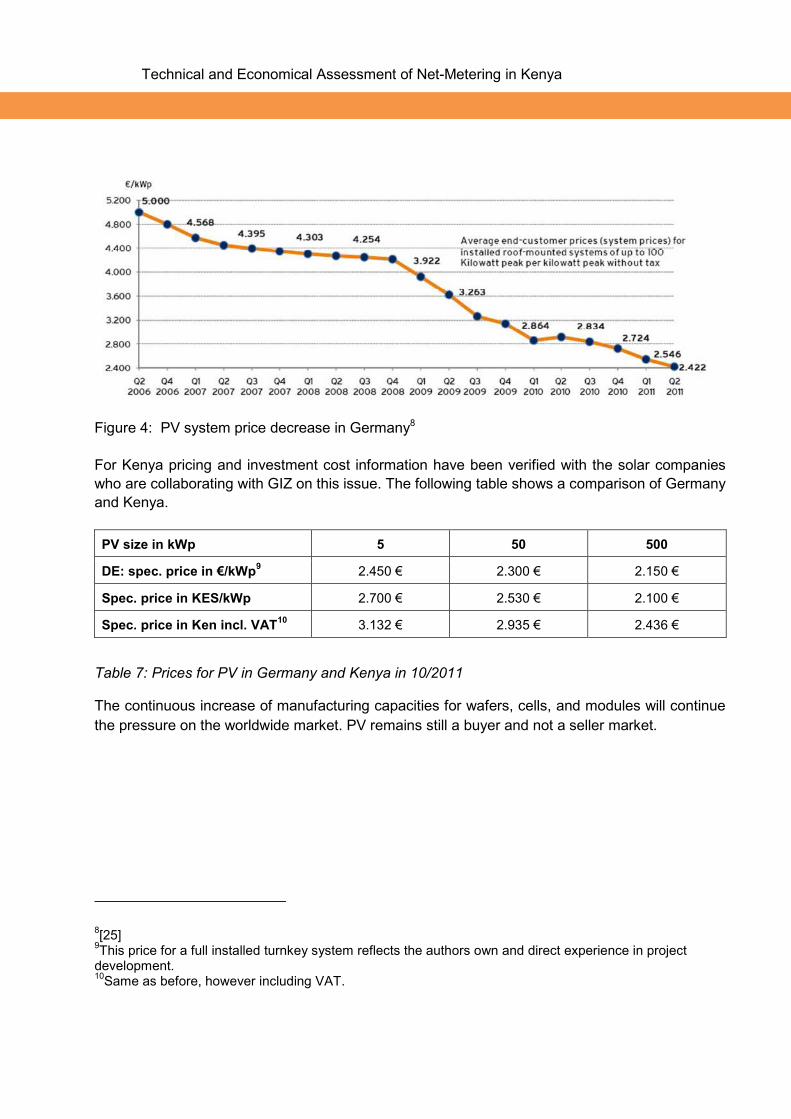
Figure 4: PV system price decrease in Germany8
For Kenya pricing and investment cost information have been verified with the solar companies
who are collaborating with GIZ on this issue. The following table shows a comparison of Germany
and Kenya.
PV size in kWp 5 50 500
DE: spec. price in €/kWp9 2.450 € 2.300 € 2.150 €
Spec. price in KES/kWp 2.700 € 2.530 € 2.100 €
Spec. price in Ken incl. VAT10 3.132 € 2.935 € 2.436 €
Table 7: Prices for PV in Germany and Kenya in 10/2011
The continuous increase of manufacturing capacities for wafers, cells, and modules will continue
the pressure on the worldwide market. PV remains still a buyer and not a seller market.
8[25]
9This price for a full installed turnkey system reflects the authors own and direct experience in project
development. 10
Same as before, however including VAT.

Technical and Economical Assessment of Net-Metering in Kenya
Figure 5: Learning Curve for PV and future cost development projection11
Note that the 2011-2012Q2 price developments are NOT learning curve effects but a market adjustment due to the recent burst of the EU FIT bubble. Knowing this (and the actual production costs of PV manufacturers) helps to pick the right time to start net metering in Kenya!12
However, as a project developer with 12 operational solar parks in Germany, the author denies
the argument often used to “wait until a certain cost threshold of cost is achieved”. A lesson
learned is that long-term learning curves do not reflect local prices at any time. The author
decides any investment based on current prices and market conditions.
11
Roland Berger: Adolescence of an Industry (INSERT PROPER SOURCE) 12
[24]

Technical and Economical Assessment of Net-Metering in Kenya
2. Economic evaluation
The Kenyan Government is focused on increasing energy access to larger segments of the
population. Because of relatively low incomes, increased access requires that all introduced
energy systems are economically viable and do not add a burden to electricity ratepayers, who
already are forced to pay high prices for electricity. As such, new technology investments,
including solar, must in the long term reduce the burden on the rate payer. Thus cost is the major
issue in introduction of electricity generation technologies.
This chapter analyses the economic viability of net metered PV systems for three categories of
electricity consumers and in two different solar regimes (Nairobi and Kisumu). It examines
investment in PV systems from the consumer perspective --- identifying lifetime cost issues that
are important to commercial and individual consumers. The chapter also examines the
implications of wide-spread net metering on KPLC, and whether net-metering would impact on
KPLC financial performance. It also explores potential fee structures that KPLC might use to
cover the extra costs incurred by a net metering program.
In summary, the analysis finds that, with current trends, net metering will be economically
attractive by 2014, especially in sunnier parts of the country. (The recent fluctuations in the
Kenya shilling against the Euro could make net metering profitable even sooner). The analysis
also finds that, with the foreseeable PV market of up to 100 MWp, the cash flow implications for
KPLC are not significant, and that there are likely to be overall economic benefits, including
carbon trading and reduction of fuel use by generators, which could lead to financial gains by the
company.
a. Introduction
PV power plants are in essence front-loaded investments with no fuel cost and therefore
insignificant O&M costs. To determine the advisability of a scale PV plant in Kenya, discounted
cash flows have to be calculated and analyzed. For the (relatively straightforward but somewhat
extensive) PV cash flow modelling (as done regularly for all types of project finance), three
essential elements have to be determined: (i) discount factor, (ii) cost and (iii) benefits.
For task i and ii above, the team’s experience is combined with several standard methods and
software. To achieve realistic modelling, the key is to choose parameters that fit the Kenyan case
well.
For task iii – the determination of PV benefits – a multitude of publications exists which provide
murky calculations and questionable quantifications. We have therefore chosen a different route,
mirroring largely the calculation performed regularly by the dispatcher, in order to determine the
operational benefits of PV. Therefore, the levelised costs of electricity (LCOE) of solar PV are

Technical and Economical Assessment of Net-Metering in Kenya
compared to the most expensive power plants in Kenya according to KPLC´s merit-order
ranking.
The formula below ilustrates how to calculate the LCOE:
I0 initial Investment
At total annual costs in the year t
i real interest rate in %
Mel electricity produced in the year t
n years of lifetime
t current year
In many reports the Annuity Method and the Net Present Value (NPV) are used for economic
evaluation. In case of feasibility studies for a single project cash-flow profiles are used, i.e. the
Internal Rate of Return IRR either expressed as Equity Internal Rate of Return (EIRR) or as
Project Internal Rate of Return (PIRR).
In addition, the Cost Benefit Ratio over the project lifetime can be used to assess the profitability
of an investment. It is expressed as
Levelised revenues of the PV plant during the life time of the PV plant
(The annuity cost of the PV investment + the levelised annual costs over the lifetime)
Any calculation should consider possible failures in the parameter settings. Consequently a
sensitivity analysis spotlights the relevant and the less important parameters –or in other words it
advises the author to focus on the most important input parameters.
The following figure shows the impact of a deviation of one – and each simulation only one - input
parameter and the resulting deviation of the outcome, here the specific cost (in Euro/kWh) of a
PV plant.
One example: a decrease of the yield (yellow line by 20% would result into a cost increase from
0.33(as reference case) to 0.42 €/kWh. This sensitivity analysis is carried out for the input initial
investment, lifetime, yield, O&M cost and weighted average cost of capital. The stronger the
deviation is the stronger is the influence of this parameter.
For PV the case is clear: Assessment of the electricity yield is the determining factor for the
profitability, with the assumed investment costs as second.

Technical and Economical Assessment of Net-Metering in Kenya
Figure 6: Sensitivity analysis of a small grid-connected PV plant
Initial investment price/cost
Lifetime
Yield
O&M costs (operation & maintenance)
Weighted Average Cost of Capital
b. Reference case and input data
For net-metering, the anticipated project types in a developed net-metering market will not
comprise one or few large scale PV plants but thousands of dispersed plants, varying in scale,
site, efficiency and technology. Therefore, we choose a reference case for each appropriate tariff
group with various parameters (see the following table C and G)
i. Reference case assumptions
The reference cases represent the most relevant electricity consumer groups and corresponding
PV sizes. The table C (see chapter 4.1) describes them in detail, and breaks down the electricity
costs as per regulation & KPLC billing method:

Technical and Economical Assessment of Net-Metering in Kenya
Case 1 Case 2 Case 3
Domestic (DC) >
1500 kWh/month
Small
Commercial (SC)
Commercial and
Industrial
Customers (CI1)
KES/kWh KES/kWh KES/kWh
Basic consumption tariff 11,15 8,96 5,75
Fuel cost adjustment 7,30 7,30 7,30
Forex: Foreign exchange adjustments 1,23 1,23 1,23
Inflation adjustment 0,13 0,13 0,13
Total without ERC and REP 19,81 17,62 14,41
Total without ERC and REP incl. VAT 22,19 19,73 16,14
(ERC) levy 0,03 0,03 0,03
REP levy 0,56 0,45 0,29
Total 22,78 20,21 16,46
Table 8: Definition of the most relevant consumer cases for net metering,
ii. PV generation cost assumptions
The costs for PV electricity generation depend on two categories of parameters: the technical
assumptions, and the economic / financing assumptions:
- Technical assumptions
Under net-metering, PV system size – and corresponding solar electricity generation - cannot be
larger than the annual electricity consumption in each tariff class (as explained in chapter 4.3).
Otherwise net payments at the annual bill from the customer / PV investor to KPLC would occur,
or power would be fed into the grid without compensation. .
Thus, we are calculating here three examples representing the three aforementioned, relevant
customer categories: 5 kW for domestic > 1500 kWh / month, 50 kW for SC, 250 kW for CI1. The
size of the PV systems reflects the expected area available on the roofs and the equity required.

Technical and Economical Assessment of Net-Metering in Kenya
PV system parameters PV-system size
Case 1 Case 2 Case 3
Domestic (DC) >
1500 kWh/month
Small
Commercial (SC)
Commercial and
Industrial
Customers (CI1)
PV size in kWp 5 50 250
Delivered kWh/kW and year 1371 1389 1389
resp. capacity factor 15,7% 15,9% 15,9%
Specific Investment costs in Euro/kW 2698 2526 2100
Maintenance costs (% of investment) 2% 2% 2%
Expected cost reduction rate for PV
2011-2020 per year
10% / 15 %
Table 9: PV input data and possible variations
We recommend allowance of monthly carryovers of excess electricity at the utility’s full retail rate,
this requires a change in billing an administration structures (for more details see chapter 2).
Of the three solar radiation examples presented in chapter 4.1.1, Nairobi represents a site with
lower yields than many parts of Kenya - if net metering is profitable in Nairobi it is likely to be
profitable in most other locations! For Kisumu the values would be 1750 kWh/kW year delivered
for a 5 kWp plant resp.1774 kWh/kW year delivered for 50 / 250 kWp plant. This variation is due
to the fact that the capacity factor –reflecting electricity delivered – differs. Small PV systems
(<20 kW) have a lower overall efficiency. Therefore, the performance ratio (PR) of the system
larger 50kWp will be at least 1% better.
Costs for PV are related to Kenya with high-end components in particular for the modules and
inverters. Lower quality modules are 10-15 % less expensive. However, unbranded products
have less track record in fulfilling warranty commitments or in maintaining long-term output. From
a project developer’s point of view with a project horizon – also under net-metering – of 20 years,
quality and warranty reliability for products and services is crucial. Therefore all information given
is related to quality components. Currently PV is exempted from VAT (16%). We refer to – and
recommend maintaining - the current situation.
For operation and maintenance of PV systems we assume about 2% of investment as annual
operation cost in Kenya, which is slightly higher than in the EU due to higher insurance costs.
As explained in chapter 4.4 the rate of cost reduction for PV 2011-2020 is expected to be
between 10-15% annually.

Technical and Economical Assessment of Net-Metering in Kenya
- Economic / financial assumptions
The following assumptions were identified based on literature13 and stakeholder consultation:
Economic parameter Possible Scenarios
Average life time PV-system 20 years
interest rate equity for EIRR 10% 15%
equity share 50%
interest rate debt 10%
debt share 50%
levelised interest rate for PIRR 10,0%
inflation rate maintenance cost 5%
Assumed annual power tariff increase 5%
Exchange rate (KES / EUR) 133 120
Table 10: Economic input data and possible variations
The parameters outlined above require further elaboration:
- The interest rate on equity for EIRR is equivalent to PIRR for private consumers for the
cases 2 and 3. For small systems, the private investor will compare the current costs of his electricity bill with the PV annuity costs. He will not take any future tariff increase into his consideration. Assuming a positive result for PV, he will invest if he has the money (“willingness-to-pay”).The commercial investor (class CI1) of a 250 kWp PV plant acts in a different way: he will decide between various investment options (e.g. solar plant or government bonds) and will decide according to the best EIRR. We assume his EIRR expectation will be 5% higher than the IRR for debt capital (Case 4b). Consequently, the PIRR increases from 10 to 12.5%.
- For the equity/ debt share, we have chosen a conservative value of 50% / 50%for project
financing, meaning that the project – here the PV investment – is the only guarantee.
- The interest rate for debt are below the local market rates and assume that debt financing
will have a foreign component, either through project development partnerships or through involvement of GoK or development partners with a view to promoting renewable energy.
- The inflation rate for maintenance costs is based on literature14.
13
[21][22]

Technical and Economical Assessment of Net-Metering in Kenya
- Power tariff escalation rate: according to the LCPDP 2011-203115, current average costs
on the Kenyan national grid are 9.3USc/kWh (p.142). Depending on the scenario a cost
increase up to min 11.8 and max 15.6USc/kWh (p.141) in 2031 is anticipated. These
values are expressed in 2011 prices with the assumption of 90$/bbl oil. This is a price
increase of 27% or 68% respectively over a 20 year period. These increased costs will
need to be reflected in the end-user prices, which will essentially lead to an increase of
the basic tariffs. However, this is the optimal scenario assuming that all projects are
realized as scheduled in the LCPDP. Should any delays materialize, or the oil price
increase further than assumed, the real increase might be even higher. Assuming that the
values above would materialize at a level of approx. 50% price increase over 20 years,
this would be equivalent to an annual increase of 2%.
In addition, inflation has to be considered. Inflation influences upcoming power projects,
both in construction as well as in operating costs. The higher the share of generation
capacity with high operating costs will be, the higher the influence of inflation. It is
important to note that renewable energy projects, including solar, with their very low
operating costs, are less affected by inflation. For the above prices, considering historic
values for US$ inflation rate, it is therefore realistic to assume a 3% annual inflation rate.
On this basis, the assumed annual power tariff increase is assumed here at 5% p.a.
- PV components (modules, inverter) are imported and have to be paid in US$ or €.
Therefore the exchange is of outstanding importance to the economic evaluation. At the date of editing this report the exchange rate is at a critical level: 133 KES/€. While it is difficult to forecast the development, we are using one alternative scenario of 120 KES/€16. Any further improvement would improve PV competitiveness accordingly.
The following table summarizes all the values identified above, with 96 possible variations.
Variable Value 1 Value 2 Value 3
3 Tariff cases and PV sizes DC > 1500, 5 kWp SC, 50 kWp CI1, 250 kWp
Equity Interest rate EIRR 10% 10% 10% or 15%
Exchange rate 132 KES/€ 120 KES/€
Site (PV production): Nairobi / Kisumu 1371 or 1750 1389 or 1774 1389 or 1774
Expected degression of PV costs 10% 15%
Expected increase of tariffs 5%
14
[21] 15
[26] 16
Economist Intelligence Unit

Technical and Economical Assessment of Net-Metering in Kenya
Table 11: Possible scenarios and input data variations
In the following chapters 6.3 and 6.4 we will present results of the most relevant scenarios.
Prepaid Metering: Prepaid meters are mainly used in the DC class for low consumption (<
1500 kWh/unit). The few meters, which might be also used by those DC consumers able to
invest in PV, the metering must be exchanged to more advanced electronic ones. The
estimated cost for the new meters should be below 3% of the total PV investment
c. Consumer perspective: economic viability of PV power generation
A consumer willing to invest in PV will make his calculation based on the annuity cost of the PV
investment plus the levelised annual costs over the lifetime. In our calculations the PV lifetime is
limited to 20 years even though practical experiences in Germany show duration up to 30 years
are possible. However, the existing FIT (for hydro and biomass) in Kenya – as well the FIT in
Germany for PV - is given for 20 years only. From the consumer / investor perspective, a longer
lifetime is thus an add-on to the profit (as the annuity factor for 30 instead of 20 years is 9.5%
lower). In a first step he compares the current tariff with this annuity cost.
i. Investment today
Due to the aforementioned parameters (in particular the financing costs for equity and debt, as
well as the exchange rate) grid-connected PV under net-metering is not cheaper for the
consumer than the average tariff level throughout 2011.
It is important to note that this statement does not consider any component of diesel power
generation at the end-user level that could be substituted by solar PV, e.g. a diesel-based backup
system. Many users may want to consider a solar-battery system as their primary backup. Such
systems could be designed to supply both backup power, as well as substitute grid power under
net-metering. However, this implies modifications to the plant design, which will have a price
implication. While this may be a very interesting perspective for many investors, it has not been
considered here due to the additional variables.
The investment into PV for the systems assumed here is calculated on the basis of annuity costs.
The consumer electricity bill (see table. C in chapter 4.1.4) includes basic consumption tariff +
fuel costs + forex adjustments + inflation adjustment + ERC and REP levy and VAT. The
parameters set out above for solar PV electricity costs as well as for the grid prices are
summarized in the following table:

Technical and Economical Assessment of Net-Metering in Kenya
PV in KES/kWh
Nairobi / (Kisumu), LCOE
Corresponding tariff
class / electricity tariff,
KES / KWh 1 EUR = 133 KES 1 EUR = 120 KES
DC, 5 kWp 38.6 (30.2) 34.8 (27.3) 22,78
SC, 50 kWp 35.6 (27.9) 32.1 (25.2) 20,21
CI1, 250 kWp 33.6 (26.3) 30.3 (23.7) 16,46
Table 12: Current costs for PV Left side for Nairobi radiation conditions (Kisumu) versus average of recent electricity tariff (10/2011)
However, the picture changes completely once future increases in tariffs are taken into
consideration, i.e. if PV-annuity costs are compared with future tariffs. PV power plants are in
essence front-loaded investments with no fuel cost and therefore almost insignificant O&M costs.
Under net-metering, where the “income” is generated through the substitution of power
consumption from the grid with own generation in a net-metered PV plant, the assumed increase
of the electricity tariff determines the year of break-even.
In terms of today’s monetary values, an annual tariff increase can be expected (dotted lines in the
following figures 12 a,b), assumed here as outlined above at 5% p.a.
The following figures12a,b show the thee cases identified previously. The investment into PV
(Solid lines: on the basis of LCOE for PV) compared with the current tariff (dotted lines) are
shown.
Figure 7: Comparison of PV cost with increasing tariffs for Nairobi
Exchange rate 133 KES / EUR Exchange rate 120 KES / EUR
Technical and Economical Assessment of Net-Metering in Kenya
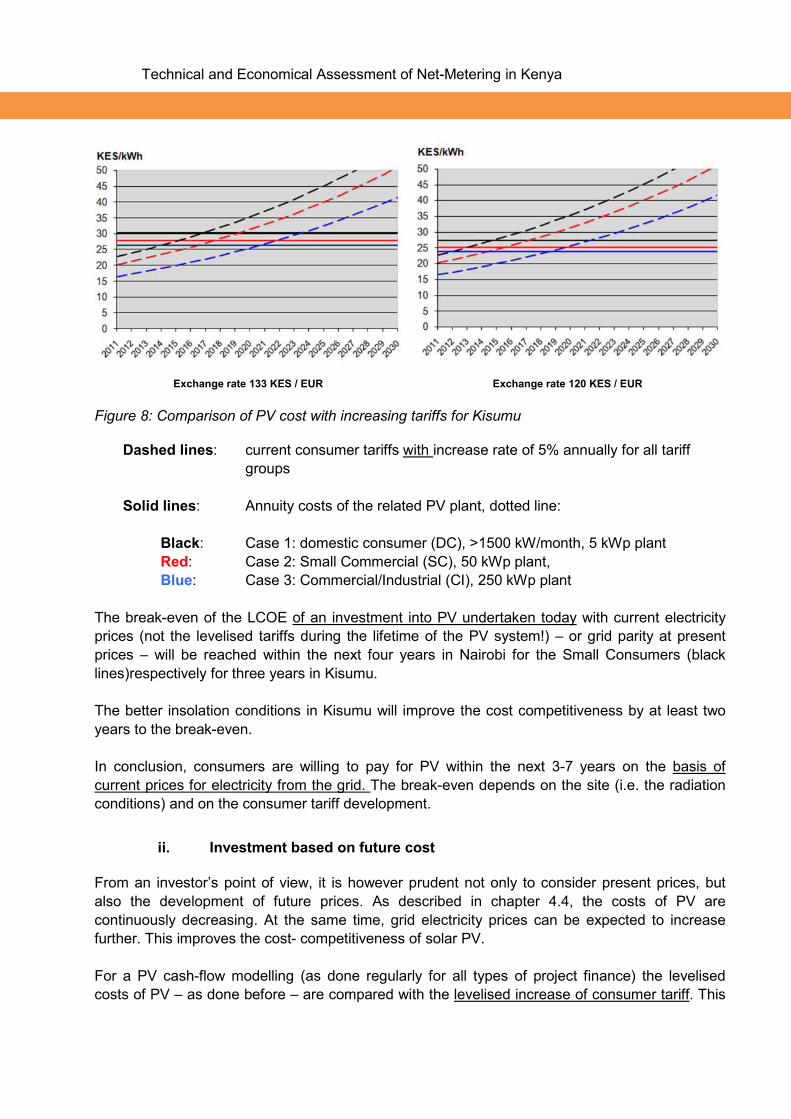
Figure 8: Comparison of PV cost with increasing tariffs for Kisumu
Dashed lines: current consumer tariffs with increase rate of 5% annually for all tariff
groups
Solid lines: Annuity costs of the related PV plant, dotted line:
Black: Case 1: domestic consumer (DC), >1500 kW/month, 5 kWp plant
Red: Case 2: Small Commercial (SC), 50 kWp plant,
Blue: Case 3: Commercial/Industrial (CI), 250 kWp plant
The break-even of the LCOE of an investment into PV undertaken today with current electricity
prices (not the levelised tariffs during the lifetime of the PV system!) – or grid parity at present
prices – will be reached within the next four years in Nairobi for the Small Consumers (black
lines)respectively for three years in Kisumu.
The better insolation conditions in Kisumu will improve the cost competitiveness by at least two
years to the break-even.
In conclusion, consumers are willing to pay for PV within the next 3-7 years on the basis of
current prices for electricity from the grid. The break-even depends on the site (i.e. the radiation
conditions) and on the consumer tariff development.
ii. Investment based on future cost
From an investor’s point of view, it is however prudent not only to consider present prices, but
also the development of future prices. As described in chapter 4.4, the costs of PV are
continuously decreasing. At the same time, grid electricity prices can be expected to increase
further. This improves the cost- competitiveness of solar PV.
For a PV cash-flow modelling (as done regularly for all types of project finance) the levelised
costs of PV – as done before – are compared with the levelised increase of consumer tariff. This
Exchange rate 133 KES / EUR Exchange rate 120 KES / EUR

Technical and Economical Assessment of Net-Metering in Kenya
method of calculation expresses all future cost components, and allows to compare the future
cost of energy from solar PV (including technology as well as financing costs, i.e. already
including returns on investment) with future costs grid electricity.
For solar PV electricity generation, the levelised costs thus include all the parameters listed in
6.1.2, projected over a lifetime of 20 years. For the grid electricity cost, they show the estimated
cost of grid power with an annual escalation of 5%. As explained previously, the 5 % are an
approximated value accounting for both inflation as well as increased cost of power generation as
per LCPDP 2011-2031. Should the cost of grid electricity increase further than this value, the
conditions for PV through net-metering are more favourable, and break-even is achieved earlier!
Where the graphs for PV costs intersect with the graphs for grid cost / avoided cost electricity
demand, the investment in PV under net-metering is commercially viable for the respective
customer groups. The graphs thus show clearly when commercial break-even – including all
relevant costs i.e. including as well the profit margin of investors expressed in the discount rate
on equity – is reached.

Technical and Economical Assessment of Net-Metering in Kenya
133 KES / EUR 120 KES / EUR
Nairobi,
DC > 1500
kWh /
month,
5 kWp
- Viable without net-metering-fee in 2012 - Viable with net-metering-fee in 2013
- Viable without net-metering-fee in 2011 - Viable with net-metering-fee in 2012
Nairobi,
SC > 3000
kWh /
month,
50 kWp
- Viable without net-metering-fee in 2012 - Viable with net-metering-fee in 2013
- Viable without net-metering-fee in 2011 - Viable with net-metering-fee in 2012
Nairobi,
CI1,
250 kWp
- Viable without net-metering-fee in 2012 - Viable without net-metering-fee, but with
higher EIRR in 2013 - Viable with higher EIRR and net-metering-
fee in 2014
- Viable without net-metering-fee in 2011 - Viable without net-metering-fee, but with
higher EIRR in 2012
- Viable with higher EIRR and net-metering-fee in 2013

Technical and Economical Assessment of Net-Metering in Kenya
133 KES / EUR 120 KES / EUR
Kisumu,
DC > 1500
kWh /
month,
5 kWp
- Viable ex-/including net-metering fee now - Viable ex-/including net-metering fee now
Kisumu,
SC > 3000
kWh /
month,
50 kWp
- Viable (without net-metering-fee) now - Viable with net-metering-fee in 2012
- Viable ex-/including net-metering fee now
Kisumu,
CI1,
250 kWp
- Viable without net-metering-fee now - Viable without net-metering-fee, but with
higher EIRR in 2011 - Viable with higher EIRR and net-metering-
fee in 2012
- Viable without net-metering-fee in now - Viable without net-metering-fee, but with
higher EIRR now
- Viable with higher EIRR and net-metering-fee in 2012
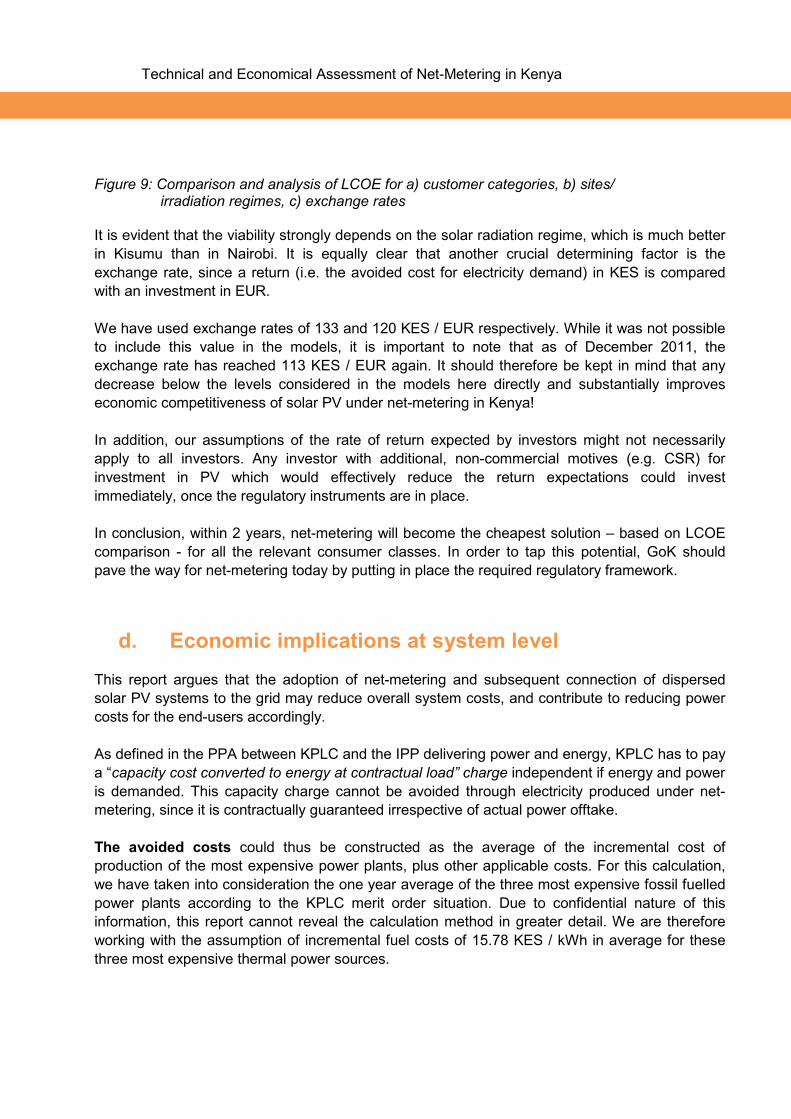
Technical and Economical Assessment of Net-Metering in Kenya
Figure 9: Comparison and analysis of LCOE for a) customer categories, b) sites/ irradiation regimes, c) exchange rates
It is evident that the viability strongly depends on the solar radiation regime, which is much better
in Kisumu than in Nairobi. It is equally clear that another crucial determining factor is the
exchange rate, since a return (i.e. the avoided cost for electricity demand) in KES is compared
with an investment in EUR.
We have used exchange rates of 133 and 120 KES / EUR respectively. While it was not possible
to include this value in the models, it is important to note that as of December 2011, the
exchange rate has reached 113 KES / EUR again. It should therefore be kept in mind that any
decrease below the levels considered in the models here directly and substantially improves
economic competitiveness of solar PV under net-metering in Kenya!
In addition, our assumptions of the rate of return expected by investors might not necessarily
apply to all investors. Any investor with additional, non-commercial motives (e.g. CSR) for
investment in PV which would effectively reduce the return expectations could invest
immediately, once the regulatory instruments are in place.
In conclusion, within 2 years, net-metering will become the cheapest solution – based on LCOE
comparison - for all the relevant consumer classes. In order to tap this potential, GoK should
pave the way for net-metering today by putting in place the required regulatory framework.
d. Economic implications at system level
This report argues that the adoption of net-metering and subsequent connection of dispersed
solar PV systems to the grid may reduce overall system costs, and contribute to reducing power
costs for the end-users accordingly.
As defined in the PPA between KPLC and the IPP delivering power and energy, KPLC has to pay
a “capacity cost converted to energy at contractual load” charge independent if energy and power
is demanded. This capacity charge cannot be avoided through electricity produced under net-
metering, since it is contractually guaranteed irrespective of actual power offtake.
The avoided costs could thus be constructed as the average of the incremental cost of
production of the most expensive power plants, plus other applicable costs. For this calculation,
we have taken into consideration the one year average of the three most expensive fossil fuelled
power plants according to the KPLC merit order situation. Due to confidential nature of this
information, this report cannot reveal the calculation method in greater detail. We are therefore
working with the assumption of incremental fuel costs of 15.78 KES / kWh in average for these
three most expensive thermal power sources.

Technical and Economical Assessment of Net-Metering in Kenya
In addition, 1.12 kWh must be produced to deliver one kWh to a customer as losses on the LV
level and the HV level must be considered17. Furthermore, other incremental costs incurred by
KPLC apply. On this basis the total avoided KPLC costs can be calculated to 18.73 KES/kWh.
Under net-metering, this power is generated by the investors / consumers themselves, and it thus
does not have to be purchased by Kenya Power – these costs are avoided.
Incremental Fuel costs 15,78
Incremental KPLC costs 0,68
avoided technical grid losses (LV & HV) 12%
Total avoided cost without taxes 18,73
Table 13: Profit or losses by net-metering at system level
The following table shows an example calculation of the annual avoided cost at system level, if
the three most expensive plants in the power mix could be substituted with the load freed up by
net-metering. We have based this example calculation on a total market penetration of 100 MWp
installed capacity under net-metering, with most of the investment in the SC group.
Total Installation of MWp = 100 Case 2
DC> 1500
Case 3
SC
Case 4
CI1
Total
Share of consumer in each class
investing into PV
1.0% 3.0% 2.0%
Share of total investment from different
customer-classes18
4.3% 89.7% 6.0%
Installed PV-capacity MWp 4.3 89.7 6.0 100
Electricity production in kWh/kWp *a 1,389 1,389 1,389 4,168
Electricity production in MWh/a 5,989 124,672 8,267 138,928
Avoided fuel costs in KES 94,506,420 1,967,324,160 130,453,260 2,192,283,840
Avoided total costs at system level in
KES
112,164,968 2,334,968,971 154,836,503 2,601,970.442
Table 14: Avoided cost at system level in a mature PV market under net-metering
17
See [15] table 14 at p. 41 18
This is proportional to share of the respective customer category of the total electricity consumption

Technical and Economical Assessment of Net-Metering in Kenya
Note that the avoided fuel costs would directly translate into a cost reduction for the end-users
through a reduced fuel cost charge.
The future development of this result is mainly dependent on
• The price-development of fuel for the power plant. If the prices will go up, the benefits of the PV-Plants will rise accordingly;
• The fraction of electricity produced by fossil fuels. If the fraction is rising, the installation of PV-plants will be more beneficial
It is important to consider that this calculation does not consider any potential other direct or
indirect benefits from dispersed production of solar PV in the Kenyan grid, e.g. through improved
grid stability (as a result of modern inverter application), reduced system losses, or other
aggregate benefits. It also does not consider potential carbon credit revenues.
e. Optional compensation through “net-metering-fee” – a theoretical model
As any utility, Kenya Power (KPLC) will evaluate the perspective of net-metering based on the
implications for its business. When consumers are investing into solar PV to substitute their grid
power consumption through net-metering, thereby reducing their own power bill payable to KPLC,
KPLC is losing turnover. The investment into new PV-plants will reduce the purchase of electricity
of KPLC from KenGen or IPPs. The power fed-into the grid from the solar PV plants under net-
metering, however, can obviously be sold to other customers – or, in other words, the power not
consumed by the investor in PV can be sold elsewhere. Under the assumption that the power
made available through net-metering could be sold elsewhere, Kenya Power would not suffer
losses.
Nevertheless, this assumption might not materialize. Furthermore, it could be argued from the
perspective of Kenya Power that the additional administration costs for registration and billing of
the net metering PV systems need to be considered. Following this logic, Kenya Power could
make a position towards introducing a “net-metering” fee to compensate for this loss.
To assess net-metering fee, we are working with an average KPLC yield of 6.12 KES/kWh (figure
provided by KPLC). From this value, system losses and incremental cost of KPLC (see table 15)
have to be deducted. If the remainder would be covered through a “net-metering fee”, KPLC’s
overall position would not only be neutral, but rather positive since incremental costs plus the
profit margin would be covered. On the basis of the data available, i.e. yield of 6.12 KES – 0.68
KES incremental KPLC costs – 12% system losses, such a “net-metering fee” could be
determined at about 3.5 KES/kWh. For ease of calculation and implementation, this figure is
independent from the consumer classes, and would be claimed by KPLC.

Technical and Economical Assessment of Net-Metering in Kenya
To keep all administrative actions as low as possible a separate metering system for the PV plant
should not be required. With plant commissioning KPLC could calculate in the following way the
expected yield of the PV plant – and the net-metering-fee. This table should be extended to max
4 different insolation regions – here given for Nairobi as the worst and Kisumu as the best case.
Site Nairobi
PV size in kWp 5 50 250
delivered kWh/kWp *year 1,371 1,389.28 1,389.28
total kWh PV delivered 6,855 69,464 347,320
KPLC in KES/kWh 3.5 3.5 3.5
Annual "Net Metering" fee to KPLC in KES 23,992.5 243,124,0 1,215,620,0
Site Kisumu
PV size in kWp 5 50 250
delivered kWh/kWp *year 1,750 1,774 1,797
total kWh PV delivered 8,751 88,679 449,230
KPLC in KES/kWh 3.5 3.5 3.5
Annual "Net Metering" fee to KPLC in KES 30,629.3 310,377.3 1,572,306.1
Table 15: Example how to calculate the surcharge / additional fee on the annual consumer bill
If this net-metering-fee should be allowed to KPLC, we recommend to ERC to design it as a
single down-payment put on the annual consumers bill.
For consideration of the implications of this additional fee on the consumer’s investment decision,
please compare the graphs in chapter 6.3. We have added this net-metering-fee on the current
tariff of the customer CI1. It is evident that the break-even is only shifted by a few months – this
would not influence the consumers decision pros/cons PV considerably. However, it is important
to consider that any such fee would effectively amount to a disincentive from the perspective of
investors. It should therefore be considered carefully, whether the introduction of this construct is
actually necessary and adding value.
Furthermore, as an additional option to play a more direct role in the net-metering market, KPLC
could act as a facilitator between the consumers / PV investors and financing institutions with
regards to financing the PV systems. Under this approach, PV investors could pay back the PV
systems through their power bill. A similar approach is being implemented by the utility in Tunisia
for financing of solar water heaters. This would not only greatly reduce transaction costs and thus
expedite PV market development under net-metering; it would also ease bundling of and
monitoring of the individual PV installations and thus pave the way for tapping carbon revenues.

Technical and Economical Assessment of Net-Metering in Kenya
f. Other economic implications
- Lost revenue through statutory levies
Other economic implications refer to the statutory levies of GoK on the power bill, notably ERC
and REP levy as well as taxes. Equivalent to the turnover of Kenya Power lost from net-metering,
these revenues are lost for GoK. As indicated in the following table G there are losses for the
ERC fee, the REP fee and the VAT in the range of 2-2.97 KES/kWh.
Case 1 Case 2 Case 3
VAT 2,38 2,11 1.73
ERC levy 0,03 0,03 0,03
REP levy 0,56 0,45 0,29
Total per kWh 2,97 2,59 2,05
Table 16: Cost/benefit of Net Metering for the GoK
GoK should balance these “lost revenues” with the following benefits of PV.
- Avoided costs for the consumers
The avoided cost calculation illustrated above translates into direct cost reductions for the power customers (assuming that thermal generation capacity would be displaced). Since the investment costs for the net-metering projects are borne by private investors, and since fuel costs are passed through to consumers as fuel cost charge, this would imply lower power bills for the end-users.
- Other operational benefits of PV
The key to estimating the operational benefits of PV-plants integrated into the Kenyan power
system/grid is the optimal, least-cost multi-period commitment and dispatch of available plant
both in the absence and the presence of PV-loads, subject to load balances and other
operational constraints (spinning reserves, minimum maximum loads, and volume of
dischargeable water). From this perspective, the PV-benefits to the system amount to avoided
costs defined as the difference between system minimum [operational] costs without PV and
system minimum [operational] costs in the presence of PV-loads. Accordingly, the specific PV
benefits (KES/MWh) are given by the ratio of PV-benefits (KES) to PV-loads (MW) injected.
In the present contest, the optimum dispatch schedule yielding a cost minimum is calculated for
the LCDP 2011 through The Wien Automatic Simulation Planning Package (WASP). This study
could not use this or other software models such as MATHEMATICA (a simplex-based de-
commitment algorithm). To simplify this here we have used the merit order ranking of the existing
power plants and defined the incremental fuel costs as the average of the three most expensive
power plants. The results have informed the above analysis of economic implications for KPLC.

Technical and Economical Assessment of Net-Metering in Kenya
Additional benefits (not yet quantified) are - Combination of PV with hydropower to increase availability of this least-cost resource - National energy mix closer to the efficient frontier of optimal risk-return combinations - PV will help reduce the economic and political cost of probable future blackouts - PV will stabilize the LV grid, especially in weak parts of it and in centres such as Nairobi - PV fed in a LV level will reduce overall system losses - PV can create national employment - PV will abate greenhouse gases
g. A possible market development for grid connected PV
According to KPLC data the No. of consumers for the tariff groups are shown below. Based on
this as well as on parameters analyzed above, a potential market development can be assessed:
Number of customers
DC DC/IT 1,525,047
Out of this DC with > 1500 182,044
SC 126,322
CI1 2,513
Total 1,767,929
Table 17: Customers per relevant KPLC tariff groups
No. of
consumers
for the
tariff
groups
Est. share
of PV
investors
of total
tariff group
average
size of PV
plant (kWp)
assumed
market
installed
PV (kWp)
electricity
produced
in
kWh/kWp
(Nairobi)
total electricity
produced in
MWh
DC DC/IT 1,525,047 0%
DC with >
1500
182,044 1% 5 9,102 1,371 12,479
SC 126,322 3% 50 189,483 1,389 263,245
CI1 2,513 2% 250 12,565 1,408 17,686
Total 310,879 5,660 211,150 4,168 293,410

Technical and Economical Assessment of Net-Metering in Kenya
Table 18: Assessment of possible PV market development
It is obvious that this market of 211 MWp will not be realised within one year. Germany as
worldwide leading market has shown similar developments – today 1million PV systems are
installed by approx. 30 million households- this is a share of 3%.The diffusion of 1-5% of PV on
the targeted tariff groups (DC with more than 1500units, SC and CI1) could be realised in a time
frame of 2-5 years, mainly depending from the economic development and the administration
burdens GoK will put on net metering. The PV plants in the SC tariff group are the backbone of
this development.
Even assuming a market penetration of 1% only for each class, this would result in a total
installed capacity of 78.5 MWp, mainly installed in the cities such as Nairobi, Kisumu and/or
Mombasa – with more than 90% feeding into the LV grid. This report cannot consider regional
impacts; however, we assume that feeding into the LV grid in Nairobi will improve the grid quality
– if the technical standards recommended in part II are fulfilled.
3. International experiences in Net-metering
In 2010, PV installations reached the one million mark, thanks to small residential installations to
a large extent. The rapid growth of the residential sector in Germany accounted for much of
reaching this target (EPIA, 2011) but other countries have as well been successful in the
implementation of decentralized generation connected to the low voltage grid. The aim of this
chapter is to show case international experiences in small-scale grid-connected PV, in particular
with a net-metering framework.
The USA, Denmark and Mexico have already run net-metering for solar PV for several years.
Brazil and Morocco have been chosen as cases of governments actively pursuing a net-metering
framework. In the following, a brief overview of each of these countries is given, focusing on
regulation and technical aspects.
a. United States
Depending on the size of the solar installation, different policy strategies apply. For systems
below 1 MW –which is the large majority of PV installations in the USA (outside California) – net-
metering is applicable19.
19
[27]

Technical and Economical Assessment of Net-Metering in Kenya
- Regulatory aspects
In the U.S.A., as part of the Energy Policy Act of 2005, state utility regulatory commissions must
consider requiring the public electric utilities under their jurisdiction to make net metering
available to their customers upon request20. Specific regulation therefore varies from state to
state. Several bills are pending in Congress to institute a federal framework. Currently as of May
2010, 46 US states have a net-metering policy21.
Regarding capacity limits, several states impose a subscriber limit as a percentage of the utility’s
peak load (typically ranging from 1 to 5%). However, already twenty states plus Washington D.C.
impose no limit on the number of subscribers using net metering.
- Technical aspects
As is the case in Europe, the USA has implemented specific regulation concerning the
connection to the low voltage grid. The market access requirements for PV equipment are
segmented in two main areas - safety and performance - that are integral to each other in the
overall construction. The focus of the UL standards (UL, 2011) is in providing requirements for
materials, construction and the evaluation of the potential electrical shock and fire safety hazards.
The focus of the IEC requirements is in terms and symbols, testing, design qualification and type
approval.
UL certifies that PV equipment complies with the safety, environmental and other performance
requirements of the appropriate standards. UL supports manufacturers with the compliance to
both the UL and the IEC requirements utilizing a combined project or if needed, as individual
evaluations. The only norms that contain information towards grid connection are UL 1741 and
IEEE 1547 (Stadler, 2011).
b. Denmark
Even if there is no feed-in tariff for solar PV in Denmark, high electricity prices – virtually the
highest in Europe22– provide the rationale for net-metering.
- Regulatory aspects
The "Guidelines for net settlement of auto producers"23 were approved by the Danish Energy
Authority in 2005.
20
[28] 21
[29] 22
[30]

Technical and Economical Assessment of Net-Metering in Kenya
Solar PV systems below 50kWp are eligible for net-metering and are automatically registered for
net-metering. Larger systems could also benefit from net-metering, but must address an
application to the utility24.
- Technical aspects
At the time of writing (December 2011), Energinet.dk has only made available the “Technical
regulation 3.2.1 for electricity-generating facilities of 16 A pr. phase or lower”. This technical
regulation comprises provisions for electricity-generating facilities connected to the Danish public
electricity supply network which have a maximum output current of 16 A per phase. The
regulation includes provisions regarding the properties which the electricity-generating facilities
must have and continue to have throughout their service life. As an attachment to this regulation,
a list of solar inverters that comply with this regulation and are thus approved for use is
provided.
c. Mexico
Net-metering for solar PV installations is possible throughout the country since June 200725.
Although the government has not set specific targets for solar energy generation, insolation
conditions in Mexico and a legal framework for grid access encourage optimistic forecasts.
- Regulatory aspects
The net-metering regulation makes a difference between small-scale generators (connected to
the grid at voltage below 1kV) and medium-scale generators (connected to the grid at voltage
between 1kW and 69kV). The specific capacity limits that apply are respectively 30kW and
500kW. In both cases, no generation permit is required. In order to access the electrical grid, a
contract for distributed generation is signed with the Comisión Federal de Electricidad (CFE),
which is only an annex to the normal electricity supply contract).
- Technical aspects
Specific technical requirements concerning the connection to the low voltage grid are available
on the website of the Comisión Reguladora de Energía. These cover all technical requirements
for inverter-based generators.
23
[31] 24
[32] 25
[33]
Technical and Economical Assessment of Net-Metering in Kenya
d. Brazil
The government of Brazil is set to promulgate market-enabling legislation that will finally permit
broad grid connections for solar installations by the end of 201126. This new opportunity is
expected to catalyze growth in the solar PV sector.
- Regulatory aspects
No official documentation is available at the time of writing (December 2011). The Deutsche
Gesellschaft für Internationale Zusammenarbeit (GIZ) is actively working with local governmental
institutions and relevant stakeholders to push forward the net-metering policy.
For this purpose, a thorough study by German lawyers was completed in August 2011 to provide
the Brazilian Electricity Regulatory Agency (ANEEL) with information on the legal procedures for
the connection of small and decentralized distributed generation plants up to 1 Megawatt to low
voltage grids27.
e. Morocco
The Deutsche Gesellschaft für Internationale Zusammenarbeit (GIZ) is completing a study to
prove the potential of grid-connected solar PV to the low voltage grid 28. According to the outputs
of this study, grid parity will be achieved by electricity consumers of all tariff categories by latest
2013. As part of the efforts to promote such regulation, a proposal of “1 million roofs program” is
being developed. Such program would have to rely on a net-metering framework.
- Regulatory aspects
There is no specific regulation for net-metering at the moment of writing (December 2011).
However, a law published in 2010 (Dahir n° 1-10-16 du 11 février 2010, publiée au Bulletin officiel
n° 5822 le 18 mars 2010) expresses the right to produce electricity from renewable energy
sources for own consumption in grid-connected applications in medium and high voltage. This
law is in line with the philosophy of net-metering and represents starting point for the
development of specific regulation.
26
[34] 27
[35] 28
[36]

Technical and Economical Assessment of Net-Metering in Kenya
f. Best practices
Interesting lessons can be derived from each the previous examples. The practices listed below
could set examples worthwhile to consider:
- Several states in the USA, including Washington D.C. impose no limit on the number of
subscribers using net metering
- The national utility in Denmark makes available a list of solar inverters that comply with
its regulation for connection to the low voltage grid
- Administrative procedures for net-metering are kept very simple in most of the cases
listed above. In the case of Mexico, the contract is just an annex to the normal energy
supply contract with the utility.
- Brazil conducted a thorough study on the legal procedures for the connection of small
and decentralized distributed generation plants to low voltage grids with the aim of
collecting the best practices from around the world.
- Morocco’s proposal of a “1 million roofs program” might be too ambitious, but a
“thousand roof program” would be a great example of an achievable target that would
pave the way for the growth of decentralized small-scale solar PV.

Technical and Economical Assessment of Net-Metering in Kenya
Part II: Technical Issues of Solar PV Grid Interconnection
1. Introduction
This chapter is intended to examine the technical feasibility of grid integration of solar Distributed
Generation (DG) with PV in Kenya. As Kenya has up to now no country-specific experiences in
this area, we are basing our analysis on the circumstances of the German market, in combination
with parameters and information derived from the available documentation of the Kenyan
electricity market, e.g. the grid code as well as other information obtained from stakeholders.
Technical requirements in other countries having implemented net-metering have also been
reviewed for reference and have been included in chapter 7.
By 2011, approx. 1,000,000 grid-connected PV systems were operating in Germany with a total
rated power of 17,200 MW installed capacity, of which 7,200 were added in 2010 only. 98% of
these systems are feeding into the LV grid. As a result, the technical issues of distributed
generation (DG) are of paramount importance with respect to the German grid operation and
stability. In this chapter, we discuss the newly developed, advanced guidelines for grid
interconnection of DG. These guidelines were recently changed in a significant way and are now
ready for future growth of the share of distributed electric power generation. The changes
became necessary because earlier technical rules were not suitable to accommodate for the
tremendous growth of DG in Germany. Instead, they were a threat to the stability of the European
electricity supply, the synchronous area, ENTSOE. Thus, the new guidelines reflect the impact of
DG on the distribution grid level on the transmission and generation system.
Figure 10: Development of PV installations in Germany 2000 – 2010

Technical and Economical Assessment of Net-Metering in Kenya
The report therefore will not simply copy the German solution to Kenya without considering the
implications of transfer and proper adaption. However, the new German guidelines for grid-
connected PV are based on the general guidelines of the European High Voltage (HV) network.
Furthermore, European countries are now harmonizing their PV-guidelines according to the
German regulations. We therefore also recommend for Kenya to switch to these very advanced
guidelines for PV.
This chapter addresses technical issues of connection to the LV distribution grid with respect to
the whole electricity supply system. It is intended to give guidance on preparations for a growing
rate of distributed generation. The report primarily addresses the low voltage LV connection of
DG systems. However, the technical issues are similar for medium voltage MV connection.
2. Compatibility with the Kenya Grid Code
This assessment is based on an evaluation of the /Kenya Electricity Grid Code of 200829 . It
considers only technical and not procedural and administrative requirements.
The grid code focuses on large electricity production plants which are typically connected to
higher voltage levels than Low Voltage (LV). Therefore a literal employment for PV systems
would not be appropriate. PV systems that would be installed under net metering would be much
smaller and would require much simpler procedures as those outlined in code section 3 and 6.
We noticed several technical requirements with respect to the transmission network. No specific
requirements for LV had been noticed. Thus the following discussion is based on the rules for the
High Voltage (HV) network.
We recommend adding a section to the Kenyan Grid Code for inverter based generators, or
generators connected to the LV grid. This would clarify the requirements for potential
Independent Power Producers.
- Frequency behaviour
The Code says in section S3.1.3:
“A network service provider shall ensure that within the power system frequency range
45.0 to 52.0 Hz all of his power system equipment will remain in service unless that
equipment is required to be switched to give effect to load shedding in accordance with
clause S3.1.10, or is required by the System Operator to be switched for operational
29
[20]

Technical and Economical Assessment of Net-Metering in Kenya
purposes. Plant shall not be required to operate in a sustained manner outside the range
of the normal operating frequency excursion band but should remain in service for short-
term operation in the range of 45.0 Hz to 52 Hz. b”.
In section S3.2.6.4 it states:
“MOverall response of a generator for system frequency excursions shall be settable and
be capable of achievingM.a reduction in the generator's active power output of 2% per 0.1
Hz increase in system frequency provided the latter does not require operation below
technical minimum. For initial outputs above 85% of rated output response capability shall
be able to achieve a linear reduction in response down to zero response at rated output.
M
”
The basic functionality to abide by these requirements is implemented in modern
inverters. However, the frequency range is wider than in Europe, thus inverters with
“European settings” might switch off more often than necessary. Default frequency range
in Europe is 47.5 Hz to 51.5 Hz.
Once a significant generation capacity with PV is available, the switching-off threshold at
lower frequency becomes crucial. A premature disconnection of inverters would actually
reduce generation power, when it is badly needed, during a lack of generation.
Therefore, on a long term basis inverters threshold for disconnection should be set to 45
Hz during commissioning.
As grid voltage in Kenya is above the German standard, the inverter operational bands
have to be adapted. This is technically feasible.
- Voltage behaviour and Fault-Ride-Through (FRT)
Section S3.1.4 states:
“M. control of voltage such that the minimum steady state voltage magnitude on the
transmission network will be 90% of nominal voltage and the maximum steady state
voltage magnitude will be 110% of nominal voltage. M.
M Short-time variations (of several minutes duration) within 5% of the intended values
shall be considered in the design of plant by Code ParticipantsM.”
And sectionS3.2.5.3 on Generator response to disturbances in the power system
“bconnection point to drop to zero for up to 0.175 seconds in any one phase or
combination of phases, followed by a period of ten seconds where voltage may vary in the
range 80-110%.”
Technical and Economical Assessment of Net-Metering in Kenya
The voltage band from 90 % to 110 % of nominal voltage (Un) is already implemented as
default into European inverters. No change is necessary.
FRT capability in Europe is not requested on the LV grid, but only on higher grid voltage
levels, however many inverters are prepared for this feature, since they may be employed
in PV systems connected to the MV grid. The Kenyan requirement for FRT for 0.175 s
duration is slightly higher than in Europe (0.150 s).
It should be clarified whether FRT will be requested also for generators connected to the
LV grid.
- Reactive power capability
According to the code power factor (PF) limits are 0.85 inductive and 0.95 capacitive.
(Code S3.2.5.1).
Modern inverters can typically deliver PF >= 0.95 (Pn<= 13.8 kVA) or PF >= 0.90 (Pn<=
13.8kVA). This is a sub band of the code requirement. It is only minor constraint, not
impeding application of PV technology. Typically most systems are set to a PF of 1.
- Voltage quality (harmonics, dips, swells, phase unbalance)
These topics are stated in Code section S3.1.6. The code refers to requirements
according to the IEC 61000 standard series. The same standards are required in Europe,
too.
In short, modern inverters fully comply with the Kenyan Grid Code. From the inverter side, no
serious obstacles can be expected.

Technical and Economical Assessment of Net-Metering in Kenya
3. Solar PV and the German/European Electricity Supply
Network
The German electricity supply network is part of the European common control area, ENTSOE. It
includes generation and transmission system with typical 220 kV and 380 kV system voltages.
For cities and short distances 110 kV is used for transmission as well as distribution. Regional
distribution is done over 10 kV and 20 kV 3-phase, 3-wire system. Local distribution uses a 400
V, 3-phase, 4-wire system with a neutral centre wire. Nominal voltage between phases and
neutral is 230 V.
Generally, buildings are connected to this 3-phase system. Internal 1-phase loads are distributed
over the three phases. Voltage regulation is regularly performed at the HV/MV transformer by
means of a tap changer.
In residential areas in Germany the network regularly comprises a transformer with a nominal
power of Sn = 400 kVA. This transformer feeds several feeders of 150 mm² Al cables. These
cables can carry about 180 kVA continuously /PV Upscale - Utilities Experience [1]/.
Currently in Europe a substantial change in electrical power generation and distribution is taking
place. The structure is shifting from a central, top-down structured generation and distribution to a
combined central and decentralised generation. With fast growing penetration especially of
photovoltaic power systems (PV) mainly in the low-voltage grid the impact of PV on the whole
electricity supply network has been re-assessed.
It is very important to consider that the utilities view of the role of PV has completely changed: PV
in Germany is now a power source with a significant generation capacity and a big impact on the
European electricity supply system. New PV systems therefore are requested to actively
contribute to system services and security.
Grid stability is of paramount importance. Therefore “fault-ride-through” capabilities are an
important feature for PV systems including small ones, due to their large number. Even with little
PV capacity on the grid potential effects of future large inverter capacities should be taken into
account, since the amount of DG capacity will steadily increase and these inverters will operate
for the next 10- 15 years.

Technical and Economical Assessment of Net-Metering in Kenya
Retrofitting of PV systems (in Germany) to solve 50.2 Hz problemplanned
Press Release from the German the Association of Electrical, Electronic and Information Technologies
– VDE,September 2011
A joint initiative of grid operators and the solar industry is recommending that the German Government
take measures to ensure supply security in the German and European power grid. According to a
scientific study, a retrofitting of some solar power systems is necessary to solve the so-called 50.2-hertz
problem.
The technical guidelines for operating decentralized power generating systems were established at a
time when these systems played only a minor role. For this reason, the forum network technology
(FNN) has now revised the guidelines for new systems. The objective is to achieve a "gentle"
disconnect of systems from the grid when overfrequencies occur. Since the large number of already
installed systems has a significant influence on network stability in the German and European electricity
grids, there must be a regulation of retrofitting.
In Germany, these modifications are recommended for all photovoltaic systems that became
operational after 1 September 2005 and that have a capacity of over 10 kWp peak power. Technical
implementation is to be carried out between 2012 and 2014 on around 315,000 mid- to large-sized
solar power systems that are connected to the low-voltage grid.
This means that small roof-mounted systems on single-family homes would not be required to undergo
retrofitting. Although solar inverters were always installed and set up properly and according to current
guidelines, necessary progress in shutdown specifications requires that changes be made to existing
systems.
According to experts, the retrofit recommendation is the simplest and most cost-efficient solution. In the
vast majority of cases, the installer must only update the software or change the parameter settings of
the solar inverter.

Technical and Economical Assessment of Net-Metering in Kenya
4. Relevant technical issues of distributed PV generation
This section summarizes concerns of utilities with regards to distributed generation. These
individual aspects relevant to this presented in the following are based on two studies undertaken
by a team of experts on this issue3031 :
• Maximum capacity for distributed PV generation in LV networks
The acceptable capacity depends strongly on the assumptions for a tolerable voltage rise. A
study by IEA32 found a difference by a factor of four when comparing the limits of 2 % as given in
the former VDEW Guideline and the 10 % tolerance level regulated in the European Standard for
voltage quality, EN 50160. /EN 50160:200833 .
As a rule of thumb PV capacity in an LV grid segment should not cause any problems, if power is
limited to 70 % of the rated power of the feeding transformer34.
• Voltage level rise along feeder
Figure 11: Principle scheme of current flow over LV transformer and voltage gradient at distributed generation.
Due to PV power generation, the voltage drop across the branch can change its sign.
30
[1] 31
[2] 32
[3] 33
[12] 34
[2]
V/Vn [%]
95
90
100
105
110
grid 20 kV0,4 kV GGGGG
II

Technical and Economical Assessment of Net-Metering in Kenya
Adding generation capacity on a feeder formerly used only to supply loads may cause a reverse
power flow in that feeder along with a voltage rise due to voltage drops on the power line to the
transformer. Figure 7 shows the basic scheme. The low voltage grid is often designed with a so
called “after diversity maximum” (ADMD) load for each domestic customer of 1 to 1.1 kVA. If PV
systems are connected with a nominal power of several kW’s at each customer’s installation,
problems with the actual voltage level and capacity of the LV cable can occur.
From one of the aforementioned studies35, it can be assumed that this effect is noticed; however,
in stiff grids it is not critical. It may become critical in rural areas with higher impedance networks.
• Component loading
A recent study for German networks36 showed that under the assumption of an even distribution
of PV capacity - each customer has a PV system (!) - at the LV level, the first limitation for higher
PV capacity arises from the voltage rise towards the end of the feeder. Thermal overload of
equipment is not noticed until even higher PV power, in the worst case of suburban networks 6
kWp per household (household is equal to connection point). In stiffer network areas 10 kWp - 30
kWp per consumer can be connected. Note that these values are depending on the topology of
the grids. Certain numbers for Kenya should be assessed in a more detailed investigation –
however 100% PV penetration in a market has not yet been achieved in the world (see chapter
6.2 for the market scenario).
• Harmonics from inverters
Harmonic currents and DC from inverters are no problem with modern inverters, which comply
with generic standards of the IEC 61000 series. Also analysis of high population real estates with
PV showed that in general no detrimental effect on power quality was noticed. Flicker problems
were not noticed37.
• External manual disconnect
External disconnects were for a long time in many countries seen as a very important measure to
ensure staff safety during maintenance work. However, with soaring numbers of systems
manually disconnecting all DG systems seems no longer feasible. Thus, for systems up to 30 kW
the external disconnect requirement had been dismissed, if grid connection is done through a
safety interface according to the German standard VDE 0126-1-1: 2007.
35
[2] 36
[7] 37
[2]

Technical and Economical Assessment of Net-Metering in Kenya
• Unintentional islanding
The possible occurrence of unintentional islanding in networks with distributed generation had
been one of the major issues. However, investigations have shown that likelihood and risk of
personal injury or death from islanding are below other risks accepted by society (such as
smoking, driving cars or passing a highway). This topic has been discussed in detail38. .
Accordingly, unintentional islanding and its risks should not be seen as a barrier or limiting factor
for the further development of Distributed Generation.
• Short-circuits in the distribution system
In urban areas employing underground cable networks the currents from PV systems are small
compared to the high short circuit current of the network. Therefore no adverse effect on fault
clearance is expected. However, under high penetration of PV-DG and if faults occur at the end
of lines with high impedance, currents from PV systems might hamper fault detection and
clearance.
To avoid reduced stability of the electricity supply system due to massive disconnection of
generation capacity, short faults with voltage breakdown must not lead to disconnection of PV
systems from the grid (see box Retrofitting of PV systems (in Germany) to solve 50.2 Hz
problem).
• Network stability
Grid stability is of prime importance. Therefore “fault-ride-through” capabilities are an important
feature for PV systems including small ones, due to their large number. Even with little PV
capacity on the grid potential effects of large inverter capacities should be taken into account,
since the amount of DG capacity will steadily increase and these inverters will operate for the
next 10 b 15 years.
Therefore, in Germany, due to the large PV capacity of some 17 GVA (2010) on the grid, PV
inverters are now required to provide ““fault-ride-through” capability like central power stations39
(more details in section 5.4 New Guidelines). For systems on the LV grid the necessity of this
feature is being discussed, but not implemented.
38
[8] 39
[9]

Technical and Economical Assessment of Net-Metering in Kenya
• Output power control
The current feed-in law (EEG 201140) requires for systems of 30 kW and above means for
remotely controllable output power. In case of overload, DNOs may reduce the actual power of a
system. Output power control allows a coordinated reduction in power delivery from generation
systems. This reduction is used to ensure abidance with admissible voltage bands. The method
would allow a higher capacity than could be tolerated on the basis of fixed rules for voltage rise.
However, this option requires a reliable communication channel and an appropriate control
scheme implementation into network operation. It is thus suitable only for larger systems.
• Reactive power supply
Drawing reactive power while supplying real power is an option for voltage level control widely
used in transmission networks. It is essentially an option for PV inverters, too. Currently, it is not
(yet) used in small inverters, but by 2012 new .inverters have to be prepared to activate such an
option. Ideally this control should operate automatically, using some static control characteristics.
This option can be implemented in cable networks, though it is more effective in overhead lines.
This capability is required in the new German LV guidelines41.
5. Applicable aspects of the German LV Guideline
In Germany a new guideline for connecting and operating distributed generation systems on the
medium voltage grid has been published in August 201142.This guideline considers DG as part of
the larger electricity network as described before, and imposes some concepts from the
transmission system level (transmission code 200743) to the LV grid. This section gives a
summary of the main requirements discussed in that paper.
The new LV guideline requests a contribution to grid security and stability from DG. DG systems
have to remain connected and feed into the grid using much wider voltage and frequency bands
than in former editions of this guideline.
DG systems have to o contribute to static voltage control, i.e. aid in maintaining voltage level under varying
loads
40
[5] 41
[10] 42
[10] 43
[11]

Technical and Economical Assessment of Net-Metering in Kenya
o contribute to dynamic grid support during grid disturbances This includes a defined fault-ride-through capability and the option to deliver reactive current for voltage support
o must operate with a defined over-frequency regime
• Admissible voltage changes
The connection point between grid and DG Systems as well as the power factor of the DG
system have to be selected that the voltage change of the sum of all DG systems at full power is
limited to 3 %.This measure shall ensure that voltage limits defined by respective standards are
well kept.
• Asymmetric loading
Generally, symmetric 3-phase generation is required. Maximum tolerable difference between
phases is 4.6 kVA.
• Active power limitation
An additional requirement regards the option for the DNO to actively reduce the power output of
DG systems in critical situations. This requirement is also defined in the governing “EEG “ law for
system sized above 30 kWp. A paper by the Association of Network Operators (VDN) suggests
use of a variable power reduction scheme with several reduction levels, at least: 0 %, 30 %, 60
%, and 100 % with respect to nominal system power.
• Automatic power reduction at over frequency
All renewable-based generating units must reduce, while in operation, at a frequency of more
than 50.2 Hz the instantaneous active power with a gradient of 40 % of the generator’s
instantaneously available capacity per Hertz (Figure 7).

Technical and Economical Assessment of Net-Metering in Kenya
Figure 12: Active power reduction of renewable-based generating units in the case of over-frequency (from [12])
For maintenance work transformers may be switched off and power supply on the LV level is
assured by mobile gensets. Typically, emergency power units are operated for a short while in
parallel to the public grid. To avoid disturbing interactions of distributed generators and
emergency generators the frequency of the emergency generator is shortly increased above the
cut-off threshold of DG units, e.g. 52 Hz. After all DG has disconnected, the frequency is reduced
and kept slightly above the reconnection frequency.
• Reactive power control
DG systems need some means for reactive power control.
Sn< 3.68 kVA: PF <= 0,95
3.68 kVA: <Sn<= 13,8 kVA: PF <= 0,95; control curve by DNO
13,8 kVA <Sn : PF <= 0,90; control curve by DNO
Power limits are somewhat arbitrary and influenced by European standards. The control curve
can be a fixed displacement factor cos φ, or fixed reactive power Q in MVAr, or a variable
displacement factor as function of real power cos φ (P), or a variable reactive power Q as
function of voltage, Q (V). Dynamic functions shall respond within 10 s (for cos φ (P)) up to 1
minute (for Q (V)).

Technical and Economical Assessment of Net-Metering in Kenya
Figure 13: Example of a cos φ (P)-characteristic. This is the recommended default curve.
• Protective relays
The MV Guideline44 states:
“Protection equipment is of considerable importance for secure and reliable operation of
networks, connection facilities and generating plants. According to DIN VDE 0101, automatic
installations must be provided for short-circuit clearing in electric facilities. The plant operator is
responsible himself for the reliable protection of his plants (e.g. short-circuit, earth fault and
overload protection, protection from electric shock, etc.). To this end, the plant operator must
install an adequate amount of protection equipment..”.
The protective relay works on the transfer switch, which eventually connects the DG unit to the
grid. The following functions of the protective disconnection equipment shall be realized for LV
systems, with set values and reaction time given in the following table F.
44
[9]

Technical and Economical Assessment of Net-Metering in Kenya
Protective function Set value Reaction time
under-voltage protection U< 0.8 Un ≤ 200 ms
over-voltage protection U> 1.1 Un ≤ 200 ms
over-voltage protection U>> 1.15 Un ≤ 200 ms
under-frequency protection f< 47.5 Hz ≤ 200 ms
over-frequency protection f> 51.5 Hz ≤ 200 ms
islanding detection n.a. 5s
Table 19: Set values and reaction time of protection relays
Over-voltage protection employs a 10 min sliding average measurement. Thus it is compatible
with the voltage quality standard EN 50 16045. The other voltage deviation protection relies on
fast, half-cycle, rms measurements.
At a frequency below 47.5 Hz or above 51.5 Hz the DG system shall disconnect immediately.
Between 47.5 Hz and 51.5 Hz the DG unit must not disconnect, but shall deliver a frequency
dependent power as shown in section 5.4.4
Islanding detection can be realised by an active method like “frequency shift” or by 3-ph voltage
monitoring (only 1-ph inverters and electrical machines).
• Verification of the electrical properties
Every generating unit requires a type-specific “unit certificate” which specifies the electrical
properties of the generating unit in order to confirm the conformity of the generating unit with the
requirements of the guideline.
A second type certificate is required which confirms the proper function and settings of the
protective relays including the Testing specifications for conformity assessment are currently
under development in the German standardisation committee DKE K261 and are expected to be
published in 2013.
45
[12]

Technical and Economical Assessment of Net-Metering in Kenya
6. Future options
Modern inverters can perform additional functions such as: active filtering by injecting
compensating current harmonics, reactive power control, voltage level control, phase symmetry
control / P. Kremer and M. Fruehauf46. In combination with energy storage more options are
possible, for example: intended islanding, extended voltage control, peak shaving. Such solutions
are of particular interest to consumers that currently rely on generator sets and battery back-ups.
Potential benefits are generally acknowledged, but currently have little market value in European
grids. To employ these options a regulatory framework including financial incentives – FIT surplus
or down-payment for installation - needs to be developed. In future, theses benefits may become
features of a “smart grid”.
• Grid support during disturbances (Fault-Ride-Through Capability)
The MV guideline requests that DG plants contribute to grid security and stability. DG systems
have to remain connected and feed into the grid using much wider voltage and frequency bands
than in former editions of this guideline. The same operating areas as for HV equipments are
employed (see Figure 10).
Figure 14: Operation voltage-time bands for DG on the MV grid.
46
[13]
begin of disturbance
limit curve 1
below blue curve - disconnection not regulated
lower limit of voltageband = 90 % Vn
V/Vn
time [ms]
source:Technische Richtlinie Erzeugungsanlagen am
Mittelspannungsnetz (Technical guideline for generation systems
in the Medium Voltage grid), BDEW, Ausgabe Juni 2008
limit curve 2

Technical and Economical Assessment of Net-Metering in Kenya
Disconnection within the first 150 ms of a disturbance is not permitted even when the voltage
completely collapses. Above “limit curve1“ all PV systems have to remain connected to the grid,
between curve 1 and curve 2 short time disconnections (< = 2 s) are allowed, but preferably the
system should stay connected.
• Active filtering
Inverters can be operated as active harmonic filters. In grid sections with a high distortion this
may cause violations of harmonic current limits given in EMC standards like IEC 61000 – 3-2.
Here is a gap in conventional standards and this condition could be addressed in utilities´
guidelines to take advantage of the new opportunities from modern inverters.
If active filtering is employed and ripple control is used, inverters shall be adjusted not to
compensate the frequency of the ripple control voltage.
• Active symmetry control
Unbalanced loads and generation lead to voltage unbalance and generate a “negative sequence
component”. This component causes additional losses mainly in rotating machines. Properly
designed and connected inverters are capable of sensing the voltage unbalance and adjust their
feed-in control in a such a way that the phase with the lowest voltage receives the highest feed-in
power47.Consequently, such systems can improve the grid quality at the low voltage level.
47
[13]

Technical and Economical Assessment of Net-Metering in Kenya
References
[1] PV Upscale - Utilities Experience and Perception of PV Distributed Generation,
http://www.pvupscale.org/IMG/pdf/WP4_D4-2_Utilities-Experience-PVDG_v5.pdf, (July 2008)
[2] PV Upscale - Impact of PV Generation on Power Quality in Urban Areas with High PV Population, http://www.pvupscale.org/IMG/pdf/WP4_D4-3_public_v1c.pdf, (July 2008)
[3] IEA-PVPVS-Task 5, Impacts of Power Penetration from Photovoltaic Power Systems in Distribution Networks, Report IEA-PVPS T5-10: 2002, February 2002
[4] PV Upscale - Recommendations for Utilities, http://www.pvupscale.org/IMG/pdf/WP4_D4-4_recommendations_V6.pdf:
[5] EEG 2011, Erneuerbare-Energien-Gesetz – EEG) http://www.erneuerbare-energien.de/inhalt/47585/4596/ an English Version of the preceding version of this law is found here: http://www.erneuerbare-energien.de/inhalt/42934/ (August 2011)
[6] IEA-PVPVS-Task 5, Impacts of Power Penetration from Photovoltaic Power Systems in Distribution Networks, Report IEA-PVPS T5-10: 2002, February 2002
[7] Kerber, G.; Witzmann, R.: Aufnahmefähigkeit der Verteilnetze für Strom aus Photovoltaik, EW Jg. 106 (2007), Heft 4, (Capacity of distribution networks for electric power from PV)
[8] IEA-PVPVS-Task 5, Risk Analysis of Islanding of Photovoltaic Power Systems within low voltage Distribution Network, Task V Report IEA PVPS T5-08: 2002, March 2002
[9] Technische Richtlinie Erzeugungsanlagen am Mittelspannungsnetz (Richtlinie für Anschluss und Parallelbetrieb von Erzeugungsanlagen am Mittelspannungsnetz), Ausgabe Juni 2008, (Guideline for Interconnection and operation of electric generation systems in parallel to the Medium Voltage grid), BDEW (Bundesverband der Energie- und Wasserwirtschaft – Federal Association of Energy and Water Industries), issued June 2008 english version available - http://www.vde.com/en/fnn/documents/rl_ea-am-ms-netz_bdew2008-06_engl.pdf
[10] VDE-AR-N 4105 - Anforderungen an Erzeugungsanlagen am Niederspannnungsnetz), Ausgabe September 2011 (Technical minimum requirements for distributed generation for the connection to and parallel operation with low-voltage distribution networks; September 2011; http://www.vde.com/de/infocenter/seiten/details.aspx?eslshopitemid=0d65ed5e-83c9-4d84-af92-356f06b66f8b
[11] Transmission Code 2007, Network and System Rules of the German Transmission System Operators, August 2007; http://www.bdew.de/bdew.nsf/id/DE_7B6ERD_NetzCodes_und_Richtlinien/$file/TransmissionCode%202007_GB_end.pdf, (August 2008)

Technical and Economical Assessment of Net-Metering in Kenya
[12] EN 50160:2008; Voltage characteristics of electricity supplied by public distribution networks; German version of EN 50160:2007
[13] P. Kremer and M. Fruehauf, PV grid power unlimited – Multi MW Power Conditioner units Sinvert Solar, 21st European Photovoltaic Solar Energy Conference, September 2006, Dresden, Germany
[14] Freeing the Grid: Best Practices in State Net Metering Policies and Interconnection Procedures, www.newenergychoices.org, 2010
[15] MoE: Least cost power development plan LCDP, study period 2010-2030
[16] Business Guide Erneuerbare Energien, Projektentwicklungsprogramm Ostafrika: Kenia; www.exportinitiative.bmwi.de; 2009
[17] Solar PV in Kenya Potentials, Market, and Opportunity Portfolio, Michael Franz GIZ Solar Technology Forum, Nairobi; 04.07.2011
[18] ERC: Gazette Notice No. The energy act (No.12 of 2006)
[19] Konstantin, Panos, Praxisbuch Energiewirtschaft: Energieumwandlung, -transport und -beschaffung im liberalisierten Markt, Springer, Berlin; 2009
[20] Kenya Electricity Grid Code; ERC; 2008
[21] Dual metering for solar PV systems - discussion paper for investors and consumers; Michael Franz GIZ, Kenya; 10/2011
[22] Kenya Country Report, Economist Intelligence Unit; United Kingdom; 9/2011
[23] http://www.kplc.co.ke/index.php?id=104
[24] Adolescence of an Industry, Dr. Michael Alexander, Roland Berger Consultant, at Bird & Bird Solar Conference 2010; Investments in the Solar Industry: opportunities and pitfalls in a challenging environment, 26 November 2009
[25] German Solar Industry Association (BSW-Solar), BSW Statistic data on the German, solar power (photovoltaic) industry, BSW http://www.solarwirtschaft.de/fileadmin/content_files/factsheet_pv_engl.pdf June 2011
[26] Least Cost Power Development Plant 2011-2031, http://www.erc.go.ke/erc/LCPDP%202011%20-%202030.pdf
[27] EPIA, European Photovoltaic Industry Association, 2011. Global Market Outlook for Photovoltaics until 2015.
[28] EERE, U.S. Department of Energy, Energy Efficiency and Renewable Energy, 2011. http://www.eere.energy.gov
[29] DSIRE, Database of State Incentives for Renewables & Efficiency, 2011. http://www.dsireusa.org
[30] Europe’s Energy Portal, 2011. http://www.energy.eu
[31] Energinet.dk, 2010. Technical Regulation 3.2.1 for electricity-generation plants of 11kW or lower
[32] Energinet.dk, 2011. Official website. http://energinet.dk

Technical and Economical Assessment of Net-Metering in Kenya
[33] CRE, Comisión Reguladora de Energía, Gobierno Federal de Mexico, 2011. http://www.cre.gob.mx
[34] PV Magazine, July 14th 2011.Brazil readies grid connection law.
[35] STADLER, Ingo. 2011. Study about International Standards for the connection of Small Distributed Generators to the power grid. Cologne University of Applied Science.
[36] GIZ, Deutsche Gesellschaft für Internationale Zusammenarbet, 2011. L’énergie solaire photovoltaïque au Marocet la basse tension.

Technical and Economical Assessment of Net-Metering in Kenya
Our team
Georg Hille is a senior PV expert with over 26 years in hands-on experience in the financial analysis,
technical and project design, acquisition and operation of utility scale PV power plants across Europe
(focus Germany EEG) with a total power of >60 MWp. He is CEO of twelve PV SPVs and responsible for
the highly successful Ecovision PV business which has outperformed IRR predictions in all SPVs they have
brought to the market to date. He has more than ten years of specific LCR renewable energy sector
experience.
Dieter Seifried is an internationally recognized energy economist with more than thirty years of specific
work experience. He has carried Germany’s most successful contracting projects with limited partners
participations and is a least cost planning expert from the beginning.
Hermann Laukamp is an electrical engineer and an international recognized PV specialist with about 25
years of work experience. For the last two decades he works with Fraunhofer Institute for Solar Energy
Systems ISE, Europe´s largest research institute for solar energy, lately with an emphasis on
standardization of grid connected PV in Germany and Europe, working with Governments, leading donors
and top tier PV companies.
Eberhard Rössler is one of the most experienced PV installers worldwide with more than 28 years in
hands-on experience in planning, installing and monitoring of small up to utility scale PV power plants
across Europe (focus Germany EEG). He is managing director of the installation company ARES and
freelancer to the Fraunhofer Institute for Solar Energy Systems ISE in monitoring.
Kilian Reiche is an internationally recognized expert in the fields of renewable energy (RE) and energy
access, with eighteen years of specific work experience. He is lead advisor to several RE funds and
managing director of iidevelopment, a small firm specialized on RE equity placements and PPI in
developing countries. He has led transactions and funds totalling >$500M, is a co-founder of fosera ltd and
teaches at TU Darmstadt. Since 1999, he has been working continuously for the World Bank Group, first as
a staff member and recently as a senior consultant. He has more than ten years of specific energy sector
experience in Latin America.