Embed Size (px)
Citation preview
Guide to Basic FCS Experiments on Zeiss LSM 780/Confocor3/BiG
Systems Running ZEN 2010
With the Zeiss LSM 780, BiG Module or Confocor 3 systems, fluorescence correlation
spectroscopy (FCS) data can be acquired and analyzed. From this data, information about
particle mobility, concentration, and interaction can be measured at a single molecule level.
The purpose of this document is to act as a guide for acquiring a basic FCS measurement using
a dye-in-solution sample. Any questions or concerns can be directed to the Zeiss Product and
Applications Support group at 1-800-509-3905 or [email protected]

Carl Zeiss MicroImaging, Inc. Application and Product Support
Outline 1) Sample preparation
2) Focus into the sample
a) Setup and focus with reflected laser light
3) Setup of LSM 780/Confocor 3/BiG for FCS
a) Light Path
i) Selection of MBS, secondary dichroics, emission filters and detectors
ii) Count Rate
iii) Pinhole Alignment
b) Acquisition Parameters
c) Creation of Basic Fit Model
4) Data Acquisition
a) Navigation of Data Table
b) Creation of Average Correlation Curve
5) Data Analysis
a) Selection of Fit Model
b) Fitting the data

Carl Zeiss MicroImaging, Inc. Application and Product Support
1. Sample Preparation
The dye to be used should be dissolved in a water/buffer solution and diluted down such that the
concentration is between 1-50 nM. After dilution, the dye solution needs to be put in a chamber that
will hold media with a # 1.5 cover-glass bottom. Make sure to put enough media to cover the entire
bottom of the chamber. Typically, a Mat-Tek dish or 8-well NUNC chamber work well as sample holders.
Common dyes used for this kind of experiment is Rhodamine 6G or any of the Alexa dyes. The Alexa
dyes are recommended as Rhodamine 6G has problem with aggregation.
Mat-Tek Dishes
http://www.glass-bottom-dishes.com/product.html
NUNC Chambered Cover Glass
http://www.nuncbrand.com/us/page.aspx?ID=235
Alexa Fluor Dyes
http://www.invitrogen.com/site/us/en/home/References/Molecular-Probes-The-Handbook/Technical-
Notes-and-Product-Highlights/The-Alexa-Fluor-Dye-Series.html
Carl Zeiss MicroImaging, Inc. Application and Product Support
2. Focus Into the Sample Before loading the sample onto the scope, some consideration is needed when selecting the objective to
use. It is imperative for good FCS measurements that a well corrected objective is used to ensure
overlap of the PSF for different wavelengths as well as the objective needs to be corrected for any
spherical aberration. Also, the use of fluorescence free water as an immersion medium is highly
recommended. From Zeiss there are 3 “FCS approved” objectives that meet these criteria:
40x C-Apochromat NA 1.2 W Corr
63x C-Apochromat NA 1.2 W Corr
40x LD C-Apochromat NA 1.1 W Corr
All of these steps will help ensure a well defined PSF which is crucial to accurately model the resulting
FCS data.
2.a Setup and Focus with Reflected Laser Light After the dye solution sample has been loaded onto the scope, the objective needs to be focused into
the sample. An easy and reliable way to focus into a solution sample is to utilize reflected laser light off
of the coverglass to position the focus.
1. Setup reflected light path
2. Focus up until both sides of the coverglass have been imaged
3. Move focus an additional 200 um into sample
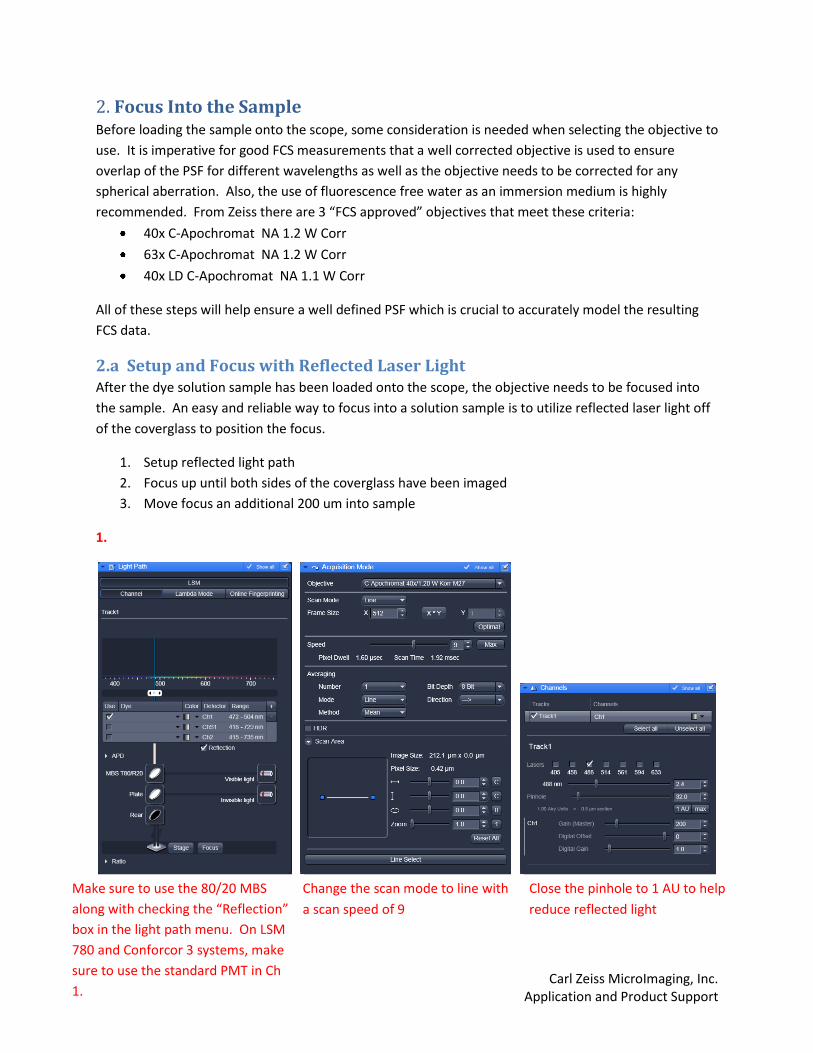
1.
Make sure to use the 80/20 MBS
along with checking the “Reflection”
box in the light path menu. On LSM
780 and Conforcor 3 systems, make
sure to use the standard PMT in Ch
1.
Change the scan mode to line with
a scan speed of 9
Close the pinhole to 1 AU to help
reduce reflected light
Carl Zeiss MicroImaging, Inc. Application and Product Support
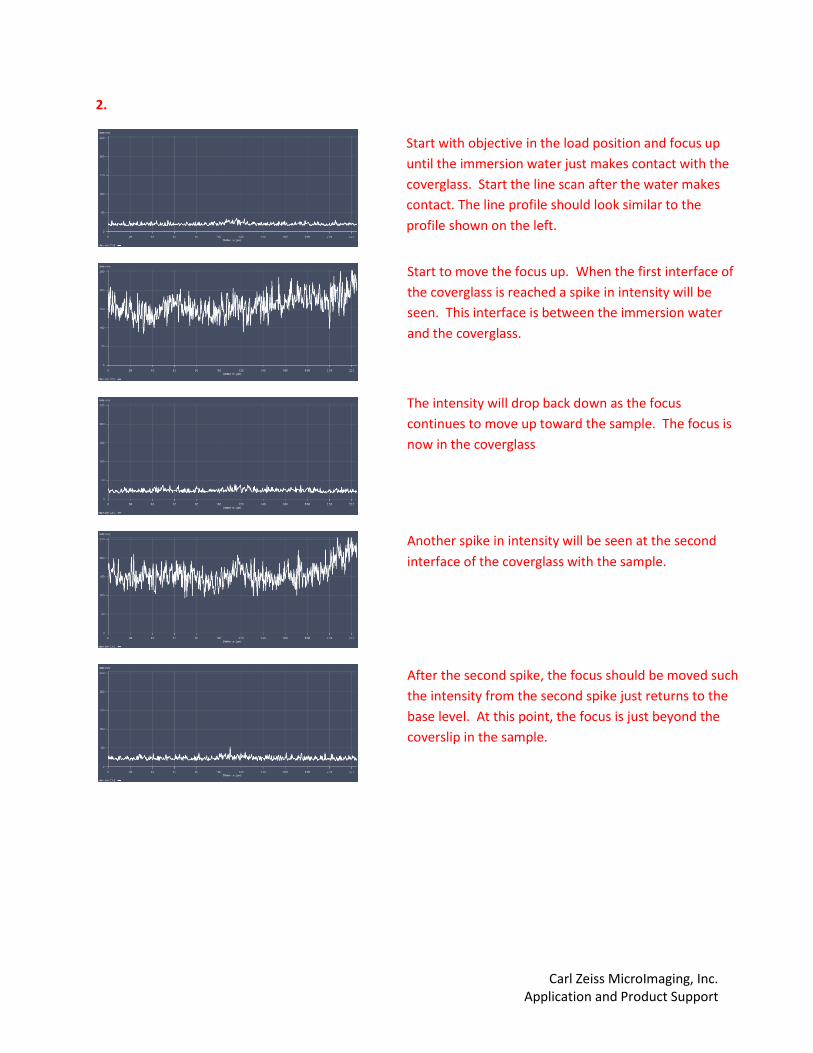
2.
Start with objective in the load position and focus up
until the immersion water just makes contact with the
coverglass. Start the line scan after the water makes
contact. The line profile should look similar to the
profile shown on the left.
Start to move the focus up. When the first interface of
the coverglass is reached a spike in intensity will be
seen. This interface is between the immersion water
and the coverglass.
The intensity will drop back down as the focus
continues to move up toward the sample. The focus is
now in the coverglass
Another spike in intensity will be seen at the second
interface of the coverglass with the sample.
After the second spike, the focus should be moved such
the intensity from the second spike just returns to the
base level. At this point, the focus is just beyond the
coverslip in the sample.
Carl Zeiss MicroImaging, Inc. Application and Product Support
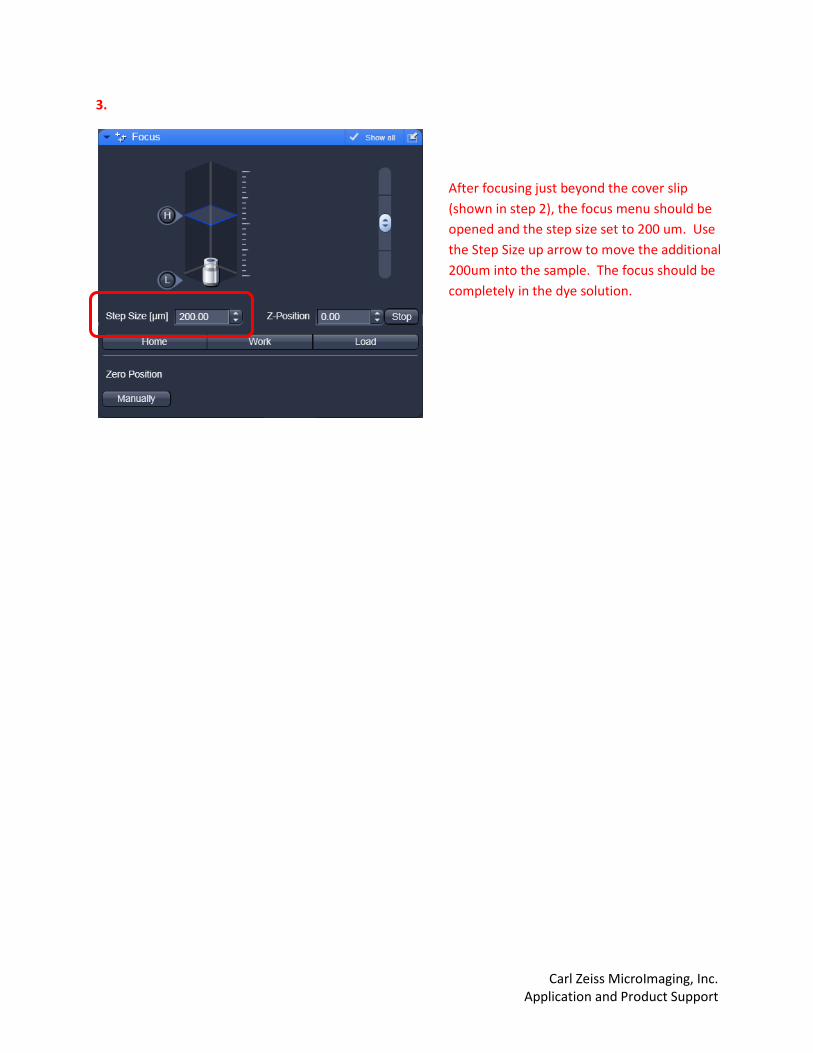
3.
After focusing just beyond the cover slip
(shown in step 2), the focus menu should be
opened and the step size set to 200 um. Use
the Step Size up arrow to move the additional
200um into the sample. The focus should be
completely in the dye solution.
Carl Zeiss MicroImaging, Inc. Application and Product Support
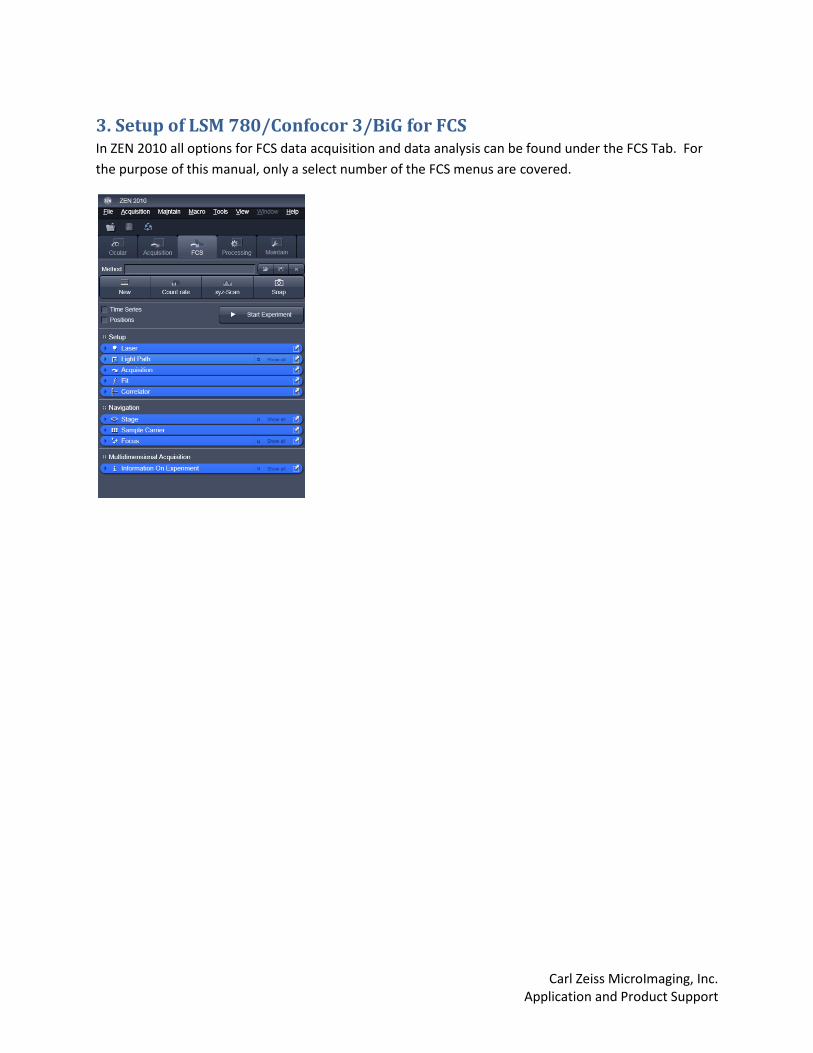
3. Setup of LSM 780/Confocor 3/BiG for FCS In ZEN 2010 all options for FCS data acquisition and data analysis can be found under the FCS Tab. For
the purpose of this manual, only a select number of the FCS menus are covered.
Carl Zeiss MicroImaging, Inc. Application and Product Support
3.a Light Path
3.a.1 Selection of MBS, secondary dichroics, emission filters and detectors
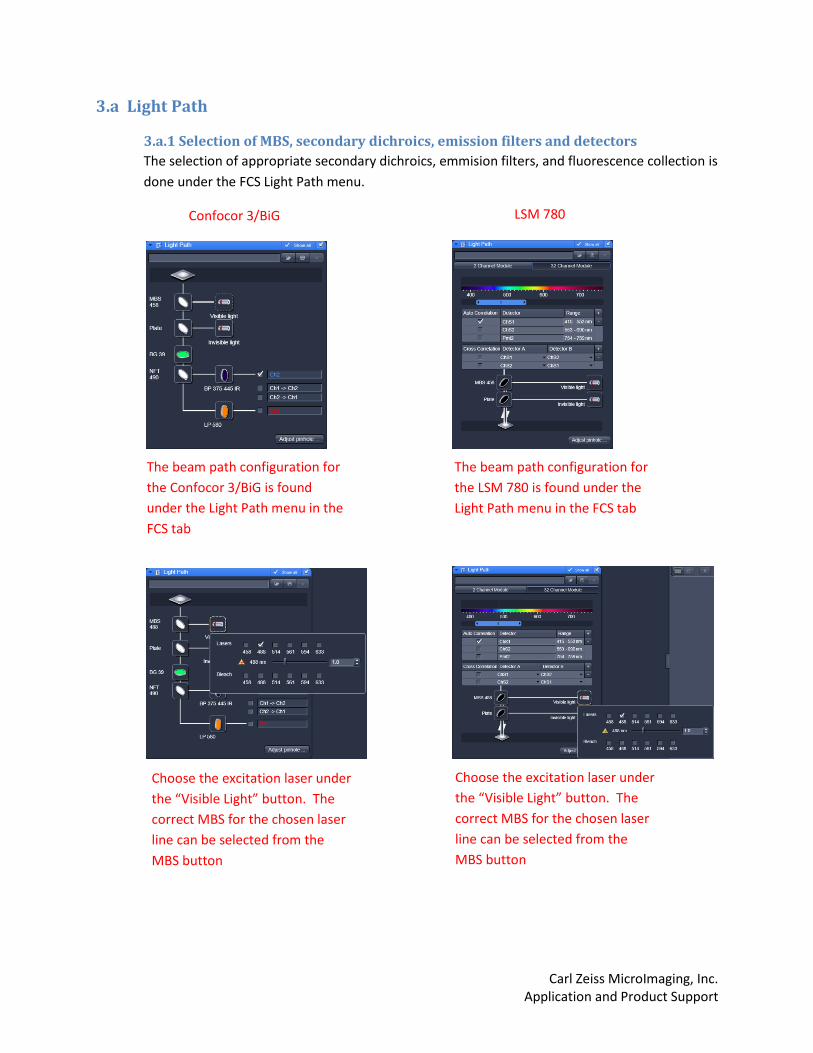
The selection of appropriate secondary dichroics, emmision filters, and fluorescence collection is
done under the FCS Light Path menu.
Confocor 3/BiG LSM 780
The beam path configuration for
the Confocor 3/BiG is found
under the Light Path menu in the
FCS tab
The beam path configuration for
the LSM 780 is found under the
Light Path menu in the FCS tab
Choose the excitation laser under
the “Visible Light” button. The
correct MBS for the chosen laser
line can be selected from the
MBS button
Choose the excitation laser under
the “Visible Light” button. The
correct MBS for the chosen laser
line can be selected from the
MBS button
Carl Zeiss MicroImaging, Inc. Application and Product Support
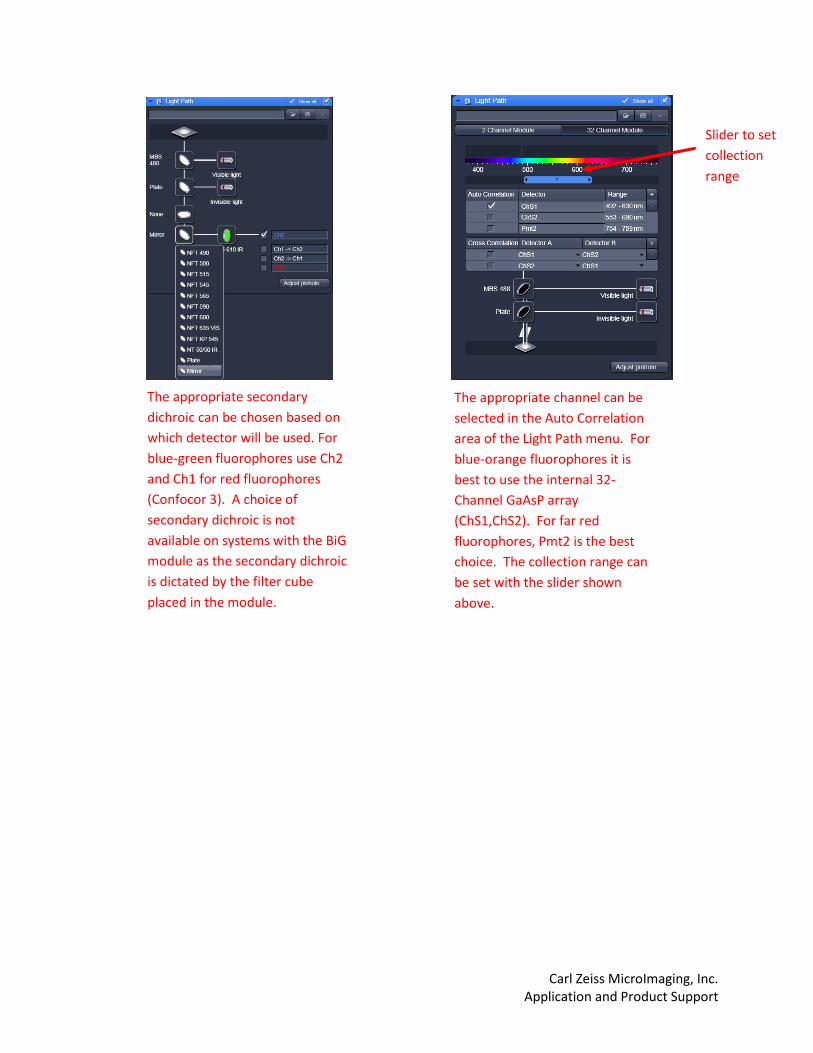
The appropriate secondary
dichroic can be chosen based on
which detector will be used. For
blue-green fluorophores use Ch2
and Ch1 for red fluorophores
(Confocor 3). A choice of
secondary dichroic is not
available on systems with the BiG
module as the secondary dichroic
is dictated by the filter cube
placed in the module.
The appropriate channel can be
selected in the Auto Correlation
area of the Light Path menu. For
blue-orange fluorophores it is
best to use the internal 32-
Channel GaAsP array
(ChS1,ChS2). For far red
fluorophores, Pmt2 is the best
choice. The collection range can
be set with the slider shown
above.
Slider to set
collection
range
Carl Zeiss MicroImaging, Inc. Application and Product Support
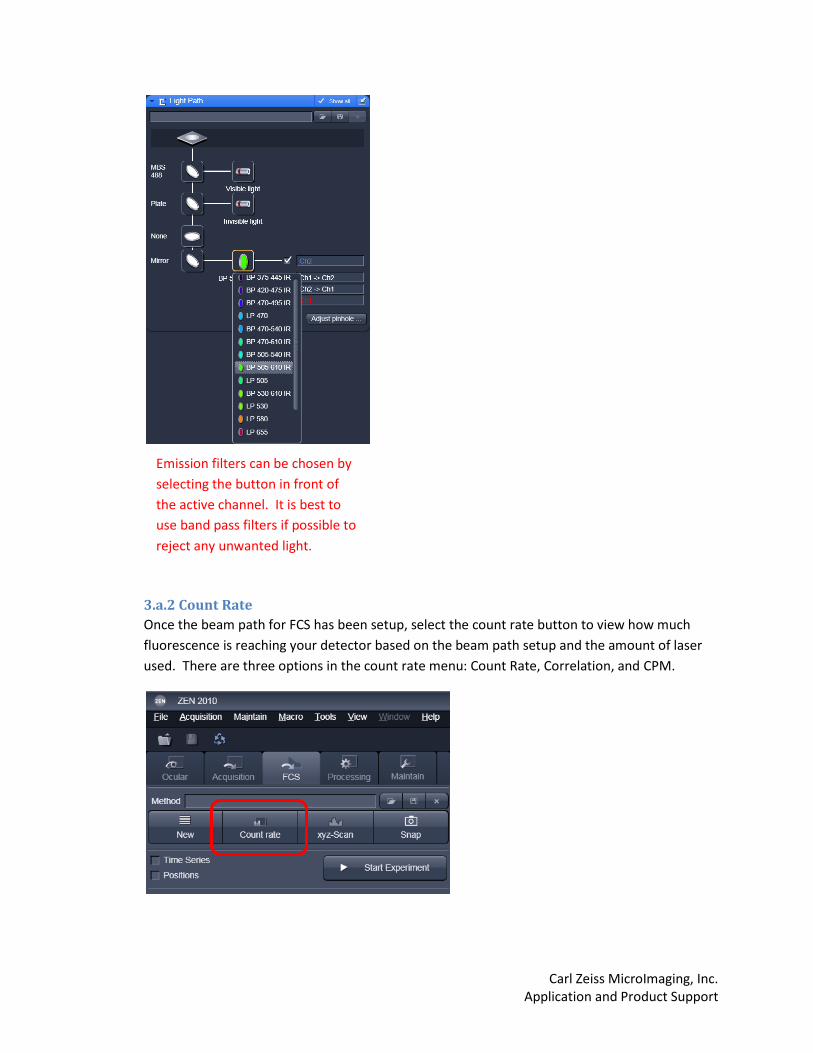
3.a.2 Count Rate
Once the beam path for FCS has been setup, select the count rate button to view how much
fluorescence is reaching your detector based on the beam path setup and the amount of laser
used. There are three options in the count rate menu: Count Rate, Correlation, and CPM.
Emission filters can be chosen by
selecting the button in front of
the active channel. It is best to
use band pass filters if possible to
reject any unwanted light.
Carl Zeiss MicroImaging, Inc. Application and Product Support
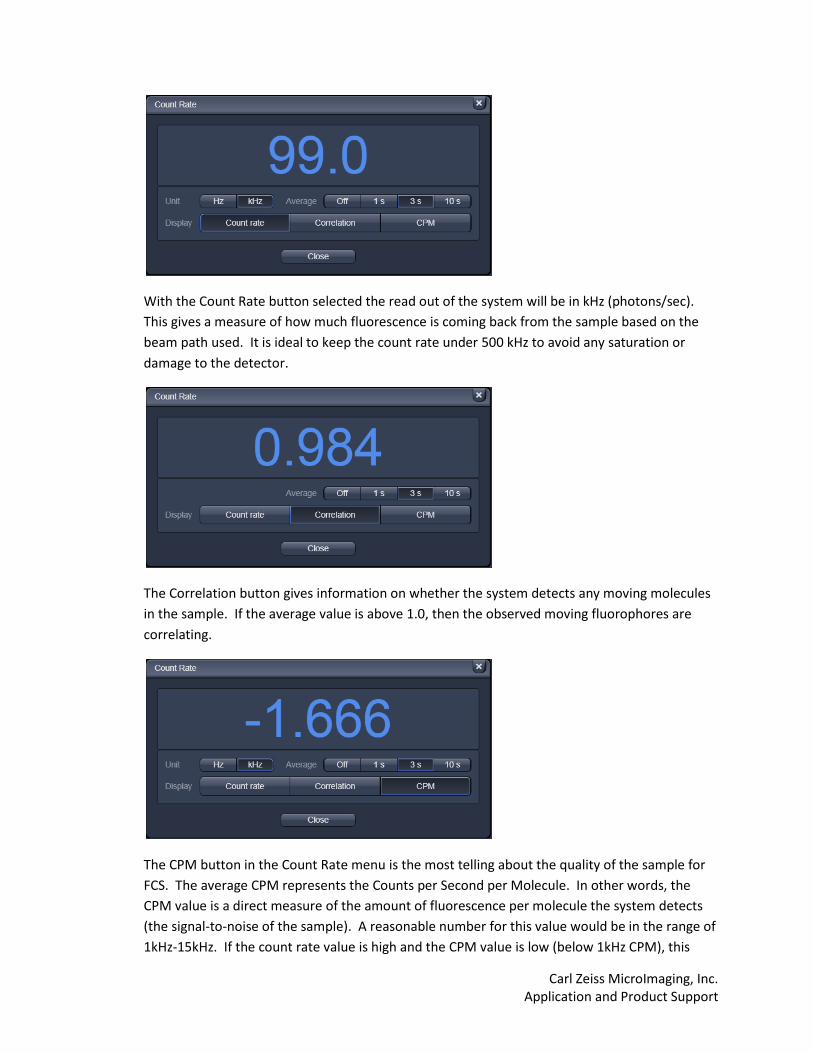
With the Count Rate button selected the read out of the system will be in kHz (photons/sec).
This gives a measure of how much fluorescence is coming back from the sample based on the
beam path used. It is ideal to keep the count rate under 500 kHz to avoid any saturation or
damage to the detector.
The Correlation button gives information on whether the system detects any moving molecules
in the sample. If the average value is above 1.0, then the observed moving fluorophores are
correlating.
The CPM button in the Count Rate menu is the most telling about the quality of the sample for
FCS. The average CPM represents the Counts per Second per Molecule. In other words, the
CPM value is a direct measure of the amount of fluorescence per molecule the system detects
(the signal-to-noise of the sample). A reasonable number for this value would be in the range of
1kHz-15kHz. If the count rate value is high and the CPM value is low (below 1kHz CPM), this
Carl Zeiss MicroImaging, Inc. Application and Product Support
indicates the sample is to concentrated for FCS. With the CPM menu open, the correction collar
of the objective should be adjusted to maximize the CPM value. This process corrects for any
variation in the coverglass thickness.
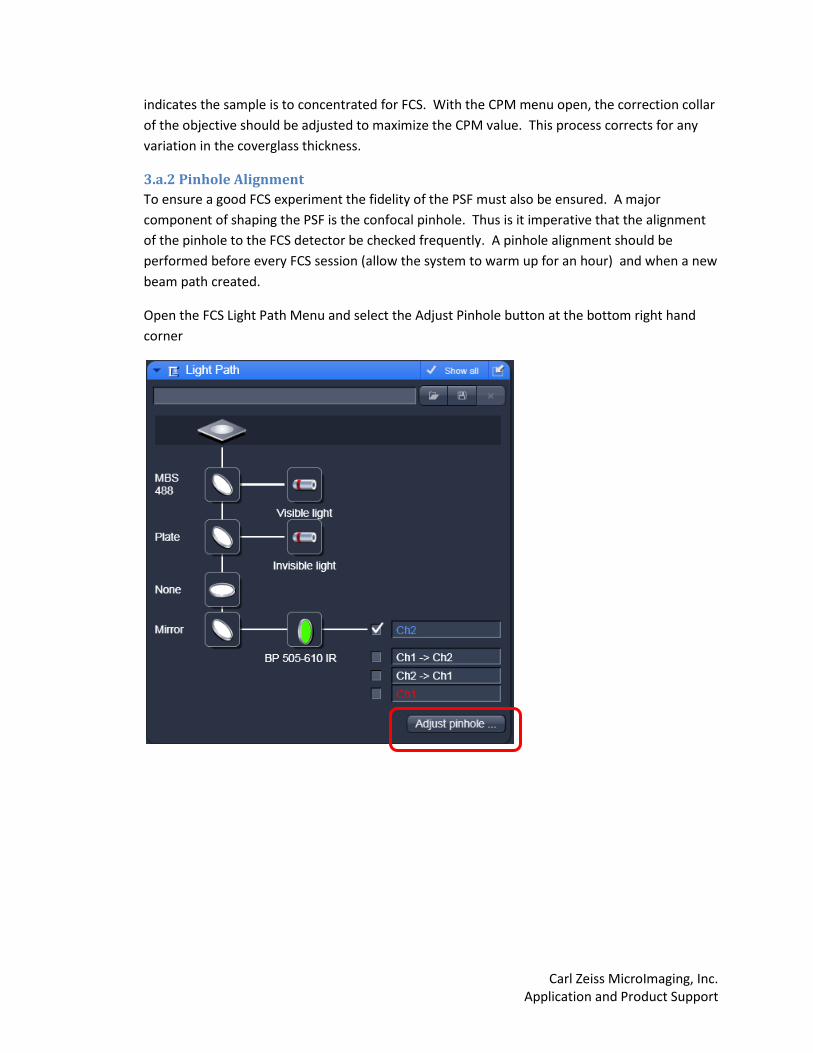
3.a.2 Pinhole Alignment
To ensure a good FCS experiment the fidelity of the PSF must also be ensured. A major
component of shaping the PSF is the confocal pinhole. Thus is it imperative that the alignment
of the pinhole to the FCS detector be checked frequently. A pinhole alignment should be
performed before every FCS session (allow the system to warm up for an hour) and when a new
beam path created.
Open the FCS Light Path Menu and select the Adjust Pinhole button at the bottom right hand
corner
Carl Zeiss MicroImaging, Inc. Application and Product Support
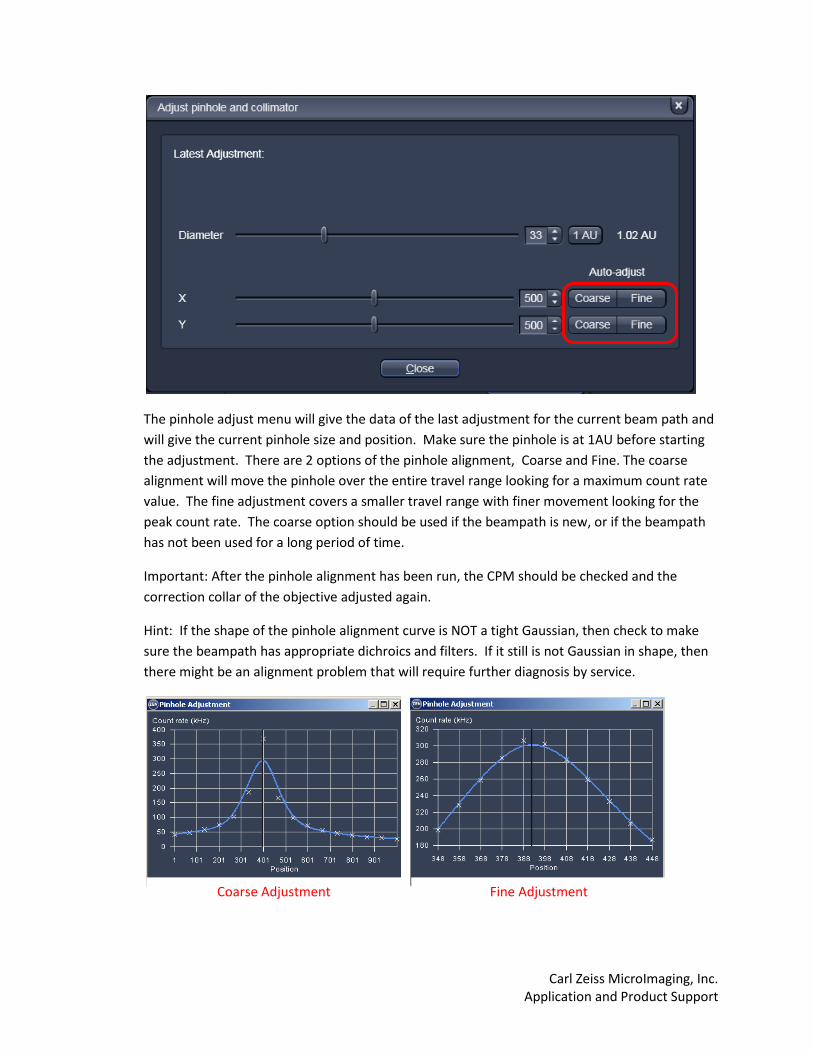
The pinhole adjust menu will give the data of the last adjustment for the current beam path and
will give the current pinhole size and position. Make sure the pinhole is at 1AU before starting
the adjustment. There are 2 options of the pinhole alignment, Coarse and Fine. The coarse
alignment will move the pinhole over the entire travel range looking for a maximum count rate
value. The fine adjustment covers a smaller travel range with finer movement looking for the
peak count rate. The coarse option should be used if the beampath is new, or if the beampath
has not been used for a long period of time.
Important: After the pinhole alignment has been run, the CPM should be checked and the
correction collar of the objective adjusted again.
Hint: If the shape of the pinhole alignment curve is NOT a tight Gaussian, then check to make
sure the beampath has appropriate dichroics and filters. If it still is not Gaussian in shape, then
there might be an alignment problem that will require further diagnosis by service.
Coarse Adjustment Fine Adjustment
Carl Zeiss MicroImaging, Inc. Application and Product Support
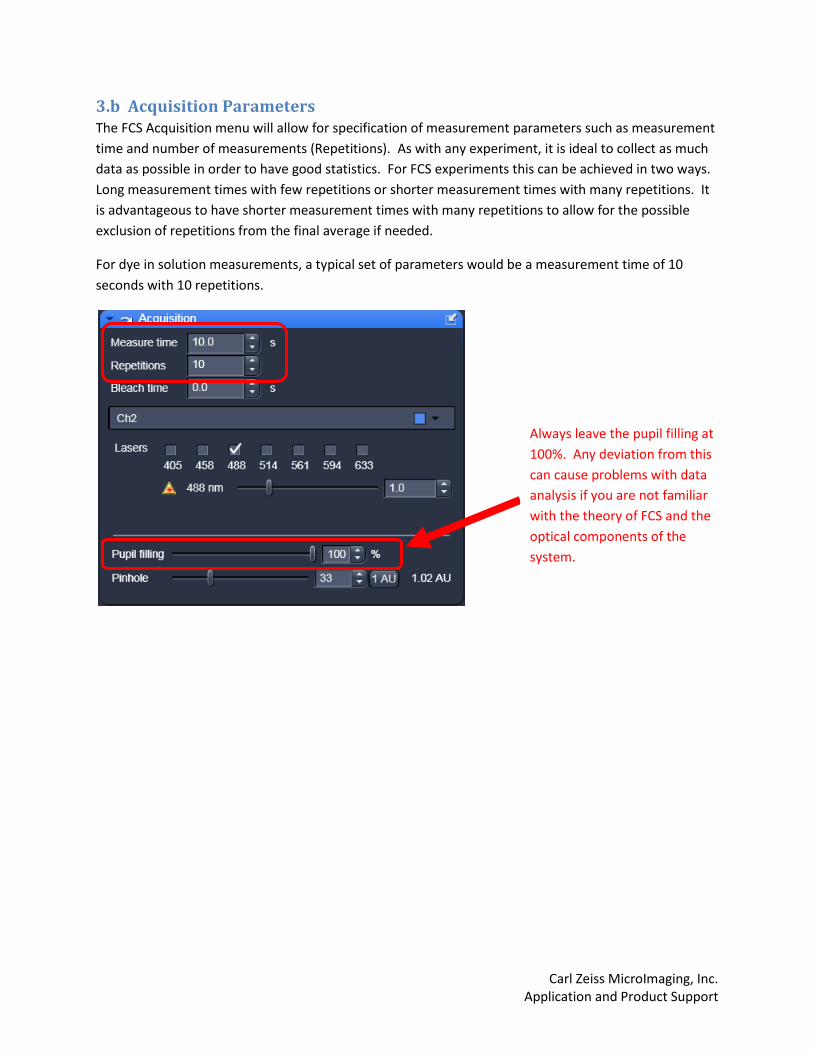
3.b Acquisition Parameters The FCS Acquisition menu will allow for specification of measurement parameters such as measurement
time and number of measurements (Repetitions). As with any experiment, it is ideal to collect as much
data as possible in order to have good statistics. For FCS experiments this can be achieved in two ways.
Long measurement times with few repetitions or shorter measurement times with many repetitions. It
is advantageous to have shorter measurement times with many repetitions to allow for the possible
exclusion of repetitions from the final average if needed.
For dye in solution measurements, a typical set of parameters would be a measurement time of 10
seconds with 10 repetitions.
Always leave the pupil filling at
100%. Any deviation from this
can cause problems with data
analysis if you are not familiar
with the theory of FCS and the
optical components of the
system.
Carl Zeiss MicroImaging, Inc. Application and Product Support
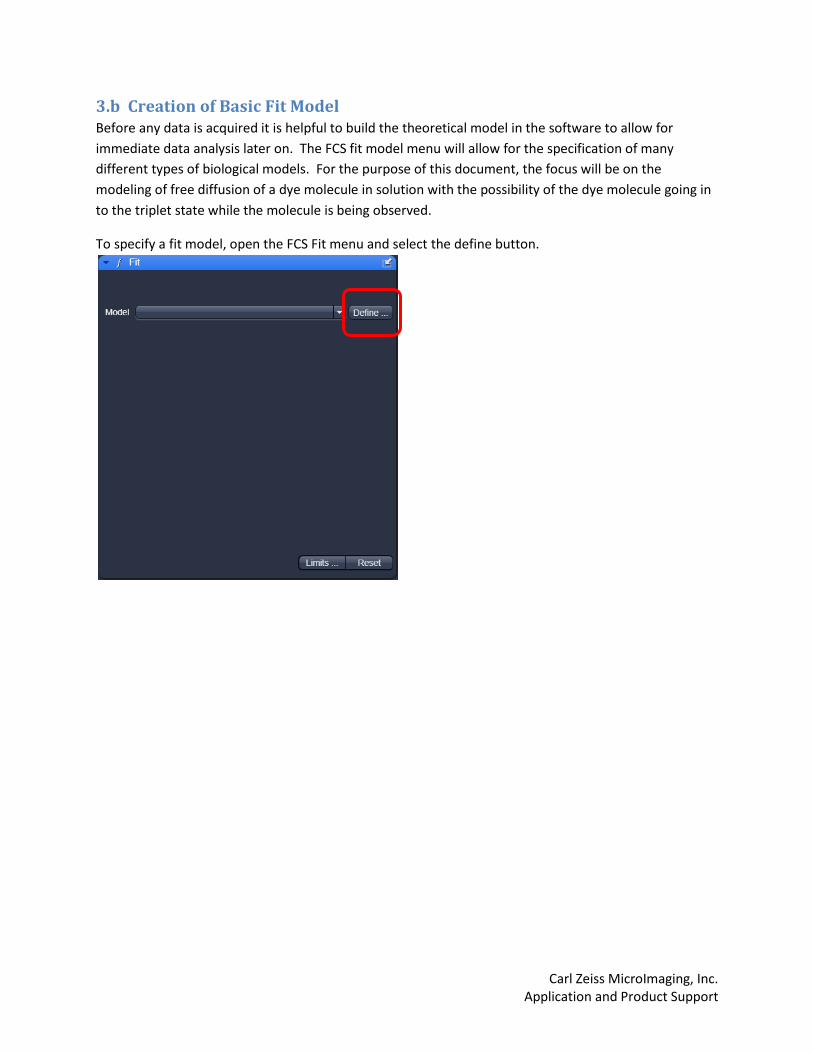
3.b Creation of Basic Fit Model Before any data is acquired it is helpful to build the theoretical model in the software to allow for
immediate data analysis later on. The FCS fit model menu will allow for the specification of many
different types of biological models. For the purpose of this document, the focus will be on the
modeling of free diffusion of a dye molecule in solution with the possibility of the dye molecule going in
to the triplet state while the molecule is being observed.
To specify a fit model, open the FCS Fit menu and select the define button.
Carl Zeiss MicroImaging, Inc. Application and Product Support
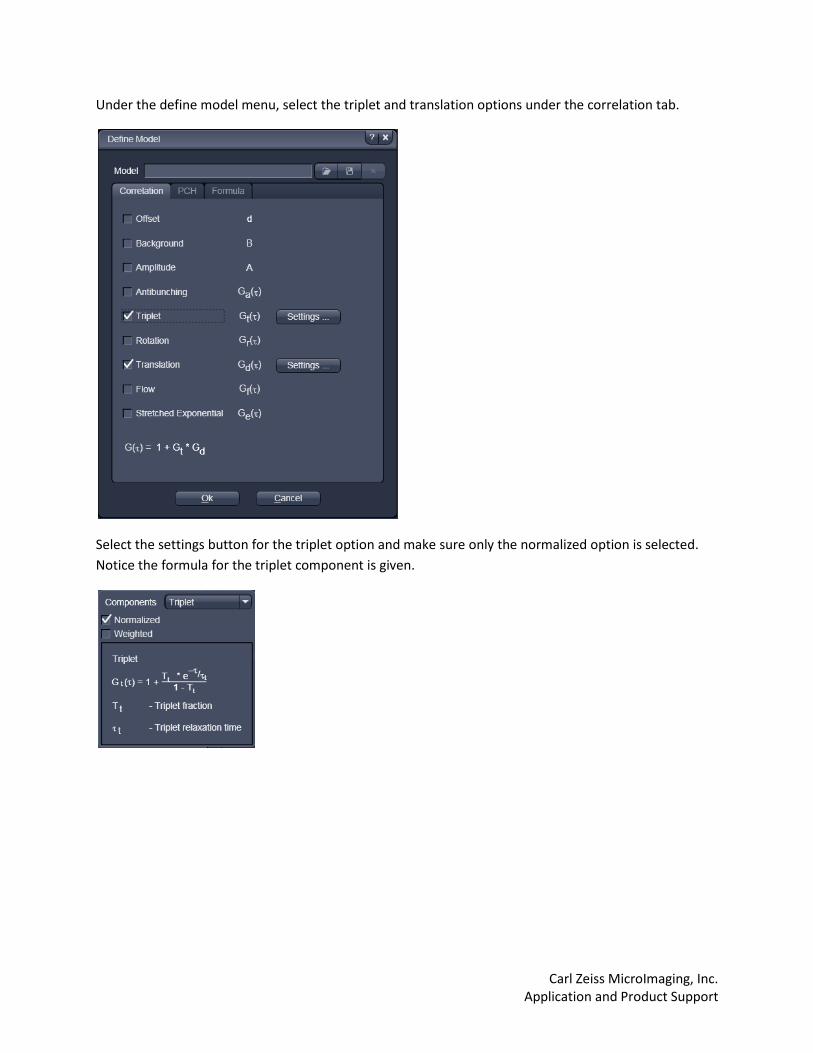
Under the define model menu, select the triplet and translation options under the correlation tab.
Select the settings button for the triplet option and make sure only the normalized option is selected.
Notice the formula for the triplet component is given.
Carl Zeiss MicroImaging, Inc. Application and Product Support
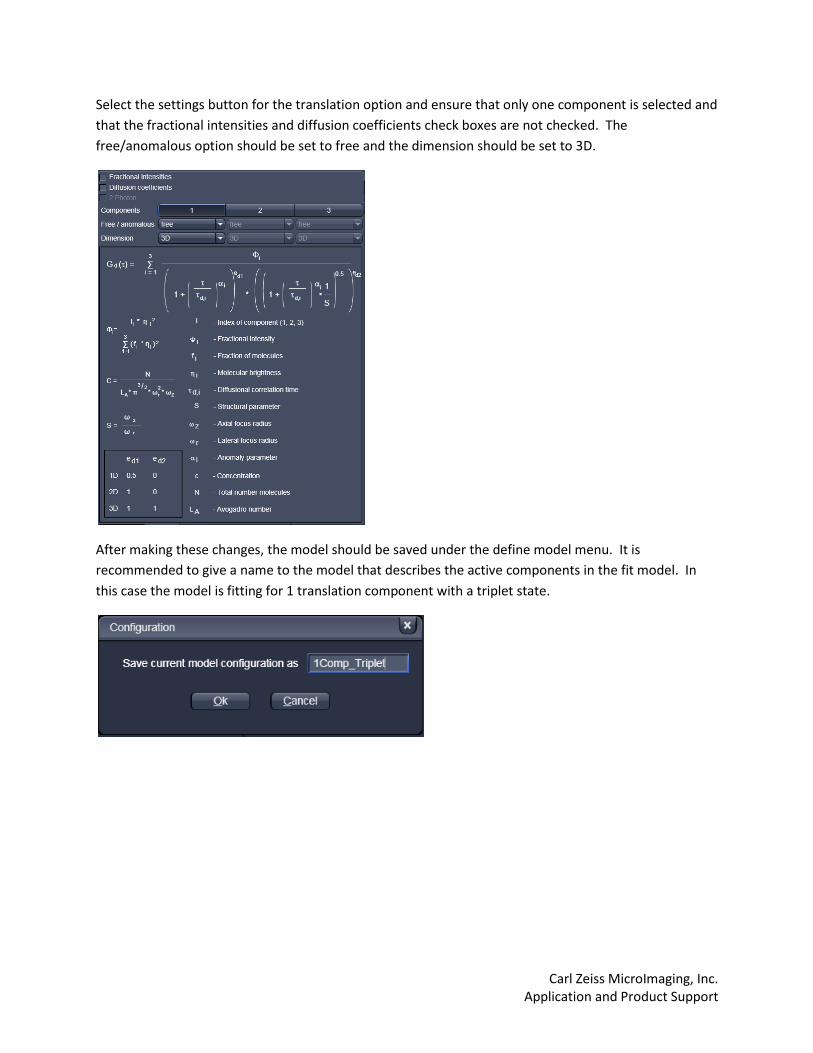
Select the settings button for the translation option and ensure that only one component is selected and
that the fractional intensities and diffusion coefficients check boxes are not checked. The
free/anomalous option should be set to free and the dimension should be set to 3D.
After making these changes, the model should be saved under the define model menu. It is
recommended to give a name to the model that describes the active components in the fit model. In
this case the model is fitting for 1 translation component with a triplet state.
Carl Zeiss MicroImaging, Inc. Application and Product Support
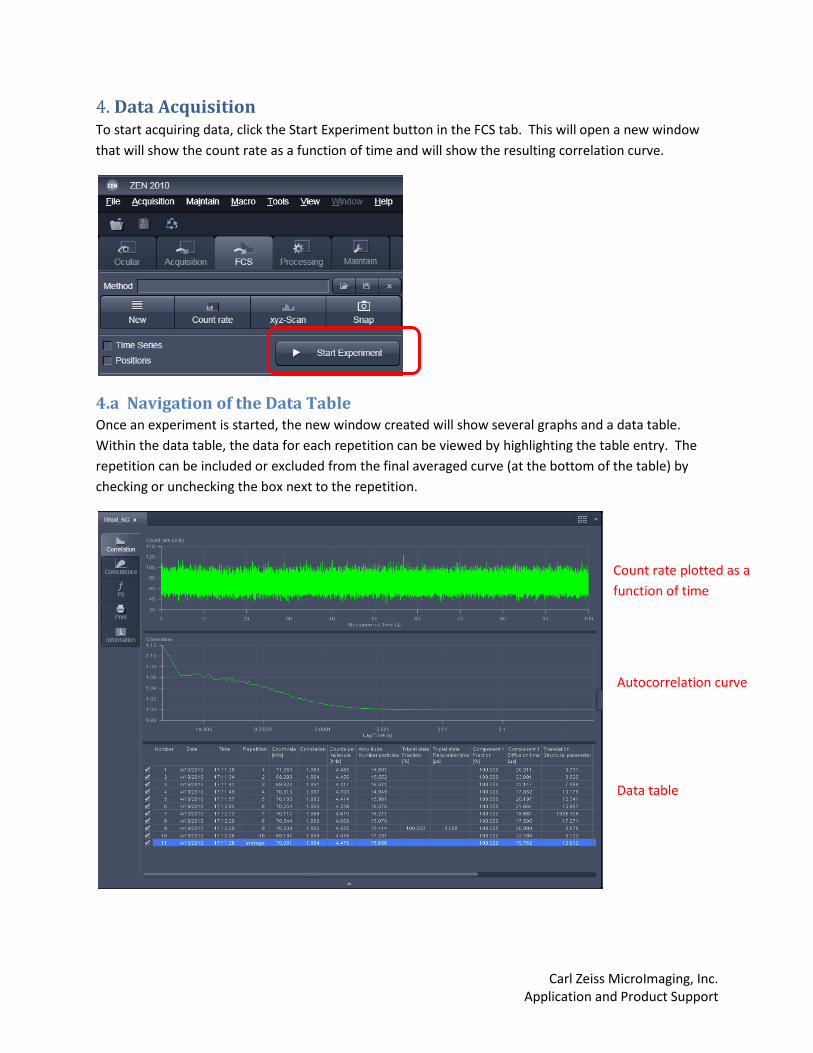
4. Data Acquisition To start acquiring data, click the Start Experiment button in the FCS tab. This will open a new window
that will show the count rate as a function of time and will show the resulting correlation curve.
4.a Navigation of the Data Table Once an experiment is started, the new window created will show several graphs and a data table.
Within the data table, the data for each repetition can be viewed by highlighting the table entry. The
repetition can be included or excluded from the final averaged curve (at the bottom of the table) by
checking or unchecking the box next to the repetition.
Count rate plotted as a
function of time
Autocorrelation curve
Data table
Carl Zeiss MicroImaging, Inc. Application and Product Support
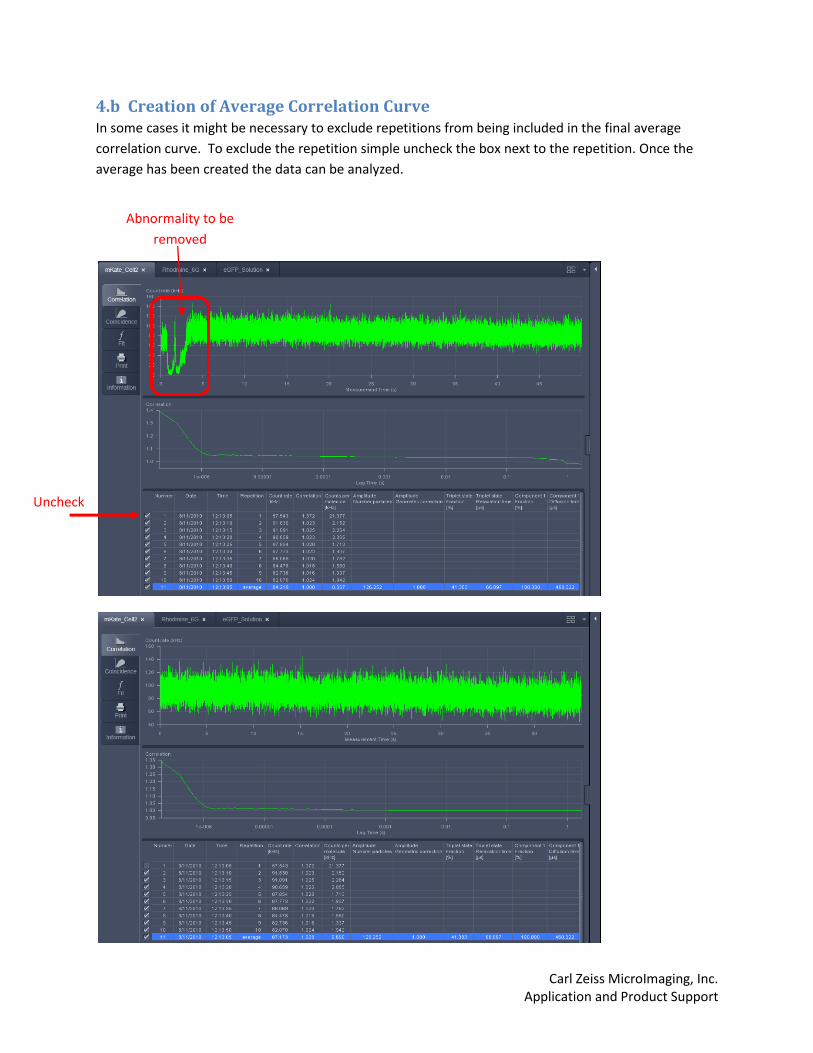
4.b Creation of Average Correlation Curve In some cases it might be necessary to exclude repetitions from being included in the final average
correlation curve. To exclude the repetition simple uncheck the box next to the repetition. Once the
average has been created the data can be analyzed.
Abnormality to be
removed
Uncheck
Carl Zeiss MicroImaging, Inc. Application and Product Support
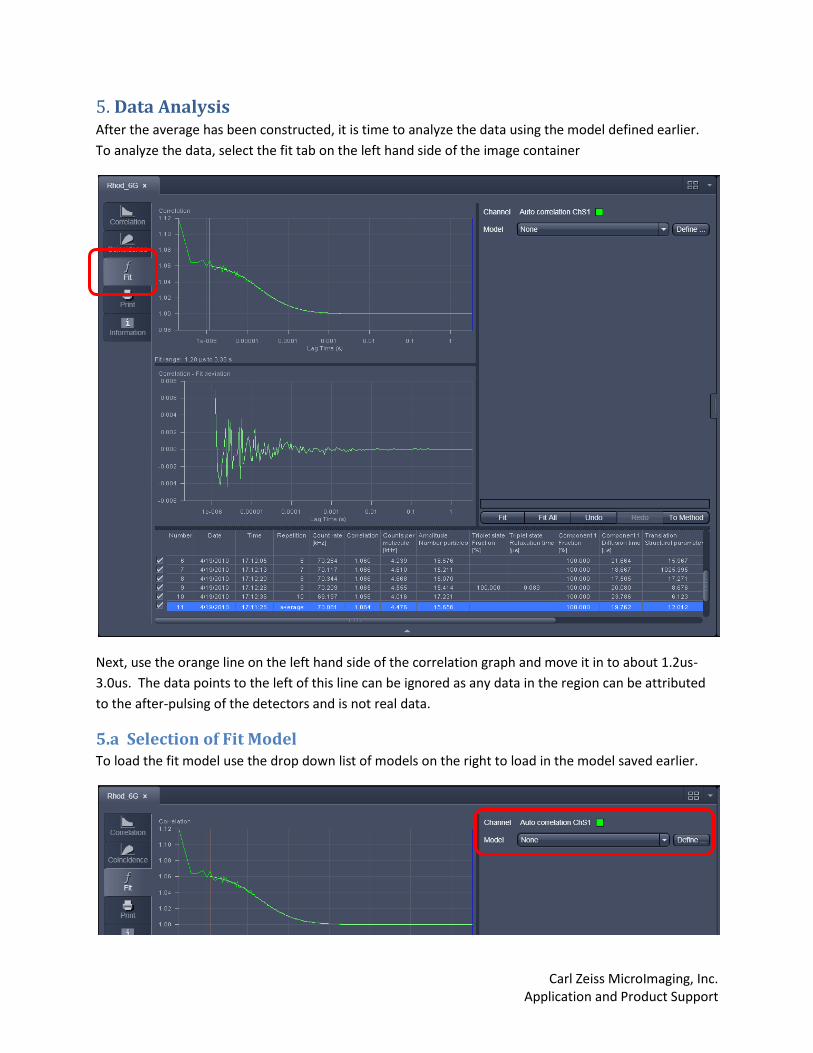
5. Data Analysis After the average has been constructed, it is time to analyze the data using the model defined earlier.
To analyze the data, select the fit tab on the left hand side of the image container
Next, use the orange line on the left hand side of the correlation graph and move it in to about 1.2us-
3.0us. The data points to the left of this line can be ignored as any data in the region can be attributed
to the after-pulsing of the detectors and is not real data.
5.a Selection of Fit Model To load the fit model use the drop down list of models on the right to load in the model saved earlier.
Carl Zeiss MicroImaging, Inc. Application and Product Support
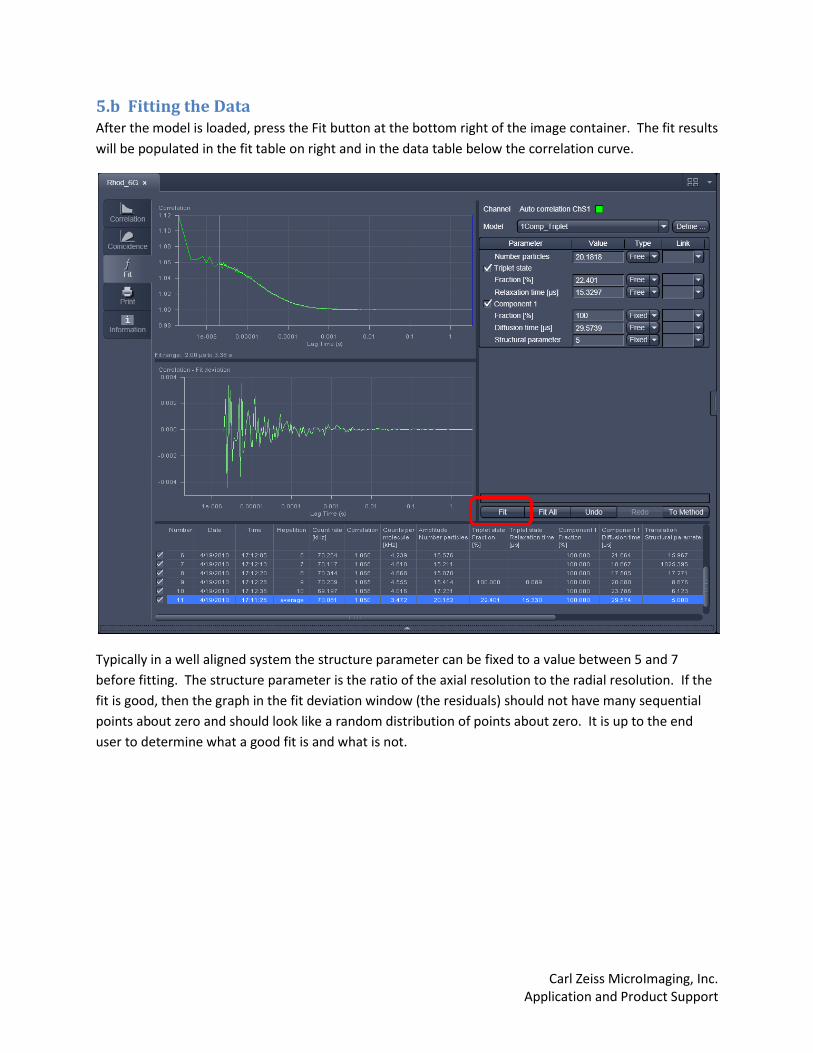
5.b Fitting the Data After the model is loaded, press the Fit button at the bottom right of the image container. The fit results
will be populated in the fit table on right and in the data table below the correlation curve.
Typically in a well aligned system the structure parameter can be fixed to a value between 5 and 7
before fitting. The structure parameter is the ratio of the axial resolution to the radial resolution. If the
fit is good, then the graph in the fit deviation window (the residuals) should not have many sequential
points about zero and should look like a random distribution of points about zero. It is up to the end
user to determine what a good fit is and what is not.


![FLIM Systems for Zeiss LSM-710 / 780 / 880 · [1] FLIM Systems for Zeiss LSM 710 / 780 / 880 family laser scanning microscopes, user handbook. 7th edition (2017), [2] FLIM systems](https://img.pdfslide.net/doc/110x75/611b3f26ede66b1f2323f888/flim-systems-for-zeiss-lsm-710-780-880-1-flim-systems-for-zeiss-lsm-710-.jpg)