Embed Size (px)
Citation preview

Half-year Financial Report
2020

Three brands. One company.Great potential.
For the brand quality, we guarantee.


Content
Introduction by the Executive Board 6IMMOFINANZ on the Capital Market 8
Group Interim Management Report Economic Overview and Property Market 12Portfolio Report 14Property Valuation 24Financing 26Business Development 30EPRA Financial Indicators 34Risk Report 38
Consolidated Interim Financial Statements Consolidated Balance Sheet 40Consolidated Income Statement 41Consolidated Statement of Comprehensive Income 42Consolidated Cash Flow Statement 43Consolidated Statement of Changes in Equity 44Notes 46
Financial Calendar 73Imprint 73
3
4 IMMOFINANZ AGHalf-year Financial Report 2020
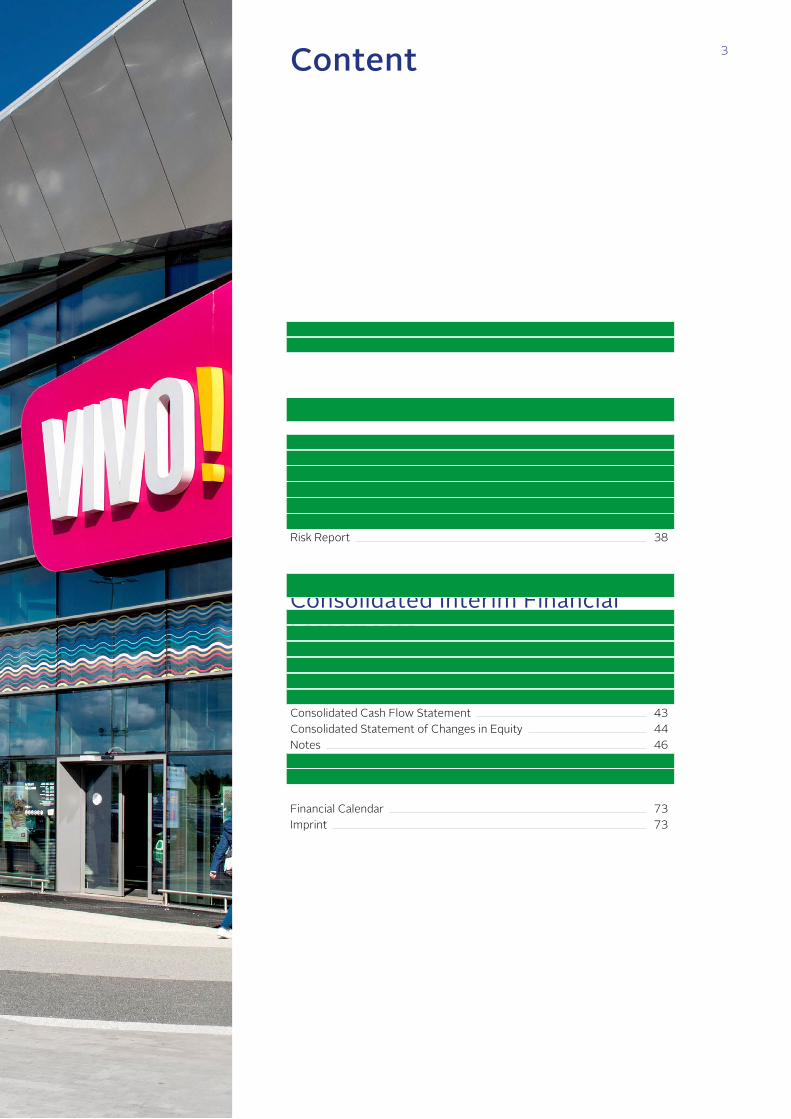
Key Figures
Earnings Q1–2 2020 Q1–2 2019 Change in % Rental income in MEUR 145.5 131.8 10.4Results of asset management in MEUR 102.8 101.0 1.8Results of property sales in MEUR -0.7 1.7 n. a.Results of property development in MEUR -16.7 14.3 n. a.Results of operations in MEUR 59.7 98.7 -39.5Revaluations in MEUR -159.2 123.5 n. a.EBIT in MEUR -83.6 203.4 n. a.Financial results in MEUR -42.4 -5.2 ≤ -100.0EBT in MEUR -126.0 198.2 n. a.Net profit for the period in MEUR -120.4 185.3 n. a.FFO 1 before tax (sustainable FFO from asset management)1 in MEUR 53.3 59.0 -9.8FFO 1 per share before tax1 in EUR 0.53 0.54 -3.0 1 See calculation in the section on "Business Development"
Assets 30 06 2020 31 12 2019 Change in % Balance sheet total in MEUR 6,185.7 6,385.1 -3.1Equity as % of the balance sheet total in % 45.0 46.0 n. a.Net financial liabilities in MEUR 2,484.1 2,483.1 0.0Cash and cash equivalents1 in MEUR 342.2 345.1 -0.8Loan-to-value ratio (net) in % 44.7 43.0 n. a.Gearing2 in % 90.0 85.3 n. a.Total average interest rate including costs for derivatives in % 1.9 1.9 n. a.Average term of financial liabilities3 in years 3.8 4.0 -6.3 1 Including cash and cash equivalents held for sale 2 The prior year ratio was adjusted. 3 The convertible bond 2024 is presented in 2022 due to a put option for the bondholders; end of the bond term in 2024.
Investment property 30 06 2020 31 12 2019 Change in % Total number of properties 212 213 -0.5Rentable space in sqm 2,007,051 2,001,063 0.3Occupancy rate in % 95.9 96.8 n. a.Gross return1 in % 6.0 6.2 n. a.Invoiced rents return1 in % 6.2 6.5 n. a.Portfolio value1 in MEUR 4,972.8 5,122.1 -2.9Unencumbered investment property in MEUR 1,381.1 1,434.0 -3.7 1 According to portfolio report
5Key Figures
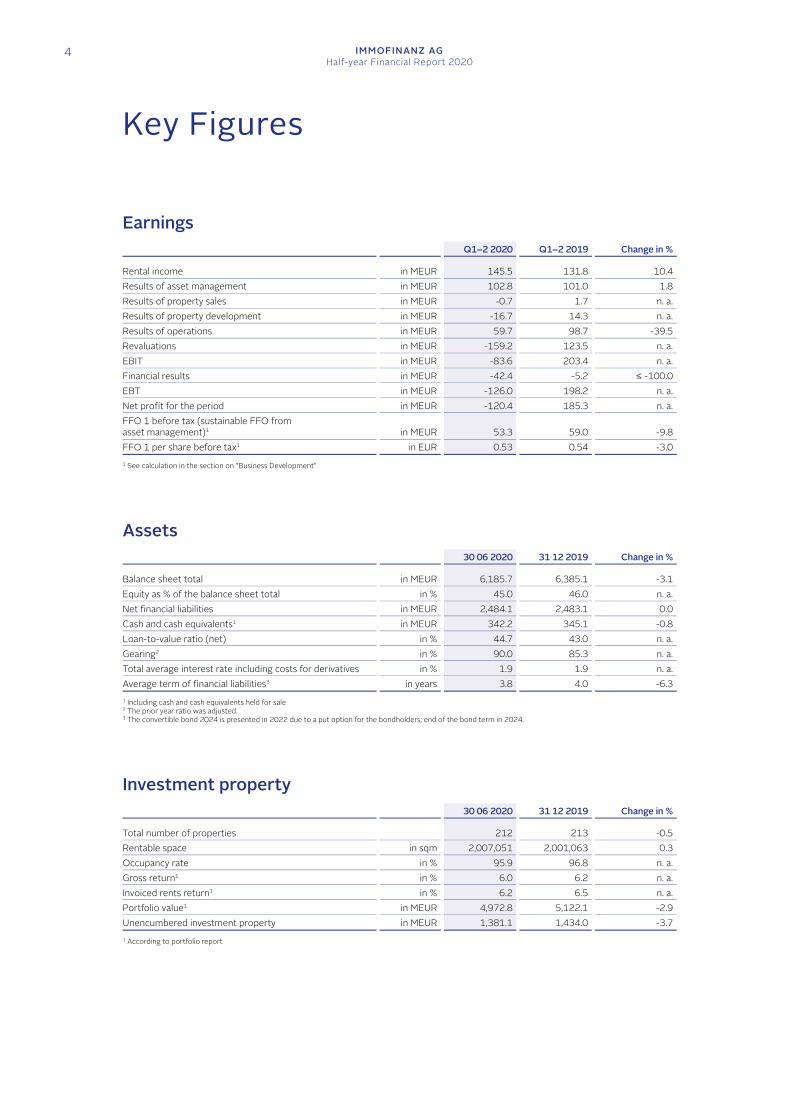
EPRA1 30 06 2020 31 12 2019 Change in % EPRA net asset value in MEUR 3,119.8 3,563.7 -12.5EPRA net asset value per share in EUR 30.93 31.05 -0.4EPRA triple net asset value in MEUR 3,080.3 3,516.1 -12.4EPRA triple net asset value per share in EUR 30.54 30.63 -0.3EPRA vacancy rate2 in % 4.0 3.2 n. a. Q1–2 2020 Q1–2 2019 Change in % EPRA earnings in MEUR 22.4 85.3 -73.7EPRA earnings per share in EUR 0.22 0.79 -71.8EPRA earnings after company-specific adjustments in MEUR 26.0 86.9 -70.1EPRA earnings per share after company-specific adjustments in EUR 0.26 0.80 -67.9EPRA net initial yield in % 5.9 5.7 n. a.EPRA capital expenditure in MEUR 57.0 174.5 -67.3 1 See calculations in the section on "EPRA financial indicators" 2 The EPRA vacancy rate is based on the ratio of the estimated market rent for the vacant space in the standing investments to the total estimated market rent for the
standing investment portfolio.
Stock exchange data 30 06 2020 31 12 2019 Change in % Book value per share in EUR 27.82 29.34 -5.2Share price at end of period in EUR 15.20 23.90 -36.4Discount of share price to EPRA NAV diluted per share in % 50.9 23.0 n. a.Total number of shares 112,085,269 112,085,269 0.0
thereof number of treasury shares 11,208,526 11,208,526 0.0Market capitalisation at end of period in MEUR 1,703.7 2,678.8 -36.4 Q1–2 2020 Q1–2 2019 Change in % Earnings per share (basic) in EUR -1.19 1.72 n. a.Earnings per share (diluted) in EUR -1.19 1.53 n. a.
The plus and minus signs assigned to the changes reflect the business point of view: improvements are shown with a plus sign (+), deteriorations with a minus sign (-). Very high positive or negative per cent changes are reported as ≥ +100% or ≤ -100%. The designation “not applicable” (n. a.) is used when there is a change in the sign (i.e. from plus to minus or from minus to plus) and for changes in percentage rates.
Rounding differences may result from the use of automatic data processing equipment for the addition of rounded amounts and percentage rates.
6 IMMOFINANZ AGHalf-year Financial Report 2020
Introduction by the Executive Board
Dear Shareholders, The Covid-19 pandemic has become a defining factor for the entire world in 2020. IMMOFINANZ started the year with good operational performance, but we were slowed by the crisis beginning in mid-March. Wide-ranging economic restrictions and the shutdown of public life have triggered the strongest recession since World War II and confronted our company with numerous challenges. The government-ordered measures to contain Covid-19 led to the temporary shutdown of retail facilities in all countries where IMMOFINANZ owns and operates properties – which naturally had a negative effect on our results for the first half-year.
However, exactly the strengths that have made IMMOFINANZ one of the leading providers of office and retail properties in our region are now helping us to master the crisis: our high-quality, innovative office solutions and cost-efficient, comparatively crisis-resistant retail concepts, our focus on customers, the commitment of our employees and our conservative financing policy.
Immediately at the start of the crisis, we introduced numerous measures to minimise the negative effects on our company and strengthen our liquidity. These activities include, among others, the postponement of non-essential investments and the reduction of costs as well as the conclusion of a revolving credit line of EUR 100 million.
We take our responsibility towards our tenants, their employees and customers very seriously. Individual solutions were quickly developed with our retail tenants to help them overcome the crisis. In exchange for the temporary reduction or deferral of rental payments, agreements were reached, among others, for contract extensions. Nearly 95% of these negotiations were finalised by mid-August. Extensive security measures and marketing activities were also implemented to support the rapid recovery of visitor frequencies.
IMMOFINANZ office tenants received support with back-to-office plans for their safe and smooth return to work. In addition, we will be offering flexible “all inclusive“ office solutions beginning in September. They will give our tenants the option to rent space or individual workstations, also on a short-time basis. The “all inclusive“ offering, just like at a vacation hotel, also includes a wide variety of services for our customers – from occupancy planning to cleaning and the organisation of coffee machines and plant care. Our customers can then concentrate on their core business in a modern office environment.
Improvement in visitor frequency The latest developments are as follows: All our retail areas have reopened with only a few exceptions, which primarily involve restaurants and movie theatres in Romania and Serbia. Visitor frequency has recovered well, above all in the STOP SHOPs, and on individual days at the same level as in the comparable period in 2019. This also underscores the competitive advantage of our retail parks with their focus on everyday products and one-stop shopping with direct access to the stores from the parking areas and lower number of contact points to other people. Visitor frequency in the VIVO! shopping centers is still roughly 20% below the level at the beginning of the year, but the trend here is also moving in the right direction. The development of our retailers’ revenues also indicates that consumers are shopping less often but spending more per shopping trip. An analysis of the first six months of 2020 shows that the number of visitors in the STOP SHOP retail parks is roughly 24% lower year-on-year, but retailers’ revenues have only declined by roughly 13% – and this is due, above all, to the phase of government-ordered shutdowns.
Capital strengthened On the capital side, we also acted quickly and proactively: In order to strengthen equity and the indicators which are important for our investment grade rating, we placed 11.2 million new shares and 4.2 million treasury shares and also issued a mandatory convertible bond in July – shortly after the end of the reporting period. The gross proceeds totalled approximately EUR 356 million and will be used to refinance financial
7Key Figures
liabilities, to utilise potential growth opportunities and for general corporate purposes. For example: retail financing of roughly EUR 79 million has already been repaid.
Results for the first half-year IMMOFINANZ’s results for the first half-year, which we are presenting with this report, include a 10.4% increase in rental income to EUR 145.5 million which is based on portfolio growth during the second half of 2019. However, a crisis-related increase in the write-off of tenant receivables led to substantially higher property expenses. The results of asset management still improved by 1.8% to EUR 102.8 million. The pandemic also influenced the valuation of our properties: revaluations totalled EUR -159.2 million and represented 3.1% of the total property portfolio at the end of June. Net profit amounted to EUR -120.4 million, and FFO 1 (before tax) was 9.8% lower year-on-year at EUR 53.3 million. However, FFO 1 is slightly higher than the first half of 2019 if the January coupon payment for our corporate bond is spread over the entire year.
Our balance sheet structure is robust, with liquidity of roughly EUR 342 million and an unused credit line of EUR 100.0 million at the end of June. This strength is underscored by an equity ratio of 45.0% and net LTV of 44.7%. These indicators were reinforced by the capital measures carried out in July.
Outlook IMMOFINANZ is very well positioned with a solid financial base, but uncertainty remains high over the further development of the Covid-19 pandemic as well as possible future containment measures and their effects on the economy and financing environment. We have therefore decided not to issue any guidance on the development of FFO 1 during the full twelve months of 2020 at the present time.
In light of the recent events and after careful consideration of all circumstances known at the present time and the possible consequences of the Covid-19 pandemic, the Executive Board and Supervisory Board of IMMOFINANZ approved a recommendation to the annual general meeting on 1 October 2020 which calls for the waiver of a dividend for the 2019 financial year and the carry forward of balance sheet profit. This recommendation does not represent a departure from the continuous dividend policy generally followed by IMMOFINANZ, but is intended to preserve the company’s capital strength in view of the exceptional situation caused by the Covid-19 pandemic.
We are living in extraordinary times which are characterised by significant uncertainty over further recovery. With a view towards the long-term development of our company, we are therefore convinced that we must act cautiously and protect IMMOFINANZ’s ability to act from a position of strength during the crisis as well as the ability to utilise attractive opportunities and quickly return to a profitable growth course with acquisitions and development projects.
Vienna, 26 August 2020
The Executive Board
Ronny Pecik CEO
Stefan Schönauer CFO
Dietmar Reindl COO
IMMOFINANZ AGHalf-year Financial Report 2020
8
IMMOFINANZ on the Capital Market
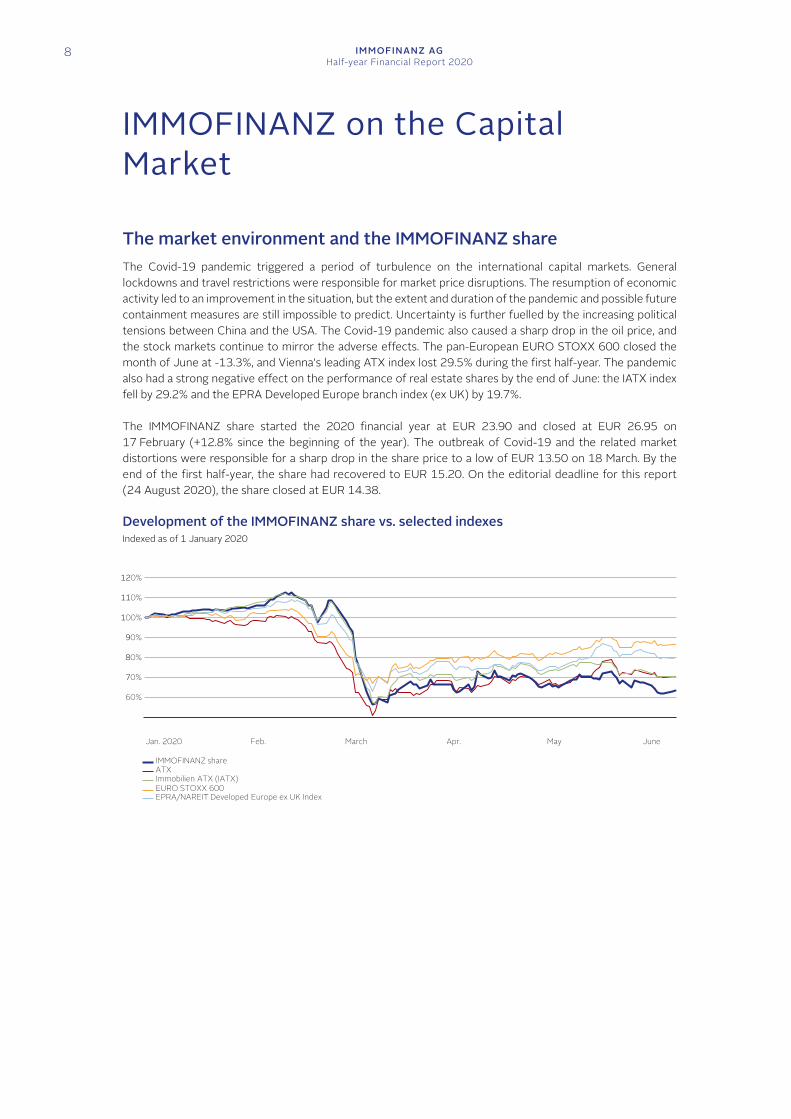
The market environment and the IMMOFINANZ share The Covid-19 pandemic triggered a period of turbulence on the international capital markets. General lockdowns and travel restrictions were responsible for market price disruptions. The resumption of economic activity led to an improvement in the situation, but the extent and duration of the pandemic and possible future containment measures are still impossible to predict. Uncertainty is further fuelled by the increasing political tensions between China and the USA. The Covid-19 pandemic also caused a sharp drop in the oil price, and the stock markets continue to mirror the adverse effects. The pan-European EURO STOXX 600 closed the month of June at -13.3%, and Vienna’s leading ATX index lost 29.5% during the first half-year. The pandemic also had a strong negative effect on the performance of real estate shares by the end of June: the IATX index fell by 29.2% and the EPRA Developed Europe branch index (ex UK) by 19.7%.
The IMMOFINANZ share started the 2020 financial year at EUR 23.90 and closed at EUR 26.95 on 17 February (+12.8% since the beginning of the year). The outbreak of Covid-19 and the related market distortions were responsible for a sharp drop in the share price to a low of EUR 13.50 on 18 March. By the end of the first half-year, the share had recovered to EUR 15.20. On the editorial deadline for this report (24 August 2020), the share closed at EUR 14.38.
Development of the IMMOFINANZ share vs. selected indexes Indexed as of 1 January 2020
ATXIMMOFINANZ share
Immobilien ATX (IATX)EURO STOXX 600
Jan. 2020 Feb. March Apr. May June
EPRA/NAREIT Developed Europe ex UK Index
90%
80%
70%
60%
100%
110%
120%
9IMMOFINANZ on the Capital Market
Performance comparison 1 January to 30 June 2020 in % IMMOFINANZ share -36.4ATX -29.5Immobilien ATX -29.2EURO STOXX 600 -13.3EPRA/NAREIT Developed Europe (ex UK) -19.7
Key data on the share
ISIN AT0000A21KS2Segment ATX, WIGReuters IMFI.VIBloomberg IIA:AVFinancial year 2020 1 January to 31 December
Information on the IMMOFINANZ share 30 06 2020 31 12 2019 Change in % Book value per share in EUR 27.82 29.34 -5.2EPRA net asset value per share1 in EUR 30.93 31.05 -0.4EPRA triple net asset value per share1 in EUR 30.54 30.63 -0.3FFO 1 per share before tax2 in EUR 0.53 0.54 -3.0Share price at end of period in EUR 15.20 23.90 -36.4Share price high based on the closing rate in EUR 26.95 26.30 2.5Share price low based on the closing rate in EUR 13.50 21.08 -36.0Discount of share price to EPRA NAV diluted per share in % 50.9 23.0 n. a.Total number of shares 112,085,269 112,085,269 0.0
thereof treasury shares 11,208,526 11,208,526 0.0Market capitalisation at the end of the period in MEUR 1,703.7 2,678.8 -36.4Free float3 in % ca. 67 ca. 72 n. a. 1 See the calculation under "EPRA Financial Indicators". 2 See the calculation under "Business Development". 3 Calculation method as defined by the Vienna Stock Exchange, Prime Market rules
Share capital and capital measures The share capital of IMMOFINANZ AG remained unchanged at EUR 112.1 million as of 30 June 2020 and was divided into 112,085,269 bearer shares. Shortly after the end of the reporting period, in July 2020, IMMOFINANZ completed a successful share placement (11,208,526 shares from authorised capital and 4,210,298 treasury shares) and the issue of a mandatory convertible bond. The gross issue proceeds totalled EUR 356.1 million. A detailed description of the capital measures is provided in the section on “Financing“. Including these capital measures, share capital currently equals EUR 123.3 million and is divided into 123,293,795 bearer shares. The number of treasury shares equals 6,998,228, or approximately 5.68% of share capital after the cash capital increase.
Annual general meeting and distribution policy In view of the ongoing high uncertainty connected with Covid-19, the Executive Board of IMMOFINANZ has decided to hold the 27th annual general meeting on 1 October as a virtual annual general meeting.
Dividend policy After careful consideration of all circumstances known at the present time and the possible consequences of the Covid-19 pandemic, the Executive Board and Supervisory Board of IMMOFINANZ approved a recommendation to the annual general meeting on 1 October 2020 which calls for the waiver of a dividend for the 2019 financial year and the carry forward of balance sheet profit. This recommendation does not represent a departure from the continuous dividend policy generally followed by IMMOFINANZ, but is intended to preserve the company’s capital strength in view of the exceptional situation caused by the Covid-19 pandemic.
IMMOFINANZ AGHalf-year Financial Report 2020
10
Change on the Supervisory Board On 4 March 2020, Rudolf Fries announced his intention to resign from the Supervisory Board. Mr. Fries informed the company on 28 February 2020, as previously reported, that he had sold the shares attributable to him. Bettina Breiteneder succeeded Rudolf Fries as Vice-Chairwoman of the Supervisory Board. The Supervisory Board currently consists of five shareholder representatives (Michael Knap, Bettina Breiteneder, Christian Böhm, Nick J. M. van Ommen and Sven Bienert) as well as one representative delegated by the Works’ Council (Philipp Obermair).
Change on the Executive Board – new CEO Following the resignation of Oliver Schumy from the Executive Board by mutual agreement as of 18 March 2020, the Supervisory Board appointed Ronny Pecik to the Executive Board of IMMOFINANZ AG for three years beginning on 4 May 2020. Mr. Pecik serves as CEO.
In addition, the Supervisory Board extended the terms of office for COO Dietmar Reindl and CFO Stefan Schönauer for a further five years as of 1 May 2021, i.e. to 30 April 2026. The Executive Board consists of Ronny Pecik (CEO), Dietmar Reindl (COO) and Stefan Schönauer (CFO).
Shareholder structure IMMOFINANZ shares are widely held: the largest shareholder groups are fixed ownership investors and private investors in Austria as well as long-term institutional investors from Europe and the USA. Free float (based on the definition issued by the Vienna Stock Exchange for the Prime Market segment) equalled roughly 67% as of 30 June 2020. Including the recently executed capital measures, free float equalled 65% at the end of July 2020.
The following shareholders held over 4% as of 30 June 2020:
Voting rights in % (basis: share capital
as of 30 06 2020) Last
reporting date S IMMO AG (via CEE Immobilien GmbH)1 11.9 27 03 2018RPPK Immo GmbH (formerly CARPINUS Holding GmbH)2 10.7 28 02 2020 1 Includes shares and other financial instruments of IMMOFINANZ 2 Indirect control (according to the Austrian Stock Exchange Act): Ronny Pecik and Peter Korbačka; includes other financial instruments
In July 2020, i.e. after the end of the reporting period, IMMOFINANZ was informed that RPPK Immo GmbH had purchased 1.0 million shares and five certificates from the mandatory convertible bond (currently convertible into approximately 29,159 shares). RPR Treasury GmbH, which is indirectly controlled by Ronny Pecik, announced the purchase of 700,000 shares. Furthermore, IMMOFINANZ was informed that Tomas Krsek holds 7.48% of voting rights in total through Tahoe Invest a.s. and WXZ1 a.s (basis: share capital after the capital increase in July 2020; thereof 6.61% via shares and 0.88% via the mandatory convertible bond).
There are no other reports of shareholdings over or under the reporting thresholds.
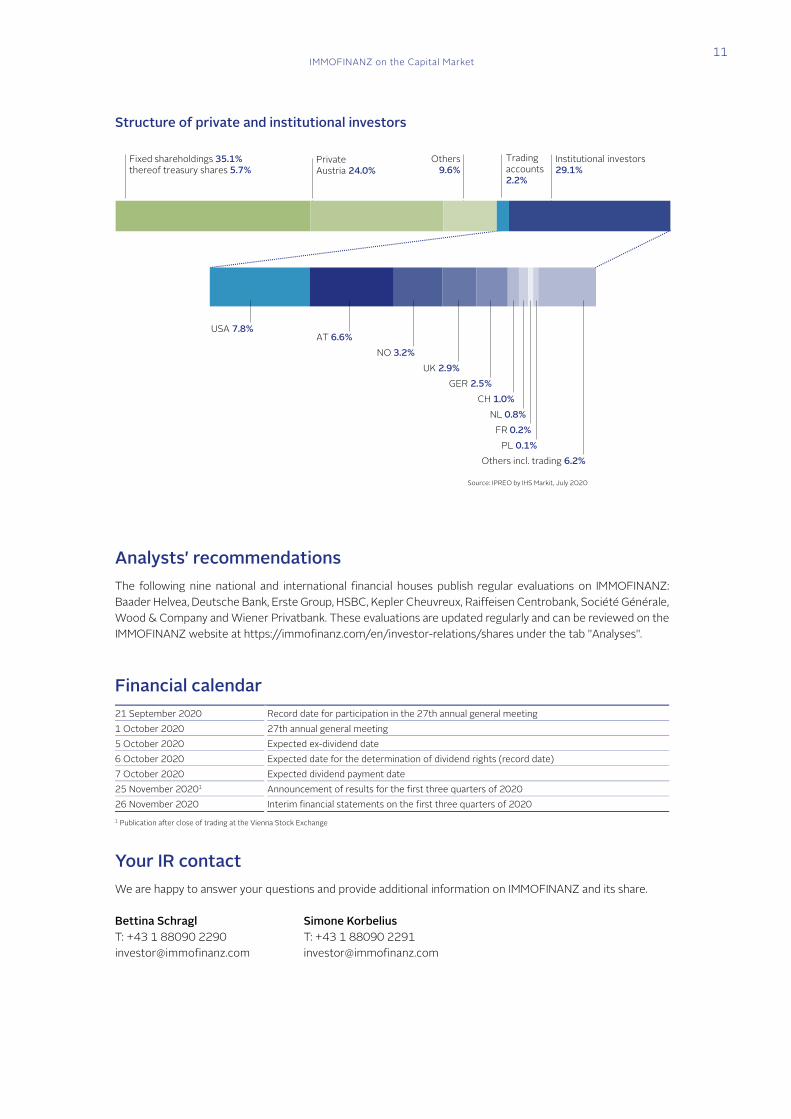
Detailed analysis Regular shareholder surveys help us to define the regional focal points for investor relations activities. The latest survey was carried out in July 2020 and can be summarised as follows: 24.0% of IMMOFINANZ shares are held by private investors in Austria. Institutional investors hold 29.1% of the free float shares, whereby most come from the USA (7.8%), Austria (6.6%) and Norway (3.2%). Fixed shareholdings by investors represent 29.4%, while a further 5.7% are treasury shares, which are also attributed to fixed shareholdings based on the free float definition of the Vienna Stock Exchange. The remaining 9.6% are unidentified investors or shares held by foreign private investors. A 2.2% component is attributable to trading accounts.
According to the Austrian Stock Exchange Act
IMMOFINANZ on the Capital Market 11
Structure of private and institutional investors
Analysts' recommendations The following nine national and international financial houses publish regular evaluations on IMMOFINANZ: Baader Helvea, Deutsche Bank, Erste Group, HSBC, Kepler Cheuvreux, Raiffeisen Centrobank, Société Générale, Wood & Company and Wiener Privatbank. These evaluations are updated regularly and can be reviewed on the IMMOFINANZ website at https://immofinanz.com/en/investor-relations/shares under the tab "Analyses".
Financial calendar 21 September 2020 Record date for participation in the 27th annual general meeting 1 October 2020 27th annual general meeting 5 October 2020 Expected ex-dividend date 6 October 2020 Expected date for the determination of dividend rights (record date) 7 October 2020 Expected dividend payment date 25 November 20201 Announcement of results for the first three quarters of 2020 26 November 2020 Interim financial statements on the first three quarters of 2020 1 Publication after close of trading at the Vienna Stock Exchange
Your IR contact We are happy to answer your questions and provide additional information on IMMOFINANZ and its share.
Bettina Schragl Simone Korbelius T: +43 1 88090 2290 T: +43 1 88090 2291 [email protected] [email protected]
Fixed shareholdings 35.1%thereof treasury shares 5.7%
Private Austria 24.0%
Others9.6%
Institutional investors29.1%
USA 7.8%AT 6.6%
NO 3.2%UK 2.9%
GER 2.5%CH 1.0%
NL 0.8%FR 0.2%
PL 0.1%Others incl. trading 6.2%
Source: IPREO by IHS Markit, July 2020
Trading accounts2.2%
IMMOFINANZ AGHalf-year Financial Report 2020
12
Economic Overview and Property Markets The Covid-19 pandemic has triggered a wave of strong negative effects on the global economy which include a pronounced recession. The lockdowns brought a large part of the world’s economic activity to an unparalleled standstill: consumers stayed home, companies lost revenue and terminated employees – which, consequently, led to a sharp rise in unemployment. Rescue packages by national governments and the EU as well as supporting monetary policies by the ECB have been implemented to moderate the economic impact of the pandemic. However, the scope and duration of the pandemic and possible future containment measures are still impossible to predict.
The pandemic had already caused far-reaching economic effects in the first quarter of 2020, even though most countries only began to enforce curfews in mid-March. The second quarter of 2020 brought a much longer interruption in economic activity as well as widespread curfews, and economic output in the eurozone fell by 12.1% during this period. Growth has also been weakened by the higher savings rate of private households.
In its July 2020 summer forecast, the European Commission points to a contraction of 8.7% for the eurozone economy in 2020 but a return to growth of 6.1% in 2021. The EU economy, in total, is projected to decline by 8.3% in 2020 and increase by 5.8% in 2021. The Commission notes, however, that these forecasts are connected with extremely high risks – above all, downward risks. They are based on the assumptions that measures will be continuously eased and a second wave of infections will not materialise. Additional significant risks involve the possibility of longer-than-expected unfavourable developments on the employment market and liquidity shortages for many companies that would endanger their solvency.
Unemployment in the EU rose to 7.0% at the end of the second quarter, but with substantial geographic differences. In the eurozone, the unemployment rate equalled 7.8%. The coming months could also see a further increase in unemployment rates.
Consumer price inflation in the EU presented a mixed picture at the end of the second quarter. High inflation rates were recorded in Poland (3.8%), the Czech Republic (3.4%) and Hungary (2.9%), but Germany failed to show any inflationary effects in June and Slovenia measured deflation of 0.3%. The inflation rate in Austria equalled 1.1% in June.
Transaction and rental market The effects of the Covid-19 pandemic are also clearly visible on the real estate market. Commercial property transactions in Europe totalled EUR 43.9 billion in the second quarter of 2020, for a year-on-year decline of 38%. Lower declines were recorded in the IMMOFINANZ core countries of Germany (-20%), Austria (-16%)
Group Interim Management Report
GROUP INTERIM MANAGEMENT REPORTEconomic Overview and Property Markets
13
and the CEE region (-13%). In spite of this negative second quarter, the transaction volume – which equalled EUR 332.3 billion based on a moving annual average – was still 10% higher year-on-year. Experts expect stable development on the transaction markets during the second half of 2020. The monetary support measures implemented by the ECB are intensifying the low-interest environment which, in turn, will benefit the real estate market. Furthermore, there have been no signs of wide-ranging emergency property sales to date.
The transaction volume on the commercial property market in Germany fell by roughly 20% to EUR 13.6 billion in the second quarter. However, the volume over the past twelve months was 32% higher year-on-year at EUR 94.5 billion. The prime yield for office properties equals 3.0% in Düsseldorf, while the lowest yields in the top seven cities are currently recorded in Munich and Berlin with 2.6%.
In Austria, commercial property transactions totalled EUR 1.0 billion in the second quarter of 2020. This represents a Covid-19-related, year-on-year decline of roughly 16%. Prime yields are stable at 3.45% on the Vienna office market and equal roughly 5% for retail parks.
The transaction markets in the CEE region differ by country. First half-year increases were recorded in the Czech Republic with +74% to EUR 1.9 billion, Slovakia with +66% to EUR 432 million and Romania with +17% to EUR 395 million. Lower transaction volumes were reported in Poland with -9.3% to EUR 2.9 billion and Hungary with -12% to EUR 500 million. Investors' preferences were more consistent: office properties were the most popular asset class in nearly all markets. These properties represented 88% of the total transaction volume in Romania and 83% in Hungary. The transaction market was only dominated by the residential sector in the Czech Republic, where a EUR 1.3 billion residential portfolio was sold. Industrial properties held second place in the transaction ranking and are currently the focus of rising demand. Retail properties were responsible for a volume of EUR 695.6 million, or 11.3% of the total transaction volume.
Rents in the individual markets remain generally stable. The office markets react to economic developments with a delay, and the impact of the current downturn will probably not be visible before 2021. The extent to which long-term trends, for example an increase in home office work, influence the demand for rentals will only become tangible when expiring rental contracts are extended. In the retail park business, visitor frequency increased towards the pre-crisis level very quickly after the end of the lockdown. The STOP SHOPs benefit from direct access to the individual shops from the parking areas and a focus on everyday products. Visitor frequency in the VIVO! shopping centers is still below the level before the outbreak of the pandemic. Restrictions remain in place in individual countries, e. g. for gastronomy areas, and consumer demand is particularly weak for luxury brands, jewellery stores and travel offices. Yields are trending slightly upward.
IMMOFINANZ’s core markets are generally characterised by stable vacancy rates: for example, 4.6% on the office market in Vienna and 5.7% in Düsseldorf.
IMMOFINANZ AGHalf-year Financial Report 2020
14
Portfolio Report The first six months of 2020 were influenced by the Covid-19 pandemic and its effects on the real estate sector. The governments in most of IMMOFINANZ’s core countries imposed temporary shutdowns beginning in March which had an impact, above all, on retail businesses. In order to optimally offset the temporary decline in rental income from the retail properties on cash flow, IMMOFINANZ’s management introduced a cost savings programme in March. It includes, among others, the postponement of non-essential investments and expenditures, the reduction of overheads and the renegotiation of supplier contracts. On the revenue side, individual solutions were developed together with retail tenants to assist them in overcoming the crisis and marketing activities were launched to ensure the rapid recovery of visitor frequency in the retail properties. Tenants in the office business received support for a smooth return to work. Back-to-office plans were prepared with a focus on room concepts, distance guidelines, disinfection, protective measures and access rules. A separate task force was installed to manage hygiene procedures for the common areas to ensure the safe use of office and retail space.
The IMMOFINANZ portfolio covered 212 properties as of 30 June 2020 (31 December 2019: 213) with a combined value of EUR 4,972.8 million (31 December 2019: EUR 5,122.1 million). These properties are located, above all, in the core markets of Austria, Germany, Poland, Czech Republic, Slovakia, Hungary and Romania. Standing investments represent the largest component at EUR 4,578.2 million, or 92.1% of the carrying amount, and 2.0 million sqm of rentable space, which generate steady rental income. The development projects total EUR 214.4 million, or 4.3% of the carrying amount. Pipeline projects are responsible for EUR 180.2 million, or 3.6%, and include future planned development projects, undeveloped land, real estate inventories and properties that are intended for sale.
The portfolio is focused on three clearly defined brands with a high degree of standardisation: myhive stands for innovative, international office solutions, STOP SHOP for retail parks and VIVO! for shopping centers. Properties in these three brands were responsible for 68.8% of the carrying amount of the standing investment portfolio at the end of the first half of 2020 and 74.5% of rental income (Q2 2020). A further 14.4% of the carrying amount is attributable to office buildings which are rented to single tenants. The largest of these properties is the City Tower in Vienna, which is leased to the Austrian government, followed by the trivago Campus and FLOAT in Düsseldorf.
A geographical analysis shows 50.7% of the property portfolio in Austria, Germany and Poland, i.e. in so-called “developed markets” as defined by FTSE EPRA/NAREIT.
The application of IFRS 16 since the first quarter of 2019 has led to differences between the amounts presented in the portfolio report and on the balance sheet. The property values in the portfolio report are based on expert appraisals or internal valuation. The reported property values also include capitalised rights of use for building rights.
Properties that are held for sale and fall under IFRS 5 are, as in the past, not included in the portfolio report (see section 4.5 in the consolidated interim financial
statements).
GROUP INTERIM MANAGEMENT REPORTPortfolio Report
15
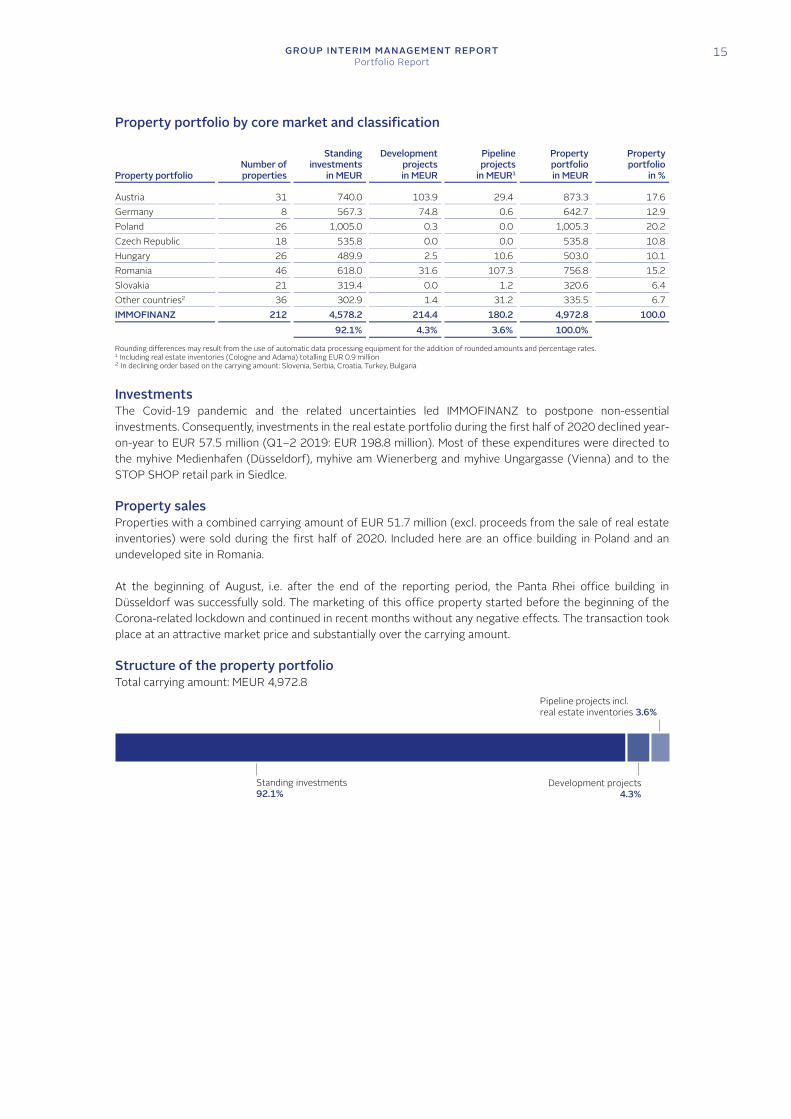
Property portfolio by core market and classification
Property portfolio Number of properties
Standinginvestments
in MEUR
Developmentprojectsin MEUR
Pipelineprojects
in MEUR1
Property portfolio in MEUR
Propertyportfolio
in % Austria 31 740.0 103.9 29.4 873.3 17.6Germany 8 567.3 74.8 0.6 642.7 12.9Poland 26 1,005.0 0.3 0.0 1,005.3 20.2Czech Republic 18 535.8 0.0 0.0 535.8 10.8Hungary 26 489.9 2.5 10.6 503.0 10.1Romania 46 618.0 31.6 107.3 756.8 15.2Slovakia 21 319.4 0.0 1.2 320.6 6.4Other countries2 36 302.9 1.4 31.2 335.5 6.7IMMOFINANZ 212 4,578.2 214.4 180.2 4,972.8 100.0 92.1% 4.3% 3.6% 100.0% Rounding differences may result from the use of automatic data processing equipment for the addition of rounded amounts and percentage rates. 1 Including real estate inventories (Cologne and Adama) totalling EUR 0.9 million 2 In declining order based on the carrying amount: Slovenia, Serbia, Croatia, Turkey, Bulgaria
Investments The Covid-19 pandemic and the related uncertainties led IMMOFINANZ to postpone non-essential investments. Consequently, investments in the real estate portfolio during the first half of 2020 declined year-on-year to EUR 57.5 million (Q1–2 2019: EUR 198.8 million). Most of these expenditures were directed to the myhive Medienhafen (Düsseldorf), myhive am Wienerberg and myhive Ungargasse (Vienna) and to the STOP SHOP retail park in Siedlce.
Property sales Properties with a combined carrying amount of EUR 51.7 million (excl. proceeds from the sale of real estate inventories) were sold during the first half of 2020. Included here are an office building in Poland and an undeveloped site in Romania.
At the beginning of August, i.e. after the end of the reporting period, the Panta Rhei office building in Düsseldorf was successfully sold. The marketing of this office property started before the beginning of the Corona-related lockdown and continued in recent months without any negative effects. The transaction took place at an attractive market price and substantially over the carrying amount.
Structure of the property portfolio Total carrying amount: MEUR 4,972.8
Pipeline projects incl.real estate inventories 3.6%
Standing investments92.1%
Development projects4.3%
IMMOFINANZ AGHalf-year Financial Report 2020
16
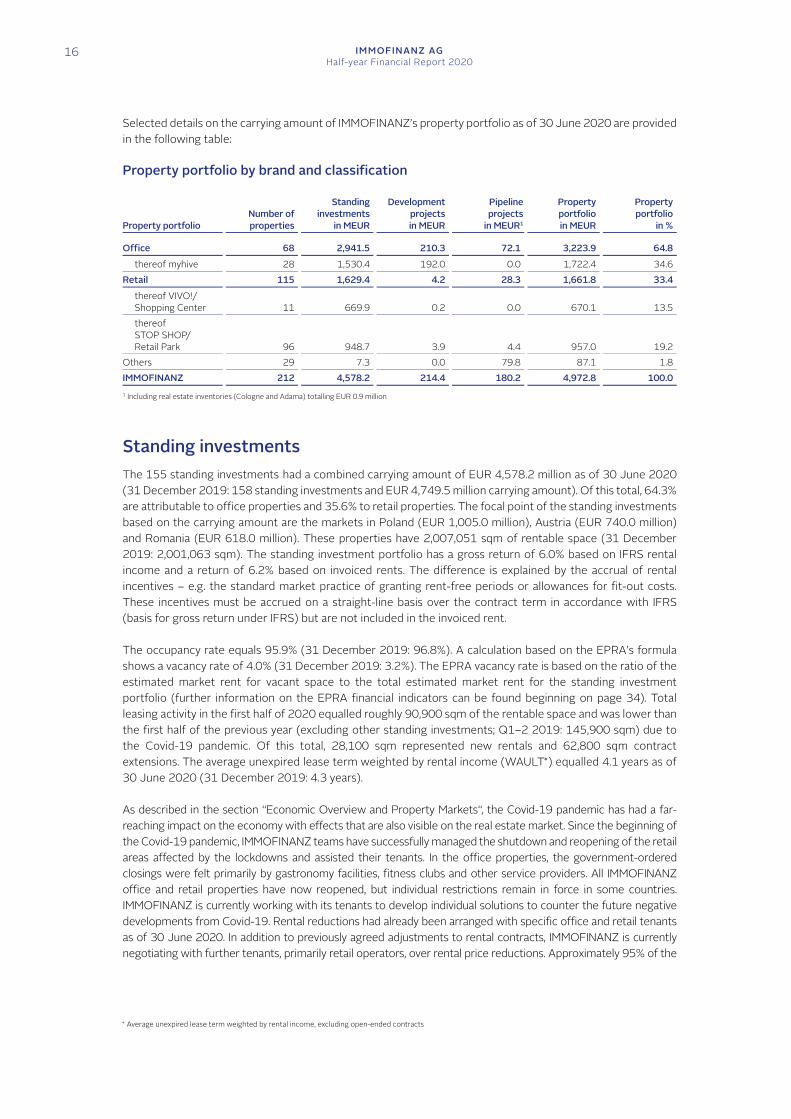
Selected details on the carrying amount of IMMOFINANZ’s property portfolio as of 30 June 2020 are provided in the following table:
Property portfolio by brand and classification
Property portfolio Number of properties
Standinginvestments
in MEUR
Developmentprojectsin MEUR
Pipelineprojects
in MEUR1
Property portfolio in MEUR
Propertyportfolio
in % Office 68 2,941.5 210.3 72.1 3,223.9 64.8
thereof myhive 28 1,530.4 192.0 0.0 1,722.4 34.6Retail 115 1,629.4 4.2 28.3 1,661.8 33.4
thereof VIVO!/ Shopping Center 11 669.9 0.2 0.0 670.1 13.5thereof STOP SHOP/ Retail Park 96 948.7 3.9 4.4 957.0 19.2
Others 29 7.3 0.0 79.8 87.1 1.8IMMOFINANZ 212 4,578.2 214.4 180.2 4,972.8 100.0 1 Including real estate inventories (Cologne and Adama) totalling EUR 0.9 million
Standing investments The 155 standing investments had a combined carrying amount of EUR 4,578.2 million as of 30 June 2020 (31 December 2019: 158 standing investments and EUR 4,749.5 million carrying amount). Of this total, 64.3% are attributable to office properties and 35.6% to retail properties. The focal point of the standing investments based on the carrying amount are the markets in Poland (EUR 1,005.0 million), Austria (EUR 740.0 million) and Romania (EUR 618.0 million). These properties have 2,007,051 sqm of rentable space (31 December 2019: 2,001,063 sqm). The standing investment portfolio has a gross return of 6.0% based on IFRS rental income and a return of 6.2% based on invoiced rents. The difference is explained by the accrual of rental incentives – e.g. the standard market practice of granting rent-free periods or allowances for fit-out costs. These incentives must be accrued on a straight-line basis over the contract term in accordance with IFRS (basis for gross return under IFRS) but are not included in the invoiced rent.
The occupancy rate equals 95.9% (31 December 2019: 96.8%). A calculation based on the EPRA’s formula shows a vacancy rate of 4.0% (31 December 2019: 3.2%). The EPRA vacancy rate is based on the ratio of the estimated market rent for vacant space to the total estimated market rent for the standing investment portfolio (further information on the EPRA financial indicators can be found beginning on page 34). Total leasing activity in the first half of 2020 equalled roughly 90,900 sqm of the rentable space and was lower than the first half of the previous year (excluding other standing investments; Q1–2 2019: 145,900 sqm) due to the Covid-19 pandemic. Of this total, 28,100 sqm represented new rentals and 62,800 sqm contract extensions. The average unexpired lease term weighted by rental income (WAULT) equalled 4.1 years as of 30 June 2020 (31 December 2019: 4.3 years).
As described in the section “Economic Overview and Property Markets“, the Covid-19 pandemic has had a far-reaching impact on the economy with effects that are also visible on the real estate market. Since the beginning of the Covid-19 pandemic, IMMOFINANZ teams have successfully managed the shutdown and reopening of the retail areas affected by the lockdowns and assisted their tenants. In the office properties, the government-ordered closings were felt primarily by gastronomy facilities, fitness clubs and other service providers. All IMMOFINANZ office and retail properties have now reopened, but individual restrictions remain in force in some countries. IMMOFINANZ is currently working with its tenants to develop individual solutions to counter the future negative developments from Covid-19. Rental reductions had already been arranged with specific office and retail tenants as of 30 June 2020. In addition to previously agreed adjustments to rental contracts, IMMOFINANZ is currently negotiating with further tenants, primarily retail operators, over rental price reductions. Approximately 95% of the
Average unexpired lease term weighted by rental income, excluding open-ended contracts
GROUP INTERIM MANAGEMENT REPORTPortfolio Report
17
negotiations with retail tenants were finalised by mid-August and more than half of the related agreements have already been signed. The goal is to complete the signing of all contract adjustments by the end of 2020.
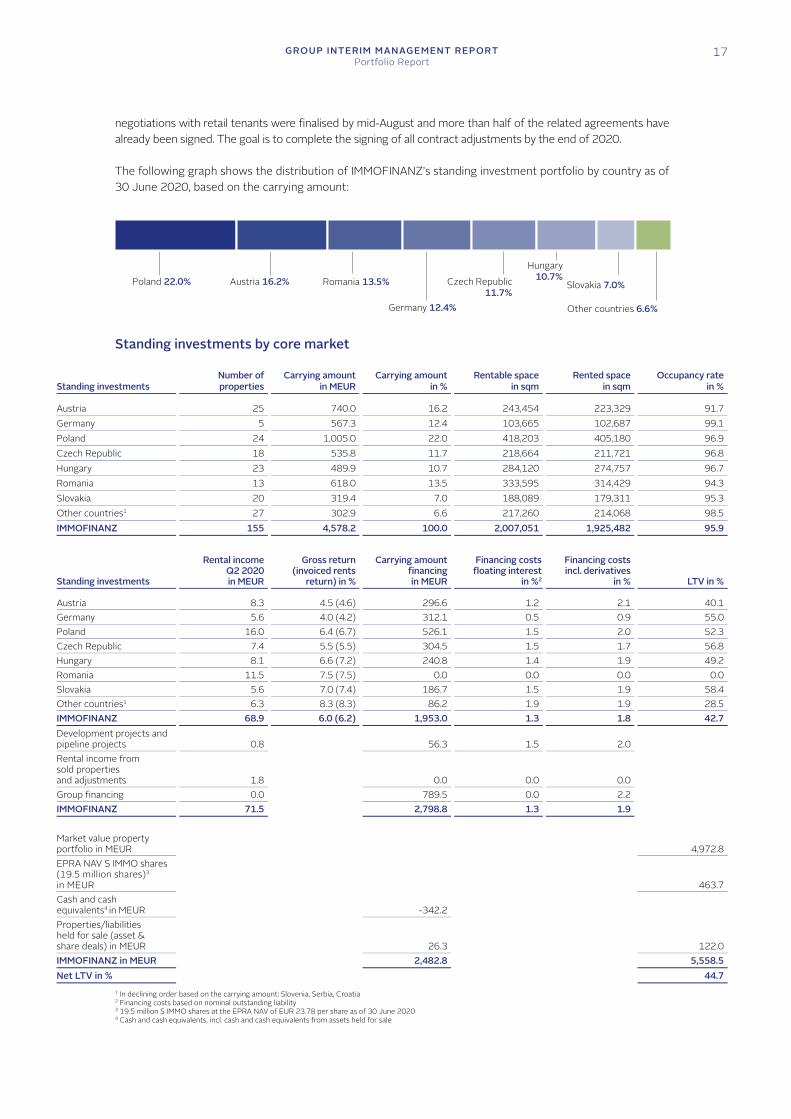
The following graph shows the distribution of IMMOFINANZ’s standing investment portfolio by country as of 30 June 2020, based on the carrying amount:
Standing investments by core market
Standing investments Number of properties
Carrying amountin MEUR
Carrying amountin %
Rentable spacein sqm
Rented space in sqm
Occupancy ratein %
Austria 25 740.0 16.2 243,454 223,329 91.7Germany 5 567.3 12.4 103,665 102,687 99.1Poland 24 1,005.0 22.0 418,203 405,180 96.9Czech Republic 18 535.8 11.7 218,664 211,721 96.8Hungary 23 489.9 10.7 284,120 274,757 96.7Romania 13 618.0 13.5 333,595 314,429 94.3Slovakia 20 319.4 7.0 188,089 179,311 95.3Other countries1 27 302.9 6.6 217,260 214,068 98.5IMMOFINANZ 155 4,578.2 100.0 2,007,051 1,925,482 95.9
Standing investments
Rental income Q2 2020 in MEUR
Gross return(invoiced rents
return) in %
Carrying amountfinancingin MEUR
Financing costsfloating interest
in %2
Financing costs incl. derivatives
in % LTV in % Austria 8.3 4.5 (4.6) 296.6 1.2 2.1 40.1Germany 5.6 4.0 (4.2) 312.1 0.5 0.9 55.0Poland 16.0 6.4 (6.7) 526.1 1.5 2.0 52.3Czech Republic 7.4 5.5 (5.5) 304.5 1.5 1.7 56.8Hungary 8.1 6.6 (7.2) 240.8 1.4 1.9 49.2Romania 11.5 7.5 (7.5) 0.0 0.0 0.0 0.0Slovakia 5.6 7.0 (7.4) 186.7 1.5 1.9 58.4Other countries1 6.3 8.3 (8.3) 86.2 1.9 1.9 28.5IMMOFINANZ 68.9 6.0 (6.2) 1,953.0 1.3 1.8 42.7Development projects and pipeline projects 0.8 56.3 1.5 2.0 Rental income from sold properties and adjustments 1.8 0.0 0.0 0.0 Group financing 0.0 789.5 0.0 2.2 IMMOFINANZ 71.5 2,798.8 1.3 1.9 Market value property portfolio in MEUR 4,972.8EPRA NAV S IMMO shares (19.5 million shares)3
in MEUR 463.7Cash and cash equivalents4 in MEUR -342.2 Properties/liabilities held for sale (asset & share deals) in MEUR 26.3 122.0IMMOFINANZ in MEUR 2,482.8 5,558.5Net LTV in % 44.7
1 In declining order based on the carrying amount: Slovenia, Serbia, Croatia 2 Financing costs based on nominal outstanding liability 3 19.5 million S IMMO shares at the EPRA NAV of EUR 23.78 per share as of 30 June 2020 4 Cash and cash equivalents, incl. cash and cash equivalents from assets held for sale
Poland 22.0% Austria 16.2% Romania 13.5% Czech Republic 11.7%
Hungary10.7%
Slovakia 7.0%
Germany 12.4% Other countries 6.6%
IMMOFINANZ AGHalf-year Financial Report 2020
18
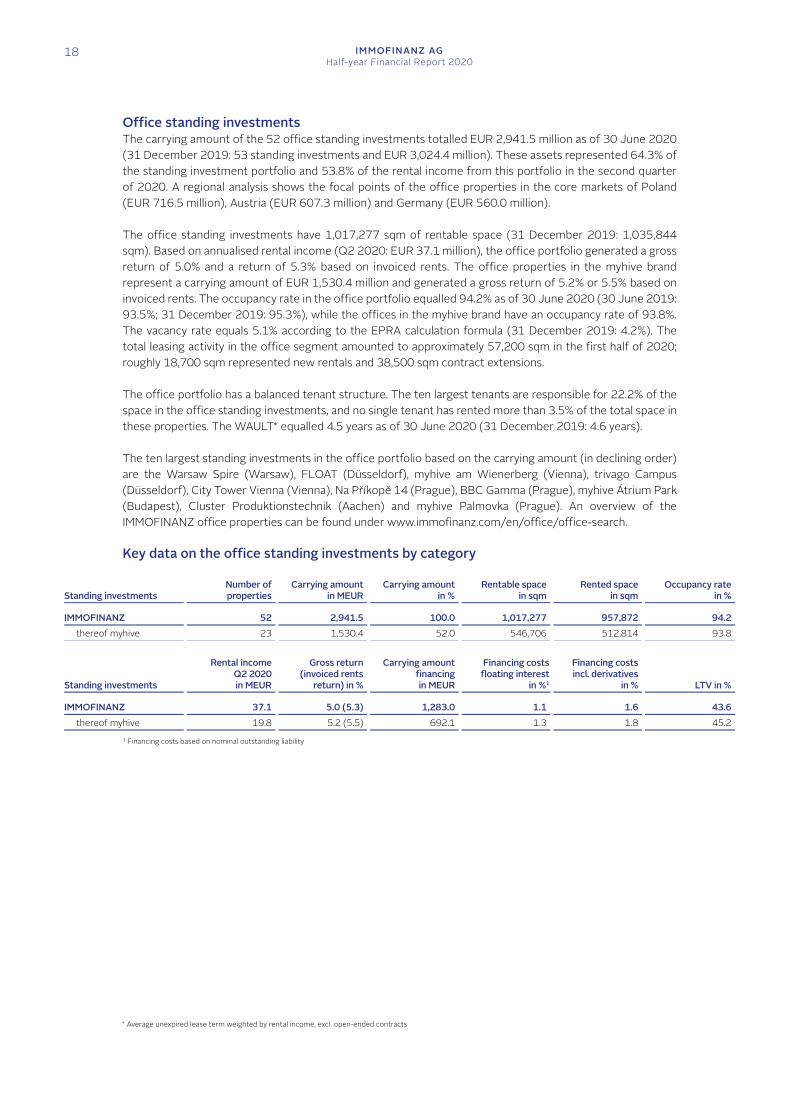
Office standing investments The carrying amount of the 52 office standing investments totalled EUR 2,941.5 million as of 30 June 2020 (31 December 2019: 53 standing investments and EUR 3,024.4 million). These assets represented 64.3% of the standing investment portfolio and 53.8% of the rental income from this portfolio in the second quarter of 2020. A regional analysis shows the focal points of the office properties in the core markets of Poland (EUR 716.5 million), Austria (EUR 607.3 million) and Germany (EUR 560.0 million).
The office standing investments have 1,017,277 sqm of rentable space (31 December 2019: 1,035,844 sqm). Based on annualised rental income (Q2 2020: EUR 37.1 million), the office portfolio generated a gross return of 5.0% and a return of 5.3% based on invoiced rents. The office properties in the myhive brand represent a carrying amount of EUR 1,530.4 million and generated a gross return of 5.2% or 5.5% based on invoiced rents. The occupancy rate in the office portfolio equalled 94.2% as of 30 June 2020 (30 June 2019: 93.5%; 31 December 2019: 95.3%), while the offices in the myhive brand have an occupancy rate of 93.8%. The vacancy rate equals 5.1% according to the EPRA calculation formula (31 December 2019: 4.2%). The total leasing activity in the office segment amounted to approximately 57,200 sqm in the first half of 2020; roughly 18,700 sqm represented new rentals and 38,500 sqm contract extensions.
The office portfolio has a balanced tenant structure. The ten largest tenants are responsible for 22.2% of the space in the office standing investments, and no single tenant has rented more than 3.5% of the total space in these properties. The WAULT equalled 4.5 years as of 30 June 2020 (31 December 2019: 4.6 years).
The ten largest standing investments in the office portfolio based on the carrying amount (in declining order) are the Warsaw Spire (Warsaw), FLOAT (Düsseldorf), myhive am Wienerberg (Vienna), trivago Campus (Düsseldorf), City Tower Vienna (Vienna), Na Příkopě 14 (Prague), BBC Gamma (Prague), myhive Átrium Park (Budapest), Cluster Produktionstechnik (Aachen) and myhive Palmovka (Prague). An overview of the IMMOFINANZ office properties can be found under www.immofinanz.com/en/office/office-search.
Key data on the office standing investments by category
Standing investments Number of properties
Carrying amountin MEUR
Carrying amountin %
Rentable spacein sqm
Rented space in sqm
Occupancy ratein %
IMMOFINANZ 52 2,941.5 100.0 1,017,277 957,872 94.2
thereof myhive 23 1,530.4 52.0 546,706 512,814 93.8
Standing investments
Rental income Q2 2020 in MEUR
Gross return(invoiced rents
return) in %
Carrying amountfinancingin MEUR
Financing costsfloating interest
in %1
Financing costs incl. derivatives
in % LTV in % IMMOFINANZ 37.1 5.0 (5.3) 1,283.0 1.1 1.6 43.6
thereof myhive 19.8 5.2 (5.5) 692.1 1.3 1.8 45.2 1 Financing costs based on nominal outstanding liability
Average unexpired lease term weighted by rental income, excl. open-ended contracts
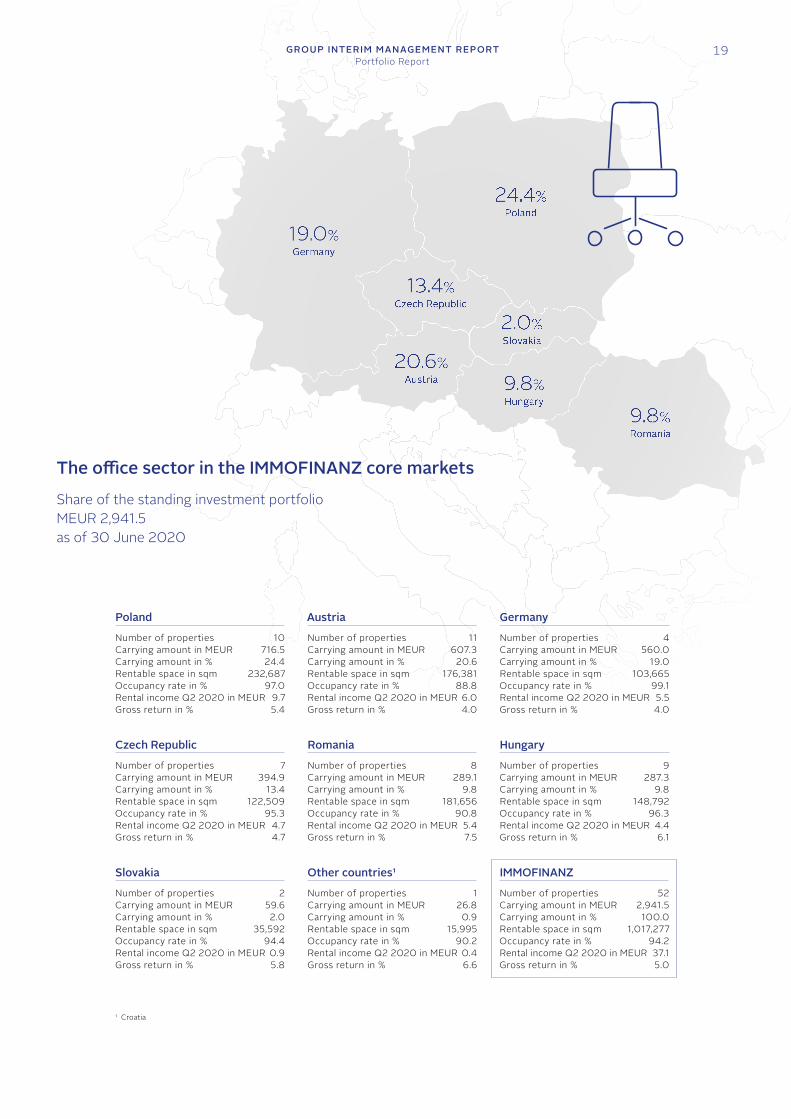
Romania
Number of properties 8 Carrying amount in MEUR 289.1 Carrying amount in % 9.8 Rentable space in sqm 181,656 Occupancy rate in % 90.8 Rental income Q2 2020 in MEUR 5.4 Gross return in % 7.5
24.4%Poland
2.0%Slovakia
19.0%Germany
13.4%Czech Republic
20.6%Austria 9.8%
Hungary
9.8%Romania
The office sector in the IMMOFINANZ core markets
1 Croatia
Austria
Number of properties 11 Carrying amount in MEUR 607.3 Carrying amount in % 20.6 Rentable space in sqm 176,381 Occupancy rate in % 88.8 Rental income Q2 2020 in MEUR 6.0 Gross return in % 4.0
Czech Republic
Number of properties 7 Carrying amount in MEUR 394.9 Carrying amount in % 13.4 Rentable space in sqm 122,509 Occupancy rate in % 95.3 Rental income Q2 2020 in MEUR 4.7 Gross return in % 4.7
Slovakia
Number of properties 2 Carrying amount in MEUR 59.6 Carrying amount in % 2.0 Rentable space in sqm 35,592 Occupancy rate in % 94.4 Rental income Q2 2020 in MEUR 0.9 Gross return in % 5.8
Other countries1
Number of properties 1 Carrying amount in MEUR 26.8 Carrying amount in % 0.9 Rentable space in sqm 15,995 Occupancy rate in % 90.2 Rental income Q2 2020 in MEUR 0.4 Gross return in % 6.6
Germany
Number of properties 4 Carrying amount in MEUR 560.0 Carrying amount in % 19.0 Rentable space in sqm 103,665 Occupancy rate in % 99.1 Rental income Q2 2020 in MEUR 5.5 Gross return in % 4.0
Hungary
Number of properties 9 Carrying amount in MEUR 287.3 Carrying amount in % 9.8 Rentable space in sqm 148,792 Occupancy rate in % 96.3Rental income Q2 2020 in MEUR 4.4 Gross return in % 6.1
IMMOFINANZ
Number of properties 52 Carrying amount in MEUR 2,941.5 Carrying amount in % 100.0 Rentable space in sqm 1,017,277 Occupancy rate in % 94.2 Rental income Q2 2020 in MEUR 37.1 Gross return in % 5.0
Share of the standing investment portfolio MEUR 2,941.5 as of 30 June 2020
Poland
Number of properties 10 Carrying amount in MEUR 716.5 Carrying amount in % 24.4 Rentable space in sqm 232,687 Occupancy rate in % 97.0 Rental income Q2 2020 in MEUR 9.7 Gross return in % 5.4
GROUP INTERIM MANAGEMENT REPORTPortfolio Report
19
IMMOFINANZ AGHalf-year Financial Report 2020
20
Retail standing investments The carrying amount of the 102 standing investments in the retail sector totalled EUR 1,629.4 million as of 30 June 2020 (31 December 2019: 100 standing investments and EUR 1,672.9 million). These properties represented 35.6% of the standing investment portfolio and generated 46.1% of the rental income from standing investments in the second quarter of 2020. The largest regional markets are Romania with EUR 328.8 million, Poland with EUR 288.6 million and Slovakia with EUR 259.8 million. The STOP SHOP retail parks have a carrying amount of EUR 948.7 million; the gross return and the return based on invoiced rents equal 8.0%. The VIVO! shopping centers have a carrying amount of EUR 669.9 million; the gross return and the return based on invoice rents equal 7.5%.
The retail standing investments have 989,774 sqm of rentable space (31 December 2019: 955,039 sqm). Based on annualised rents (Q2 2020: EUR 31.8 million), the retail portfolio has a gross return and a return based on invoice rents of 7.8%. The occupancy rate in the retail properties equalled 97.8% as of 30 June 2020 (30 June 2019: 96.4%; 31 December 2019: 98.3%); the occupancy rates in the STOP SHOP retail parks and the VIVO! shopping centers are 98.4% and 96.7%, respectively. Total leasing activity in the retail properties amounted to roughly 33,700 sqm in the first half of 2020 and includes approximately 9,400 sqm of new rentals and 24,300 sqm of contract extensions.
IMMOFINANZ was affected by the government-ordered, temporary shutdown of retail establishments during the first half of 2020, but all facilities have since reopened. In the retail park business, visitor frequency increased towards the pre-crisis level very quickly after the end of the lockdown. The STOP SHOP retail parks benefit from direct access to the individual shops from the parking areas and a focus on everyday products. Visitor frequency in the VIVO! shopping centers is still below the level before the outbreak of the pandemic. Restrictions remain in place in individual countries, e.g. for gastronomy areas. IMMOFINANZ started discussions with its tenants immediately after the outbreak of the Covid-19 pandemic to develop joint solutions for the crisis months and the reopening phase. These solutions include necessary support through the deferral of rental payments and temporary rent reductions with parallel negotiations over lease extensions, an increase in turnover-based rents, the strengthening of security measures etc. (also see section 5.1 in the consolidated interim financial statements).
IMMOFINANZ relies on a balanced tenant mix to create an optimal environment for retailers and their customers. All larger IMMOFINANZ retail properties have solid international and local anchor tenants, but no single retailer has rented more than 4.0% of the total space in these properties. The WAULT equalled 3.6 years as of 30 June 2020 (31 December 2019: 3.8 years).
The ten largest standing investments in the retail portfolio based on the carrying amount (in declining order) are the VIVO! Cluj-Napoca (Romania), VIVO! Bratislava (Slovakia), VIVO! Lublin (Poland), VIVO! Constanţa (Romania), VIVO! Baia Mare (Romania), VIVO! Stalowa Wola (Poland), VIVO! Piła (Poland), VIVO! Krosno (Poland), VIVO! Hostivař (Czech Republic) and STOP SHOP Veszprém (Hungary). An overview of the IMMOFINANZ retail properties can be found under www.immofinanz.com/en/retail/retail-search.
Average unexpired lease term weighted by rental income, excl. open-ended contracts
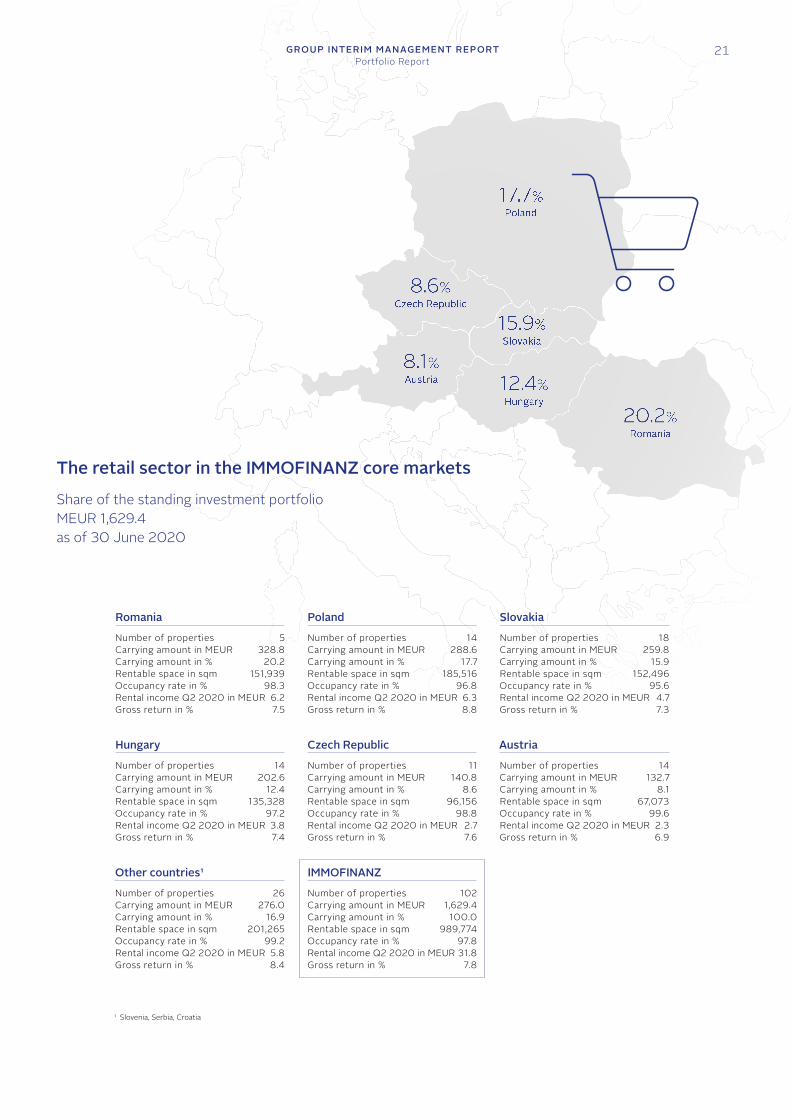
17.7%Poland
15.9%Slovakia
8.6%Czech Republic
8.1%Austria 12.4%
Hungary
20.2%Romania
1 Slovenia, Serbia, Croatia
Romania
Number of properties 5 Carrying amount in MEUR 328.8 Carrying amount in % 20.2 Rentable space in sqm 151,939 Occupancy rate in % 98.3 Rental income Q2 2020 in MEUR 6.2 Gross return in % 7.5
Hungary
Number of properties 14 Carrying amount in MEUR 202.6Carrying amount in % 12.4 Rentable space in sqm 135,328 Occupancy rate in % 97.2 Rental income Q2 2020 in MEUR 3.8 Gross return in % 7.4
Other countries1
Number of properties 26 Carrying amount in MEUR 276.0 Carrying amount in % 16.9 Rentable space in sqm 201,265 Occupancy rate in % 99.2Rental income Q2 2020 in MEUR 5.8 Gross return in % 8.4
Poland
Number of properties 14 Carrying amount in MEUR 288.6 Carrying amount in % 17.7 Rentable space in sqm 185,516 Occupancy rate in % 96.8 Rental income Q2 2020 in MEUR 6.3 Gross return in % 8.8
Czech Republic
Number of properties 11 Carrying amount in MEUR 140.8 Carrying amount in % 8.6 Rentable space in sqm 96,156 Occupancy rate in % 98.8 Rental income Q2 2020 in MEUR 2.7 Gross return in % 7.6
Slovakia
Number of properties 18 Carrying amount in MEUR 259.8 Carrying amount in % 15.9 Rentable space in sqm 152,496 Occupancy rate in % 95.6 Rental income Q2 2020 in MEUR 4.7 Gross return in % 7.3
Austria
Number of properties 14 Carrying amount in MEUR 132.7 Carrying amount in % 8.1 Rentable space in sqm 67,073 Occupancy rate in % 99.6 Rental income Q2 2020 in MEUR 2.3 Gross return in % 6.9
IMMOFINANZ
Number of properties 102 Carrying amount in MEUR 1,629.4 Carrying amount in % 100.0 Rentable space in sqm 989,774 Occupancy rate in % 97.8 Rental income Q2 2020 in MEUR 31.8 Gross return in % 7.8
The retail sector in the IMMOFINANZ core markets
Share of the standing investment portfolio MEUR 1,629.4 as of 30 June 2020
GROUP INTERIM MANAGEMENT REPORTPortfolio Report
21
IMMOFINANZ AGHalf-year Financial Report 2020
22
Key data on the retail standing investments by category
Standing investments Number of properties
Carrying amountin MEUR
Carrying amountin %
Rentable spacein sqm
Rented space in sqm
Occupancy ratein %
IMMOFINANZ 102 1,629.4 100.0 989,774 967,610 97.8
thereof VIVO!/Shopping Center 10 669.9 41.1 314,112 303,849 96.7thereof STOP SHOP/Retail Park 90 948.7 58.2 665,379 654,572 98.4
Standing investments
Rental income Q2 2020 in MEUR
Gross return(invoiced rents
return) in %
Carrying amountfinancingin MEUR
Financing costsfloating interest
in %1
Financing costs incl. derivatives
in % LTV in % IMMOFINANZ 31.8 7.8 (7.8) 667.1 1.6 2.0 40.9
thereof VIVO!/Shopping Center 12.6 7.5 (7.5) 231.8 1.6 2.0 34.6thereof STOP SHOP/Retail Park 18.9 8.0 (8.0) 435.3 1.6 2.0 45.9
1 Financing costs based on nominal outstanding liability
Development projects The development projects had a carrying amount of EUR 214.4 million as of 30 June 2020, which represents 4.3% of the total property portfolio (31 December 2019: EUR 199.4 million and 3.9%). This amount includes EUR 192.0 million of active development projects and EUR 22.4 million of projects in the preparation or concept phase, for which outstanding construction costs are not yet available. The expected fair value of the active projects on completion amounts to EUR 302.4 million. The core markets of Germany and Austria represent the focus of these activities based on an expected fair value after completion of EUR 161.0 million, respectively EUR 100.9 million.
The Covid-19 pandemic led to construction delays on several development projects, but there have been no other limitations to date.
The STOP SHOP Siedlce, which opened at the end of March 2020, was reclassified to the standing investment portfolio during the first half of 2020. This retail park has an occupancy rate of 99.1%.
Current focus of development activities
Germany The myhive Medienhafen is currently under development in the Düsseldorfer Medienhafen as the first myhive office building in Germany. This high-rise is designed as a multi-tenant building and will have roughly 21,000 sqm of rentable space on 16 floors. Completion is planned for the third quarter of 2021.
Austria The two development projects currently in progress involve the modernisation of existing office buildings: the location for the myhive am Wienerberg with approximately 12,500 sqm and the myhive Ungargasse in Vienna’s third district with roughly 17,200 sqm of planned usable space. These projects are scheduled for completion in 2020.
Romania At the IRIDE Business Park in Bucharest, the IRIDE 18 and 19 buildings are currently undergoing modernisation and integration in the myhive concept. The office buildings should then have roughly 10,000 sqm and 18,000 sqm of rentable space, respectively. These modernisation projects are scheduled for completion in the first quarter of 2021.
GROUP INTERIM MANAGEMENT REPORTPortfolio Report
23
Development projects by core market
Development projects
Number of properties
Carrying amount
in MEUR
Carrying amount
in %
Outstandingconstruction
costs in MEUR
Plannedrentable space
in sqm
Expected fair value after
completion in MEUR
Expected rentalincome at full
occupancyin MEUR
Expected yield after
completion in %1
Austria 2 86.4 45.0 14.5 26,572 100.9 4.2 4.1Germany 1 74.0 38.5 52.6 21,690 161.0 5.8 4.6Romania 2 31.6 16.4 8.9 27,956 40.5 3.6 8.9Active projects 5 192.0 100.0 76.0 76,218 302.4 13.6 5.1Projects in preparation 7 22.4 IMMOFINANZ 12 214.4
1 Expected rental income after completion in relation to the current carrying amount, including outstanding construction costs
Pipeline projects Pipeline projects include planned development projects, undeveloped land and/or temporarily suspended projects. These projects had a carrying amount of EUR 180.2 million as of 30 June 2020 (31 December 2019: EUR 173.2 million). Romania represents the focal point of the pipeline projects at EUR 107.3 million. IMMOFINANZ intends to further reduce the scope of pipeline projects, in particular the land reserves in Romania, through selected sales as part of its corporate strategy.
Assets held for sale The assets held for sale totalled EUR 141.6 million as of 30 June 2020 (including capitalised rights of use for building rights) and are not included in this portfolio report (31 December 2019: EUR 154.6 million). Concrete sale plans have been approved for these properties, and their sale is intended in the near future. Details are provided in section 4.5 of the consolidated interim financial statements.
IMMOFINANZ AGHalf-year Financial Report 2020
24
Property Valuation IMMOFINANZ prepares its consolidated financial statements in accordance with the International Financial Reporting Standards (IFRS) and arranges for the regular valuation of its properties by independent experts. These external appraisals are carried out each year as of 30 June and 31 December. The valuation of the property portfolio also follows the EPRA’s Best Practices Policy Recommendations for the application of the fair value method as defined in IFRS.
CBRE appraised nearly all real estate in IMMOFINANZ’s portfolio (EUR 4.9 billion) as of 30 June 2020. Internal valuations were responsible for 0.9%.
Development of property valuation in the first half of 2020 The Covid-19 pandemic had a negative influence on the valuation of investment property. Revaluations totalled EUR -159.2 million in the first half of 2020, compared with clearly positive results in the first half of the previous year (Q1–2 2019: EUR 123.5 million or Q1–4 2019: EUR 193.3 million). The external appraisals by CBRE reflected slightly higher market yields (increase of up to 0.5% in the retail segment) as well as changed assumptions concerning re-rentals in the portfolio properties.
Results from the revaluation of the standing investments totalled EUR -143.4 million (Q1–2 2019: EUR 104.7 million). This decline in value represents roughly 3.1% of the carrying amount of the standing investments as of 30 June 2020. Retail properties were written down by EUR -68.1 million (4.2% of the carrying amount) and office properties by EUR -74.8 million (2.5% of the carrying amount).
Development of property valuation like-for-like A like-for-like analysis – i.e. after an adjustment for new acquisitions, completions and sales to improve comparability – shows a valuation effect of EUR -124.6 million for the first half of 2020 (Q1–2 2019: EUR 78.2 million).
Standing investments like-for-like by core market Standing investments like-for-like1
Number of properties
Carrying amountin MEUR
Carrying amount in %
Valuation effectsQ1–2 2020 in MEUR
Austria 23 691.3 18.7 -12.3Germany 4 332.6 9.0 -4.9Poland 20 574.8 15.5 -30.9Czech Republic 17 453.0 12.2 -5.9Hungary 23 489.9 13.2 -13.7Romania 13 618.0 16.7 -41.0Slovakia 20 319.4 8.6 -11.3Other countries 20 220.1 5.9 -4.6IMMOFINANZ 140 3,699.1 100.0 -124.6 1 This calculation only includes the properties which were fully owned by IMMOFINANZ during both periods. In other words, the calculation excludes new acquisitions,
completions and sales.
GROUP INTERIM MANAGEMENT REPORTProperty Valuation
25
Standing investments like-for-like by asset class Standing investments like-for-like1
Number of properties
Carrying amountin MEUR
Carrying amount in %
Valuation effectsQ1–2 2020 in MEUR
Office 48 2,191.9 59.3 -58.5
thereof myhive 20 1,015.4 27.5 -34.2Retail 91 1,499.9 40.5 -65.9
thereof VIVO!/Shopping Center 10 669.9 18.1 -47.6thereof STOP SHOP/Retail Park 80 825.4 22.3 -17.7
Others 1 7.3 0.2 -0.3IMMOFINANZ 140 3,699.1 100.0 -124.6 1 This calculation only includes the properties which were fully owned by IMMOFINANZ during both periods. In other words, the calculation excludes new acquisitions,
completions and sales.
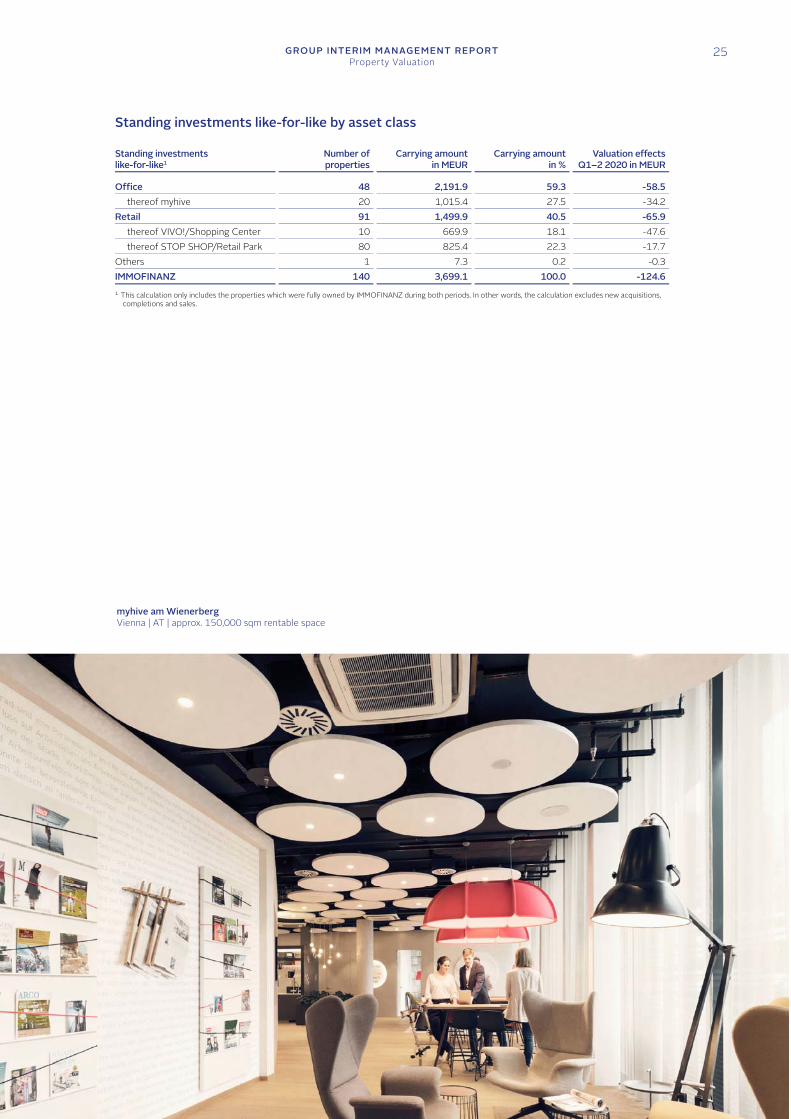
myhive am Wienerberg Vienna | AT | approx. 150,000 sqm rentable space
IMMOFINANZ AGHalf-year Financial Report 2020
26
Financing Financial liabilities totalled EUR 2.8 billion as of 30 June 2020 (31 December 2019: EUR 2.8 billion). Cash and cash equivalents, including cash and cash equivalents held for sale, amounted to EUR 342.2 million (31 December 2019: EUR 345.1 million) and net debt, i.e. debt after the deduction of cash and cash equivalents held by the Group, equalled EUR 2.5 billion (31 December 2019: EUR 2.5 billion).
IMMOFINANZ AG concluded an unsecured, revolving credit line of EUR 100.0 million at the end of March 2020. It can be used at the company’s discretion up to 31 March 2022 and gives IMMOFINANZ added financial flexibility. This credit line was unused at the end of the reporting period and is therefore available in full.
Capital measures after the balance sheet date Shortly after the end of the reporting period, in July 2020, IMMOFINANZ completed a successful share placement and the issuance of a mandatory convertible bond. The gross issue proceeds amounted to EUR 356.1 million.
A total number of 15,418,824 shares were placed through an accelerated book-building procedure with institutional investors under the exclusion of subscription rights. Share capital was increased by 11,208,526 to 123,293,795 shares, and 4,210,298 treasury shares were sold. The placement was made at EUR 15.31 per share and led, in total, to gross issue proceeds of EUR 236.1 million.
IMMOFINANZ also placed a subordinated mandatory convertible bond with a total nominal value of EUR 120.0 million through an accelerated book-building procedure with institutional investors under the exclusion of subscription rights. The initial conversion price was set at EUR 17.1472, which represents a 12.0% premium above the issue price of the shares in the current share placement. The three-year bond carries a coupon of 4.0% per annum, payable semi-annually in arrears on 23 January and 23 July of each year. The subordinated mandatory convertible bond is convertible into a total of 6,998,228 IMMOFINANZ shares and is classified as equity under IFRS and by the rating agency S&P (exception: future coupon payments).
Robust balance sheet structure IMMOFINANZ has a robust balance sheet structure with an equity ratio of 45.0% (31 December 2019: 46.0%) and a net loan-to-value ratio (net LTV) of 44.7% (31 December 2019: 43.0%). A calculation including the capital measures implemented after the balance sheet date and based on the numbers as of 30 June 2020 shows an improvement in the equity ratio from 45.0% to 47.8% and in net LTV from 44.7% to 38.6%.
Excluding lease liabilities of EUR 61.3 million in accordance with the application of IFRS 16; including IFRS 5 The calculation is based on the figures as of 30 June 2020 and includes the gross proceeds less ancillary transaction costs and the debt component of the
subordinated mandatory convertible bond.
GROUP INTERIM MANAGEMENT REPORTFinancing
27
Development of net LTV
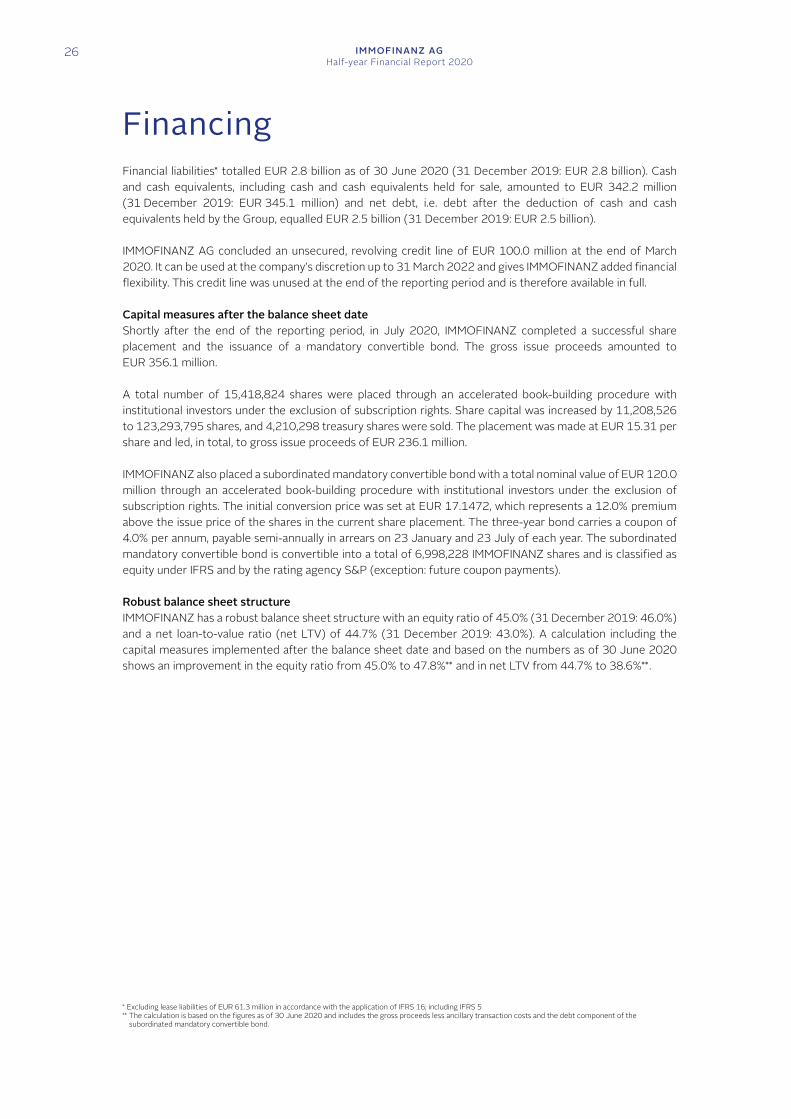
Calculation of net LTV as of 30 June 2020 Amounts in TEUR
Carrying amount of financing1 2,825,036.9 - Cash and cash equivalents2 -342,245.7 Net carrying amount of financing 2,482,791.2 Carrying amount of property3 & EPRA NAV of S IMMO shares4 5,558,494.6 Net LTV in % 44.7 1 Including IFRS 5 values, excluding IFRS 16 values 2 Cash and cash equivalents, including cash and cash equivalents in assets held
for sale 3 Excluding rights of use, values as per IFRS 16 4 19.5 million S IMMO shares at the EPRA NAV of EUR 23.78 per share as of
30 June 2020
The average financing costs for IMMOFINANZ, including derivatives, equalled 1.89% per year as of 30 June 2020 (31 December 2019: 1.91% per year). The hedging quota was stable at 90.7% (31 December 2019: 90.7%).
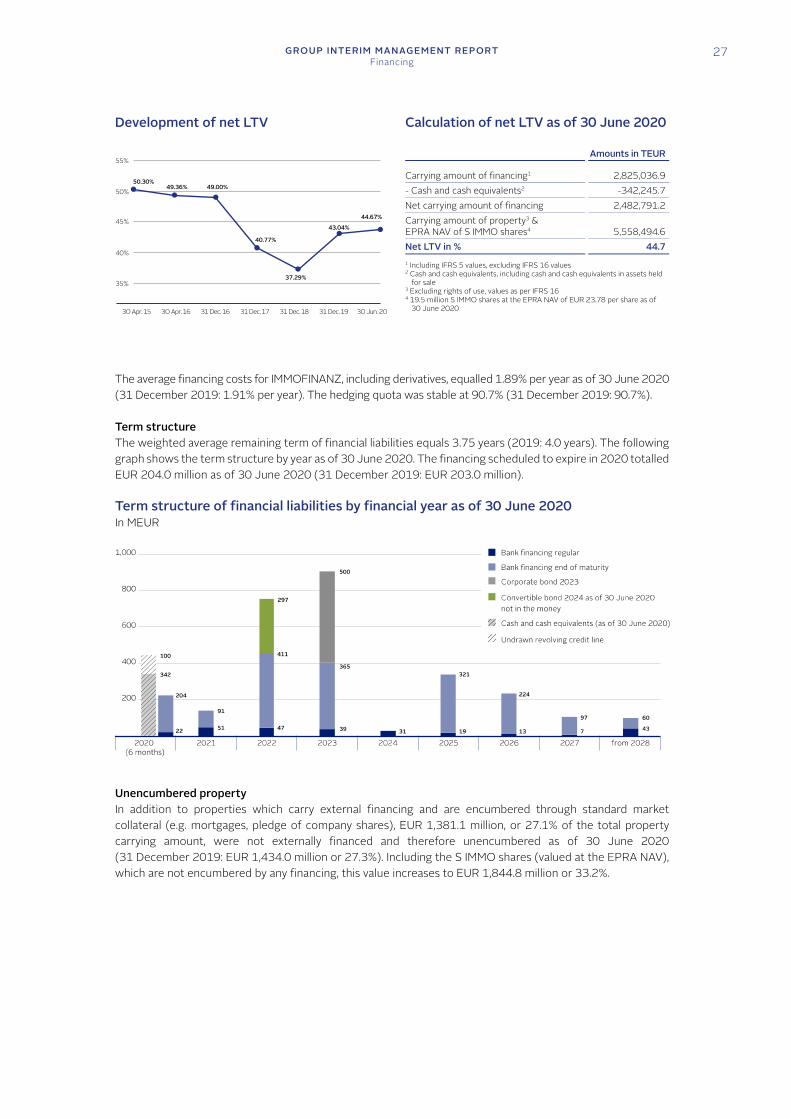
Term structure The weighted average remaining term of financial liabilities equals 3.75 years (2019: 4.0 years). The following graph shows the term structure by year as of 30 June 2020. The financing scheduled to expire in 2020 totalled EUR 204.0 million as of 30 June 2020 (31 December 2019: EUR 203.0 million).
Term structure of financial liabilities by financial year as of 30 June 2020 In MEUR
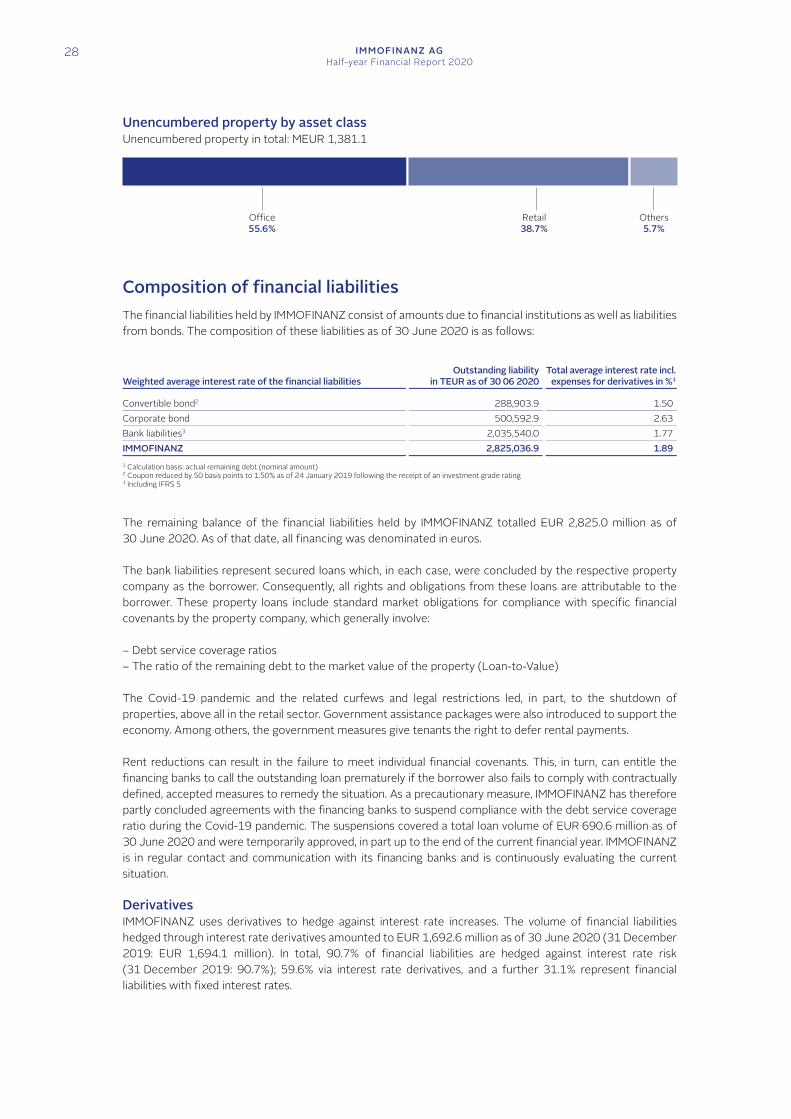
Unencumbered property In addition to properties which carry external financing and are encumbered through standard market collateral (e.g. mortgages, pledge of company shares), EUR 1,381.1 million, or 27.1% of the total property carrying amount, were not externally financed and therefore unencumbered as of 30 June 2020 (31 December 2019: EUR 1,434.0 million or 27.3%). Including the S IMMO shares (valued at the EPRA NAV), which are not encumbered by any financing, this value increases to EUR 1,844.8 million or 33.2%.
30 Apr. 15 30 Apr. 16 31 Dec. 16 31 Dec. 17 31 Dec. 18 31 Dec. 19
50.30%
43.04%
55%
50%
45%
40%
35%
49.36% 49.00%
40.77%
37.29%
30 Jun. 20
44.67%
IMMOFINANZ AGHalf-year Financial Report 2020
28
Unencumbered property by asset class Unencumbered property in total: MEUR 1,381.1
Composition of financial liabilities The financial liabilities held by IMMOFINANZ consist of amounts due to financial institutions as well as liabilities from bonds. The composition of these liabilities as of 30 June 2020 is as follows:
Weighted average interest rate of the financial liabilities Outstanding liability
in TEUR as of 30 06 2020Total average interest rate incl.
expenses for derivatives in %1
Convertible bond2 288,903.9 1.50Corporate bond 500,592.9 2.63Bank liabilities3 2,035,540.0 1.77IMMOFINANZ 2,825,036.9 1.89 1 Calculation basis: actual remaining debt (nominal amount) 2 Coupon reduced by 50 basis points to 1.50% as of 24 January 2019 following the receipt of an investment grade rating 3 Including IFRS 5
The remaining balance of the financial liabilities held by IMMOFINANZ totalled EUR 2,825.0 million as of 30 June 2020. As of that date, all financing was denominated in euros.
The bank liabilities represent secured loans which, in each case, were concluded by the respective property company as the borrower. Consequently, all rights and obligations from these loans are attributable to the borrower. These property loans include standard market obligations for compliance with specific financial covenants by the property company, which generally involve:
– Debt service coverage ratios – The ratio of the remaining debt to the market value of the property (Loan-to-Value)
The Covid-19 pandemic and the related curfews and legal restrictions led, in part, to the shutdown of properties, above all in the retail sector. Government assistance packages were also introduced to support the economy. Among others, the government measures give tenants the right to defer rental payments.
Rent reductions can result in the failure to meet individual financial covenants. This, in turn, can entitle the financing banks to call the outstanding loan prematurely if the borrower also fails to comply with contractually defined, accepted measures to remedy the situation. As a precautionary measure, IMMOFINANZ has therefore partly concluded agreements with the financing banks to suspend compliance with the debt service coverage ratio during the Covid-19 pandemic. The suspensions covered a total loan volume of EUR 690.6 million as of 30 June 2020 and were temporarily approved, in part up to the end of the current financial year. IMMOFINANZ is in regular contact and communication with its financing banks and is continuously evaluating the current situation.
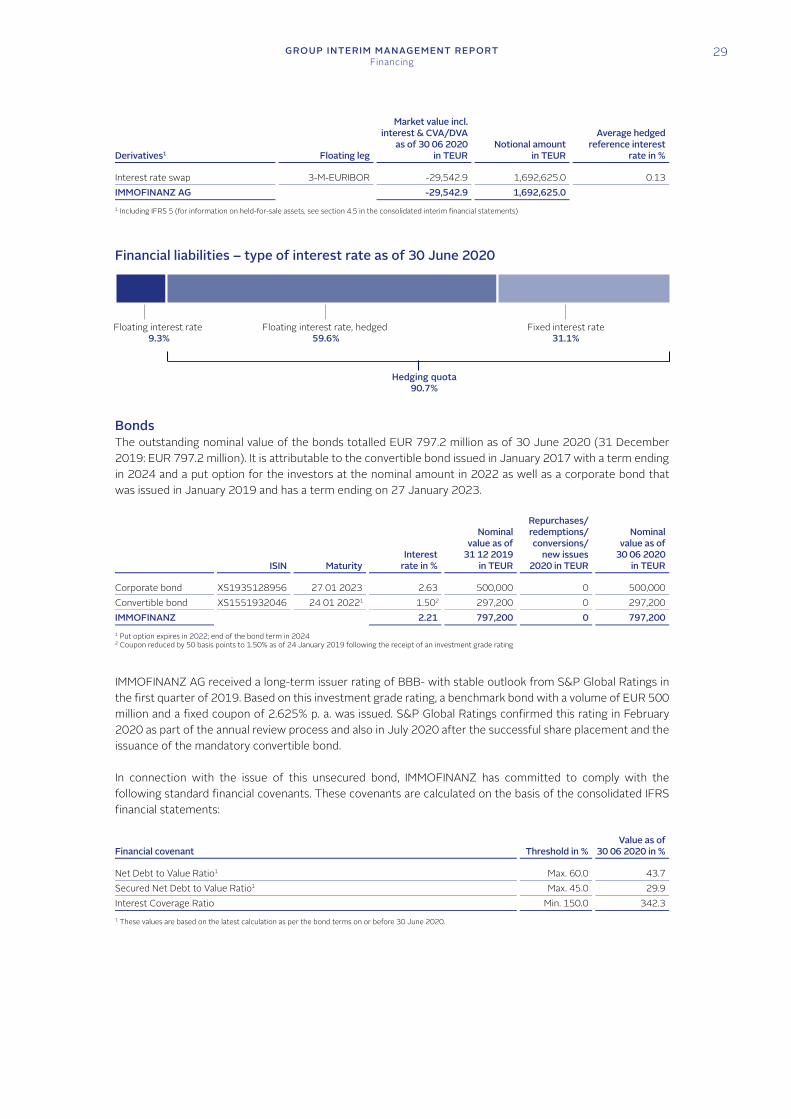
Derivatives IMMOFINANZ uses derivatives to hedge against interest rate increases. The volume of financial liabilities hedged through interest rate derivatives amounted to EUR 1,692.6 million as of 30 June 2020 (31 December 2019: EUR 1,694.1 million). In total, 90.7% of financial liabilities are hedged against interest rate risk (31 December 2019: 90.7%); 59.6% via interest rate derivatives, and a further 31.1% represent financial liabilities with fixed interest rates.
Office55.6%
Retail38.7%
Others5.7%
GROUP INTERIM MANAGEMENT REPORTFinancing
29
Derivatives1 Floating leg
Market value incl. interest & CVA/DVA
as of 30 06 2020 in TEUR
Notional amount in TEUR
Average hedgedreference interest
rate in % Interest rate swap 3-M-EURIBOR -29,542.9 1,692,625.0 0.13IMMOFINANZ AG -29,542.9 1,692,625.0 1 Including IFRS 5 (for information on held-for-sale assets, see section 4.5 in the consolidated interim financial statements)
Financial liabilities – type of interest rate as of 30 June 2020
Bonds The outstanding nominal value of the bonds totalled EUR 797.2 million as of 30 June 2020 (31 December 2019: EUR 797.2 million). It is attributable to the convertible bond issued in January 2017 with a term ending in 2024 and a put option for the investors at the nominal amount in 2022 as well as a corporate bond that was issued in January 2019 and has a term ending on 27 January 2023.
ISIN MaturityInterest
rate in %
Nominal value as of
31 12 2019in TEUR
Repurchases/ redemptions/ conversions/
new issues 2020 in TEUR
Nominal value as of
30 06 2020in TEUR
Corporate bond XS1935128956 27 01 2023 2.63 500,000 0 500,000Convertible bond XS1551932046 24 01 20221 1.502 297,200 0 297,200IMMOFINANZ 2.21 797,200 0 797,200 1 Put option expires in 2022; end of the bond term in 2024 2 Coupon reduced by 50 basis points to 1.50% as of 24 January 2019 following the receipt of an investment grade rating
IMMOFINANZ AG received a long-term issuer rating of BBB- with stable outlook from S&P Global Ratings in the first quarter of 2019. Based on this investment grade rating, a benchmark bond with a volume of EUR 500 million and a fixed coupon of 2.625% p. a. was issued. S&P Global Ratings confirmed this rating in February 2020 as part of the annual review process and also in July 2020 after the successful share placement and the issuance of the mandatory convertible bond.
In connection with the issue of this unsecured bond, IMMOFINANZ has committed to comply with the following standard financial covenants. These covenants are calculated on the basis of the consolidated IFRS financial statements:
Financial covenant Threshold in % Value as of
30 06 2020 in % Net Debt to Value Ratio1 Max. 60.0 43.7Secured Net Debt to Value Ratio1 Max. 45.0 29.9Interest Coverage Ratio Min. 150.0 342.3 1 These values are based on the latest calculation as per the bond terms on or before 30 June 2020.
Floating interest rate, hedged59.6%
Floating interest rate9.3%
Fixed interest rate31.1%
Hedging quota90.7%
IMMOFINANZ AGHalf-year Financial Report 2020
30
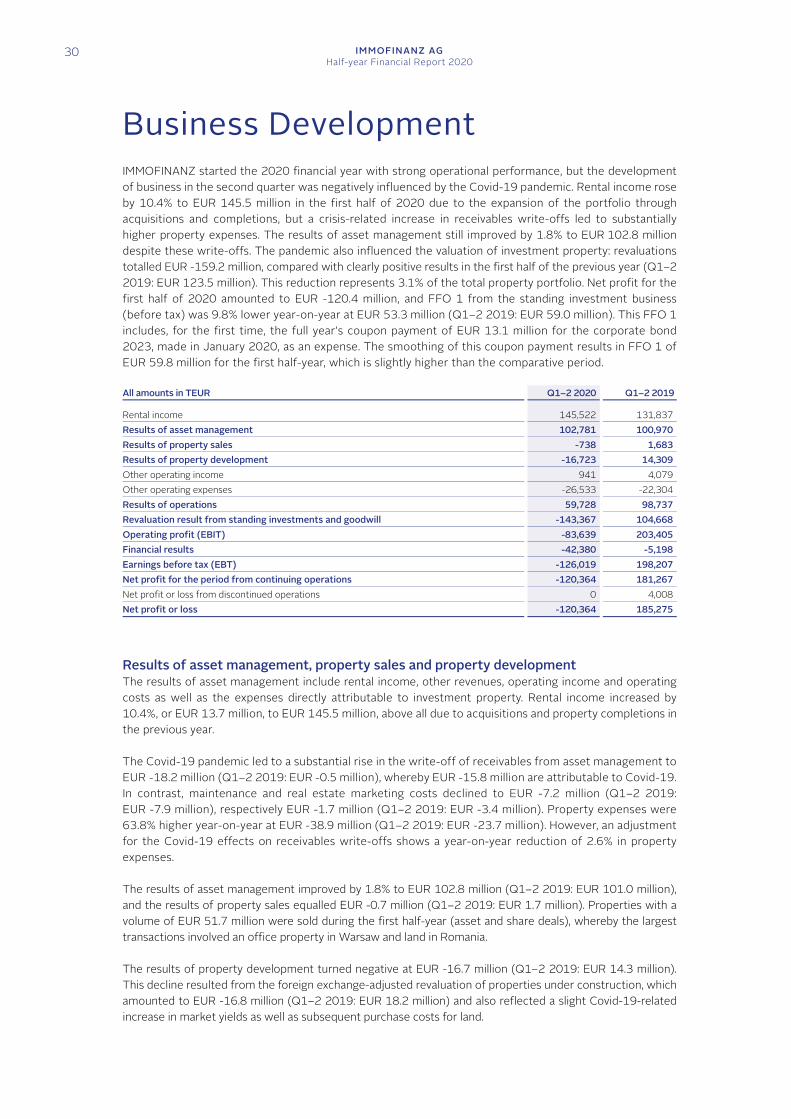
Business Development IMMOFINANZ started the 2020 financial year with strong operational performance, but the development of business in the second quarter was negatively influenced by the Covid-19 pandemic. Rental income rose by 10.4% to EUR 145.5 million in the first half of 2020 due to the expansion of the portfolio through acquisitions and completions, but a crisis-related increase in receivables write-offs led to substantially higher property expenses. The results of asset management still improved by 1.8% to EUR 102.8 million despite these write-offs. The pandemic also influenced the valuation of investment property: revaluations totalled EUR -159.2 million, compared with clearly positive results in the first half of the previous year (Q1–2 2019: EUR 123.5 million). This reduction represents 3.1% of the total property portfolio. Net profit for the first half of 2020 amounted to EUR -120.4 million, and FFO 1 from the standing investment business (before tax) was 9.8% lower year-on-year at EUR 53.3 million (Q1–2 2019: EUR 59.0 million). This FFO 1 includes, for the first time, the full year’s coupon payment of EUR 13.1 million for the corporate bond 2023, made in January 2020, as an expense. The smoothing of this coupon payment results in FFO 1 of EUR 59.8 million for the first half-year, which is slightly higher than the comparative period.
All amounts in TEUR Q1–2 2020 Q1–2 2019 Rental income 145,522 131,837Results of asset management 102,781 100,970Results of property sales -738 1,683Results of property development -16,723 14,309Other operating income 941 4,079Other operating expenses -26,533 -22,304Results of operations 59,728 98,737Revaluation result from standing investments and goodwill -143,367 104,668Operating profit (EBIT) -83,639 203,405Financial results -42,380 -5,198Earnings before tax (EBT) -126,019 198,207Net profit for the period from continuing operations -120,364 181,267Net profit or loss from discontinued operations 0 4,008Net profit or loss -120,364 185,275
Results of asset management, property sales and property development The results of asset management include rental income, other revenues, operating income and operating costs as well as the expenses directly attributable to investment property. Rental income increased by 10.4%, or EUR 13.7 million, to EUR 145.5 million, above all due to acquisitions and property completions in the previous year.
The Covid-19 pandemic led to a substantial rise in the write-off of receivables from asset management to EUR -18.2 million (Q1–2 2019: EUR -0.5 million), whereby EUR -15.8 million are attributable to Covid-19. In contrast, maintenance and real estate marketing costs declined to EUR -7.2 million (Q1–2 2019: EUR -7.9 million), respectively EUR -1.7 million (Q1–2 2019: EUR -3.4 million). Property expenses were 63.8% higher year-on-year at EUR -38.9 million (Q1–2 2019: EUR -23.7 million). However, an adjustment for the Covid-19 effects on receivables write-offs shows a year-on-year reduction of 2.6% in property expenses.
The results of asset management improved by 1.8% to EUR 102.8 million (Q1–2 2019: EUR 101.0 million), and the results of property sales equalled EUR -0.7 million (Q1–2 2019: EUR 1.7 million). Properties with a volume of EUR 51.7 million were sold during the first half-year (asset and share deals), whereby the largest transactions involved an office property in Warsaw and land in Romania.
The results of property development turned negative at EUR -16.7 million (Q1–2 2019: EUR 14.3 million). This decline resulted from the foreign exchange-adjusted revaluation of properties under construction, which amounted to EUR -16.8 million (Q1–2 2019: EUR 18.2 million) and also reflected a slight Covid-19-related increase in market yields as well as subsequent purchase costs for land.
GROUP INTERIM MANAGEMENT REPORTBusiness Development
31
Results of operations Other operating expenses rose by 19.0% to EUR -26.5 million (Q1–2 2019: EUR -22.3 million). The increase in personnel expenses included under this position is primarily attributable to a non-recurring payment related to the resignation of Oliver Schumy from the Executive Board. The results of operations equalled EUR 59.7 million and were 39.5% lower than the first half of the previous year (Q1–2 2019: EUR 98.7 million).
Revaluation and operating profit Results from the revaluation of standing investments and goodwill totalled EUR -143.4 million (Q1–2 2019: EUR 104.7 million), chiefly due to the negative effects of the Covid-19 pandemic. This decline in value represents roughly 3.1% of the carrying amount of the standing investments as of 30 June 2020. Retail properties were written down by EUR -68.1 million (4.2% of the carrying amount) and office properties by EUR -74.8 million (2.5% of the carrying amount). The external appraisals by CBRE reflected slightly higher market yields (increase of up to 0.5% in the retail segment) as well as changed assumptions concerning re-rentals in the portfolio properties.
Operating profit (EBIT) declined from EUR 203.4 million in the first half of 2019 to EUR -83.6 million.
Financial results and taxes Financing costs rose by 19.4% to EUR -37.7 million (Q1–2 2019: EUR -31.6 million) as a result of property acquisitions and a 14.1% increase in the total financing volume. Moreover, the comparative prior year value included a positive effect of EUR 4.2 million from the reduction of the coupon for the convertible bond 2024 (adjustment of the effective interest method). Average financing costs, including hedging, equalled 1.89% per year (31 December 2019: 1.91%). Other financial results amounted to EUR -12.4 million (Q1–2 2019: EUR -16.2 million) and resulted chiefly from the valuation of interest rate derivatives in the current low-interest environment.
The share of profit/loss from equity-accounted investments amounted to EUR 6.4 million (Q1–2 2019: EUR 43.4 million), whereby EUR 4.5 million are attributable to the share of earnings from S IMMO. Financial results totalled EUR -42.4 million in the first half of 2020 (Q1–2 2019: EUR -5.2 million).
Net profit Profit before tax amounted to EUR -126.0 million (Q1–2 2019: EUR 198.2 million). The negative revaluation of investment properties led to a positive effect in deferred taxes, and income tax equalled EUR 5.7 million for the first half of 2020 (Q1–2 2019: EUR -16.9 million). Net profit amounted to EUR -120.4 million (Q1–2 2019: EUR 185.3 million), which represents earnings per share (basic) of EUR -1.19 (Q1–2 2019: EUR 1.72).
IMMOFINANZ AGHalf-year Financial Report 2020
32
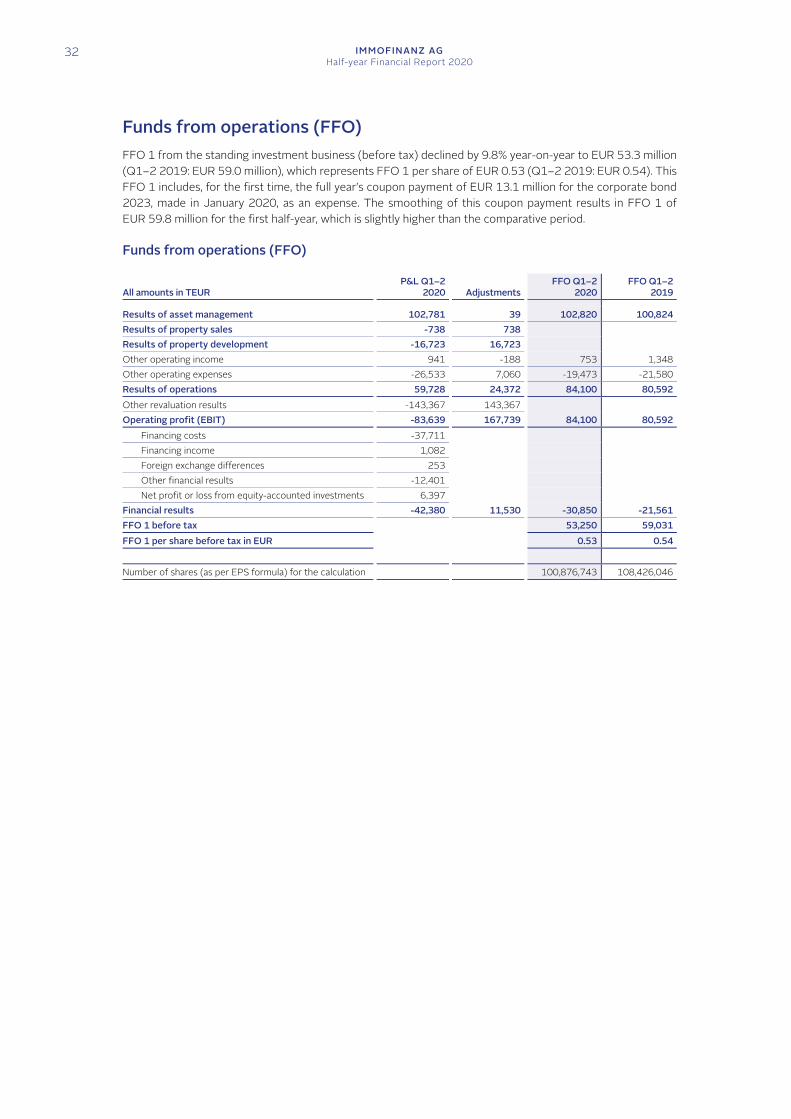
Funds from operations (FFO) FFO 1 from the standing investment business (before tax) declined by 9.8% year-on-year to EUR 53.3 million (Q1–2 2019: EUR 59.0 million), which represents FFO 1 per share of EUR 0.53 (Q1–2 2019: EUR 0.54). This FFO 1 includes, for the first time, the full year’s coupon payment of EUR 13.1 million for the corporate bond 2023, made in January 2020, as an expense. The smoothing of this coupon payment results in FFO 1 of EUR 59.8 million for the first half-year, which is slightly higher than the comparative period.
Funds from operations (FFO)
All amounts in TEUR P&L Q1–2
2020 AdjustmentsFFO Q1–2
2020 FFO Q1–2
2019 Results of asset management 102,781 39 102,820 100,824Results of property sales -738 738 Results of property development -16,723 16,723 Other operating income 941 -188 753 1,348Other operating expenses -26,533 7,060 -19,473 -21,580Results of operations 59,728 24,372 84,100 80,592Other revaluation results -143,367 143,367 Operating profit (EBIT) -83,639 167,739 84,100 80,592
Financing costs -37,711 Financing income 1,082 Foreign exchange differences 253 Other financial results -12,401 Net profit or loss from equity-accounted investments 6,397
Financial results -42,380 11,530 -30,850 -21,561FFO 1 before tax 53,250 59,031FFO 1 per share before tax in EUR 0.53 0.54 Number of shares (as per EPS formula) for the calculation 100,876,743 108,426,046
GROUP INTERIM MANAGEMENT REPORTBusiness Development
33
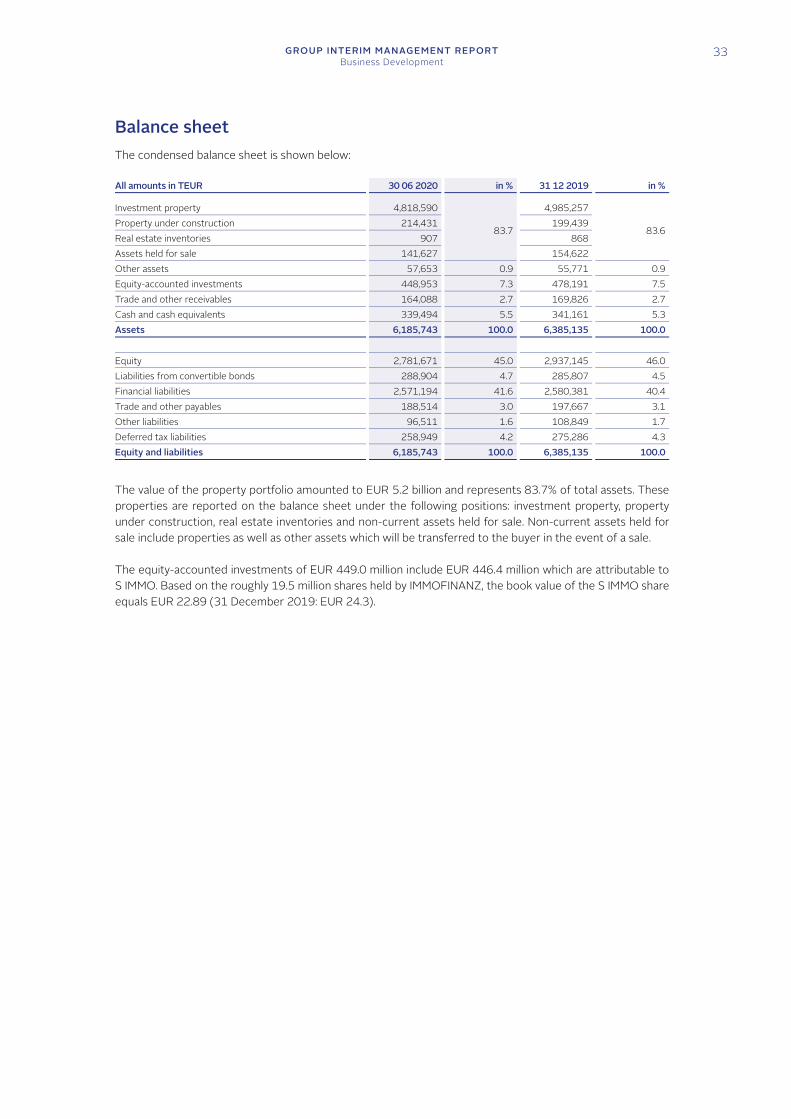
Balance sheet The condensed balance sheet is shown below:
All amounts in TEUR 30 06 2020 in % 31 12 2019 in % Investment property 4,818,590
83.7
4,985,257
83.6Property under construction 214,431 199,439 Real estate inventories 907 868 Assets held for sale 141,627 154,622 Other assets 57,653 0.9 55,771 0.9Equity-accounted investments 448,953 7.3 478,191 7.5Trade and other receivables 164,088 2.7 169,826 2.7Cash and cash equivalents 339,494 5.5 341,161 5.3Assets 6,185,743 100.0 6,385,135 100.0 Equity 2,781,671 45.0 2,937,145 46.0Liabilities from convertible bonds 288,904 4.7 285,807 4.5Financial liabilities 2,571,194 41.6 2,580,381 40.4Trade and other payables 188,514 3.0 197,667 3.1Other liabilities 96,511 1.6 108,849 1.7Deferred tax liabilities 258,949 4.2 275,286 4.3Equity and liabilities 6,185,743 100.0 6,385,135 100.0
The value of the property portfolio amounted to EUR 5.2 billion and represents 83.7% of total assets. These properties are reported on the balance sheet under the following positions: investment property, property under construction, real estate inventories and non-current assets held for sale. Non-current assets held for sale include properties as well as other assets which will be transferred to the buyer in the event of a sale.
The equity-accounted investments of EUR 449.0 million include EUR 446.4 million which are attributable to S IMMO. Based on the roughly 19.5 million shares held by IMMOFINANZ, the book value of the S IMMO share equals EUR 22.89 (31 December 2019: EUR 24.3).
IMMOFINANZ AGHalf-year Financial Report 2020
34
EPRA Financial Indicators
Net Asset Value (NAV) and Triple Net Asset Value (NNNAV) The calculation of EPRA NAV and EPRA NNNAV – in contrast to 31 December 2019 – does not include any potential diluting effects from the conversion of the IMMOFINANZ convertible bond 2024 because the bond was “not in the money” as of 30 June 2020.
Basic EPRA NAV per share equalled EUR 30.93 as of 30 June 2020 (31 December 2019: diluted EUR 31.05). The absence of the dilution had a positive effect of EUR 1.23 per share (see reconciliation below). Basic EPRA NNNAV per share equalled EUR 30.54 (31 December 2019: diluted EUR 30.63).
The book value per share equalled EUR 27.82 (31 December 2019: EUR 29.34).
The results of the NAV and NNNAV calculations are shown below:
30 06 2020 31 12 2019
in TEUR in EUR per share in TEUR in EUR per share Equity excluding non-controlling interests 2,806,042 2,960,094 Diluting effects of convertible bond 2024 0 285,807 Diluted equity excluding non-controlling interests after an adjustment for convertible bonds and the exercise of options 2,806,042 3,245,901
Undisclosed reserves in real estate inventories 0 2 Fair value of derivative financial instruments 29,332 18,311 Deferred taxes on investment property 314,400 327,275 Deferred taxes on real estate inventories and derivative financial instruments -5,782 -3,590 Goodwill resulting from deferred taxes -24,185 -24,184
Number of shares excluding treasury shares (in 1,000) 100,877 100,877Potential shares (in 1,000) 0 13,903EPRA NAV 3,119,807 30.93 3,563,715 31.05Fair value of derivative financial instruments -29,332 -18,311 Effect of fair value measurement of financial liabilities -19,333 -30,240 Deferred taxes on derivative financial instruments and the fair value measurement of financial liabilities 10,616 11,150 Deferred taxes on investment property -1,421 -10,253 EPRA NNNAV 3,080,337 30.54 3,516,061 30.63
The European Public Real Estate Association (EPRA) recommends the publication of a revised version of the Net Asset Value (NAV) indicators beginning with the annual financial statements for 2020. The NAV and NNNAV indicators are expected to be replaced by three new indicators at the end of 2020: Net Tangible Assets (NTA), Net Reinstatement Value (NRV) and Net Disposal Value (NDV).
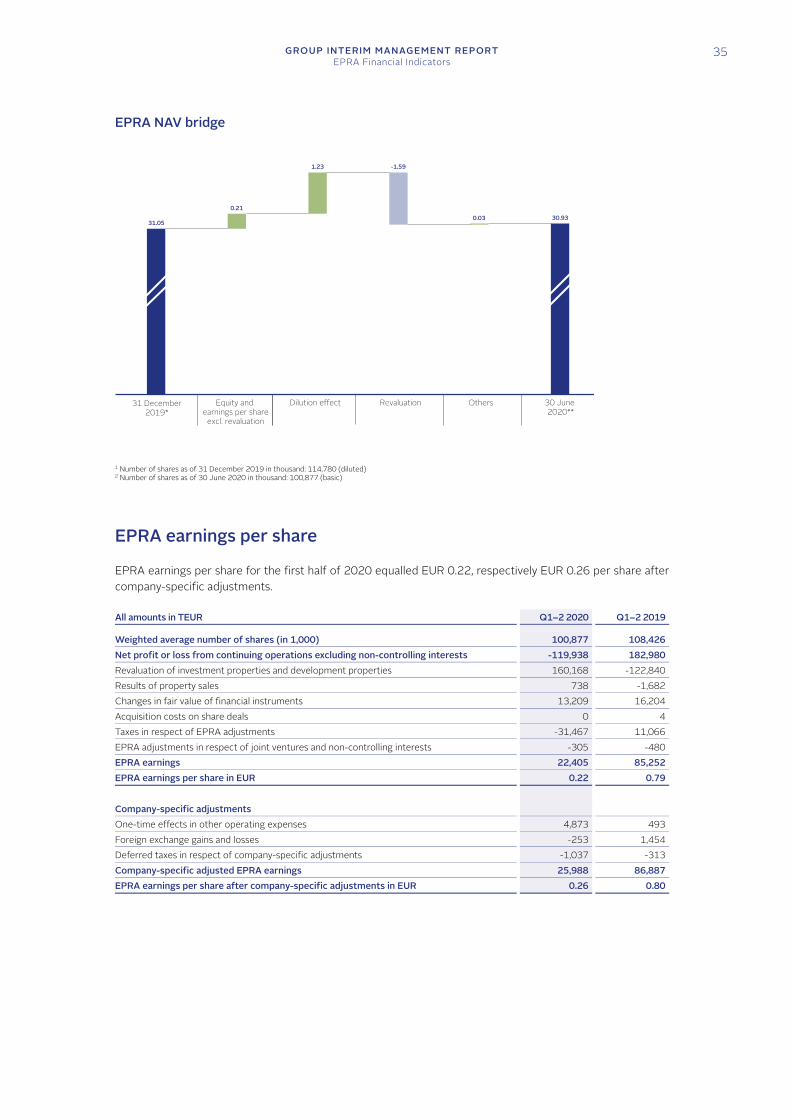
GROUP INTERIM MANAGEMENT REPORTEPRA Financial Indicators
35
EPRA NAV bridge
1 Number of shares as of 31 December 2019 in thousand: 114,780 (diluted) 2 Number of shares as of 30 June 2020 in thousand: 100,877 (basic)
EPRA earnings per share
EPRA earnings per share for the first half of 2020 equalled EUR 0.22, respectively EUR 0.26 per share after company-specific adjustments.
All amounts in TEUR Q1–2 2020 Q1–2 2019 Weighted average number of shares (in 1,000) 100,877 108,426Net profit or loss from continuing operations excluding non-controlling interests -119,938 182,980Revaluation of investment properties and development properties 160,168 -122,840Results of property sales 738 -1,682Changes in fair value of financial instruments 13,209 16,204Acquisition costs on share deals 0 4Taxes in respect of EPRA adjustments -31,467 11,066EPRA adjustments in respect of joint ventures and non-controlling interests -305 -480EPRA earnings 22,405 85,252EPRA earnings per share in EUR 0.22 0.79 Company-specific adjustments One-time effects in other operating expenses 4,873 493Foreign exchange gains and losses -253 1,454Deferred taxes in respect of company-specific adjustments -1,037 -313Company-specific adjusted EPRA earnings 25,988 86,887EPRA earnings per share after company-specific adjustments in EUR 0.26 0.80
31.05
1.23 -1.59
0.03 30.93
31 December2019*
Equity and earnings per share
excl. revaluation
Dilution effect 30 June2020**
OthersRevaluation
0.21
IMMOFINANZ AGHalf-year Financial Report 2020
36
EPRA net initial yield The EPRA net initial yield rose from 5.7% at year-end 2019 to 5.9%.
All amounts in TEUR Q1–2 2020 2019 Investment property 4,832,929 5,005,974Investment property – proportional share of joint ventures 1,268 1,267
less undeveloped land -178,186 -166,756less undeveloped land – proportional share of joint ventures -1,268 0
Total property portfolio 4,654,743 4,840,485Allowance for estimated purchasers’ costs 91,233 94,874Gross value of total standing investment portfolio 4,745,976 4,935,359Annualised cash rental income 306,581 311,939Non-recoverable property operating expenses -27,964 -28,452Non-recoverable property operating expenses – proportional share of joint ventures 0 -5Annualised net rental income 278,617 283,482EPRA net initial yield in % 5.9 5.7
EPRA vacancy rate The EPRA vacancy rate equals 4.0% (31 December 2019: 3.2%). At 1.5%, the STOP SHOP retail parks had the lowest vacancy rate as of 30 June 2020.
EPRA vacancy rate by core market
All amounts in % Standing investments
as of 30 06 2020Standing investments
as of 31 12 2019 Austria 8.5 4.9Germany 1.2 1.7Poland 2.6 1.7Czech Republic 3.4 3.2Hungary 3.4 2.8Romania 4.7 5.0Slovakia 6.0 5.5Other countries 1.6 0.7IMMOFINANZ 4.0 3.2
EPRA vacancy rate by asset class and brand
All amounts in % Standing investments
as of 30 06 2020Standing investments
as of 31 12 2019 Office 5.1 4.2
thereof myhive 5.7 4.6Retail 2.5 1.9
thereof VIVO!/Shopping Center 3.6 2.7thereof STOP SHOP/Retail Park 1.5 1.2
IMMOFINANZ 4.0 3.2
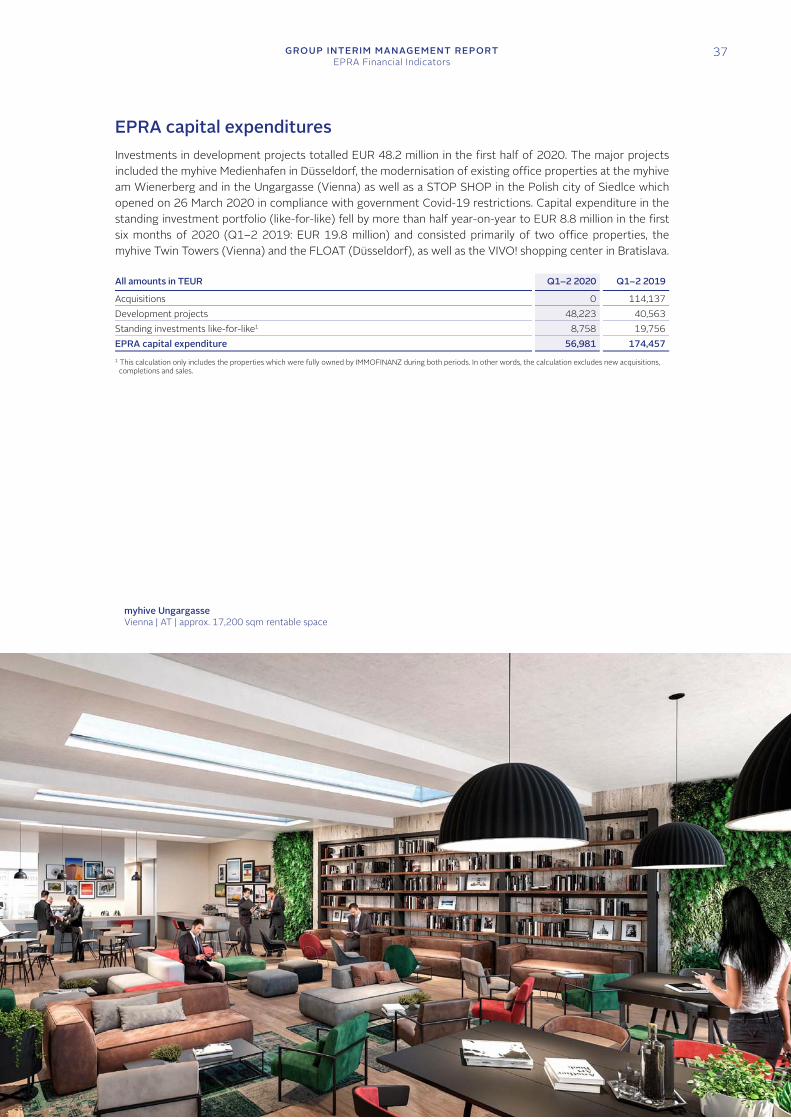
GROUP INTERIM MANAGEMENT REPORTEPRA Financial Indicators
37
EPRA capital expenditures Investments in development projects totalled EUR 48.2 million in the first half of 2020. The major projects included the myhive Medienhafen in Düsseldorf, the modernisation of existing office properties at the myhive am Wienerberg and in the Ungargasse (Vienna) as well as a STOP SHOP in the Polish city of Siedlce which opened on 26 March 2020 in compliance with government Covid-19 restrictions. Capital expenditure in the standing investment portfolio (like-for-like) fell by more than half year-on-year to EUR 8.8 million in the first six months of 2020 (Q1–2 2019: EUR 19.8 million) and consisted primarily of two office properties, the myhive Twin Towers (Vienna) and the FLOAT (Düsseldorf), as well as the VIVO! shopping center in Bratislava.
All amounts in TEUR Q1–2 2020 Q1–2 2019
Acquisitions 0 114,137Development projects 48,223 40,563Standing investments like-for-like1 8,758 19,756EPRA capital expenditure 56,981 174,457 1 This calculation only includes the properties which were fully owned by IMMOFINANZ during both periods. In other words, the calculation excludes new acquisitions,
completions and sales.
myhive Ungargasse Vienna | AT | approx. 17,200 sqm rentable space
IMMOFINANZ AGHalf-year Financial Report 2020
38
Risk Report As an international real estate investor, property owner and project developer, IMMOFINANZ is exposed to a variety of general and branch-specific risks in its business operations. An integrated risk management process provides the Group with a sound basis for the timely identification of potential risks and the assessment of the potential consequences.
Based on the hedging and management instruments currently in use, no material risks can be identified at the present time that could endanger the company’s standing as a going concern. The overall risk situation for the first half of 2020 was classified as elevated due to the Covid-19 pandemic and its effects.
Risks in the first half of 2020 Market and property-specific risks A macroeconomic evaluation shows that the Covid-19 pandemic has triggered the strongest recession since World War II. Economic output in the eurozone fell by 12.1% in the second quarter of 2020 as described in the section “Economic Overview and Property Markets”, and unemployment increased in IMMOFINANZ’s core countries. This situation has improved with the resumption of economic activity, but the extent and duration of the pandemic as well as possible future containment measures are still impossible to predict. A further risk factor involves the rising political tensions between China and the USA. The Covid-19 pandemic also led to a substantial decline in the oil price, which has had a substantial negative impact on the budgets of the oil-producing countries.
The economic support measures announced by the European Central Bank (ECB) included the reopening of the bond purchase programme and the provision of additional liquidity for the European banking sector. The European Union compiled a rescue package for the countries hardest hit by the pandemic, while national governments introduced measures to strengthen consumer spending and support businesses. However, further negative implications for economic growth and the negative effects of the crisis on IMMOFINANZ’s net profit cannot be excluded during the remainder of the year. These factors are related, among others, to a potential subsequent wave of bankruptcies following the expiration of government support programmes. A wave of bankruptcies could increase the risk of a deterioration in the financing environment for companies. Banks negatively affected by write-offs could cease to be available as financing partners, and this could lead to a dangerous liquidity shortage on the capital market. IMMOFINANZ therefore sees the protection of sufficient liquidity as a key priority in the event this scenario materialises.
The first half of 2020 was influenced by the Covid-19 pandemic and its impact on the real estate sector. In order to offset the temporary decline in rental income from the retail business on cash flow, IMMOFINANZ’s management introduced a cost savings programme in March. It includes, among others, the postponement of non-essential investments and expenditures, the reduction of overheads and the renegotiation of supplier contracts. The equity structure was also strengthened by capital measures after the end of the reporting period. On the revenue side, individual solutions were developed together with retail tenants to assist them in overcoming the crisis and marketing activities were launched to ensure the rapid recovery of visitor frequency in the retail properties. In the office business, tenants received support for a smooth return to work. Back-to-office plans were prepared with a focus on room concepts, distance guidelines, disinfection, protective measures and access rules. A separate task force was installed to manage hygiene procedures for the common areas to ensure the safe use of office and retail space.
IMMOFINANZ was affected by the government-ordered, temporary shutdown of retail facilities and – up to now only a few – tenant bankruptcies. In individual countries, rental payments in the retail and office sector were deferred by government directives. Voluntary retrospective and prospective rental price reductions were also agreed as were the deferral of rents and contract term extensions. Construction was also delayed on several development projects. The immediate installation of a crisis staff and the introduction of internal emergency measures substantially reduced the impact on the operating business. This active risk management will be continued during the second half-year, but future periods carry the general risk of possible tenant bankruptcies as well as the risks connected with new rentals and the re-rental of vacant space.
GROUP INTERIM MANAGEMENT REPORTRisk Report
39
The foreseeable long-term effects of the Covid-19 pandemic include, for example, changes in consumer behaviour and changes in the modern working world, both of which will have an influence on IMMOFINANZ’s real estate solutions. In the retail sector, this could range from more conscious purchasing behaviour to the avoidance of public areas. In the office sector, the focus on home office could increase and the current recession could lead to changes in the demand for office space. With its cost-efficient STOP SHOP and VIVO! retail concepts and high-quality, innovative office solutions, the Executive Board of IMMOFINANZ sees itself well positioned to meet these challenges.
The development projects currently in progress by IMMOFINANZ (property under construction) have a carrying amount of EUR 192.0 million (31 December 2019: EUR 177.5 million). The outstanding construction costs for these development projects totalled EUR 76.0 million as of 30 June 2020 (31 December 2019: EUR 111.9 million). The pipeline projects, including real estate inventories, had a carrying amount of EUR 180.2 million as of 30 June 2020 (31 December 2019: EUR 173.2 million).
Business and other risks IMMOFINANZ is also exposed to other risks in connection with its business activities. These legal, compliance, environmental, tax and human resources risks remained generally unchanged in comparison with the 2019 financial year.
IMMOFINANZ AG acquired 19,499,437 bearer shares in S IMMO AG through share purchase contracts dated 18 April 2018. The transaction closed on 21 September 2018. The S IMMO share is listed in the Prime Segment of the Vienna Stock Exchange and is therefore exposed to market price risks. The equity method is used to account for this investment: as of 30 June 2020, the carrying amount of the S IMMO investment equalled EUR 446.4 million, which represents 7.2% of IMMOFINANZ’s total assets. The purchase of these shares was not financed externally.
Significant events which occurred after the end of the reporting period are discussed in section 8 of the consolidated interim financial statements.
Vienna, 26 August 2020
The Executive Board
Ronny Pecik CEO
Stefan Schönauer CFO
Dietmar Reindl COO
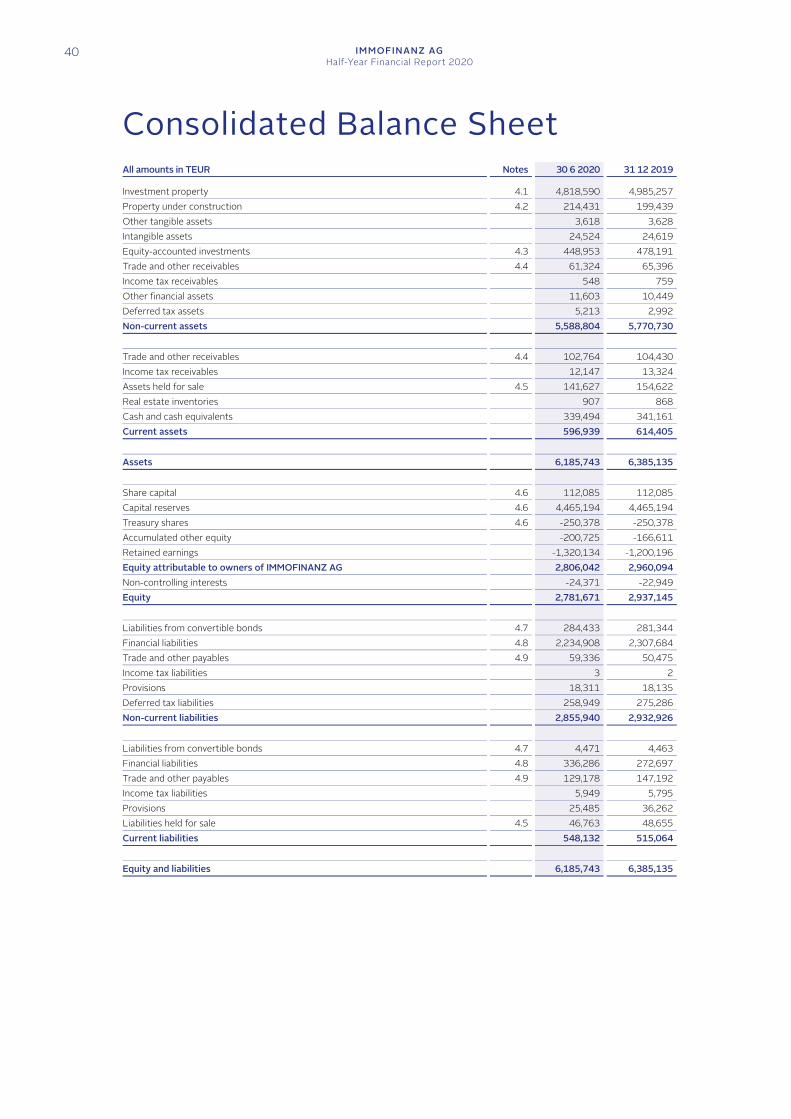
40 IMMOFINANZ AGHalf-Year Financial Report 2020
Consolidated Balance Sheet All amounts in TEUR Notes 30 6 2020 31 12 2019 Investment property 4.1 4,818,590 4,985,257Property under construction 4.2 214,431 199,439Other tangible assets 3,618 3,628Intangible assets 24,524 24,619Equity-accounted investments 4.3 448,953 478,191Trade and other receivables 4.4 61,324 65,396Income tax receivables 548 759Other financial assets 11,603 10,449Deferred tax assets 5,213 2,992Non-current assets 5,588,804 5,770,730 Trade and other receivables 4.4 102,764 104,430Income tax receivables 12,147 13,324Assets held for sale 4.5 141,627 154,622Real estate inventories 907 868Cash and cash equivalents 339,494 341,161Current assets 596,939 614,405 Assets 6,185,743 6,385,135 Share capital 4.6 112,085 112,085Capital reserves 4.6 4,465,194 4,465,194Treasury shares 4.6 -250,378 -250,378Accumulated other equity -200,725 -166,611Retained earnings -1,320,134 -1,200,196Equity attributable to owners of IMMOFINANZ AG 2,806,042 2,960,094Non-controlling interests -24,371 -22,949Equity 2,781,671 2,937,145 Liabilities from convertible bonds 4.7 284,433 281,344Financial liabilities 4.8 2,234,908 2,307,684Trade and other payables 4.9 59,336 50,475Income tax liabilities 3 2Provisions 18,311 18,135Deferred tax liabilities 258,949 275,286Non-current liabilities 2,855,940 2,932,926 Liabilities from convertible bonds 4.7 4,471 4,463Financial liabilities 4.8 336,286 272,697Trade and other payables 4.9 129,178 147,192Income tax liabilities 5,949 5,795Provisions 25,485 36,262Liabilities held for sale 4.5 46,763 48,655Current liabilities 548,132 515,064 Equity and liabilities 6,185,743 6,385,135
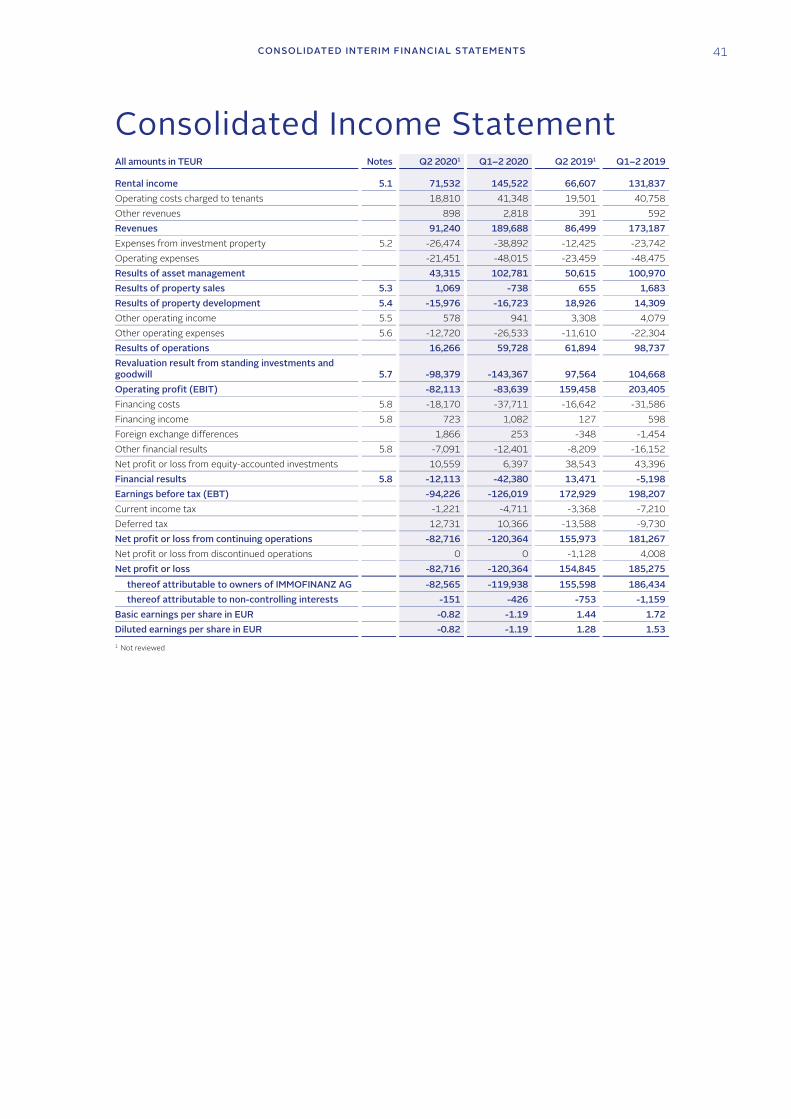
CONSOLIDATED INTERIM FINANCIAL STATEMENTS 41
Consolidated Income Statement All amounts in TEUR Notes Q2 20201 Q1–2 2020 Q2 20191 Q1–2 2019 Rental income 5.1 71,532 145,522 66,607 131,837Operating costs charged to tenants 18,810 41,348 19,501 40,758Other revenues 898 2,818 391 592Revenues 91,240 189,688 86,499 173,187Expenses from investment property 5.2 -26,474 -38,892 -12,425 -23,742Operating expenses -21,451 -48,015 -23,459 -48,475Results of asset management 43,315 102,781 50,615 100,970Results of property sales 5.3 1,069 -738 655 1,683Results of property development 5.4 -15,976 -16,723 18,926 14,309Other operating income 5.5 578 941 3,308 4,079Other operating expenses 5.6 -12,720 -26,533 -11,610 -22,304Results of operations 16,266 59,728 61,894 98,737Revaluation result from standing investments and goodwill 5.7 -98,379 -143,367 97,564 104,668Operating profit (EBIT) -82,113 -83,639 159,458 203,405Financing costs 5.8 -18,170 -37,711 -16,642 -31,586Financing income 5.8 723 1,082 127 598Foreign exchange differences 1,866 253 -348 -1,454Other financial results 5.8 -7,091 -12,401 -8,209 -16,152Net profit or loss from equity-accounted investments 10,559 6,397 38,543 43,396Financial results 5.8 -12,113 -42,380 13,471 -5,198Earnings before tax (EBT) -94,226 -126,019 172,929 198,207Current income tax -1,221 -4,711 -3,368 -7,210Deferred tax 12,731 10,366 -13,588 -9,730Net profit or loss from continuing operations -82,716 -120,364 155,973 181,267Net profit or loss from discontinued operations 0 0 -1,128 4,008Net profit or loss -82,716 -120,364 154,845 185,275
thereof attributable to owners of IMMOFINANZ AG -82,565 -119,938 155,598 186,434thereof attributable to non-controlling interests -151 -426 -753 -1,159
Basic earnings per share in EUR -0.82 -1.19 1.44 1.72Diluted earnings per share in EUR -0.82 -1.19 1.28 1.53 1 Not reviewed
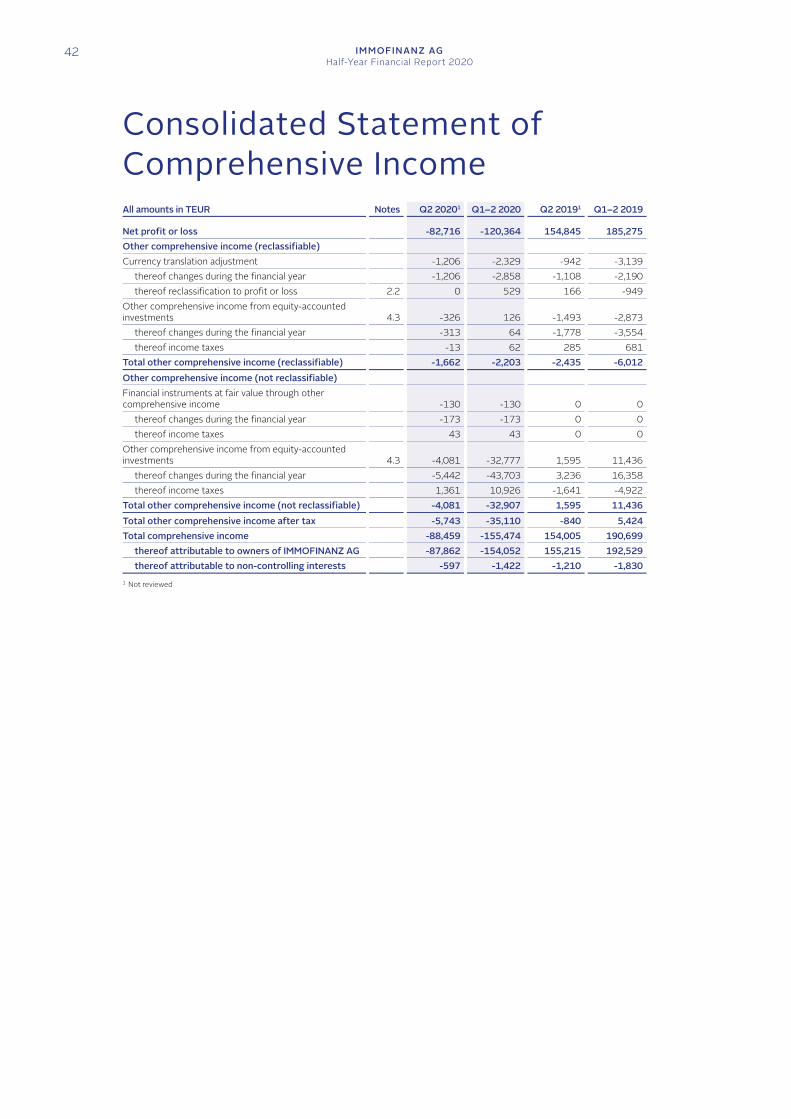
42 IMMOFINANZ AGHalf-Year Financial Report 2020
Consolidated Statement of Comprehensive Income All amounts in TEUR Notes Q2 20201 Q1–2 2020 Q2 20191 Q1–2 2019 Net profit or loss -82,716 -120,364 154,845 185,275 Other comprehensive income (reclassifiable) Currency translation adjustment -1,206 -2,329 -942 -3,139
thereof changes during the financial year -1,206 -2,858 -1,108 -2,190 thereof reclassification to profit or loss 2.2 0 529 166 -949
Other comprehensive income from equity-accounted investments 4.3 -326 126 -1,493 -2,873
thereof changes during the financial year -313 64 -1,778 -3,554 thereof income taxes -13 62 285 681
Total other comprehensive income (reclassifiable) -1,662 -2,203 -2,435 -6,012 Other comprehensive income (not reclassifiable) Financial instruments at fair value through other comprehensive income -130 -130 0 0
thereof changes during the financial year -173 -173 0 0 thereof income taxes 43 43 0 0
Other comprehensive income from equity-accounted investments 4.3 -4,081 -32,777 1,595 11,436
thereof changes during the financial year -5,442 -43,703 3,236 16,358 thereof income taxes 1,361 10,926 -1,641 -4,922
Total other comprehensive income (not reclassifiable) -4,081 -32,907 1,595 11,436 Total other comprehensive income after tax -5,743 -35,110 -840 5,424 Total comprehensive income -88,459 -155,474 154,005 190,699
thereof attributable to owners of IMMOFINANZ AG -87,862 -154,052 155,215 192,529 thereof attributable to non-controlling interests -597 -1,422 -1,210 -1,830
1 Not reviewed
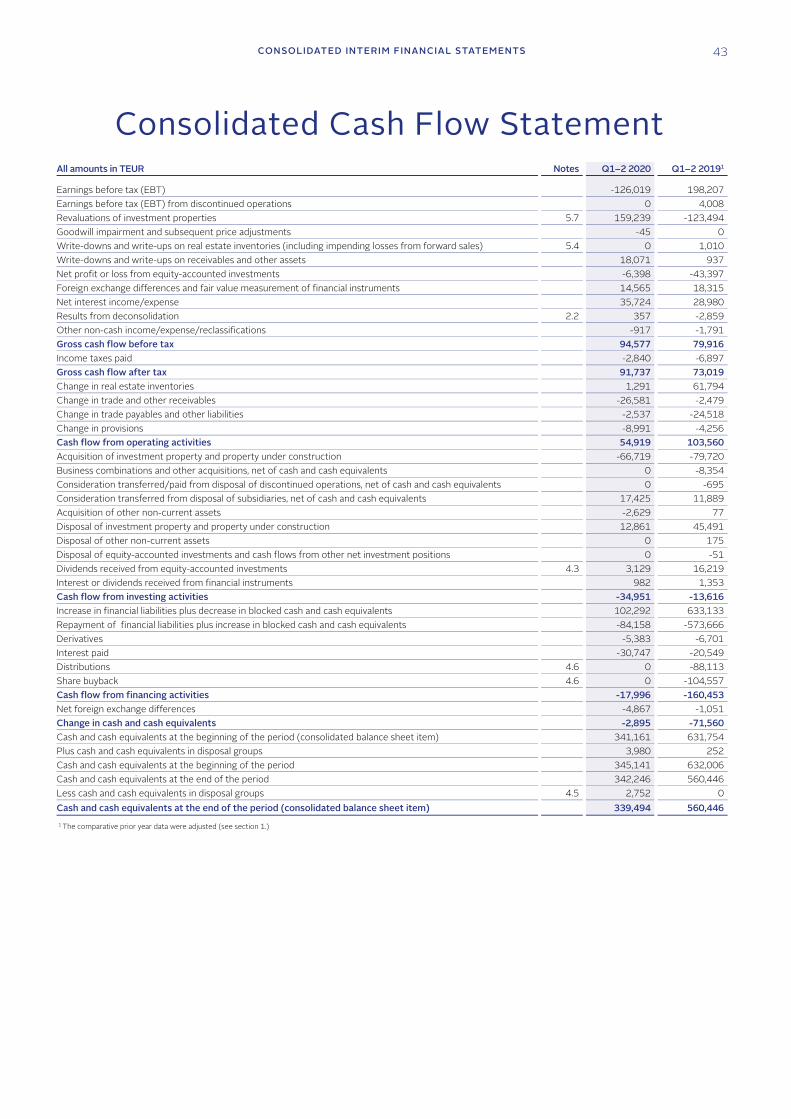
CONSOLIDATED INTERIM FINANCIAL STATEMENTS 43
Consolidated Cash Flow Statement All amounts in TEUR Notes Q1–2 2020 Q1–2 20191
Earnings before tax (EBT) -126,019 198,207Earnings before tax (EBT) from discontinued operations 0 4,008Revaluations of investment properties 5.7 159,239 -123,494Goodwill impairment and subsequent price adjustments -45 0Write-downs and write-ups on real estate inventories (including impending losses from forward sales) 5.4 0 1,010Write-downs and write-ups on receivables and other assets 18,071 937Net profit or loss from equity-accounted investments -6,398 -43,397Foreign exchange differences and fair value measurement of financial instruments 14,565 18,315Net interest income/expense 35,724 28,980Results from deconsolidation 2.2 357 -2,859Other non-cash income/expense/reclassifications -917 -1,791Gross cash flow before tax 94,577 79,916Income taxes paid -2,840 -6,897Gross cash flow after tax 91,737 73,019Change in real estate inventories 1,291 61,794Change in trade and other receivables -26,581 -2,479Change in trade payables and other liabilities -2,537 -24,518Change in provisions -8,991 -4,256Cash flow from operating activities 54,919 103,560Acquisition of investment property and property under construction -66,719 -79,720Business combinations and other acquisitions, net of cash and cash equivalents 0 -8,354Consideration transferred/paid from disposal of discontinued operations, net of cash and cash equivalents 0 -695Consideration transferred from disposal of subsidiaries, net of cash and cash equivalents 17,425 11,889Acquisition of other non-current assets -2,629 77Disposal of investment property and property under construction 12,861 45,491Disposal of other non-current assets 0 175Disposal of equity-accounted investments and cash flows from other net investment positions 0 -51Dividends received from equity-accounted investments 4.3 3,129 16,219Interest or dividends received from financial instruments 982 1,353Cash flow from investing activities -34,951 -13,616Increase in financial liabilities plus decrease in blocked cash and cash equivalents 102,292 633,133Repayment of financial liabilities plus increase in blocked cash and cash equivalents -84,158 -573,666Derivatives -5,383 -6,701Interest paid -30,747 -20,549Distributions 4.6 0 -88,113Share buyback 4.6 0 -104,557Cash flow from financing activities -17,996 -160,453Net foreign exchange differences -4,867 -1,051Change in cash and cash equivalents -2,895 -71,560Cash and cash equivalents at the beginning of the period (consolidated balance sheet item) 341,161 631,754Plus cash and cash equivalents in disposal groups 3,980 252Cash and cash equivalents at the beginning of the period 345,141 632,006Cash and cash equivalents at the end of the period 342,246 560,446Less cash and cash equivalents in disposal groups 4.5 2,752 0Cash and cash equivalents at the end of the period (consolidated balance sheet item) 339,494 560,446 1 The comparative prior year data were adjusted (see section 1.)
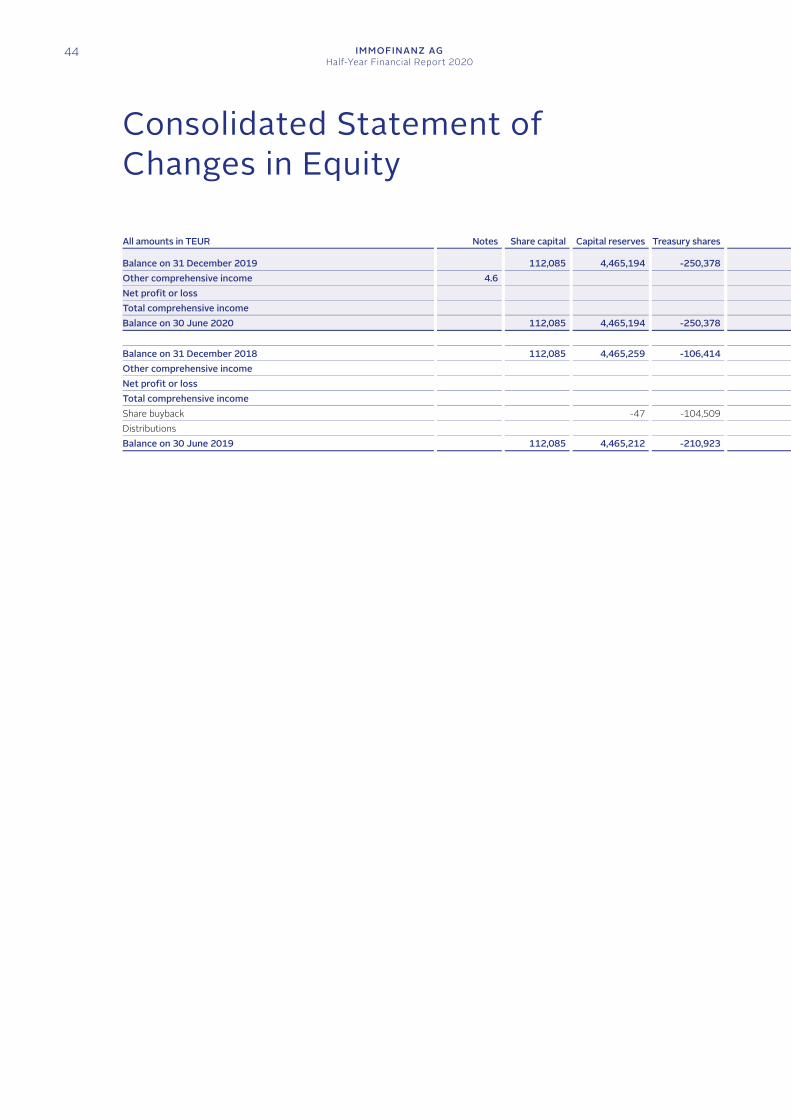
44 IMMOFINANZ AGHalf-Year Financial Report 2020
Consolidated Statement of Changes in Equity
All amounts in TEUR Notes Share capital Capital reserves Treasury shares Balance on 31 December 2019 112,085 4,465,194 -250,378 Other comprehensive income 4.6 Net profit or loss Total comprehensive income Balance on 30 June 2020 112,085 4,465,194 -250,378 Balance on 31 December 2018 112,085 4,465,259 -106,414 Other comprehensive income Net profit or loss Total comprehensive income Share buyback -47 -104,509 Distributions Balance on 30 June 2019 112,085 4,465,212 -210,923
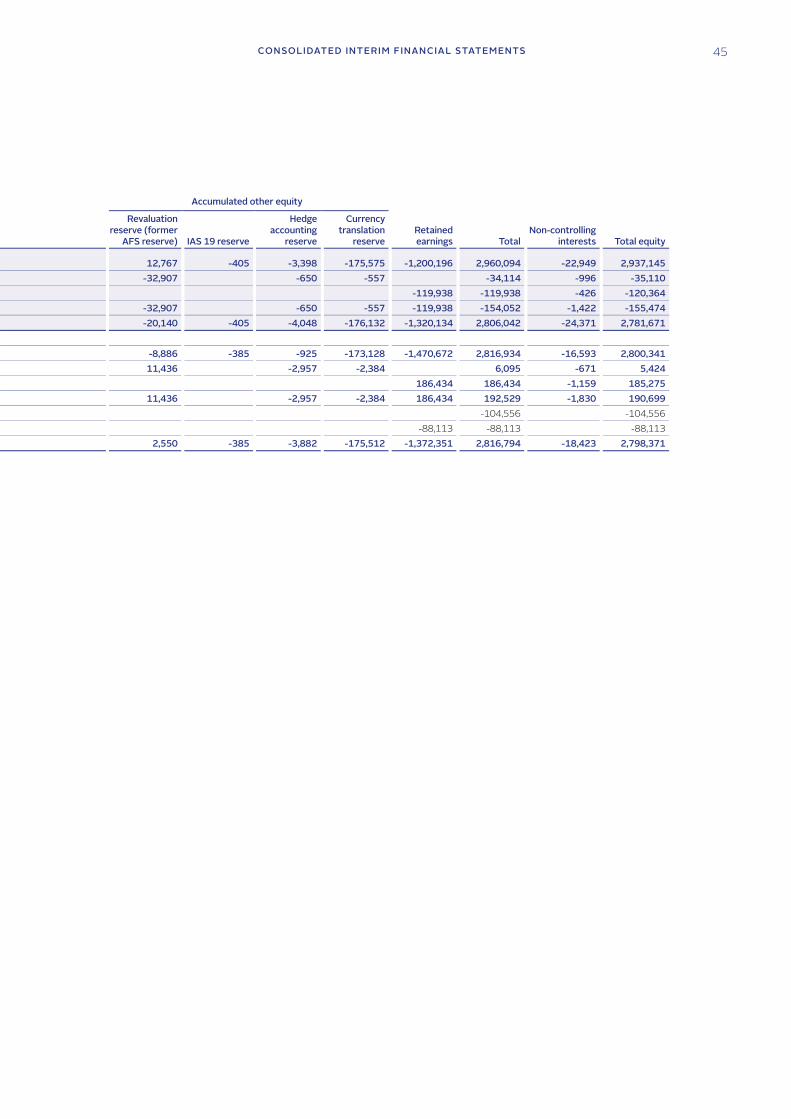
CONSOLIDATED INTERIM FINANCIAL STATEMENTS 45
Accumulated other equity
Revaluation reserve (former
AFS reserve) IAS 19 reserve
Hedge accounting
reserve
Currency translation
reserveRetained earnings Total
Non-controlling interests Total equity
12,767 -405 -3,398 -175,575 -1,200,196 2,960,094 -22,949 2,937,145 -32,907 -650 -557 -34,114 -996 -35,110 -119,938 -119,938 -426 -120,364 -32,907 -650 -557 -119,938 -154,052 -1,422 -155,474 -20,140 -405 -4,048 -176,132 -1,320,134 2,806,042 -24,371 2,781,671 -8,886 -385 -925 -173,128 -1,470,672 2,816,934 -16,593 2,800,341 11,436 -2,957 -2,384 6,095 -671 5,424 186,434 186,434 -1,159 185,275 11,436 -2,957 -2,384 186,434 192,529 -1,830 190,699 -104,556 -104,556 -88,113 -88,113 -88,113 2,550 -385 -3,882 -175,512 -1,372,351 2,816,794 -18,423 2,798,371
46 IMMOFINANZ AGHalf-Year Financial Report 2020
1. Basis of Preparation The consolidated interim financial statements of IMMOFINANZ as of 30 June 2020 were prepared for the period from 1 January 2020 to 30 June 2020 (first half-year 2020) in agreement with the International Financial Reporting Standards (IFRS) applicable to interim reporting, as applied in the EU.
The condensed scope of reporting in these consolidated interim financial statements reflects the requirements of IAS 34. Supplementary information was included in the consolidated interim financial statements to describe the effects of Covid-19. Information on the application of IFRS, on the significant accounting policies and on further disclosures is provided in the consolidated financial statements of IMMOFINANZ as of 31 December 2019 and forms the basis for these consolidated interim financial statements.
These consolidated interim financial statements of IMMOFINANZ were reviewed by Deloitte Audit Wirtschaftsprüfungs GmbH, which also audits the consolidated financial statements.
The consolidated interim financial statements are presented in thousand euros (“TEUR”, rounded). The use of automatic data processing equipment can lead to rounding differences in the addition of rounded amounts or percentage rates.
In contrast to the consolidated interim financial statements as of 30 June 2019, the presentation on the cash flow statement of the consideration received and paid for the sale of discontinued operations was adjusted to reflect the presentation in the consolidated financial statements as of 31 December 2019. This adjustment involves the presentation of EUR 0.7 million under cash flow from investing activities instead of under cash flow from operating activities.
Notes
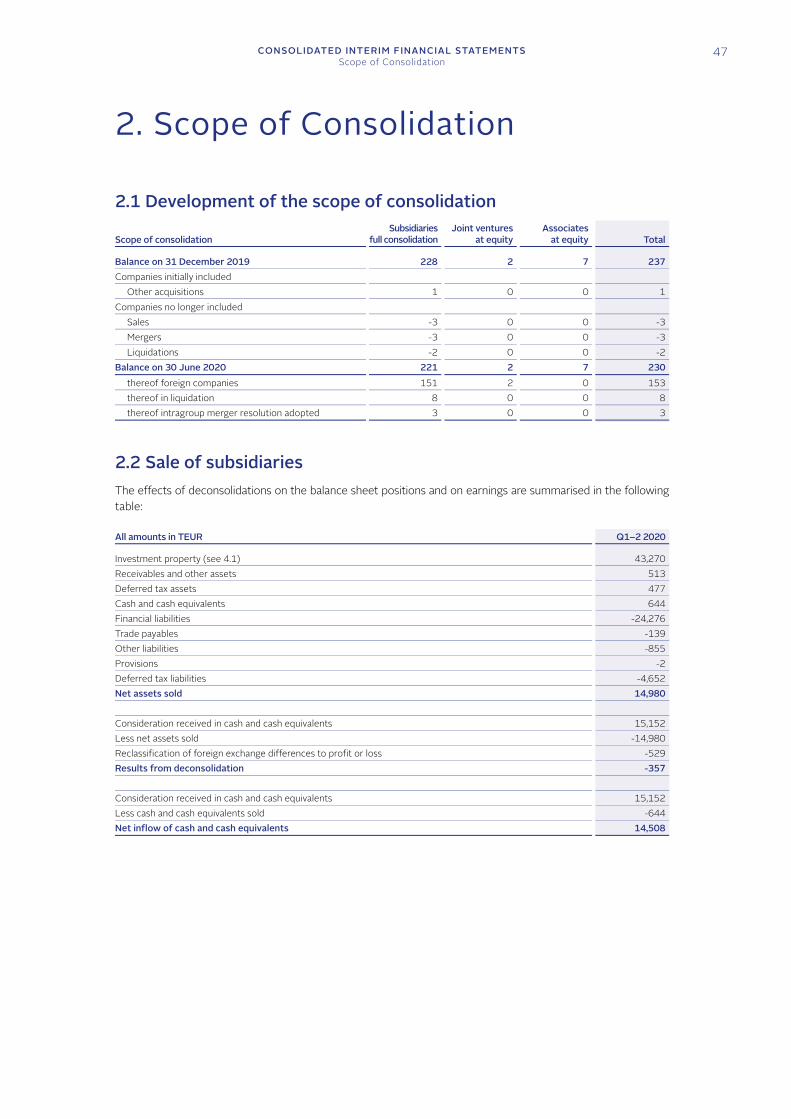
CONSOLIDATED INTERIM FINANCIAL STATEMENTSScope of Consolidation
47
2. Scope of Consolidation
2.1 Development of the scope of consolidation
Scope of consolidation Subsidiaries
full consolidationJoint ventures
at equityAssociates
at equity Total Balance on 31 December 2019 228 2 7 237Companies initially included
Other acquisitions 1 0 0 1Companies no longer included
Sales -3 0 0 -3Mergers -3 0 0 -3Liquidations -2 0 0 -2
Balance on 30 June 2020 221 2 7 230thereof foreign companies 151 2 0 153thereof in liquidation 8 0 0 8thereof intragroup merger resolution adopted 3 0 0 3
2.2 Sale of subsidiaries The effects of deconsolidations on the balance sheet positions and on earnings are summarised in the following table:
All amounts in TEUR Q1–2 2020 Investment property (see 4.1) 43,270Receivables and other assets 513Deferred tax assets 477Cash and cash equivalents 644Financial liabilities -24,276Trade payables -139Other liabilities -855Provisions -2Deferred tax liabilities -4,652Net assets sold 14,980 Consideration received in cash and cash equivalents 15,152Less net assets sold -14,980Reclassification of foreign exchange differences to profit or loss -529Results from deconsolidation -357 Consideration received in cash and cash equivalents 15,152Less cash and cash equivalents sold -644Net inflow of cash and cash equivalents 14,508
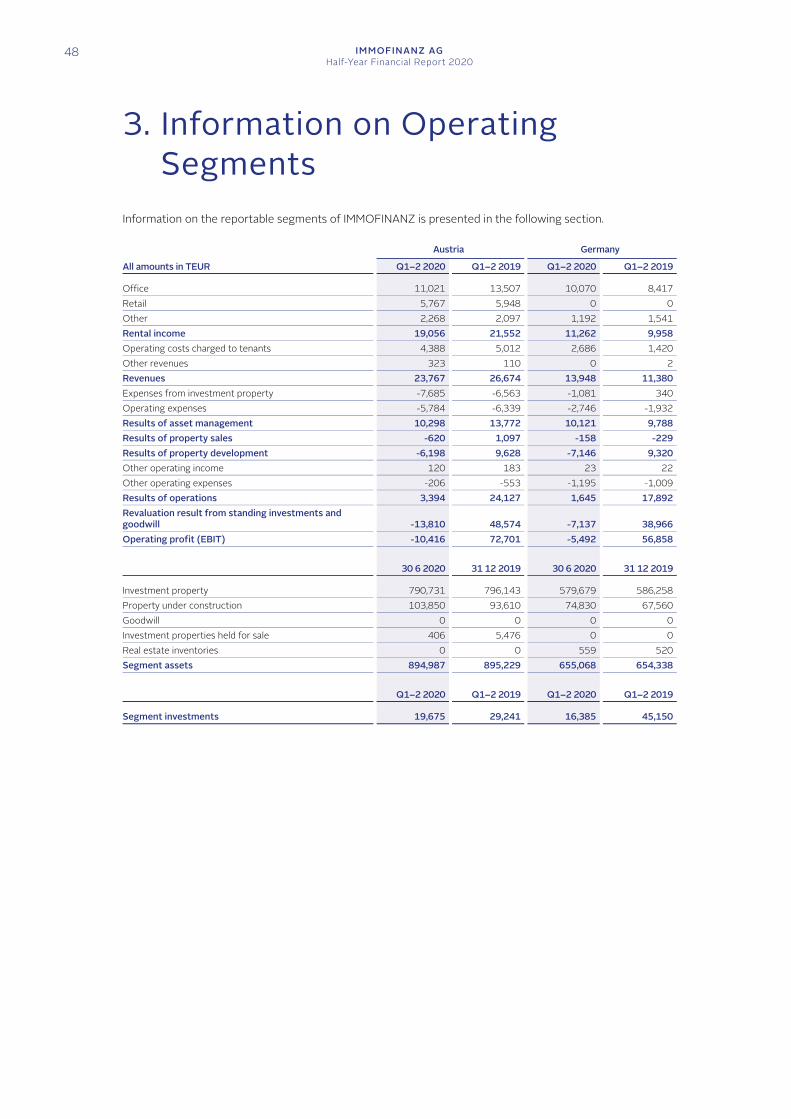
48 IMMOFINANZ AGHalf-Year Financial Report 2020
3. Information on Operating Segments
Information on the reportable segments of IMMOFINANZ is presented in the following section.
Austria Germany
All amounts in TEUR Q1–2 2020 Q1–2 2019 Q1–2 2020 Q1–2 2019 Office 11,021 13,507 10,070 8,417Retail 5,767 5,948 0 0Other 2,268 2,097 1,192 1,541Rental income 19,056 21,552 11,262 9,958Operating costs charged to tenants 4,388 5,012 2,686 1,420Other revenues 323 110 0 2Revenues 23,767 26,674 13,948 11,380Expenses from investment property -7,685 -6,563 -1,081 340Operating expenses -5,784 -6,339 -2,746 -1,932Results of asset management 10,298 13,772 10,121 9,788Results of property sales -620 1,097 -158 -229Results of property development -6,198 9,628 -7,146 9,320Other operating income 120 183 23 22Other operating expenses -206 -553 -1,195 -1,009Results of operations 3,394 24,127 1,645 17,892Revaluation result from standing investments and goodwill -13,810 48,574 -7,137 38,966Operating profit (EBIT) -10,416 72,701 -5,492 56,858 30 6 2020 31 12 2019 30 6 2020 31 12 2019 Investment property 790,731 796,143 579,679 586,258Property under construction 103,850 93,610 74,830 67,560Goodwill 0 0 0 0Investment properties held for sale 406 5,476 0 0Real estate inventories 0 0 559 520Segment assets 894,987 895,229 655,068 654,338 Q1–2 2020 Q1–2 2019 Q1–2 2020 Q1–2 2019 Segment investments 19,675 29,241 16,385 45,150
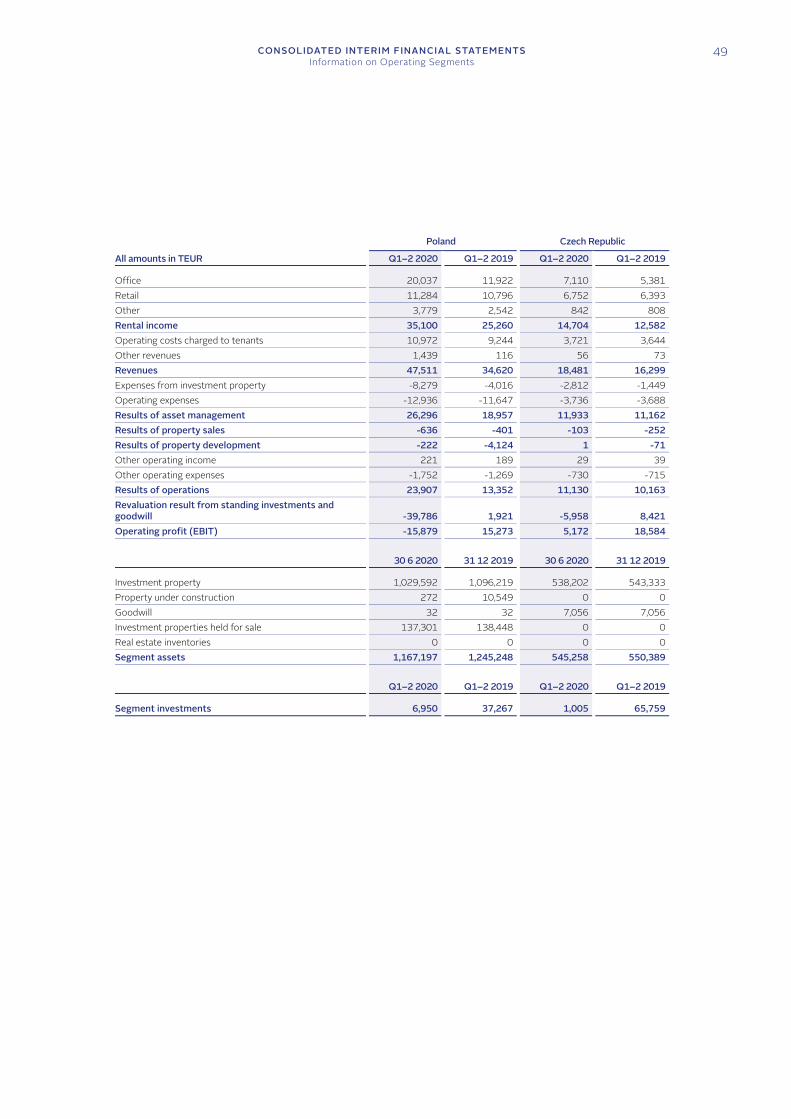
CONSOLIDATED INTERIM FINANCIAL STATEMENTSInformation on Operating Segments
49
Poland Czech Republic
All amounts in TEUR Q1–2 2020 Q1–2 2019 Q1–2 2020 Q1–2 2019 Office 20,037 11,922 7,110 5,381Retail 11,284 10,796 6,752 6,393Other 3,779 2,542 842 808Rental income 35,100 25,260 14,704 12,582Operating costs charged to tenants 10,972 9,244 3,721 3,644Other revenues 1,439 116 56 73Revenues 47,511 34,620 18,481 16,299Expenses from investment property -8,279 -4,016 -2,812 -1,449Operating expenses -12,936 -11,647 -3,736 -3,688Results of asset management 26,296 18,957 11,933 11,162Results of property sales -636 -401 -103 -252Results of property development -222 -4,124 1 -71Other operating income 221 189 29 39Other operating expenses -1,752 -1,269 -730 -715Results of operations 23,907 13,352 11,130 10,163Revaluation result from standing investments and goodwill -39,786 1,921 -5,958 8,421Operating profit (EBIT) -15,879 15,273 5,172 18,584 30 6 2020 31 12 2019 30 6 2020 31 12 2019 Investment property 1,029,592 1,096,219 538,202 543,333Property under construction 272 10,549 0 0Goodwill 32 32 7,056 7,056Investment properties held for sale 137,301 138,448 0 0Real estate inventories 0 0 0 0Segment assets 1,167,197 1,245,248 545,258 550,389 Q1–2 2020 Q1–2 2019 Q1–2 2020 Q1–2 2019 Segment investments 6,950 37,267 1,005 65,759
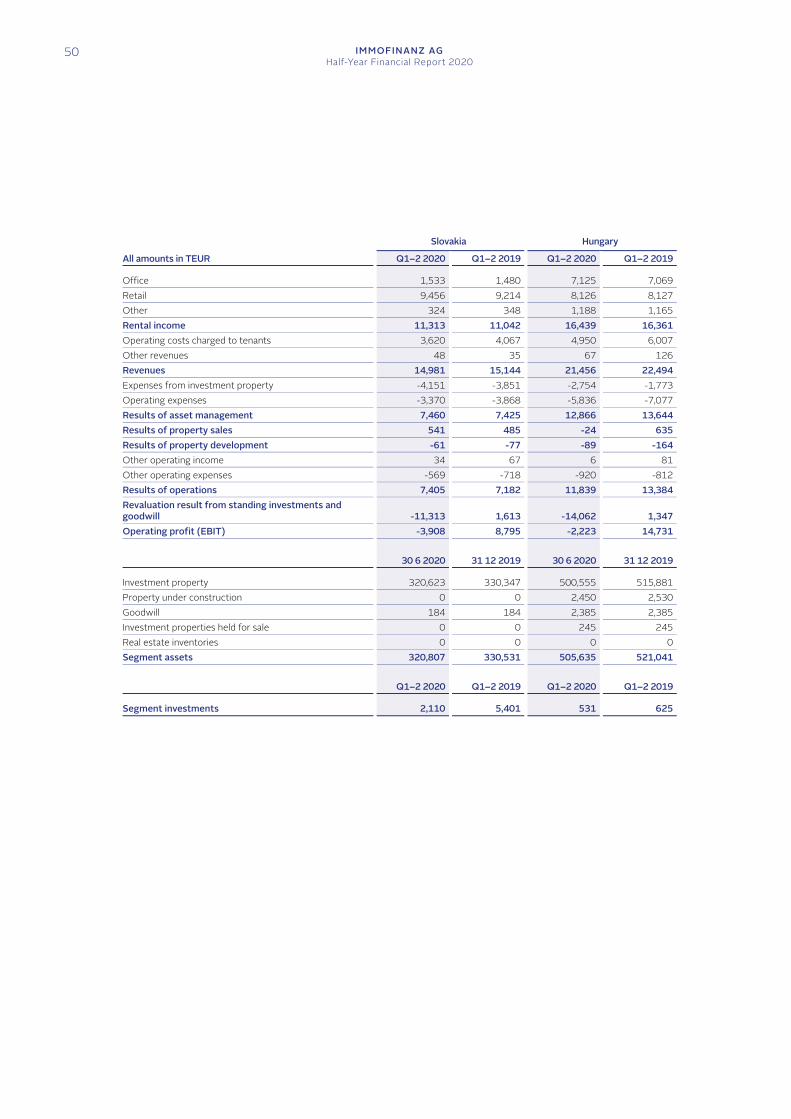
50 IMMOFINANZ AGHalf-Year Financial Report 2020
Slovakia Hungary
All amounts in TEUR Q1–2 2020 Q1–2 2019 Q1–2 2020 Q1–2 2019 Office 1,533 1,480 7,125 7,069Retail 9,456 9,214 8,126 8,127Other 324 348 1,188 1,165Rental income 11,313 11,042 16,439 16,361Operating costs charged to tenants 3,620 4,067 4,950 6,007Other revenues 48 35 67 126Revenues 14,981 15,144 21,456 22,494Expenses from investment property -4,151 -3,851 -2,754 -1,773Operating expenses -3,370 -3,868 -5,836 -7,077Results of asset management 7,460 7,425 12,866 13,644Results of property sales 541 485 -24 635Results of property development -61 -77 -89 -164Other operating income 34 67 6 81Other operating expenses -569 -718 -920 -812Results of operations 7,405 7,182 11,839 13,384Revaluation result from standing investments and goodwill -11,313 1,613 -14,062 1,347Operating profit (EBIT) -3,908 8,795 -2,223 14,731 30 6 2020 31 12 2019 30 6 2020 31 12 2019 Investment property 320,623 330,347 500,555 515,881Property under construction 0 0 2,450 2,530Goodwill 184 184 2,385 2,385Investment properties held for sale 0 0 245 245Real estate inventories 0 0 0 0Segment assets 320,807 330,531 505,635 521,041 Q1–2 2020 Q1–2 2019 Q1–2 2020 Q1–2 2019 Segment investments 2,110 5,401 531 625
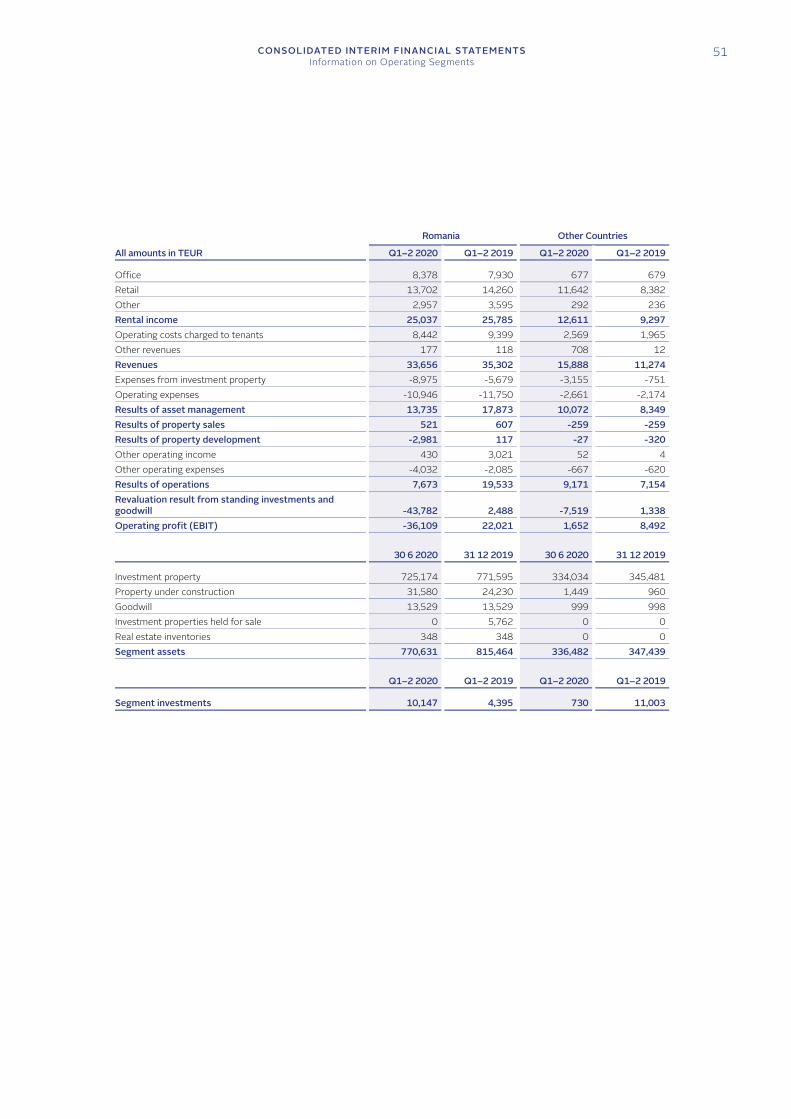
CONSOLIDATED INTERIM FINANCIAL STATEMENTSInformation on Operating Segments
51
Romania Other Countries
All amounts in TEUR Q1–2 2020 Q1–2 2019 Q1–2 2020 Q1–2 2019 Office 8,378 7,930 677 679Retail 13,702 14,260 11,642 8,382Other 2,957 3,595 292 236Rental income 25,037 25,785 12,611 9,297Operating costs charged to tenants 8,442 9,399 2,569 1,965Other revenues 177 118 708 12Revenues 33,656 35,302 15,888 11,274Expenses from investment property -8,975 -5,679 -3,155 -751Operating expenses -10,946 -11,750 -2,661 -2,174Results of asset management 13,735 17,873 10,072 8,349Results of property sales 521 607 -259 -259Results of property development -2,981 117 -27 -320Other operating income 430 3,021 52 4Other operating expenses -4,032 -2,085 -667 -620Results of operations 7,673 19,533 9,171 7,154Revaluation result from standing investments and goodwill -43,782 2,488 -7,519 1,338Operating profit (EBIT) -36,109 22,021 1,652 8,492 30 6 2020 31 12 2019 30 6 2020 31 12 2019 Investment property 725,174 771,595 334,034 345,481Property under construction 31,580 24,230 1,449 960Goodwill 13,529 13,529 999 998Investment properties held for sale 0 5,762 0 0Real estate inventories 348 348 0 0Segment assets 770,631 815,464 336,482 347,439 Q1–2 2020 Q1–2 2019 Q1–2 2020 Q1–2 2019 Segment investments 10,147 4,395 730 11,003
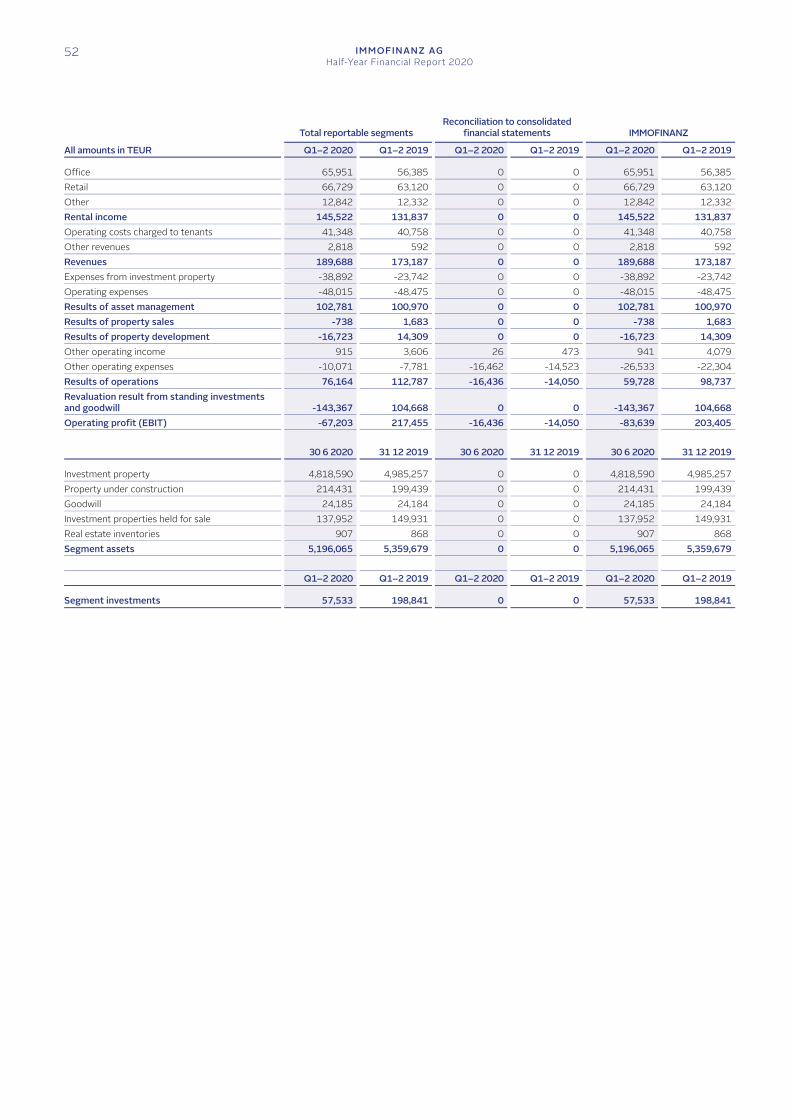
52 IMMOFINANZ AGHalf-Year Financial Report 2020
Total reportable segments
Reconciliation to consolidated financial statements IMMOFINANZ
All amounts in TEUR Q1–2 2020 Q1–2 2019 Q1–2 2020 Q1–2 2019 Q1–2 2020 Q1–2 2019 Office 65,951 56,385 0 0 65,951 56,385Retail 66,729 63,120 0 0 66,729 63,120Other 12,842 12,332 0 0 12,842 12,332Rental income 145,522 131,837 0 0 145,522 131,837Operating costs charged to tenants 41,348 40,758 0 0 41,348 40,758Other revenues 2,818 592 0 0 2,818 592Revenues 189,688 173,187 0 0 189,688 173,187Expenses from investment property -38,892 -23,742 0 0 -38,892 -23,742Operating expenses -48,015 -48,475 0 0 -48,015 -48,475Results of asset management 102,781 100,970 0 0 102,781 100,970Results of property sales -738 1,683 0 0 -738 1,683Results of property development -16,723 14,309 0 0 -16,723 14,309Other operating income 915 3,606 26 473 941 4,079Other operating expenses -10,071 -7,781 -16,462 -14,523 -26,533 -22,304Results of operations 76,164 112,787 -16,436 -14,050 59,728 98,737Revaluation result from standing investments and goodwill -143,367 104,668 0 0 -143,367 104,668Operating profit (EBIT) -67,203 217,455 -16,436 -14,050 -83,639 203,405 30 6 2020 31 12 2019 30 6 2020 31 12 2019 30 6 2020 31 12 2019 Investment property 4,818,590 4,985,257 0 0 4,818,590 4,985,257Property under construction 214,431 199,439 0 0 214,431 199,439Goodwill 24,185 24,184 0 0 24,185 24,184Investment properties held for sale 137,952 149,931 0 0 137,952 149,931Real estate inventories 907 868 0 0 907 868Segment assets 5,196,065 5,359,679 0 0 5,196,065 5,359,679 Q1–2 2020 Q1–2 2019 Q1–2 2020 Q1–2 2019 Q1–2 2020 Q1–2 2019 Segment investments 57,533 198,841 0 0 57,533 198,841
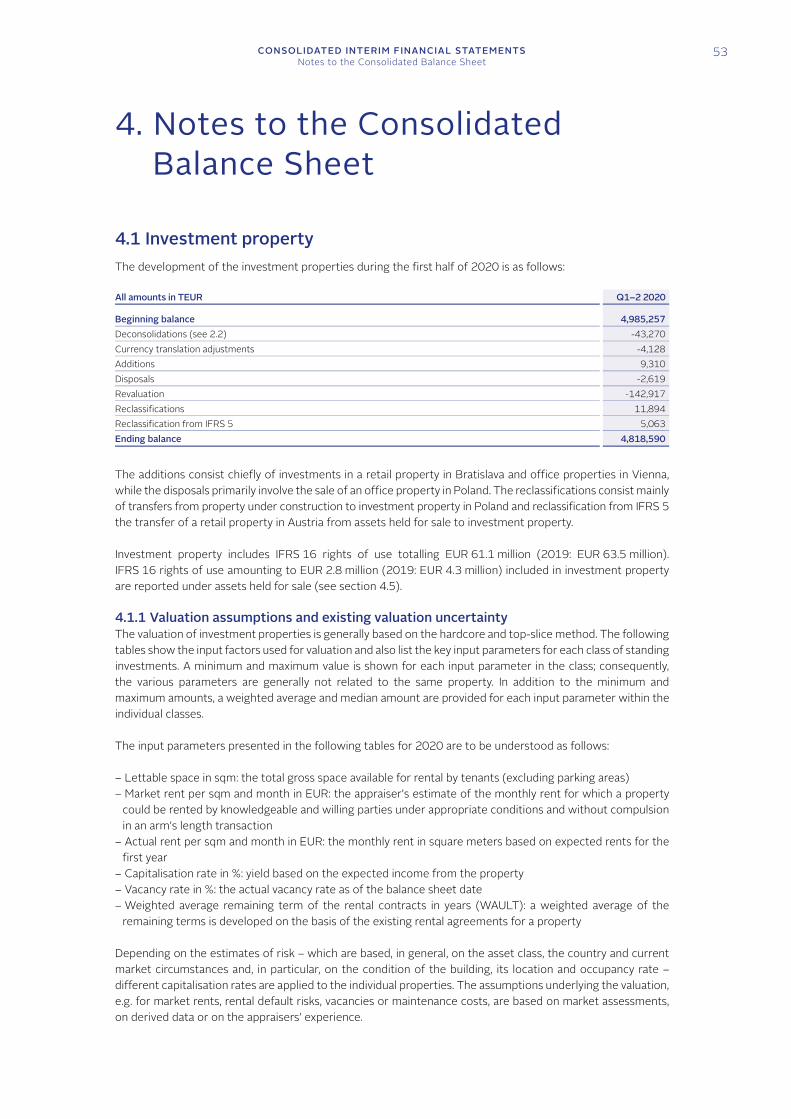
CONSOLIDATED INTERIM FINANCIAL STATEMENTSNotes to the Consolidated Balance Sheet
53
4. Notes to the Consolidated Balance Sheet
4.1 Investment property The development of the investment properties during the first half of 2020 is as follows:
All amounts in TEUR Q1–2 2020 Beginning balance 4,985,257Deconsolidations (see 2.2) -43,270Currency translation adjustments -4,128Additions 9,310Disposals -2,619Revaluation -142,917Reclassifications 11,894Reclassification from IFRS 5 5,063Ending balance 4,818,590 The additions consist chiefly of investments in a retail property in Bratislava and office properties in Vienna, while the disposals primarily involve the sale of an office property in Poland. The reclassifications consist mainly of transfers from property under construction to investment property in Poland and reclassification from IFRS 5 the transfer of a retail property in Austria from assets held for sale to investment property.
Investment property includes IFRS 16 rights of use totalling EUR 61.1 million (2019: EUR 63.5 million). IFRS 16 rights of use amounting to EUR 2.8 million (2019: EUR 4.3 million) included in investment property are reported under assets held for sale (see section 4.5).
4.1.1 Valuation assumptions and existing valuation uncertainty The valuation of investment properties is generally based on the hardcore and top-slice method. The following tables show the input factors used for valuation and also list the key input parameters for each class of standing investments. A minimum and maximum value is shown for each input parameter in the class; consequently, the various parameters are generally not related to the same property. In addition to the minimum and maximum amounts, a weighted average and median amount are provided for each input parameter within the individual classes.
The input parameters presented in the following tables for 2020 are to be understood as follows:
– Lettable space in sqm: the total gross space available for rental by tenants (excluding parking areas) – Market rent per sqm and month in EUR: the appraiser’s estimate of the monthly rent for which a property
could be rented by knowledgeable and willing parties under appropriate conditions and without compulsion in an arm’s length transaction
– Actual rent per sqm and month in EUR: the monthly rent in square meters based on expected rents for the first year
– Capitalisation rate in %: yield based on the expected income from the property – Vacancy rate in %: the actual vacancy rate as of the balance sheet date – Weighted average remaining term of the rental contracts in years (WAULT): a weighted average of the
remaining terms is developed on the basis of the existing rental agreements for a property
Depending on the estimates of risk – which are based, in general, on the asset class, the country and current market circumstances and, in particular, on the condition of the building, its location and occupancy rate – different capitalisation rates are applied to the individual properties. The assumptions underlying the valuation, e.g. for market rents, rental default risks, vacancies or maintenance costs, are based on market assessments, on derived data or on the appraisers’ experience.
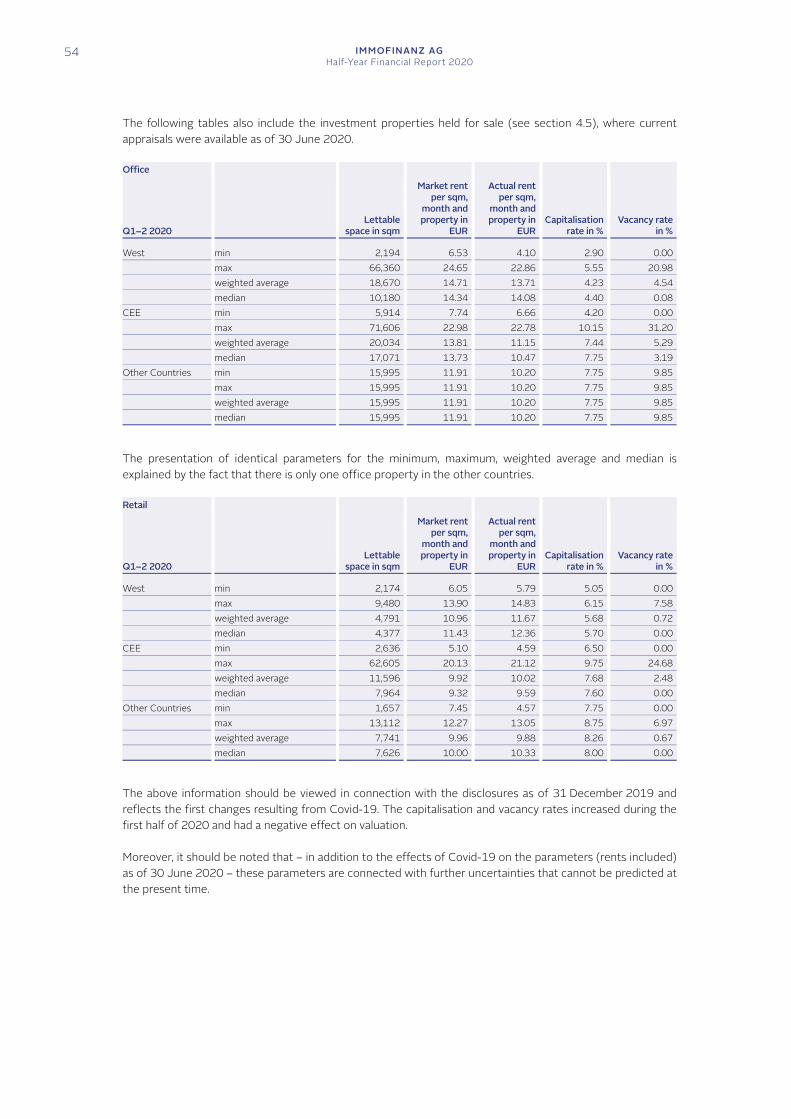
54 IMMOFINANZ AGHalf-Year Financial Report 2020
The following tables also include the investment properties held for sale (see section 4.5), where current appraisals were available as of 30 June 2020.
Office
Q1–2 2020 Lettable
space in sqm
Market rent per sqm,
month and property in
EUR
Actual rent per sqm,
month and property in
EURCapitalisation
rate in % Vacancy rate
in % West min 2,194 6.53 4.10 2.90 0.00 max 66,360 24.65 22.86 5.55 20.98 weighted average 18,670 14.71 13.71 4.23 4.54 median 10,180 14.34 14.08 4.40 0.08CEE min 5,914 7.74 6.66 4.20 0.00 max 71,606 22.98 22.78 10.15 31.20 weighted average 20,034 13.81 11.15 7.44 5.29 median 17,071 13.73 10.47 7.75 3.19Other Countries min 15,995 11.91 10.20 7.75 9.85 max 15,995 11.91 10.20 7.75 9.85 weighted average 15,995 11.91 10.20 7.75 9.85 median 15,995 11.91 10.20 7.75 9.85
The presentation of identical parameters for the minimum, maximum, weighted average and median is explained by the fact that there is only one office property in the other countries.
Retail
Q1–2 2020 Lettable
space in sqm
Market rent per sqm,
month and property in
EUR
Actual rent per sqm,
month and property in
EURCapitalisation
rate in % Vacancy rate
in % West min 2,174 6.05 5.79 5.05 0.00 max 9,480 13.90 14.83 6.15 7.58 weighted average 4,791 10.96 11.67 5.68 0.72 median 4,377 11.43 12.36 5.70 0.00CEE min 2,636 5.10 4.59 6.50 0.00 max 62,605 20.13 21.12 9.75 24.68 weighted average 11,596 9.92 10.02 7.68 2.48 median 7,964 9.32 9.59 7.60 0.00Other Countries min 1,657 7.45 4.57 7.75 0.00 max 13,112 12.27 13.05 8.75 6.97 weighted average 7,741 9.96 9.88 8.26 0.67 median 7,626 10.00 10.33 8.00 0.00
The above information should be viewed in connection with the disclosures as of 31 December 2019 and reflects the first changes resulting from Covid-19. The capitalisation and vacancy rates increased during the first half of 2020 and had a negative effect on valuation.
Moreover, it should be noted that – in addition to the effects of Covid-19 on the parameters (rents included) as of 30 June 2020 – these parameters are connected with further uncertainties that cannot be predicted at the present time.
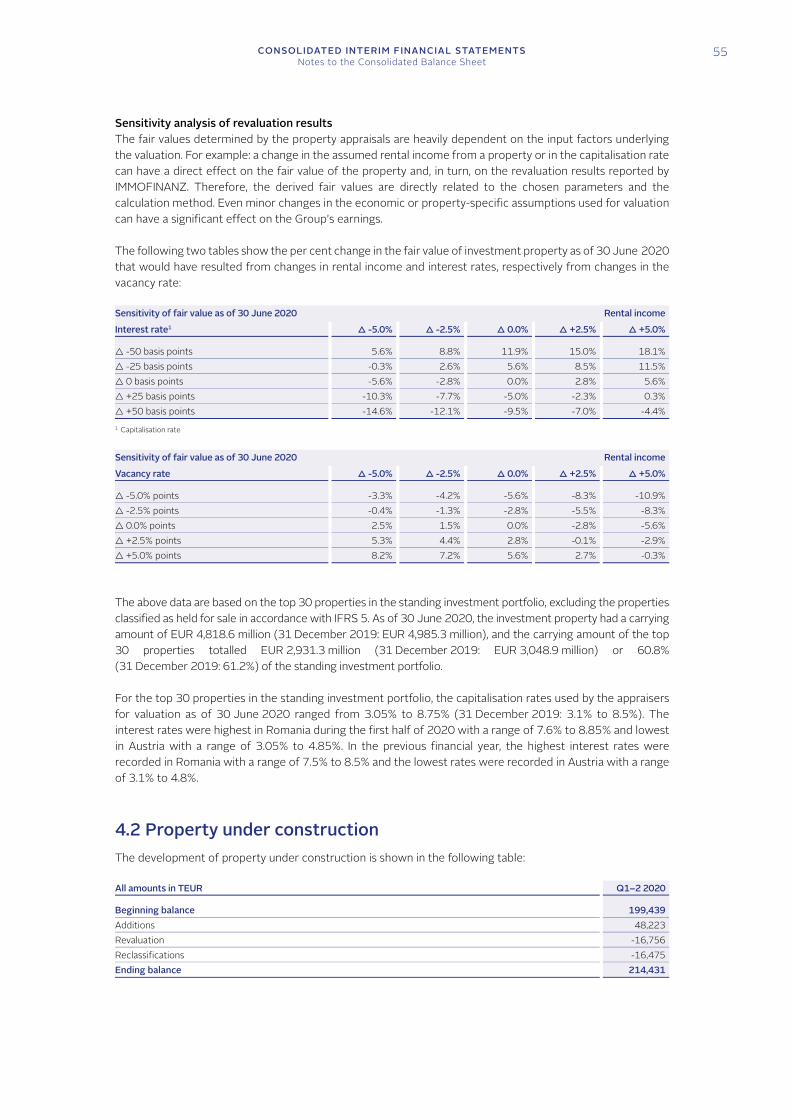
CONSOLIDATED INTERIM FINANCIAL STATEMENTSNotes to the Consolidated Balance Sheet
55
Sensitivity analysis of revaluation results The fair values determined by the property appraisals are heavily dependent on the input factors underlying the valuation. For example: a change in the assumed rental income from a property or in the capitalisation rate can have a direct effect on the fair value of the property and, in turn, on the revaluation results reported by IMMOFINANZ. Therefore, the derived fair values are directly related to the chosen parameters and the calculation method. Even minor changes in the economic or property-specific assumptions used for valuation can have a significant effect on the Group’s earnings.
The following two tables show the per cent change in the fair value of investment property as of 30 June 2020 that would have resulted from changes in rental income and interest rates, respectively from changes in the vacancy rate:
Sensitivity of fair value as of 30 June 2020 Rental incomeInterest rate1 ∆ -5.0% ∆ -2.5% ∆ 0.0% ∆ +2.5% ∆ +5.0% ∆ -50 basis points 5.6% 8.8% 11.9% 15.0% 18.1%∆ -25 basis points -0.3% 2.6% 5.6% 8.5% 11.5%∆ 0 basis points -5.6% -2.8% 0.0% 2.8% 5.6%∆ +25 basis points -10.3% -7.7% -5.0% -2.3% 0.3%∆ +50 basis points -14.6% -12.1% -9.5% -7.0% -4.4% 1 Capitalisation rate
Sensitivity of fair value as of 30 June 2020 Rental incomeVacancy rate ∆ -5.0% ∆ -2.5% ∆ 0.0% ∆ +2.5% ∆ +5.0% ∆ -5.0% points -3.3% -4.2% -5.6% -8.3% -10.9%∆ -2.5% points -0.4% -1.3% -2.8% -5.5% -8.3%∆ 0.0% points 2.5% 1.5% 0.0% -2.8% -5.6%∆ +2.5% points 5.3% 4.4% 2.8% -0.1% -2.9%∆ +5.0% points 8.2% 7.2% 5.6% 2.7% -0.3%
The above data are based on the top 30 properties in the standing investment portfolio, excluding the properties classified as held for sale in accordance with IFRS 5. As of 30 June 2020, the investment property had a carrying amount of EUR 4,818.6 million (31 December 2019: EUR 4,985.3 million), and the carrying amount of the top 30 properties totalled EUR 2,931.3 million (31 December 2019: EUR 3,048.9 million) or 60.8% (31 December 2019: 61.2%) of the standing investment portfolio.
For the top 30 properties in the standing investment portfolio, the capitalisation rates used by the appraisers for valuation as of 30 June 2020 ranged from 3.05% to 8.75% (31 December 2019: 3.1% to 8.5%). The interest rates were highest in Romania during the first half of 2020 with a range of 7.6% to 8.85% and lowest in Austria with a range of 3.05% to 4.85%. In the previous financial year, the highest interest rates were recorded in Romania with a range of 7.5% to 8.5% and the lowest rates were recorded in Austria with a range of 3.1% to 4.8%.
4.2 Property under construction The development of property under construction is shown in the following table:
All amounts in TEUR Q1–2 2020 Beginning balance 199,439Additions 48,223Revaluation -16,756Reclassifications -16,475Ending balance 214,431
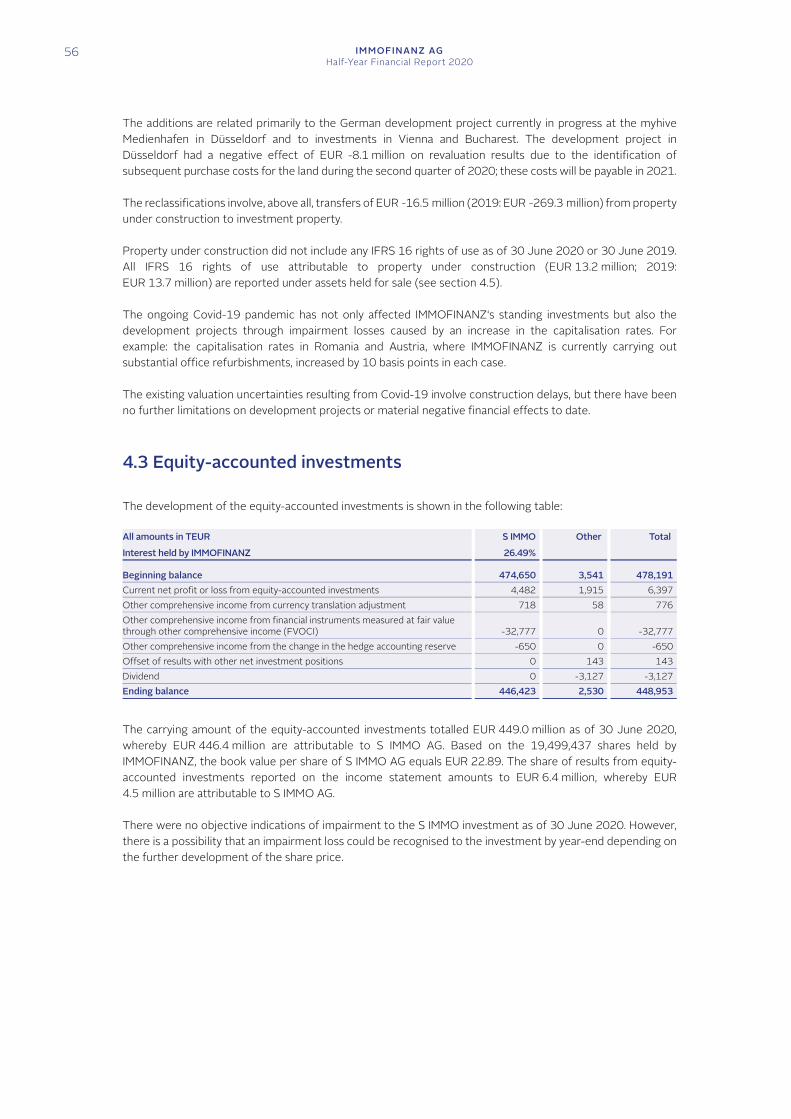
56 IMMOFINANZ AGHalf-Year Financial Report 2020
The additions are related primarily to the German development project currently in progress at the myhive Medienhafen in Düsseldorf and to investments in Vienna and Bucharest. The development project in Düsseldorf had a negative effect of EUR -8.1 million on revaluation results due to the identification of subsequent purchase costs for the land during the second quarter of 2020; these costs will be payable in 2021.
The reclassifications involve, above all, transfers of EUR -16.5 million (2019: EUR -269.3 million) from property under construction to investment property.
Property under construction did not include any IFRS 16 rights of use as of 30 June 2020 or 30 June 2019. All IFRS 16 rights of use attributable to property under construction (EUR 13.2 million; 2019: EUR 13.7 million) are reported under assets held for sale (see section 4.5).
The ongoing Covid-19 pandemic has not only affected IMMOFINANZ‘s standing investments but also the development projects through impairment losses caused by an increase in the capitalisation rates. For example: the capitalisation rates in Romania and Austria, where IMMOFINANZ is currently carrying out substantial office refurbishments, increased by 10 basis points in each case.
The existing valuation uncertainties resulting from Covid-19 involve construction delays, but there have been no further limitations on development projects or material negative financial effects to date.
4.3 Equity-accounted investments
The development of the equity-accounted investments is shown in the following table:
All amounts in TEUR S IMMO Other Total Interest held by IMMOFINANZ 26.49% Beginning balance 474,650 3,541 478,191Current net profit or loss from equity-accounted investments 4,482 1,915 6,397Other comprehensive income from currency translation adjustment 718 58 776Other comprehensive income from financial instruments measured at fair value through other comprehensive income (FVOCI) -32,777 0 -32,777Other comprehensive income from the change in the hedge accounting reserve -650 0 -650Offset of results with other net investment positions 0 143 143Dividend 0 -3,127 -3,127Ending balance 446,423 2,530 448,953
The carrying amount of the equity-accounted investments totalled EUR 449.0 million as of 30 June 2020, whereby EUR 446.4 million are attributable to S IMMO AG. Based on the 19,499,437 shares held by IMMOFINANZ, the book value per share of S IMMO AG equals EUR 22.89. The share of results from equity-accounted investments reported on the income statement amounts to EUR 6.4 million, whereby EUR 4.5 million are attributable to S IMMO AG.
There were no objective indications of impairment to the S IMMO investment as of 30 June 2020. However, there is a possibility that an impairment loss could be recognised to the investment by year-end depending on the further development of the share price.
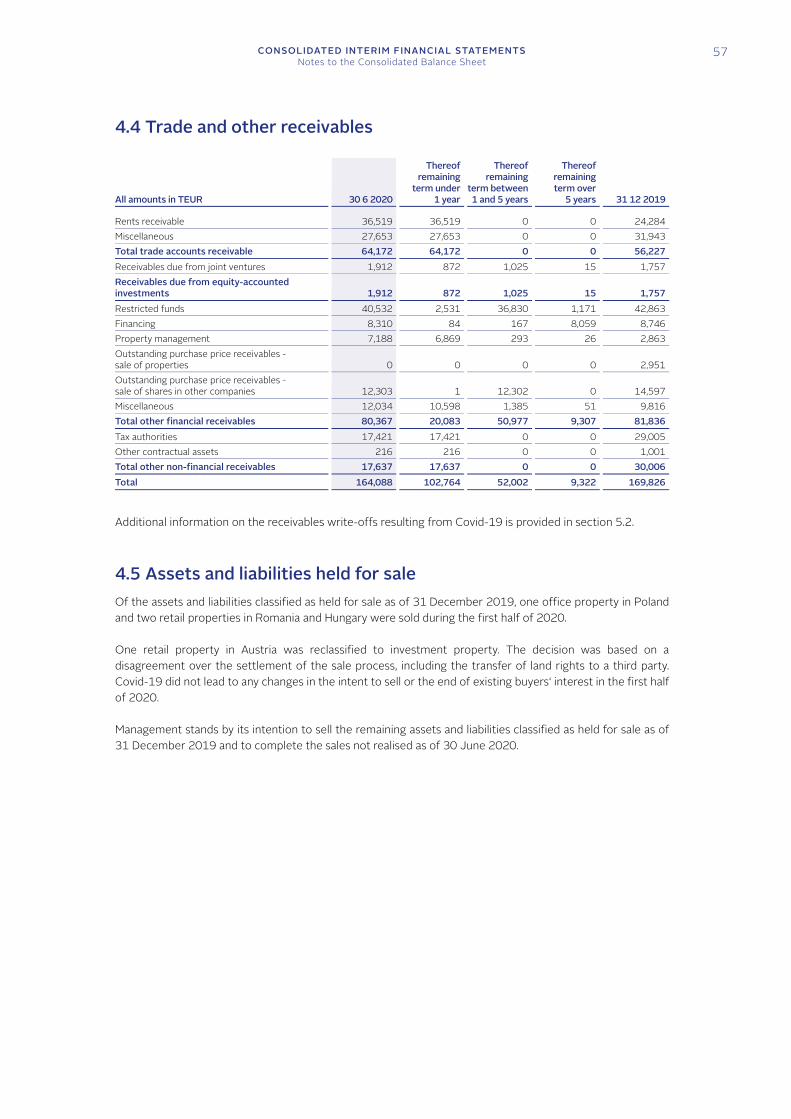
CONSOLIDATED INTERIM FINANCIAL STATEMENTSNotes to the Consolidated Balance Sheet
57
4.4 Trade and other receivables
All amounts in TEUR 30 6 2020
Thereof remaining
term under 1 year
Thereof remaining
term between 1 and 5 years
Thereof remaining term over
5 years 31 12 2019 Rents receivable 36,519 36,519 0 0 24,284Miscellaneous 27,653 27,653 0 0 31,943Total trade accounts receivable 64,172 64,172 0 0 56,227Receivables due from joint ventures 1,912 872 1,025 15 1,757Receivables due from equity-accounted investments 1,912 872 1,025 15 1,757Restricted funds 40,532 2,531 36,830 1,171 42,863Financing 8,310 84 167 8,059 8,746Property management 7,188 6,869 293 26 2,863Outstanding purchase price receivables - sale of properties 0 0 0 0 2,951Outstanding purchase price receivables - sale of shares in other companies 12,303 1 12,302 0 14,597Miscellaneous 12,034 10,598 1,385 51 9,816Total other financial receivables 80,367 20,083 50,977 9,307 81,836Tax authorities 17,421 17,421 0 0 29,005Other contractual assets 216 216 0 0 1,001Total other non-financial receivables 17,637 17,637 0 0 30,006Total 164,088 102,764 52,002 9,322 169,826
Additional information on the receivables write-offs resulting from Covid-19 is provided in section 5.2.
4.5 Assets and liabilities held for sale Of the assets and liabilities classified as held for sale as of 31 December 2019, one office property in Poland and two retail properties in Romania and Hungary were sold during the first half of 2020.
One retail property in Austria was reclassified to investment property. The decision was based on a disagreement over the settlement of the sale process, including the transfer of land rights to a third party. Covid-19 did not lead to any changes in the intent to sell or the end of existing buyers‘ interest in the first half of 2020.
Management stands by its intention to sell the remaining assets and liabilities classified as held for sale as of 31 December 2019 and to complete the sales not realised as of 30 June 2020.
58 IMMOFINANZ AGHalf-Year Financial Report 2020
The following table provides summarised information on the assets and liabilities classified as held for sale as of 30 June 2020:
All amounts in TEUR
Carrying amount as of
30 6 2020
Carrying amount as of 31
12 2019 Investment property 78,205 88,446Property under construction 59,747 61,485Deferred tax assets 0 27Trade and other receivables 923 684Cash and cash equivalents 2,752 3,980Assets held for sale 141,627 154,622 Reclassifiable reserves -904 -904 Financial liabilities 43,536 45,365Trade and other payables 1,870 2,185Provisions 333 335Deferred tax liabilities 1,024 770Liabilities held for sale 46,763 48,655
The investment property and property under construction which are classified as held for sale include IFRS 16 rights of use totalling EUR 2.8 million (2019: EUR 4.3 million), respectively EUR 13.2 million (2019: EUR 13.7 million).
The financial liabilities held for sale include lease liabilities of EUR 16.0 million (2019: EUR 17.9 million).
4.6 Equity In view of the Covid-19 pandemic, IMMOFINANZ rescheduled the 27th annual general meeting which was originally planned for 22 May 2020 in Vienna to 1 October 2020. Consequently, the resolution on the distribution of profit for 2019 and the dividend will also be postponed to that date.
4.7 Liabilities from convertible bonds IMMOFINANZ had convertible bonds with a total nominal value of EUR 297.2 million outstanding as of 30 June 2020 (31 December 2019: EUR 297.2 million). The underlying bond liability and the related interest coupons are measured at amortised cost based on the effective interest method.
All amounts in TEUR 30 6 2020
Thereof remaining
term under 1 year
Thereof remaining
term between 1 and 5 years
Thereof remaining term over
5 years 31 12 2019 Convertible bond 2017-2024 288,904 4,471 284,433 0 285,807Total 288,904 4,471 284,433 0 285,807
Convertible bond 2017–2024 IMMOFINANZ issued a convertible bond on 24 January 2017 through an accelerated book-building process with institutional investors. The bond has a nominal value of EUR 297.2 million, an initial interest rate of 2.0% and a term ending on 24 January 2024. Following the receipt of an investment grade rating from S&P Global Ratings in the first quarter of 2019, the coupon was reduced by 0.5% to 1.5% in accordance with the issue terms beginning with the interest rate period as of 24 January 2019. S&P Global Ratings confirmed this rating during its annual review process in February 2020 and again after the successful share placement and issue of the mandatory convertible bond in July 2020.
CONSOLIDATED INTERIM FINANCIAL STATEMENTSNotes to the Consolidated Balance Sheet
59
The convertible bond 2017–2024 includes a (non-separable) put option at the nominal value plus accrued interest as of 24 January 2022, which also determines the instrument’s maturity at the present time.
The conversion price for the convertible bond 2017–2024 currently equals EUR 21.3772 per share. The conversion right can be exercised up to 10 January 2024.
4.8 Financial liabilities The following table shows the composition and classification of financial liabilities by remaining term as of 30 June 2020:
All amounts in TEUR 30 6 2020
Thereof remaining
term under 1 year
Thereof remaining
term between 1 and 5 years
Thereof remaining term over
5 years 31 12 2019 Amounts due to financial institutions 2,009,197 327,110 1,228,962 453,125 2,008,731
thereof secured by collateral 2,009,099 327,012 1,228,962 453,125 2,008,618thereof not secured by collateral 98 98 0 0 113
Liabilities arising from the issue of bonds 500,593 5,469 495,124 0 506,161Other financial liabilities 61,404 3,707 10,024 47,673 65,489Total 2,571,194 336,286 1,734,110 500,798 2,580,381 Liabilities arising from the issue of bonds show an unsecured, non-subordinated bond with a nominal value of EUR 500 million. The bond was issued in January 2019; it has a four-year term and carries a fixed interest rate of 2.625% per year.
The other financial liabilities consist almost entirely of IFRS 16 lease liabilities.
Agreements have been reached with the banks in selected cases over the possible suspension of principal payments and the deferral of compliance with financial covenants during the Covid-19 pandemic. The actual payment suspensions represent only an immaterial component of the total outstanding credit volume. The deferral of compliance with financial covenants was immaterial because the originally agreed covenants were met in nearly all cases.
60 IMMOFINANZ AGHalf-Year Financial Report 2020
4.9 Trade payables and other liabilities
All amounts in TEUR 30 6 2020
Thereof remaining
term under 1 year
Thereof remaining
term between 1 and 5 years
Thereof remaining term over
5 years 31 12 2019 Trade payables 69,186 67,744 1,405 37 85,280Derivative financial instruments (liabilities) 29,329 650 17,882 10,797 18,007Property management 6,778 6,778 0 0 6,378Amounts due to non-controlling interests 4,522 0 262 4,260 4,449Amounts due to associated companies 68 68 0 0 191Amounts due to joint ventures 322 6 20 296 326Deposits and guarantees received 25,107 5,911 15,601 3,595 25,689Prepayments received on property sales 1,107 1,107 0 0 1,124Construction and refurbishment 2,136 1,917 219 0 6,496Outstanding purchase prices (acquisition of properties) 0 0 0 0 111Miscellaneous 13,671 9,805 3,858 8 14,212Total other financial liabilities 83,040 26,242 37,842 18,956 76,983Tax authorities 12,380 12,380 0 0 7,051Rental and lease prepayments received 23,908 22,812 222 874 28,353Total non-financial liabilities 36,288 35,192 222 874 35,404Total 188,514 129,178 39,469 19,867 197,667
CONSOLIDATED INTERIM FINANCIAL STATEMENTSNotes to the Consolidated Income Statement
61
5. Notes to the Consolidated Income Statement
5.1 Rental income Q1–2 2020All amounts in TEUR Office Retail Other Total Office space 65,780 73 77 65,930Retail space 3,827 62,319 0 66,146Other space 10,998 1,496 952 13,446
thereof parking areas 6,776 162 215 7,153thereof warehouse space 2,456 195 0 2,651thereof hotel 123 0 705 828thereof advertising and telecommunications 912 1,056 3 1,971thereof other 731 83 29 843
Total 80,605 63,888 1,029 145,522 Q1–2 2019All amounts in TEUR Office Retail Other Total Office space 56,215 154 17 56,386Retail space 4,106 59,014 0 63,120Other space 10,629 1,410 292 12,331
thereof parking areas 6,825 174 218 7,217thereof warehouse space 1,991 143 24 2,158thereof advertising and telecommunications 1,009 1,050 3 2,062thereof other 804 43 47 894
Total 70,950 60,578 309 131,837 The increase in rental income resulted primarily from acquisitions in the second half of 2019, in particular the Warsaw Spire and Palmovka Open Park.
Covid-19 led to the legally mandated suspension of rental payments in individual countries during the first half of 2020. In addition, voluntary retrospective and prospective rental price reductions were agreed.
The pure suspension of rental payments does not have an impact on recognised revenues. Rental price reductions for future periods will be distributed over the remaining term as lease incentives. Previously invoiced rental payments were written down and expensed accordingly (information on the receivables write-offs resulting from Covid-19 is provided in section 5.2).
Rental price reductions in the office segment totalled EUR 0.4 million up to 30 June 2020. The comparable amount for the retail segment also totalled EUR 0.4 million. In addition, rental payments were suspended and lease terms were extended in both segments. IMMOFINANZ is continuing to work with tenants to develop individual solutions to counter future negative developments resulting from Covid-19. In addition to contractually agreed lease adjustments, IMMOFINANZ was negotiating with further tenants over rental price reductions at the end of June. (Also see section 8. Subsequent Events.)
Covid-19 had only a very limited effect on revenues for the first six months of 2020 because most rents for the first half of 2020 were already invoiced. However, turnover-based rents declined slightly as a result of Covid-19.
In addition to the above-mentioned measures, future periods are connected with the general risk of possible tenant bankruptcies as well as the risks connected with new rentals and the re-rental of vacant space.
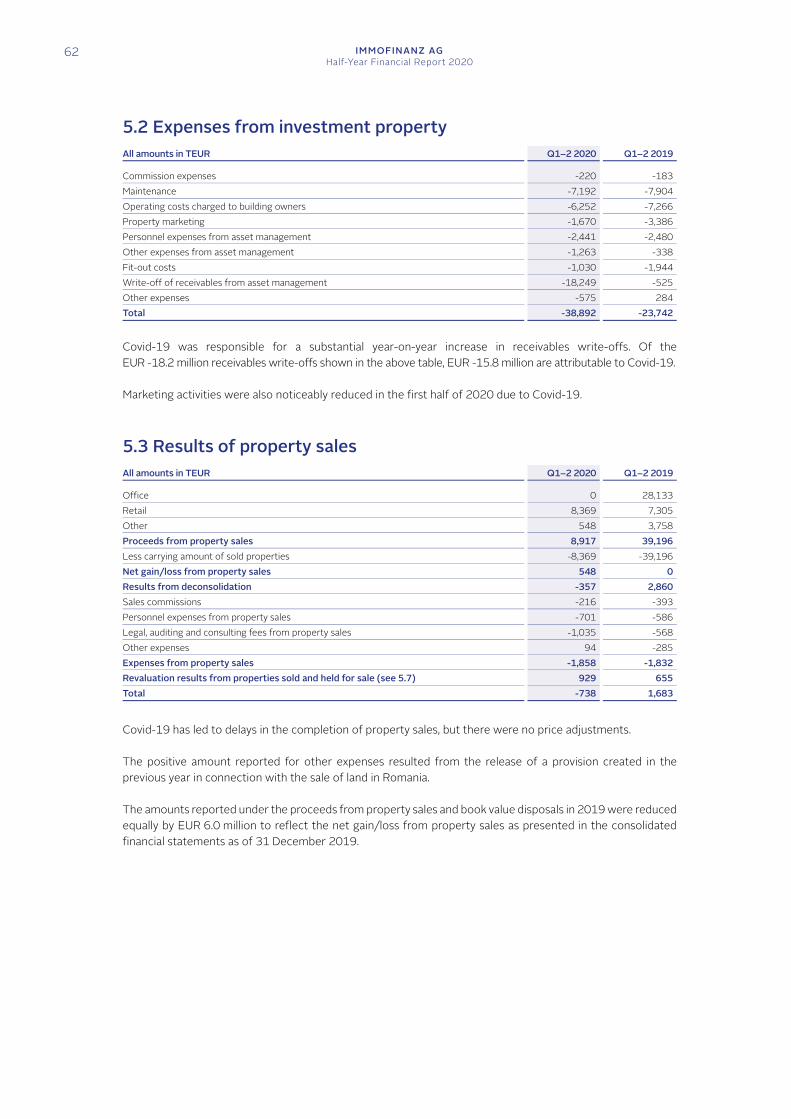
62 IMMOFINANZ AGHalf-Year Financial Report 2020
5.2 Expenses from investment property All amounts in TEUR Q1–2 2020 Q1–2 2019 Commission expenses -220 -183Maintenance -7,192 -7,904Operating costs charged to building owners -6,252 -7,266Property marketing -1,670 -3,386Personnel expenses from asset management -2,441 -2,480Other expenses from asset management -1,263 -338Fit-out costs -1,030 -1,944Write-off of receivables from asset management -18,249 -525Other expenses -575 284Total -38,892 -23,742 Covid-19 was responsible for a substantial year-on-year increase in receivables write-offs. Of the EUR -18.2 million receivables write-offs shown in the above table, EUR -15.8 million are attributable to Covid-19.
Marketing activities were also noticeably reduced in the first half of 2020 due to Covid-19.
5.3 Results of property sales All amounts in TEUR Q1–2 2020 Q1–2 2019 Office 0 28,133Retail 8,369 7,305Other 548 3,758Proceeds from property sales 8,917 39,196Less carrying amount of sold properties -8,369 -39,196Net gain/loss from property sales 548 0Results from deconsolidation -357 2,860Sales commissions -216 -393Personnel expenses from property sales -701 -586Legal, auditing and consulting fees from property sales -1,035 -568Other expenses 94 -285Expenses from property sales -1,858 -1,832Revaluation results from properties sold and held for sale (see 5.7) 929 655Total -738 1,683 Covid-19 has led to delays in the completion of property sales, but there were no price adjustments.
The positive amount reported for other expenses resulted from the release of a provision created in the previous year in connection with the sale of land in Romania.
The amounts reported under the proceeds from property sales and book value disposals in 2019 were reduced equally by EUR 6.0 million to reflect the net gain/loss from property sales as presented in the consolidated financial statements as of 31 December 2019.
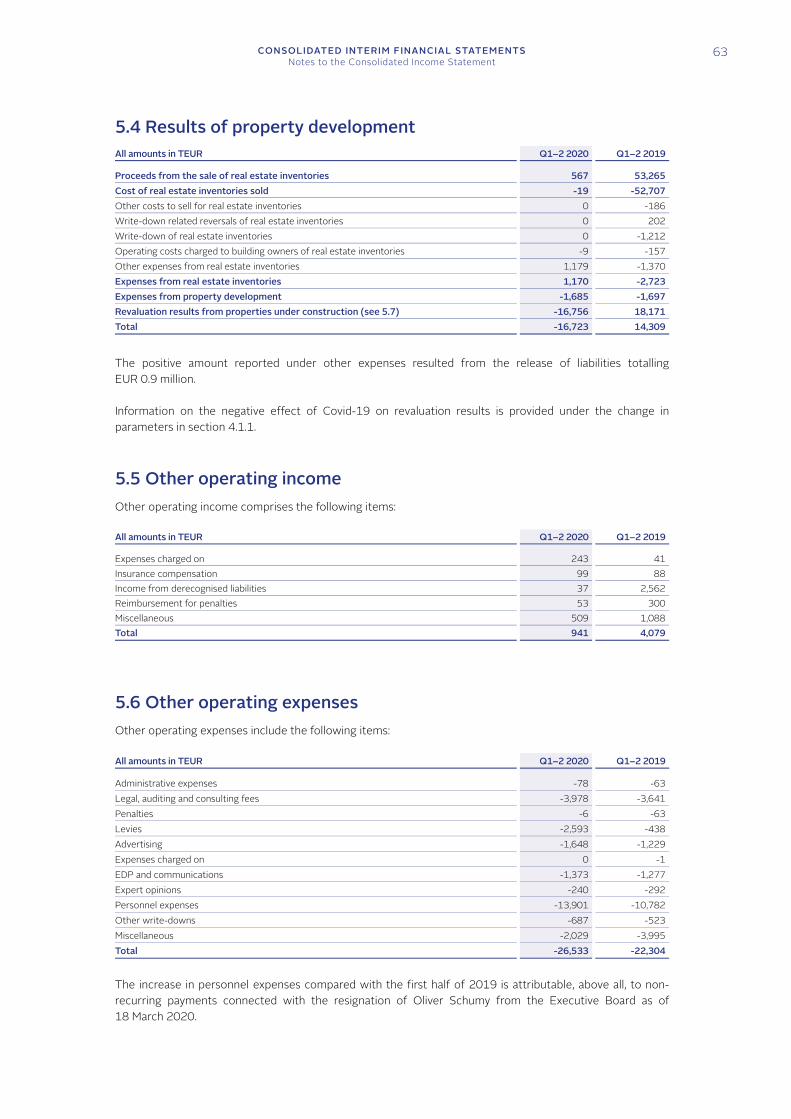
CONSOLIDATED INTERIM FINANCIAL STATEMENTSNotes to the Consolidated Income Statement
63
5.4 Results of property development All amounts in TEUR Q1–2 2020 Q1–2 2019 Proceeds from the sale of real estate inventories 567 53,265Cost of real estate inventories sold -19 -52,707Other costs to sell for real estate inventories 0 -186Write-down related reversals of real estate inventories 0 202Write-down of real estate inventories 0 -1,212Operating costs charged to building owners of real estate inventories -9 -157Other expenses from real estate inventories 1,179 -1,370Expenses from real estate inventories 1,170 -2,723Expenses from property development -1,685 -1,697Revaluation results from properties under construction (see 5.7) -16,756 18,171Total -16,723 14,309 The positive amount reported under other expenses resulted from the release of liabilities totalling EUR 0.9 million.
Information on the negative effect of Covid-19 on revaluation results is provided under the change in parameters in section 4.1.1.
5.5 Other operating income Other operating income comprises the following items:
All amounts in TEUR Q1–2 2020 Q1–2 2019 Expenses charged on 243 41Insurance compensation 99 88Income from derecognised liabilities 37 2,562Reimbursement for penalties 53 300Miscellaneous 509 1,088Total 941 4,079
5.6 Other operating expenses Other operating expenses include the following items:
All amounts in TEUR Q1–2 2020 Q1–2 2019 Administrative expenses -78 -63Legal, auditing and consulting fees -3,978 -3,641Penalties -6 -63Levies -2,593 -438Advertising -1,648 -1,229Expenses charged on 0 -1EDP and communications -1,373 -1,277Expert opinions -240 -292Personnel expenses -13,901 -10,782Other write-downs -687 -523Miscellaneous -2,029 -3,995Total -26,533 -22,304 The increase in personnel expenses compared with the first half of 2019 is attributable, above all, to non-recurring payments connected with the resignation of Oliver Schumy from the Executive Board as of 18 March 2020.
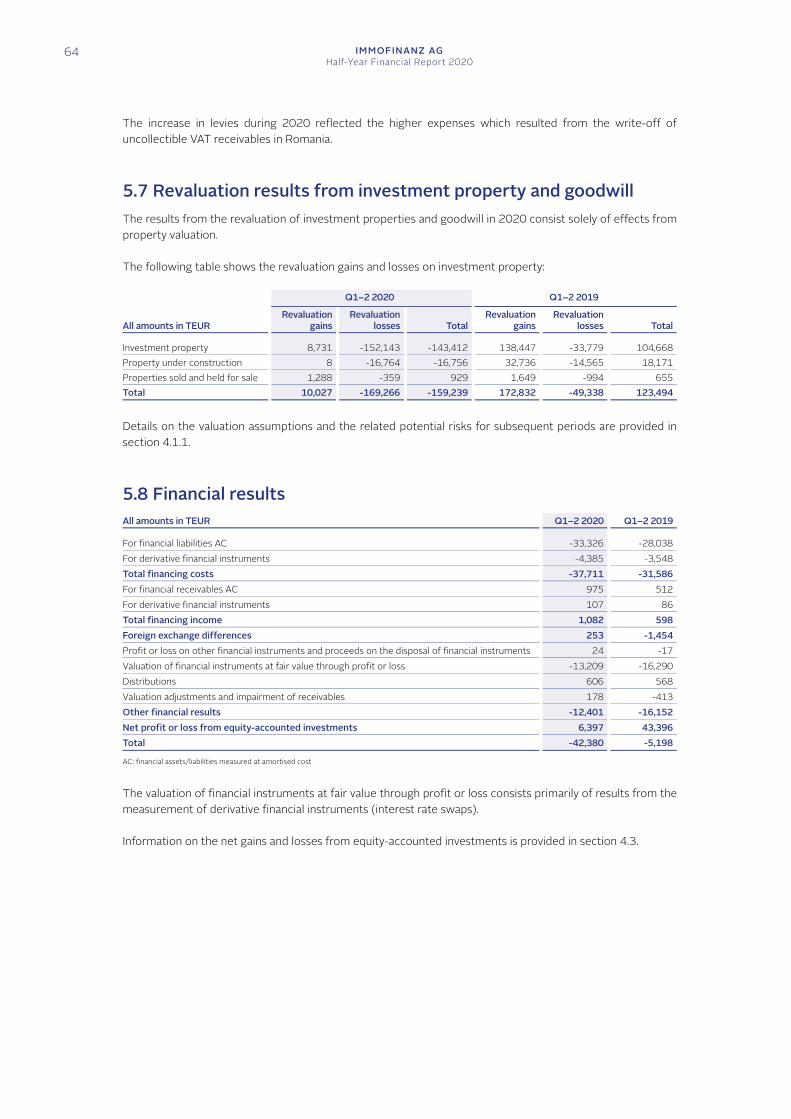
64 IMMOFINANZ AGHalf-Year Financial Report 2020
The increase in levies during 2020 reflected the higher expenses which resulted from the write-off of uncollectible VAT receivables in Romania.
5.7 Revaluation results from investment property and goodwill The results from the revaluation of investment properties and goodwill in 2020 consist solely of effects from property valuation.
The following table shows the revaluation gains and losses on investment property:
Q1–2 2020 Q1–2 2019
All amounts in TEUR Revaluation
gainsRevaluation
losses TotalRevaluation
gainsRevaluation
losses Total Investment property 8,731 -152,143 -143,412 138,447 -33,779 104,668Property under construction 8 -16,764 -16,756 32,736 -14,565 18,171Properties sold and held for sale 1,288 -359 929 1,649 -994 655Total 10,027 -169,266 -159,239 172,832 -49,338 123,494 Details on the valuation assumptions and the related potential risks for subsequent periods are provided in section 4.1.1.
5.8 Financial results All amounts in TEUR Q1–2 2020 Q1–2 2019 For financial liabilities AC -33,326 -28,038For derivative financial instruments -4,385 -3,548Total financing costs -37,711 -31,586For financial receivables AC 975 512For derivative financial instruments 107 86Total financing income 1,082 598Foreign exchange differences 253 -1,454Profit or loss on other financial instruments and proceeds on the disposal of financial instruments 24 -17Valuation of financial instruments at fair value through profit or loss -13,209 -16,290Distributions 606 568Valuation adjustments and impairment of receivables 178 -413Other financial results -12,401 -16,152Net profit or loss from equity-accounted investments 6,397 43,396Total -42,380 -5,198 AC: financial assets/liabilities measured at amortised cost
The valuation of financial instruments at fair value through profit or loss consists primarily of results from the measurement of derivative financial instruments (interest rate swaps).
Information on the net gains and losses from equity-accounted investments is provided in section 4.3.
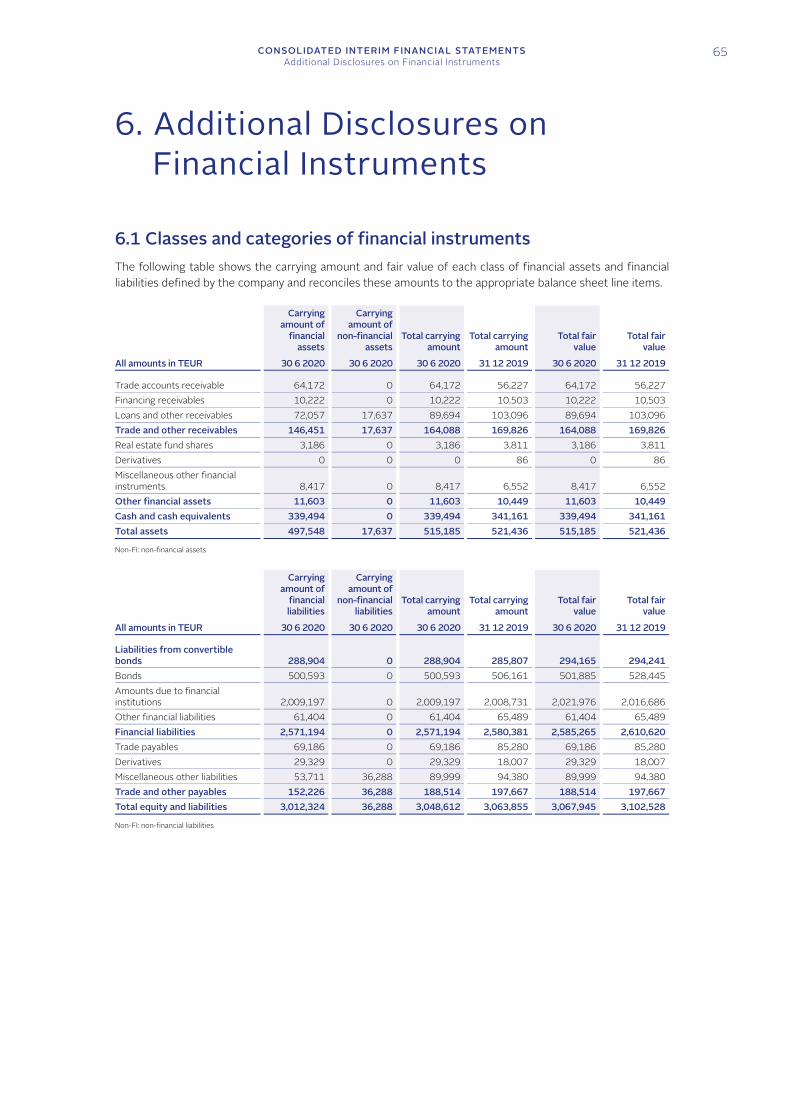
CONSOLIDATED INTERIM FINANCIAL STATEMENTSAdditional Disclosures on Financial Instruments
65
6. Additional Disclosures on Financial Instruments
6.1 Classes and categories of financial instruments The following table shows the carrying amount and fair value of each class of financial assets and financial liabilities defined by the company and reconciles these amounts to the appropriate balance sheet line items.
Carrying amount of
financial assets
Carrying amount of
non-financial assets
Total carrying amount
Total carrying amount
Total fair value
Total fair value
All amounts in TEUR 30 6 2020 30 6 2020 30 6 2020 31 12 2019 30 6 2020 31 12 2019 Trade accounts receivable 64,172 0 64,172 56,227 64,172 56,227Financing receivables 10,222 0 10,222 10,503 10,222 10,503Loans and other receivables 72,057 17,637 89,694 103,096 89,694 103,096Trade and other receivables 146,451 17,637 164,088 169,826 164,088 169,826Real estate fund shares 3,186 0 3,186 3,811 3,186 3,811Derivatives 0 0 0 86 0 86Miscellaneous other financial instruments 8,417 0 8,417 6,552 8,417 6,552Other financial assets 11,603 0 11,603 10,449 11,603 10,449Cash and cash equivalents 339,494 0 339,494 341,161 339,494 341,161Total assets 497,548 17,637 515,185 521,436 515,185 521,436 Non-FI: non-financial assets
Carrying
amount of financial liabilities
Carrying amount of
non-financial liabilities
Total carrying amount
Total carrying amount
Total fair value
Total fair value
All amounts in TEUR 30 6 2020 30 6 2020 30 6 2020 31 12 2019 30 6 2020 31 12 2019 Liabilities from convertible bonds 288,904 0 288,904 285,807 294,165 294,241Bonds 500,593 0 500,593 506,161 501,885 528,445Amounts due to financial institutions 2,009,197 0 2,009,197 2,008,731 2,021,976 2,016,686Other financial liabilities 61,404 0 61,404 65,489 61,404 65,489Financial liabilities 2,571,194 0 2,571,194 2,580,381 2,585,265 2,610,620Trade payables 69,186 0 69,186 85,280 69,186 85,280Derivatives 29,329 0 29,329 18,007 29,329 18,007Miscellaneous other liabilities 53,711 36,288 89,999 94,380 89,999 94,380Trade and other payables 152,226 36,288 188,514 197,667 188,514 197,667Total equity and liabilities 3,012,324 36,288 3,048,612 3,063,855 3,067,945 3,102,528 Non-FI: non-financial liabilities
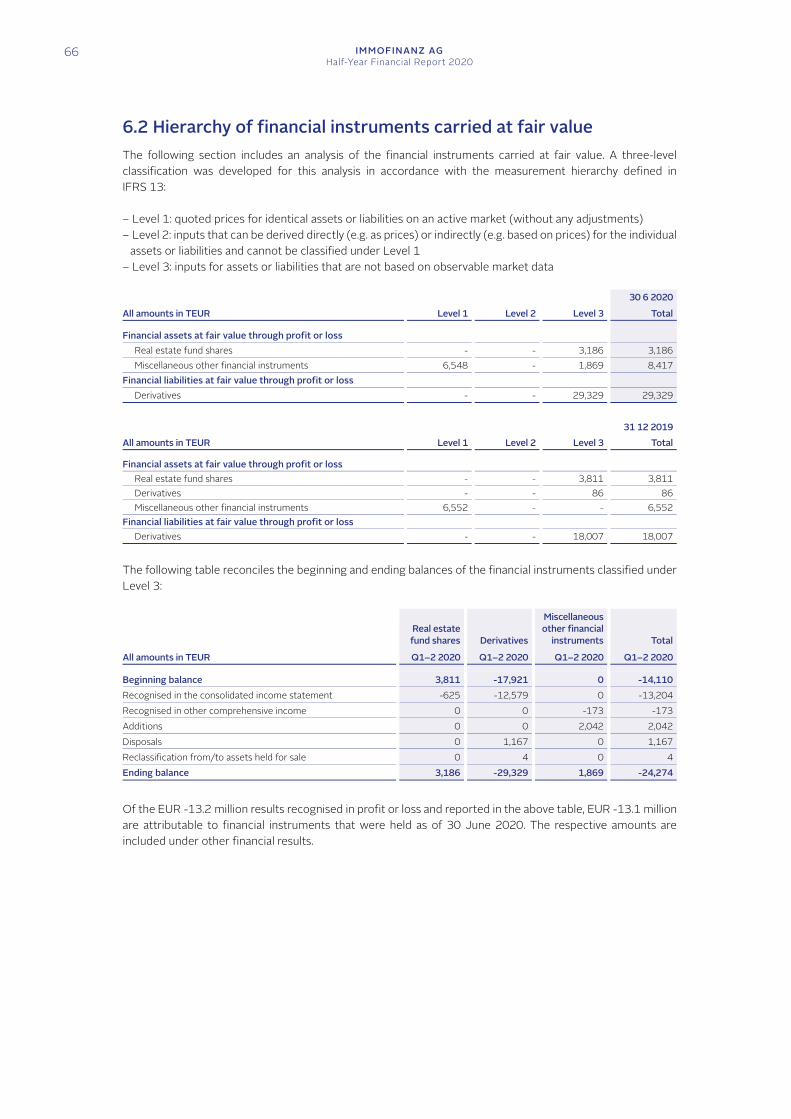
66 IMMOFINANZ AGHalf-Year Financial Report 2020
6.2 Hierarchy of financial instruments carried at fair value The following section includes an analysis of the financial instruments carried at fair value. A three-level classification was developed for this analysis in accordance with the measurement hierarchy defined in IFRS 13:
– Level 1: quoted prices for identical assets or liabilities on an active market (without any adjustments) – Level 2: inputs that can be derived directly (e.g. as prices) or indirectly (e.g. based on prices) for the individual
assets or liabilities and cannot be classified under Level 1 – Level 3: inputs for assets or liabilities that are not based on observable market data
30 6 2020All amounts in TEUR Level 1 Level 2 Level 3 Total Financial assets at fair value through profit or loss
Real estate fund shares - - 3,186 3,186Miscellaneous other financial instruments 6,548 - 1,869 8,417
Financial liabilities at fair value through profit or loss Derivatives - - 29,329 29,329
31 12 2019All amounts in TEUR Level 1 Level 2 Level 3 Total Financial assets at fair value through profit or loss
Real estate fund shares - - 3,811 3,811Derivatives - - 86 86Miscellaneous other financial instruments 6,552 - - 6,552
Financial liabilities at fair value through profit or loss Derivatives - - 18,007 18,007
The following table reconciles the beginning and ending balances of the financial instruments classified under Level 3:
Real estate fund shares Derivatives
Miscellaneous other financial
instruments Total
All amounts in TEUR Q1–2 2020 Q1–2 2020 Q1–2 2020 Q1–2 2020 Beginning balance 3,811 -17,921 0 -14,110Recognised in the consolidated income statement -625 -12,579 0 -13,204Recognised in other comprehensive income 0 0 -173 -173Additions 0 0 2,042 2,042Disposals 0 1,167 0 1,167Reclassification from/to assets held for sale 0 4 0 4Ending balance 3,186 -29,329 1,869 -24,274 Of the EUR -13.2 million results recognised in profit or loss and reported in the above table, EUR -13.1 million are attributable to financial instruments that were held as of 30 June 2020. The respective amounts are included under other financial results.
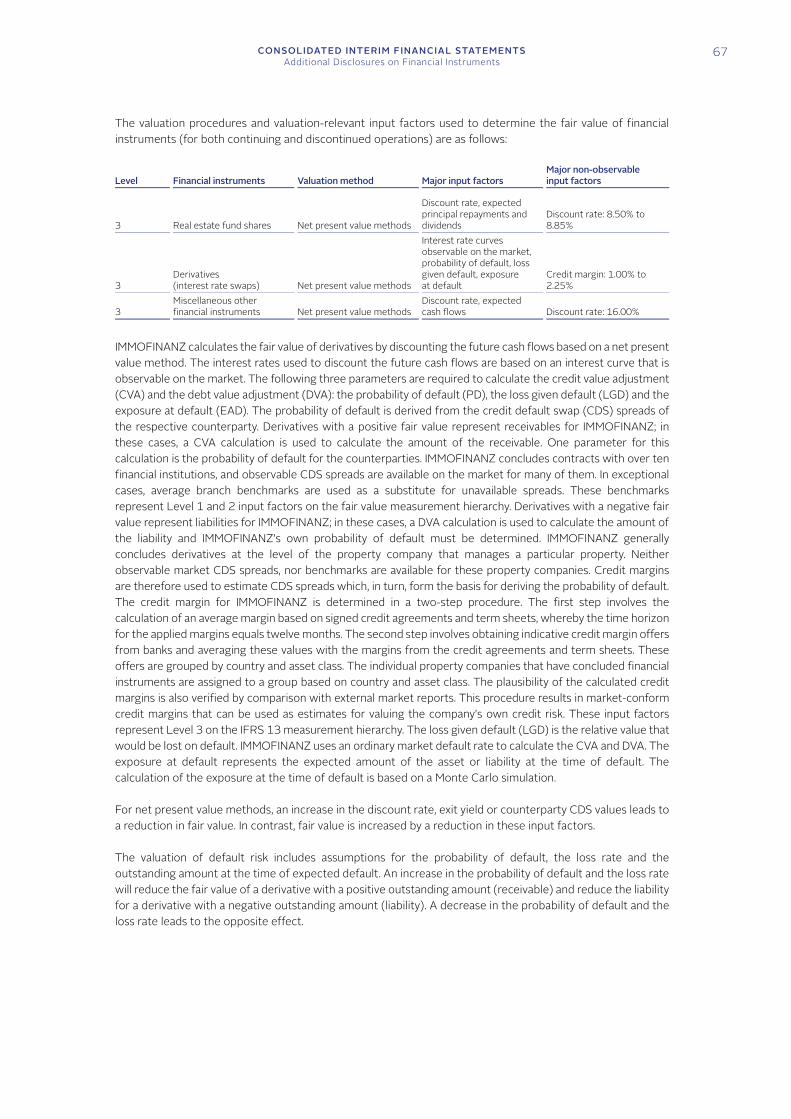
CONSOLIDATED INTERIM FINANCIAL STATEMENTSAdditional Disclosures on Financial Instruments
67
The valuation procedures and valuation-relevant input factors used to determine the fair value of financial instruments (for both continuing and discontinued operations) are as follows:
Level Financial instruments Valuation method Major input factors Major non-observable input factors
3 Real estate fund shares Net present value methods
Discount rate, expected principal repayments and dividends
Discount rate: 8.50% to 8.85%
3 Derivatives (interest rate swaps) Net present value methods
Interest rate curves observable on the market, probability of default, loss given default, exposure at default
Credit margin: 1.00% to 2.25%
3 Miscellaneous other financial instruments Net present value methods
Discount rate, expected cash flows Discount rate: 16.00%
IMMOFINANZ calculates the fair value of derivatives by discounting the future cash flows based on a net present value method. The interest rates used to discount the future cash flows are based on an interest curve that is observable on the market. The following three parameters are required to calculate the credit value adjustment (CVA) and the debt value adjustment (DVA): the probability of default (PD), the loss given default (LGD) and the exposure at default (EAD). The probability of default is derived from the credit default swap (CDS) spreads of the respective counterparty. Derivatives with a positive fair value represent receivables for IMMOFINANZ; in these cases, a CVA calculation is used to calculate the amount of the receivable. One parameter for this calculation is the probability of default for the counterparties. IMMOFINANZ concludes contracts with over ten financial institutions, and observable CDS spreads are available on the market for many of them. In exceptional cases, average branch benchmarks are used as a substitute for unavailable spreads. These benchmarks represent Level 1 and 2 input factors on the fair value measurement hierarchy. Derivatives with a negative fair value represent liabilities for IMMOFINANZ; in these cases, a DVA calculation is used to calculate the amount of the liability and IMMOFINANZ’s own probability of default must be determined. IMMOFINANZ generally concludes derivatives at the level of the property company that manages a particular property. Neither observable market CDS spreads, nor benchmarks are available for these property companies. Credit margins are therefore used to estimate CDS spreads which, in turn, form the basis for deriving the probability of default. The credit margin for IMMOFINANZ is determined in a two-step procedure. The first step involves the calculation of an average margin based on signed credit agreements and term sheets, whereby the time horizon for the applied margins equals twelve months. The second step involves obtaining indicative credit margin offers from banks and averaging these values with the margins from the credit agreements and term sheets. These offers are grouped by country and asset class. The individual property companies that have concluded financial instruments are assigned to a group based on country and asset class. The plausibility of the calculated credit margins is also verified by comparison with external market reports. This procedure results in market-conform credit margins that can be used as estimates for valuing the company’s own credit risk. These input factors represent Level 3 on the IFRS 13 measurement hierarchy. The loss given default (LGD) is the relative value that would be lost on default. IMMOFINANZ uses an ordinary market default rate to calculate the CVA and DVA. The exposure at default represents the expected amount of the asset or liability at the time of default. The calculation of the exposure at the time of default is based on a Monte Carlo simulation.
For net present value methods, an increase in the discount rate, exit yield or counterparty CDS values leads to a reduction in fair value. In contrast, fair value is increased by a reduction in these input factors.
The valuation of default risk includes assumptions for the probability of default, the loss rate and the outstanding amount at the time of expected default. An increase in the probability of default and the loss rate will reduce the fair value of a derivative with a positive outstanding amount (receivable) and reduce the liability for a derivative with a negative outstanding amount (liability). A decrease in the probability of default and the loss rate leads to the opposite effect.
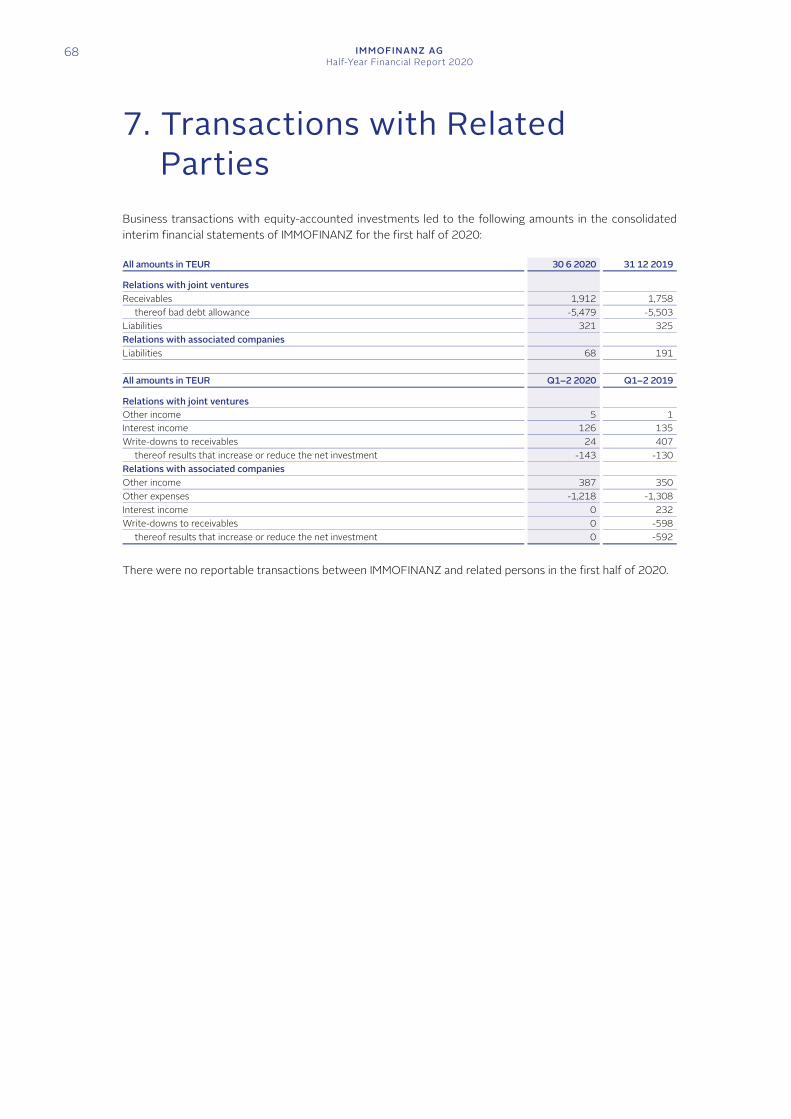
68 IMMOFINANZ AGHalf-Year Financial Report 2020
7. Transactions with Related Parties
Business transactions with equity-accounted investments led to the following amounts in the consolidated interim financial statements of IMMOFINANZ for the first half of 2020:
All amounts in TEUR 30 6 2020 31 12 2019 Relations with joint ventures Receivables 1,912 1,758
thereof bad debt allowance -5,479 -5,503Liabilities 321 325Relations with associated companies Liabilities 68 191 All amounts in TEUR Q1–2 2020 Q1–2 2019 Relations with joint ventures Other income 5 1Interest income 126 135Write-downs to receivables 24 407
thereof results that increase or reduce the net investment -143 -130Relations with associated companies Other income 387 350Other expenses -1,218 -1,308Interest income 0 232Write-downs to receivables 0 -598
thereof results that increase or reduce the net investment 0 -592 There were no reportable transactions between IMMOFINANZ and related persons in the first half of 2020.
CONSOLIDATED INTERIM FINANCIAL STATEMENTSSubsequent Events
69
8. Subsequent Events The negative effects of Covid-19 after the balance sheet date on 30 June 2020 also include suspended rents and a decline in rental income from the office and retail businesses. In addition to the lease adjustments which had been signed as of 30 June 2020, numerous other contract adjustments were nearing finalisation. IMMOFINANZ assumes that most of these contract adjustments will be signed during the next quarter. Contractual agreements over further rental price reductions in the office and retail segments were also reached during the weeks in which this report was prepared.
Covid-19 also has a significant influence on the company’s revaluation results, and the impact of the pandemic on the further development of business during and after 2020 cannot be estimated at the present time.
On 9 July 2020, IMMOFINANZ announced plans for a capital increase and the issue of a subordinated mandatory convertible bond.
IMMOFINANZ placed 15,418,824 shares, which represent approximately 13.76% of the company’s current share capital, with institutional investors through an accelerated book-building process under the exclusion of subscription rights. The gross proceeds from the placement totalled roughly EUR 236 million.
A total of 4,210,298 treasury shares, which represent approximately 3.76% of the company’s current share capital, were sold. IMMOFINANZ holds 6,998,228 treasury shares after this sale, which represent approximately 6.24% of the company’s current share capital (and roughly 5.68% of share capital after the cash capital increase).
In addition, IMMOFINANZ AG placed a subordinated mandatory convertible bond with a total nominal value of EUR 120 million with institutional investors through an accelerated book-building process under the exclusion of subscription rights.
IMMOFINANZ sold the Panta Rhei office building in Düsseldorf to Deka Immobilien on 6 August 2020.
70 IMMOFINANZ AGHalf-Year Financial Report 2020
Statement by the Executive Board We confirm to the best of our knowledge that these consolidated interim financial statements of IMMOFINANZ as of 30 June 2020, which were prepared in accordance with the rules for interim financial reporting defined by the International Financial Reporting Standards (IFRS), give a true and fair view of the assets, liabilities, financial position and profit or loss of the Group as required by Austrian stock market regulations. We also confirm to the best of our knowledge that the interim Group management report gives a true and fair view of important events that occurred during the first six months of the financial year and their impact on these consolidated interim financial statements as well as the principal risks and uncertainties for the remaining six months of the financial year and reportable transactions with related parties.
Vienna, 26 August 2020
The Executive Board of IMMOFINANZ AG
Ronny Pecik CEO
Stefan Schönauer CFO
Dietmar Reindl COO
CONSOLIDATED INTERIM FINANCIAL STATEMENTSReport on the Review
71
Report on the Review of the Condensed Consolidated Interim Financial Statements
Introduction
We have reviewed the accompanying condensed consolidated interim financial statements of IMMOFINANZ AG, Vienna, for the period from 1 January 2020 to 30 June 2020. These condensed consolidated interim financial statements comprise (i) the consolidated balance sheet as of 30 June 2020, (ii) the consolidated income statement, the consolidated statement of comprehensive income, the consolidated cash flow statement and the consolidated statement of changes in equity, each for the period from 1 January 2020 to 30 June 2020 and the comparative information for the period from 1 January 2019 to 30 June 2019, and (iii) notes.
Management is responsible for the preparation of the condensed consolidated interim financial statements in accordance with the International Financial Reporting Standards (IFRS) as adopted by the EU and applicable to interim financial reporting.
Our responsibility is to express a conclusion on these condensed consolidated interim financial statements based on our review.
Our responsibility and liability for proven financial losses due to a grossly negligent breach of duty is limited to EUR 12 million analogous to § 275 (2) UGB (Austrian Commercial Code). Our liability for slight negligence is excluded in accordance with the General Conditions of Contract for the Public Accounting Professions (AAB 2018) on which this review engagement is based. The limitation of our liability agreed with the client and disclosed here also applies to any third party who takes or fails to take action in reliance on our review report.
Scope of review We conducted our review of the condensed consolidated interim financial statements in accordance with Austrian legal requirements and professional standards and with the International Standard on Review Engagements (ISRE 2410) “Review of Interim Financial Information Performed by the Independent Auditor of the Entity”. A review of interim financial statements consists of making inquiries, primarily of persons responsible for financial and accounting matters, and applying analytical and other review procedures.
A review is substantially less in scope than an audit conducted in accordance with Austrian Standards on Auditing, which require the application of the International Standards on Auditing, and consequently does not enable us to obtain assurance that we would become aware of all significant matters that might be identified in an audit. Accordingly, we do not express an audit opinion.
72 IMMOFINANZ AGHalf-Year Financial Report 2020
Conclusion Based on our review, nothing has come to our attention that causes us to believe that the accompanying condensed consolidated interim financial statements of IMMOFINANZ AG are not prepared, in all material respects, in accordance with the International Financial Reporting Standards (IFRS) as adopted by the EU and applicable to interim financial reporting.
Vienna, 26 August 2020
Deloitte Audit Wirtschaftsprüfungs GmbH
Mr. Friedrich Wiesmüllner
Austrian Chartered Accountant
This report is a translation of the German version of our report on the Review of the Condensed Consolidated Interim Financial Statements as of 30 June 2020. The translation is presented for the convenience of the reader only. The German wording of the report is solely valid and is the only legally binding version. Section 281 (2) UGB applies.
ImprintPhotos: IMMOFINANZ AG, ESB Professional/Shutterstock.com, Geber86 – stock.adobe.com, praetorianphoto – stock.adobe.com, Downtown films Zemun, Klaus VyhnalekConcept and realisation: be.public Corporate & Financial Communications and Rosebud, Inc., produced inhouse using firesys GmbH (pages 4–72) Print: DRUCKWERKSTATT, Hosnedlgasse 16 b, 1220 Wien
Disclaimer We have prepared this report and verified the data herein with the greatest possible caution. However, errors arising from rounding, transmission, typesetting or printing cannot be excluded. This report contains assumptions and forecasts that were based on information available at the time this report was prepared. If the assumptions underlying these forecasts are not realised, actual results may differ from the results expected at the present time. Automatic data processing can lead to apparent mathematical errors in the rounding of numbers or percentage rates. This report is published in German and English, and can be downloaded from the investor relations section of the IMMOFINANZ website. In case of doubt, the German text represents the definitive version. This report does not represent a recommendation to buy or sell shares in IMMOFINANZ AG.
Rounding differences may result from the use of automatic data processing equipment for the addition of rounded amounts and percentage rates.
Financial Calendar 2020
IMMOFINANZ AG Wienerbergstraße 11 1100 Vienna, Austria T +43 (0)1 880 90
[email protected] www.immofinanz.com
21 September 2020 Record date for participation in the 27th annual general meeting1 October 2020 27th annual general meeting5 October 2020 Expected ex-dividend date6 October 2020 Expected date for the determination of dividend rights (record date)7 October 2020 Expected dividend payment date25 November 20201 Announcement of results for the first three quarters of 202026 November 2020 Interim financial statements on the first three quarters of 2020
1 Publication after close of trading at the Vienna Stock Exchange