Embed Size (px)
Citation preview
Hard to Find Information About
Distribution Systems Part VI (only)
Volume 2 August 2007 Jim Burke 109 Dorchester Pines Court Cary, NC 27511 919-457-3118 – mobile © Jim Burke [email protected]@quanta-technology.com
1

2
TABLE OF CONTENTS
Page I. Stray Voltage 4 II. Reliability of Higher Voltages 9 III. Trends in Reliability 11 IV. DG Update 14 V. Power Line Interference (RFI) 16 VI. Warning Labels 17 VII. Conversion of OH to UG 17 VIII. Maintenance Survey 18 IX. Courses for Men 22 X. Arc Flash 24 XI. Impedance of Earth 25 XII. Cost of Power 26 XIII. Telephone Interference 26 Burke Bio 27
3
I. “Stray Voltage”
I. Introduction For most of my career, spanning over 40 years, the term “stray voltage” has meant one thing, i.e. the voltage between the neutral conductor and the earth, resulting from unbalanced current. Since unbalanced current is an integral part of a 4 wire multi-grounded system, it was considered normal. The only issues that arose were from the dairy industry and occasionally from a pool owner. Stray Voltage was not considered dangerous , especially to humans, so the interest level in the industry was relatively low.
Contrast this with today’s perception (a perception I might add resulting from the legal environment, and non technically orientated people), where stray voltage has been blamed for every type of electrical phenomena, the most newsworthy, of course, those associated with death. A true mess!
What we have historically called “stray voltage” refers to voltages that are generally less than 5 volts and rarely above 10 volts. These voltages are significantly less than voltages considered dangerous by OSHA, NESC and NEC who set the limit at 50 volts and amateur radio operators (ARRL) who set the limit at 35 volts.
Stray voltage is not the voltage associated with “step-and- touch”, high impedance faults, temporary overvoltages, static discharge, contact voltages, etc. And finally, although everyone knows that current kills…not voltage, “stray current” and “stray voltage” are not directly related…..at all. II. Terminology Issues in 2006 The term “stray voltage” is taking on a life of its own and becoming all things to all people. The following are terms interchanged with the term “stray voltage” which are incorrect (to those of us in the industry for a while) and causing a lot of the present confusion: a. Stray Voltage – the term as generally defined by utility engineers refers to the voltage imposed on the distribution primary neutral due in large part to return currents (unbalanced loads). In the context of the last 40 years, the voltage is associated with problems in dairy farms and generally the voltages do not exceed about 10 volts. It is not considered lethal. b. TOV – Temporary Overvoltages (TOV) are commonly referred to as stray voltages which they are not. TOV’s are 60 Hz overvoltages that occur on the unfaulted phases of a 4-wire multi-grounded system during a fault. They are voltages primary associated with the rating of arresters for lightning protection. There duration is very short and a function of the overcurrent protection speed being used on the distribution system. c. Contact Voltage – We normally use the term contact voltage to address the condition where the “hot” lead (120 volts or more) contacts the outside shell of something like a streetlight. This voltage is dangerous and can result in death. Contact voltage is not “stray voltage” although it is sometimes misapplied in this context.
d. Step and Touch Voltages – “Step and Touch” voltages are generally associated with the high voltages that can occur between the two feet of an individual or a hand and foot, during fault conditions. They are normally a concern in substations, where currents can be very high (>10,000 amperes) and where close proximity of personnel creates safety concerns. In
4
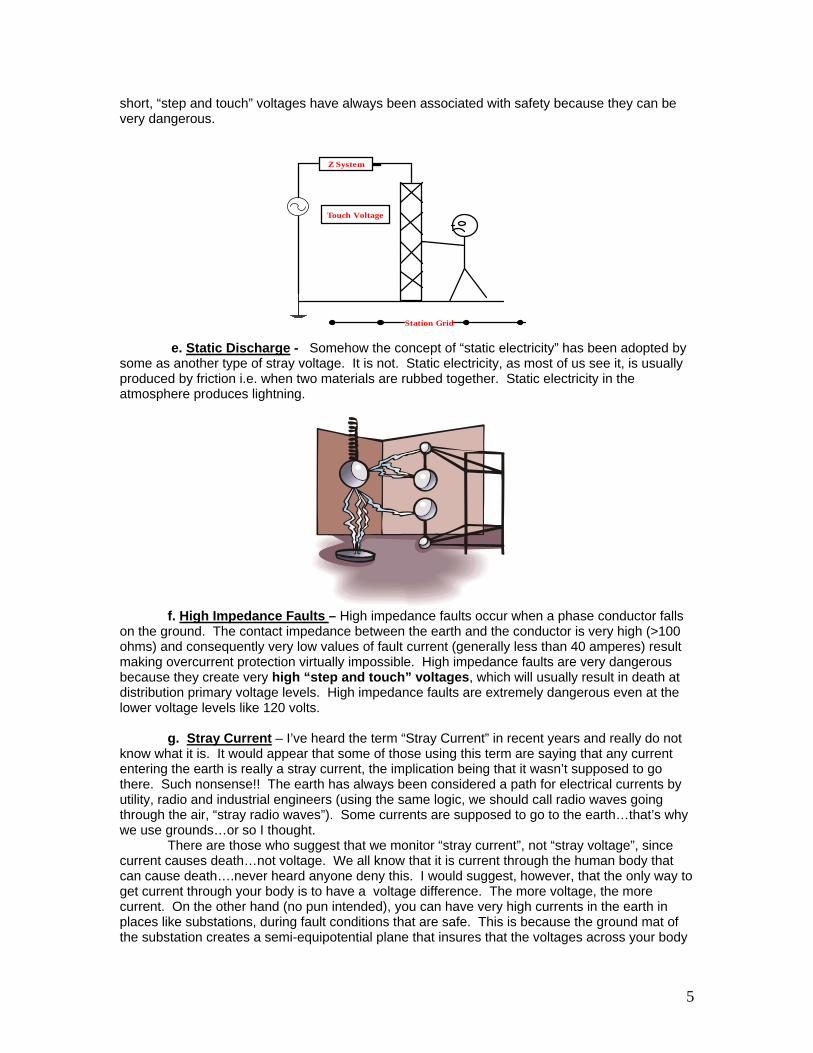
short, “step and touch” voltages have always been associated with safety because they can be very dangerous. Z System
Touch Voltage
Station Grid
e. Static Discharge - Somehow the concept of “static electricity” has been adopted by some as another type of stray voltage. It is not. Static electricity, as most of us see it, is usually produced by friction i.e. when two materials are rubbed together. Static electricity in the atmosphere produces lightning.
f. High Impedance Faults – High impedance faults occur when a phase conductor falls
on the ground. The contact impedance between the earth and the conductor is very high (>100 ohms) and consequently very low values of fault current (generally less than 40 amperes) result making overcurrent protection virtually impossible. High impedance faults are very dangerous because they create very high “step and touch” voltages, which will usually result in death at distribution primary voltage levels. High impedance faults are extremely dangerous even at the lower voltage levels like 120 volts.
g. Stray Current – I’ve heard the term “Stray Current” in recent years and really do not know what it is. It would appear that some of those using this term are saying that any current entering the earth is really a stray current, the implication being that it wasn’t supposed to go there. Such nonsense!! The earth has always been considered a path for electrical currents by utility, radio and industrial engineers (using the same logic, we should call radio waves going through the air, “stray radio waves”). Some currents are supposed to go to the earth…that’s why we use grounds…or so I thought.
There are those who suggest that we monitor “stray current”, not “stray voltage”, since current causes death…not voltage. We all know that it is current through the human body that can cause death….never heard anyone deny this. I would suggest, however, that the only way to get current through your body is to have a voltage difference. The more voltage, the more current. On the other hand (no pun intended), you can have very high currents in the earth in places like substations, during fault conditions that are safe. This is because the ground mat of the substation creates a semi-equipotential plane that insures that the voltages across your body
5
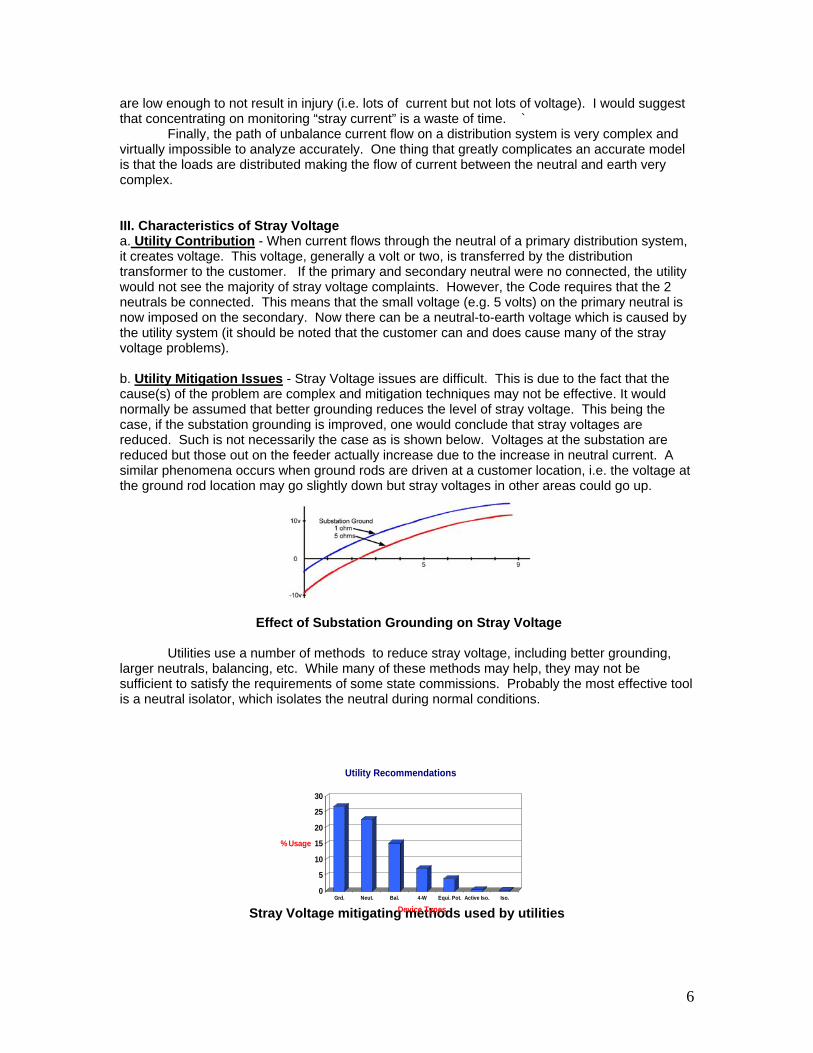
are low enough to not result in injury (i.e. lots of current but not lots of voltage). I would suggest that concentrating on monitoring “stray current” is a waste of time. ` Finally, the path of unbalance current flow on a distribution system is very complex and virtually impossible to analyze accurately. One thing that greatly complicates an accurate model is that the loads are distributed making the flow of current between the neutral and earth very complex. III. Characteristics of Stray Voltage a. Utility Contribution - When current flows through the neutral of a primary distribution system, it creates voltage. This voltage, generally a volt or two, is transferred by the distribution transformer to the customer. If the primary and secondary neutral were no connected, the utility would not see the majority of stray voltage complaints. However, the Code requires that the 2 neutrals be connected. This means that the small voltage (e.g. 5 volts) on the primary neutral is now imposed on the secondary. Now there can be a neutral-to-earth voltage which is caused by the utility system (it should be noted that the customer can and does cause many of the stray voltage problems). b. Utility Mitigation Issues - Stray Voltage issues are difficult. This is due to the fact that the cause(s) of the problem are complex and mitigation techniques may not be effective. It would normally be assumed that better grounding reduces the level of stray voltage. This being the case, if the substation grounding is improved, one would conclude that stray voltages are reduced. Such is not necessarily the case as is shown below. Voltages at the substation are reduced but those out on the feeder actually increase due to the increase in neutral current. A similar phenomena occurs when ground rods are driven at a customer location, i.e. the voltage at the ground rod location may go slightly down but stray voltages in other areas could go up.
Effect of Substation Grounding on Stray Voltage
Utilities use a number of methods to reduce stray voltage, including better grounding, larger neutrals, balancing, etc. While many of these methods may help, they may not be sufficient to satisfy the requirements of some state commissions. Probably the most effective tool is a neutral isolator, which isolates the neutral during normal conditions.
0
5
10
15
20
25
30
Stray Voltage mitigating methods used by utilities
% Usage
Grd. Neut. Bal. 4-W Equi. Pot. Active Iso. Iso.
Utility Recommendations
Device Types
6
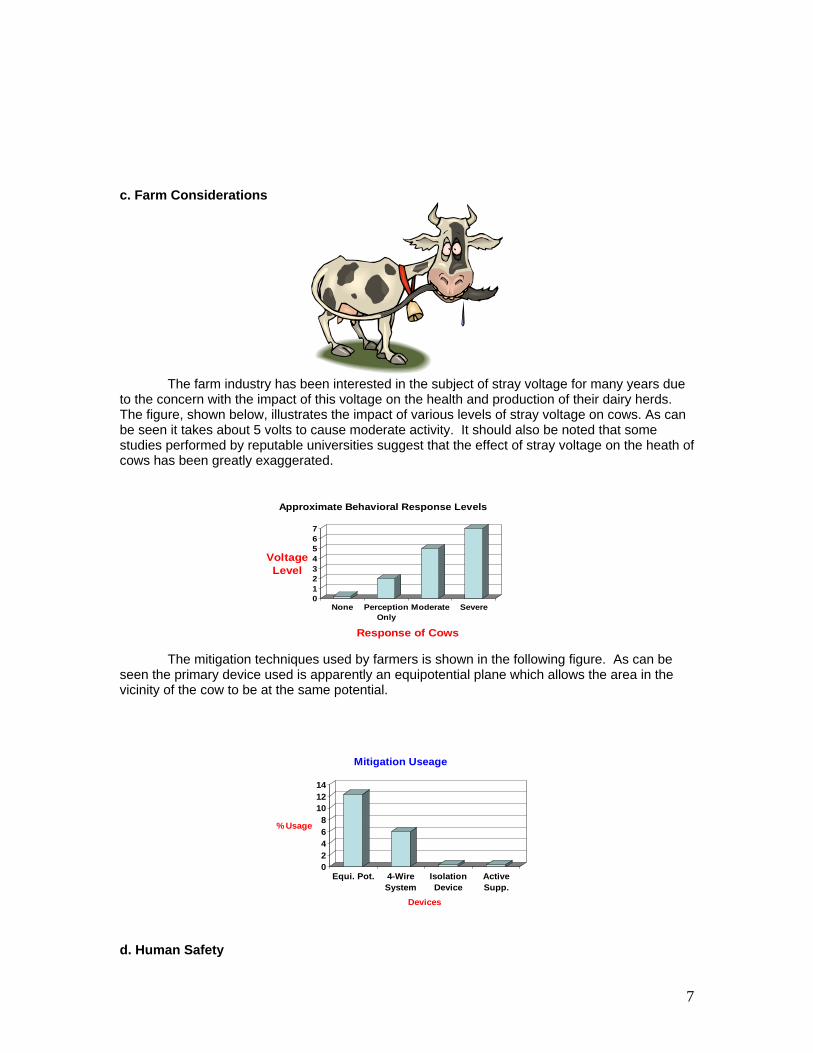
c. Farm Considerations
The farm industry has been interested in the subject of stray voltage for many years due to the concern with the impact of this voltage on the health and production of their dairy herds. The figure, shown below, illustrates the impact of various levels of stray voltage on cows. As can be seen it takes about 5 volts to cause moderate activity. It should also be noted that some studies performed by reputable universities suggest that the effect of stray voltage on the heath of cows has been greatly exaggerated.
0123
4
567
Voltage Level
None PerceptionOnly
Moderate Severe
Approximate Behavioral Response Levels
Response of Cows The mitigation techniques used by farmers is shown in the following figure. As can be seen the primary device used is apparently an equipotential plane which allows the area in the vicinity of the cow to be at the same potential.
02468
101214
d. Human Safety
% Usage
Equi. Pot. 4-WireSystem
IsolationDevice
ActiveSupp.
Mitigation Useage
Devices
7
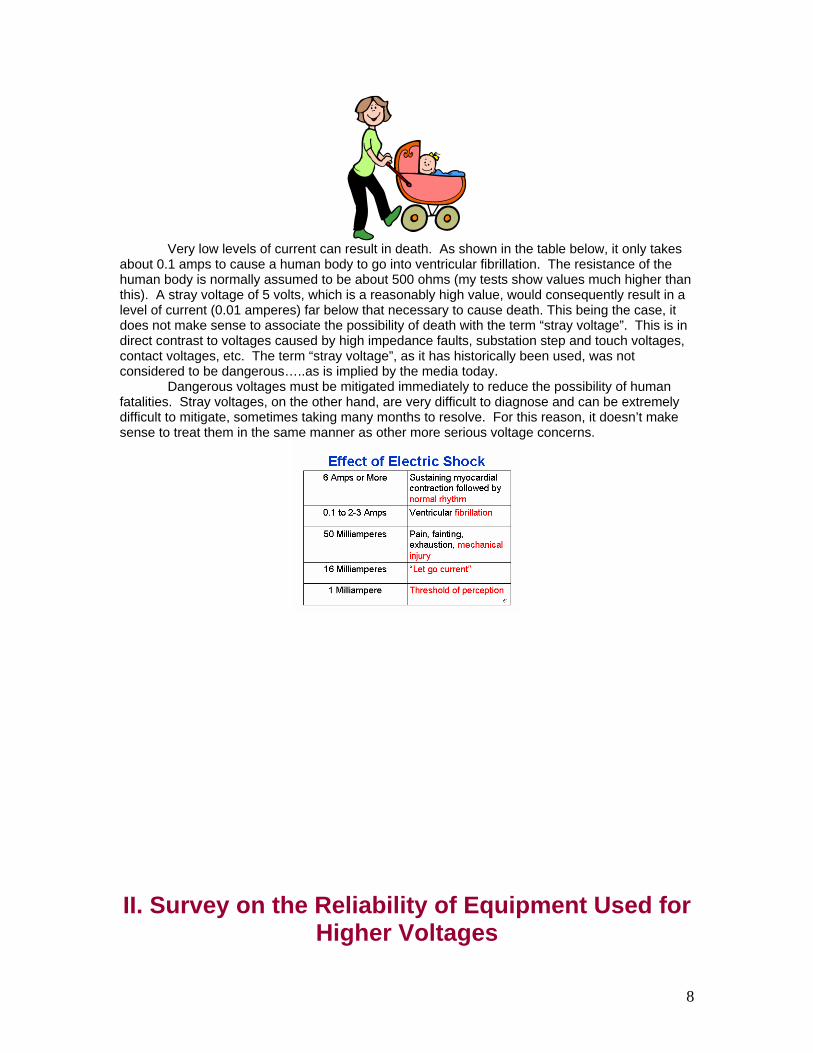
Very low levels of current can result in death. As shown in the table below, it only takes about 0.1 amps to cause a human body to go into ventricular fibrillation. The resistance of the human body is normally assumed to be about 500 ohms (my tests show values much higher than this). A stray voltage of 5 volts, which is a reasonably high value, would consequently result in a level of current (0.01 amperes) far below that necessary to cause death. This being the case, it does not make sense to associate the possibility of death with the term “stray voltage”. This is in direct contrast to voltages caused by high impedance faults, substation step and touch voltages, contact voltages, etc. The term “stray voltage”, as it has historically been used, was not considered to be dangerous…..as is implied by the media today.
Dangerous voltages must be mitigated immediately to reduce the possibility of human fatalities. Stray voltages, on the other hand, are very difficult to diagnose and can be extremely difficult to mitigate, sometimes taking many months to resolve. For this reason, it doesn’t make sense to treat them in the same manner as other more serious voltage concerns.
II. Survey on the Reliability of Equipment Used for Higher Voltages
8
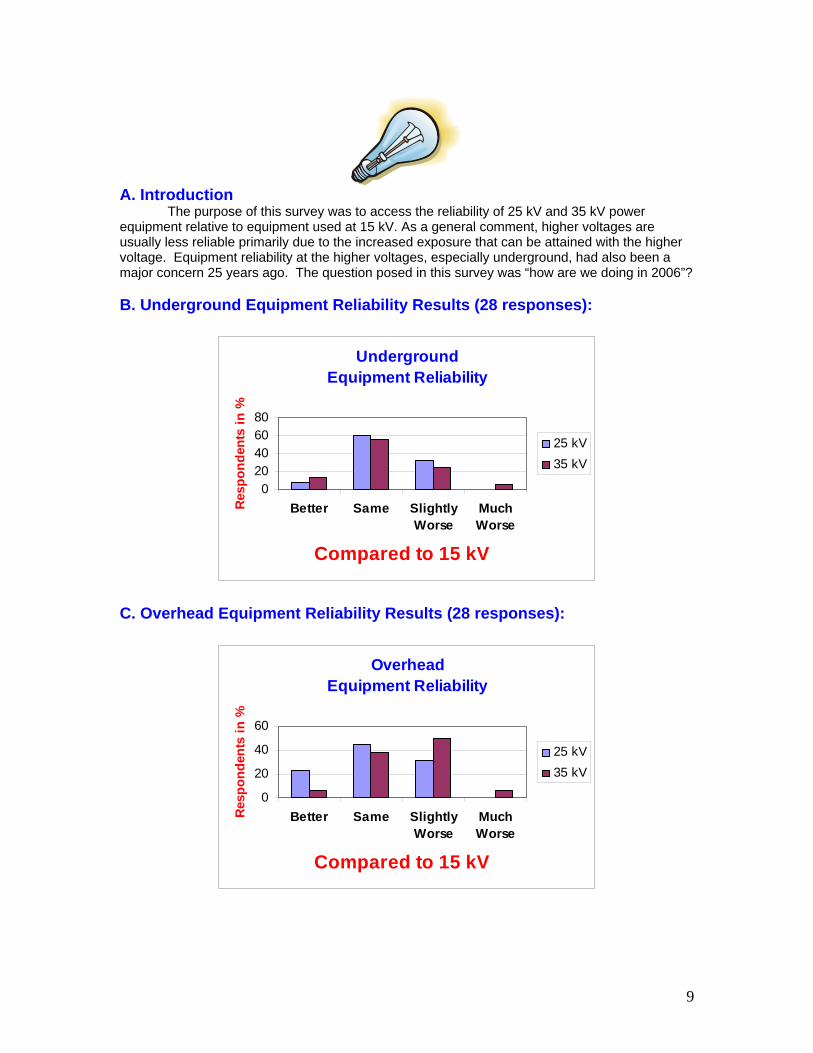
A. Introduction The purpose of this survey was to access the reliability of 25 kV and 35 kV power equipment relative to equipment used at 15 kV. As a general comment, higher voltages are usually less reliable primarily due to the increased exposure that can be attained with the higher voltage. Equipment reliability at the higher voltages, especially underground, had also been a major concern 25 years ago. The question posed in this survey was “how are we doing in 2006”? B. Underground Equipment Reliability Results (28 responses):
UndergroundEquipment Reliability
020406080
Better Same SlightlyWorse
MuchWorse
Compared to 15 kV
Resp
onde
nts
in %
25 kV35 kV
C. Overhead Equipment Reliability Results (28 responses):
Overhead Equipment Reliability
0
20
40
60
Better Same SlightlyWorse
MuchWorse
Compared to 15 kV
Resp
onde
nts
in %
25 kV35 kV
9
D. System Performance Most users of 25 kV systems found them to be equal in performance to those in the 15 kV class. Average performance rated 8.4 out of 10. This slight decrease in performance was primarily due to increase exposure. Most users of 35 kV systems found the overall performance of the system to be moderately less than 15 kV systems (6.7 out of 10). This was primarily attributed to increased exposure and operability of equipment. Some found 34.5 kV equal to or better than 15 kV. E. Coastal Areas
1 utility reported that they limit voltages in coastal areas to 15 kV class. 8 reported that they have no voltage restrictions in their coastal areas. Most reported that they use high insulation levels regardless of voltage level. 3 manufacturers were contacted and all indicated they were not aware of voltage restrictions regarding customer purchases for coastal areas. F. Conclusions It would appear that equipment used for 25 kV systems, both overhead and underground is equal in reliability to that used at 15 kV. 35 kV equipment also appeared to be very comparable in reliability to 15 kV class products. Many utilities commented that system performance (which includes operability, and increase exposure) of the higher voltages was quite good (some said better than 15 kV). Some low marks were given at the 35 kV level but most were quite good. Voltage level does not appear to be much of a concern when selecting voltages for coastal areas. Apparently most utilities are aware of problems associated with salt spray and compensate for this problem by increasing insulation levels.
III. Trends Creating Reliability Concerns Or
(10 Steps to Becoming a Third World Utility)
10
Introduction For the past 40 years, my experience has been that utilities have always made a concerted effort to provide reliable power to their customers. Manufacturers, too, have competed on the basis of creating better products having better reliability, operability and features. Recent trends have been disturbing. It would appear that while reliability and power quality are getting a lot of publicity, the overall picture would indicate that reliability will degrade in the not too distant future. This short section addresses the following 10 trends that the author feels are creating a power system having many of the poor reliability characteristics utilities have been so successful in avoiding over these years:
1. Elimination of experienced engineers 2. Reduction of participation in standards activities 3. Loss of control over generation and transmission 4. Decaying infrastructure 5. Purchase of products purely on the basis of price 6. Elimination of R&D 7. Severe reduction of budgets and manpower 8. Overloading equipment 9. Loss of control over daily activities 10. Adoption of an “Not in My Backyard” policy
1. Elimination of Experienced Engineers
Very few of the engineers I started with in the industry are still around. Company policies have made the incentive to continue in the areas of utility engineering difficult. Lack of continuing education, no ability to attend regional and committee meetings to stay up to date and lack of control on system decisions (turned over to finance and legal entities) have made the “early out” policies very attractive. This has caused a huge change in technical talent in the industry. Whereas years ago, my course on distribution engineering would have included such topics as the per-unit system and sequence networks, today it would be pretty much impossible to address these topics in an introductory course. Distribution engineers today tend to be very new to the area and do not expect to do engineering for very long. Instead they are put into operational and supervisory jobs where the time to do detailed engineering in any particular area of expertise is impossible. Software programs have replaced actual understanding, in many instances. The concern here is that the industry is rapidly losing its experts and its mentors. What mentors that are left, are not allowed the time to mentor. In an industry that is rapidly becoming much more complex, we seem to be under the assumption that someone else will tell us how to do it. Not a good idea!
2. Reduction of Participation in Standards Standards activities depend on the integrated efforts of the manufacturers and the users. While many manufacturers make every effort to produce products in accordance with their customer’s needs, only the utility really knows what it is they need, and how it will be used. The assumption that manufacturers know the maintenance schedule of switches, the loading of transformers, the environment of underground equipment, overcurrent protection philosophies, etc. is not necessarily true. Throughout the years, it has always been the utilities which have insured that the standards met their needs. With the reduction of utility participation which has occurred over the past 10 years, there is a tremendous risk that products and applications will not reflect utility requirements and that utility engineers will be unaware of these limitations.
11
3. Loss of Control Over Generation and Transmission My experience in underdeveloped countries has shown me that in the area of reliability, the transmission and generation can contribute as much to customer interruptions as the distribution system (in North America we normally assume that T&G contributes less than 10% to our reliability indicies). Trends in this country are rapidly making transmission and generation adequacy a major concern. Equally disturbing is the assumption that distributed generation will save the day. Distributed generation has traditionally been used as backup. The philosophy that DG will replace traditional T&D system infrastructure is a serious step. Claims of lower cost and better reliability are many times based on this philosophy, which in the authors opinion, has little foundation (see section IV). DG as backup will no doubt increase as customer concerns about reliability increase. The idea that our industry can rely on DG to replace fossil and nuclear stations as well as transmission lines is a giant step and has huge and unproven technological implications and concerns. Some of points one should consider in this area are:
• Solar, wind, etc. have been around a long time and have not impacted total generation capacity to any large degree
• Natural gas is becoming expensive • Efficiencies of most DG range around 30% • Reliability of solar, micro-turbines, fuel cells, etc. does not even approach utility
reliability values • DG may not be available when the utility needs it?
4. Decaying Infrastructure
There is no law in our industry that states “thou shalt maintain”. While there is some maintenance on the distribution system, the overriding philosophy seems to be “to replace only in the event of failure”. Some of this philosophy is understandable but there are some disturbing situations in the country that are not being adequately addressed. For example, it is not unusual to hear a utility say that the average age of their substation transformers is 35 to 40 years old. While it is encouraging that this equipment has performed beyond the normal life estimates, I am not aware of any utility that replaces old transformers unless they fail. This is also true of many transmission and distribution lines where growth has not made them obsolete. Underground systems, in many of our cities, are sometimes so old that there are no records of where cables are even routed. Since there is no money these days, programs to replace old equipment are non existent. Old equipment eventually fails and the day may not be too far away where we see much of this vintage equipment failing far more frequently than is presently the case.
5. Buy on Price In my early years in the industry, manufacturers of good equipment and services, were rewarded by receiving a slight premium for their products. Today, most utilities buy on price. All products are not created equally. When utilities buy solely on price, they force even the good manufactures to cut costs to survive. In effect, they force product quality to the lowest common denominator. Nobody wins!!!!!
6. Elimination of R&D
There is much less R&D being performed in the area of distribution these days. This lack of R&D is reflected in the fact that graduate students in the area of power are becoming few and far between. New (hardware) product developments are rare. This is all in a time when the industry is becoming much more complicated. How is it possible that an industry immersed in computers, power electronics, distributed generation, power quality, etc. can afford to reduce R&D?
7. Reduction of Budgets and Manpower
12
The reduction of capital budgets, sometimes by more than 30%, and the reduction in crews and engineers is pretty common in this age of de-regulation. While de-regulation in the distribution areas has really meant more regulations in the area of reliability, there still seems to be an attitude that these reductions can be accomplished without any major impact to reliability indices. On the contrary, many of these same utilities are promising better reliability. Add to this the demands of customers for better power quality (mitigation of sags, etc.) and it gets pretty difficult to see where the monies to fund these expensive customer based programs will come from.
8. Overloading Equipment
Utilities have, in the past, been very conservative in their loading practices. This philosophy has provided them with excellent reliability. It has also allowed them flexibility for reconfiguration during times of equipment outages. The ability to switch, without exceeding equipment loading criteria, is a major factor in reducing interruption times. While overloading of equipment, such as substation transformers, does not appear to be the major cause of transformer failure, it may be a contributing cause to transformer failures resulting from short circuit since insulation brittleness during these events can cause breakdown. Also, even if the equipment can handle the load, the simple fact of having more customers per feeder (or transformer) will be reflected in poorer reliability since more customers will be impacted by a given outage. Another consideration is that power systems are getting larger while the workforce is getting smaller. It is reasonable to assume that the day-to-day knowledge required to operate the system is getting lost and as margins are reduced the chance for operation errors will increase. Finally, in the past, most distribution engineers didn’t have to concern themselves with things like load cycles since conservative loading basically allowed enough margins for errors in forecasting. By consciously overloading equipment in order to delay purchases, utilities are creating a situation where engineers must know more about the overload characteristics of these equipment’s, and this is not being done.
9. Loss of Control Over Daily Activities
The trend toward farming work out to others is sensitive so I will be brief. On the one hand, there may be certain things that others can do better than what utilities have experienced by using the internal work force. There are, however, other things that only intimate knowledge of the utility’s customer base and territory will provide. Another concern is that the more a utility becomes ignorant of their day-to-day activities, the more likely they will not see what the future offers.
10. “Not in My Backyard Policy”
I can remember some years ago hearing various utilities say that they will never be able to build transmission lines and they have a policy not to build generation. I had to assume at that time that they expected they would also see “no growth”. Oops!!! The idea that a utility can assume “others will share” even in times of their own crisis is ludicrous. In a time of de-regulation I would suggest you draw your own conclusions. Everyone wants the other guy to foot the bill for what they do. “Pollute your state but give me the energy at a low price” is an attitude not too uncommon in certain parts of the country. A more local attitude is “ I cannot tolerate outages but don’t trim my trees”. At an industrial level it’s “I need near perfect power but I won’t pay a cent to obtain it…that’s your (the utilities) job”. While “having your cake and eating it too” may be the preference of some of
13
our customers, reality is something all of us must eventually face. We need not look farther than the “rolling blackouts” in California to see what can happen
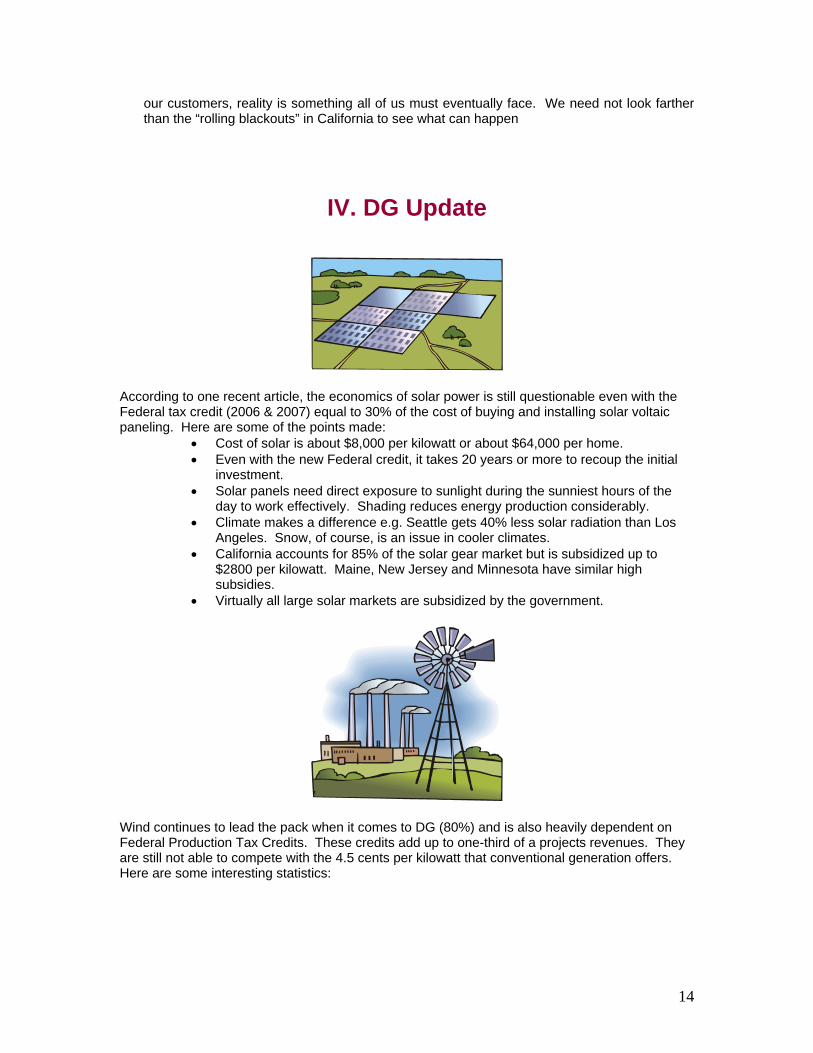
IV. DG Update
According to one recent article, the economics of solar power is still questionable even with the Federal tax credit (2006 & 2007) equal to 30% of the cost of buying and installing solar voltaic paneling. Here are some of the points made:
• Cost of solar is about $8,000 per kilowatt or about $64,000 per home. • Even with the new Federal credit, it takes 20 years or more to recoup the initial
investment. • Solar panels need direct exposure to sunlight during the sunniest hours of the
day to work effectively. Shading reduces energy production considerably. • Climate makes a difference e.g. Seattle gets 40% less solar radiation than Los
Angeles. Snow, of course, is an issue in cooler climates. • California accounts for 85% of the solar gear market but is subsidized up to
$2800 per kilowatt. Maine, New Jersey and Minnesota have similar high subsidies.
• Virtually all large solar markets are subsidized by the government.
Wind continues to lead the pack when it comes to DG (80%) and is also heavily dependent on Federal Production Tax Credits. These credits add up to one-third of a projects revenues. They are still not able to compete with the 4.5 cents per kilowatt that conventional generation offers. Here are some interesting statistics:
14
Installed Wind Capacity (MW)
California 2,150 Texas 1,995 Iowa 836
Minnesota 744 Oklahoma 475
New Mexico 407 Washington 390
Oregon 338 Wyoming 288 Kansas 264
Owners of U.S. Wind Energy Installations (MW)
FPL Energy 3,192 PPM Energy 518
MidAmerican energy 361 Edison Mission Group 316
Shell Wind Energy 315
Purchasers of Wind Power in 2005 (MW) Xcel Energy 1,048
Southern California Edison 1,021 PG&E 680
PPM Energy 606 TXU 580
U.S. nuclear plants continue to set industry and unit performance records. The average plant capacity in 2004 was 91% as compared to numbers closer to 50% in the 70’s. According to Power Engineering magazine, by 2020, approximately 13 GW of new nuclear power will be ordered by electricity generators in the United States. Nuclear power has the advantages of an exceptional safety record, resistance to price volatility and ability to produce large amounts of electricity around the clock.
V. Power Line Interference
15
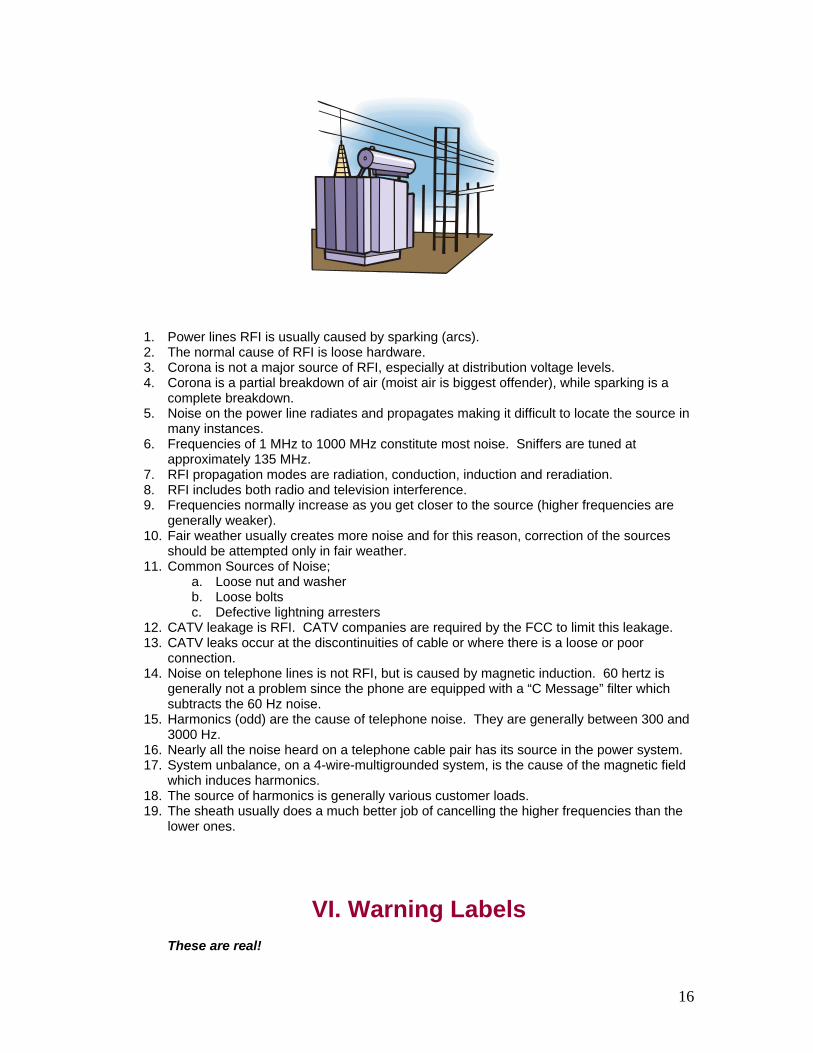
1. Power lines RFI is usually caused by sparking (arcs). 2. The normal cause of RFI is loose hardware. 3. Corona is not a major source of RFI, especially at distribution voltage levels. 4. Corona is a partial breakdown of air (moist air is biggest offender), while sparking is a
complete breakdown. 5. Noise on the power line radiates and propagates making it difficult to locate the source in
many instances. 6. Frequencies of 1 MHz to 1000 MHz constitute most noise. Sniffers are tuned at
approximately 135 MHz. 7. RFI propagation modes are radiation, conduction, induction and reradiation. 8. RFI includes both radio and television interference. 9. Frequencies normally increase as you get closer to the source (higher frequencies are
generally weaker). 10. Fair weather usually creates more noise and for this reason, correction of the sources
should be attempted only in fair weather. 11. Common Sources of Noise;
a. Loose nut and washer b. Loose bolts c. Defective lightning arresters
12. CATV leakage is RFI. CATV companies are required by the FCC to limit this leakage. 13. CATV leaks occur at the discontinuities of cable or where there is a loose or poor
connection. 14. Noise on telephone lines is not RFI, but is caused by magnetic induction. 60 hertz is
generally not a problem since the phone are equipped with a “C Message” filter which subtracts the 60 Hz noise.
15. Harmonics (odd) are the cause of telephone noise. They are generally between 300 and 3000 Hz.
16. Nearly all the noise heard on a telephone cable pair has its source in the power system. 17. System unbalance, on a 4-wire-multigrounded system, is the cause of the magnetic field
which induces harmonics. 18. The source of harmonics is generally various customer loads. 19. The sheath usually does a much better job of cancelling the higher frequencies than the
lower ones.
VI. Warning Labels
These are real!
16
1. Never used hairdryer while sleeping. 2. This power drill is not intended for dental use. 3. Do not use toilet brush for personal hygiene. 4. Do not drive with sunshield in place 5. Once used rectally, the thermometer should not be used orally. 6. Never iron clothes that are being worn. 7. This pepper spray may irritate eyes. 8. Never catch a falling knife.
VII. Conversion of Overhead to Underground It seems that after every major storm (hurricanes in particular), we see interest in converting overhead systems to underground. Here are a number of points made by utilities when confronted by the daunting costs associated with this endeavor:
• Cost of putting distribution underground would be between $.5 million and $5.4 million per mile. Average underground about $1 million per mile. Average overhead about $120,000.
• Cost of putting transmission underground would be about $10 million per mile • Service continuity could actually diminish • Virtually all jurisdictions conclude that conversion is prohibitive • Primary driver is aesthetics, not reliability • Repair time for underground is about 60% longer than overhead • Underground is still vulnerable to lightning • Underground lines are more susceptible to rodents, corrosion, tree roots and
accidental digging • Outages per year would drop by 70% • System longevity for overhead is 50 years but only 30 for underground • Maintenance costs are about the same. • 70% of US system is overhead • Underground conversion cost per residential customer is approximately $20K to
$40K
VIII. Distribution Maintenance Summary Survey (Approximately 90 responses from 84 utilities)
17
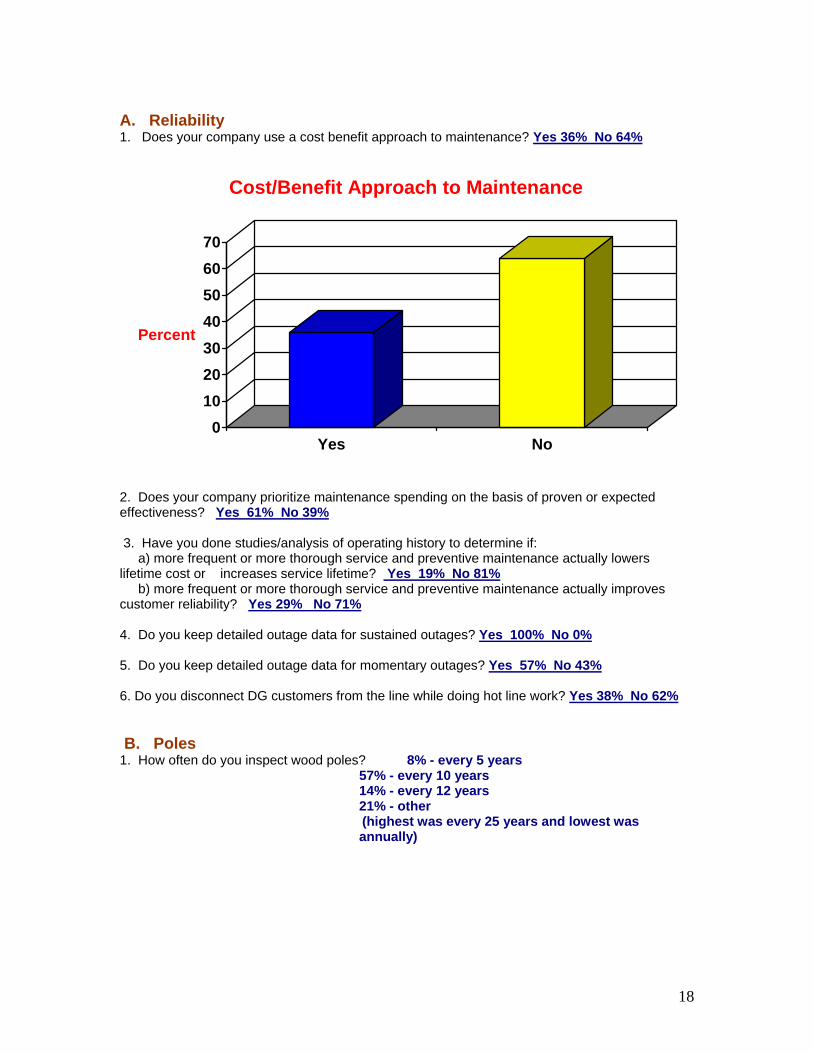
A. Reliability 1. Does your company use a cost benefit approach to maintenance? Yes 36% No 64%
Cost/Benefit Approach to Maintenance
010203040506070
Percent
Yes No
2. Does your company prioritize maintenance spending on the basis of proven or expected effectiveness? Yes 61% No 39% 3. Have you done studies/analysis of operating history to determine if: a) more frequent or more thorough service and preventive maintenance actually lowers lifetime cost or increases service lifetime? Yes 19% No 81% b) more frequent or more thorough service and preventive maintenance actually improves customer reliability? Yes 29% No 71% 4. Do you keep detailed outage data for sustained outages? Yes 100% No 0% 5. Do you keep detailed outage data for momentary outages? Yes 57% No 43% 6. Do you disconnect DG customers from the line while doing hot line work? Yes 38% No 62% B. Poles 1. How often do you inspect wood poles? 8% - every 5 years 57% - every 10 years 14% - every 12 years 21% - other
(highest was every 25 years and lowest was annually)
18
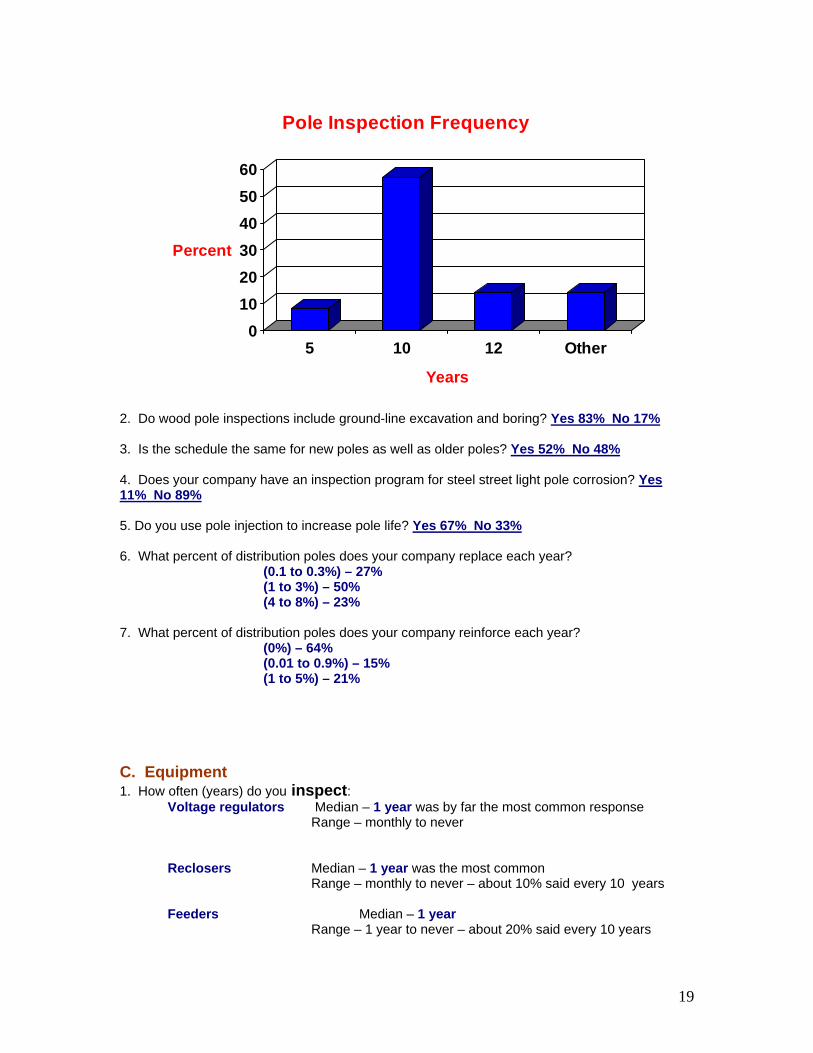
0102030405060
Percent
5 10 12 Other
Years
Pole Inspection Frequency
2. Do wood pole inspections include ground-line excavation and boring? Yes 83% No 17% 3. Is the schedule the same for new poles as well as older poles? Yes 52% No 48% 4. Does your company have an inspection program for steel street light pole corrosion? Yes 11% No 89% 5. Do you use pole injection to increase pole life? Yes 67% No 33% 6. What percent of distribution poles does your company replace each year? (0.1 to 0.3%) – 27% (1 to 3%) – 50% (4 to 8%) – 23% 7. What percent of distribution poles does your company reinforce each year? (0%) – 64% (0.01 to 0.9%) – 15% (1 to 5%) – 21% C. Equipment 1. How often (years) do you inspect:
Voltage regulators Median – 1 year was by far the most common response Range – monthly to never
Reclosers Median – 1 year was the most common Range – monthly to never – about 10% said every 10 years Feeders Median – 1 year Range – 1 year to never – about 20% said every 10 years
19
Automated Switches Median – Never (almost 50% of responses) Range – monthly to never
Pole Transformers Median – Never (Over 50%) Range - annually to never Pad Mounted Xformers Median - 10 years Range – annually to never (never was most common answer)
Capacitor Median – 1 year (by far the most common answer @60%) Range - monthly to never Cable Median - Never (was by far the most common answer at 90% of total) Range - annually to never 2. Do you perform routine infrared camera inspections on pad-mount transformers? Yes 46% No 54% 3. Do you use zero crossing switches for capacitor switching? Yes 8% No 92% 4. How often (years) do you maintain the following: Disconnects – Never was the overwhelming response Fuse Cutouts – Never was virtually the only response Reclosers - 36% - 10 years, 32% - 5 years, 32% other
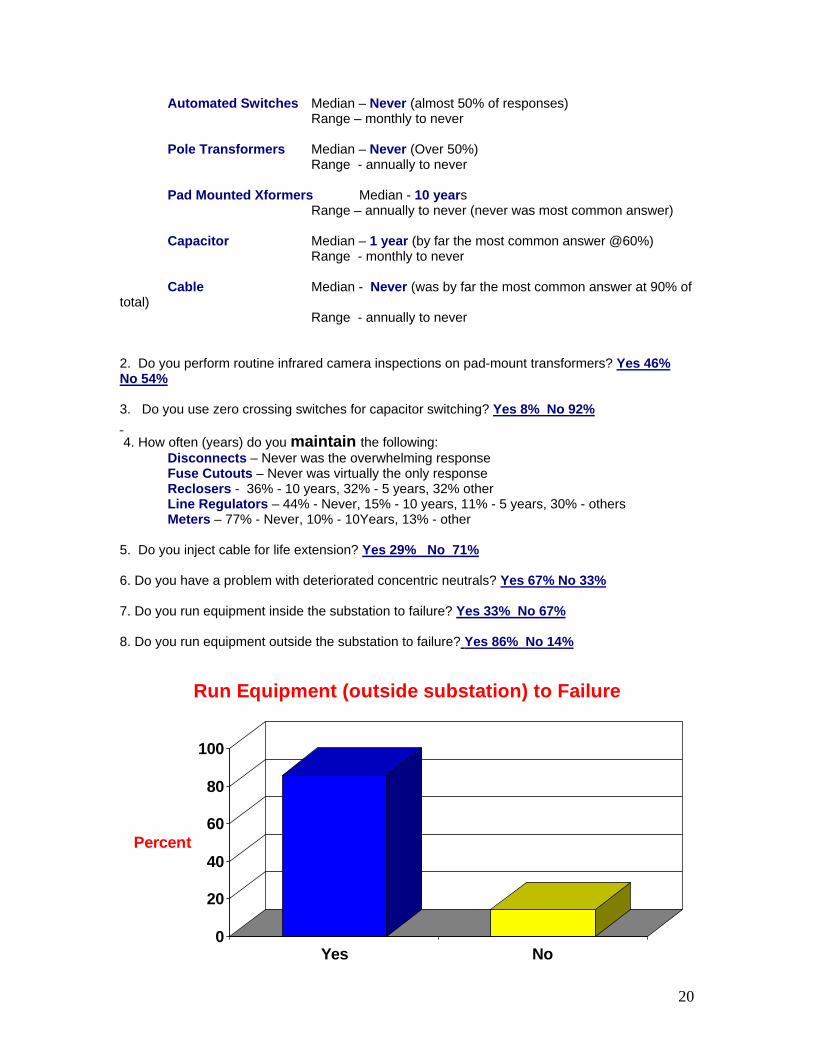
Line Regulators – 44% - Never, 15% - 10 years, 11% - 5 years, 30% - others Meters – 77% - Never, 10% - 10Years, 13% - other 5. Do you inject cable for life extension? Yes 29% No 71% 6. Do you have a problem with deteriorated concentric neutrals? Yes 67% No 33% 7. Do you run equipment inside the substation to failure? Yes 33% No 67% 8. Do you run equipment outside the substation to failure? Yes 86% No 14%
Run Equipment (outside substation) to Failure
0
20
40
60
80
100 Percent Yes No
20
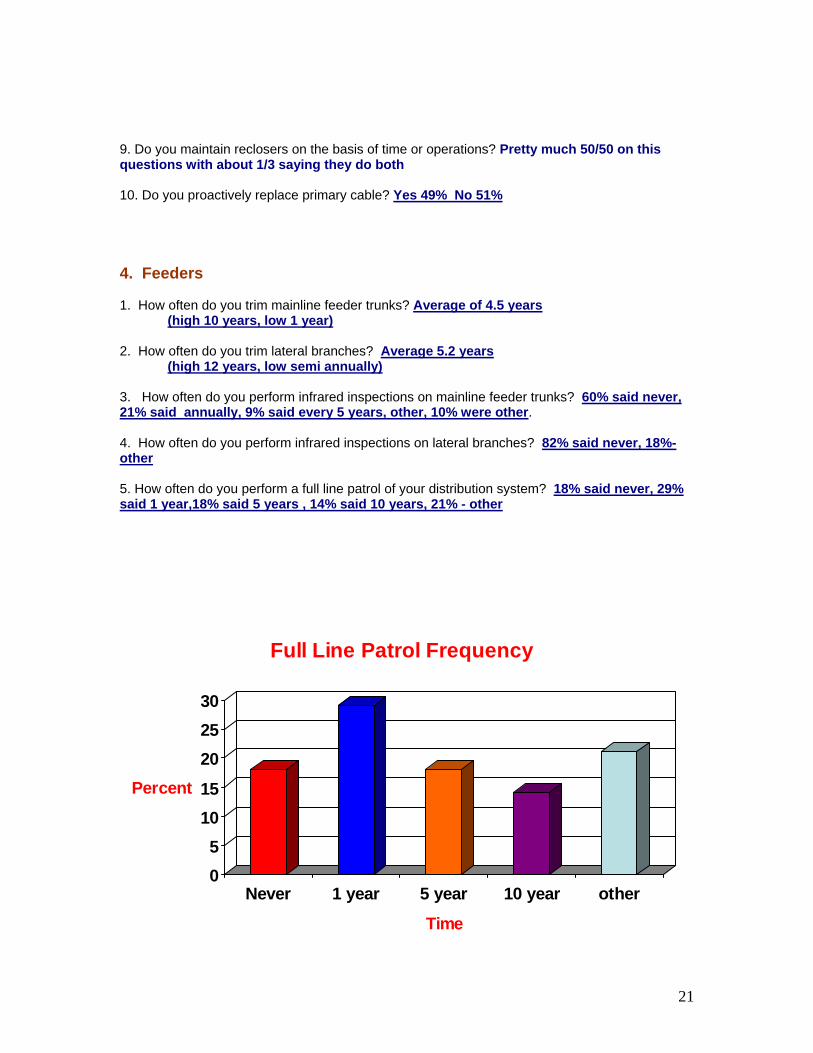
9. Do you maintain reclosers on the basis of time or operations? Pretty much 50/50 on this questions with about 1/3 saying they do both 10. Do you proactively replace primary cable? Yes 49% No 51% 4. Feeders 1. How often do you trim mainline feeder trunks? Average of 4.5 years (high 10 years, low 1 year) 2. How often do you trim lateral branches? Average 5.2 years (high 12 years, low semi annually) 3. How often do you perform infrared inspections on mainline feeder trunks? 60% said never, 21% said annually, 9% said every 5 years, other, 10% were other. 4. How often do you perform infrared inspections on lateral branches? 82% said never, 18%-other 5. How often do you perform a full line patrol of your distribution system? 18% said never, 29% said 1 year,18% said 5 years , 14% said 10 years, 21% - other
05
1015
202530
Percent
Never 1 year 5 year 10 year other
Time
Full Line Patrol Frequency
21
6. Do you perform inspections of completed work orders? Yes 67% No 33% 7. Have you performed a full joint use audit? Yes 45% No 55% 8. Do operations crews have computer mapping? Yes 56% No 44% 9. Do you use Blue Sky Trimming criteria for your maintenance trimming program? Yes 34% No 66%
IX. Adult Education Courses for Men Fall Classes for Men at
THE ADULT LEARNING CENTER
Class 1 How To Fill Up The Ice Cube Trays--Step by Step, with Slide Presentation.
Class 2
The Toilet Paper Roll--Does It Change Itself? Round Table Discussion.
Class 3
Is It Possible To Urinate Using The Technique Of Lifting The Seat and Avoiding The Floor, Walls and Nearby Bathtub?--Group Practice.
Class 4
Fundamental Differences Between The Laundry Hamper and The Floor--Pictures and Explanatory Graphics.
Class 5
Dinner Dishes--Can They Levitate and Fly Into The Kitchen Sink? Examples on Video.
Meets 4 weeks, Tuesday and Thursday for 2 hours beginning at 7:00 PM
Class 6
Loss Of Identity--Losing The Remote To Your Significant Other. Help Line Support and Support Groups.
Class 7
Learning How To Find Things--Starting With Looking In The Right Places And Not Turning The House Upside Down While Screaming.
Open Forum.
Class 8 Health Watch--Bringing Her Flowers Is Not Harmful To Your Health.
Graphics and Audio Tapes.
22
Class 9 Real Men Ask For Directions When Lost--Real Life Testimonials.
Class 10
Is It Genetically Impossible To Sit Quietly While She Parallel Parks? Driving Simulations.
Class 11
Learning to Live--Basic Differences Between Mother and Wife. Online Classes and role-playing.
Class 12
How to be the Ideal Shopping Companion Relaxation Exercises, Meditation and Breathing Techniques.
Class 13
How to Fight Cerebral Atrophy--Remembering Birthdays, Anniversaries and Other Important Dates and Calling When You're Going To Be Late.
Cerebral Shock Therapy Sessions and Full Lobotomies Offered.
Class 14 The Stove/Oven--What It Is and How It Is Used.
Live Demonstration.
23
X. Arc Flash
1. Introduction An arc flash is a short circuit through air. The temperature of the arc can reach more than 5000 degrees F, creating hot gases, melting metal, and causing sound waves that can damage hearing and/or flashes that can damage eyesight. Basically, industry regulations define a “flash protection boundary” inside which workers must be protected. The National Fire Protection Association (NFPA) 70E standards defines this boundary as an imaginary sphere surrounding the potential arc point, “within which a person could receive a second-degree (1.2 cal/cm2) burn if an electrical arc flash were to occur. Typically, incident energy levels are about 2.1 cal/cm2, but can be greater than 40 cal/cm2. 2. Analysis Process Arc Flash analysis basically consists of performing a detailed analysis comprised of a load-flow study, short circuit study, protective coordination study, and an equipment evaluation. IEEE 1584 standard establishes the following 9 key steps in the analysis process:
• Collect system and installation data • Determine system modes of operation • Determine bolted fault current • Find protective device characteristics and arc duration • Document system voltages and equipment class • Determine arc fault current • Select working distances • Calculate the incident energy • Calculate flash protection boundary
3. Standards Four standards are relevant to arc flash studies’
• OSHA 29 Code of Federal Regulations Part 1910, Subpart S – states that safety work practices shall be employed t prevent shock or other injuries resulting from either direct or indirect electrical contacts….
• NFPA 70-2002 – requires that companies put warning labels on equipment likely to cause arc flash conditions
• NFPA 70e-2000 – it provides the detailed actions companies must take to be in federal compliance.
• IEEE Standard 1584-2002, Guide to Arc Flash Hazard Analysis – provides a method to calculate the incident energy in order to specify the level of PPE required for workers.
24
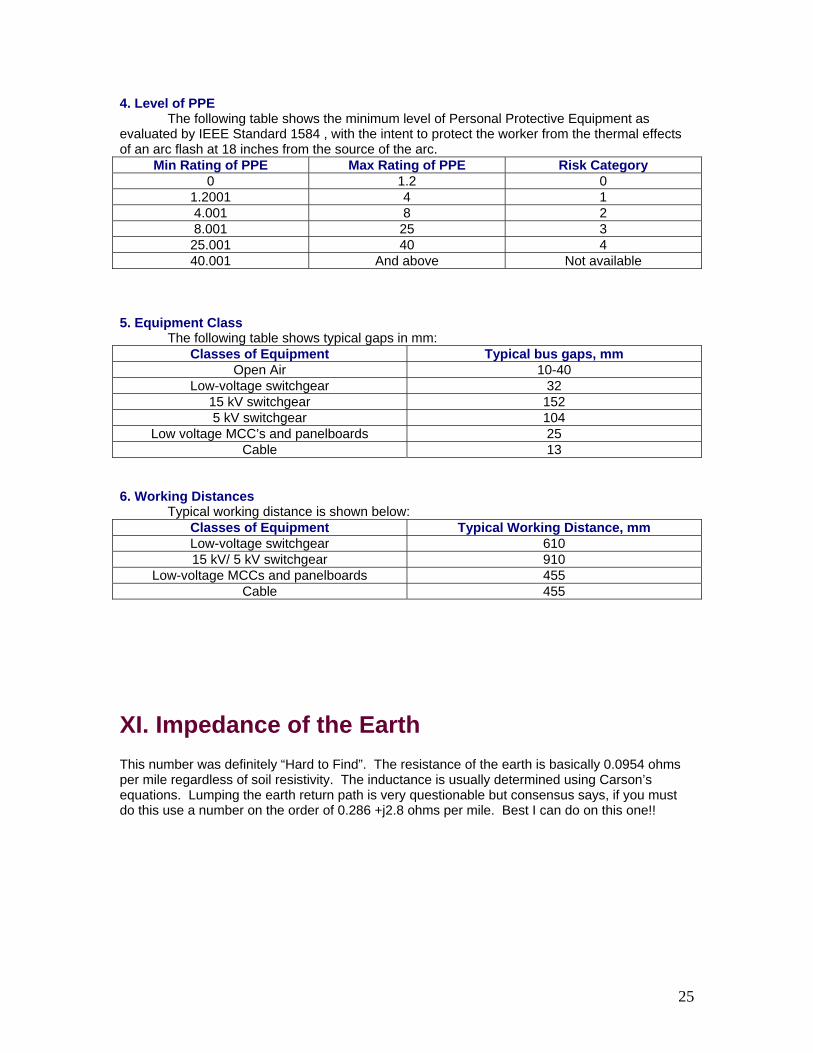
4. Level of PPE The following table shows the minimum level of Personal Protective Equipment as evaluated by IEEE Standard 1584 , with the intent to protect the worker from the thermal effects of an arc flash at 18 inches from the source of the arc.
Min Rating of PPE Max Rating of PPE Risk Category 0 1.2 0
1.2001 4 1 4.001 8 2 8.001 25 3
25.001 40 4 40.001 And above Not available
5. Equipment Class The following table shows typical gaps in mm:
Classes of Equipment Typical bus gaps, mm Open Air 10-40
Low-voltage switchgear 32 15 kV switchgear 152 5 kV switchgear 104
Low voltage MCC’s and panelboards 25 Cable 13
6. Working Distances Typical working distance is shown below:
Classes of Equipment Typical Working Distance, mm Low-voltage switchgear 610 15 kV/ 5 kV switchgear 910
Low-voltage MCCs and panelboards 455 Cable 455
XI. Impedance of the Earth This number was definitely “Hard to Find”. The resistance of the earth is basically 0.0954 ohms per mile regardless of soil resistivity. The inductance is usually determined using Carson’s equations. Lumping the earth return path is very questionable but consensus says, if you must do this use a number on the order of 0.286 +j2.8 ohms per mile. Best I can do on this one!!
25
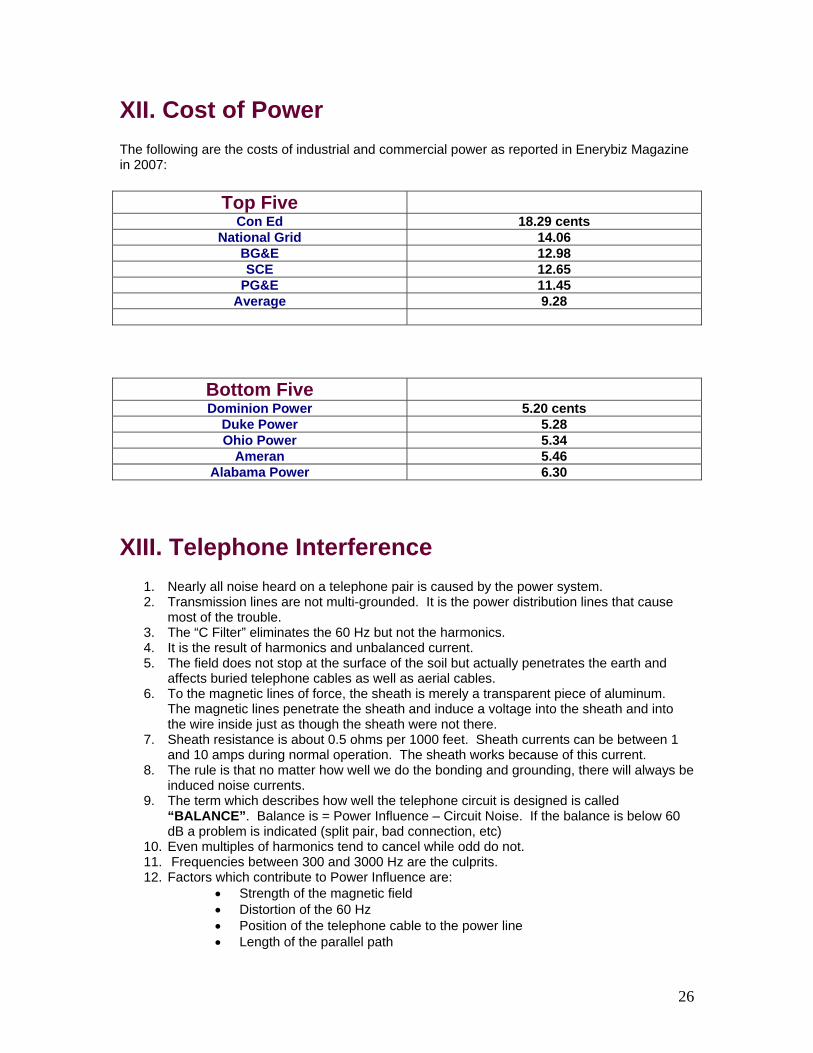
XII. Cost of Power The following are the costs of industrial and commercial power as reported in Enerybiz Magazine in 2007:
Top Five
Con Ed 18.29 cents National Grid 14.06
BG&E 12.98 SCE 12.65
PG&E 11.45 Average 9.28
Bottom Five Dominion Power 5.20 cents
Duke Power 5.28 Ohio Power 5.34
Ameran 5.46 Alabama Power 6.30
XIII. Telephone Interference
1. Nearly all noise heard on a telephone pair is caused by the power system. 2. Transmission lines are not multi-grounded. It is the power distribution lines that cause
most of the trouble. 3. The “C Filter” eliminates the 60 Hz but not the harmonics. 4. It is the result of harmonics and unbalanced current. 5. The field does not stop at the surface of the soil but actually penetrates the earth and
affects buried telephone cables as well as aerial cables. 6. To the magnetic lines of force, the sheath is merely a transparent piece of aluminum.
The magnetic lines penetrate the sheath and induce a voltage into the sheath and into the wire inside just as though the sheath were not there.
7. Sheath resistance is about 0.5 ohms per 1000 feet. Sheath currents can be between 1 and 10 amps during normal operation. The sheath works because of this current.
8. The rule is that no matter how well we do the bonding and grounding, there will always be induced noise currents.
9. The term which describes how well the telephone circuit is designed is called “BALANCE”. Balance is = Power Influence – Circuit Noise. If the balance is below 60 dB a problem is indicated (split pair, bad connection, etc)
10. Even multiples of harmonics tend to cancel while odd do not. 11. Frequencies between 300 and 3000 Hz are the culprits. 12. Factors which contribute to Power Influence are:
• Strength of the magnetic field • Distortion of the 60 Hz • Position of the telephone cable to the power line • Length of the parallel path
26
• Efficiency of the sheath (only factor controlled by the telephone company)
Jim Burke InfraSource Technology 109 Dorchester Pines Court Cary, NC 27511 919-457-3118 [email protected]@quanta-technology.com
27
02/07/08
Jim Burke EXPERIENCE Mr. Burke is an Executive Advisor with Quanta Technology. He has been in the industry for over 42 years. He is recognized throughout the world as an expert in lightning and overcurrent protection, design, power quality and reliability. Mr. Burke began his career in the utility business with the General Electric Company in 1965 training and taking courses in generation, transmission and distribution as part of GE's Advanced Utility Engineering Program. In 1969, he accepted a position as a field application engineer in Los Angeles responsible for transmission and distribution system analyses, as well as generation planning studies for General Electric's customer utilities in the Southwestern states. In 1971 he joined GE's Power Distribution Engineering Operation in New York where he was responsible for distribution substations, overcurrent and overvoltage protection, and railroad electrification for customers all over the world. During this period he was involved with the development of the MOV "riser pole" arrester, the Power Vac Switchgear, the static overcurrent relay and distribution substation automation.
In 1978 Mr. Burke accepted a position at Power Technologies Inc. (PTI) where he continued to be involved with virtually all distribution engineering issues. During this period he was responsible for the EPRI distribution fault study, the development of the first digital fault recorder, state-of-the-art grounding studies, and numerous lightning and power quality monitoring studies. In the area of railroad electrification he was the project manager of the EPRI manual on "Railroad Electrification on Utility Systems" as well as project manager of system studies for the 25 to 60 Hz conversion of the Northeast Corridor. Until his departure in 1997, he was manager of distribution engineering. He was project leader for the industries first:
• 50,000 Volt Electrified Railroad • Microprocessor based Fault
Recorder • Five Wire Distribution System • Digital Simulation of MOV’s for
Distribution Systems He also managed numerous projects
including the EPRI Distribution Fault Study, the successful use of MOV line protection for the 115kV line and many others in the areas of
power quality, reliability, overcurrent protection, overvoltage protection, grounding, capacitor application, planning, etc. In 1997, he joined ABB, consulting in all areas of distribution as well as software engineering. He was an Executive Consultant with Synergetic Design until 2006.
He has authored and co-authored over 120 technical papers (5 prize papers) addressing all these areas. He has taught numerous courses, all over the world, for thousands of engineers in virtually all areas of distribution engineering. He is the author of the book “Power Distribution Engineering: Fundamentals & Applications”, now in its 13th printing. He is author of two revisions to the chapter on Distribution Engineering in the "Standard Handbook for Electrical Engineering."
BSEE - Univ. of Notre Dame - 1965 MSIA – Union College – 1969 - Thesis:
“Reliability and Availability Analysis of Direct Buried Distribution Systems” PSEC – GE (Schenectady) – 1965 to 1969
IEEE Past Chair:
• Distribution Subcommittee • Distribution Neutral Grounding • Overvoltage Protection of DG’s • Switching and Overcurrent
Protection • Voltage Quality • Test Code for Faulted Circuit
Indicators • Testing of Distribution 3 Phase
Submersible Switches Presently, he is Chair of the Distribution Awards Group and member of many other IEEE groups.
IEEE Awards Fellow (1992)
Standards Medallion (1992) 5 Prize Papers
The 1996 Award for “Excellence in Power Distribution Engineering” IEEE Distinguished Lecturer in PQ & Reliability for 20 years 2005 Recipient of “Herman Halperin Transmission and Distribution Award” [email protected]
EDUCATION
PROFESSIONAL ACTIVITIES
ACHIEVEMENTS & HONORS
28