Embed Size (px)
Citation preview
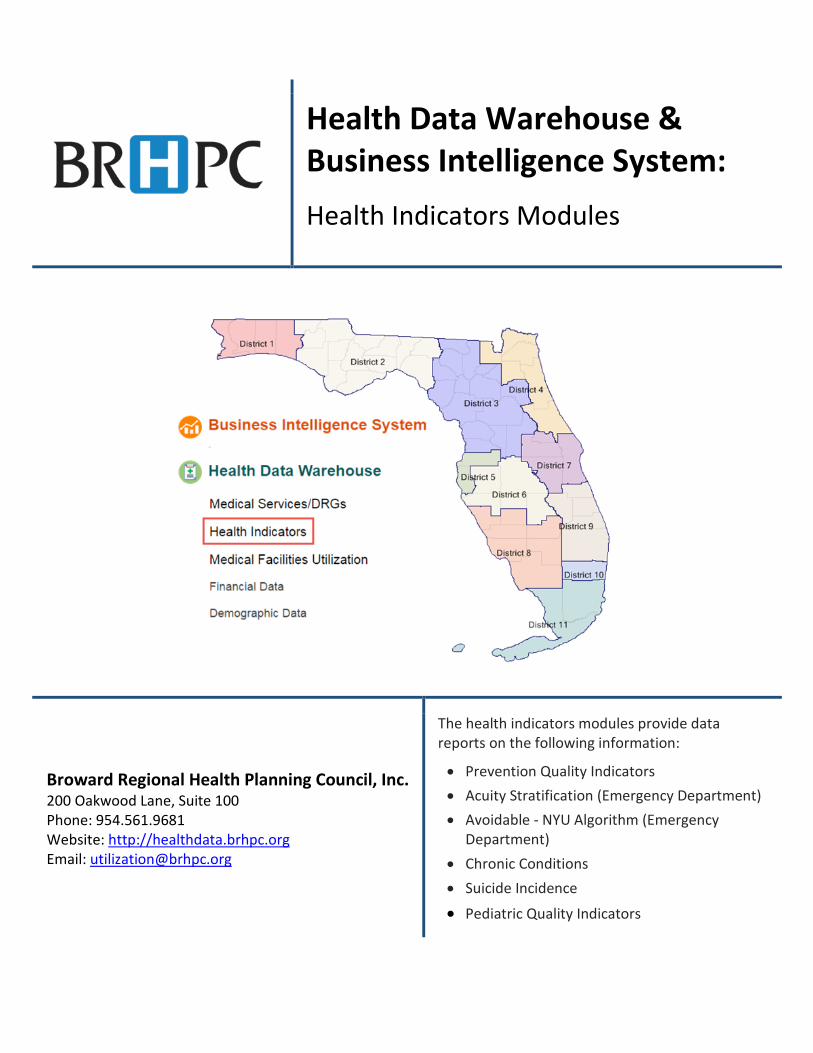
Health Data Warehouse & Business Intelligence System: Health Indicators Modules
Broward Regional Health Planning Council, Inc. 200 Oakwood Lane, Suite 100 Phone: 954.561.9681 Website: http://healthdata.brhpc.org Email: [email protected]
The health indicators modules provide data reports on the following information:
• Prevention Quality Indicators • Acuity Stratification (Emergency Department) • Avoidable - NYU Algorithm (Emergency
Department) • Chronic Conditions • Suicide Incidence
• Pediatric Quality Indicators
TABLE OF CONTENTS Page Data Sources............................................................................................................. 1 Prevention Quality Indicators (PQI)......................................................................... 2 Definition ……………………………………………………………………………………………….. 2 Data Source ………………………………………………………………………………………….… 3 Data Processing ………………………………………………………………………………………. 4 Data Analysis ………………………………………………………………………………………….. 5 Website ……………………………………………………………………………………………….…. 5 Acuity Stratification (Emergency Department)….…………………………………………. 8 Definition ……………………………………………………………………………………………….. 8 Data Source ……………………………………………………………………………………………. 8 Data Processing ………………………………………………………………………………………. 9 Data Analysis ………………………………………………………………………………………….. 10 Website ……………………………………………………………………………………………….…. 10 Avoidable - NYU Algorithm (Emergency Department)….………………………………… 13 Definition ……………………………………………………………………………………………….. 13 Data Source ……………………………………………………………………………………………. 14 Data Processing ………………………………………………………………………………………. 15 Data Analysis ………………………………………………………………………………………….. 15 Website ………………………………………………………………………………………………….. 16 Chronic Conditions…………………………………………….............................................. 19 Definition ……………………………………………………………………………………………….. 19 Data Source ……………………………………………………………………………………………. 19 Data Processing ………………………………………………………………………………………. 20 Data Analysis ………………………………………………………………………………………….. 20 Website ………………………………………………………………………………………………….. 21 Suicide Incidence..…………………………………………….............................................. 24 Definition ……………………………………………………………………………………………….. 24 Data Source ……………………………………………………………………………………………. 24 Data Processing ………………………………………………………………………………………. 25 Data Analysis ………………………………………………………………………………………….. 26 Website ………………………………………………………………………………………………….. 26
Pediatric Quality Indicators (PDI)......................................................................... 29 Definition ……………………………………………………………………………………………….. 29 Data Source ………………………………………………………………………………………….… 30 Data Processing ………………………………………………………………………………………. 31 Data Analysis ………………………………………………………………………………………….. 31 Website ……………………………………………………………………………………………….…. 32 Appendix A (Website – Graphical Presentation) …………………………………………………….. 35 Appendix B (Exclusions) ………………………………………………………………………………………….. 36 Appendix C (Code Translations) ……………………………………………………………………………… 37 Appendix D (Analytical Queries) ……………………………………………………………………………… 38 Appendix E (NYU ED Algorithm) ……………………………………………………………………………… 39 Appendix F (Codes - Chronic Conditions & Suicide Incidence) ………………………………. 41 Appendix G (GIS Mapping & Graphing resources – All Modules) …………………………… 46
This Hospital Inpatient & Emergency Department Analytical System Manual and all future revisions:
© Copyright Broward Regional Health Planning Council, Inc. 2011 All rights reserved.
1
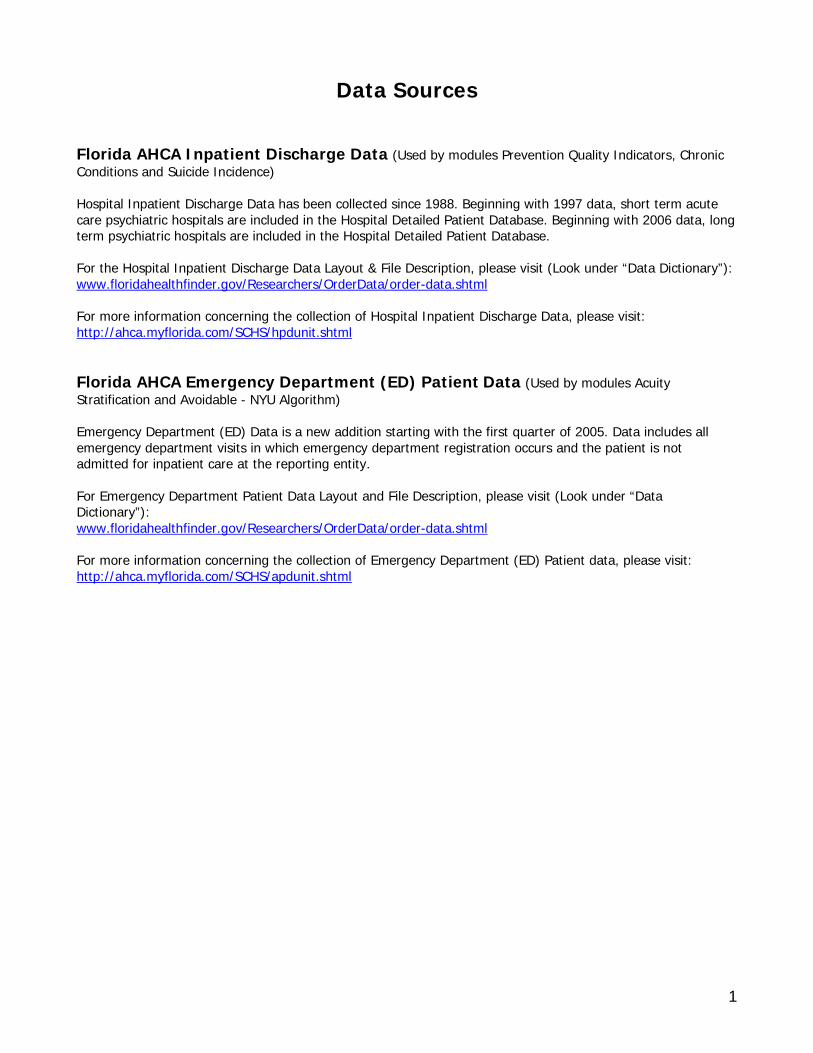
Data Sources
Florida AHCA Inpatient Discharge Data (Used by modules Prevention Quality Indicators, Chronic Conditions and Suicide Incidence) Hospital Inpatient Discharge Data has been collected since 1988. Beginning with 1997 data, short term acute care psychiatric hospitals are included in the Hospital Detailed Patient Database. Beginning with 2006 data, long term psychiatric hospitals are included in the Hospital Detailed Patient Database. For the Hospital Inpatient Discharge Data Layout & File Description, please visit (Look under “Data Dictionary”): www.floridahealthfinder.gov/Researchers/OrderData/order-data.shtml For more information concerning the collection of Hospital Inpatient Discharge Data, please visit: http://ahca.myflorida.com/SCHS/hpdunit.shtml Florida AHCA Emergency Department (ED) Patient Data (Used by modules Acuity Stratification and Avoidable - NYU Algorithm) Emergency Department (ED) Data is a new addition starting with the first quarter of 2005. Data includes all emergency department visits in which emergency department registration occurs and the patient is not admitted for inpatient care at the reporting entity. For Emergency Department Patient Data Layout and File Description, please visit (Look under “Data Dictionary”): www.floridahealthfinder.gov/Researchers/OrderData/order-data.shtml For more information concerning the collection of Emergency Department (ED) Patient data, please visit: http://ahca.myflorida.com/SCHS/apdunit.shtml
2
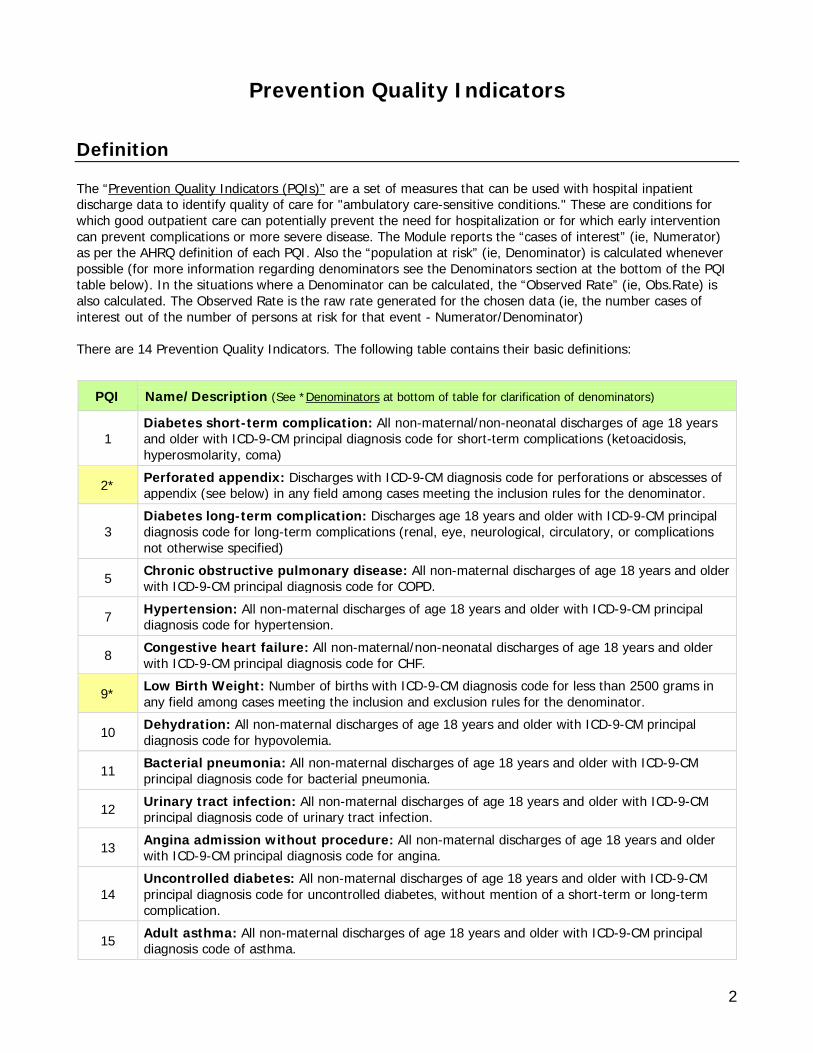
Prevention Quality Indicators Definition The “Prevention Quality Indicators (PQIs)” are a set of measures that can be used with hospital inpatient discharge data to identify quality of care for "ambulatory care-sensitive conditions." These are conditions for which good outpatient care can potentially prevent the need for hospitalization or for which early intervention can prevent complications or more severe disease. The Module reports the “cases of interest” (ie, Numerator) as per the AHRQ definition of each PQI. Also the “population at risk” (ie, Denominator) is calculated whenever possible (for more information regarding denominators see the Denominators section at the bottom of the PQI table below). In the situations where a Denominator can be calculated, the “Observed Rate” (ie, Obs.Rate) is also calculated. The Observed Rate is the raw rate generated for the chosen data (ie, the number cases of interest out of the number of persons at risk for that event - Numerator/Denominator) There are 14 Prevention Quality Indicators. The following table contains their basic definitions:
PQI Name/Description (See *Denominators at bottom of table for clarification of denominators)
1 Diabetes short-term complication: All non-maternal/non-neonatal discharges of age 18 years and older with ICD-9-CM principal diagnosis code for short-term complications (ketoacidosis, hyperosmolarity, coma)
2* Perforated appendix: Discharges with ICD-9-CM diagnosis code for perforations or abscesses of appendix (see below) in any field among cases meeting the inclusion rules for the denominator.
3 Diabetes long-term complication: Discharges age 18 years and older with ICD-9-CM principal diagnosis code for long-term complications (renal, eye, neurological, circulatory, or complications not otherwise specified)
5 Chronic obstructive pulmonary disease: All non-maternal discharges of age 18 years and older with ICD-9-CM principal diagnosis code for COPD.
7 Hypertension: All non-maternal discharges of age 18 years and older with ICD-9-CM principal diagnosis code for hypertension.
8 Congestive heart failure: All non-maternal/non-neonatal discharges of age 18 years and older with ICD-9-CM principal diagnosis code for CHF.
9* Low Birth Weight: Number of births with ICD-9-CM diagnosis code for less than 2500 grams in any field among cases meeting the inclusion and exclusion rules for the denominator.
10 Dehydration: All non-maternal discharges of age 18 years and older with ICD-9-CM principal diagnosis code for hypovolemia.
11 Bacterial pneumonia: All non-maternal discharges of age 18 years and older with ICD-9-CM principal diagnosis code for bacterial pneumonia.
12 Urinary tract infection: All non-maternal discharges of age 18 years and older with ICD-9-CM principal diagnosis code of urinary tract infection.
13 Angina admission without procedure: All non-maternal discharges of age 18 years and older with ICD-9-CM principal diagnosis code for angina.
14 Uncontrolled diabetes: All non-maternal discharges of age 18 years and older with ICD-9-CM principal diagnosis code for uncontrolled diabetes, without mention of a short-term or long-term complication.
15 Adult asthma: All non-maternal discharges of age 18 years and older with ICD-9-CM principal diagnosis code of asthma.
3
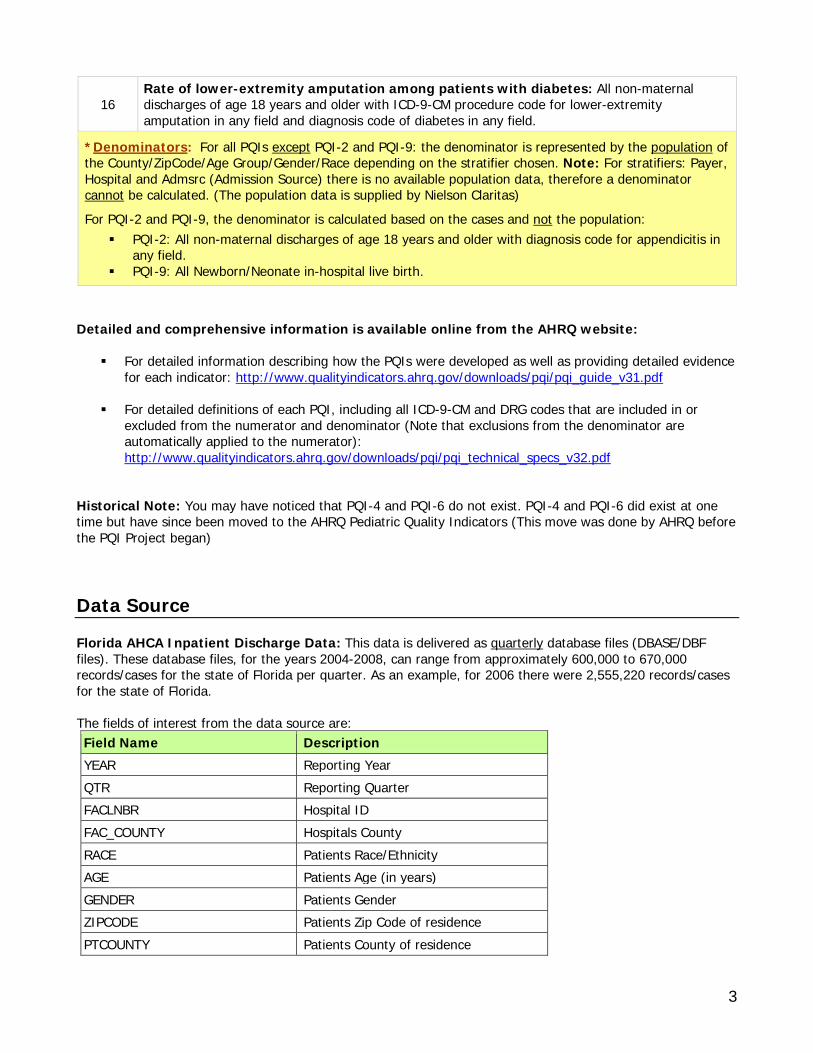
16 Rate of lower-extremity amputation among patients with diabetes: All non-maternal discharges of age 18 years and older with ICD-9-CM procedure code for lower-extremity amputation in any field and diagnosis code of diabetes in any field.
*Denominators: For all PQIs except PQI-2 and PQI-9: the denominator is represented by the population of the County/ZipCode/Age Group/Gender/Race depending on the stratifier chosen. Note: For stratifiers: Payer, Hospital and Admsrc (Admission Source) there is no available population data, therefore a denominator cannot be calculated. (The population data is supplied by Nielson Claritas)
For PQI-2 and PQI-9, the denominator is calculated based on the cases and not the population: PQI-2: All non-maternal discharges of age 18 years and older with diagnosis code for appendicitis in
any field. PQI-9: All Newborn/Neonate in-hospital live birth.
Detailed and comprehensive information is available online from the AHRQ website:
For detailed information describing how the PQIs were developed as well as providing detailed evidence for each indicator: http://www.qualityindicators.ahrq.gov/downloads/pqi/pqi_guide_v31.pdf
For detailed definitions of each PQI, including all ICD-9-CM and DRG codes that are included in or
excluded from the numerator and denominator (Note that exclusions from the denominator are automatically applied to the numerator): http://www.qualityindicators.ahrq.gov/downloads/pqi/pqi_technical_specs_v32.pdf
Historical Note: You may have noticed that PQI-4 and PQI-6 do not exist. PQI-4 and PQI-6 did exist at one time but have since been moved to the AHRQ Pediatric Quality Indicators (This move was done by AHRQ before the PQI Project began) Data Source Florida AHCA Inpatient Discharge Data: This data is delivered as quarterly database files (DBASE/DBF files). These database files, for the years 2004-2008, can range from approximately 600,000 to 670,000 records/cases for the state of Florida per quarter. As an example, for 2006 there were 2,555,220 records/cases for the state of Florida. The fields of interest from the data source are: Field Name Description YEAR Reporting Year QTR Reporting Quarter FACLNBR Hospital ID FAC_COUNTY Hospitals County RACE Patients Race/Ethnicity AGE Patients Age (in years) GENDER Patients Gender ZIPCODE Patients Zip Code of residence PTCOUNTY Patients County of residence
4
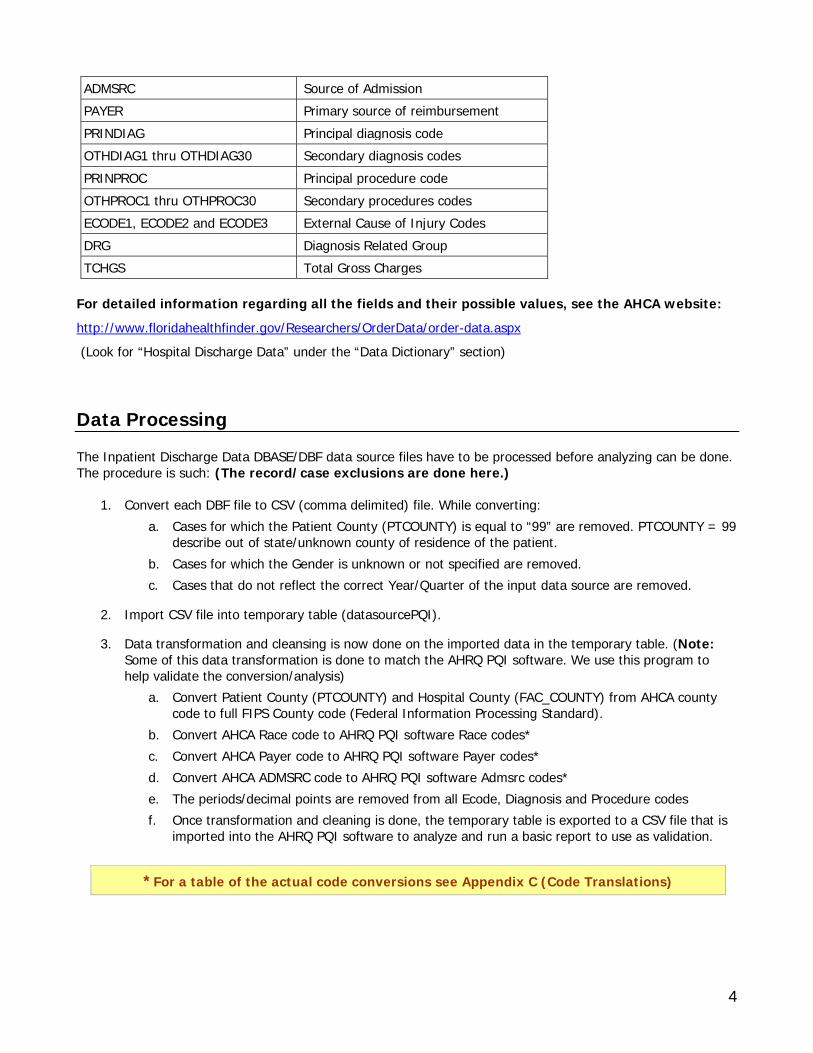
ADMSRC Source of Admission PAYER Primary source of reimbursement PRINDIAG Principal diagnosis code OTHDIAG1 thru OTHDIAG30 Secondary diagnosis codes PRINPROC Principal procedure code OTHPROC1 thru OTHPROC30 Secondary procedures codes ECODE1, ECODE2 and ECODE3 External Cause of Injury Codes DRG Diagnosis Related Group TCHGS Total Gross Charges
For detailed information regarding all the fields and their possible values, see the AHCA website:
http://www.floridahealthfinder.gov/Researchers/OrderData/order-data.aspx (Look for “Hospital Discharge Data” under the “Data Dictionary” section) Data Processing The Inpatient Discharge Data DBASE/DBF data source files have to be processed before analyzing can be done. The procedure is such: (The record/case exclusions are done here.)
1. Convert each DBF file to CSV (comma delimited) file. While converting: a. Cases for which the Patient County (PTCOUNTY) is equal to “99” are removed. PTCOUNTY = 99
describe out of state/unknown county of residence of the patient. b. Cases for which the Gender is unknown or not specified are removed. c. Cases that do not reflect the correct Year/Quarter of the input data source are removed.
2. Import CSV file into temporary table (datasourcePQI).
3. Data transformation and cleansing is now done on the imported data in the temporary table. (Note: Some of this data transformation is done to match the AHRQ PQI software. We use this program to help validate the conversion/analysis)
a. Convert Patient County (PTCOUNTY) and Hospital County (FAC_COUNTY) from AHCA county code to full FIPS County code (Federal Information Processing Standard).
b. Convert AHCA Race code to AHRQ PQI software Race codes* c. Convert AHCA Payer code to AHRQ PQI software Payer codes* d. Convert AHCA ADMSRC code to AHRQ PQI software Admsrc codes* e. The periods/decimal points are removed from all Ecode, Diagnosis and Procedure codes f. Once transformation and cleaning is done, the temporary table is exported to a CSV file that is
imported into the AHRQ PQI software to analyze and run a basic report to use as validation.
*For a table of the actual code conversions see Appendix C (Code Translations)
5
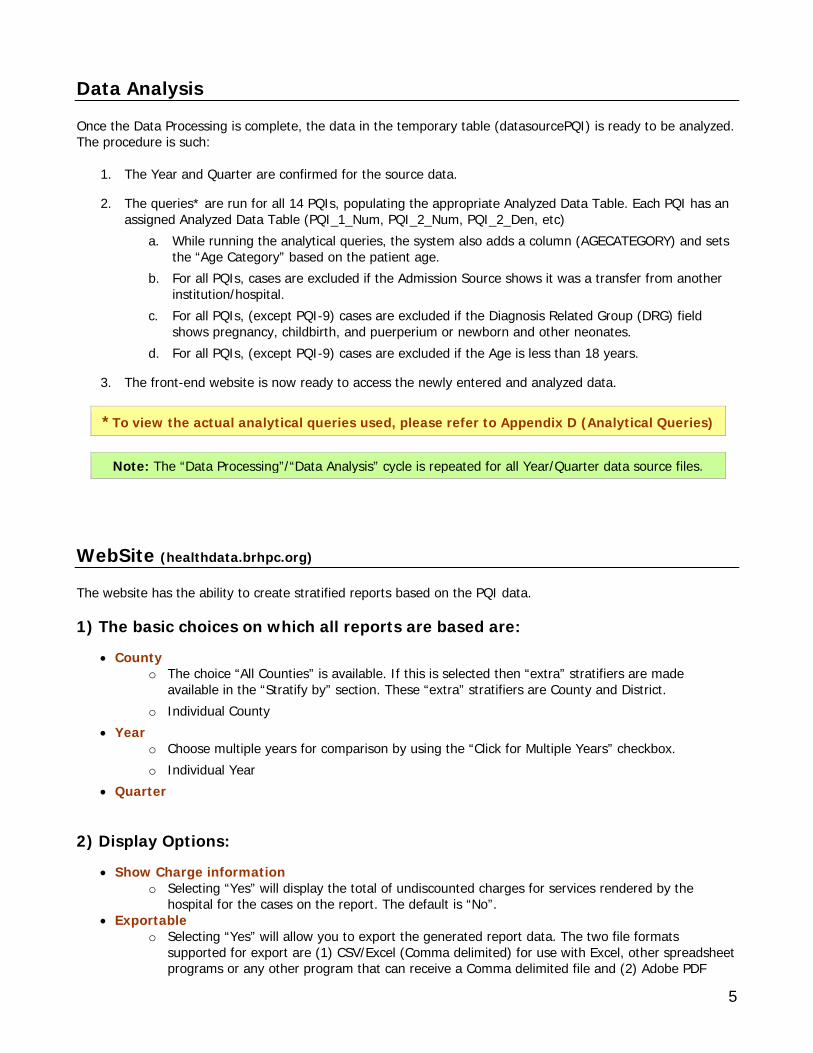
Data Analysis Once the Data Processing is complete, the data in the temporary table (datasourcePQI) is ready to be analyzed. The procedure is such:
1. The Year and Quarter are confirmed for the source data.
2. The queries* are run for all 14 PQIs, populating the appropriate Analyzed Data Table. Each PQI has an assigned Analyzed Data Table (PQI_1_Num, PQI_2_Num, PQI_2_Den, etc)
a. While running the analytical queries, the system also adds a column (AGECATEGORY) and sets the “Age Category” based on the patient age.
b. For all PQIs, cases are excluded if the Admission Source shows it was a transfer from another institution/hospital.
c. For all PQIs, (except PQI-9) cases are excluded if the Diagnosis Related Group (DRG) field shows pregnancy, childbirth, and puerperium or newborn and other neonates.
d. For all PQIs, (except PQI-9) cases are excluded if the Age is less than 18 years.
3. The front-end website is now ready to access the newly entered and analyzed data.
*To view the actual analytical queries used, please refer to Appendix D (Analytical Queries)
Note: The “Data Processing”/“Data Analysis” cycle is repeated for all Year/Quarter data source files. WebSite (healthdata.brhpc.org) The website has the ability to create stratified reports based on the PQI data. 1) The basic choices on which all reports are based are:
• County o The choice “All Counties” is available. If this is selected then “extra” stratifiers are made
available in the “Stratify by” section. These “extra” stratifiers are County and District. o Individual County
• Year o Choose multiple years for comparison by using the “Click for Multiple Years” checkbox. o Individual Year
• Quarter 2) Display Options:
• Show Charge information o Selecting “Yes” will display the total of undiscounted charges for services rendered by the
hospital for the cases on the report. The default is “No”. • Exportable
o Selecting “Yes” will allow you to export the generated report data. The two file formats supported for export are (1) CSV/Excel (Comma delimited) for use with Excel, other spreadsheet programs or any other program that can receive a Comma delimited file and (2) Adobe PDF
6
format, suitable for printing. Un-checking this option will exclude this export ability and will display "Paging" options (ie, you can choose how many records to show per page, go directly to a page, etc. This is suitable when you don't want to export and the report is a very long report, since it significantly increases the download speed). The default is “Yes”.
• Show Rates o Selecting “Yes” will display the Observed Rates (Obs.Rate) were appropriate. This includes
cases/chosen stratifiers with population at risk (denominator) data available. o The Observed Rate is the raw rate generated for the chosen data (ie, the number of times an
event occurs out of the number of persons at risk for that event - Numerator/Denominator). The default is “Yes”.
o If no stratifier is chosen, the population of the selected County is used as the denominator. If all stratfiers chosen have population data (County/ZipCode/Age Group/Gender/Race) then the stratifiers population is used as the denominator (Payer/Hospital/Admsrc do not have population data) Note: PQI-2 and PQI-9 always have denominators as explained above in the "Denominators" section. If "Show Rates?" is unchecked then the Observed Rates wiill not show for any PQI.
• Same Patient & Hospital County o Selecting “Yes” will exclude cases for which the Patient County is different from the Hospital
County for each case (This is the default behavior of the AHRQ PQI definitions)
o Selecting “No” will include cases for which the Patient County is different from the Hospital County for each case (One use of this may be for situations where a particular hospital will always have most of their patients from other counties)
3) PQI & Stratifiers:
• Individual PQIs or “All” PQIs can be chosen (If individual PQIs are chosen then it is required to select at least one stratifier) “All” PQIs is chosen by default.
• Stratifications can be done three (3) levels deep. The available stratifiers are: o Payer: Financial class (ie, how the charges were paid) If this stratifier is selected, "Select Payer
(s)?" checkbox will give the user the ability to restrict output to one or more Payer types. Possible values:
• Medicare • Medicaid • Private incl. HMO • Self-Pay • No charge/Charity • Other.
o Zip Code: Zip Code where the patient resides in. If this stratifier is selected, "Select ZipCode(s)?" checkbox will give the user the ability to restrict output to one or more zip codes or zip code group.
o Age Group: The age group of the patient. Note that PQI-9 (Low birth weight) is only concerned with newborns/neonates. The age groups available are:
• 18 – 39 • 40 – 64 • 65+.
o Hospital: The hospital of each case. If this stratifier is selected, "Select Hospital(s)?" checkbox will give the user the ability to restrict output to one or more hospitals or choose a hospital group.
7
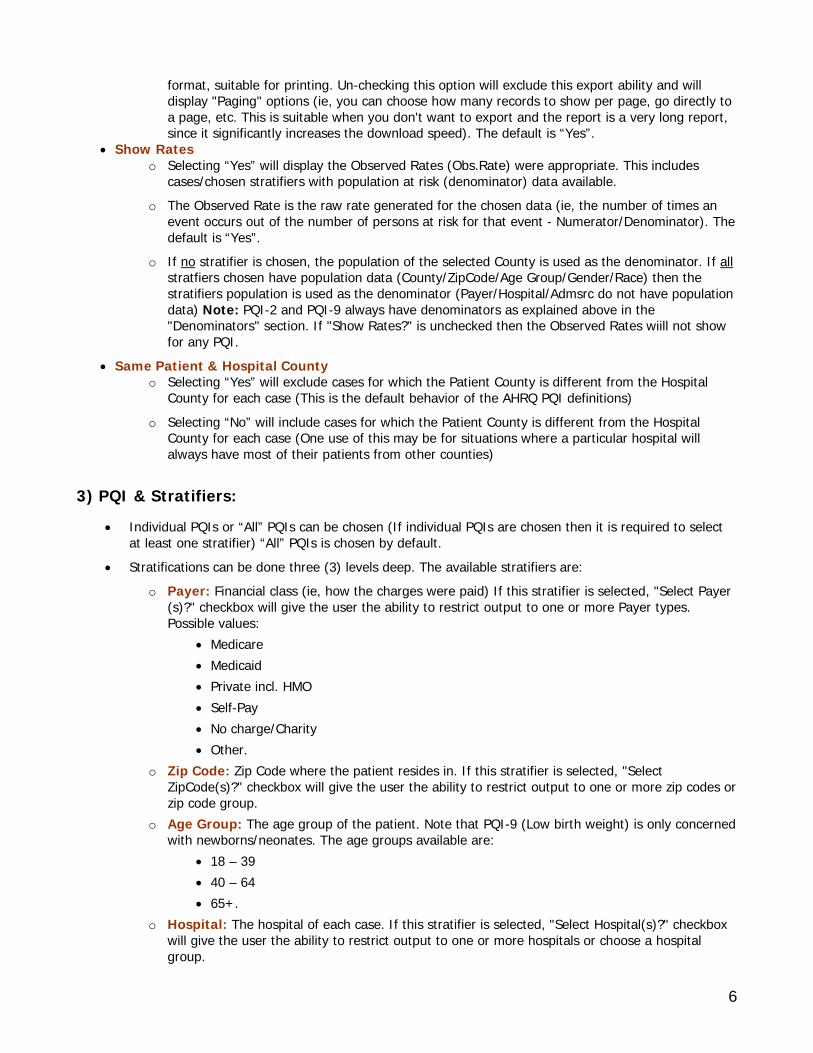
o Gender: The gender of the patient. Possible values: • Male • Female.
o Race: The race/ethnicity of the patient. Possible values: • White • Black • Hispanic • Asian/Pacific Island • Native American • Other
o Admsrc: The admission source (ie, how did the patient first enter the hospital system). Possible values:
• ER • Court/law enforcement • Routine/Birth/Other • Note: not available for ED data.
o If “All of Florida” is chosen from the County choices, the following stratifiers are available:
• County • District (Health Planning Council Districts)
4) Report Generation
• The report is displayed via a blue windowed overlay. Once the report is generated the blue windowed overlay will appear with a message stating that the report is “Loading” and that the report is being downloaded to your computer. The length of time this message will be displayed depends on the size of the report and your download speed. Once the report is downloaded, it is then displayed.
• At the top of the blue windowed overlay there is a description of the generated report (Year, County, Stratifiers, etc)
• For a view of help information there is a link at the top “*For Help click here” that opens up a pop window with a tutorial/help.
• If the option “Exportable” was selected “Yes”, then at the top right will appear a selection of export types. The choices are:
o Excel: CSV/Excel (Comma delimited) for use with Excel, other spreadsheet programs or any other program that can receive a Comma delimited file.
o PDF – Wide (Letter): Adobe PDF format, landscape mode letter sized paper. o PDF – Wide (Legal): Adobe PDF format, landscape mode legal sized paper. o PDF – Letter: Adobe PDF format, portrait mode letter size paper.
*For a graphical view/example of the websites functions, please see Appendix A (Website)
8
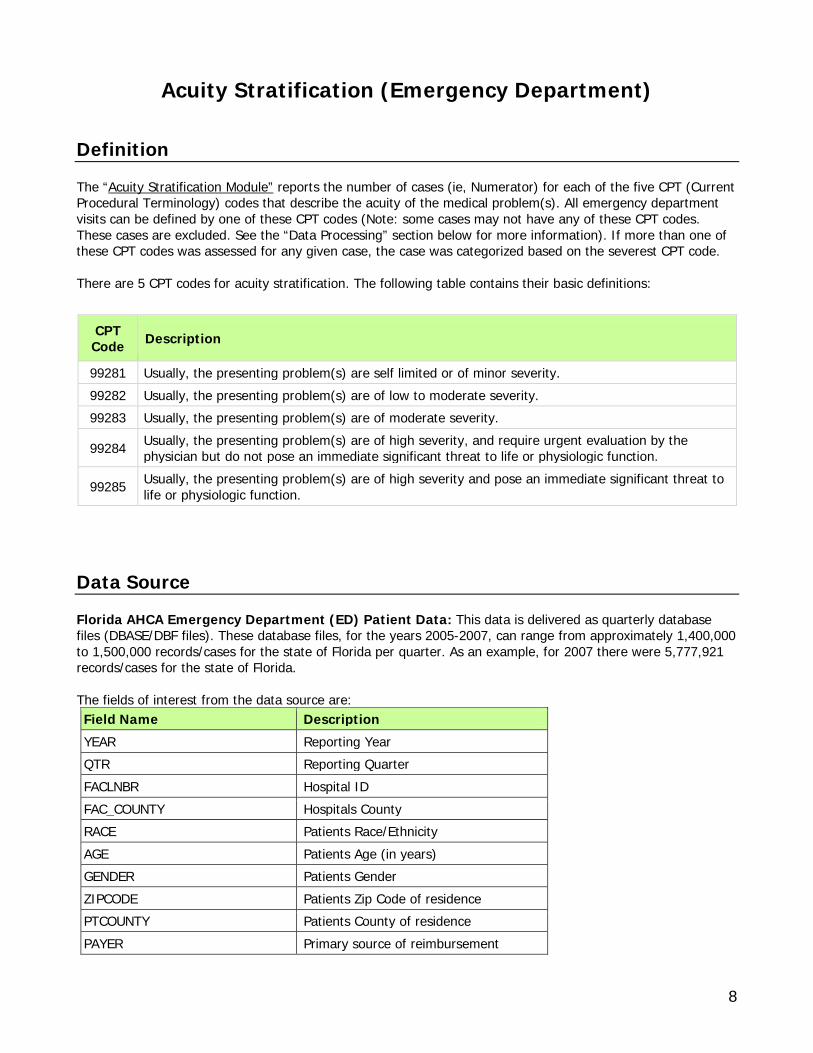
Acuity Stratification (Emergency Department) Definition The “Acuity Stratification Module” reports the number of cases (ie, Numerator) for each of the five CPT (Current Procedural Terminology) codes that describe the acuity of the medical problem(s). All emergency department visits can be defined by one of these CPT codes (Note: some cases may not have any of these CPT codes. These cases are excluded. See the “Data Processing” section below for more information). If more than one of these CPT codes was assessed for any given case, the case was categorized based on the severest CPT code. There are 5 CPT codes for acuity stratification. The following table contains their basic definitions:
CPT Code Description
99281 Usually, the presenting problem(s) are self limited or of minor severity. 99282 Usually, the presenting problem(s) are of low to moderate severity. 99283 Usually, the presenting problem(s) are of moderate severity.
99284 Usually, the presenting problem(s) are of high severity, and require urgent evaluation by the physician but do not pose an immediate significant threat to life or physiologic function.
99285 Usually, the presenting problem(s) are of high severity and pose an immediate significant threat to life or physiologic function.
Data Source Florida AHCA Emergency Department (ED) Patient Data: This data is delivered as quarterly database files (DBASE/DBF files). These database files, for the years 2005-2007, can range from approximately 1,400,000 to 1,500,000 records/cases for the state of Florida per quarter. As an example, for 2007 there were 5,777,921 records/cases for the state of Florida. The fields of interest from the data source are: Field Name Description YEAR Reporting Year QTR Reporting Quarter FACLNBR Hospital ID FAC_COUNTY Hospitals County RACE Patients Race/Ethnicity AGE Patients Age (in years) GENDER Patients Gender ZIPCODE Patients Zip Code of residence PTCOUNTY Patients County of residence PAYER Primary source of reimbursement
9
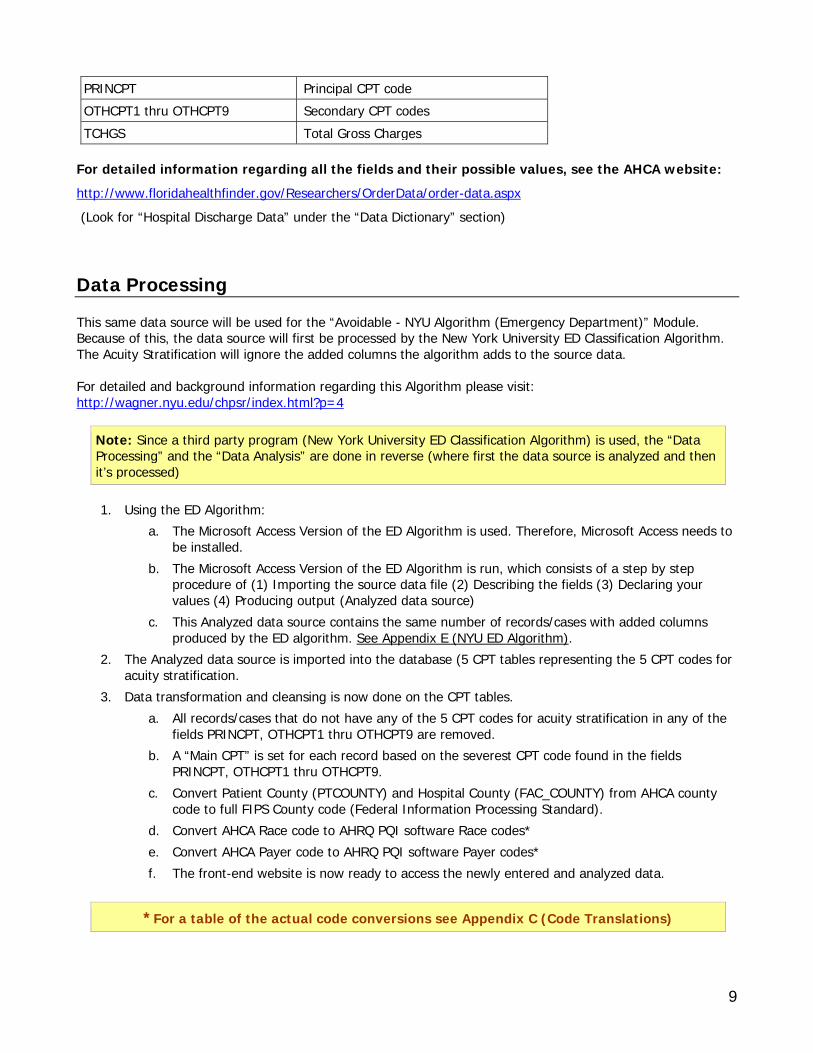
PRINCPT Principal CPT code OTHCPT1 thru OTHCPT9 Secondary CPT codes TCHGS Total Gross Charges
For detailed information regarding all the fields and their possible values, see the AHCA website: http://www.floridahealthfinder.gov/Researchers/OrderData/order-data.aspx (Look for “Hospital Discharge Data” under the “Data Dictionary” section) Data Processing This same data source will be used for the “Avoidable - NYU Algorithm (Emergency Department)” Module. Because of this, the data source will first be processed by the New York University ED Classification Algorithm. The Acuity Stratification will ignore the added columns the algorithm adds to the source data. For detailed and background information regarding this Algorithm please visit: http://wagner.nyu.edu/chpsr/index.html?p=4
Note: Since a third party program (New York University ED Classification Algorithm) is used, the “Data Processing” and the “Data Analysis” are done in reverse (where first the data source is analyzed and then it’s processed)
1. Using the ED Algorithm:
a. The Microsoft Access Version of the ED Algorithm is used. Therefore, Microsoft Access needs to be installed.
b. The Microsoft Access Version of the ED Algorithm is run, which consists of a step by step procedure of (1) Importing the source data file (2) Describing the fields (3) Declaring your values (4) Producing output (Analyzed data source)
c. This Analyzed data source contains the same number of records/cases with added columns produced by the ED algorithm. See Appendix E (NYU ED Algorithm).
2. The Analyzed data source is imported into the database (5 CPT tables representing the 5 CPT codes for acuity stratification.
3. Data transformation and cleansing is now done on the CPT tables. a. All records/cases that do not have any of the 5 CPT codes for acuity stratification in any of the
fields PRINCPT, OTHCPT1 thru OTHCPT9 are removed. b. A “Main CPT” is set for each record based on the severest CPT code found in the fields
PRINCPT, OTHCPT1 thru OTHCPT9. c. Convert Patient County (PTCOUNTY) and Hospital County (FAC_COUNTY) from AHCA county
code to full FIPS County code (Federal Information Processing Standard). d. Convert AHCA Race code to AHRQ PQI software Race codes* e. Convert AHCA Payer code to AHRQ PQI software Payer codes* f. The front-end website is now ready to access the newly entered and analyzed data.
*For a table of the actual code conversions see Appendix C (Code Translations)
10
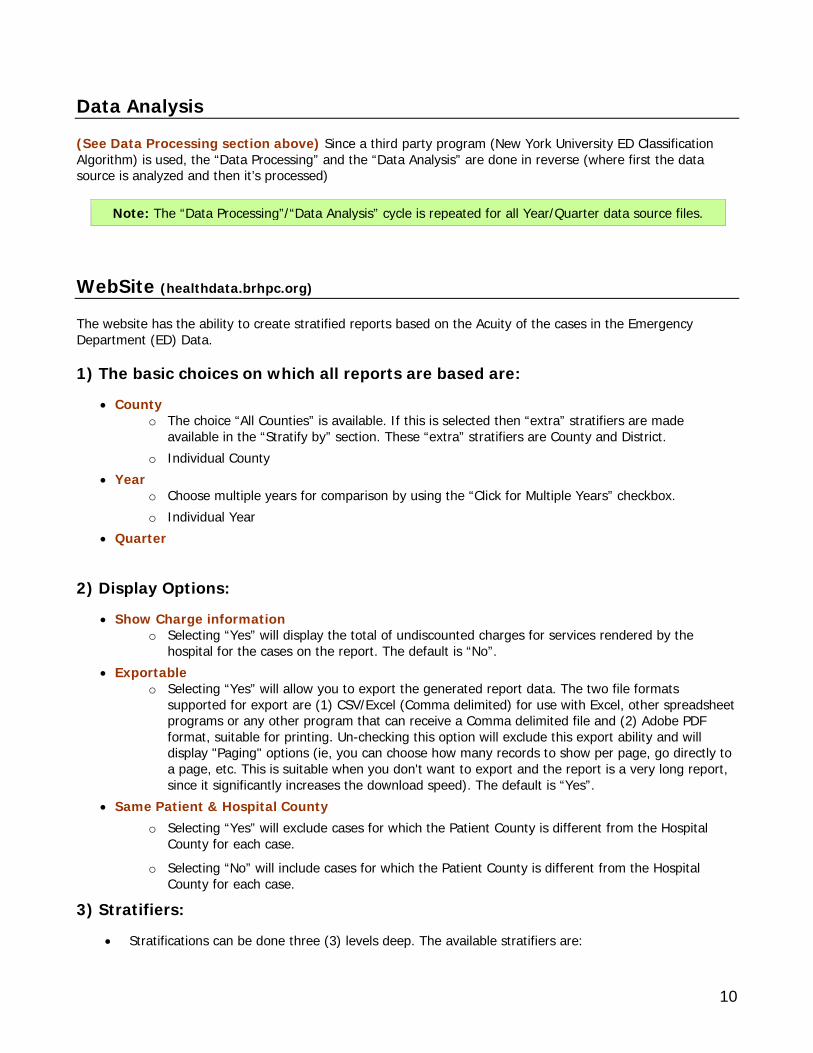
Data Analysis (See Data Processing section above) Since a third party program (New York University ED Classification Algorithm) is used, the “Data Processing” and the “Data Analysis” are done in reverse (where first the data source is analyzed and then it’s processed)
Note: The “Data Processing”/“Data Analysis” cycle is repeated for all Year/Quarter data source files. WebSite (healthdata.brhpc.org) The website has the ability to create stratified reports based on the Acuity of the cases in the Emergency Department (ED) Data. 1) The basic choices on which all reports are based are:
• County o The choice “All Counties” is available. If this is selected then “extra” stratifiers are made
available in the “Stratify by” section. These “extra” stratifiers are County and District. o Individual County
• Year o Choose multiple years for comparison by using the “Click for Multiple Years” checkbox. o Individual Year
• Quarter 2) Display Options:
• Show Charge information o Selecting “Yes” will display the total of undiscounted charges for services rendered by the
hospital for the cases on the report. The default is “No”. • Exportable
o Selecting “Yes” will allow you to export the generated report data. The two file formats supported for export are (1) CSV/Excel (Comma delimited) for use with Excel, other spreadsheet programs or any other program that can receive a Comma delimited file and (2) Adobe PDF format, suitable for printing. Un-checking this option will exclude this export ability and will display "Paging" options (ie, you can choose how many records to show per page, go directly to a page, etc. This is suitable when you don't want to export and the report is a very long report, since it significantly increases the download speed). The default is “Yes”.
• Same Patient & Hospital County o Selecting “Yes” will exclude cases for which the Patient County is different from the Hospital
County for each case. o Selecting “No” will include cases for which the Patient County is different from the Hospital
County for each case.
3) Stratifiers:
• Stratifications can be done three (3) levels deep. The available stratifiers are:
11
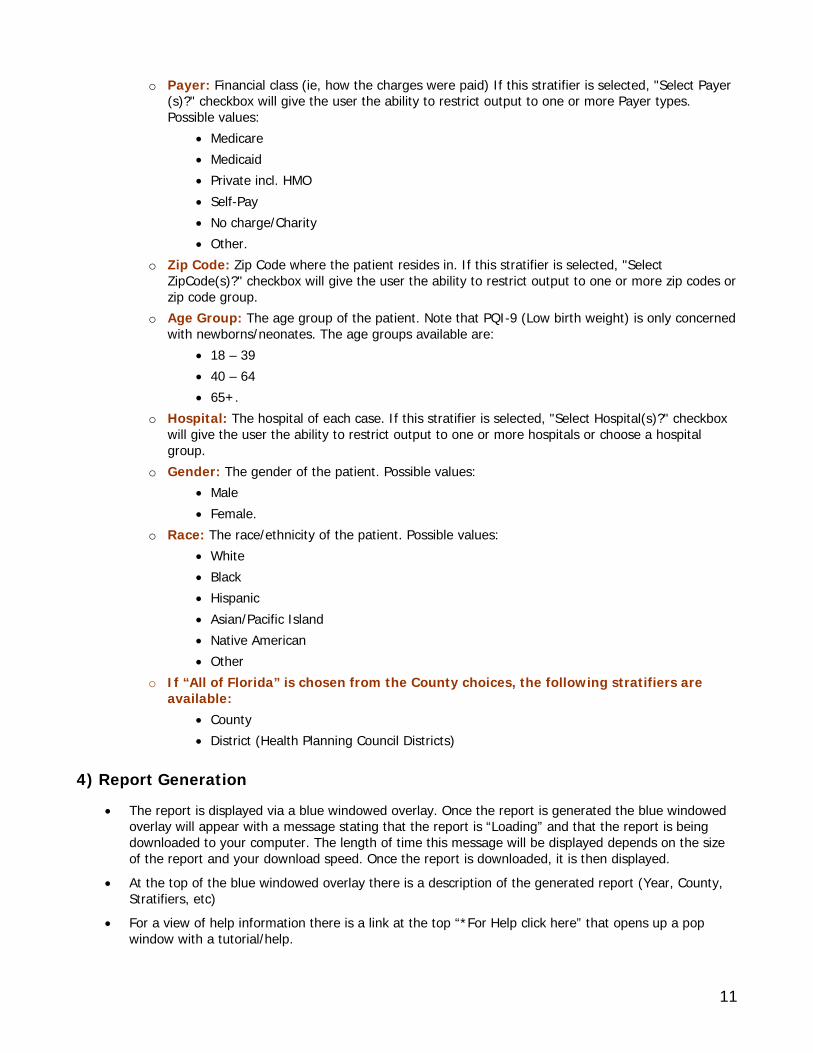
o Payer: Financial class (ie, how the charges were paid) If this stratifier is selected, "Select Payer (s)?" checkbox will give the user the ability to restrict output to one or more Payer types. Possible values:
• Medicare • Medicaid • Private incl. HMO • Self-Pay • No charge/Charity • Other.
o Zip Code: Zip Code where the patient resides in. If this stratifier is selected, "Select ZipCode(s)?" checkbox will give the user the ability to restrict output to one or more zip codes or zip code group.
o Age Group: The age group of the patient. Note that PQI-9 (Low birth weight) is only concerned with newborns/neonates. The age groups available are:
• 18 – 39 • 40 – 64 • 65+.
o Hospital: The hospital of each case. If this stratifier is selected, "Select Hospital(s)?" checkbox will give the user the ability to restrict output to one or more hospitals or choose a hospital group.
o Gender: The gender of the patient. Possible values: • Male • Female.
o Race: The race/ethnicity of the patient. Possible values: • White • Black • Hispanic • Asian/Pacific Island • Native American • Other
o If “All of Florida” is chosen from the County choices, the following stratifiers are available:
• County • District (Health Planning Council Districts)
4) Report Generation
• The report is displayed via a blue windowed overlay. Once the report is generated the blue windowed overlay will appear with a message stating that the report is “Loading” and that the report is being downloaded to your computer. The length of time this message will be displayed depends on the size of the report and your download speed. Once the report is downloaded, it is then displayed.
• At the top of the blue windowed overlay there is a description of the generated report (Year, County, Stratifiers, etc)
• For a view of help information there is a link at the top “*For Help click here” that opens up a pop window with a tutorial/help.

12
• If the option “Exportable” was selected “Yes”, then at the top right will appear a selection of export types. The choices are:
o Excel: CSV/Excel (Comma delimited) for use with Excel, other spreadsheet programs or any other program that can receive a Comma delimited file.
o PDF – Wide (Letter): Adobe PDF format, landscape mode letter sized paper. o PDF – Wide (Legal): Adobe PDF format, landscape mode legal sized paper. o PDF – Letter: Adobe PDF format, portrait mode letter size paper.
*For a graphical view/example of the websites functions, please see Appendix A (Website)
13
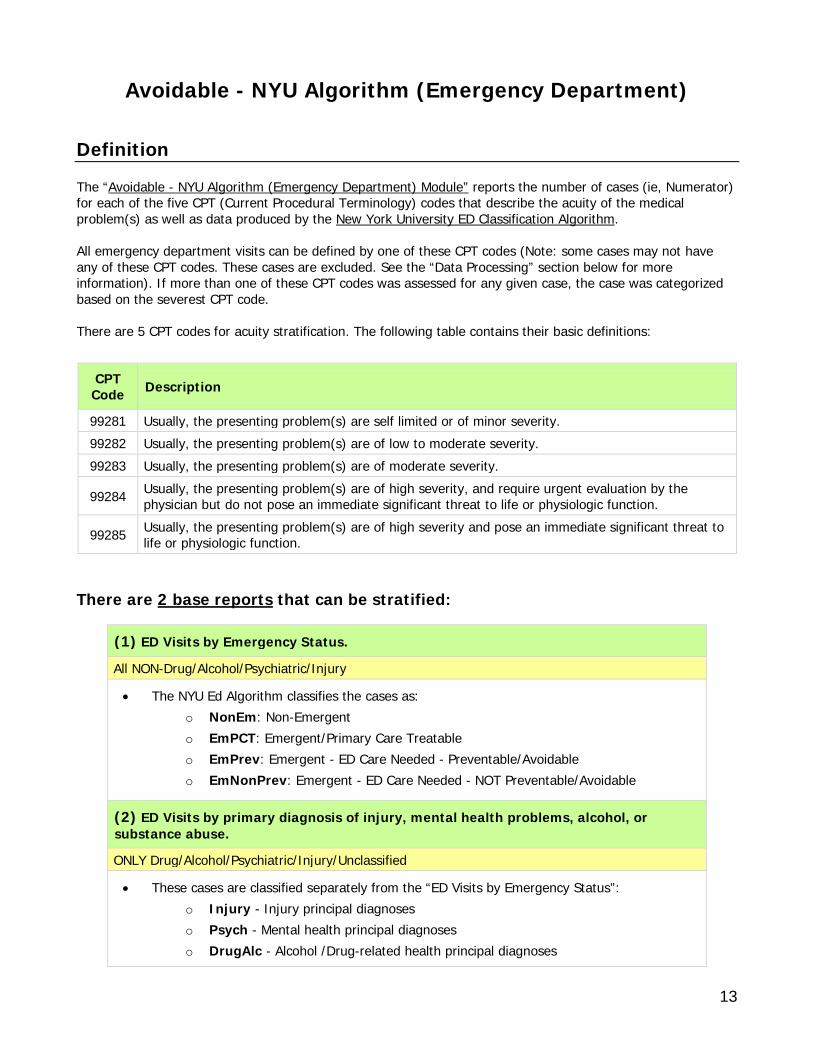
Avoidable - NYU Algorithm (Emergency Department) Definition The “Avoidable - NYU Algorithm (Emergency Department) Module” reports the number of cases (ie, Numerator) for each of the five CPT (Current Procedural Terminology) codes that describe the acuity of the medical problem(s) as well as data produced by the New York University ED Classification Algorithm. All emergency department visits can be defined by one of these CPT codes (Note: some cases may not have any of these CPT codes. These cases are excluded. See the “Data Processing” section below for more information). If more than one of these CPT codes was assessed for any given case, the case was categorized based on the severest CPT code. There are 5 CPT codes for acuity stratification. The following table contains their basic definitions:
CPT Code Description
99281 Usually, the presenting problem(s) are self limited or of minor severity. 99282 Usually, the presenting problem(s) are of low to moderate severity. 99283 Usually, the presenting problem(s) are of moderate severity.
99284 Usually, the presenting problem(s) are of high severity, and require urgent evaluation by the physician but do not pose an immediate significant threat to life or physiologic function.
99285 Usually, the presenting problem(s) are of high severity and pose an immediate significant threat to life or physiologic function.
There are 2 base reports that can be stratified:
(1) ED Visits by Emergency Status.
All NON-Drug/Alcohol/Psychiatric/Injury
• The NYU Ed Algorithm classifies the cases as: o NonEm: Non-Emergent o EmPCT: Emergent/Primary Care Treatable o EmPrev: Emergent - ED Care Needed - Preventable/Avoidable o EmNonPrev: Emergent - ED Care Needed - NOT Preventable/Avoidable
(2) ED Visits by primary diagnosis of injury, mental health problems, alcohol, or substance abuse.
ONLY Drug/Alcohol/Psychiatric/Injury/Unclassified
• These cases are classified separately from the “ED Visits by Emergency Status”: o Injury - Injury principal diagnoses o Psych - Mental health principal diagnoses o DrugAlc - Alcohol /Drug-related health principal diagnoses
14
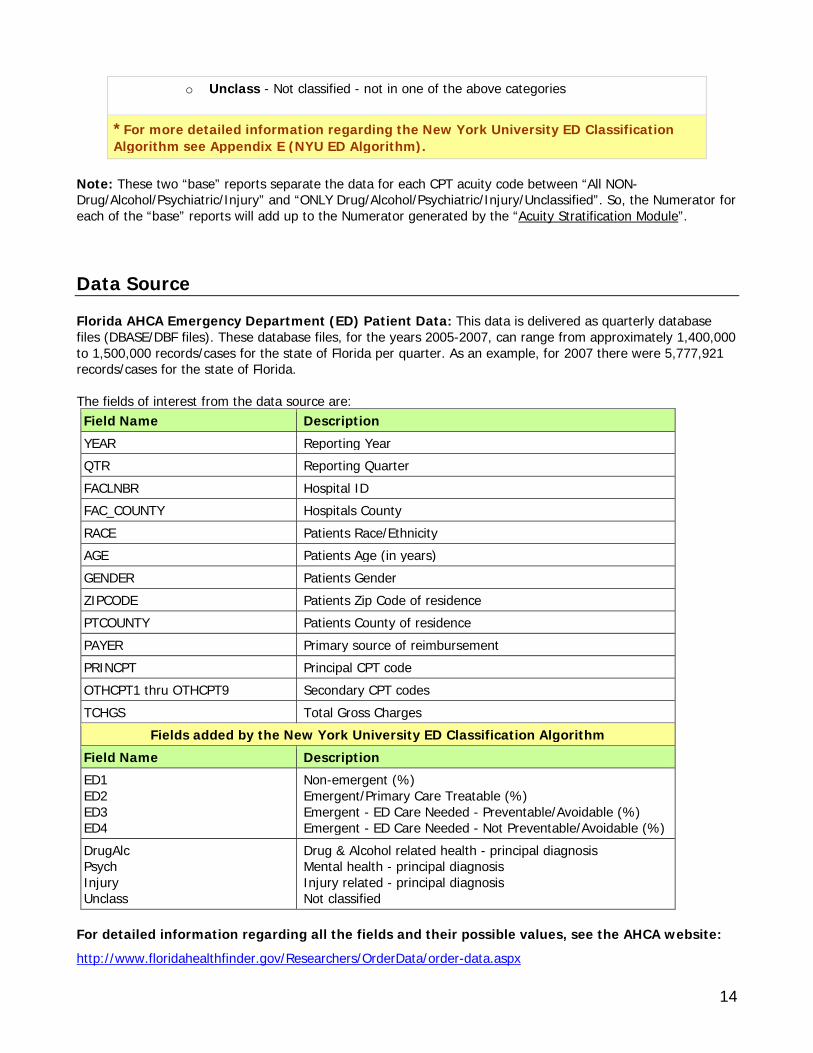
o Unclass - Not classified - not in one of the above categories
*For more detailed information regarding the New York University ED Classification Algorithm see Appendix E (NYU ED Algorithm).
Note: These two “base” reports separate the data for each CPT acuity code between “All NON-Drug/Alcohol/Psychiatric/Injury” and “ONLY Drug/Alcohol/Psychiatric/Injury/Unclassified”. So, the Numerator for each of the “base” reports will add up to the Numerator generated by the “Acuity Stratification Module”. Data Source Florida AHCA Emergency Department (ED) Patient Data: This data is delivered as quarterly database files (DBASE/DBF files). These database files, for the years 2005-2007, can range from approximately 1,400,000 to 1,500,000 records/cases for the state of Florida per quarter. As an example, for 2007 there were 5,777,921 records/cases for the state of Florida. The fields of interest from the data source are: Field Name Description YEAR Reporting Year QTR Reporting Quarter FACLNBR Hospital ID FAC_COUNTY Hospitals County RACE Patients Race/Ethnicity AGE Patients Age (in years) GENDER Patients Gender ZIPCODE Patients Zip Code of residence PTCOUNTY Patients County of residence PAYER Primary source of reimbursement PRINCPT Principal CPT code OTHCPT1 thru OTHCPT9 Secondary CPT codes TCHGS Total Gross Charges
Fields added by the New York University ED Classification Algorithm Field Name Description ED1 ED2 ED3 ED4
Non-emergent (%) Emergent/Primary Care Treatable (%) Emergent - ED Care Needed - Preventable/Avoidable (%) Emergent - ED Care Needed - Not Preventable/Avoidable (%)
DrugAlc Psych Injury Unclass
Drug & Alcohol related health - principal diagnosis Mental health - principal diagnosis Injury related - principal diagnosis Not classified
For detailed information regarding all the fields and their possible values, see the AHCA website: http://www.floridahealthfinder.gov/Researchers/OrderData/order-data.aspx
15
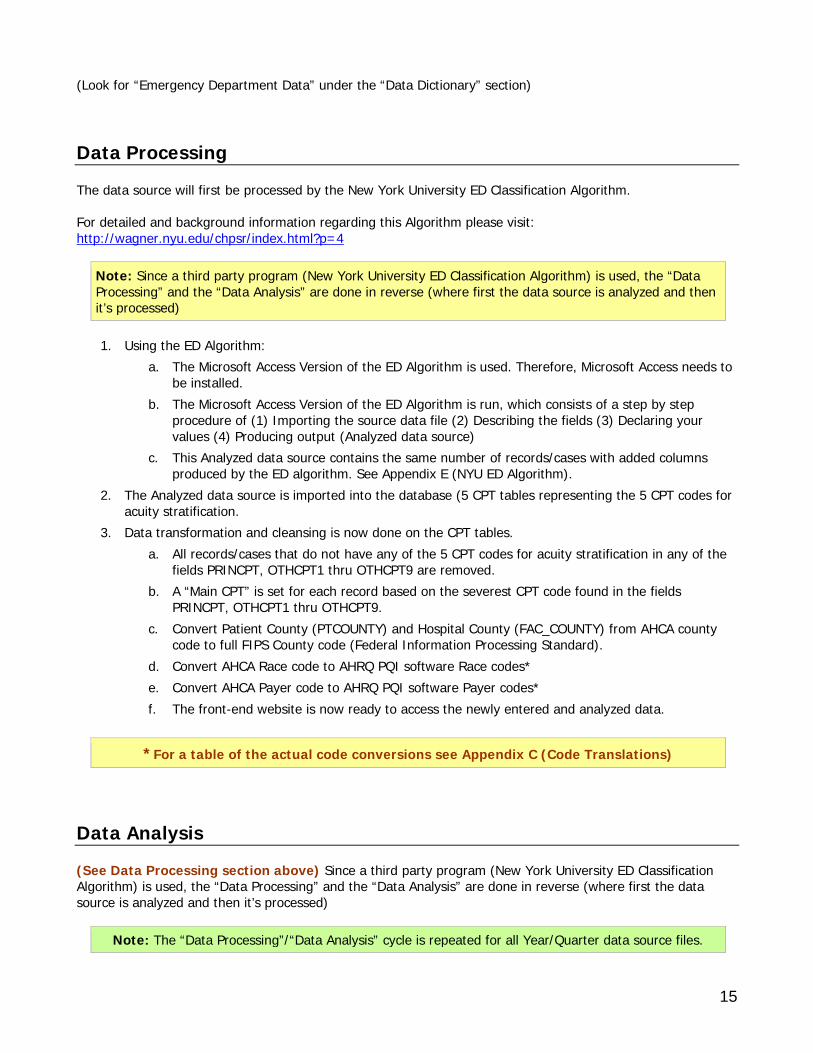
(Look for “Emergency Department Data” under the “Data Dictionary” section) Data Processing The data source will first be processed by the New York University ED Classification Algorithm. For detailed and background information regarding this Algorithm please visit: http://wagner.nyu.edu/chpsr/index.html?p=4
Note: Since a third party program (New York University ED Classification Algorithm) is used, the “Data Processing” and the “Data Analysis” are done in reverse (where first the data source is analyzed and then it’s processed)
1. Using the ED Algorithm:
a. The Microsoft Access Version of the ED Algorithm is used. Therefore, Microsoft Access needs to be installed.
b. The Microsoft Access Version of the ED Algorithm is run, which consists of a step by step procedure of (1) Importing the source data file (2) Describing the fields (3) Declaring your values (4) Producing output (Analyzed data source)
c. This Analyzed data source contains the same number of records/cases with added columns produced by the ED algorithm. See Appendix E (NYU ED Algorithm).
2. The Analyzed data source is imported into the database (5 CPT tables representing the 5 CPT codes for acuity stratification.
3. Data transformation and cleansing is now done on the CPT tables. a. All records/cases that do not have any of the 5 CPT codes for acuity stratification in any of the
fields PRINCPT, OTHCPT1 thru OTHCPT9 are removed. b. A “Main CPT” is set for each record based on the severest CPT code found in the fields
PRINCPT, OTHCPT1 thru OTHCPT9. c. Convert Patient County (PTCOUNTY) and Hospital County (FAC_COUNTY) from AHCA county
code to full FIPS County code (Federal Information Processing Standard). d. Convert AHCA Race code to AHRQ PQI software Race codes* e. Convert AHCA Payer code to AHRQ PQI software Payer codes* f. The front-end website is now ready to access the newly entered and analyzed data.
*For a table of the actual code conversions see Appendix C (Code Translations) Data Analysis (See Data Processing section above) Since a third party program (New York University ED Classification Algorithm) is used, the “Data Processing” and the “Data Analysis” are done in reverse (where first the data source is analyzed and then it’s processed)
Note: The “Data Processing”/“Data Analysis” cycle is repeated for all Year/Quarter data source files.
16
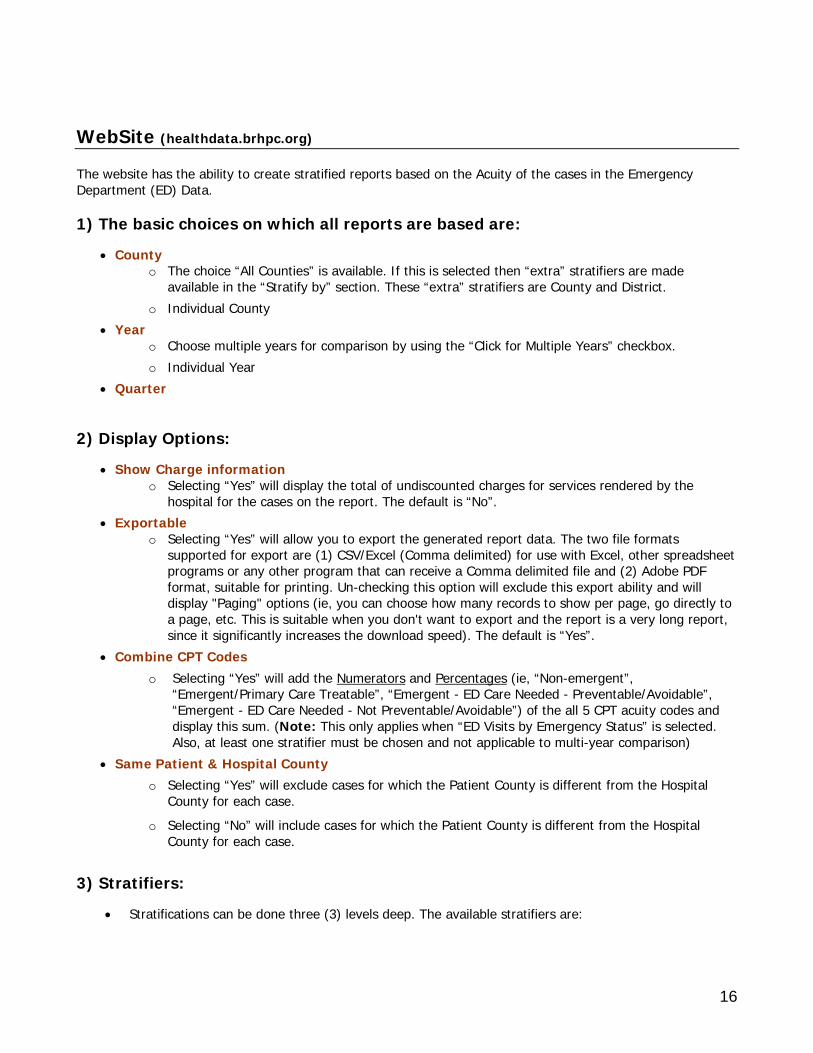
WebSite (healthdata.brhpc.org) The website has the ability to create stratified reports based on the Acuity of the cases in the Emergency Department (ED) Data. 1) The basic choices on which all reports are based are:
• County o The choice “All Counties” is available. If this is selected then “extra” stratifiers are made
available in the “Stratify by” section. These “extra” stratifiers are County and District. o Individual County
• Year o Choose multiple years for comparison by using the “Click for Multiple Years” checkbox. o Individual Year
• Quarter 2) Display Options:
• Show Charge information o Selecting “Yes” will display the total of undiscounted charges for services rendered by the
hospital for the cases on the report. The default is “No”. • Exportable
o Selecting “Yes” will allow you to export the generated report data. The two file formats supported for export are (1) CSV/Excel (Comma delimited) for use with Excel, other spreadsheet programs or any other program that can receive a Comma delimited file and (2) Adobe PDF format, suitable for printing. Un-checking this option will exclude this export ability and will display "Paging" options (ie, you can choose how many records to show per page, go directly to a page, etc. This is suitable when you don't want to export and the report is a very long report, since it significantly increases the download speed). The default is “Yes”.
• Combine CPT Codes o Selecting “Yes” will add the Numerators and Percentages (ie, “Non-emergent”,
“Emergent/Primary Care Treatable”, “Emergent - ED Care Needed - Preventable/Avoidable”, “Emergent - ED Care Needed - Not Preventable/Avoidable”) of the all 5 CPT acuity codes and display this sum. (Note: This only applies when “ED Visits by Emergency Status” is selected. Also, at least one stratifier must be chosen and not applicable to multi-year comparison)
• Same Patient & Hospital County o Selecting “Yes” will exclude cases for which the Patient County is different from the Hospital
County for each case.
o Selecting “No” will include cases for which the Patient County is different from the Hospital County for each case.
3) Stratifiers:
• Stratifications can be done three (3) levels deep. The available stratifiers are:

17
o Payer: Financial class (ie, how the charges were paid) If this stratifier is selected, "Select Payer (s)?" checkbox will give the user the ability to restrict output to one or more Payer types. Possible values:
• Medicare • Medicaid • Private incl. HMO • Self-Pay • No charge/Charity • Other.
o Zip Code: Zip Code where the patient resides in. If this stratifier is selected, "Select ZipCode(s)?" checkbox will give the user the ability to restrict output to one or more zip codes or zip code group.
o Age Group: The age group of the patient. Note that PQI-9 (Low birth weight) is only concerned with newborns/neonates. The age groups available are:
• 18 – 39 • 40 – 64 • 65+.
o Hospital: The hospital of each case. If this stratifier is selected, "Select Hospital(s)?" checkbox will give the user the ability to restrict output to one or more hospitals or choose a hospital group.
o Gender: The gender of the patient. Possible values: • Male • Female.
o Race: The race/ethnicity of the patient. Possible values: • White • Black • Hispanic • Asian/Pacific Island • Native American • Other
o If “All of Florida” is chosen from the County choices, the following stratifiers are available:
• County • District (Health Planning Council Districts)
4) Report Generation
• The report is displayed via a blue windowed overlay. Once the report is generated the blue windowed overlay will appear with a message stating that the report is “Loading” and that the report is being downloaded to your computer. The length of time this message will be displayed depends on the size of the report and your download speed. Once the report is downloaded, it is then displayed.
• At the top of the blue windowed overlay there is a description of the generated report (Year, County, Stratifiers, etc)
• For a view of help information there is a link at the top “*For Help click here” that opens up a pop window with a tutorial/help.

18
• If the option “Exportable” was selected “Yes”, then at the top right will appear a selection of export types. The choices are:
o Excel: CSV/Excel (Comma delimited) for use with Excel, other spreadsheet programs or any other program that can receive a Comma delimited file.
o PDF – Wide (Letter): Adobe PDF format, landscape mode letter sized paper. o PDF – Wide (Legal): Adobe PDF format, landscape mode legal sized paper. o PDF – Letter: Adobe PDF format, portrait mode letter size paper.
*For a graphical view/example of the websites functions, please see Appendix A (Website)
19
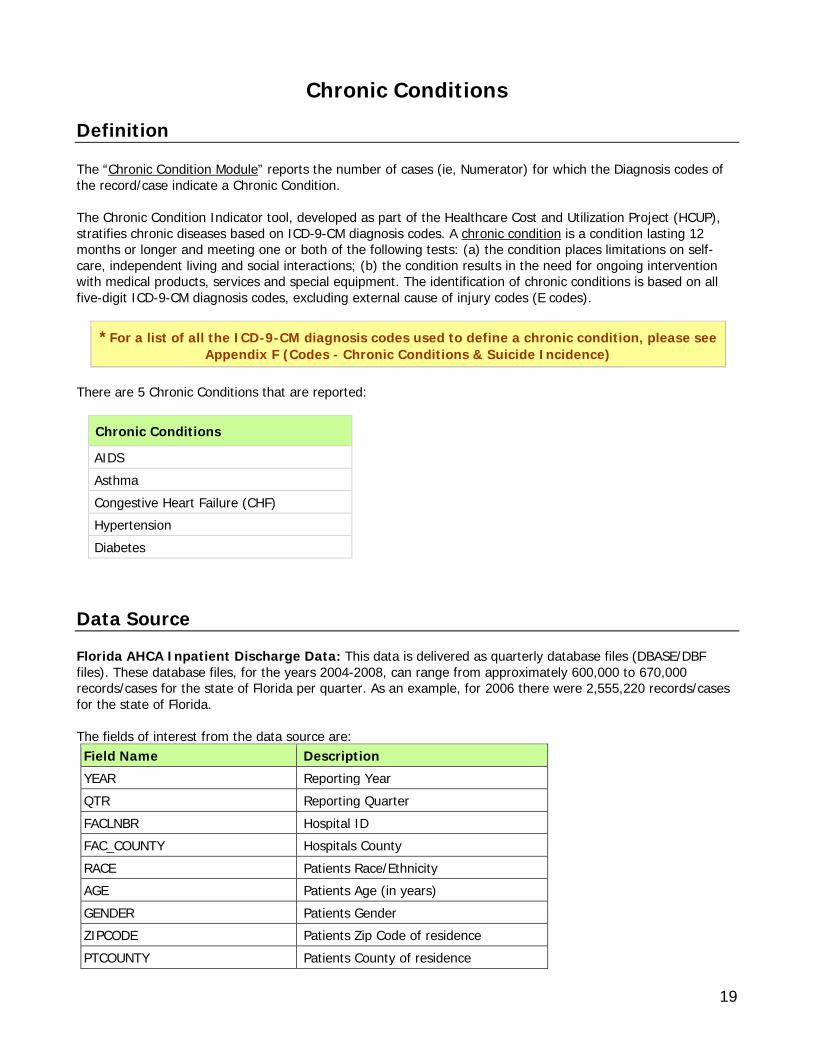
Chronic Conditions Definition The “Chronic Condition Module” reports the number of cases (ie, Numerator) for which the Diagnosis codes of the record/case indicate a Chronic Condition. The Chronic Condition Indicator tool, developed as part of the Healthcare Cost and Utilization Project (HCUP), stratifies chronic diseases based on ICD-9-CM diagnosis codes. A chronic condition is a condition lasting 12 months or longer and meeting one or both of the following tests: (a) the condition places limitations on self-care, independent living and social interactions; (b) the condition results in the need for ongoing intervention with medical products, services and special equipment. The identification of chronic conditions is based on all five-digit ICD-9-CM diagnosis codes, excluding external cause of injury codes (E codes).
*For a list of all the ICD-9-CM diagnosis codes used to define a chronic condition, please see Appendix F (Codes - Chronic Conditions & Suicide Incidence)
There are 5 Chronic Conditions that are reported:
Chronic Conditions
AIDS Asthma Congestive Heart Failure (CHF) Hypertension Diabetes
Data Source Florida AHCA Inpatient Discharge Data: This data is delivered as quarterly database files (DBASE/DBF files). These database files, for the years 2004-2008, can range from approximately 600,000 to 670,000 records/cases for the state of Florida per quarter. As an example, for 2006 there were 2,555,220 records/cases for the state of Florida. The fields of interest from the data source are: Field Name Description YEAR Reporting Year QTR Reporting Quarter FACLNBR Hospital ID FAC_COUNTY Hospitals County RACE Patients Race/Ethnicity AGE Patients Age (in years) GENDER Patients Gender ZIPCODE Patients Zip Code of residence PTCOUNTY Patients County of residence
20
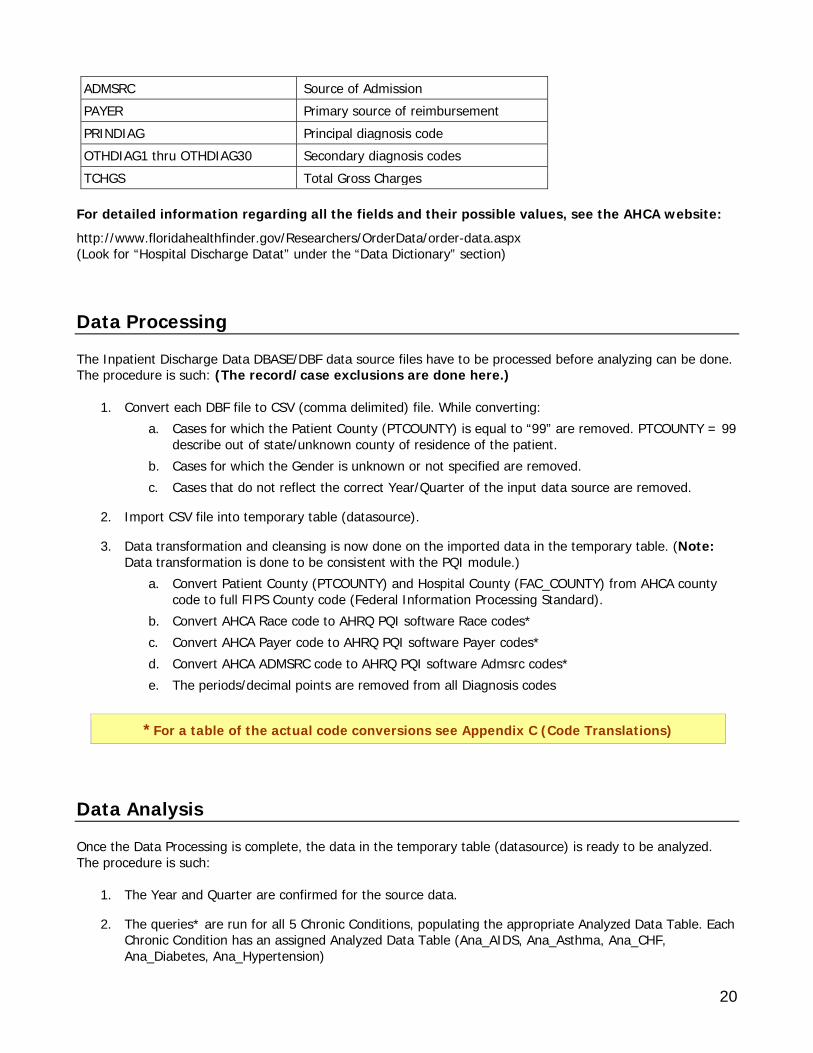
ADMSRC Source of Admission PAYER Primary source of reimbursement PRINDIAG Principal diagnosis code OTHDIAG1 thru OTHDIAG30 Secondary diagnosis codes TCHGS Total Gross Charges
For detailed information regarding all the fields and their possible values, see the AHCA website: http://www.floridahealthfinder.gov/Researchers/OrderData/order-data.aspx (Look for “Hospital Discharge Datat” under the “Data Dictionary” section) Data Processing The Inpatient Discharge Data DBASE/DBF data source files have to be processed before analyzing can be done. The procedure is such: (The record/case exclusions are done here.)
1. Convert each DBF file to CSV (comma delimited) file. While converting: a. Cases for which the Patient County (PTCOUNTY) is equal to “99” are removed. PTCOUNTY = 99
describe out of state/unknown county of residence of the patient. b. Cases for which the Gender is unknown or not specified are removed. c. Cases that do not reflect the correct Year/Quarter of the input data source are removed.
2. Import CSV file into temporary table (datasource).
3. Data transformation and cleansing is now done on the imported data in the temporary table. (Note: Data transformation is done to be consistent with the PQI module.)
a. Convert Patient County (PTCOUNTY) and Hospital County (FAC_COUNTY) from AHCA county code to full FIPS County code (Federal Information Processing Standard).
b. Convert AHCA Race code to AHRQ PQI software Race codes* c. Convert AHCA Payer code to AHRQ PQI software Payer codes* d. Convert AHCA ADMSRC code to AHRQ PQI software Admsrc codes* e. The periods/decimal points are removed from all Diagnosis codes
*For a table of the actual code conversions see Appendix C (Code Translations) Data Analysis Once the Data Processing is complete, the data in the temporary table (datasource) is ready to be analyzed. The procedure is such:
1. The Year and Quarter are confirmed for the source data.
2. The queries* are run for all 5 Chronic Conditions, populating the appropriate Analyzed Data Table. Each Chronic Condition has an assigned Analyzed Data Table (Ana_AIDS, Ana_Asthma, Ana_CHF, Ana_Diabetes, Ana_Hypertension)
21
a. While running the analytical queries, the system also adds a column (AGECATEGORY) and sets the “Age Category” based on the patient age.
3. The front-end website is now ready to access the newly entered and analyzed data.
*To view the actual analytical queries used, please refer to Appendix D (Analytical Queries)
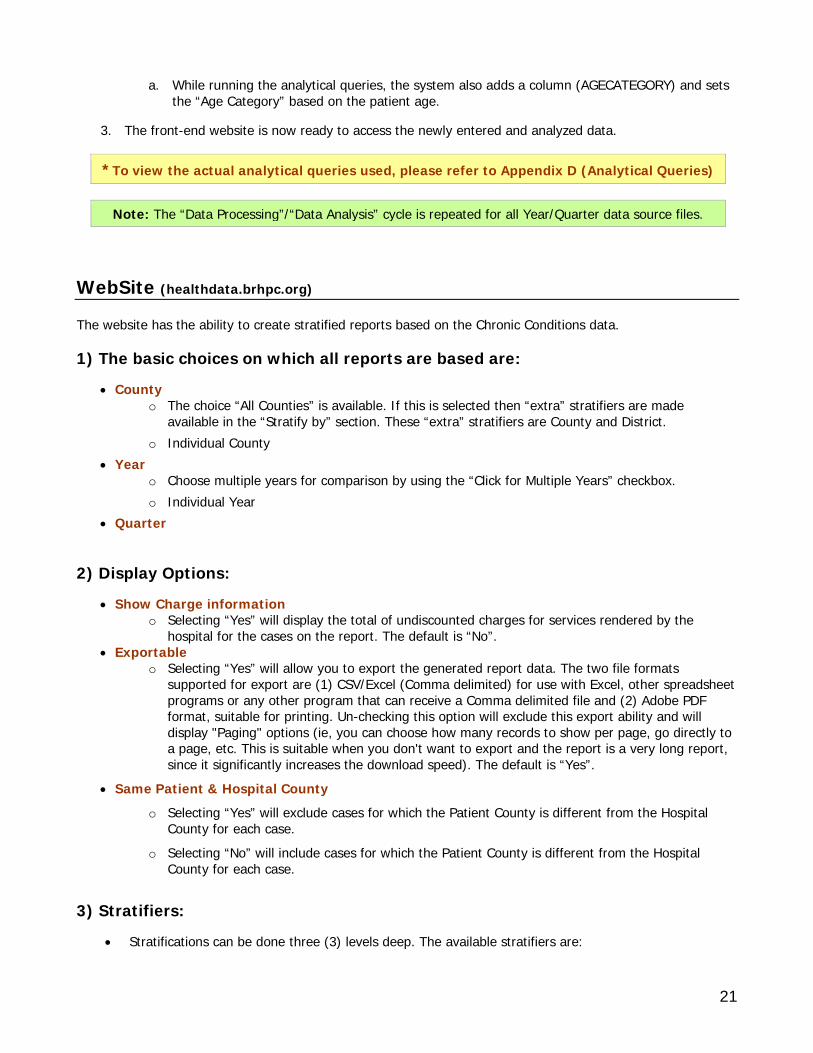
Note: The “Data Processing”/“Data Analysis” cycle is repeated for all Year/Quarter data source files. WebSite (healthdata.brhpc.org) The website has the ability to create stratified reports based on the Chronic Conditions data. 1) The basic choices on which all reports are based are:
• County o The choice “All Counties” is available. If this is selected then “extra” stratifiers are made
available in the “Stratify by” section. These “extra” stratifiers are County and District. o Individual County
• Year o Choose multiple years for comparison by using the “Click for Multiple Years” checkbox. o Individual Year
• Quarter 2) Display Options:
• Show Charge information o Selecting “Yes” will display the total of undiscounted charges for services rendered by the
hospital for the cases on the report. The default is “No”. • Exportable
o Selecting “Yes” will allow you to export the generated report data. The two file formats supported for export are (1) CSV/Excel (Comma delimited) for use with Excel, other spreadsheet programs or any other program that can receive a Comma delimited file and (2) Adobe PDF format, suitable for printing. Un-checking this option will exclude this export ability and will display "Paging" options (ie, you can choose how many records to show per page, go directly to a page, etc. This is suitable when you don't want to export and the report is a very long report, since it significantly increases the download speed). The default is “Yes”.
• Same Patient & Hospital County o Selecting “Yes” will exclude cases for which the Patient County is different from the Hospital
County for each case.
o Selecting “No” will include cases for which the Patient County is different from the Hospital County for each case.
3) Stratifiers:
• Stratifications can be done three (3) levels deep. The available stratifiers are:
22
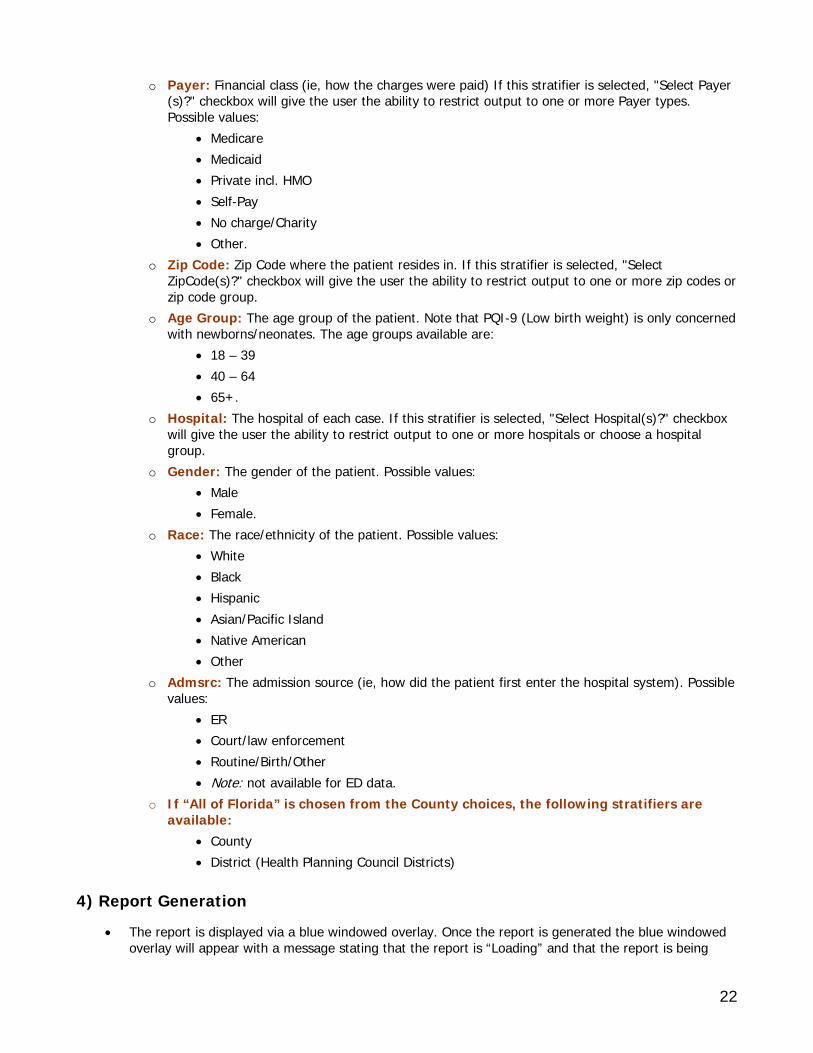
o Payer: Financial class (ie, how the charges were paid) If this stratifier is selected, "Select Payer (s)?" checkbox will give the user the ability to restrict output to one or more Payer types. Possible values:
• Medicare • Medicaid • Private incl. HMO • Self-Pay • No charge/Charity • Other.
o Zip Code: Zip Code where the patient resides in. If this stratifier is selected, "Select ZipCode(s)?" checkbox will give the user the ability to restrict output to one or more zip codes or zip code group.
o Age Group: The age group of the patient. Note that PQI-9 (Low birth weight) is only concerned with newborns/neonates. The age groups available are:
• 18 – 39 • 40 – 64 • 65+.
o Hospital: The hospital of each case. If this stratifier is selected, "Select Hospital(s)?" checkbox will give the user the ability to restrict output to one or more hospitals or choose a hospital group.
o Gender: The gender of the patient. Possible values: • Male • Female.
o Race: The race/ethnicity of the patient. Possible values: • White • Black • Hispanic • Asian/Pacific Island • Native American • Other
o Admsrc: The admission source (ie, how did the patient first enter the hospital system). Possible values:
• ER • Court/law enforcement • Routine/Birth/Other • Note: not available for ED data.
o If “All of Florida” is chosen from the County choices, the following stratifiers are available:
• County • District (Health Planning Council Districts)
4) Report Generation
• The report is displayed via a blue windowed overlay. Once the report is generated the blue windowed overlay will appear with a message stating that the report is “Loading” and that the report is being
23
downloaded to your computer. The length of time this message will be displayed depends on the size of the report and your download speed. Once the report is downloaded, it is then displayed.
• At the top of the blue windowed overlay there is a description of the generated report (Year, County, Stratifiers, etc)
• For a view of help information there is a link at the top “*For Help click here” that opens up a pop window with a tutorial/help.
• If the option “Exportable” was selected “Yes”, then at the top right will appear a selection of export types. The choices are:
o Excel: CSV/Excel (Comma delimited) for use with Excel, other spreadsheet programs or any other program that can receive a Comma delimited file.
o PDF – Wide (Letter): Adobe PDF format, landscape mode letter sized paper. o PDF – Wide (Legal): Adobe PDF format, landscape mode legal sized paper. o PDF – Letter: Adobe PDF format, portrait mode letter size paper.
*For a graphical view/example of the websites functions, please see Appendix A (Website)
24
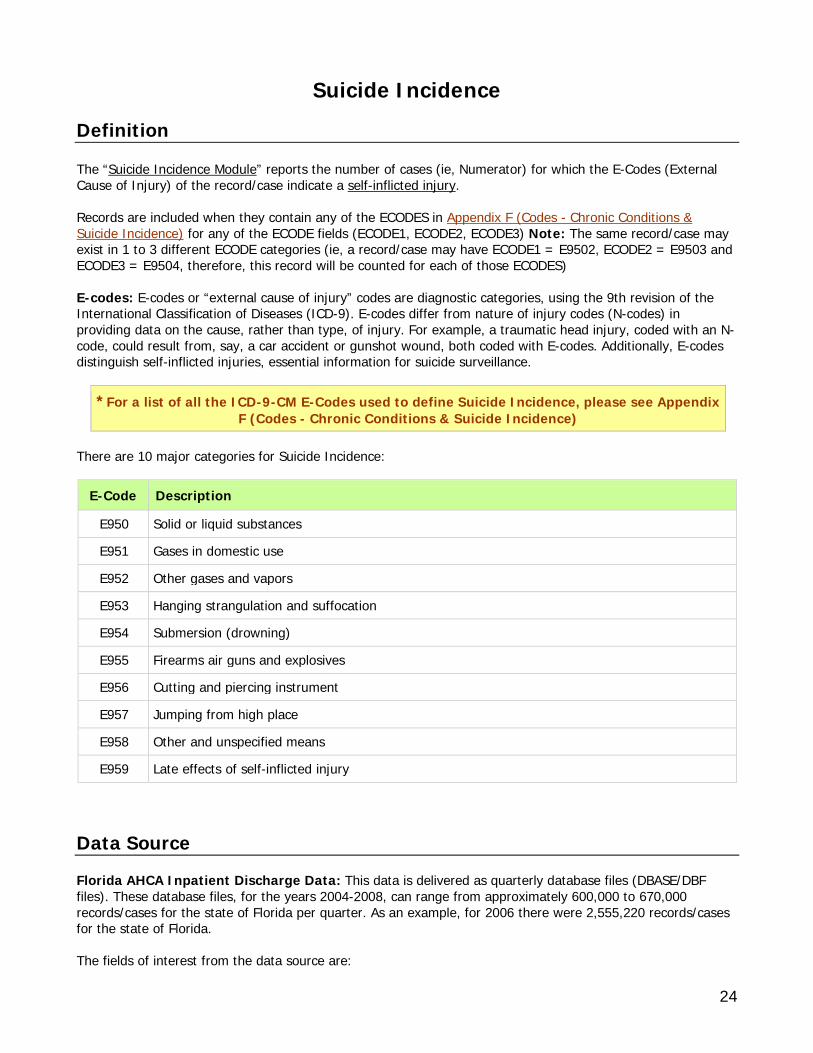
Suicide Incidence Definition The “Suicide Incidence Module” reports the number of cases (ie, Numerator) for which the E-Codes (External Cause of Injury) of the record/case indicate a self-inflicted injury. Records are included when they contain any of the ECODES in Appendix F (Codes - Chronic Conditions & Suicide Incidence) for any of the ECODE fields (ECODE1, ECODE2, ECODE3) Note: The same record/case may exist in 1 to 3 different ECODE categories (ie, a record/case may have ECODE1 = E9502, ECODE2 = E9503 and ECODE3 = E9504, therefore, this record will be counted for each of those ECODES) E-codes: E-codes or “external cause of injury” codes are diagnostic categories, using the 9th revision of the International Classification of Diseases (ICD-9). E-codes differ from nature of injury codes (N-codes) in providing data on the cause, rather than type, of injury. For example, a traumatic head injury, coded with an N-code, could result from, say, a car accident or gunshot wound, both coded with E-codes. Additionally, E-codes distinguish self-inflicted injuries, essential information for suicide surveillance.
*For a list of all the ICD-9-CM E-Codes used to define Suicide Incidence, please see Appendix F (Codes - Chronic Conditions & Suicide Incidence)
There are 10 major categories for Suicide Incidence:
E-Code Description
E950 Solid or liquid substances
E951 Gases in domestic use
E952 Other gases and vapors
E953 Hanging strangulation and suffocation
E954 Submersion (drowning)
E955 Firearms air guns and explosives
E956 Cutting and piercing instrument
E957 Jumping from high place
E958 Other and unspecified means
E959 Late effects of self-inflicted injury Data Source Florida AHCA Inpatient Discharge Data: This data is delivered as quarterly database files (DBASE/DBF files). These database files, for the years 2004-2008, can range from approximately 600,000 to 670,000 records/cases for the state of Florida per quarter. As an example, for 2006 there were 2,555,220 records/cases for the state of Florida. The fields of interest from the data source are:
25
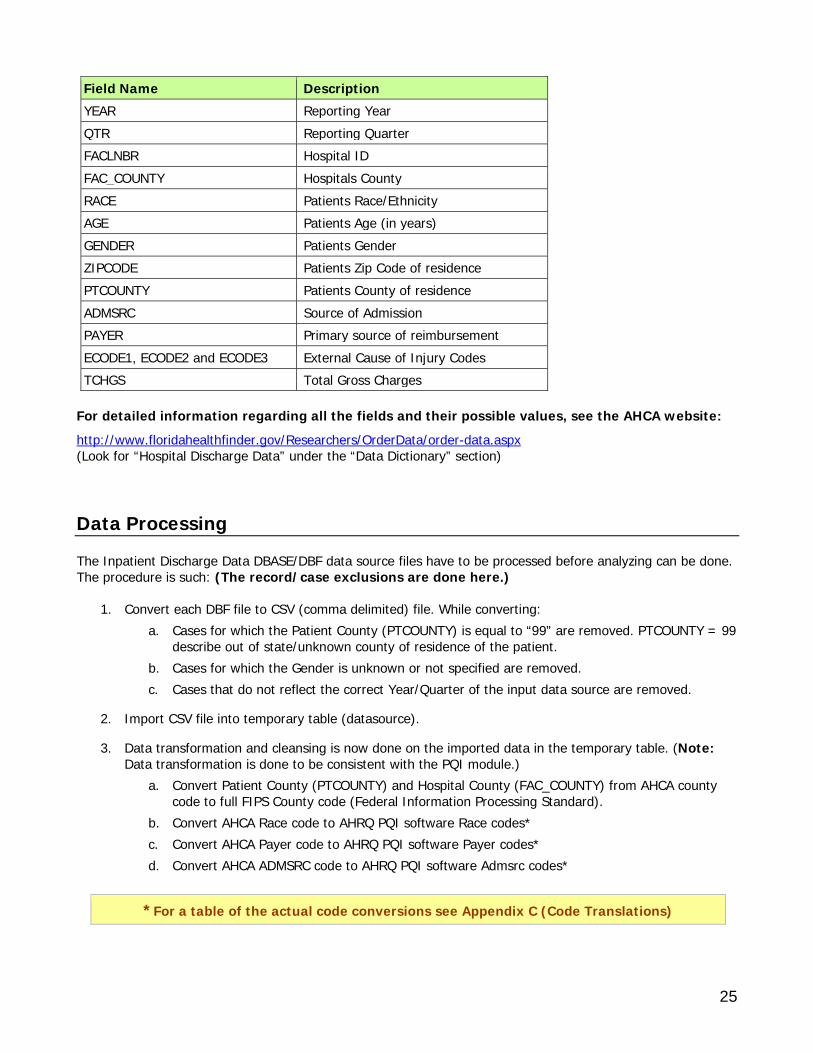
Field Name Description YEAR Reporting Year QTR Reporting Quarter FACLNBR Hospital ID FAC_COUNTY Hospitals County RACE Patients Race/Ethnicity AGE Patients Age (in years) GENDER Patients Gender ZIPCODE Patients Zip Code of residence PTCOUNTY Patients County of residence ADMSRC Source of Admission PAYER Primary source of reimbursement ECODE1, ECODE2 and ECODE3 External Cause of Injury Codes TCHGS Total Gross Charges
For detailed information regarding all the fields and their possible values, see the AHCA website: http://www.floridahealthfinder.gov/Researchers/OrderData/order-data.aspx (Look for “Hospital Discharge Data” under the “Data Dictionary” section) Data Processing The Inpatient Discharge Data DBASE/DBF data source files have to be processed before analyzing can be done. The procedure is such: (The record/case exclusions are done here.)
1. Convert each DBF file to CSV (comma delimited) file. While converting: a. Cases for which the Patient County (PTCOUNTY) is equal to “99” are removed. PTCOUNTY = 99
describe out of state/unknown county of residence of the patient. b. Cases for which the Gender is unknown or not specified are removed. c. Cases that do not reflect the correct Year/Quarter of the input data source are removed.
2. Import CSV file into temporary table (datasource).
3. Data transformation and cleansing is now done on the imported data in the temporary table. (Note: Data transformation is done to be consistent with the PQI module.)
a. Convert Patient County (PTCOUNTY) and Hospital County (FAC_COUNTY) from AHCA county code to full FIPS County code (Federal Information Processing Standard).
b. Convert AHCA Race code to AHRQ PQI software Race codes* c. Convert AHCA Payer code to AHRQ PQI software Payer codes* d. Convert AHCA ADMSRC code to AHRQ PQI software Admsrc codes*
*For a table of the actual code conversions see Appendix C (Code Translations)
26
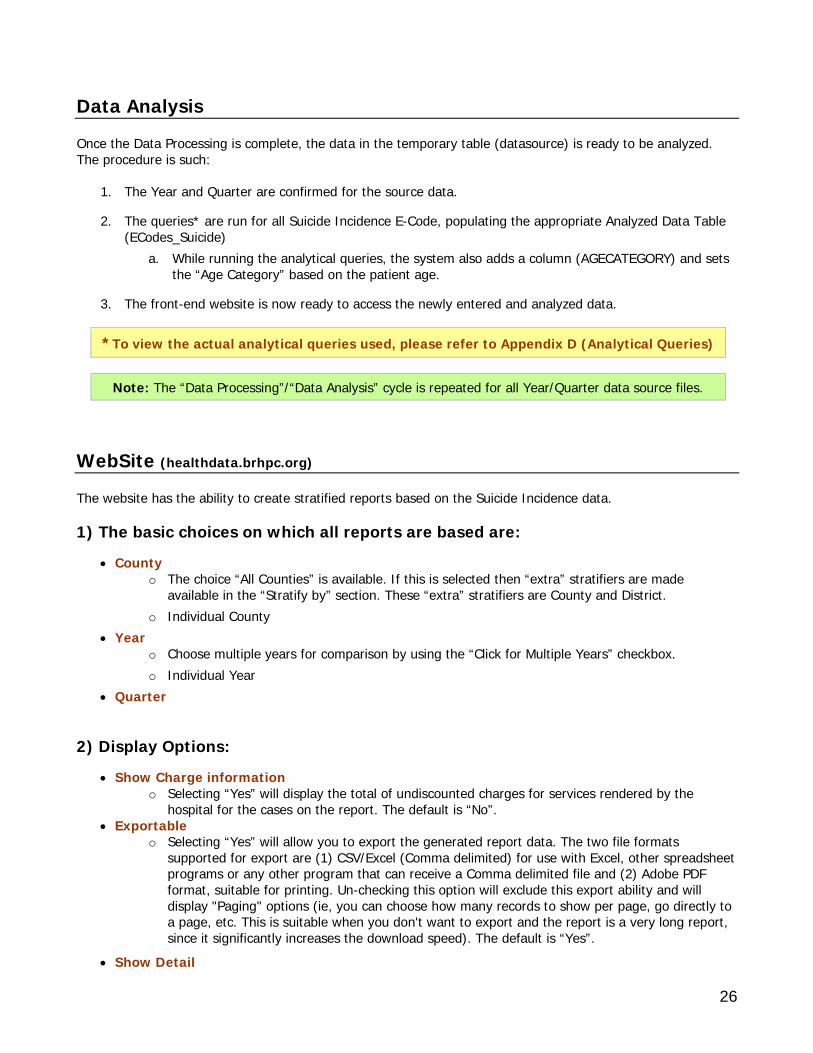
Data Analysis Once the Data Processing is complete, the data in the temporary table (datasource) is ready to be analyzed. The procedure is such:
1. The Year and Quarter are confirmed for the source data.
2. The queries* are run for all Suicide Incidence E-Code, populating the appropriate Analyzed Data Table (ECodes_Suicide)
a. While running the analytical queries, the system also adds a column (AGECATEGORY) and sets the “Age Category” based on the patient age.
3. The front-end website is now ready to access the newly entered and analyzed data.
*To view the actual analytical queries used, please refer to Appendix D (Analytical Queries)
Note: The “Data Processing”/“Data Analysis” cycle is repeated for all Year/Quarter data source files. WebSite (healthdata.brhpc.org) The website has the ability to create stratified reports based on the Suicide Incidence data. 1) The basic choices on which all reports are based are:
• County o The choice “All Counties” is available. If this is selected then “extra” stratifiers are made
available in the “Stratify by” section. These “extra” stratifiers are County and District. o Individual County
• Year o Choose multiple years for comparison by using the “Click for Multiple Years” checkbox. o Individual Year
• Quarter 2) Display Options:
• Show Charge information o Selecting “Yes” will display the total of undiscounted charges for services rendered by the
hospital for the cases on the report. The default is “No”. • Exportable
o Selecting “Yes” will allow you to export the generated report data. The two file formats supported for export are (1) CSV/Excel (Comma delimited) for use with Excel, other spreadsheet programs or any other program that can receive a Comma delimited file and (2) Adobe PDF format, suitable for printing. Un-checking this option will exclude this export ability and will display "Paging" options (ie, you can choose how many records to show per page, go directly to a page, etc. This is suitable when you don't want to export and the report is a very long report, since it significantly increases the download speed). The default is “Yes”.
• Show Detail
27
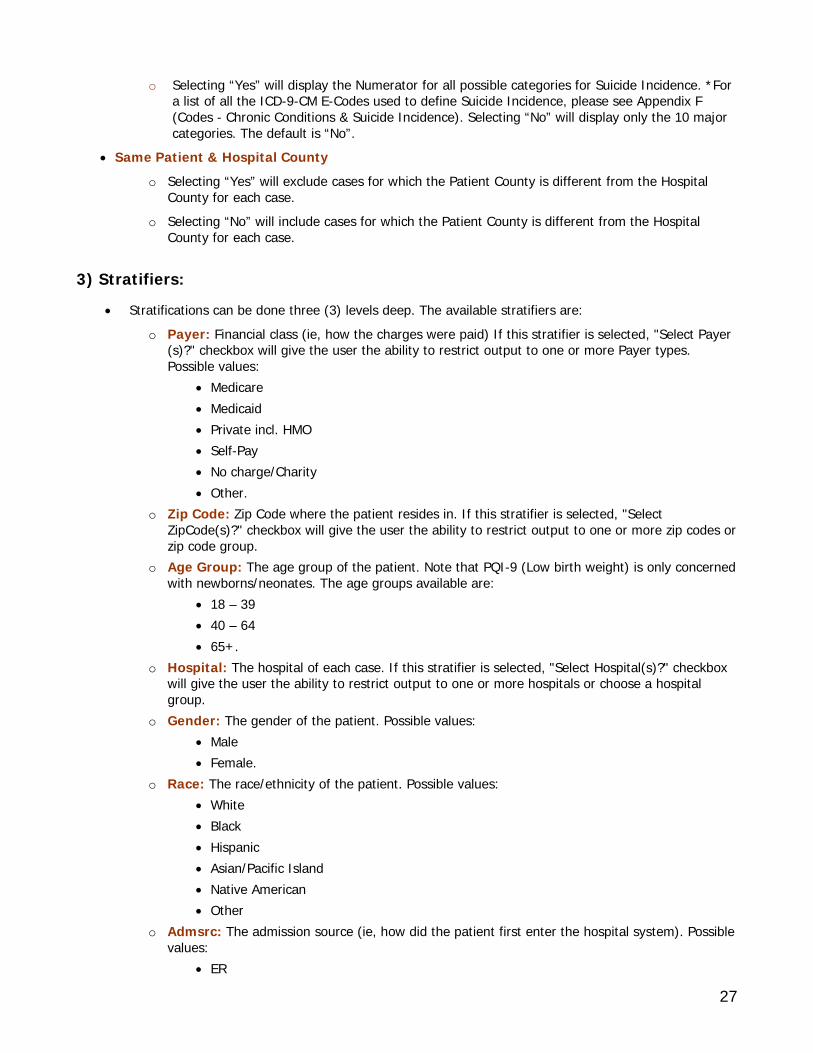
o Selecting “Yes” will display the Numerator for all possible categories for Suicide Incidence. *For a list of all the ICD-9-CM E-Codes used to define Suicide Incidence, please see Appendix F (Codes - Chronic Conditions & Suicide Incidence). Selecting “No” will display only the 10 major categories. The default is “No”.
• Same Patient & Hospital County
o Selecting “Yes” will exclude cases for which the Patient County is different from the Hospital County for each case.
o Selecting “No” will include cases for which the Patient County is different from the Hospital County for each case.
3) Stratifiers:
• Stratifications can be done three (3) levels deep. The available stratifiers are:
o Payer: Financial class (ie, how the charges were paid) If this stratifier is selected, "Select Payer (s)?" checkbox will give the user the ability to restrict output to one or more Payer types. Possible values:
• Medicare • Medicaid • Private incl. HMO • Self-Pay • No charge/Charity • Other.
o Zip Code: Zip Code where the patient resides in. If this stratifier is selected, "Select ZipCode(s)?" checkbox will give the user the ability to restrict output to one or more zip codes or zip code group.
o Age Group: The age group of the patient. Note that PQI-9 (Low birth weight) is only concerned with newborns/neonates. The age groups available are:
• 18 – 39 • 40 – 64 • 65+.
o Hospital: The hospital of each case. If this stratifier is selected, "Select Hospital(s)?" checkbox will give the user the ability to restrict output to one or more hospitals or choose a hospital group.
o Gender: The gender of the patient. Possible values: • Male • Female.
o Race: The race/ethnicity of the patient. Possible values: • White • Black • Hispanic • Asian/Pacific Island • Native American • Other
o Admsrc: The admission source (ie, how did the patient first enter the hospital system). Possible values:
• ER
28
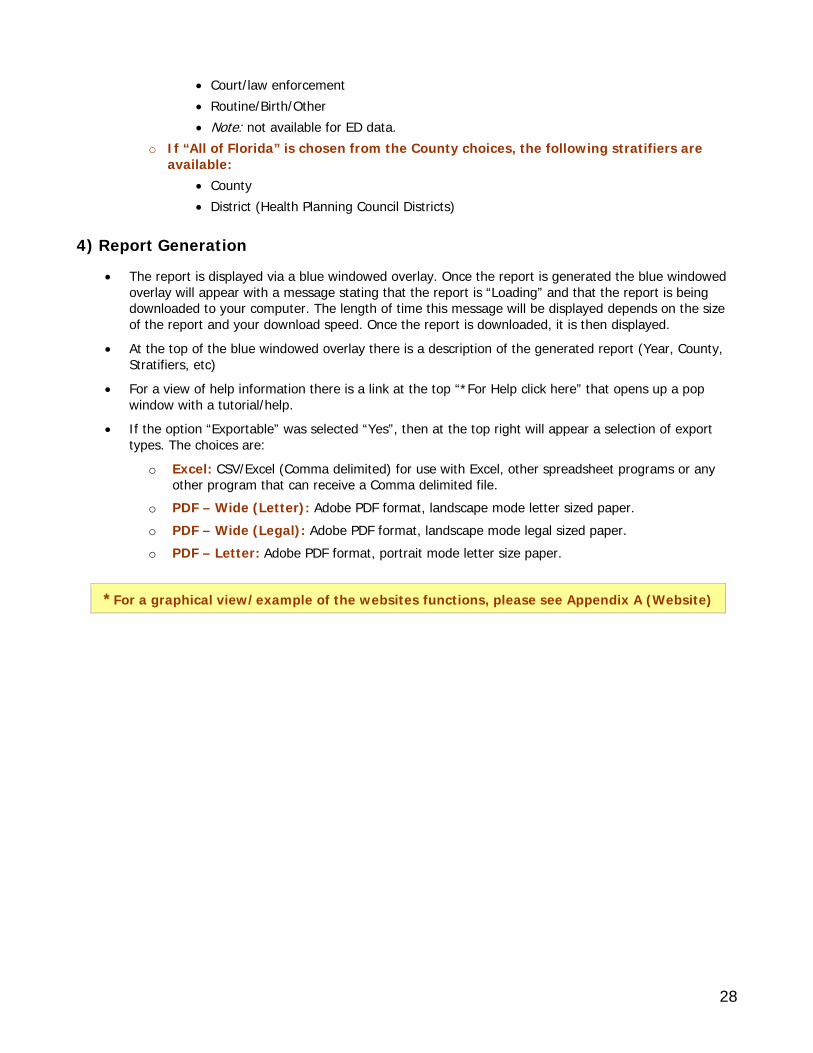
• Court/law enforcement • Routine/Birth/Other • Note: not available for ED data.
o If “All of Florida” is chosen from the County choices, the following stratifiers are available:
• County • District (Health Planning Council Districts)
4) Report Generation
• The report is displayed via a blue windowed overlay. Once the report is generated the blue windowed overlay will appear with a message stating that the report is “Loading” and that the report is being downloaded to your computer. The length of time this message will be displayed depends on the size of the report and your download speed. Once the report is downloaded, it is then displayed.
• At the top of the blue windowed overlay there is a description of the generated report (Year, County, Stratifiers, etc)
• For a view of help information there is a link at the top “*For Help click here” that opens up a pop window with a tutorial/help.
• If the option “Exportable” was selected “Yes”, then at the top right will appear a selection of export types. The choices are:
o Excel: CSV/Excel (Comma delimited) for use with Excel, other spreadsheet programs or any other program that can receive a Comma delimited file.
o PDF – Wide (Letter): Adobe PDF format, landscape mode letter sized paper. o PDF – Wide (Legal): Adobe PDF format, landscape mode legal sized paper. o PDF – Letter: Adobe PDF format, portrait mode letter size paper.
*For a graphical view/example of the websites functions, please see Appendix A (Website)
29
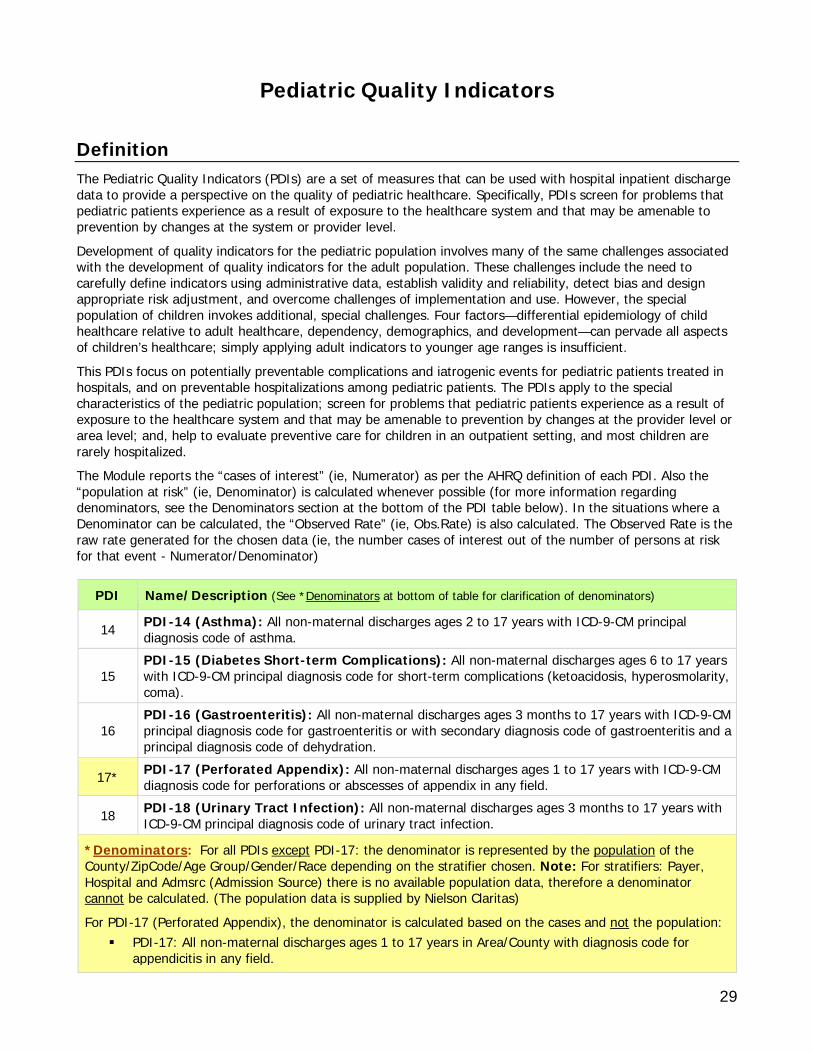
Pediatric Quality Indicators Definition The Pediatric Quality Indicators (PDIs) are a set of measures that can be used with hospital inpatient discharge data to provide a perspective on the quality of pediatric healthcare. Specifically, PDIs screen for problems that pediatric patients experience as a result of exposure to the healthcare system and that may be amenable to prevention by changes at the system or provider level.
Development of quality indicators for the pediatric population involves many of the same challenges associated with the development of quality indicators for the adult population. These challenges include the need to carefully define indicators using administrative data, establish validity and reliability, detect bias and design appropriate risk adjustment, and overcome challenges of implementation and use. However, the special population of children invokes additional, special challenges. Four factors—differential epidemiology of child healthcare relative to adult healthcare, dependency, demographics, and development—can pervade all aspects of children’s healthcare; simply applying adult indicators to younger age ranges is insufficient.
This PDIs focus on potentially preventable complications and iatrogenic events for pediatric patients treated in hospitals, and on preventable hospitalizations among pediatric patients. The PDIs apply to the special characteristics of the pediatric population; screen for problems that pediatric patients experience as a result of exposure to the healthcare system and that may be amenable to prevention by changes at the provider level or area level; and, help to evaluate preventive care for children in an outpatient setting, and most children are rarely hospitalized. The Module reports the “cases of interest” (ie, Numerator) as per the AHRQ definition of each PDI. Also the “population at risk” (ie, Denominator) is calculated whenever possible (for more information regarding denominators, see the Denominators section at the bottom of the PDI table below). In the situations where a Denominator can be calculated, the “Observed Rate” (ie, Obs.Rate) is also calculated. The Observed Rate is the raw rate generated for the chosen data (ie, the number cases of interest out of the number of persons at risk for that event - Numerator/Denominator)
PDI Name/Description (See *Denominators at bottom of table for clarification of denominators)
14 PDI-14 (Asthma): All non-maternal discharges ages 2 to 17 years with ICD-9-CM principal diagnosis code of asthma.
15 PDI-15 (Diabetes Short-term Complications): All non-maternal discharges ages 6 to 17 years with ICD-9-CM principal diagnosis code for short-term complications (ketoacidosis, hyperosmolarity, coma).
16 PDI-16 (Gastroenteritis): All non-maternal discharges ages 3 months to 17 years with ICD-9-CM principal diagnosis code for gastroenteritis or with secondary diagnosis code of gastroenteritis and a principal diagnosis code of dehydration.
17* PDI-17 (Perforated Appendix): All non-maternal discharges ages 1 to 17 years with ICD-9-CM diagnosis code for perforations or abscesses of appendix in any field.
18 PDI-18 (Urinary Tract Infection): All non-maternal discharges ages 3 months to 17 years with ICD-9-CM principal diagnosis code of urinary tract infection.
*Denominators: For all PDIs except PDI-17: the denominator is represented by the population of the County/ZipCode/Age Group/Gender/Race depending on the stratifier chosen. Note: For stratifiers: Payer, Hospital and Admsrc (Admission Source) there is no available population data, therefore a denominator cannot be calculated. (The population data is supplied by Nielson Claritas)
For PDI-17 (Perforated Appendix), the denominator is calculated based on the cases and not the population: PDI-17: All non-maternal discharges ages 1 to 17 years in Area/County with diagnosis code for
appendicitis in any field.
30
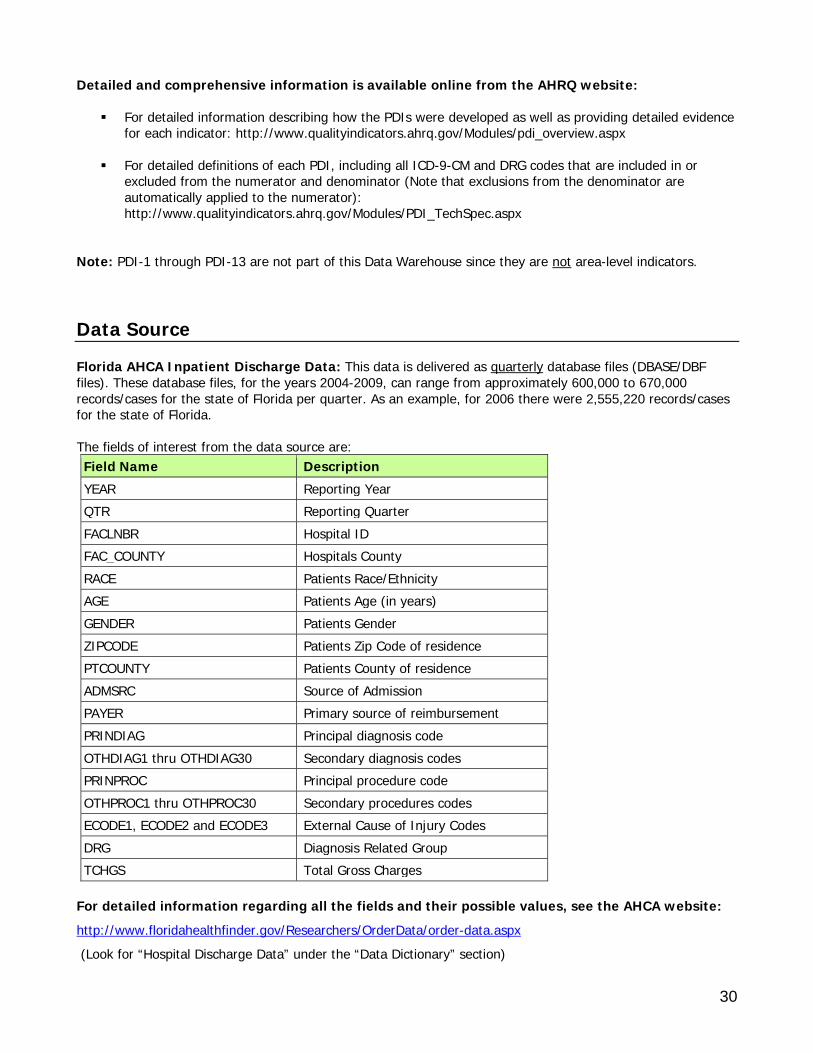
Detailed and comprehensive information is available online from the AHRQ website:
For detailed information describing how the PDIs were developed as well as providing detailed evidence for each indicator: http://www.qualityindicators.ahrq.gov/Modules/pdi_overview.aspx
For detailed definitions of each PDI, including all ICD-9-CM and DRG codes that are included in or
excluded from the numerator and denominator (Note that exclusions from the denominator are automatically applied to the numerator): http://www.qualityindicators.ahrq.gov/Modules/PDI_TechSpec.aspx
Note: PDI-1 through PDI-13 are not part of this Data Warehouse since they are not area-level indicators. Data Source Florida AHCA Inpatient Discharge Data: This data is delivered as quarterly database files (DBASE/DBF files). These database files, for the years 2004-2009, can range from approximately 600,000 to 670,000 records/cases for the state of Florida per quarter. As an example, for 2006 there were 2,555,220 records/cases for the state of Florida. The fields of interest from the data source are: Field Name Description YEAR Reporting Year QTR Reporting Quarter FACLNBR Hospital ID FAC_COUNTY Hospitals County RACE Patients Race/Ethnicity AGE Patients Age (in years) GENDER Patients Gender ZIPCODE Patients Zip Code of residence PTCOUNTY Patients County of residence ADMSRC Source of Admission PAYER Primary source of reimbursement PRINDIAG Principal diagnosis code OTHDIAG1 thru OTHDIAG30 Secondary diagnosis codes PRINPROC Principal procedure code OTHPROC1 thru OTHPROC30 Secondary procedures codes ECODE1, ECODE2 and ECODE3 External Cause of Injury Codes DRG Diagnosis Related Group TCHGS Total Gross Charges
For detailed information regarding all the fields and their possible values, see the AHCA website:
http://www.floridahealthfinder.gov/Researchers/OrderData/order-data.aspx (Look for “Hospital Discharge Data” under the “Data Dictionary” section)
31
Data Processing The Inpatient Discharge Data DBASE/DBF data source files have to be processed before analyzing can be done. The procedure is such: (The record/case exclusions are done here.)
4. Convert each DBF file to CSV (comma delimited) file. While converting: a. Cases for which the Patient County (PTCOUNTY) is equal to “99” are removed. PTCOUNTY = 99
describe out of state/unknown county of residence of the patient. b. Cases for which the Gender is unknown or not specified are removed. c. Cases that do not reflect the correct Year/Quarter of the input data source are removed.
5. Import CSV file into temporary table (datasourcePDI).
6. Data transformation and cleansing is now done on the imported data in the temporary table. (Note: Some of this data transformation is done to match the AHRQ PQI software. We use this program to help validate the conversion/analysis)
a. Convert Patient County (PTCOUNTY) and Hospital County (FAC_COUNTY) from AHCA county code to full FIPS County code (Federal Information Processing Standard).
b. Convert AHCA Race code to AHRQ PDI software Race codes* c. Convert AHCA Payer code to AHRQ PDI software Payer codes* d. Convert AHCA ADMSRC code to AHRQ PDI software Admsrc codes* e. The periods/decimal points are removed from all Ecode, Diagnosis and Procedure codes f. Once transformation and cleaning is done, the temporary table is exported to a CSV file that is
imported into the AHRQ PDI software to analyze and run a basic report to use as validation.
*For a table of the actual code conversions see Appendix C (Code Translations) Data Analysis Once the Data Processing is complete, the data in the temporary table (datasourcePDI) is ready to be analyzed. The procedure is such:
4. The Year and Quarter are confirmed for the source data.
5. The queries* are run for all 5 PDIs, populating the appropriate Analyzed Data Table. Each PDI has an assigned Analyzed Data Table (PDI_14_Num, PDI_15_Num, PDI_16_Num, etc)
a. While running the analytical queries, the system also adds a column (AGECATEGORY) and sets the “Age Category” based on the patient age.
b. For all PDIs, cases are excluded if the Admission Source shows it was a transfer from another institution/hospital.
c. For all PDIs cases are excluded if the Age is more than 17 years.
6. The front-end website is now ready to access the newly entered and analyzed data.
*To view the actual analytical queries used, please refer to Appendix D (Analytical Queries)
Note: The “Data Processing”/“Data Analysis” cycle is repeated for all Year/Quarter data source files.
32
WebSite (healthdata.brhpc.org) The website has the ability to create stratified reports based on the PDI data. 1) The basic choices on which all reports are based are:
• County o The choice “All Counties” is available. If this is selected then “extra” stratifiers are made
available in the “Stratify by” section. These “extra” stratifiers are County and District. o Individual County. (Safety Net group of hospitals is also available)
• Year o Choose multiple years for comparison by using the “Click for Multiple Years” checkbox. o Individual Year
• Quarter 2) Display Options:
• Show Charge information o Selecting “Yes” will display the total of undiscounted charges for services rendered by the
hospital for the cases on the report. The default is “No”. • Exportable
o Selecting “Yes” will allow you to export the generated report data. The two file formats supported for export are (1) CSV/Excel (Comma delimited) for use with Excel, other spreadsheet programs or any other program that can receive a Comma delimited file and (2) Adobe PDF format, suitable for printing. Un-checking this option will exclude this export ability and will display "Paging" options (ie, you can choose how many records to show per page, go directly to a page, etc. This is suitable when you don't want to export and the report is a very long report, since it significantly increases the download speed). The default is “Yes”.
• PDI 16 & 18 issue Please note that for PDI-16 (Gastroenteritis) and PDI-18 (Urinary Tract Infection) there is an issue with the AHRQ analysis requirements and the available AHCA Inpatient data.
o The AHRQ analysis requirements, for PDI-16 and PDI-18, state "All non-maternal discharges ages 3 months to 17 years" (ie, children 0-89 days of age need to be excluded). The AHCA data does not have data for the "Age in days" for records indicating an Age of zero (0). Therefore, it is not possible to exclude records of children with age 29-89 days. (0-28 days of age are excluded via a Neonate exclusion)
o Selecting "(1) Include children 29 through 89 days of age." will therefore overestimate the numerator by including records for which the age of the patient is 29 to 89 days of age.
o Selecting "(2) Exclude all children under 1 year of age." will therefore underestimate the numerator by excluding records for which the age of the patient is 90 to 364 days of age.
• Select records where (Patient & Hospital County) o Each record in the AHCA inpatient data has a Patient County and a Facility County.
Records will be included based on the following four options: o Using "Broward" County as an example: o (1) Broward County residents discharged from Broward County hospitals: Include
records for which the Patient County is Broward AND the Hospital County is Broward.
33
o (2) Broward County hospital discharges where patient is from anywhere: Include records for which the Patient County is from anywhere AND the Hospital County is Broward.
o (3) Broward County residents discharged from any Florida hospital: Include records for which the Patient County is Broward AND the Hospital County is any County in Florida.
o (4) Broward County is the Hospital County OR the Patient County: Include records for which the Patient County is Broward OR the Hospital County is Broward. (In other words, combine all the records from (2) and (3) above and remove any duplicate records.) Of interest when you want all records associated with Broward County regardless of whether it's Patient or Hospital County.
3) PDI & Stratifiers:
• Individual PDIs or “All” PDIs can be chosen (If individual PDIs are chosen then it is required to select at least one stratifier) “All” PDIs is chosen by default.
• Stratifications can be done three (3) levels deep. The available stratifiers are: o Payer: Financial class (ie, how the charges were paid) If this stratifier is selected, "Select Payer
(s)?" checkbox will give the user the ability to restrict output to one or more Payer types. Possible values:
• Medicare • Medicaid • Private incl. HMO • Self-Pay • No charge/Charity • Other.
o Zip Code: Zip Code where the patient resides in. If this stratifier is selected, "Select ZipCode(s)?" checkbox will give the user the ability to restrict output to one or more zip codes or zip code group.
o Age Group: The age group of the patient. The age groups available are: • 3 months – 4 • 2 – 4 • 5 – 9 • 10 – 14 • 15 – 17
o Hospital: The hospital of each case. If this stratifier is selected, "Select Hospital(s)?" checkbox will give the user the ability to restrict output to one or more hospitals or choose a hospital group.
o Gender: The gender of the patient. Possible values: • Male • Female.
o Race: The race/ethnicity of the patient. Possible values: • White • Black • Hispanic • Asian/Pacific Island • Native American
34
• Other o Admsrc: The admission source (ie, how did the patient first enter the hospital system). Possible
values: • ER • Court/law enforcement • Routine/Birth/Other • Note: not available for ED data.
o If “All of Florida” is chosen from the County choices, the following stratifiers are available:
• County • District (Health Planning Council Districts)
4) Report Generation
• The report is displayed via a blue windowed overlay. Once the report is generated the blue windowed overlay will appear with a message stating that the report is “Loading” and that the report is being downloaded to your computer. The length of time this message will be displayed depends on the size of the report and your download speed. Once the report is downloaded, it is then displayed.
• At the top of the blue windowed overlay there is a description of the generated report (Year, County, Stratifiers, etc)
• If the option “Exportable” was selected “Yes”, then at the top right will appear a selection of export types. The choices are:
o Excel: CSV/Excel (Comma delimited) for use with Excel, other spreadsheet programs or any other program that can receive a Comma delimited file.
o PDF – Wide (Letter): Adobe PDF format, landscape mode letter sized paper. o PDF – Wide (Legal): Adobe PDF format, landscape mode legal sized paper. o PDF – Letter: Adobe PDF format, portrait mode letter size paper.
*For a graphical view/example of the websites functions, please see Appendix A (Website)

35
Appendix A (Website – Graphical Presentation)
* We will produce multiple Graphical Presentations (of report generation) In order to facilitate adding more in the future, this has been moved to an external document: “Hospital_Inpatient_ED_Analytical_System-Graphical_Presentation.pdf”.
36
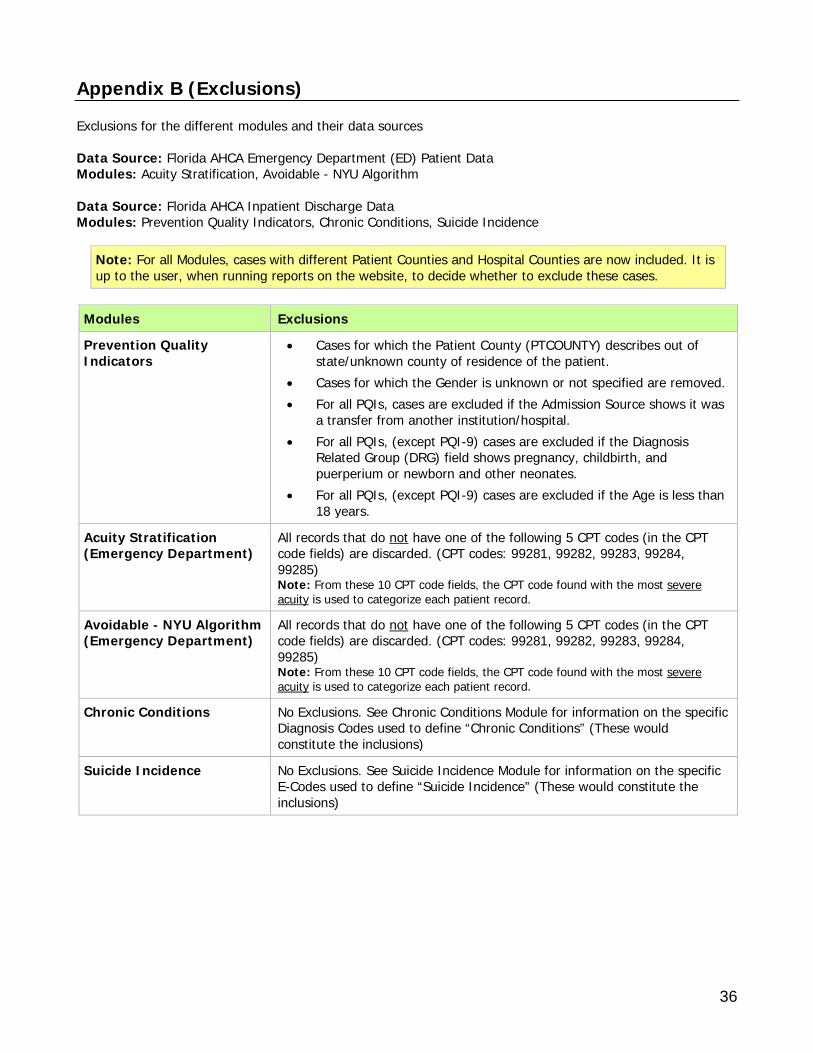
Appendix B (Exclusions) Exclusions for the different modules and their data sources Data Source: Florida AHCA Emergency Department (ED) Patient Data Modules: Acuity Stratification, Avoidable - NYU Algorithm Data Source: Florida AHCA Inpatient Discharge Data Modules: Prevention Quality Indicators, Chronic Conditions, Suicide Incidence
Note: For all Modules, cases with different Patient Counties and Hospital Counties are now included. It is up to the user, when running reports on the website, to decide whether to exclude these cases.
Modules Exclusions
Prevention Quality Indicators
• Cases for which the Patient County (PTCOUNTY) describes out of state/unknown county of residence of the patient.
• Cases for which the Gender is unknown or not specified are removed. • For all PQIs, cases are excluded if the Admission Source shows it was
a transfer from another institution/hospital. • For all PQIs, (except PQI-9) cases are excluded if the Diagnosis
Related Group (DRG) field shows pregnancy, childbirth, and puerperium or newborn and other neonates.
• For all PQIs, (except PQI-9) cases are excluded if the Age is less than 18 years.
Acuity Stratification (Emergency Department)
All records that do not have one of the following 5 CPT codes (in the CPT code fields) are discarded. (CPT codes: 99281, 99282, 99283, 99284, 99285) Note: From these 10 CPT code fields, the CPT code found with the most severe acuity is used to categorize each patient record.
Avoidable - NYU Algorithm (Emergency Department)
All records that do not have one of the following 5 CPT codes (in the CPT code fields) are discarded. (CPT codes: 99281, 99282, 99283, 99284, 99285) Note: From these 10 CPT code fields, the CPT code found with the most severe acuity is used to categorize each patient record.
Chronic Conditions No Exclusions. See Chronic Conditions Module for information on the specific Diagnosis Codes used to define “Chronic Conditions” (These would constitute the inclusions)
Suicide Incidence No Exclusions. See Suicide Incidence Module for information on the specific E-Codes used to define “Suicide Incidence” (These would constitute the inclusions)
37
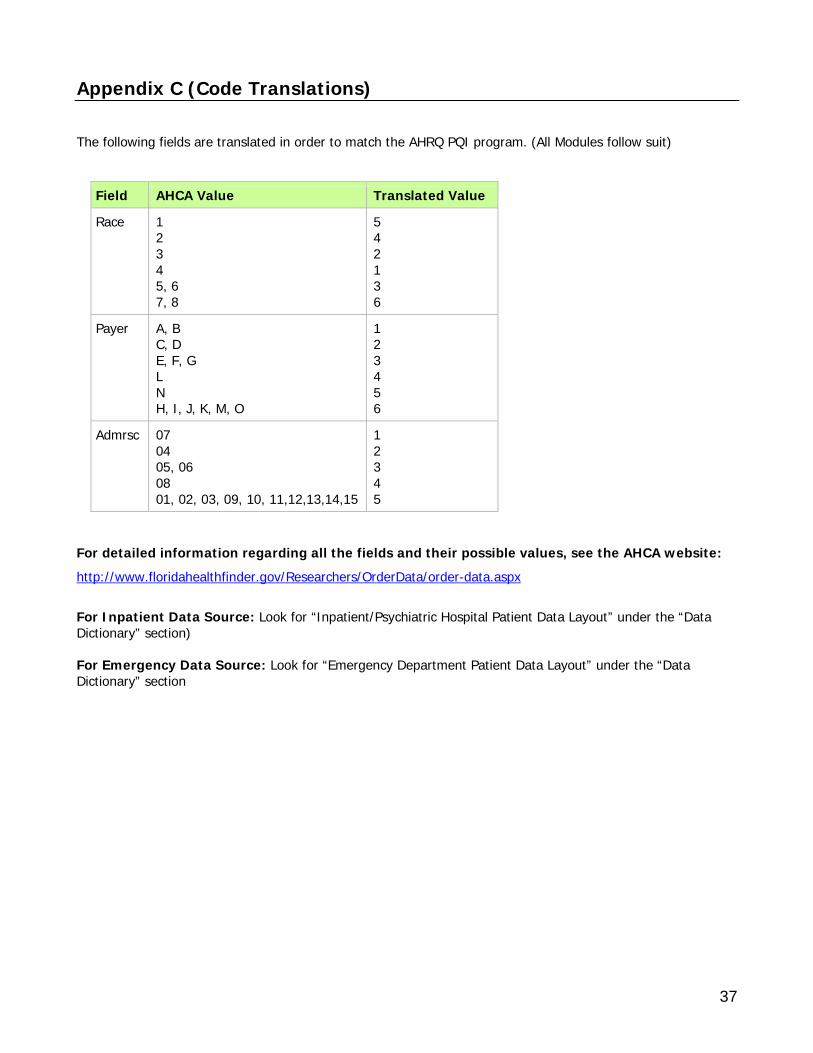
Appendix C (Code Translations) The following fields are translated in order to match the AHRQ PQI program. (All Modules follow suit)
Field AHCA Value Translated Value
Race 1 2 3 4 5, 6 7, 8
5 4 2 1 3 6
Payer A, B C, D E, F, G L N H, I, J, K, M, O
1 2 3 4 5 6
Admrsc 07 04 05, 06 08 01, 02, 03, 09, 10, 11,12,13,14,15
1 2 3 4 5
For detailed information regarding all the fields and their possible values, see the AHCA website: http://www.floridahealthfinder.gov/Researchers/OrderData/order-data.aspx
For Inpatient Data Source: Look for “Inpatient/Psychiatric Hospital Patient Data Layout” under the “Data Dictionary” section) For Emergency Data Source: Look for “Emergency Department Patient Data Layout” under the “Data Dictionary” section
38
Appendix D (Analytical Queries)
* Due to the “physical” size of the queries and the resulting large number of pages, this has been moved to an external document: “Hospital_Inpatient_ED_Analytical_System-Analytical_Queries.pdf”.
39
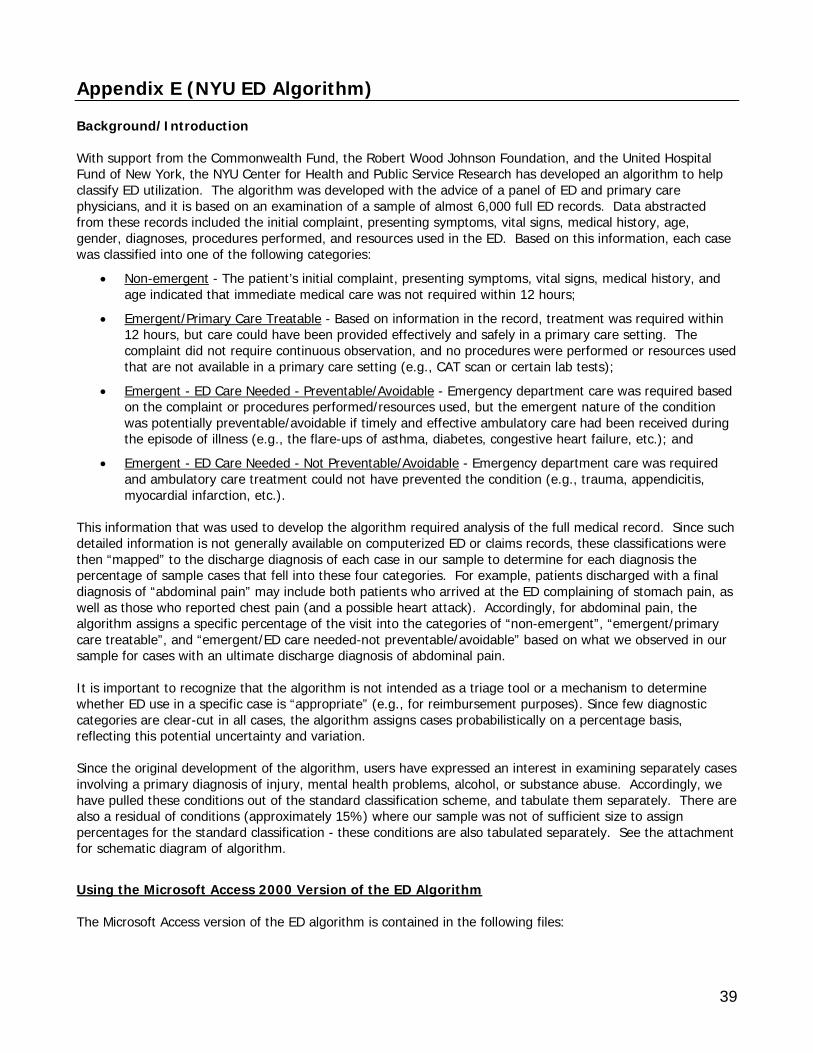
Appendix E (NYU ED Algorithm) Background/Introduction With support from the Commonwealth Fund, the Robert Wood Johnson Foundation, and the United Hospital Fund of New York, the NYU Center for Health and Public Service Research has developed an algorithm to help classify ED utilization. The algorithm was developed with the advice of a panel of ED and primary care physicians, and it is based on an examination of a sample of almost 6,000 full ED records. Data abstracted from these records included the initial complaint, presenting symptoms, vital signs, medical history, age, gender, diagnoses, procedures performed, and resources used in the ED. Based on this information, each case was classified into one of the following categories:
• Non-emergent - The patient’s initial complaint, presenting symptoms, vital signs, medical history, and age indicated that immediate medical care was not required within 12 hours;
• Emergent/Primary Care Treatable - Based on information in the record, treatment was required within 12 hours, but care could have been provided effectively and safely in a primary care setting. The complaint did not require continuous observation, and no procedures were performed or resources used that are not available in a primary care setting (e.g., CAT scan or certain lab tests);
• Emergent - ED Care Needed - Preventable/Avoidable - Emergency department care was required based on the complaint or procedures performed/resources used, but the emergent nature of the condition was potentially preventable/avoidable if timely and effective ambulatory care had been received during the episode of illness (e.g., the flare-ups of asthma, diabetes, congestive heart failure, etc.); and
• Emergent - ED Care Needed - Not Preventable/Avoidable - Emergency department care was required and ambulatory care treatment could not have prevented the condition (e.g., trauma, appendicitis, myocardial infarction, etc.).
This information that was used to develop the algorithm required analysis of the full medical record. Since such detailed information is not generally available on computerized ED or claims records, these classifications were then “mapped” to the discharge diagnosis of each case in our sample to determine for each diagnosis the percentage of sample cases that fell into these four categories. For example, patients discharged with a final diagnosis of “abdominal pain” may include both patients who arrived at the ED complaining of stomach pain, as well as those who reported chest pain (and a possible heart attack). Accordingly, for abdominal pain, the algorithm assigns a specific percentage of the visit into the categories of “non-emergent”, “emergent/primary care treatable”, and “emergent/ED care needed-not preventable/avoidable” based on what we observed in our sample for cases with an ultimate discharge diagnosis of abdominal pain. It is important to recognize that the algorithm is not intended as a triage tool or a mechanism to determine whether ED use in a specific case is “appropriate” (e.g., for reimbursement purposes). Since few diagnostic categories are clear-cut in all cases, the algorithm assigns cases probabilistically on a percentage basis, reflecting this potential uncertainty and variation. Since the original development of the algorithm, users have expressed an interest in examining separately cases involving a primary diagnosis of injury, mental health problems, alcohol, or substance abuse. Accordingly, we have pulled these conditions out of the standard classification scheme, and tabulate them separately. There are also a residual of conditions (approximately 15%) where our sample was not of sufficient size to assign percentages for the standard classification - these conditions are also tabulated separately. See the attachment for schematic diagram of algorithm.
Using the Microsoft Access 2000 Version of the ED Algorithm The Microsoft Access version of the ED algorithm is contained in the following files:
40
• “NYU ED Algorithm X.X.MDB" (X.X is the version number – this file may also have an .MDE extension)- This is the application that will run under Microsoft Access 2000. (It may also run under other versions of Access, but it has only been tested using Access 2000.);
• "NYUED.HLP" – Help file for the above application. Place the two files listed above in the same directory on your hard drive, open your copy of Microsoft Access, Go to your File menu, select Open, navigate to the .MDB or .MDE file listed above, and open it. All further instructions can then be accessed by pressing F1 on your keyboard. Context-specific help can be accessed after selected each menu choice, EXCEPT for the "Import a Dataset" menu choice. To access help for that function, please press F1 when viewing the main menu, and then select "Import a Dataset" from Help Table of Contents. This version of the ED algorithm requires that your ED dataset be available in ASCII (text), Access, .DBF, or Excel format. (It's unlikely that your data will be in Excel format, unless you have relatively few encounter records, since the Excel format can only contain a limited number of records.) The advantage of the Access version of the algorithm is that, in addition to producing a microdata (record-level) file (see below), it will also produce spreadsheets with summary records aggregated by zip code, insurance status, age and gender groupings, and other classification variables if available. Analyzing Microdata (Record-Level) Output of all Three Versions of the ED Algorithm All three versions of the ED algorithm programming – the Access, SAS, and SPSS versions – will produce a microdata (record-level) file, with one record for each encounter record in your ED database. (The Access version additionally produces spreadsheets with summary records aggregated by zip code, insurance status, age and gender groupings, and other classification variables if available.) The output microdata file will simply have a new set of variables in addition to your original data set variables. The names of the new variables are:
• ne = “Non-emergent”
• epct = “Emergent/Primary Care Treatable”
• edcnpa = “Emergent - ED Care Needed - Preventable/Avoidable”
• edcnnpa = “Emergent - ED Care Needed - Not Preventable/Avoidable”
• injury = “Injury principal diagnoses”
• psych = “Mental health principal diagnoses”
• alcohol = “Alcohol-related health principal diagnoses”
• drug = “Drug-related health principal diagnoses (excluding alcohol)”
• unclassified = “Not classified - not in one of the above categories” For each ED encounter, the numbers in the new fields represent the relative percentage of cases for that diagnosis falling into the various classification categories. For example, in the case of urinary tract infections (ICD-9-CM code 599.0), each case is assigned 66% “non-emergent”, 17% “emergent/primary care treatable”, and 17% “emergent - ED care needed - preventable/avoidable”. The sum of the values in the new data fields will always total 1, and the injury, psych, alcohol, drug, and unclassified fields are always binary (equal to 1 or 0). To profile a hospital, payor group, zip code area, patient type, etc., simply aggregate these values to find the total percentage of cases falling into each of the categories. For more information on how these categories were constructed, please consult the articles on our website, at http://www.nyu.edu/wagner/chpsr/index.html?p=62
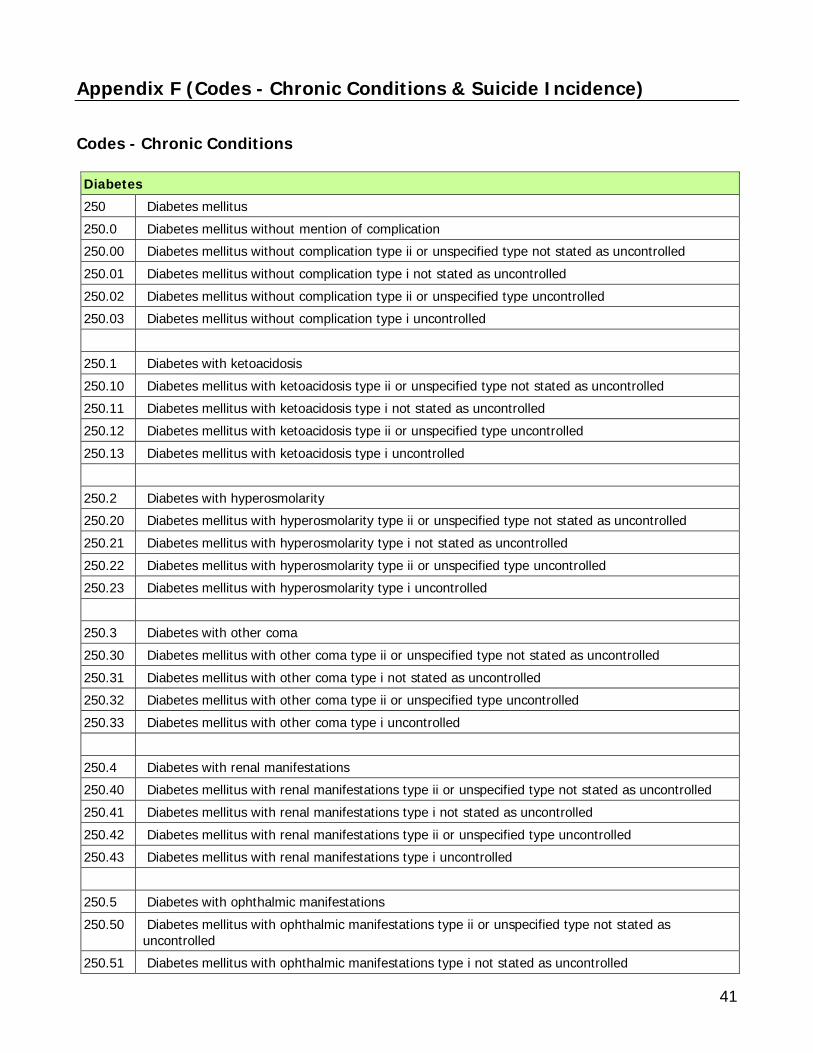
41
Appendix F (Codes - Chronic Conditions & Suicide Incidence) Codes - Chronic Conditions Diabetes 250 Diabetes mellitus 250.0 Diabetes mellitus without mention of complication 250.00 Diabetes mellitus without complication type ii or unspecified type not stated as uncontrolled 250.01 Diabetes mellitus without complication type i not stated as uncontrolled 250.02 Diabetes mellitus without complication type ii or unspecified type uncontrolled 250.03 Diabetes mellitus without complication type i uncontrolled 250.1 Diabetes with ketoacidosis 250.10 Diabetes mellitus with ketoacidosis type ii or unspecified type not stated as uncontrolled 250.11 Diabetes mellitus with ketoacidosis type i not stated as uncontrolled 250.12 Diabetes mellitus with ketoacidosis type ii or unspecified type uncontrolled 250.13 Diabetes mellitus with ketoacidosis type i uncontrolled 250.2 Diabetes with hyperosmolarity 250.20 Diabetes mellitus with hyperosmolarity type ii or unspecified type not stated as uncontrolled 250.21 Diabetes mellitus with hyperosmolarity type i not stated as uncontrolled 250.22 Diabetes mellitus with hyperosmolarity type ii or unspecified type uncontrolled 250.23 Diabetes mellitus with hyperosmolarity type i uncontrolled 250.3 Diabetes with other coma 250.30 Diabetes mellitus with other coma type ii or unspecified type not stated as uncontrolled 250.31 Diabetes mellitus with other coma type i not stated as uncontrolled 250.32 Diabetes mellitus with other coma type ii or unspecified type uncontrolled 250.33 Diabetes mellitus with other coma type i uncontrolled 250.4 Diabetes with renal manifestations 250.40 Diabetes mellitus with renal manifestations type ii or unspecified type not stated as uncontrolled 250.41 Diabetes mellitus with renal manifestations type i not stated as uncontrolled 250.42 Diabetes mellitus with renal manifestations type ii or unspecified type uncontrolled 250.43 Diabetes mellitus with renal manifestations type i uncontrolled 250.5 Diabetes with ophthalmic manifestations 250.50 Diabetes mellitus with ophthalmic manifestations type ii or unspecified type not stated as
uncontrolled 250.51 Diabetes mellitus with ophthalmic manifestations type i not stated as uncontrolled
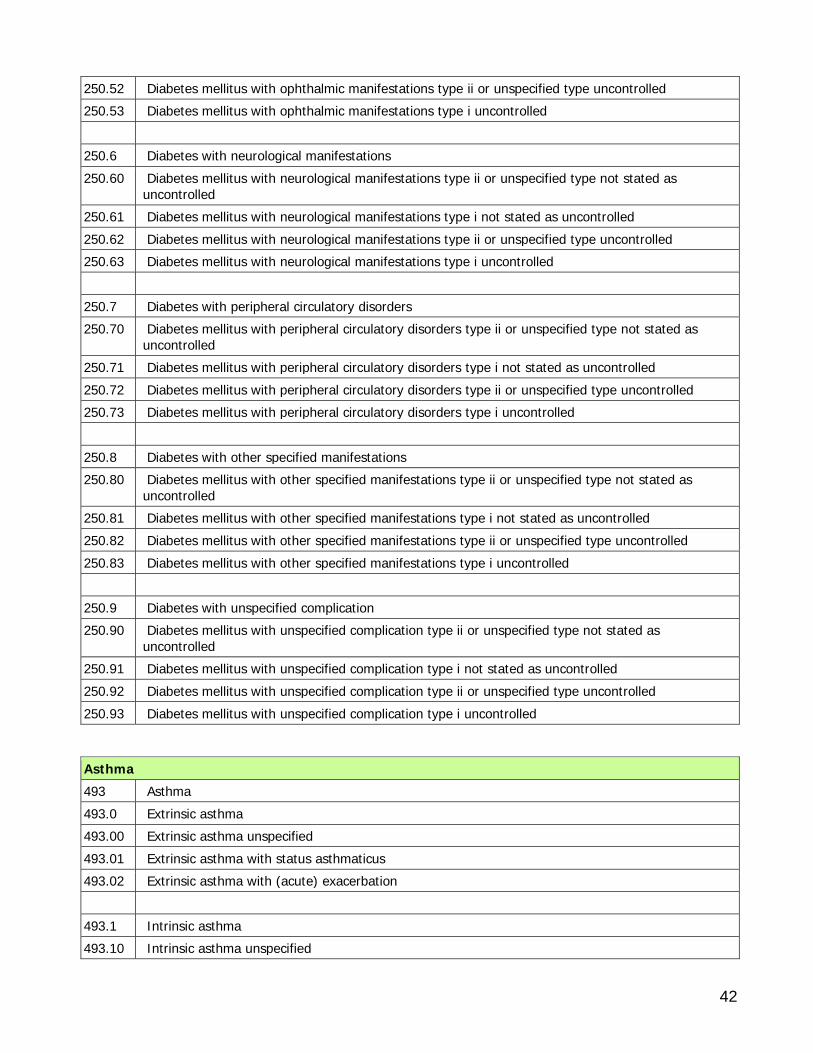
42
250.52 Diabetes mellitus with ophthalmic manifestations type ii or unspecified type uncontrolled 250.53 Diabetes mellitus with ophthalmic manifestations type i uncontrolled 250.6 Diabetes with neurological manifestations 250.60 Diabetes mellitus with neurological manifestations type ii or unspecified type not stated as
uncontrolled 250.61 Diabetes mellitus with neurological manifestations type i not stated as uncontrolled 250.62 Diabetes mellitus with neurological manifestations type ii or unspecified type uncontrolled 250.63 Diabetes mellitus with neurological manifestations type i uncontrolled 250.7 Diabetes with peripheral circulatory disorders 250.70 Diabetes mellitus with peripheral circulatory disorders type ii or unspecified type not stated as
uncontrolled 250.71 Diabetes mellitus with peripheral circulatory disorders type i not stated as uncontrolled 250.72 Diabetes mellitus with peripheral circulatory disorders type ii or unspecified type uncontrolled 250.73 Diabetes mellitus with peripheral circulatory disorders type i uncontrolled 250.8 Diabetes with other specified manifestations 250.80 Diabetes mellitus with other specified manifestations type ii or unspecified type not stated as
uncontrolled 250.81 Diabetes mellitus with other specified manifestations type i not stated as uncontrolled 250.82 Diabetes mellitus with other specified manifestations type ii or unspecified type uncontrolled 250.83 Diabetes mellitus with other specified manifestations type i uncontrolled 250.9 Diabetes with unspecified complication 250.90 Diabetes mellitus with unspecified complication type ii or unspecified type not stated as
uncontrolled 250.91 Diabetes mellitus with unspecified complication type i not stated as uncontrolled 250.92 Diabetes mellitus with unspecified complication type ii or unspecified type uncontrolled 250.93 Diabetes mellitus with unspecified complication type i uncontrolled
Asthma 493 Asthma 493.0 Extrinsic asthma 493.00 Extrinsic asthma unspecified 493.01 Extrinsic asthma with status asthmaticus 493.02 Extrinsic asthma with (acute) exacerbation 493.1 Intrinsic asthma 493.10 Intrinsic asthma unspecified
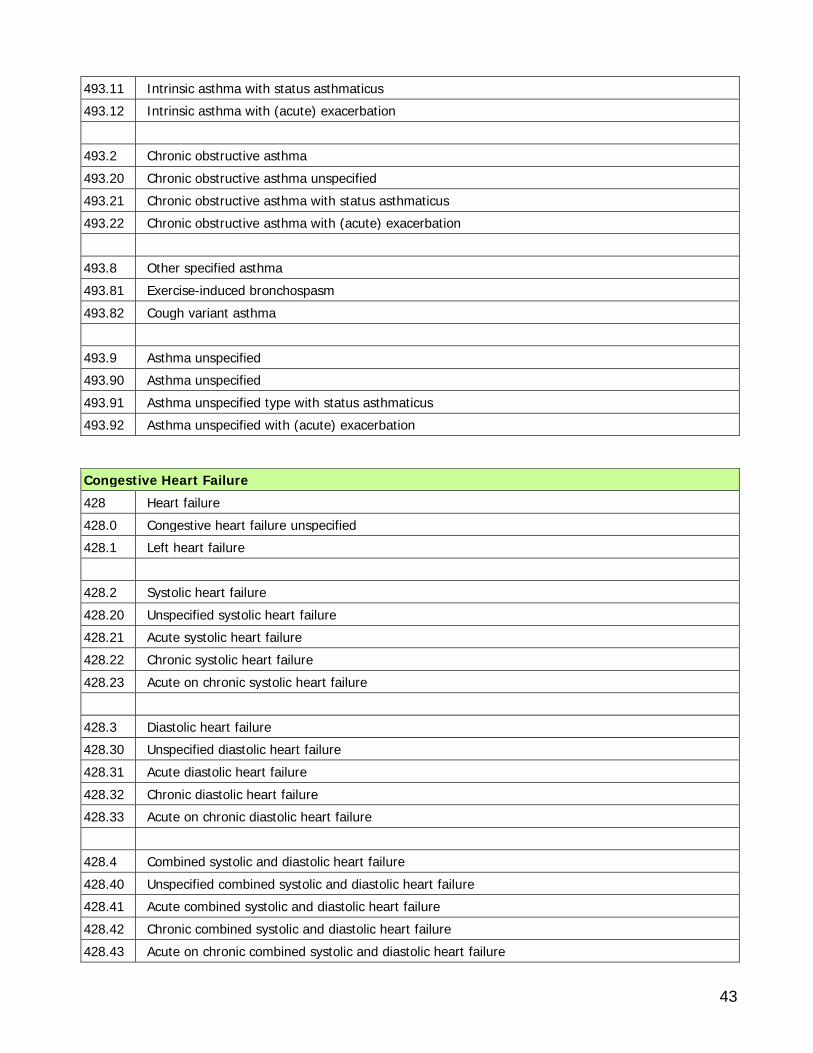
43
493.11 Intrinsic asthma with status asthmaticus 493.12 Intrinsic asthma with (acute) exacerbation 493.2 Chronic obstructive asthma 493.20 Chronic obstructive asthma unspecified 493.21 Chronic obstructive asthma with status asthmaticus 493.22 Chronic obstructive asthma with (acute) exacerbation 493.8 Other specified asthma 493.81 Exercise-induced bronchospasm 493.82 Cough variant asthma 493.9 Asthma unspecified 493.90 Asthma unspecified 493.91 Asthma unspecified type with status asthmaticus 493.92 Asthma unspecified with (acute) exacerbation
Congestive Heart Failure 428 Heart failure 428.0 Congestive heart failure unspecified 428.1 Left heart failure 428.2 Systolic heart failure 428.20 Unspecified systolic heart failure 428.21 Acute systolic heart failure 428.22 Chronic systolic heart failure 428.23 Acute on chronic systolic heart failure 428.3 Diastolic heart failure 428.30 Unspecified diastolic heart failure 428.31 Acute diastolic heart failure 428.32 Chronic diastolic heart failure 428.33 Acute on chronic diastolic heart failure 428.4 Combined systolic and diastolic heart failure 428.40 Unspecified combined systolic and diastolic heart failure 428.41 Acute combined systolic and diastolic heart failure 428.42 Chronic combined systolic and diastolic heart failure 428.43 Acute on chronic combined systolic and diastolic heart failure
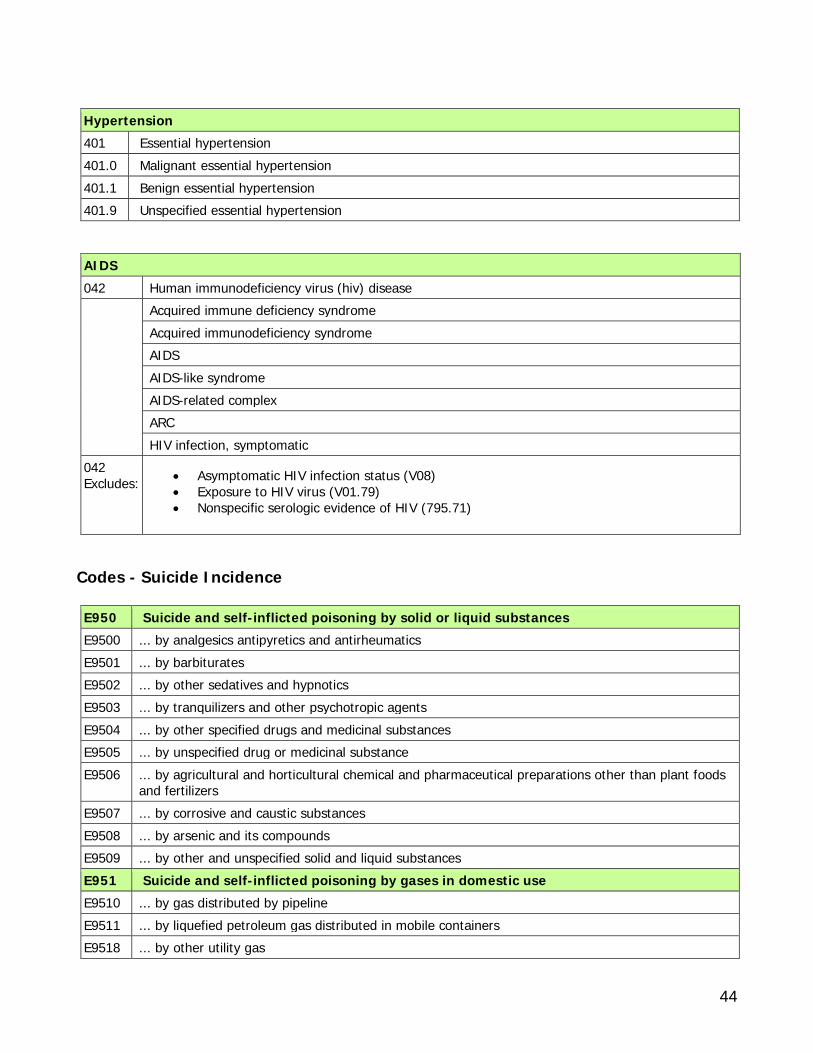
44
Hypertension 401 Essential hypertension 401.0 Malignant essential hypertension 401.1 Benign essential hypertension 401.9 Unspecified essential hypertension
AIDS 042 Human immunodeficiency virus (hiv) disease Acquired immune deficiency syndrome
Acquired immunodeficiency syndrome AIDS AIDS-like syndrome AIDS-related complex ARC HIV infection, symptomatic
042 Excludes:
• Asymptomatic HIV infection status (V08) • Exposure to HIV virus (V01.79) • Nonspecific serologic evidence of HIV (795.71)
Codes - Suicide Incidence E950 Suicide and self-inflicted poisoning by solid or liquid substances E9500 ... by analgesics antipyretics and antirheumatics E9501 ... by barbiturates E9502 ... by other sedatives and hypnotics E9503 ... by tranquilizers and other psychotropic agents E9504 ... by other specified drugs and medicinal substances E9505 ... by unspecified drug or medicinal substance E9506 ... by agricultural and horticultural chemical and pharmaceutical preparations other than plant foods
and fertilizers E9507 ... by corrosive and caustic substances E9508 ... by arsenic and its compounds E9509 ... by other and unspecified solid and liquid substances E951 Suicide and self-inflicted poisoning by gases in domestic use E9510 ... by gas distributed by pipeline E9511 ... by liquefied petroleum gas distributed in mobile containers E9518 ... by other utility gas
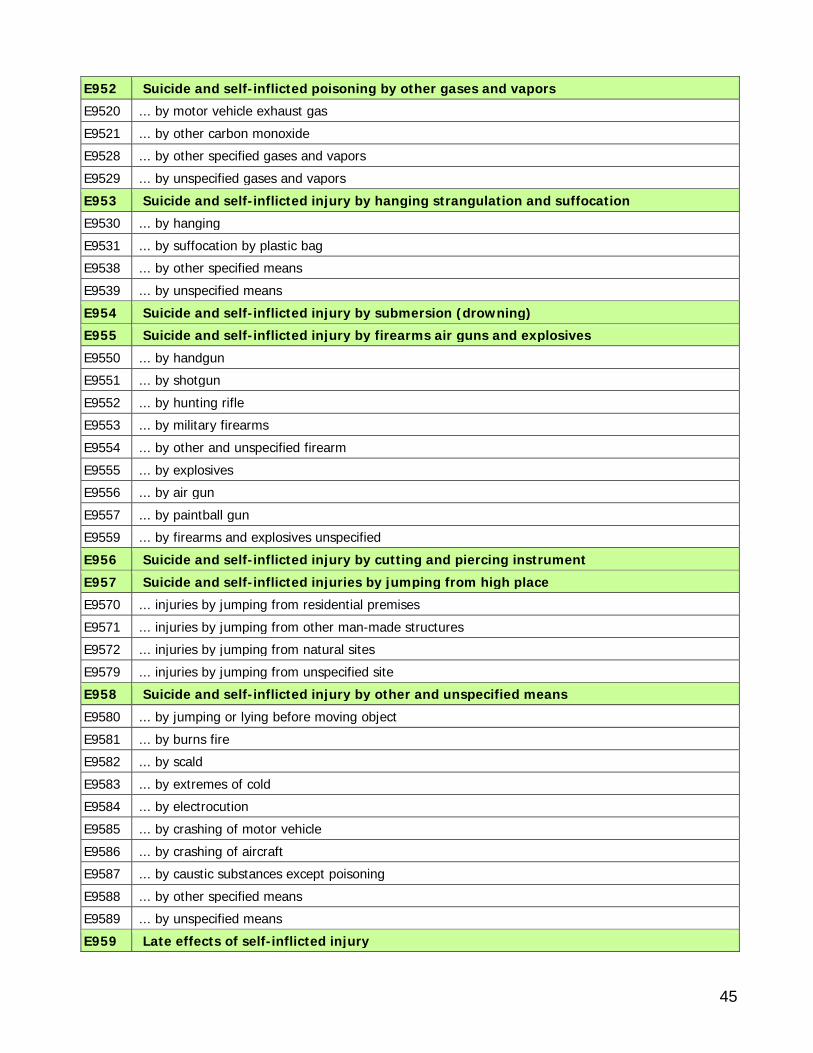
45
E952 Suicide and self-inflicted poisoning by other gases and vapors E9520 ... by motor vehicle exhaust gas E9521 ... by other carbon monoxide E9528 ... by other specified gases and vapors E9529 ... by unspecified gases and vapors E953 Suicide and self-inflicted injury by hanging strangulation and suffocation E9530 ... by hanging E9531 ... by suffocation by plastic bag E9538 ... by other specified means E9539 ... by unspecified means E954 Suicide and self-inflicted injury by submersion (drowning) E955 Suicide and self-inflicted injury by firearms air guns and explosives E9550 ... by handgun E9551 ... by shotgun E9552 ... by hunting rifle E9553 ... by military firearms E9554 ... by other and unspecified firearm E9555 ... by explosives E9556 ... by air gun E9557 ... by paintball gun E9559 ... by firearms and explosives unspecified E956 Suicide and self-inflicted injury by cutting and piercing instrument E957 Suicide and self-inflicted injuries by jumping from high place E9570 ... injuries by jumping from residential premises E9571 ... injuries by jumping from other man-made structures E9572 ... injuries by jumping from natural sites E9579 ... injuries by jumping from unspecified site E958 Suicide and self-inflicted injury by other and unspecified means E9580 ... by jumping or lying before moving object E9581 ... by burns fire E9582 ... by scald E9583 ... by extremes of cold E9584 ... by electrocution E9585 ... by crashing of motor vehicle E9586 ... by crashing of aircraft E9587 ... by caustic substances except poisoning E9588 ... by other specified means E9589 ... by unspecified means E959 Late effects of self-inflicted injury
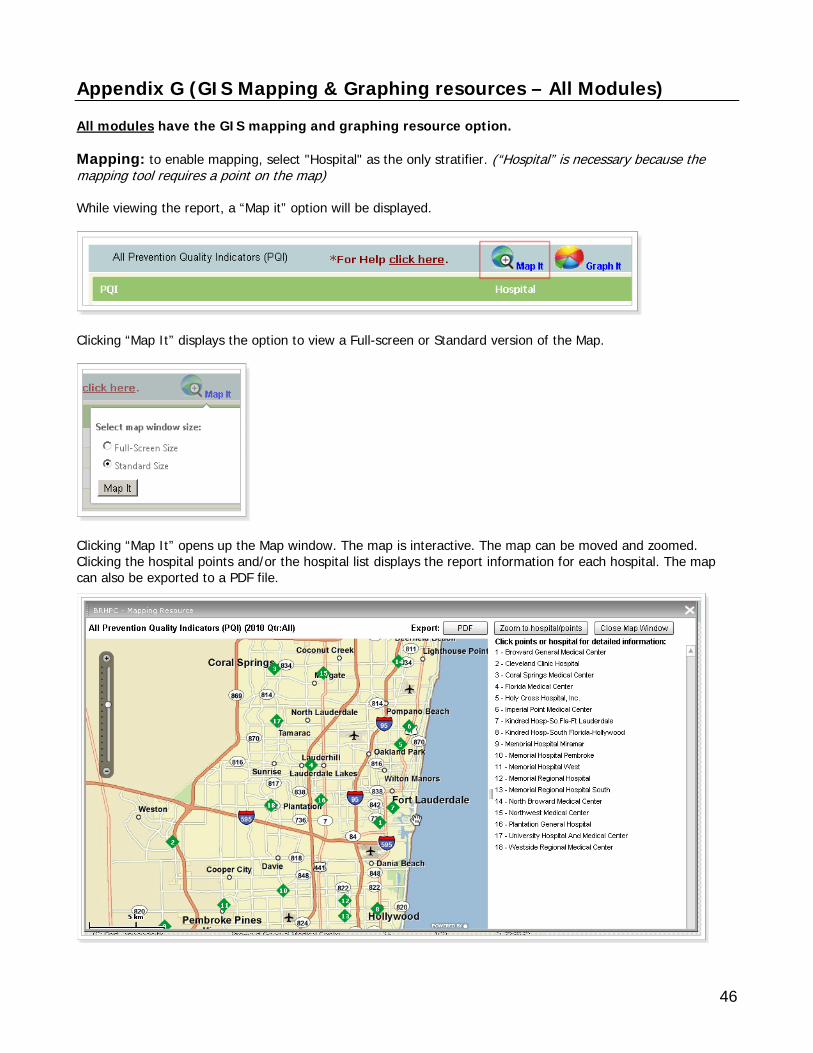
46
Appendix G (GIS Mapping & Graphing resources – All Modules) All modules have the GIS mapping and graphing resource option. Mapping: to enable mapping, select "Hospital" as the only stratifier. (“Hospital” is necessary because the mapping tool requires a point on the map) While viewing the report, a “Map it” option will be displayed.
Clicking “Map It” displays the option to view a Full-screen or Standard version of the Map.
Clicking “Map It” opens up the Map window. The map is interactive. The map can be moved and zoomed. Clicking the hospital points and/or the hospital list displays the report information for each hospital. The map can also be exported to a PDF file.
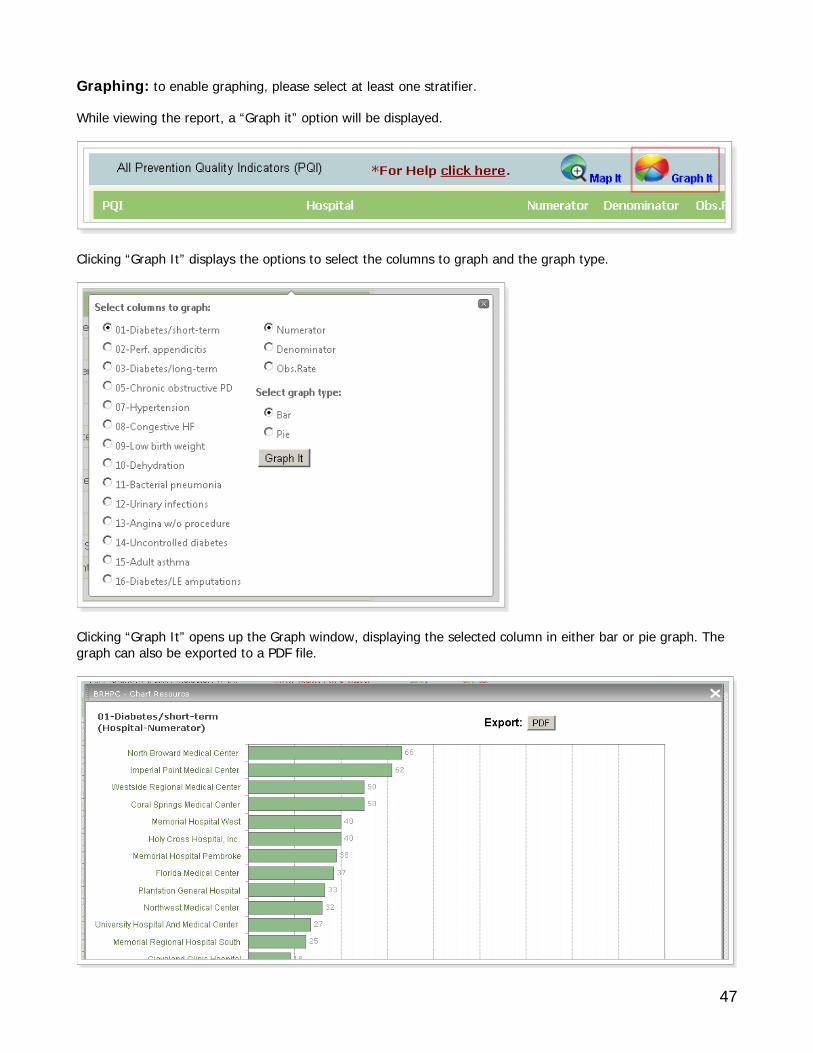
47
Graphing: to enable graphing, please select at least one stratifier. While viewing the report, a “Graph it” option will be displayed.
Clicking “Graph It” displays the options to select the columns to graph and the graph type.
Clicking “Graph It” opens up the Graph window, displaying the selected column in either bar or pie graph. The graph can also be exported to a PDF file.