Embed Size (px)
Citation preview
1 | P a g e
Cardiophysiology Danil Hammoudi.MD
Heart HORMONES Natriuretic Peptides In response to a rise in blood pressure, the heart releases two peptides:
• A-type Natriuretic Peptide (ANP)
This hormone of 28 amino acids is released from stretched atria (hence the "A").
• B-type Natriuretic Peptide (BNP)
This hormone (29 amino acids) is released from the ventricles. (It was first discovered in brain tissue; hence the "B".)
Both hormones lower blood pressure by
• relaxing arterioles • inhibiting the secretion of renin and aldosterone • inhibiting the reabsorption of sodium ions by the kidneys.
The latter two effects reduce the reabsorption of water by the kidneys. So the volume of urine increases as does the amount of sodium excreted in it. The net effect of these actions is to reduce blood pressure by reducing the volume of blood in the circulatory system.
These effects give ANP and BNP their name (natrium = sodium; uresis = urinate).
Heart Valves Heart valves ensure unidirectional blood flow through the heart Atrioventricular (AV) valves lie between the atria and the ventricles AV valves prevent backflow into the atria when ventricles contract Chordae tendineae anchor AV valves to papillary muscles Aortic semilunar valve lies between the left ventricle and the aorta Pulmonary semilunar valve lies between the right ventricle and pulmonary trunk Semilunar valves prevent backflow of blood into the ventricles
Atrioventricular Valve Function
The pressure that causes the A-V valves to close and that causes the semilunar valves to open is generated by the contraction of the heart muscle. I have tried to represent this in the following table:
Without pressure With pressure

2 | P a g e
(relaxed) (contraction)A-V valves open closed
semilunar valves closed open
Semilunar Valve Function Cardiac Muscle Contraction Heart muscle:
Is stimulated by nerves and is self-excitable (automaticity) Contracts as a unit Has a long (250 ms) absolute refractory period
Cardiac muscle contraction is similar to skeletal muscle contraction Contraction of Cardiac Muscle
• Mechanism of contraction is the same as for other muscles i.e. calcium interacts with Troponin, myosin binds to actin and the myosin head moves through the energy produced from th hydrolyses of ATP.
• In contrast with skeletal muscle, the T-tubules in the cardiac muscle have a larger diameter (around 5 times as large) and thus it has a volume that is 25 times as large. This means that the caqrdiac T-tubules can contain larger quantities of calcium. Apart from this, the T-tubules contain a mucopolysaccharide that can bind to large quantities of calcium.
• Also, the T-tubules in the cardiac muscle opens up to the extracellular space. • Thus contraction in the cardiac muscle depends on both calcium that is stored in the T-tubules as
well as extracellular calcium
Cardiac Action Potential
• Normal resting membrane potential ranges from -85 to -90mV • Action Potential = 105mV • In the Atria, the membrane is depolarised for around 0.2 secs while in the Ventricles it is 0.3
secs. • In contrast to other excitable tissues, the prolonged depolarisation is due to two reasons:
o Apart from the normal fast sodium channels (the same as for skeletal and nerve tissue), cardiac muscle contains slow calcium/sodium channels that are slow to close and let both calcium and sodium ions through.
o At onset of the action potential, there is a decrease in the permeability to Potassium, thus repolarisation takes longer to start.
• Like all other excitable tissues, cardiac muscle is refractory to re-stimulation during the action potential.
• But as the action potential of cardiac muscle lasts almost as long as the contraction itself, the

3 | P a g e
refractory period is almost as long as the contraction period - 0.25 to 0.3 secs (in the ventricles)
4 | P a g e
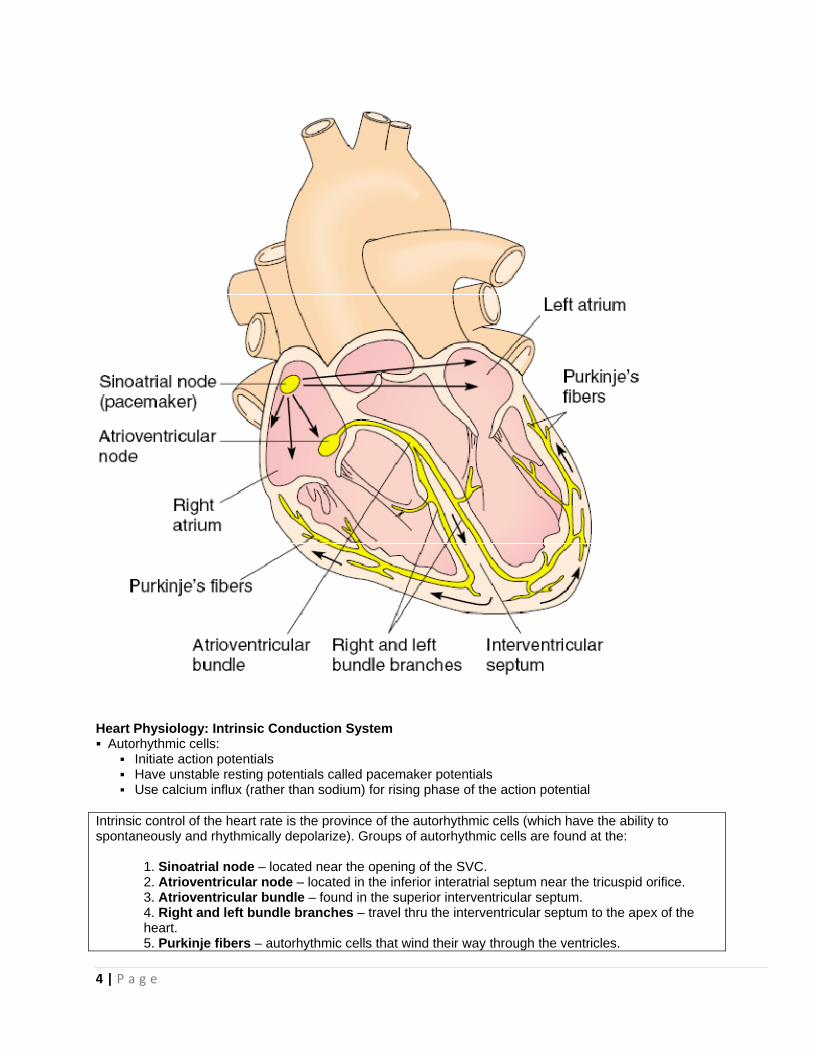
Heart Physiology: Intrinsic Conduction System Autorhythmic cells:
Initiate action potentials Have unstable resting potentials called pacemaker potentials Use calcium influx (rather than sodium) for rising phase of the action potential
Intrinsic control of the heart rate is the province of the autorhythmic cells (which have the ability to spontaneously and rhythmically depolarize). Groups of autorhythmic cells are found at the:
1. Sinoatrial node – located near the opening of the SVC. 2. Atrioventricular node – located in the inferior interatrial septum near the tricuspid orifice. 3. Atrioventricular bundle – found in the superior interventricular septum. 4. Right and left bundle branches – travel thru the interventricular septum to the apex of the
heart. 5. Purkinje fibers – autorhythmic cells that wind their way through the ventricles.

5 | P a g e
The above list also gives the path of the electrical conduction system within the heart.
• All autorhythmic cells have the ability to rhythmically and spontaneously depolarize.
• However, SA node cells have the fastest rate of depolarization and therefore set the pace for other autorhythmic cells as well as the rest of the heart.
• For this reason, the SA node is known as the pacemaker of the heart. Here’s how the process
takes place:
• Without any input (neural or hormonal), the rate of SA node depolarization determines the heart rate. The fibrous skeleton of the heart electrically isolates the atria and the ventricles.
• The AV bundle is the only electrical connection btwn them.
• Note that ventricular depolarization and thus contraction begin at the apex of the heart
and proceed upward.
• Recall that the great vessels leave the heart at its superior edge (the base). So, since blood exits the top of the heart, we must begin squeezing at the inferior end (apex) of the heart.
• The extrinsic control of the heart rate refers to factors originating outside of cardiac tissue
that affect heart rate.
• The medulla oblongata contains cardiac centers that can alter the heart’s activity.
• The cardioacceleratory center projects via the cardiac sympathetic nerves to the SA node, AV node, and the ventricular myocardium.
• These neurons release norepinephrine, which causes an increase in contraction rate and
force. The cardioinhibitory center contains parasympathetic neurons that project (via the vagus nerve, CN X) to the SA node and AV nodes.
• These neurons release acetylcholine, which causes a decrease in heart rate but no change
in the heart’s contractile strength.
• At rest, both parasympathetic and sympathetic neurons are releasing neurotransmitters onto the heart, but the parasympathetic branch is dominant.
• During stress, exercise, and excessive heat the sympathetic influence is dominant.
• Hormones such as epinephrine (released by the adrenal medulla), thyroxine (released
by the thyroid gland), and others affect heart rate as well. More on them later.

6 | P a g e
Pacemaker and Action Potentials of the Heart

7 | P a g e
Cardiac Membrane Potential Heart Physiology: Sequence of Excitation Sinoatrial (SA) node generates impulses about 75 times/minute Atrioventricular (AV) node delays the impulse approximately 0.1 second Impulse passes from atria to ventricles via the atrioventricular bundle (bundle of His)
Heart Physiology: Sequence of Excitation AV bundle splits into two pathways in the interventricular septum (bundle branches)
Bundle branches carry the impulse toward the apex of the heart Purkinje fibers carry the impulse to the heart apex and ventricular walls
Cardiac Intrinsic Conduction Cardiac Membrane Potential
Extrinsic Innervation of the Heart Heart is stimulated by the sympathetic cardioacceleratory center Heart is inhibited by the parasympathetic cardioinhibitory center

8 | P a g e
Properties of the Cardiac Muscle
Four Basic Properties
• Contractibility • Rhythmicity • Excitability • Conductivity
Contractility
• Contraction of the heart is called systole whilst relaxation of the heart is called diastole. • As the function of the heart is that of a pump, both actions are important - a pump has to
fill up with fluid before it can pump it out. The filling process occurs during diastole. • One systole and its following diastole is called one cardiac cycle. • In the normal heart, beating at a rate 0f 75 beats/min, the duration of ventricular systole is around 0.3 sec while diastole is around 0.5 sec (total length of cycle 0.8 sec)
Factors that influence cardiac contractility include:
Rhythmicity
• Normal Heart Rate: 72 beats/min • The heart contains special excitatory and conductive system each capable of discharging at regular intervals and of conducting impulses.

9 | P a g e
• Myogenic in origin - independent from nerve supply • Proof:
Complete innervation of the heart does not stop the heart from beating e.g. Heart Transplants.
Heart starts beating at day 21 of gestation while nerve tissue starts to be formed at day 35.
10 | P a g e
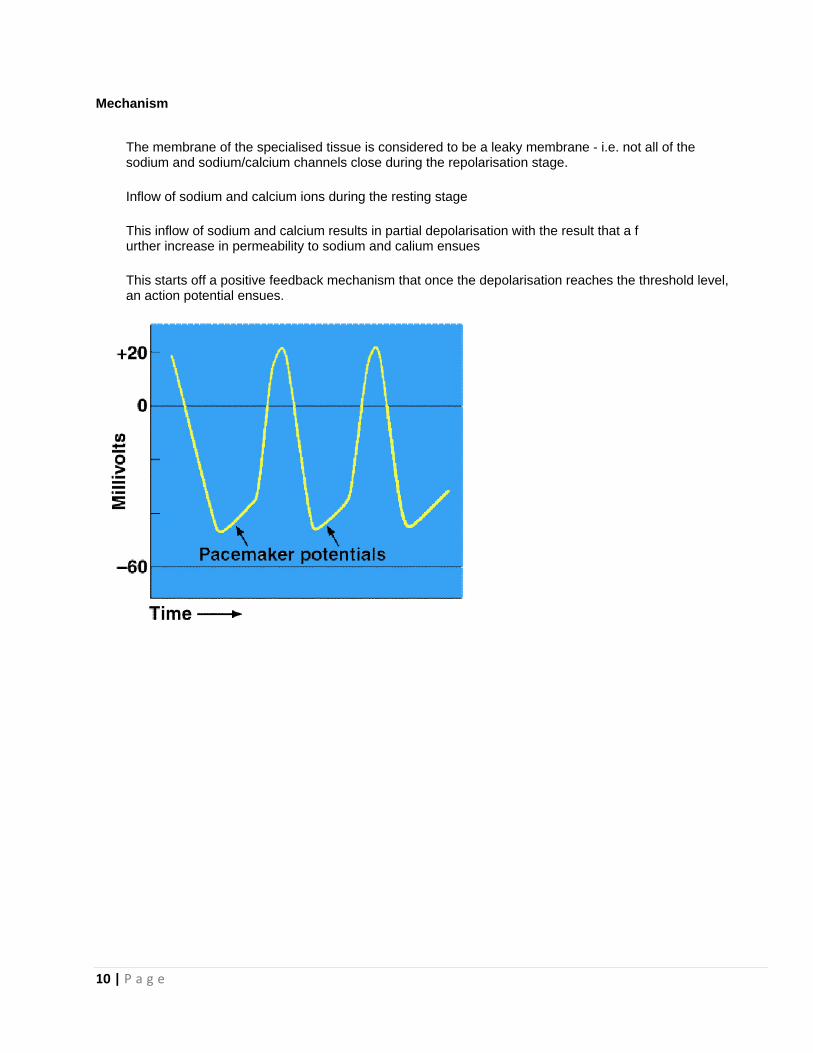
Mechanism
The membrane of the specialised tissue is considered to be a leaky membrane - i.e. not all of the sodium and sodium/calcium channels close during the repolarisation stage.
Inflow of sodium and calcium ions during the resting stage
This inflow of sodium and calcium results in partial depolarisation with the result that a f urther increase in permeability to sodium and calium ensues
This starts off a positive feedback mechanism that once the depolarisation reaches the threshold level, an action potential ensues.

11 | P a g
Factors
g e
that influeence cardiaac rhythmiccity includee:

12 | P a g e
Excitability
• In common with other muscle tissue, the heart muscle cell membrane is an excitable • membrane i.e., it is capable of transmitting an action potential. • Also in common with other muscle tissue, the depolarisation is due to the opening • of the fast sodium channels. • The unique characteristic of cardiac muscle action potential is the plateau phase i.e. • the maintenance of the potential at a positive level. • The plateau is the result of slow sodium/calcium channels that remain open for s • everal hundred milliseconds.
• Repolarisation is produced by the closing of the fast sodium and slow • sodium/calcium channels and opening of the potassium channels. • The prolonged depolarisation ensures that the absolute refractory period (ARP) • of the heart muscle cells is relatively longer than that of other muscle cells. • This prolonged ARP results in the fact that the heart muscle cell can never be • tetanised - important as for normal pumping action of the heart requires some • diastole to fill with blood.
Factors influencing Excitability
Factors that increase excitability:
• Sympathetic stimulation - Lowers the resting membrane potential – becoming more positive. • Mild Hyperkaleamia (increase in potassium concentration) - partial depolarisation • Hypocalcaemia (decrease in calcium concentration) - partial depolarisation

13 | P a g e
• Adrenaline - similar to sympathetic stimulation • Digitalis - increase atrial muscle excitability • Mild Hypoxia - Partial depolarisation • Ischaemia - Partial depolarisation
Factors that decrease excitability:
• Parasympathetic Stimulation - decreases excitability only of the atrial muscle cells • Hyponatreamia (decrease in sodium concentration) • Marked Hyperkaleamia - Marked depolarisation • Hypokaleamia - Hyperpolarisation • Hypercalceamia - decreases permeability to sodium • Acetyl choline - same as parasympthetic stimulation • Digitalis - decreases ventricular muscle excitability • Marked Hypoxia - marked depolarisation
Electrocardiography [details are in the ekg notes] Heart Sounds Heart sounds (lub-dup) are associated with closing of heart valves
First sound occurs as AV valves close and signifies beginning of systole Second sound occurs when SL valves close at the beginning of ventricular diastole
Four Heart sounds - all poduced either by closure of valves, vibrations or turbulence First Heart Sound - Caused by sudden closure of the A-V Valves - Low pitched, 0.12 sec duration - Systolic Second Heart Sound - Caused by sudden closure of Aortic and Pulmonary Valves - Higher Pitch and Shorter duration - 0.08 sec duration - Diastolic Third Heart Sound - Vibrations in ventricular wall due to rapid filling with blood (Usually not heard) - Diastolic Fourth Heart Sound - Auricular contraction and rush of blood into ventricle (Normally never heard)

14 | P a g e
- End-Diastolic
Control of Heart Rate
Normal Rate: 75/min
Values 50-100/min accepted as normal
Newly born child: - 140/min
Factors
Cerebral Cortex:
• Conditional reflexes - need learning • Emotions • Voluntary (very rare)
Hypothalamus:
• Sympathetic Stimulation • Parasympathetic Stimulation • Temperature regulatory centre
Respiratory Centre:
• Inspiration - inhibit CIC - increase in rate
Temperature:
A one degree celcius rise in body temperature increases rate by about 20/min through:
• Stimulation of the SA node • Through thermostatic centre
Exposure of body to cold results in stimulation of skin receptors that send impulses to the hypothalamus which in turn increase discharges through the sympathetic systme resulting in an increase of the heart rate.
Reflexes
Circulatory:
• Carotid sinus and aortic arch: increase in arterial blood pressure would stimulate baroreceptors that send impulses to the medulla oblongata to stimulate the CIC resluting in Bradychardia.
• Right atrium Distension stimulates stretch receptors that woudl inhibit the CIC resulting in tachycardia (Bainbridge Reflex)

15 | P a g e
• Chemoreceptors in Lt Ventricles that are stimulated by chemical compounds (e.g. nicotine) resulting in Bradychardia.
• Aortic and carotid Bodies chemoreceptors are sensitive to changes in the oxygen and carbon dioxide concentrations as well as pH. A decrease in oxygen, an increase in carbon dioxide and a decrease inpH result in tachycardia.
Extracirculatory:
• Lungs: inflatiopnof the lungs result in stimulation of stretch receptors in the bronchi and bronchioles resultin in inhibition of the CIC - Tachycardia
• Skeletal Muscles: contraction of skeletal muscles causes tachycardia. • Trigger zones: Heavy blow to certain areas of the body (larynx, abdomen or testes) can cause a strong
vagal response resultin in Bradycardia. • Eyes - Occulo Cardiac Reflex - Pressure over the eyes can cause bradycardia • Pain - Cutaneous or Deep pain results in tachycardia while Visceral pain results in bradycardia.
Cardiac Cycle Cardiac cycle refers to all events associated with blood flow through the heart
Systole – contraction of heart muscle Diastole – relaxation of heart muscle
Phases of the Cardiac Cycle Ventricular filling – mid-to-late diastole
Heart blood pressure is low as blood enters atria and flows into ventricles AV valves are open, then atrial systole occurs
Ventricular systole Atria relax Rising ventricular pressure results in closing of AV valves Isovolumetric contraction phase Ventricular ejection phase opens semilunar valves
Isovolumetric relaxation – early diastole
Ventricles relax Backflow of blood in aorta and pulmonary trunk closes semilunar valves
Dicrotic notch – brief rise in aortic pressure caused by backflow of blood rebounding off semilunar valves
Mechanical Events
They can be divided in seven phases. The description below is about the left heart, although it can be the same for the right heart. The difference is in the lower pressures reached by the right ventricle and pulmonary artery pressures.
� Phase 1 - It is the onset of ventricular systole and coincides with the R wave peak in the ECG. According to the Starling’s Law of the heart, tension will be developed in cardiac muscle fibers proportionally to their previous stretching or clinically, end-diastolic-volume ( the preload). The end diastolic volume (EDV) is about 135 mL. The ventricular pressure becomes higher than atrial one and the mitral valve close. The phonocardiogram at this moment must show the first heart sound (S1), also audible on auscultation. The origin of the first heart sound is complex and it is still debated. But for clinical purposes, it is well acceptable if one says it is originated by the

16 | P a g e
closure of atrioventricular valves. The intraventricular pressure rises sharply while the mitral and aortic valves keep closed. This phase 1 is so called isovolumetric contraction. The term isometric should not be used since some fibers do lengthen while others shorten as the ventricular shape changes during systole. The aortic pressure curve shows an oscillation, reflecting the mechanical effect of the ventricle on the aorta during this period. � Phase 2 - When the intraventricular pressure overcomes the aortic diastolic pressure, the aortic valve opens and the left ventricle and the aorta become a common cavity. The pressure tracings during this period follow one another closely. This phase is called early or rapid ejection period. The aorta blood flow increases with time and blood coming into the aorta exceeds the peripheral runoff (blood leaving aorta from its branches). When the peripheral run-off becomes equal to ejection, the pressure curves flatten (rounded summit). The intraventricular volume reduces substantially. The venous pulse curve shows the c wave originated by the bulgement of tricuspid valve into the right atrium in the previous phase. The subsequent fall on the tracing is due to the descent of the base of the ventricle, the x wave � Phase 3 - The aortic and ventricular pressure declines, while the peripheral run-off is still high. This is the reduced ejection period. The aortic pressure is slightly greater then ventricular one but the blood flow is still forward. This is explained by the momentum or inertia of blood: during the previous phase, the velocity was increasing with time and the blood gained some inertia, sufficient to keep it forward, despite the reversal gradient between aorta and ventricle. The aortic blood flow reduces sharply. Meanwhile, the venous return fills the right atrium gradually, originating the v wave on the venous pulse. � Phase 4 - When the momentum is over (equal to zero), there is virtually a reversal of blood flow in the aorta. Some blood “falls down” in the sinus of Valsalva and the aortic cusps come together preventing the regurgitation of blood into the ventricle. The second heart sound (S2), for clinical purposes, is due to the closure of aortic and pulmonic valves. There is a sharp decline in the ventricular pressure while the aortic and mitral valves keep closed and this period of time is so called the isovolumetric relaxation phase. The ventricular volume remains virtually constant and this is the residual volume (about 50 mL).The aortic curve shows a brief and sharp rise which is due to abrupt closure of aortic valve: when the cusps come together, vibrations are generated and transmitted to the aorta wall. This is the dichrotic incisura or dichrotic knob which can be seen in another peripheral artery pressure recordings. � Phase 5 - The ventricular pressure becomes lesser than atrium pressure and the mitral valve opens. This is the onset of the rapid ventricular filling period. The right atrium pressure declines and produces the y descent on the venous pulse tracing. The third sound (S3) is recorded and it can be audible in a variety of diseases (as in heart failure) or sometimes, in healthy children. Blood coming from the atrium quickly fills the ventricle. The pressures in these two chambers decline sharply. There is a common cavity again and pressure curves are very similar, with the atrium pressure being slightly greater than ventricle. � Phase 6 - This is the reduced ventricular filling phase. The atrium and ventricle pressures rises gradually. Some authors call it the diastasis phase. The ventricular volume curve rises. � Phase 7 - The end of the cardiac cycle is the atrial systole: it accounts for approximately 25% of ventricular filling. The fourth heart sound (S4), (just as the a wave on the venous pulse), is due to atrial systole and is recorded in the phonocardiogram. It can be audible on auscultation in athletes or in some diseases, which the most common is systemic arterial hypertension, where the left ventricular compliance is reduced and a forceful atrium contraction is present. In fast heart rates (tachycardia), atrial systole is very important because the phases 5 and 6 are reduced. So the blood coming from the atrium will contribute with great importance to the ventricular filling, preventing low cardiac output (heart failure) and reduced coronary blood flow, since this occurs mainly at diastole.
In clinical practice, some terms are largely used and they are derived from the cardiac cycles events: stroke volume (SV) is the volume of blood the ventricle ejects at systole. The product of SV with the heart rate (HR) give us the cardiac output (CO) (about 5 L/min). The ejection fraction (EF) is calculated dividing the SV by the

17 | P a g e
EDV (usually 60-70%) and is an index of the contractile status of the heart.
The cardiac cycle refers to all the events associated with blood flow thru the heart during one complete heartbeat. It includes the contraction (systole) and relaxation (diastole) of all 4 chambers. . The cardiac cycle is divided into 4 parts:
1. ventricular filling, 2. isovolumetric contraction, 3. ventricular ejection, 4. isovolumetric relaxation.
• During ventricular filling left atrial blood pressure is lower than pressure in the pulmonary vasculature, so
blood enters the left atrium.
18 | P a g e
• LA pressure is greater than LV pressure, so blood enters the LV. B/c LA pressure is greater than LV
pressure, the AV valves are pushed open. Note that LV pressure is less than aortic pressure. As a result, blood tries to back flow from the aorta into the LV and this forces the semilunar valves closed. Neither the atrial or ventricular muscle is contracting during this phase.
• At this point both the left atrium and the left ventricle are in diastole. About 80% of the ultimate ventricular
volume will enter in a passive manner.
• However, at the end of ventricular filling, while the ventricle is still relaxing, the atrium depolarizes and contracts. This pushes roughly the final 20% of blood into the left ventricle.
• The left ventricle now has the maximum volume it will contain during this particular cycle.
• This is known as the end diastolic volume (EDV). A typical value for EDV is 130mL.
• Note that for the rest of the cycle, the atrium will be in diastole.
• During isovolumetric contraction the ventricle depolarizes and begins to contract. As the ventricle
contracts, its pressure rises quickly. LV pressure quickly exceeds LA pressure and blood is pushed upward forcing the mitral valve shut – this creates the 1
st heart sound (the LUB). However, the opening of the
aortic semilunar valve requires much more pressure than was necessary to close the mitral valve.
• So after the mitral valve is shut, the ventricle continues to contract and the pressure within it rises, but until ventricular pressure exceeds aortic pressure, the aortic semilunar valve remains shut.
• Thus, during this period, the AV and semilunar valves are shut and the volume within the ventricle is not
changing.
• Hence this phase is known as “iso” “volumetric” contraction.
• During ventricular ejection the pressure in the left ventricle exceeds aortic pressure (typically about 80mmHg), the semilunar valve is forced open, and blood is ejected from the left ventricle. Not all of the blood is ejected.
• The amount remaining after ventricular contraction is known as the end systolic volume (ESV). A typical
value is 70mL.
• This gives a reserve amount of blood that could also be ejected if necessary (e.g., during exercise).
• The amount of blood ejected during this phase is known as the stroke volume. Mathematically the stroke volume can be expressed as the difference btwn the end diastolic and end systolic volumes:
SV=EDV-ESV.
• A more vigorous contraction will result in a decreased ESV and an increased SV.
• The final phase is isovolumetric relaxation.
• Once the ventricle has completed contracting, the pressure within it begins to fall. It quickly becomes less than aortic pressure, blood tries to back flow and the semilunar valve snaps shut – this creates the 2
nd
heart sound (the DUP). However, it takes a bit longer for the pressure in the ventricle to drop below the pressure in the left atrium – which will cause the mitral valve to open.

19 | P a g e
• During this time, as ventricular pressure is falling, the AV and semilunar valves are shut and ventricular volume is not changing.
• Once left ventricle pressure falls below left atrium pressure (which is rising as blood returns to the heart),
the mitral valve will open and the cycle will begin anew with another round of ventricular filling.
• Note that the events on the left side of the heart during a normal cardiac cycle are mirrored by the events on the right side of the heart.
• Both the right and the left side of the heart contract at the same rate.
• They have identical stroke volumes. The only difference is the pressure involved.
• The left ventricle must contract harder to open its semilunar valve.
• This is because the systemic circuit is under a much higher pressure than the pulmonary circuit.
• The left and right ventricle must have identical stroke volumes.
• If left ventricle SV > right ventricle SV, then blood would back up in the systemic circuit.
• If left ventricle SV < right ventricle SV, then blood would back up in the pulmonary circuit.
• Cardiac output is the amount of blood pumped by each ventricle in one minute.
• Cardiac output can be expressed mathematically as the product of heart rate and stroke volume:
CO(mL/min) = HR(beats/min) x SV(mL/beat). Changes in either stroke volume or heart rate can alter cardiac output. During exercise, cardiac output can increase dramatically.
• The nervous system plays a large role in the regulation of heart rate. Recall that the cardiac centers in the medulla oblongata exert influence on the rate of SA node depolarization, i.e., heart rate.
• Increases in heart rate are achieved by:
• 1. Increase in cardioacceleratory center activity. This results in an increase in sympathetic nerve activity
and an increase in norepinephrine release on the heart. • • 2. Decrease in cardioinhibitory center activity. This results in a decrease in parasympathetic nerve activity
and a decrease in acetylcholine release on the heart.
• Decreases in heart rate are achieved by a decrease in cardioacceleratory center activity or an increase in cardioinhibitory center activity. It should be noted that the main parasympathetic pathway to the heart is via the vagus nerve (CN X).
• So, an increase in parasympathetic nervous activity will result in increased vagus nerve activity.

20 | P a g e
• This is known as increased vagal tone.
• Changes in blood pressure can also influence HR. A rise in BP will initiate an increase in parasympathetic
outflow to the heart. This’ll decrease HR and by extension decrease BP.
• A drop in BP will initiate an increase in sympathetic outflow to the heart. This’ll increase HR and by extension increase BP.
• Heart rate is also sensitive to changes in plasma levels of O
2, CO
2, and pH.
• Low levels of O2 are usually accompanied by high levels of CO
2 and a drop in pH.
• These changes will activate the cardioacceleratory center causing an increase in heart rate.
• This will increase the output of blood to the lungs so that O2 can be picked up and CO
2 removed.
• Note that if heart rate changes without a change in contractility (the strength of the contraction), stroke volume will change also.
• This is because changing the heart rate alters the filling time (i.e., the time btwn beats during which the
heart fills up with blood).
• There are also hormonal influences on heart rate. Epinephrine, released by the adrenal medulla (an endocrine organ found atop the kidney), causes an increase in heart rate. Thyroxine, released by the thyroid gland (located in the anterior neck), also causes an increase in heart rate.
• There are other factors that can affect heart rate. Changes in body electrolyte levels (K
+, Ca
2+) can exert
effects on heart rate. Drugs can alter heart rate. Some drugs that increase heart rate are: caffeine, nicotine, and sympathetic mimics (e.g., ephedrine). Beta-blockers are a type of drug that decreases heart rate.
• Psychic and emotional factors can also influence the heart’s action.
• Stroke volume depends on 3 main variables: preload, contractility, and afterload. • Preload refers to the degree of ventricular stretch during filling. The more heart muscle is stretched (up to a
point), the more forceful its contraction.
• The increase in stretch causes more optimum cross-bridge formation btwn actin and myosin and a stronger contraction, thus ejecting a larger volume.
• The Frank-Starling law nicely sums it up nicely: “What returns to the heart will get pumped out of the heart.”
In other words, as venous return (the volume of blood returning to the heart per minute) increases, EDV increases, and stroke volume increases.
• Changes in heart rate change the filling time and thus the EDV (preload). During exercise skeletal muscles
massage the veins and increase the venous return, thus increasing EDV (preload). The stroke volume is greatly influenced by changes in preload.
• Contractility is the strength of the heart’s contraction independent of its degree of stretch.
• Think of it as how hard the heart contracts no matter how much blood is within it.
• An increase in contractility will result in an increase in stroke volume and a decrease in end systolic volume.

21 | P a g e
• Factors that increase contractility include: increased cardioacceleratory activity; hormones such as
epinephrine and thyroxine; drugs such as digitalis. Drug types that decrease contractility include beta-blockers and calcium channel blockers.
• Afterload refers to the pressure that must be overcome to open the semilunar valve and eject blood.
• Afterload is equivalent to arterial blood pressure.
• An increase in arterial BP will increase afterload.
• This makes the heart expend more time/energy on opening the semilunar valve and less on ejecting blood.
• Thus, an increase in afterload will cause stroke volume to decrease and end systolic volume to increase.
• However, it takes a significant increase in afterload before the pumping output of the heart is hampered.

22 | P a g e
Cardiac Output (CO) and Reserve CO is the amount of blood pumped by each ventricle in one minute CO is the product of heart rate (HR) and stroke volume (SV) HR is the number of heart beats per minute SV is the amount of blood pumped out by a ventricle with each beat Cardiac reserve is the difference between resting and maximal CO
Cardiac Output: Example CO (ml/min) = HR (75 beats/min) x SV (70 ml/beat) CO = 5250 ml/min (5.25 L/min)
Cardiac Output Factors determining the permissive pumping capacity. A.
Strength of contraction:

23 | P a g e
Defined as: The volume pumped by each ventricles per minute.
• Can also be written as the stroke volume
x heart rate where stroke volume is the volume pumped by each ventricle.
Factors determining Cardiac Output (CO).
Volume of the cardiac output determined by 2 factors:
• Permissive pumping capacity of the heart:
the maximum volume which the ventricle can p
ump per minute.
• Venous return: the volume of blood entering the right atrium per minute.
Changes in any of these two factors, would influence the cardiac output.
• Starling's Law • Sympathetic Stimulation
B. Heart Rate
• Within certain limits (>40/min - <180/min), an increase in heart rate would increase the permissive pumping capacity (PPC).
• Heart rate >180/min results in a decrease in filling (diastolic time shortened)
• Heart rate <40/min results in stasis of blood • Both conditions wuld result in a PPC that lags begind
the venous return - this results in Heart Failure.
C. Nerve Supply
• Sympathetic stimulation increases the PPC due to the increase in the strength of contraction and the heart rate.
• Parasympathetic stimulation decreases the PPC due to a decrease in the heart rate.
D. Aortic Impedance
• Impedance is the resistance offered to the flow of blood from the left ventricle.
• Thus an increase in the aortic impedance would result in an decrease in the PPC
Factors determining the venous return A. Pressure gradient
• Supine position helps blood flow to the right atrium of the heart thus increasing venous return.
B. Respiratory movements
• The increase in negative pressure during inspiration increases the venous return.
C. Skeletal Muscle Contraction
• Contraction of the skeletal muscle and the presence of valve in the veins, increases the venous return.
D. Vascular Tone
• Arterioles: arterioles are resistance vessels - opening up of the arterioles and the arterio-venous shunts results in an increased venous return.
Arterial Blood Pressure
Systolic Pressure: 120mmHg
Diastolic Pressure: 85mmHg
Mean Pressure: 96 (100)mmHg
Mean Arterial Pressure is the most important as regards tissue blood flow.
Arterial Blood Pressure is commonly measured by the auscultatory method.
• Stethoscope is placed over the antecubital artery • Blood pressure cuff inflated above systolic pressure • As soon as cuff pressure drops below systolic pressure - blood passes through the artery and a tapping sound is heard - Korotkoff sounds.

24 | P a g e
• Capillaries: capillaries are capacitance vessels - opening up of pre-capillary sphincters results in a decreased venous return.
• Veins: Veins are also capacitance vessels - a decrease in the tone of the veins results in an decrease of the venous return.
D. Blood Volume
• An increase in blood volume results in an increase in venus return.
E. Gravity
• In the upright position, gravity would decrease venous return.
• On further reduction the sounds get muffled (or disappears). This corresponds to the diastolic pressure.
Regulation of Stroke Volume SV = end diastolic volume (EDV) minus end systolic volume (ESV) EDV = amount of blood collected in a ventricle during diastole ESV = amount of blood remaining in a ventricle after contraction
Arterial Blood Pressure
Arterial Blood Pressure is a product of cardiac output and total peripheral resistance.
Control of Arterial Blood Pressure
A. Rapid System 1. Baroreceptors
• Stretch receptors inthe walls of the large arteries. • On stimulation inhibit the Vasoconstrictor Centre and Excite the vagal centre • Results in Vasodilation and a decreased in the Heart Rate - decreases blood
pressure
2. Chemoreceptors
• Two Carotid bodies and several aortic bodies • On a fall in blood pressure - the decrease in oxygen, an decrease in pH and an
increase in carbon dioxide results. • This causes stimulation of the chemoreceptors with a resultant excitation of the VCC
- increase in B.P. • Responds when the systolic B.P. goes below 80mmHg.
3. Atrial and Pulmonary Artery Receptors
• Detect changes in blood volume. • An increase in blood volume results in inhibition of the VCC and lowering of the
Blood Pressure.

25 | P a g e
• Atrial reflexes are also responsible for an increase in the glomerular filtration by the kidneys.
4. Hormonal i. Adrenaline/Noradrenaline
• The reflexes that cause sympathetic stimulation also causes release of adrenaline/noradrenaline.
• Hormones causes constriction of blood vessel - increase in arterial blood pressure
ii. Vasopressin
• A decrease in blood vessel causes a reflex release of vasopressin from the posterior pituitary gland.
• Vasopressin causes arteriolar constriction.
iii. Renin-Angiotensin System
• If the B.P. decreases, renin is released from the juxtaglomerular complex of the renal system. Renin acts on angiotensinogen to transform it into angiotensin I.
• Angiotensin I is transformed within the pulmonary system to angiotensin II - resulting in vasoconstriction.
B. Long Term Regulation 1. Renal Body Fluid System
• Increase in the Blood Pressure results in an increase of renal output of water and salt resulting in a decrease of the ECF volume and hence the Blood Volume - decrease in B.P.
Major differences between the Rapid and Long term controls: a. Short term mechanisms act within seconds to minutes b. Most short term mechanisms adapt quickly c. Long term mechanisms are able to bring the B.P. back to normal levels and not just compensate. Factors Affecting Stroke Volume Preload – amount ventricles are stretched by contained blood Contractility – cardiac cell contractile force due to factors other than EDV Afterload – back pressure exerted by blood in the large arteries leaving the heart
Hemodynamics
• Blood flowing through a long, smooth vessel at a steady rate, flows in a streamline fashion. This is also called Laminar Flow.
Laminar Flow changes to turbulent flow if: 1. Flow increases 2. Blood passes over obstruction

26 | P a g e
3. Makes a sharp turn 4. Passes over a rough surface Turbulency results in: • Reduced flow due to an increase in resistance • Increase incidence of cholesterol plaques and clot formation Frank-Starling Law of the Heart Preload, or degree of stretch, of cardiac muscle cells before they contract is the critical factor controlling stroke volume
Slow heartbeat and exercise increase venous return to the heart, increasing SV Blood loss and extremely rapid heartbeat decrease SV
Systole and Diastole
• Systole means "to contract" and diastole means "to dilate". o Atrial systole--contraction of the atrial myocardium. o Atrial diastole--relaxation of the atrial myocardium. o Ventricle systole--contraction of the ventricular myocardium. o Ventricle diastole--relaxation of the ventricular myocardium. o When systole and diastole are used without reference to specific chambers, they mean
ventricular systole and diastole. • Atrial systole and diastole
o Contraction of the atria is responsible for 30% of the ventricular filling. o Pressure changes in the atria include:
a wave--caused by atrial contraction. c wave--caused by ventricular contraction. v wave--caused by blood flowing into the atria.
o • Ventricular systole and diastole
o Contraction of the ventricles causes blood to move to the lungs and to the body. Pressure generated by the right ventricle (blood to the lungs) is lower than than
pressure generated by the left ventricle (blood to the body). o During the period of isometric contraction, ventricular contraction causes an increase in
pressure within the ventricles but no movement of blood out of the ventricles. o Blood flows out of the ventricles during the period of ejection. o Semilunar valves close, ventricles relax, and pressure drops to 0 during the early stages of
diastole and the ventricles begin to fill with blood. o Stroke volume is the difference between the end diastolic volume and end systolic
volume. (the amount of blood pumped by the heart per beat) o Cardiac Output = Stroke Volume x Heart Rate
Resting college student

27 | P a g e
mL/beat x 72 beats/min. = 5040 mL/min or 5 L/min. Exercising college student
mL/beat x 120 beats/min = 24000 mL/min or 24 L/min. o Cardiac output and peripheral resistance determine blood pressure.
Adequate blood pressure is necessary to ensure delivery of blood to tissues. Healthy young adult 120 mm Hg/ 80 mm Hg.
• Aortic Pressure Curve o Contraction of the ventricles forces blood into the aorta, thus producing the peak systolic
pressure. o Blood pressure falls to the diastolic level as blood flows out of the aorta.
•
Regulation of the Heart
• Intrinsic Regulation o Venous return is the amount of blood that returns to the heart during each cardiac cycle.
An increase in venous return causes an increase in cardiac output. o Starling's Law of the Heart--Cardiac Output Venous Return o Venous return stretches the S-A node and increases the heart rate.
• Extrinsic Regulation o The cardioregulatory center in the medulla oblongata regulates the parasympathetic and
sympathetic nervous control of the heart. o Parasympathetic Control
Parasympathetic stimulation is supplied by the vagus nerve. Parasympathetic stimulation decreases heart rate and can cause a small decrease
in the force of contraction (stroke volume).
28 | P a g e
Postganglionic neurons secrete acetylcholine which increases membrane permeability to K+, producing hyperpolarization of the membrane.
o Sympathetic Control Sympathetic stimulation is supplied by the cardiac nerves which are projections of
the cervical sympathetic chain ganglia (spinal nerve). Sympathetic stimulation increases heart rate and force of contraction (stroke
volume). Postganglionic neurons secrete norepinephrine which causes membrane
permeability to Na+ and Ca2+ producing hyperpolarization of the membrane. Epinephrine and norepinephrine are releases into the blood from the adrenal
medulla as a result of sympathetic stimulation. Effects of epinephrine and norepinephrine on the heart are long lasting
compared to the effect of neural stimulation. Both increase the rate and force of heart contraction
Heart and Homeostasis
• Effect of Blood Pressure o Baroreceptors (sensory receptors are in the walls of certain large arteries i.e.Internal
carotids and the aorta)--function to measure blood pressure. o In response to an increase in blood pressure, the baroreceptor reflexes decrease
sympathetic stimulation and increase parasympathetic stimulation. o An increase in right atrial pressure also causes the cardioregulatory center to increase the
heart rate through a reflex called the Bainbridge Reflex. • Effect of pH, CO2 and O2
o Chemoreceptors in the brain and carotids monitor blood CO2, O2, and pH levels. o In response to increased CO2, decreased pH, or decreased O2, autonomic nervous system
reflexes increase sympathetic stimulation and decrease parasympathetic stimulation. • Effect of Extracellular Ion Concentration
o An increase or decrease in extracellular K+ decreases heart rate. o Increased extracellular Ca2+ increases the force of contraction of the heart and decreases
the heart rate. o Decreased Ca2+ levels produce the opposite effect.
• Effect of Body Temperature o Heart rate increases when body temperature increases and decreases when
bodytemperature decreases.
Preload and Afterload Extrinsic Factors Influencing Stroke Volume Contractility is the increase in contractile strength, independent of stretch and EDV Increase in contractility comes from:
Increased sympathetic stimuli Certain hormones Ca2+ and some drugs

29 | P a g e
Extrinsic Factors Influencing Stroke Volume Agents/factors that decrease contractility include:
Acidosis Increased extracellular K+ Calcium channel blockers
Heart Contractility and Norepinephrine Regulation of Heart Rate Positive chronotropic factors increase heart rate Negative chronotropic factors decrease heart rate
Regulation of Heart Rate: Autonomic Nervous System Sympathetic nervous system (SNS) stimulation is activated by stress, anxiety, excitement, or exercise Parasympathetic nervous system (PNS) stimulation is mediated by acetylcholine and opposes the SNS PNS dominates the autonomic stimulation, slowing heart rate and causing vagal tone
Atrial (Bainbridge) Reflex Atrial (Bainbridge) reflex – a sympathetic reflex initiated by increased blood in the atria
Causes stimulation of the SA node Stimulates baroreceptors in the atria, causing increased SNS stimulation
Chemical Regulation of the Heart The hormones epinephrine and thyroxine increase heart rate Intra- and extracellular ion concentrations must be maintained for normal heart function
Myocardial Oxygen Consumption (MVO2)
Introduction & Importance
The heart requires much energy for its specialized function: contract. The myocytes turn chemical energy (stored in ATP molecules) into mechanical one. Therefore the cardiac cells have to yield a large amount of ATP from their aerobic metabolism, and so a large O2 consumption is expected. The contraction process itself accounts for approximately 75% of the MVO2. The remaining 25% are consumed by others cellular mechanisms (such as active transport of ions across the membrane).
Some diseases do increase MVO2 to such a point that compensatory mechanisms fail and the heart cells become ischemic (imbalance between supply and demand). This ischemic process can trigger pain in some people. Drugs that lower the MVO2 can alleviate this ischemic process by diminishing the myocardium demand.
Oxygen supply

30 | P a g e
The blood supplying the heart comes from the coronary arteries. and their branches. In capillary bed, the O2 extraction is near maximal: the saturation of venous blood in the coronary sinus is about 20%. This is why the coronary blood flow is so important to MVO2. In fact, the heart only can raise its oxygen take-up or extraction, if the coronary blood flow increases. If this mechanism fail, ischemic episodes may develop.
Major determinants of MVO2:
Many variables are determinants of MVO2 and they are usually correlated to each other:
1) Tension: One of the most important parameter influencing MVO2 can be defined as the force per centimeter length, existing in a circumference strand of myocardium ,pertaining to that plane, and is expressed as dynes / cm. 2) Preload: Is defined as the previous stretching of ventricular myocardial fibrils just about to begin a new systole. It is equal to the ventricular wall stress at end‐diastole. Stress is the force exerted in a cross sectional area (dynes / cm2). Changes in preload are usually not expressed by changes in stress, but by changes in ventricular end diastolic volume (EDV). In clinical practice, ventricular volumes appear to most closely approximate muscle fiber length. 3) Afterload: Is the impedance that the ventricles are submitted at the onset of contraction. Impedance is considered to be the sum of extracardiac forces present in the systemic circulation opposing ventricular ejection and pulsating flow. Clinically, it is assumed to be the systemic vascular resistance, if there is no obstruction between the LV and aorta. 4) Contractility: This is an intrinsic property of the cardiac cell. It defines the work that the heart can perform at a given load. Contractility is primarily determined by the availability of intracellular calcium and can be estimated by the rate of pressure development at systole (dP/dT). 5) Heart rate: It is the total of heartbeats within a minute. The association between cardiac chronotropism and inotropism was allegedly first recognized by Bowditch. Tachycardia reduces diastole period and consequently, the subendocardial blood flow, thereby reducing myocardial oxygen supply. It also increases peak dp/dt within limits, thereby increasing MVO2
How can the MVO2 be measured or estimated ?
The MVO2 at rest is about 9 ml/100g/min. However, measurement of MVO2 in patients is very cumbersome and can therefore be performed only for investigational purposes. The major determinant of MVO2 comprise the energy required for development and maintenance of systolic wall tension. However, this parameter is very difficult to obtain and several indices of myocardial oxygen demand have been suggested in the literature.
1) The stroke work . The area of the pressure‐volume loop of the cardiac cycle is the stroke work, which is proportional to the MVO2. 2) The Fick’s principle. It requires invasive procedures such as a coronary sinus venous blood sample, arterial blood sample and the coronary blood flow. This latter is measured with the thermodilution technique. The Fick’s principle, in this situation, states that: MVO2 = (CaO2 ‐ CvO2) x CBF where CaO2 is the arterial oxygen content, CvO2 is the coronary sinus oxygen content and CBF is the coronary blood flow. 3) The double product or Pressure Rate Product (PRP), which was first suggested by Rhode, is the product of heart rate (HR) with the systolic blood pressure (SP). The PRP sometimes is used to evaluate a patient’s response

31 | P a g e
to specific drug (eg. Beta‐blockers). The higher the PRP, the higher will be MVO2. PRP = HR x SP It is not a so reliable method, since it does fail in some conditions. A patient with a HR of 150 bpm and a SP of 50 mmHg has a very different clinical picture of another one with a HR of 50 bpm and SP of 150 mmhg, although they have the same PRP. 4) The Tension‐time‐index.(TTI) is the area under the ejection phase of the left ventricle pressure curve (estimated systolic tension) times the heart rate (time).
Currently, the modified Pressure work index, developed by Hoeft et al, who used a modified Kety-Schimdt technique, seems to be the best alternative for clinical estimation of myocardial oxygen demand. This can be done in a conscious patient as well during anaesthesia.
Aortic Stenosis Vs Aortic Incompetence. Why is classical angina far more common in the former ?
In aortic stenosis, the LV is working with a pressure overload, which is more stressful than in aortic incompetence, where the LV is submitted to a volume overload. The La place’s Law is the key to understand part of this difference:
The La place’s Law states that:
T = Pr / 2h. [ T: tension ‐ P: pressure ‐ r: radius ‐ h: ventricular wall thickness]
In pressure overload, as in aortic stenosis, the LV pressure will reach very high values and so the P variable on the above equation will contribute to a much higher tension. This is not true to volume overload, where the LV radius is increased (r variable) but rarely it is two-fold increased. For this reason (and others), the MVO2 will be much higher in aortic stenosis than it would be in aortic incompetence, and therefore, anginal pain is more likely to occur in pressure overload conditions.
The Coronary Blood Flow
Introduction & Importance
The coronary arteries are the first vessels to branch off the aorta and through them, the heart receives (at rest) about 5% of the cardiac output, or 250 ml/min. Coronary blood flow (CBF) is governed by a pressure gradient and by resistance of the vessels.(Q=P/R). The CBF may be seriously reduced as in coronary artery disease, and the myocardium may become ischemic or even infarcted.
Factors influencing CBF: 1)MVO2 ‐ Undoubtedly, is He major factor. Any change in this one is followed by a proportional change in the coronary flow. Whenever the oxygen consumption becomes higher, various substances promote regional vasodilatation reducing the resistance, thereby increasing CBF. Among this these vasoactive metabolics are: adenosine, potassium, lactate and prostaglandins. 2) Coronary perfusion pressure ‐ The total pressure in the aorta is a sum of two components: the dynamic pressure plus the lateral pressure. Keeping otherwise variables constant, the sum of these two parameters must be constant. The dynamic pressure is proportional to the blood velocity, while the lateral component is actually the driving force for perfusing the coronary arteries. In severe

32 | P a g e
aortic stenosis, for example, the dynamic pressure is much higher than normal and consequently, the lateral pressure in aortic root will be lower than normal; therefore the driving force for coronary perfusion in this case will be greatly reduced and this mechanism also accounts for myocardial ischemia. 3) Systolic compression ‐ Is discussed below. 4) A‐adrenergic tone ‐ Recent studies have shown that a ‐ tone is increased in exercise induced ischemia and can be reduced by a‐block drugs.
The Coronary Blood Flow
The CBF varies throughout the cardiac cycle, according to pressure gradients generated between cardiac chambers and the aorta. The pressure differential (mmHg) between aorta and ventricles, in systole and diastole, are showed below:
Left Ventricle Right Ventricle Systole -1 95 Diastole 80 80
During systole, large pressures are generated within the myocardial tissue. The myocardial vessels are compressed and tends to collapse, mainly in the left ventricle, where the intraventricular pressure reaches large values. The result is a .reduced CBF, even though systemic arterial pressure is highest during this period. The right ventricle is a low pressure chamber. Therefore the right coronary blood flow pattern is not as influenced at systole as left coronary flow is. Systolic compressional forces are greater in the subendocardial layers (exposed to pressures of 120 mmHg) than in the epicardial ones (exposed only to intrathoracic pressure, about 0 mmHg). Therefore the subendocardial layer is more prone to ischemic damage.
During diastole there is a high flow to the left ventricle and this compensates for the relatively lack of flow during systole. Tachycardia reduces diastole period and consequently the CBF.
How can CBF be measured ? 1) Clearance Methods ‐ these are based on Kety and Schmidt (1948) and involves introducing an inert gas (usually nitrous oxide) into the circulation via the lungs and following the progressive saturation of cardiac tissue. The increases in the systemic arterial and coronary sinus concentrations of indicator are measured over the time until arteriovenous difference reaches zero. The reciprocal of this time reflects the blood flow in milliliters per minute per 100g of tissue. 2) Thermodilution ‐ described by Ganz et al (1971) requires a special catheter which is passed into the coronary sinus and a continuous infusion of cold saline is made through a lumen near the tip at a constant rate. The temperature of the blood at a site several centimeters back from the tip of the catheter is measured with a thermistor. The method uses the form of the Fick equation dealing with continuous (rather than bolus) infusion of indicator: Q = I / C where Q is the blood flow in ml/min, I the rate of infusion and C the steady level of indicator (temperature difference) resulting from infusion. 3) Flowmeter Techniques ‐ electromagnetic and Doppler flowmeters have been used at surgery, where they are best suited for measurement of the flow in vein grafts. The native coronary vessels should never be dissected for the sole purpose of placing a flowmeter. 4) Catheter‐Tip Flowmeters ‐ these are small enough to enter the large coronary arteries but calibration and positioning are difficult. Laser Doppler probes can potentially measure flow velocity in intramyocardial vessels.
Coronary Artery disease & CBF.

33 | P a g e
The most common cause of myocardial ischemia is coronary atherosclerosis, which produces progressive stenosis, reducing CBF. The atheroma plaque causes partial obstruction of the lumen and generates a high resistance area. The pressure drop will be higher than normal in this segment, and the perfusion pressure will be lower at the point distal to the obstruction, according to the Pouiselle-Hagen formula. In this regard, colateral circulation is important, because if obstruction is total, myocardial infarct is much more likely to occur if the heart did not meet another way to supply the suffering myocardium. Clinically, coronary artery disease is manifested by angina pectoris in the great majority of people The pain usually is triggered when MVO2 increases, as in exercise (effort angina). In this situation, the coronary blood flow will try to increase but the narrowed segment will offer a great resistance - as discussed above - and regional ischemia will develop, if compensatory mechanisms fail.
Venous System
Introduction & Importance
The blood coming from the tissues are transported by the venous system which is composed grossly by the venules, the small and the great veins. The pulmonary artery contains mixed venous blood, which is actually the sum of the superior vena cava and inferior one venous blood. Venous congestion is seen in some diseases and is consequence to abnormal high venous pressure.
Venous Return
The venous return (VR) can be defined as the volume of blood reaching the right heart. If one defines the term central venous pool ‐ roughly the blood contained in the great thoracic veins and in the right atrium ‐ then venous return will be the volume of blood entering this compartment, coming from the periphery. According to the Ohm’s law, there must be a pressure gradient between these two compartments. Keeping others variables constant, the venous return is inversely proportional to the central venous pressure. These two parameters can be plotted in a diagram, yielding the venous return family curves. In hemodinamically stable conditions the VR must be virtually equal to the CO ‐ changes from one heartbeat to another do exist ‐ otherwise blood would be damped back. CVP is always inherently driven to the equilibrium value that makes CO and VR equal. At CVP of 2 mmHg, CO is about 5 l/min.
Major factors influencing venous return
1) Respiratory cycle ‐ Central venous pressure (CVP) decreases with inspiration thereby increasing venous return. This is explained by the negative intrathoracic pressure originated at inspiration, which is transmitted to the great veins of the thorax; moreover, the downward diaphragm movement during this phase helps the pulling of blood toward the heart by increasing the intrabdominal pressure. At expiration, the mechanisms reverse. 2) Venous tone ‐ is governed by autonomous system. 3) Right heart function ‐ The blood reaching the right ventricle is pumped to the pulmonary circulation and therefore will not be damped backward in the venous system. 4) Gravity ‐ discussed below 5) Muscle pump ‐ discussed below
Gravity & Muscle pump

34 | P a g e
Venous pressure increases by approximately 0.77 mmHg for each centimeter (cm) below right atrium In a standing person, the venous pressure around the ankle is about 90 mmHg. Gravity actually causes blood pooling in the legs and if one stands quietly, fainting will occur within a few minutes, despite the compensatory mechanisms, because of low brain perfusion pressure. In fact, whenever a patient is in shock the Trendelemburg position increases venous return due to gravity effects. Muscle contractions helps venous return by compressing the surrounding veins ‐ the so‐called muscle pump. In fact, leg muscles contractions can lower local venous pressure to less than 30 mmHg. In the upright position, the venous pressure above the right atrium is decreased. Neck veins collapse and pressure is close to zero. Dural sinuses have rigid wall and cannot collapse. The pressure in these ones is subatmospheric and may reach ‐10 mmHg in the superior sagittal sinus. If these structures are perforated during a neurosurgical procedure, air embolism can occur. The levels of air injected in the blood stream of laboratory animals that was fatal ranged between 5 to 100 mL and depends in part, upon the rate of infusion. Air, unlike blood, is compressible and can virtually stop the circulation or lodge in the cerebral circulation causing permanent neurological deficits or even death.
The Venous Pulse Waves.
Venous flow becomes pulsatile close to the heart. The atrium dynamics is transmitted to the great veins, generating six waves which can be described. (The description is classically about the right atrium) : 1) "a" wave ‐ The atria contraction generates this upward contour on the tracing 2) x descent ‐ coming soon after the "a" wave, corresponds to the atrium diastole period. 3) c wave ‐ In the past, it was believed that the carotid impulse, coming from the carotid artery, which is next to internal jugular vein, produced this upward movement on the tracing, thus the "c" for carotid. Today, the bulge of the tricuspid valve into the atrium at early systole is actually responsible for this wave. 4) x’ descent ‐ Corresponds to the downward displacement of the base of the right ventricle at systole which reduces atria pressure and consequently produces this descent; 5) v wave ‐ Venous return coming into the atrium at systole. 6) y wave ‐ The atrioventricular valves open and blood quickly fills the ventricles, generating this other descent. Some authors also describe a h wave, that would be a subdivision of the y wave. It would correspond to the diastasis period. It is important to keep in mind that only two waves are diastolic events: the "a" wave and the y one. The reminder are systolic events.
How can I measure CVP ?
Following the classic and definitive work on venous pressure by Landis and Hortenstine, Hughes and Magovern used right atrial pressure monitoring to guide blood volume replacement in patients who had undergone thoracotomy. Wilson and coworkers developed the CVP catheters. Because of its simplicity and availability, CVP monitoring is routinely used to guide fluid therapy in emergency conditions associated with blood volume deficits. CVP give us a somewhat good estimate about the effective circulatory blood volume and the venous return. Wide variation in the CVP may occur if (1) the central line slips into the right ventricle, (2) in severe right‐sided heart failure and dilation of the atrioventricular ring and (3) in cases of tricuspid insufficiency. Besides cathetherization, CVP can be estimated at bedside: The internal jugular pulsations are transmitted to the neck of the patient and are observed by the examiner so the top level of pulsations can be determined. (The major movement of jugular pulse corresponds to x+x’ descent and sometimes is the only one observed. The remaining waves are too small to detect by inspection). An imaginary horizontal level is traced from this point. The sternal angle (Louis) is defined as the zero level. Trace a vertical line form this latter until this line meets the horizontal one previous traced. Measure in centimeters the vertical distance between the sternal angle and the meeting point. Normal upper limits are 2 cm when patient is supine and 4.5 cm when the head is elevated 45 degrees. Invasive methods have shown that normal value of CVP ranges between ‐2 and 6 mmHg, according to the respiratory phase. CVP is decreased in negative pressure breathing and in shock. It is increased in congestive heart failure, positive pressure breathing, cardiac tamponade and right ventricular failure.
35 | P a g e
The Arterial System
Importance: The arteries carry blood away from the heart to the tissues. The aorta branches toward periphery until blood reaches the arterioles and finally, the capillaries. The arterioles are the main site of resistance to the pumping function to the heart (accounting for approximately 50%) and also control blood flow into the capillaries. The mean arterial pressure - (MAP) is the product of cardiac output (CO) by the total peripheral resistance (TPR). Many anti-hypertensive drugs change one or both of these two parameters trying to lower blood pressure levels.
Defining Terms: Whenever the left ventricle ejects blood into the aorta, some energy derived from contraction is actually stored in the arterial walls in the form of potential energy. This latter accounts for the elastic recoil of the arteries that keeps capillary forward blood flow. This is an intrinsic property of the arteries: if their walls were build up of rigid tubes, one should expect no flow during diastole and pressure would fall to zero levels. The heart work in this way would be twice than the normal. Thus, the arterial system works like a hydraulic filter and lessens the excessive cardiac work of intermittent pumping.
Mean Arterial Pressure: It is the average pressure reached inside the arteries. The area under the arterial pulse curve (see below) is calculated by means of an integral function which yields the MAP. For the sake of simplicity, the MAP is nearer the levels of diastolic pressure than the systolic ones and can be estimated by the formula: MAP = Pd + (Ps - Pd)/3, where Pd and Ps are the diastolic and systolic pressure respectively, which are the minimum and maximum pressure levels reached in the arteries at a single cardiac cycle. Normal values of MAP varies widely but usually ranges between 77-97 mmHg.
Compliance is defined as the slope of the pressure-volume family curves ( C=dV/dP). An old patient will show a right shifted, flattened curve comparing to a young person, whose curve will be sigmoidal and left-shifted. Therefore, dV/dP generally is higher in this group than in the older s. Grossly speaking, compliance refers to the capacitance of the arterial system to accommodate volume in a specific level of pressure. In anyone with decreased arterial compliance, the heart at systole will eject blood into the rigid system slower than into a more compliant one, and peak arterial pressure will occur late in systole.
Pulse pressure is the difference between systolic and diastolic pressure and is mainly dependent on stroke volume and arterial compliance. If the first increases, the pulse pressure increases proportionally. The relationship is inverse regarding to compliance: as this one diminishes, the pulse pressure rises. As far as we travel along the arterial tree, the pulse pressure becomes higher - the systolic pressure in the radial artery may exceeds that of the aorta by 30%. However, MAP tends to be similar.
The Arterial Pulse Curve. Whenever the ventricles contract and eject blood into the great arteries, a pulse wave is generated and is transmitted along the arterial system. This wave has a finite velocity, far higher than blood velocity. The palpable pulse is the tactile sensation of this wave. As one travels along the system, the pulse wave becomes more distorted and the high frequency incisors disappears. A diastolic hump may be seen. Whenever the pulse wave reaches branching points in the system, some is returned back, like a mirror reflecting images. Actually the pulse wave is a mechanical event originated

36 | P a g e
from the ventricular contraction, which travels along the arteries, and is influenced mainly by the stroke volume and the intrinsic elastic properties of the arteries.
Putting all together: Keeping otherwise variables constant, the arterial pressure will vary in a proportional fashion to the volume increments inside the vessels. This volume increment, at each cardiac cycle, depends upon the rate of inflow into the arteries (Qi - cardiac output) and rate of outflow (Qo - peripheral run-off). At equilibrium, Qi and Qo should be similar and so would be the volume increment (V2 - V1). Therefore, in this model, V1 relates to the diastolic pressure, V2 to the systolic pressure and the Vm to the MAP. The variation of volume with time is: (1) dV/dT = Qi - Qo Qo is dependent on the peripheral resistance, according to the Ohm’s law: (2) R= MAP / Qo By definition of compliance: (3) C = dV/dP => dV=C.dP Therefore, C.dP / dT = Qi - Qo which yields: (4) dP/dT = Qi - Qo / C
According to the equation (4) above, if at anytime Qi exceeds Qo, arterial pressure (Pa) will rise until equilibrium is reached (Qi=Qo). The height to which Pa will rise is independent of the arterial wall compliance (C). This one will determine only the rate at which Pa values will be reached. Therefore, the greater the compliance the slower will be the rise.
If the resistance rises, Qo will be lower, according to the equation (2) and Pa will rise until Qo equals Qi again reaching the new equilibrium value.
Therefore the arterial pressure will be a function of Qi and Qo variations over the time. As Qo varies mainly with the resistance, one should conclude from the present discussion that:
The mean arterial pressure is dependent only on the cardiac output and the peripheral resistance. Actually, this is the Ohm’s law applied to the entire cardiovascular system: MAP = CO x TPR.
Regulation of blood pressure - 1) Rapid-acting mechanisms - are achieved by the baroreceptors, localized mainly in the carotid sinus. Whenever the carotid wall is stretched, the Hering or carotid sinus nerve, which is a branch of the glossopharyngeal nerve (IX pair), discharges and will stimulate inhibitory areas of the vasomotor center, and the autonomous system will down-regulate blood pressure via efferent vagal (X pair) pathways. The baroreceptors are only sensitive to MAP variations and they adapt in 1 to 3 days to whatever blood pressure they are exposed to. Vasomotor or Traube-Hering waves are cyclic increases and decreases in blood pressure probably due to the oscillations of baroreceptors activity over the time.Atrial reflexes - when atrial walls are distended, reflex vasodilatation and tachycardia occur.
2) Moderately rapid-acting mechanisms - refers to the actions of the circulating hormones as catecholamines, endothelins, prostaglandins, nitric oxide, angiotensin and others.
3) Long-term regulation - differs from the rapid-acting because this is a non-adaptive mechanism, providing a sustained regulatory effect. The Kidney is the main site for this regulation, controlling the volemia through the reabsorption of sodium (Na+) and water, this one being influenced by the renin-angiotensin-aldosterone system (RAA).

37 | P a g e
Measurement of Arterial Pressure is routinely made in ambulatory or home devices. The sphygmomanometer consists of a cuff which is wrapped and inflated around the patient’s arm until the systolic pressure is overcome. At this moment, the brachial artery will be occluded. With the stethoscope positioned over the brachial artery area, one should release gradually the pressure from the bag (3 mmHg each heartbeat) and listen carefully for the Korotkoff sounds, which indicates the systolic blood pressure level, until they muffle or disappear (diastolic pressure).
The normal levels cannot be accessed accurately because blood pressure vary widely during the day (circadian pattern) and is influenced by many factors and one cannot diagnosis arterial hypertension with only one measure (see below).
The blood pressure (BP) lacks diagnostic specificity: decreased BP occurs in circulatory decompensation while increased pressure may indicate improved circulatory function, adrenal stress response or excessive vasopressor therapy. The pulse pressure increases with age due to decreased compliance, mostly by the cost of the systolic levels. The average of this increment is 100 plus the age, in mmHg. (eg., a 60 years old person may have systolic pressure of 160 (100 + 60) mmHg. Normal levels of blood pressure usually are 120/80 mmHg with the pulse pressure ranging from 40 to 50 mmHg. Young adults (especially teenage girls) may normally have BP as low as 90/60 mmHg. It is important to know the patient’s baseline, pre-illness pressures. Decreased pulse pressure may be an early sign of hypovolemia
Intra-arterial blood pressure is more accurate and may exceed cuff measured values by 2 to 8 mmHg (in critical patient this difference may exceed 30 mmHg). The method consists of a system of catheter connected to an artery, and pressures transducers which transmits signs to a monitor which displays the arterial BP waveforms, the systolic and diastolic pressures and the MAP. Intra-arterial measurement is indicated in shock, critically-ill patients and intra operative and postoperative monitoring in patients undergoing extensive and/or life-threatening surgeries.
Pathological Pulse Waves
Pulsus paradoxus - is defined as an exaggerated decrease in systolic pressure of 8-10mmHg or more during inspiration. It was described by Kusmaull who gave the name paradoxus because the pulse of his patient was not felt by him whenever the patient inspirated, despite the yet existing heartbeats. Inspiration increases venous return therefore increasing the right heart output transiently, according to the Frank-Starling’s law. Blood will be “sequestered” in the pulmonary circulation and the left heart output will be reduced transiently, accounting for the normal (< 8-10mmHg decrease) lower systolic pressure during this phase. Right ventricle contracts more vigorously during this phase and may bulge mechanically the interventricular septum toward the left ventricle, reducing its size and also may account for the lower systolic levels. Conditions likely to cause pulsus paradoxus are: Cardiac tamponade, severe COPD and mechanical positive pressure ventilation.
Pulsus alternans - is an alternating weak and strong contractions causing a similar alteration in the strength of the peripheral pulse. It may be found in severe heart failure and heart block.
Watter hammer pulse - is the bounding pulse (+4/+4) felt in severe aortic regurgitation where the pulse pressure is wide. This name is derived from a toy that produced similar boundings when managed.

38 | P a g e
Pulsus parvus et tardus - is the classical aortic stenosis pulse and feels like a “caress” under the examiner’s fingers in contrast to the tapering pattern of the normal pulse. In aortic stenosis, the stroke volume is reduced but the rapid ejection phase is prolonged because of the high pressure gradient. The volume increment inside the aorta will be less pronounced and delayed, producing this pulse pattern.
Pulse deficit or weak and threading pulse - is the weak pulse (+1/+4) of the shock syndromes, reflecting an underlying circulatory insufficiency
The Cardiac Endothelium
Introduction:
"...Cinderella of the Heart...
Once upon a time, in a kingdom far away, there lived a lovely maiden named Endo. She had a sweet and gentle nature and always went about her chores with a song and a smile. Endo lived with her cruel stepmother, Cardia, and two ugly stepsisters, Myo and Peri. Cardia forced Endo to work as a maid for the family, doing all of the cooking and cleaning. Endo's stepsisters were jealous of her beauty and sweet disposition, and forced her to wear rags while they were dressed in fine gowns. But beautiful clothes could not hide their nasty natures and rags could not hide Endo's gentle grace. Through all of her hardships, she remained pleasant and kind..."
The text above was extracted from "The Endocardium", by Brutsaert1 and it should reinforce that cardiac endothelium is not a passive barrier between blood and myocardium, as we thought in the past, but indeed, its regulatory function on myocardium is now unquestionable.
Embriology
The endocardium endothelium (EE) is one of the most primitive strucuture in the human heart. Its development preceeds that of the coronary vessels. Between the primitive endocardium and the embrionary myocardium, there is the cardiac jelly. Therefore, this last one and the EE are the only structures separating myocardium from the tubular heart lumen blood of the fetus. Before coronary vessels develop, substances diffuse through sinusoids to reach adjacent miocytes. ( The Tebessian veins may be the remanescent sinusoids ). The coronary vessels in Pisces and Reptilia only exist in epicardial surface while there is no coronary circulation in cyclostome, and in this latter, exchange of substances between myocardium and blood occurs through EE. Therefore the EE, together with heterometric autoregulation (Frank-Starling mechanism), seems to be one of the earliest organ to develop and modulate cardiac function, interacting with the superfusing blood and with the subjacent myocardium.
Morphology
Endothelial cells structure differ in many ways depending on its location and this feature can be explained, at least in part, by different microenviroments. The EE cell is thin, with numerous microvillis and invaginations on its surface membrane. This called attention for a possible sensor sign role of these cells, since they are exposed to a large surface-area. They own a bulging nucleus and relatively well developed Golgi apparatus, speaking in favor of a secretory role of this cells. Numerous

39 | P a g e
intercellular gap juctions were showed on electronic microscopic technics, speaking again in favor of their sign-transducing function, as we know that gap junctions are low-resistance channels and ions or second messagers can pass through them easier, amplifing a specific signal. Stress fibers (actin filaments) are components of the cytoskeleton and are oriented mainly by shear-stress forces. (In aorta endothelium they are oriented more vertically). Weibel-Palade bodies has been shown too, as well as some EE receptors: atrial natriuretic pepide (ANP), endothelin (ET), A and B types, and angiotensin converting enzyme (ACE) ones.
Function
The question is: What happens with cardiac function if EE is damaged ?
This can be answered by plotting force development (in Newtons) with time and comparing the two curves (intact versus denuded endothelium). The latter shows a smaller and faster curve but with no significant changes in the slope of the curve, indicating that Vmax (slope of the curve) remained unchangable. This differs from virtually all others forms of negative inotropic interventions such as reduced extracellular calcium or cAMP-mediated effects, which are all associated with a decrease in Vmax. The substance used to injury EE was Triton x-100, a mild detergent. Intracardiac US was the method used by investigation in vivo animal models, and the results were similar. We can extrapolate this curve to the entire heart by plotting LVP with time, and a similar pattern is found. In other words, the presence of an intact EE helps modulating left ventricular function (LVF) by prolonging ejection duration and slightly increasing systolic peak performance.
How EE modulates LVF ?
Myocardial inotropic state depends primarilly on the amount of transient intracellular calcium [Ca2+]i and the affinitty of the contractile proteins for the avaiable calcium. Wang and Morgan reported the effects of a denuded EE in differents [Ca2+]i. Even when the latter was increased, the final results were of that described above. Therefore, EE seems to modulate the affinity of the contractile proteins. With EE damage, there is a decreased responsiveness of these proteins thereby decreasing contractile permormance.
How EE can alter the affinity of these proteins ?
There are two main theories that try to answer this question, though they may act together:
1) Stimulus-Secretion Coupling and EE mediators -- Many studies indicated that the resting membrane potential (Vm) is important for endothelium Ca2+ homeostasis and the release of endothelium-derived factors. The Vm is influenced by a variety of ion channels, such as K+, Na+/K+ ATPase pump, Cl-, and substances such as ATP, ADP, AMP, histamine and substance P. There is now increasing evidence suggesting that EE may release chemical mediators, which may determine the myocyte inotropic response. Nitrous oxide (NO), prostaglandins and endothelins are suggested in this setting.
a) NO - this substance is produced from L-arginine by the NO synthase enzyme. Its main subcellular action is activation of guanylate cyclase, which elevates [cGMP]i . The latter seems to reduce the

40 | P a g e
responsiveness of the myofilaments to intracellular calcium, thereby the net effect is a negative inotropism. However, it seems surprisingly, that some in vivo and in vitro studies have shown positive inotropic properties of basal cGMP contents. The hypothesis is: NO and cGMP inotropic actions would depend, at least in part, of the myocardial [cGMP]i which may be determined by the integrity of the EE
.
b) Prostaglandins - PGI2 may also contribute to the underlying myocardium function. Tissue cyclooxygenase has been found twice in the endocardium fraction compared with that of the myocardium. Its inotropic properties are very poorly known, but new researches suggest that basal release of NO and prostaglandins and their interaction may modulate myocardial relaxation. The subcellular actions of PGs at myocardial level are not fully understood.
c) Endothelin - This 21 amino-acid peptide has at least two receptors, ET-A and ET-B, found in myocytes, conduction system and vascular and EE cells. It is a very potent positive inotropic substance, and its action resembles that of the EE, also increasing responsiveness of the contractile proteins bu through activation of a sarcolemmal Na /H exchanger. Besides of these effects, ET also has positive chronotropism properties, is a potent vasoconstrictor and can induce proliferation of vascular smooth cell and cardiac muscle. It is difficult to to understand the physiological role of ET in the heart if its net effect is an increase in MVO2. There is growing evidence that ET may bind to its receptors in a stoichiometrical pattern, suggesting that ET may act in an autocrine way, binding to ET-B receptor and stimulating NO an PGs release, rather than causing direct vasoconstriction. Some studies suggest the protective effect of ET during ischemia, opposing the adverse actions of cathecolamines mainly on cardiac electrophysiology, thereby preventing arrythmias. Conversely, one study showed that ACE inhibitors, by supressing ET secretion, improved coronary function and the stabilization of cardiac rhythm after ischemia in rat hearts, suggesting the use of ET receptors antagonists as an antiarrhythmic drug.
2) Blood-Heart Barrier - The most studied endothelium barrier is the blood-brain barrier (BBB), which has unique features that are crucial to keep neural tissue in optimal conditions. Some of these features include thigh endothelial junctions and selective ions transporters, which help to modulate ionic concentrations in interstitial milieau. Similar to the BBB, the EE may function as a blood-heart barrier (BHB), providing optimal environment for myocytes function. One feature of the EE that suggests this role is the different density of ionic channels on the luminal side comparing with the abluminal one. Therefore, there may be a transendothelial transport regulating ionic composition of extracellular space, which is crucial for myocyte function. Further studies are needed to confirm this hypothesis.
Clinical Implications
Cardiac endothelium is a modulator of ventricular function and its damage or dysfunction is actually a factor in the development of heart disease. Understanding clearly how EE modulates underlying myocardium is undoubtely useful, since new drugs can be experimented in this relatively new field, improving myocardial function by interacting directly or indirectly with the EE. One of the most utilized animal model of chronic heart failure is the dog one. Multiple sequential coronary microembolizations are performed during a specific period of time until ejection fraction reaches a low,

41 | P a g e
pre-determined value. Endothelin blood levels, like cathecolamines, angiotensin ones, are increased in chronic heart failure. In one sudy, performed in this dog model described above, bosentan (endothelin receptor antagonist) improved LVF in a short-term basis and this drug could be proved useful in humans patients with heart failure.
Developmental Aspects of the Heart Embryonic heart chambers
Sinus venous Atrium Ventricle Bulbus cordis
Fetal heart structures that bypass pulmonary circulation Foramen ovale connects the two atria Ductus arteriosus connects pulmonary trunk and the aorta