Embed Size (px)
Citation preview
Journal of Development Economics 107 (2014) 84–96
Contents lists available at ScienceDirect
Journal of Development Economics
j ourna l homepage: www.e lsev ie r .com/ locate /devec
Height, skills, and labor market outcomes in Mexico☆
Tom S. Vogl363 Wallace Hall, Princeton University, Princeton, NJ 08542, United States
☆ I thankDavid Cutler, Larry Katz, Jeff Liebman, DuncanTinar participants at Academia Sinica, Harvard, and the Pments. This research was supported by the NSF GraduMultidisciplinary Program on Inequality and Social Policand the NBER Aging Program (NIA Grant T32-AG000186)
E-mail address: [email protected] See, for example, Persico et al. (2004) and Case and Pax
Lundborg et al. (2009) on Sweden; Thomas and Strauss (1Bouis (1991) on the Philippines. The return to height wasple among slaves in the antebellumAmerican South (Marg19th century German workers (Komlos, 1990).
0304-3878/$ – see front matter © 2013 Elsevier B.V. All rhttp://dx.doi.org/10.1016/j.jdeveco.2013.11.007
a b s t r a c t
a r t i c l e i n f oArticle history:Received 20 May 2011Received in revised form 29 October 2013Accepted 18 November 2013
JEL classification:I15J24O15
Keywords:HealthDevelopmentHeightLabor productivity
Taller workers are paid higher wages. A prominent explanation for this pattern is that physical growth andcognitive development share childhood inputs, inducing a correlation between adult height and two productiveskills: strength and intelligence. This paper explores the relative roles of strength and intelligence in explainingthe labor market height premium among Mexican men. While cognitive test scores account for a limited shareof the height premium, roughly half of the premium can be attributed to the educational and occupationalchoices of taller workers. Taller workers obtain more education and sort into occupations with greaterintelligence requirements and lower strength requirements, suggesting a possible role for cognitive skill.
© 2013 Elsevier B.V. All rights reserved.
1. Introduction
In a wide range of economies—rich and poor, historical andcontemporary—taller workers earn more than their shorter counter-parts. 1 Given the ubiquity of this relationship, researchers have devotedconsiderable effort to determining its origins, setting forth numeroushypotheses. One theory, popular for developing economies, posits thatthe returns to stature derive from the greater strength (and health) oftaller individuals, which leads to a productivity advantage in economiesthat rely heavily onmanual labor (Haddad andBouis, 1991; Thomas andStrauss, 1997). For industrialized economies, explanations have beenmore varied, typically involving social–psychological pathways suchas self esteem (Freedman, 1979), social dominance (Hensley, 1993),discrimination (Hamermesh and Biddle, 1994; Loh, 1993), and thesocial consequences of being short in adolescence (Persico et al.,2004). However, more recent research on the U.K. (Case and Paxson,
homas, RobertWillis, and sem-AA meetings for helpful com-ate Research Fellowship, they (NSF IGERT Grant 0333403).
son (2008) on theU.S. andU.K.;997) on Brazil; and Haddad andalso high historically, for exam-o andSteckel, 1982) and among
ights reserved.
2008) suggests that the height premium has much to do with a correla-tion between height and cognitive skill. Like the strength-based expla-nation, the cognitive skill theory is rooted in the idea that physicalgrowth and skill development sharemany inputs—such as health, nutri-tion, and care in early life—so that for a given genetic height potential,people who achieve greater stature also tend achieve greater skill.
The extent to which cognitive skill (and human capital more gener-ally) explains the height premium in contemporary developing econo-mies is an open question. The reliance of these economies on manuallabor does not necessarily bias them towards a solely strength-basedheight premium. Cognitive capacity improves entrepreneurship, thecapacity to adapt to shocks, and general problem-solving skills, whichmay be valuable even entirely agrarian economies. For example, theliterature on technology adoption in developing countries has empha-sized the abilities of farmers to learn about the optimal uses of newseed varieties and fertilizers (Duflo, 2001; Foster and Rosenzweig,1995). Along these lines, Hanushek and Woessmann (2008) arguethat cognitive skill is a fundamental determinant of individual income,the income distribution, and the rate of economic growth in developingcountries.
This paper examines the relative roles of strength and intelligencein forging the link between height and labor market outcomes inMexico, a country that straddles the line traditionally dividing econo-mies intensive in manual labor from those intensive in skilled labor.The term “strength” is meant to encompass physical health, robustness,and endurance. The analysis takes advantage of rich data from theMexican Family Life Survey (MxFLS),which includesmodules on health,anthropometry, cognitive skill, parental characteristics, and labor

85T.S. Vogl / Journal of Development Economics 107 (2014) 84–96
market outcomes. As the first nationally representative survey from adeveloping country to administer cognitive tests to working-age adults,theMxFLS provides a unique opportunity to unpack the height premiumin a less industrialized setting.
Several existing studies explore the relative returns to strengthand intelligence in developing country labor markets. Pitt et al. (2012)focus on body mass endowments (rather than height) in Bangladesh,showing that larger men are more likely to engage in energy-intensiveactivities, while larger women are less likely. They argue that thesesorting patterns are consistent with a high return to physical skill;body mass is more strongly correlated with strength for men than forwomen. Rosenzweig and Zhang (2012) complement these results in astudy of Chinese twins, finding that female twins with higherbirthweight attain more education, while male twins with higherbirthweight develop greater adult body mass. On the other hand,Behrmann et al. (2009) use data from Guatemala to argue that brains,not brawn, have significant wage returns. 2 Both studies follow in thetradition of an earlier paper by Thomas and Strauss (1997), whichfinds that wages are positively related to height, body mass, and nutri-ent intake among Brazilian men. Thomas and Strauss document inter-esting heterogeneity in the elasticity of wages with respect to bodysize. In the market sector, height and earnings are most strongly corre-lated among themost educated workers, suggesting a role for cognitiveskill. But in the self-employed sector, the correlation is strongest amongthe illiterate, who primarily engage in physical labor, suggesting a rolefor strength. 3 Note that many of these studies' interesting results con-cern sectoral affiliation; Pitt et al. (2012) study the sorting of workersacross sectors,while Thomas and Strauss (1997) glean their conclusionsfrom effect heterogeneity across sectors.
This paper also devotes much attention to the sectoral affiliations oftaller and shorter workers. The paper begins with an exploration of therelationships linking height, cognitive skill, education, and earnings, butit thenmoves on to its primary contribution, an analysis of height-basedoccupational sorting. To avoid issues of endogenous labor force partici-pation, the analysis sample only includes male workers, among whomeach centimeter of height is associated with 2% higher hourly earnings.This premium is similar to those observed in other developing countriesbut more than twice those observed in most wealthy countries. 4 Child-hood health conditions and parental socioeconomic status explain asubstantial share of this height premium, but the premium remainsstatistically and economically significant even after adjustmentfor these background characteristics. However, cognitive test scoresaccount for only a limited part of the height premium. The test instru-ment is relatively crude, so its coefficient may be attenuated. At thesame time, because survey respondents took the test in adulthood,their scores may in part reflect job-related opportunities to practicecognitive tasks, which would tend to (spuriously) inflate the role ofcognitive skill. Regardless, the findings do indicate that roughly half ofthe premium can be attributed to the sorting of workers across skillgroups or occupations.
The rest of the paper focuses on this sorting. Based on a new linkageof Mexican occupational categories to job characteristics from the U.S.Dictionary of Occupational Titles (DOT), the paper considers theskill requirements of occupations with greater concentrations of tallworkers. In line with the evidence from industrialized countries, tallerworkers select into occupations with higher intelligence requirementsand lower strength requirements. This result is consistent with Roy's(1951) model in which taller workers have a comparative advantage
2 Importantly, Behrmann et al.'s (2009) conclusions rest on quite strong exclusion re-strictions. Their instruments for cognitive skill and body size include childhood proximityto a health post, class size at age 7, birth cohort, and parental characteristics.
3 Thomas and Strauss (1997) also find that the returns to body mass are uniformlystronger among the illiterate.
4 See the sources listed in footnote 1.
in intelligence-intensive tasks. Importantly, education mediates nearlyall of the relationship between height and occupational choice; tallerworkers tend to have more education, and educated workers tend towork in skill-intensive occupations. The role of education has two natu-ral interpretations. First, parents' propensities to invest in child healthand education may be correlated, a hypothesis raised by both Haddadand Bouis (1991) and Thomas and Strauss (1997) as a caveat to theirargument that the height premium reflects a return to strength. Second,the early-life conditions that promote growth in childhood alsopromote cognitive development, which may raise the productivity ofeducational investments.
As a consequence, although the paper contributes several newfindings to the literature on the correlates of height, these findings donot pin down a single interpretation. Scores on a (crude) cognitivetest account for little of the height premium in earnings regressions,suggesting that cognitive skill maymatter less in Mexico than in Britain(Case and Paxson, 2008). But taller workers obtain more schooling andsort into skill-intensive occupations, reintroducing a possible rolefor cognition. These two sorting results may be driven either by sharedinputs in the production of physical and cognitive skill or by unobservedheterogeneity in parental investment. In either case, the data suggest animportant role for human capital in explaining the earnings premiumpaid to taller workers.
The paper proceeds as follows. Section 2 reviews of the literature onthe early-life determinants of height and skill, which Section 3 fits into aconceptual framework to understand the relationship between heightand labor market outcomes. A description of the data sources followsin Section 4. Section 5 reports the results of earnings analyses, whileSection 6 reports the results of occupational choice analyses. Section 7concludes.
2. Growth, cognitive development, and adult achievement
Adult height reflects the interaction of genetic and environmentalfactors from thewomb to adulthood (Tanner, 1979). During this period,an individual experiences two phases of intense growth, the first duringgestation and infancy—from ages zero to three—and the second duringadolescence. Good nutrition and freedom from infection during theseperiods, particularly the first, are critical to achieving optimalgrowth. Apart from its direct effects on growth, nutritional depri-vation increases young children's susceptibility to infection. Infec-tion, in turn, inhibits nutrient absorption and appetite, leading to a“synergism” between nutrition and infection (Scrimshaw et al.,1968).
The prenatal and very early postnatal periods appear to be of partic-ular importance for adult height. Early-life adversity may alter tissuedifferentiation and development in ways that boost short-run survivalat the expense of long-run health (Barker, 2001). A growing body ofresearch indicates that deprivation during this period—whether insideor outside the womb—has lasting effects on stature. Among identicaltwins in Norway, those born with a 10% birthweight advantage overtheir twins gain an extra 0.6 cm in height by age 18 (Black et al.,2007). Results of this type extend as far as rural Indonesia, whereMaccini and Yang (2009) show that women exposed to above averagerainfall in their birth years attain significantly greater heights. 5 In a sim-ilar vein, among French soldiers in the 19th and early 20th centuries,childhood exposure to the grape vine parasite phylloxera reducedadult height, presumably through a reduction in parental income(Banerjee et al., 2010).
Negative health and nutrition shocks, both in utero and in earlychildhood, have similarly detrimental effects on cognition and physical
5 Interestingly, Maccini and Yang do not find similar benefits of early-life rainfall formen.
86 T.S. Vogl / Journal of Development Economics 107 (2014) 84–96
strength later in life. In industrialized countries, a large body of researchhas documented cognitive deficits among children born with low birthweight (Breslau, 1995). 6 The specific effects of low birth weight arenot well-documented in developing countries, but randomized trialshave confirmed the effects of nutrition on cognition in such settings(Grantham-McGregor, 1995). 7 Evidence linking early-life health andmuscle strength in adulthood is somewhat rarer, but a number ofstudies in rich and poor countries have shown a positive relationshipbetween birth weight and muscle strength over the lifecourse (Doddset al., 2012).
Combined, these results suggest that superior health and nutritionpromote both physical growth and cognitive development. 8 Indeed,height is correlated with cognitive test scores in children from a rangeof settings. 9 This association carries well into adulthood, as evidencedin Hawaii (Abbott et al., 1998), the U.K. (Case and Paxson, 2008;Richards et al., 2002), urban Latin America (Maurer, 2010), and China(Huang et al., 2012). Taller individuals' enhanced cognitive skills mayalso increase the productivity of schooling, which may explain thecorrelation between height and education, observed in such diversesettings as Brazil (Strauss and Thomas, 1998), India (Perkins et al.,2011), Sweden (Magnusson et al., 2006), and the U.S. and U.K. (Caseand Paxson, 2010). Height is also associated with physical strength inadults (Lundborg et al., 2009; Tuvemo et al., 1999).
3. Conceptual framework
The current knowledge on the co-evolution of body size, strength,and cognitive skill fits nicely into a theoretical framework in thetradition of Roy (1951). In a complementary line of work, Pitt et al.(2012) and Rosenzweig and Zhang (2012) also use the Roy modelto study strength and cognitive skill in developing economies. Fortractability, they use the functional form assumptions of Ohnsorgeand Trefler (2007) and derive predictions for gender and occupation-al segregation. In the framework below, I aim to conceptualize key is-sues in the relationship between height and labor market outcomes,rather than derive analytic results. As such, I do not assume function-al forms.
Let h, υp, and υc denote a worker's height, physical ability (includingstrength, health, and robustness), and cognitive ability, respectively. Forclarity of exposition, we treat υp and υc as endowments that are fixedafter early childhood; when we specify the wage function below, wewill allow workers to augment their cognitive ability endowmentsthrough investments after early childhood. The three worker traitshave the following production functions:
h ¼ h N;B;D;X; εhð Þυp ¼ υp N;B;D;X; εp
� �υc ¼ υc N;B;D;X; εcð Þ
6 In Black et al.'s study of Norwegian twins, a 10% increase in birth weight increases age18 IQ by roughly one third of a standard deviation. Richards et al. (2002) find similarly-sized associations among young British adults who were born with low birth weight.
7 In one well-known trial in Jamaica (Grantham-McGregor et al., 1991), administrationof milk-based formula to young stunted children led to substantial gains on developmen-tal tests, especially when researchers coupled cognitive stimulation with nutritionalsupplementation.
8 Height and intelligence may share common chemical antecedents, including insulin-like growth factor (Berger, 2001) and thyroid hormone (Richards et al., 2002).
9 Conditional on age, sex, and family background characteristics, the correlation ofheight and cognitive test scores is roughly 0.05–0.10 among both British children (Caseand Paxson, 2008) and Ecuadorian children (Paxson and Schady, 2007). In a cohort ofPeruvian children, severe stunting at age two is associated with a one standard deviationdeficit in cognitive test scores at age nine (Berkmanet al., 2002). In a cohort of Filipino chil-dren, moderate stunting and severe stunting at age two are associated with a 0.25 and 0.6standard deviation decline in cognitive test scores at age eight (Mendez and Adair, 1999).
whereN denotes childhood nutrition andhealth inputs,B denotes child-hood background characteristics, D denotes the childhood disease envi-ronment, X is a vector of exogenous demographic controls, and{εh,εp,εc} are mutually independent error terms. The three productionfunctions share partial derivatives of the same sign with respect to N,B, and D. Thus, conditional on X, h, υp, and υc are positively correlated.
Upon reaching adulthood, the worker faces a labor market withJ sectors, indexed j. The worker's potential wage in each sector is givenby:
wj ¼ wj υp;υc
; S;X; ε j
� �
where S denotes schooling and the other variables are defined as before.For all sectors, the partial derivatives of wageswith respect to υp, υc, andS are positive.
The simplest formulation of the model would have the worker andhis parents choose {N,S,j} to maximize a utility function over parentalconsumption (C) and the worker's wage in adulthood:
U C;wj υp;υc
; S;X; ε j
� �� �:
Maximization would then be subject to the following budgetconstraint:
I ¼ pCC þ pNN þ pS þ ψ υp;υc
; εψ� �h i
S
where I is parental income; pC, pN, and pS are the prices of parental con-sumption, child nutrition and health inputs, and schooling, receptively;and ψ(⋅) is the opportunity cost of schooling. The opportunity cost ofschooling can be thought of aswage income from teenage employment.
This simple setup with no uncertainty delivers the main predictionsof the paper. First, it leads to an unambiguously positive correlationbetween height and wages, working through the production functionsfor h, υp, and υc. 10 Second, if cognitive ability increases the productivityof schooling in all sectors (∂2wj/∂υc∂S N 0 for all j)—as the literature onthe returns to schooling typically assumes (Card, 2001)—then tallerindividuals obtain more schooling. Third, if the sector-specific returnsto cognitive ability are large and heterogeneous (relative to the returnsto physical ability), then taller workers sort into sectors with higherreturns to cognitive ability. At the same time, the fact that parentsmaximize their utility suggests a caveat; many of the same patternsmay result from heterogeneity in parental income and preferences.Parents who invest more in their children's health may also investmore in their children's schooling, for reasons unrelated to the cross-partial ∂2wj/∂υc∂S.
A more realistic version of the model would separate the decisionprocess into three stages—nutrition, schooling, and sectoral choice—and would introduce environment, income, and labor market shocksat each stage. This setup would not only deliver similar predictionsbut also allow for correlations between height and labor market out-comes after controlling for parental characteristics like income. In eithercase, the principal results derive from the fact that h, υp, and υc shareinputs.
Much of the empirical analysis focuses on the sorting of workersacross sectors, measured as occupations. Ideally, one would studyboth occupational choice and within-occupation skill returns, to verifythat taller workers indeed sort into occupations with high returnsto both height and either cognitive or physical skill. However, within-occupation skill returns are difficult to estimate. The researcher
10 On average, taller workers hold an absolute advantage over shorter workers (in bothphysical and cognitive ability), so the envelope theorem implies that theywill earn higheraverage wages after making their wage-maximizing choices.
Table 1Summary statistics, men aged 25–65.
Earnings analysis Occupational choice analysis
(1) (2)
Height (cm) 165.6 [6.9] 165.4 [7.0]Raven score 0.1 [1.0] 0.1 [1.0]Years of education 8.4 [4.6] 8.1 [4.8]Hourly earnings (2002 Mex$) 20.0 [18.6]Brawn occupation 0.89Age 40.1 [10.3] 41.0 [10.5]Indigenous 0.12 0.15Rural residence 0.20 0.23# of observations 5286 7401# of individuals 3860 4715
Notes: Weighted sample means, with standard deviations in brackets. The sample incolumn (1) only includes observationswith non-missingwages, and the sample in column(2) only includes observations with occupations that can be matched to the Dictionary ofOccupational Titles.
87T.S. Vogl / Journal of Development Economics 107 (2014) 84–96
observes only one realized wage per worker, rather than potentialwages in every occupation. As a result, within-occupation estimatesbased only on realized wages are inconsistent because sorting inducesa negative correlation between the skill and the error term. Withadequate panel data and structural assumptions, one can recoverwithin-occupation skill returns (see, e.g., Gibbons et al., 2005). Howev-er, these methods require substantial movement of workers across oc-cupations, and too few workers in the Mexican Family Life Surveychange occupations between survey waves. As a result, I focus on occu-pational choice, and I then compare the observed occupational sortingwith estimates of occupational skill requirements from the U.S. Dictio-nary of Occupational Titles.
4. Data
The analysis of height and labor market outcomes draws on datafrom the Mexican Family Life Survey (MxFLS), a panel with two waves(so far) in 2002 and2005. TheMxFLS, a nationally representative house-hold survey, included modules on household economic decisions andhousehold demographic structure, as well as individual-level questionson labor market participation, self-reported health, schooling, and theliving conditions that adults experienced while growing up. The surveyadministered a short cognitive test and also collected data on theheights and weights of all household members. To avoid sample selec-tion issues arising from endogenous labor force participation, I employdata on men aged 25–65.
To measure height and cognitive skill, I use standing height incentimeters and a cognitive test score based on the short-form Raven'sProgressiveMatrices test (Raven et al., 1983). 11 The Raven test,which isintended to measure abstract reasoning, presents the subject with aseries of patterns (called matrices), each with a missing element. 12
For each matrix, the subject selects the missing element from a bankof eight candidates. In the MxFLS, the adult Raven test comprised 12matrices. To obtain a composite measure of test performance, I sumthe number of correct responses and then standardize them among allmen in the MxFLS to have a mean of zero and a standard deviation ofone. In interpreting analyses of the Raven test score, two caveats areworthy of note. First, the test score measures accumulated cognitive
11 I trim the top and bottom 0.5% of the height distribution to reduce the influence ofoutliers.12 The Raven test exhibits high ‘g-loading,’ meaning that its score correlates stronglywith general factor intelligence, a unidimensional variable that many cognitive psycholo-gists hypothesize underlies cognitive skills (Carroll, 1993).
skill over the lifecycle, reflecting early-life cognitive development,schooling, and cognitive reinforcement learning in adulthood. Second,with only 12 simple matrices on the Raven test, the test score is anoisy measure of cognitive skill. Both caveats suggest that the Ravenscore is not an ideal measure of υc from the theoretical framework inSection 3. The first might lead us to overstate the effect of early-life con-ditions because of the endogenous reinforcement of cognitive skill overthe lifecycle (from having a cognitively demanding job, for example).On the other hand, the second might lead us to understate it becauseof attenuation bias.
I measure hourly earnings using an individually-administeredsurvey module on labor market outcomes over the previous year.Wages are notoriously difficult to measure in developing countries,given the prevalence of informal contracting and self-employment.However, the MxFLS posed a detailed set of questions that enable thecalculation of hourly earnings for awide variety of individuals, includingfarmers and small business owners. Every respondent answeredquestions about the number of weeks worked in his or her main job,the number of hours worked per week, and post-tax labor earnings.Non-working individuals reported on their previous jobs if theyworkedin the previous year. I compute hourly earnings for individuals who re-ported working 20 or more hours per week regularly over the previousyear. For wage earners, the survey collected data on earnings both overthe previous month and over the previous year. Appendix A describesthe algorithm used to reconcile differences between the monthly andannual reports.
Occupational classifications are crucial to the analysis. For theearnings analysis, I use the 19-category Mexican Classification of Occu-pations (MCO), but one cannot merge the MCO to measures of occupa-tional skill requirements from the Dictionary of Occupational Titles(DOT). As an alternative, I use the nine civilian occupations in the coars-er International Standard Classification of Occupations (ISCO), whichcan be matched to both the Mexican and the U.S. job classificationsystems. 13 From England and Kilbourne's (1988) job characteristicfile, which maps DOT measures to the three-digit detailed occupationalclassification of the 1980 U.S. Census, I assign measures of occupationalskill requirements to workers in the 1980 U.S. Census (Ruggles et al.,2008). Then, using the 1980 U.S. distribution of occupations, I thenaggregate the detailed occupation categories up to the nine-categoryISCO. This procedure assumes that the distribution of detailed occupa-tions and relative skill requirements within each broad ISCO categoryis the same in the 1980 U.S. and 2002 Mexico. Although these assump-tions are unlikely to hold exactly, the aggregation procedure can none-theless provide a useful guide to the skill content of height-basedoccupation sorting.
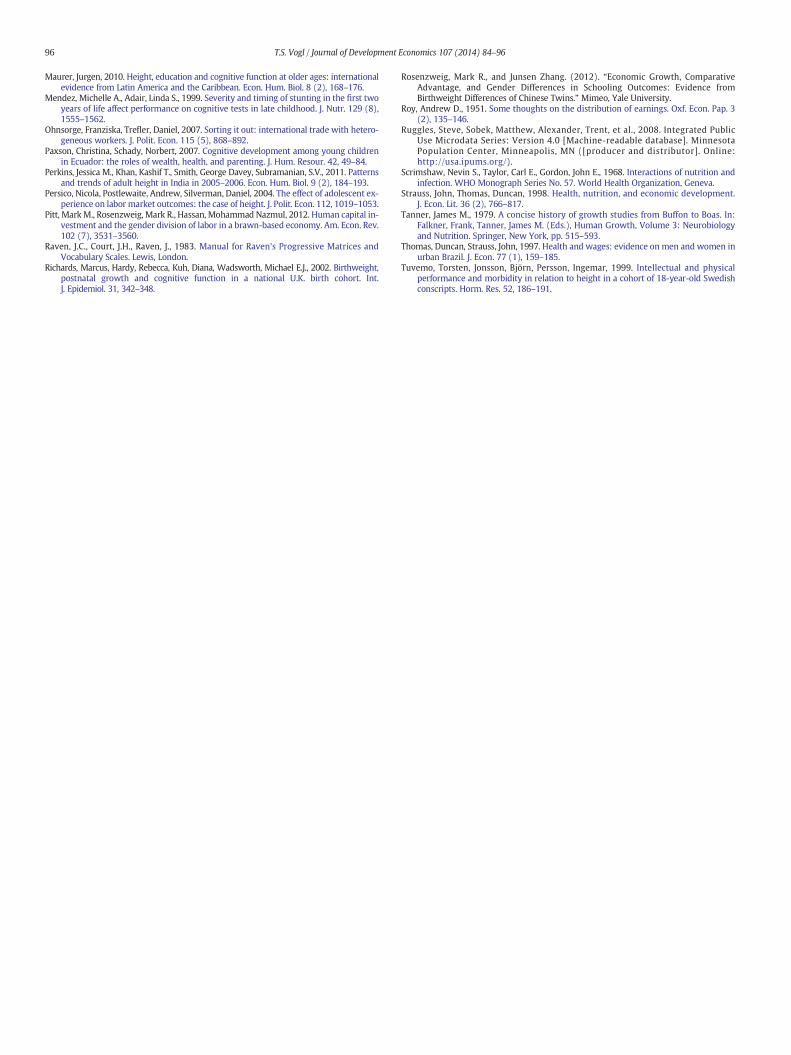
In the analysis of the DOT, I use the “intelligence aptitude” and“strength” intensities of each occupation as measures of cognitive andphysical skill requirements. Alternative measures from the DOT (suchas “numerical skills” and “physical demands”) yield results similarto those reported below. Some of the results are more interpretablewith a binary categorization of occupational skill requirements, sothat workers select either the “brains” sector or the “brawn” sector.Appendix Fig. 1 plots intelligence aptitude requirements againststrength requirements for the civilian occupations in the ISCO, revealingthat the occupations divide naturally into “brains” and “brawn” sectors.I define the two sectors as indicated in the figure.
In all analyses, I only use data on individuals who were in the 2002baseline survey wave. I use survey weights to estimate populationregression parameters, and I cluster standard errors at the primarysampling unit (PSU) level. 14 Because I only study original members of
13 Most of the two-digit MCO categories map perfectly onto the ISCO, but three do not:worker in personal establishments;worker in domestic services; and protection,monitor-ing and armed forces. In the analysis of skill requirements, I omit these occupation groups.14 Because the paper aims to describe the relationship between height and labor marketoutcomes at the national level, the use of survey weights is appropriate (Deaton, 1997).
22.
53
3.5
Ln(H
ourly
Ear
ning
s)
150 160 170 180
Height (cm)
46
810
12
Year
s of
Edu
catio
n
150 160 170 180
Height (cm)
−.5
0.5
1
Sta
ndar
dize
d C
ogni
tive
Tes
tS
core
150 160 170 180
Height (cm)3.
33.
43.
53.
63.
73.
8
Sel
f−R
epor
ted
Hea
lth S
tatu
s(1
=E
xcel
lent
, 5=
Poo
r)150 160 170 180
Height (cm)
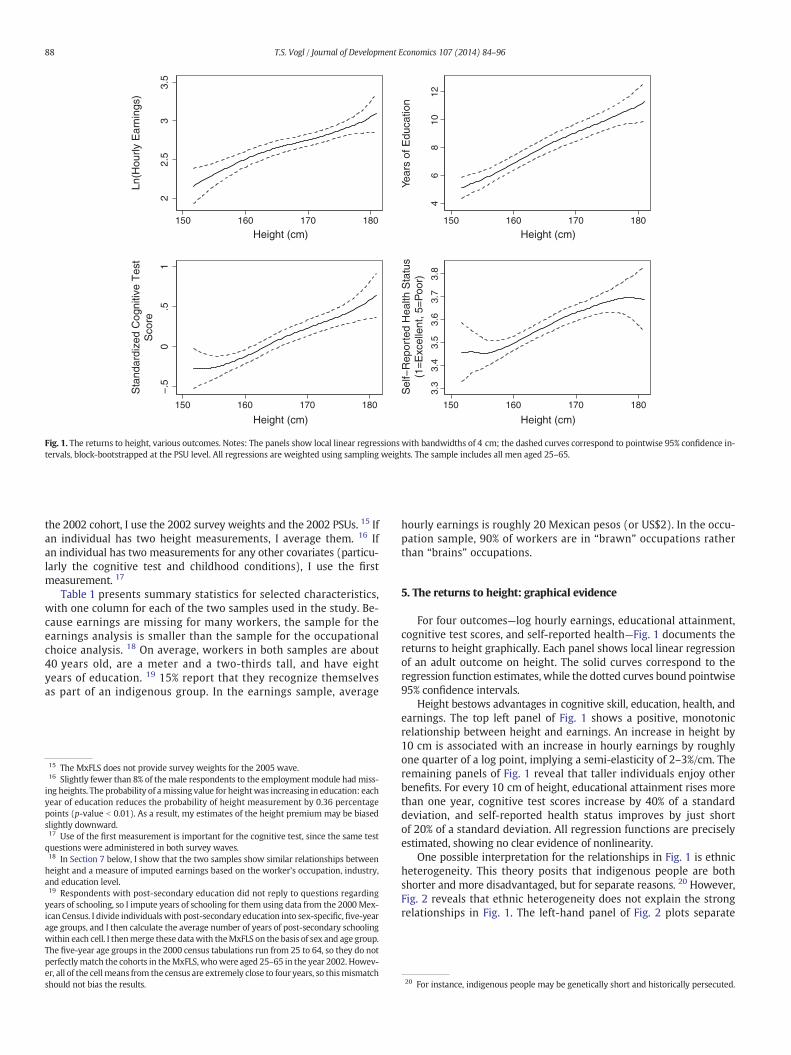
Fig. 1. The returns to height, various outcomes. Notes: The panels show local linear regressions with bandwidths of 4 cm; the dashed curves correspond to pointwise 95% confidence in-tervals, block-bootstrapped at the PSU level. All regressions are weighted using sampling weights. The sample includes all men aged 25–65.
88 T.S. Vogl / Journal of Development Economics 107 (2014) 84–96
the 2002 cohort, I use the 2002 survey weights and the 2002 PSUs. 15 Ifan individual has two height measurements, I average them. 16 Ifan individual has two measurements for any other covariates (particu-larly the cognitive test and childhood conditions), I use the firstmeasurement. 17
Table 1 presents summary statistics for selected characteristics,with one column for each of the two samples used in the study. Be-cause earnings are missing for many workers, the sample for theearnings analysis is smaller than the sample for the occupationalchoice analysis. 18 On average, workers in both samples are about40 years old, are a meter and a two-thirds tall, and have eightyears of education. 19 15% report that they recognize themselvesas part of an indigenous group. In the earnings sample, average
15 The MxFLS does not provide survey weights for the 2005 wave.16 Slightly fewer than 8% of themale respondents to the employment module had miss-ing heights. The probability of amissing value for heightwas increasing in education: eachyear of education reduces the probability of height measurement by 0.36 percentagepoints (p-value b 0.01). As a result, my estimates of the height premium may be biasedslightly downward.17 Use of the first measurement is important for the cognitive test, since the same testquestions were administered in both survey waves.18 In Section 7 below, I show that the two samples show similar relationships betweenheight and a measure of imputed earnings based on the worker's occupation, industry,and education level.19 Respondents with post-secondary education did not reply to questions regardingyears of schooling, so I impute years of schooling for them using data from the 2000 Mex-ican Census. I divide individualswith post-secondary education into sex-specific,five-yearage groups, and I then calculate the average number of years of post-secondary schoolingwithin each cell. I thenmerge these datawith theMxFLS on the basis of sex and age group.The five-year age groups in the 2000 census tabulations run from 25 to 64, so they do notperfectlymatch the cohorts in theMxFLS, whowere aged 25–65 in the year 2002. Howev-er, all of the cellmeans from the census are extremely close to four years, so thismismatchshould not bias the results.
hourly earnings is roughly 20 Mexican pesos (or US$2). In the occu-pation sample, 90% of workers are in “brawn” occupations ratherthan “brains” occupations.
5. The returns to height: graphical evidence
For four outcomes—log hourly earnings, educational attainment,cognitive test scores, and self-reported health—Fig. 1 documents thereturns to height graphically. Each panel shows local linear regressionof an adult outcome on height. The solid curves correspond to theregression function estimates, while the dotted curves bound pointwise95% confidence intervals.
Height bestows advantages in cognitive skill, education, health, andearnings. The top left panel of Fig. 1 shows a positive, monotonicrelationship between height and earnings. An increase in height by10 cm is associated with an increase in hourly earnings by roughlyone quarter of a log point, implying a semi-elasticity of 2–3%/cm. Theremaining panels of Fig. 1 reveal that taller individuals enjoy otherbenefits. For every 10 cm of height, educational attainment rises morethan one year, cognitive test scores increase by 40% of a standarddeviation, and self-reported health status improves by just shortof 20% of a standard deviation. All regression functions are preciselyestimated, showing no clear evidence of nonlinearity.
One possible interpretation for the relationships in Fig. 1 is ethnicheterogeneity. This theory posits that indigenous people are bothshorter and more disadvantaged, but for separate reasons. 20 However,Fig. 2 reveals that ethnic heterogeneity does not explain the strongrelationships in Fig. 1. The left-hand panel of Fig. 2 plots separate
20 For instance, indigenous people may be genetically short and historically persecuted.
Indigenous
Non−Indigenous
Ln(H
ourly
Ear
ning
s)
150 160 170 180
Height (cm)
By Ethnicity
Rural Birthplace
Non−Rural Birthplace
1.5
22.
53
3.5
1.5
22.
53
3.5
Ln(H
ourly
Ear
ning
s)150 160 170 180
Height (cm)
By Place of Birth
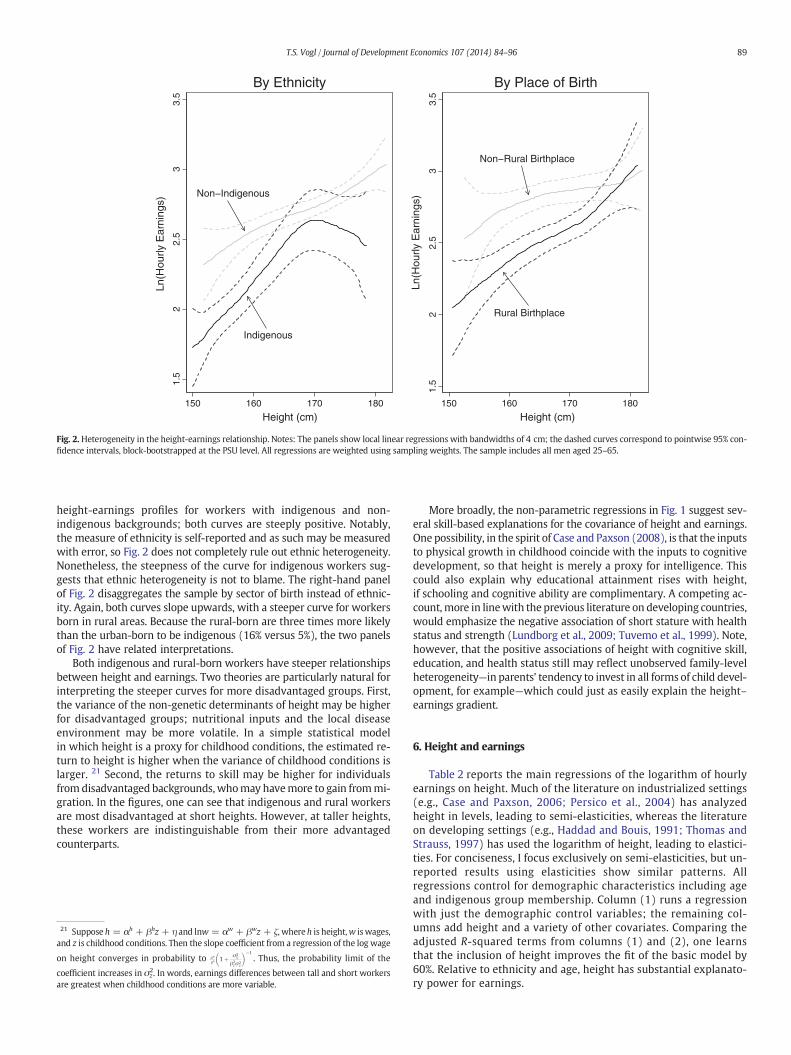
Fig. 2.Heterogeneity in the height-earnings relationship. Notes: The panels show local linear regressions with bandwidths of 4 cm; the dashed curves correspond to pointwise 95% con-fidence intervals, block-bootstrapped at the PSU level. All regressions are weighted using sampling weights. The sample includes all men aged 25–65.
89T.S. Vogl / Journal of Development Economics 107 (2014) 84–96
height-earnings profiles for workers with indigenous and non-indigenous backgrounds; both curves are steeply positive. Notably,the measure of ethnicity is self-reported and as such may be measuredwith error, so Fig. 2 does not completely rule out ethnic heterogeneity.Nonetheless, the steepness of the curve for indigenous workers sug-gests that ethnic heterogeneity is not to blame. The right-hand panelof Fig. 2 disaggregates the sample by sector of birth instead of ethnic-ity. Again, both curves slope upwards, with a steeper curve for workersborn in rural areas. Because the rural-born are three times more likelythan the urban-born to be indigenous (16% versus 5%), the two panelsof Fig. 2 have related interpretations.
Both indigenous and rural-born workers have steeper relationshipsbetween height and earnings. Two theories are particularly natural forinterpreting the steeper curves for more disadvantaged groups. First,the variance of the non-genetic determinants of height may be higherfor disadvantaged groups; nutritional inputs and the local diseaseenvironment may be more volatile. In a simple statistical modelin which height is a proxy for childhood conditions, the estimated re-turn to height is higher when the variance of childhood conditions islarger. 21 Second, the returns to skill may be higher for individualsfrom disadvantaged backgrounds,whomay havemore to gain frommi-gration. In the figures, one can see that indigenous and rural workersare most disadvantaged at short heights. However, at taller heights,these workers are indistinguishable from their more advantagedcounterparts.
21 Suppose h = αh + βhz + η and lnw = αw + βwz + ζ, where h is height,w iswages,and z is childhood conditions. Then the slope coefficient from a regression of the log wage
on height converges in probability to βw
βh 1þ σ2η
β2zσ2
z
� �−1
. Thus, the probability limit of the
coefficient increases in σz2. In words, earnings differences between tall and short workers
are greatest when childhood conditions are more variable.
More broadly, the non-parametric regressions in Fig. 1 suggest sev-eral skill-based explanations for the covariance of height and earnings.One possibility, in the spirit of Case and Paxson (2008), is that the inputsto physical growth in childhood coincide with the inputs to cognitivedevelopment, so that height is merely a proxy for intelligence. Thiscould also explain why educational attainment rises with height,if schooling and cognitive ability are complimentary. A competing ac-count,more in linewith the previous literature on developing countries,would emphasize the negative association of short stature with healthstatus and strength (Lundborg et al., 2009; Tuvemo et al., 1999). Note,however, that the positive associations of height with cognitive skill,education, and health status still may reflect unobserved family-levelheterogeneity—in parents' tendency to invest in all forms of child devel-opment, for example—which could just as easily explain the height–earnings gradient.
6. Height and earnings
Table 2 reports the main regressions of the logarithm of hourlyearnings on height. Much of the literature on industrialized settings(e.g., Case and Paxson, 2006; Persico et al., 2004) has analyzedheight in levels, leading to semi-elasticities, whereas the literatureon developing settings (e.g., Haddad and Bouis, 1991; Thomas andStrauss, 1997) has used the logarithm of height, leading to elastici-ties. For conciseness, I focus exclusively on semi-elasticities, but un-reported results using elasticities show similar patterns. Allregressions control for demographic characteristics including ageand indigenous group membership. Column (1) runs a regressionwith just the demographic control variables; the remaining col-umns add height and a variety of other covariates. Comparing theadjusted R-squared terms from columns (1) and (2), one learnsthat the inclusion of height improves the fit of the basic model by60%. Relative to ethnicity and age, height has substantial explanato-ry power for earnings.
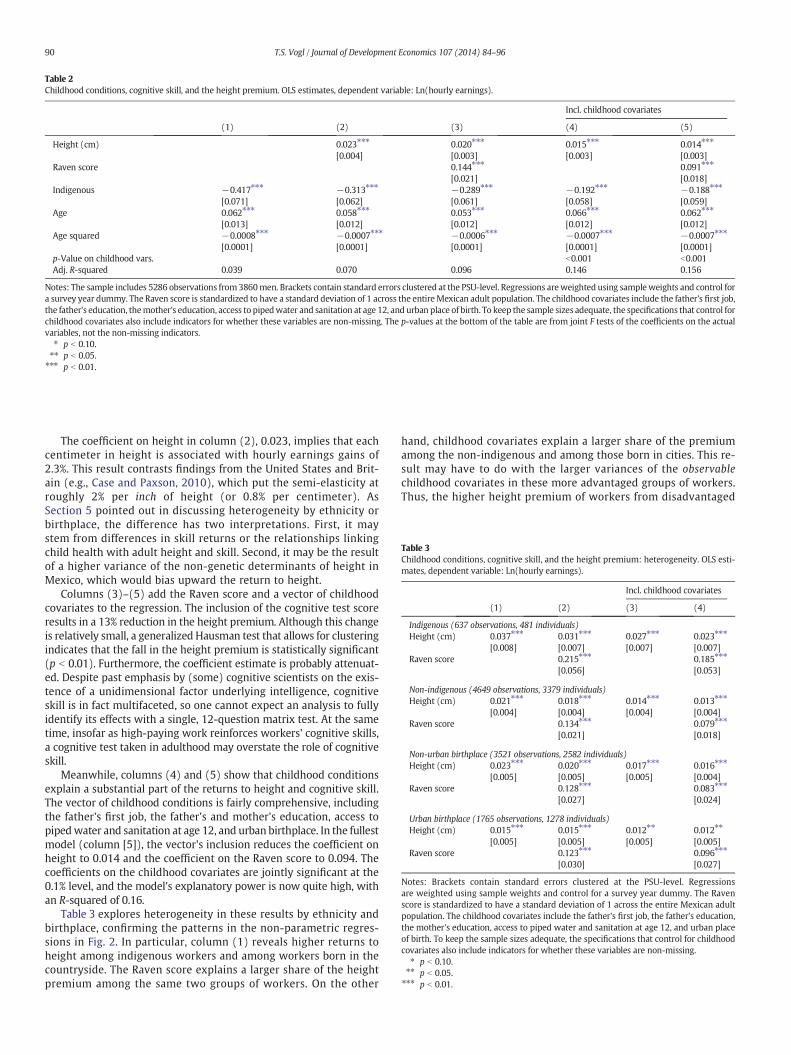
Table 3Childhood conditions, cognitive skill, and the height premium: heterogeneity. OLS esti-mates, dependent variable: Ln(hourly earnings).
Incl. childhood covariates
(1) (2) (3) (4)
Indigenous (637 observations, 481 individuals)Height (cm) 0.037⁎⁎⁎
[0.008]0.031⁎⁎⁎
[0.007]0.027⁎⁎⁎
[0.007]0.023⁎⁎⁎
[0.007]Raven score 0.215⁎⁎⁎
[0.056]0.185⁎⁎⁎
[0.053]
Non-indigenous (4649 observations, 3379 individuals)Height (cm) 0.021⁎⁎⁎
[0.004]0.018⁎⁎⁎
[0.004]0.014⁎⁎⁎
[0.004]0.013⁎⁎⁎
[0.004]Raven score 0.134⁎⁎⁎
[0.021]0.079⁎⁎⁎
[0.018]
Non-urban birthplace (3521 observations, 2582 individuals)Height (cm) 0.023⁎⁎⁎
[0.005]0.020⁎⁎⁎
[0.005]0.017⁎⁎⁎
[0.005]0.016⁎⁎⁎
[0.004]Raven score 0.128⁎⁎⁎
[0.027]0.083⁎⁎⁎
[0.024]
Urban birthplace (1765 observations, 1278 individuals)Height (cm) 0.015⁎⁎⁎
[0.005]0.015⁎⁎⁎
[0.005]0.012⁎⁎
[0.005]0.012⁎⁎
[0.005]Raven score 0.123⁎⁎⁎
[0.030]0.096⁎⁎⁎
[0.027]
Notes: Brackets contain standard errors clustered at the PSU-level. Regressionsare weighted using sample weights and control for a survey year dummy. The Ravenscore is standardized to have a standard deviation of 1 across the entire Mexican adultpopulation. The childhood covariates include the father's first job, the father's education,the mother's education, access to piped water and sanitation at age 12, and urban placeof birth. To keep the sample sizes adequate, the specifications that control for childhoodcovariates also include indicators for whether these variables are non-missing.
⁎ p b 0.10.⁎⁎ p b 0.05.⁎⁎⁎ p b 0.01.
Table 2Childhood conditions, cognitive skill, and the height premium. OLS estimates, dependent variable: Ln(hourly earnings).
Incl. childhood covariates
(1) (2) (3) (4) (5)
Height (cm) 0.023⁎⁎⁎
[0.004]0.020⁎⁎⁎
[0.003]0.015⁎⁎⁎
[0.003]0.014⁎⁎⁎
[0.003]Raven score 0.144⁎⁎⁎
[0.021]0.091⁎⁎⁎
[0.018]Indigenous −0.417⁎⁎⁎
[0.071]−0.313⁎⁎⁎
[0.062]−0.289⁎⁎⁎
[0.061]−0.192⁎⁎⁎
[0.058]−0.188⁎⁎⁎
[0.059]Age 0.062⁎⁎⁎
[0.013]0.058⁎⁎⁎
[0.012]0.053⁎⁎⁎
[0.012]0.066⁎⁎⁎
[0.012]0.062⁎⁎⁎
[0.012]Age squared −0.0008⁎⁎⁎
[0.0001]−0.0007⁎⁎⁎
[0.0001]−0.0006⁎⁎⁎
[0.0001]−0.0007⁎⁎⁎
[0.0001]−0.0007⁎⁎⁎
[0.0001]p-Value on childhood vars. b0.001 b0.001Adj. R-squared 0.039 0.070 0.096 0.146 0.156
Notes: The sample includes 5286 observations from3860men. Brackets contain standard errors clustered at the PSU-level. Regressions areweighted using sampleweights and control fora survey year dummy. The Raven score is standardized to have a standard deviation of 1 across the entire Mexican adult population. The childhood covariates include the father's first job,the father's education, themother's education, access to pipedwater and sanitation at age 12, and urban place of birth. To keep the sample sizes adequate, the specifications that control forchildhood covariates also include indicators for whether these variables are non-missing. The p-values at the bottom of the table are from joint F tests of the coefficients on the actualvariables, not the non-missing indicators.
⁎ p b 0.10.⁎⁎ p b 0.05.
⁎⁎⁎ p b 0.01.
90 T.S. Vogl / Journal of Development Economics 107 (2014) 84–96
The coefficient on height in column (2), 0.023, implies that eachcentimeter in height is associated with hourly earnings gains of2.3%. This result contrasts findings from the United States and Brit-ain (e.g., Case and Paxson, 2010), which put the semi-elasticity atroughly 2% per inch of height (or 0.8% per centimeter). AsSection 5 pointed out in discussing heterogeneity by ethnicity orbirthplace, the difference has two interpretations. First, it maystem from differences in skill returns or the relationships linkingchild health with adult height and skill. Second, it may be the resultof a higher variance of the non-genetic determinants of height inMexico, which would bias upward the return to height.
Columns (3)–(5) add the Raven score and a vector of childhoodcovariates to the regression. The inclusion of the cognitive test scoreresults in a 13% reduction in the height premium. Although this changeis relatively small, a generalized Hausman test that allows for clusteringindicates that the fall in the height premium is statistically significant(p b 0.01). Furthermore, the coefficient estimate is probably attenuat-ed. Despite past emphasis by (some) cognitive scientists on the exis-tence of a unidimensional factor underlying intelligence, cognitiveskill is in fact multifaceted, so one cannot expect an analysis to fullyidentify its effects with a single, 12-question matrix test. At the sametime, insofar as high-paying work reinforces workers' cognitive skills,a cognitive test taken in adulthood may overstate the role of cognitiveskill.
Meanwhile, columns (4) and (5) show that childhood conditionsexplain a substantial part of the returns to height and cognitive skill.The vector of childhood conditions is fairly comprehensive, includingthe father's first job, the father's and mother's education, access topipedwater and sanitation at age 12, and urban birthplace. In the fullestmodel (column [5]), the vector's inclusion reduces the coefficient onheight to 0.014 and the coefficient on the Raven score to 0.094. Thecoefficients on the childhood covariates are jointly significant at the0.1% level, and the model's explanatory power is now quite high, withan R-squared of 0.16.
Table 3 explores heterogeneity in these results by ethnicity andbirthplace, confirming the patterns in the non-parametric regres-sions in Fig. 2. In particular, column (1) reveals higher returns toheight among indigenous workers and among workers born in thecountryside. The Raven score explains a larger share of the heightpremium among the same two groups of workers. On the other
hand, childhood covariates explain a larger share of the premiumamong the non-indigenous and among those born in cities. This re-sult may have to do with the larger variances of the observablechildhood covariates in these more advantaged groups of workers.Thus, the higher height premium of workers from disadvantaged

Table 4Education, occupational choice, and the height premium. OLS estimates, dependent variable: Ln(hourly earnings).
(1) (2) (3) (4) (5) (6) (7) (8)
Height 0.023⁎⁎⁎
[0.004]0.015⁎⁎⁎
[0.003]0.013⁎⁎⁎
[0.004]0.012⁎⁎⁎
[0.003]0.018⁎⁎⁎
[0.003]0.014⁎⁎⁎
[0.003]0.013⁎⁎⁎
[0.004]0.012⁎⁎⁎
[0.003]Raven score 0.145⁎⁎⁎
[0.023]0.046⁎⁎⁎
[0.014]0.011[0.014]
−0.0003[0.011]
Years of education 0.073⁎⁎⁎
[0.006]0.042⁎⁎⁎
[0.006]0.072⁎⁎⁎
[0.005]0.043⁎⁎⁎
[0.006]Occupation dummies? No Yes No Yes No Yes No Yesp-value on occ. dummies b0.001 b0.001 b0.001 b0.001R-squared 0.070 0.226 0.205 0.252 0.096 0.229 0.204 0.253
Notes: The sample includes 5286 observations from3860men. Brackets contain standard errors clustered at the PSU-level. Regressions areweighted using sampleweights and control foryear, ethnicity, age, and age squared. The Raven score is standardized to have a standard deviation of 1 across the entire Mexican adult population. The p-values at the bottom of the tableare from joint F tests of the coefficients on the occupation dummies.
⁎ p b 0.10.⁎⁎ p b 0.05.
⁎⁎⁎ p b 0.01.
91T.S. Vogl / Journal of Development Economics 107 (2014) 84–96
backgrounds may be due to greater idiosyncratic volatility in livingconditions, rather than variation in longer-term, observable livingconditions.
Returning to the full sample, Table 4 investigates whether thereturns to height accrue within or between occupation and educationgroups. This is strictly an accounting exercise; occupation and educationshould be interpreted as choice variables. The inclusion of either occu-pation dummies or educational attainment (as a continuous covariate)cuts the estimated height premium approximately in half (comparedwith column [1]), implying that a large part of the height premium isattributable to the higher educational attainment of taller workers orto their sorting into higher-paying occupations. 22
7. Height and occupational choice
The results of the previous section imply that sorting across oc-cupations contributes to the returns to height. This finding is inter-esting, especially in light of Case and Paxson's (2006) evidence fromthe United States that taller individuals sort into occupations withgreater cognitive demands. As discussed in Section 3, if cognitiveability explains the height premium, then the tallest workers willsort into the most cognitively demanding occupations. This sectionassesses height-based occupational selection in two steps. First, itassesses whether “taller” occupation groups have higher intelli-gence aptitude or strength requirements. Second, it explores theroles of cognitive skill, childhood conditions, and educationalchoices in explaining height-based selection into “brains” or“brawn” occupations. Throughout, it uses a full sample of workers,rather than restricting the sample to workers with non-missinghourly earnings. The full sample exhibits sectoral sorting that issimilar to the earnings sample in Section 6. Appendix Table 1assigns each worker the mean hourly earnings of her occupation–industry–education cell in the 2000Mexican census, and then regressesthe logarithmof this sectoral earnings score on height and demographiccharacteristics. The coefficients on height in the full sample and theearnings sample are quite close.
For the first step of the occupational choice analysis, I follow Caseand Paxson (2006) in estimating amultinomial logit regression of occu-pation category (as classified by the ISCO) on height:
lnpijpi0
� �¼ γ jheighti þ Xi′Γ j; j N 0 ð1Þ
22 A Mincer-style earnings regression that omits height yields a return to schooling of7.7%.
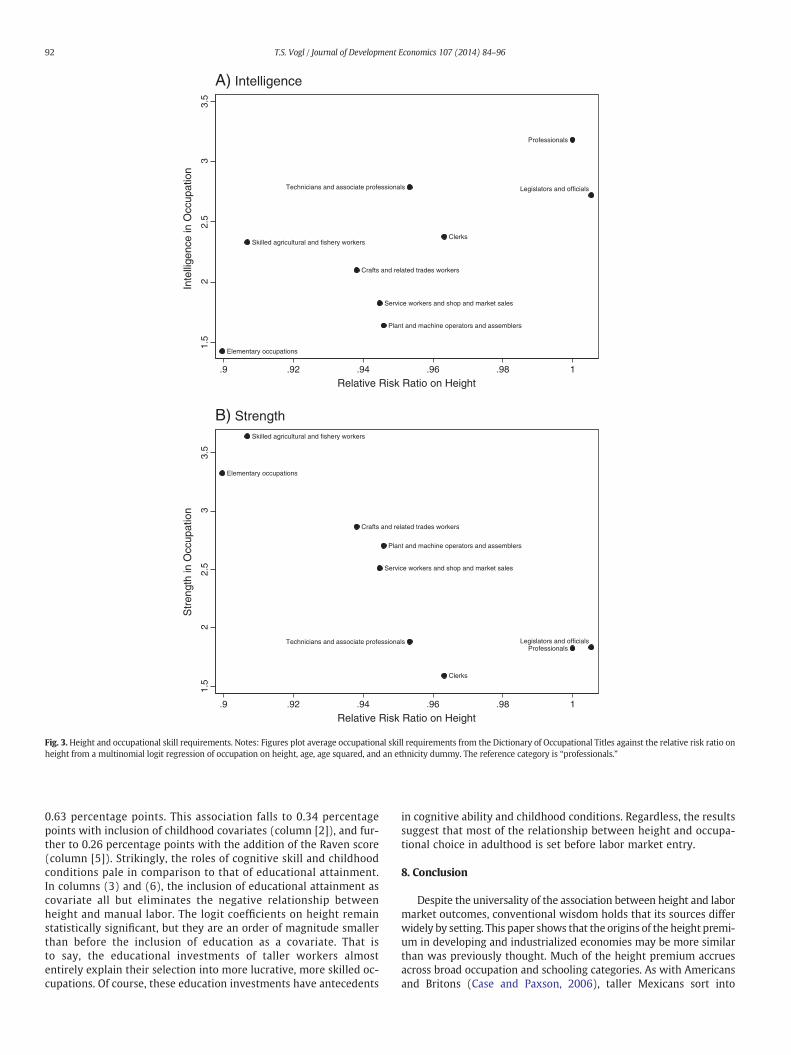
where pij is the probability that worker i selects an occupation incategory j, and j = 0 corresponds to the professional occupationcategory. To reduce the dimensionality of the likelihood maximiza-tion problem, I restrict Xi, the vector of control variables, to includeonly a constant term, ethnicity, age, and a squared term in age. Afterestimating the logit regressions, I plot occupational skill measuresfrom the DOT against each occupation category's relative risk ratioon height (eγ j ). An occupation category's relative risk ratio mea-sures the association between height and the risk of selection intothat occupation category, relative to the professional occupationcategory. By plotting each occupation category's cognitive andphysical skill intensities against its relative risk ratio on height,one can infer whether physical or cognitive skill drives height-based occupational sorting.
The results, which appear in Fig. 3, indicate that taller men system-atically select into occupations with larger intelligence aptitude de-mands and smaller strength demands. The plots are surprisinglysimilar to the occupational sorting patterns that arise in industrializedcountries (Case and Paxson, 2006). Combined with Table 4, we reachthe conclusion that nearly half of Mexico's height premium can be at-tributed to the sorting of taller workers into occupations intensive incognitive skill. Seen through the lens of the theoretical framework ofSection 3, this result suggests that the return to cognitive ability (andhuman capital more broadly) drives a substantial part of the heightpremium.
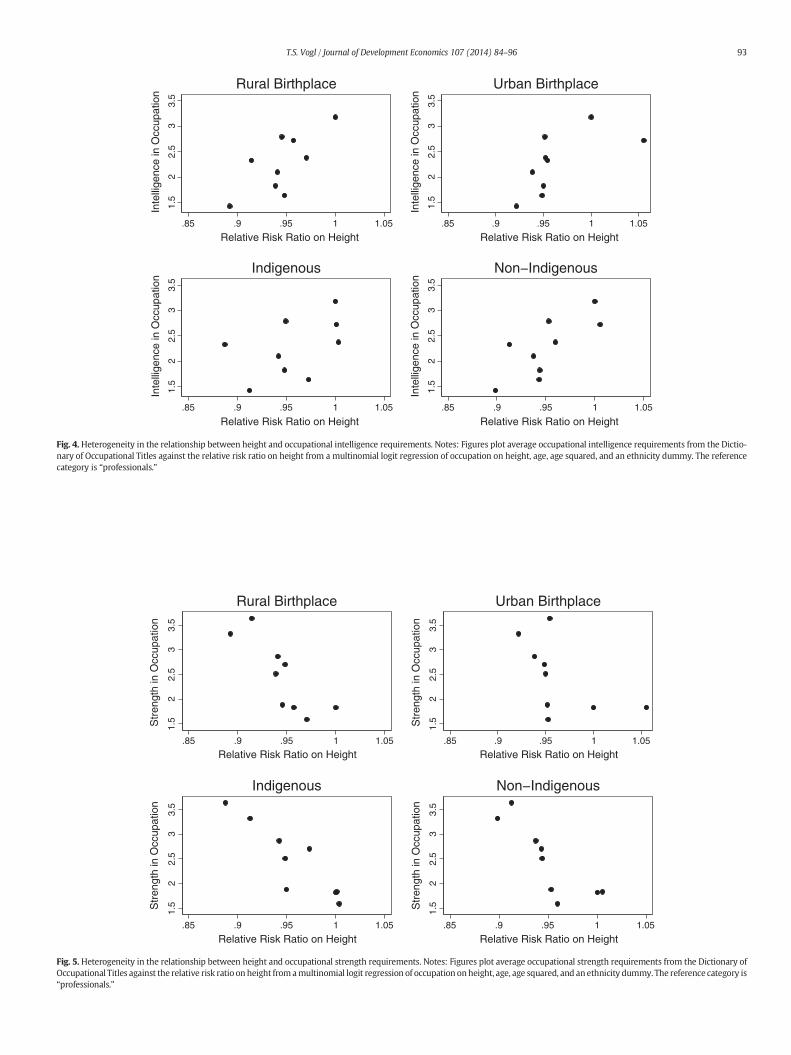
Again, these results are not merely driven by ethnic or birthplaceheterogeneity. Figs. 4 and 5 draw the same plots by ethnicity andbirthplace. The same patterns emerge, with “taller” occupationsexhibiting higher average intelligence requirements and loweraverage strength requirements. Perhaps surprisingly, the patterns ap-pear quite similar for indigenous, non-indigenous, rural-born, andurban-born workers.
To further understand these patterns, Table 5 performs an analysisof occupational choice that is analogous to Table 2's analysis ofthe height premium. The table reports marginal effects from logit re-gressions in which the dependent variable equals 0 for a “brains” oc-cupation and 1 for a “brawn” occupation. The marginal effects aremultiplied by 100, so that a marginal effect of 1 corresponds to a 1percentage point increase in the probability of working in a “brawn”occupation. Each column adds a different set of covariates to the basicspecification.
The associations of height with cognitive skill, childhood condi-tions, and educational investments account for the lion's share ofthe decreased likelihood of taller workers to select into manual oc-cupations. Column (1) indicates that a centimeter of height de-creases the probability of working in a “brawn” occupation by
Legislators and officials
Professionals
Technicians and associate professionals
Clerks
Service workers and shop and market sales
Skilled agricultural and fishery workers
Crafts and related trades workers
Plant and machine operators and assemblers
Elementary occupations
1.5
22.
53
3.5
Inte
llige
nce
in O
ccup
atio
n
.9 .92 .94 .96 .98 1
Relative Risk Ratio on Height
Legislators and officialsProfessionals
Technicians and associate professionals
Clerks
Service workers and shop and market sales
Skilled agricultural and fishery workers
Crafts and related trades workers
Plant and machine operators and assemblers
Elementary occupations
1.5
22.
53
3.5
Str
engt
h in
Occ
upat
ion
.9 .92 .94 .96 .98 1
Relative Risk Ratio on Height
B) Strength
A) Intelligence
Fig. 3.Height and occupational skill requirements. Notes: Figures plot average occupational skill requirements from the Dictionary of Occupational Titles against the relative risk ratio onheight from a multinomial logit regression of occupation on height, age, age squared, and an ethnicity dummy. The reference category is “professionals.”
92 T.S. Vogl / Journal of Development Economics 107 (2014) 84–96
0.63 percentage points. This association falls to 0.34 percentagepoints with inclusion of childhood covariates (column [2]), and fur-ther to 0.26 percentage points with the addition of the Raven score(column [5]). Strikingly, the roles of cognitive skill and childhoodconditions pale in comparison to that of educational attainment.In columns (3) and (6), the inclusion of educational attainment ascovariate all but eliminates the negative relationship betweenheight and manual labor. The logit coefficients on height remainstatistically significant, but they are an order of magnitude smallerthan before the inclusion of education as a covariate. That isto say, the educational investments of taller workers almostentirely explain their selection into more lucrative, more skilled oc-cupations. Of course, these education investments have antecedents
in cognitive ability and childhood conditions. Regardless, the resultssuggest that most of the relationship between height and occupa-tional choice in adulthood is set before labor market entry.
8. Conclusion
Despite the universality of the association between height and labormarket outcomes, conventional wisdom holds that its sources differwidely by setting. This paper shows that the origins of the height premi-um in developing and industrialized economies may be more similarthan was previously thought. Much of the height premium accruesacross broad occupation and schooling categories. As with Americansand Britons (Case and Paxson, 2006), taller Mexicans sort into
1.5
22.
53
3.5
Inte
llige
nce
in O
ccup
atio
n
.85 .9 .95 1 1.05
Relative Risk Ratio on Height
Rural Birthplace
1.5
22.
53
3.5
Inte
llige
nce
in O
ccup
atio
n
.85 .9 .95 1 1.05
Relative Risk Ratio on Height
Urban Birthplace
1.5
22.
53
3.5
Inte
llige
nce
in O
ccup
atio
n
.85 .9 .95 1 1.05
Relative Risk Ratio on Height
Indigenous
1.5
22.
53
3.5
Inte
llige
nce
in O
ccup
atio
n.85 .9 .95 1 1.05
Relative Risk Ratio on Height
Non−Indigenous
Fig. 4.Heterogeneity in the relationship between height and occupational intelligence requirements. Notes: Figures plot average occupational intelligence requirements from the Dictio-nary of Occupational Titles against the relative risk ratio on height from a multinomial logit regression of occupation on height, age, age squared, and an ethnicity dummy. The referencecategory is “professionals.”
Str
engt
h in
Occ
upat
ion
Relative Risk Ratio on Height
Rural Birthplace
Str
engt
h in
Occ
upat
ion
Relative Risk Ratio on Height
Urban Birthplace
Str
engt
h in
Occ
upat
ion
Indigenous
1.5
22.
53
3.5
Str
engt
h in
Occ
upat
ion
.85 .9 .95 1 1.05
1.5
22.
53
3.5
.85 .9 .95 1 1.05
1.5
22.
53
3.5
.85 .9 .95 1 1.05
Relative Risk Ratio on Height
1.5
22.
53
3.5
.85 .9 .95 1 1.05
Relative Risk Ratio on Height
Non−Indigenous
Fig. 5.Heterogeneity in the relationship between height and occupational strength requirements. Notes: Figures plot average occupational strength requirements from the Dictionary ofOccupational Titles against the relative risk ratio on height fromamultinomial logit regression of occupation onheight, age, age squared, and an ethnicity dummy. The reference category is“professionals.”
93T.S. Vogl / Journal of Development Economics 107 (2014) 84–96
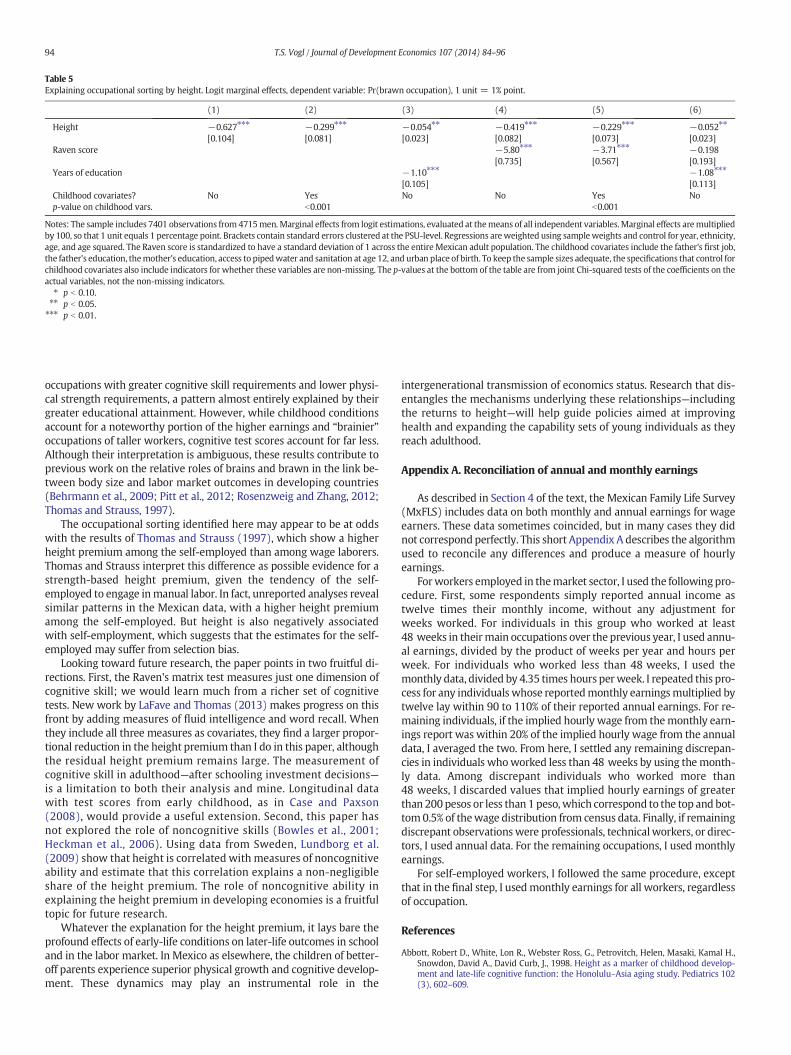
Table 5Explaining occupational sorting by height. Logit marginal effects, dependent variable: Pr(brawn occupation), 1 unit = 1% point.
(1) (2) (3) (4) (5) (6)
Height −0.627⁎⁎⁎
[0.104]−0.299⁎⁎⁎
[0.081]−0.054⁎⁎
[0.023]−0.419⁎⁎⁎
[0.082]−0.229⁎⁎⁎
[0.073]−0.052⁎⁎
[0.023]Raven score −5.80⁎⁎⁎
[0.735]−3.71⁎⁎⁎
[0.567]−0.198[0.193]
Years of education −1.10⁎⁎⁎
[0.105]−1.08⁎⁎⁎
[0.113]Childhood covariates? No Yes No No Yes Nop-value on childhood vars. b0.001 b0.001
Notes: The sample includes 7401 observations from 4715men.Marginal effects from logit estimations, evaluated at themeans of all independent variables.Marginal effects aremultipliedby 100, so that 1 unit equals 1 percentage point. Brackets contain standard errors clustered at the PSU-level. Regressions areweighted using sampleweights and control for year, ethnicity,age, and age squared. The Raven score is standardized to have a standard deviation of 1 across the entireMexican adult population. The childhood covariates include the father's first job,the father's education, themother's education, access to pipedwater and sanitation at age 12, and urban place of birth. To keep the sample sizes adequate, the specifications that control forchildhood covariates also include indicators for whether these variables are non-missing. The p-values at the bottom of the table are from joint Chi-squared tests of the coefficients on theactual variables, not the non-missing indicators.
⁎ p b 0.10.⁎⁎ p b 0.05.⁎⁎⁎ p b 0.01.
94 T.S. Vogl / Journal of Development Economics 107 (2014) 84–96
occupations with greater cognitive skill requirements and lower physi-cal strength requirements, a pattern almost entirely explained by theirgreater educational attainment. However, while childhood conditionsaccount for a noteworthy portion of the higher earnings and “brainier”occupations of taller workers, cognitive test scores account for far less.Although their interpretation is ambiguous, these results contribute toprevious work on the relative roles of brains and brawn in the link be-tween body size and labor market outcomes in developing countries(Behrmann et al., 2009; Pitt et al., 2012; Rosenzweig and Zhang, 2012;Thomas and Strauss, 1997).
The occupational sorting identified here may appear to be at oddswith the results of Thomas and Strauss (1997), which show a higherheight premium among the self-employed than among wage laborers.Thomas and Strauss interpret this difference as possible evidence for astrength-based height premium, given the tendency of the self-employed to engage inmanual labor. In fact, unreported analyses revealsimilar patterns in the Mexican data, with a higher height premiumamong the self-employed. But height is also negatively associatedwith self-employment, which suggests that the estimates for the self-employed may suffer from selection bias.
Looking toward future research, the paper points in two fruitful di-rections. First, the Raven's matrix test measures just one dimension ofcognitive skill; we would learn much from a richer set of cognitivetests. New work by LaFave and Thomas (2013) makes progress on thisfront by adding measures of fluid intelligence and word recall. Whenthey include all three measures as covariates, they find a larger propor-tional reduction in the height premium than I do in this paper, althoughthe residual height premium remains large. The measurement ofcognitive skill in adulthood—after schooling investment decisions—is a limitation to both their analysis and mine. Longitudinal datawith test scores from early childhood, as in Case and Paxson(2008), would provide a useful extension. Second, this paper hasnot explored the role of noncognitive skills (Bowles et al., 2001;Heckman et al., 2006). Using data from Sweden, Lundborg et al.(2009) show that height is correlated with measures of noncognitiveability and estimate that this correlation explains a non-negligibleshare of the height premium. The role of noncognitive ability inexplaining the height premium in developing economies is a fruitfultopic for future research.
Whatever the explanation for the height premium, it lays bare theprofound effects of early-life conditions on later-life outcomes in schooland in the labor market. In Mexico as elsewhere, the children of better-off parents experience superior physical growth and cognitive develop-ment. These dynamics may play an instrumental role in the
intergenerational transmission of economics status. Research that dis-entangles the mechanisms underlying these relationships—includingthe returns to height—will help guide policies aimed at improvinghealth and expanding the capability sets of young individuals as theyreach adulthood.
Appendix A. Reconciliation of annual and monthly earnings
As described in Section 4 of the text, the Mexican Family Life Survey(MxFLS) includes data on both monthly and annual earnings for wageearners. These data sometimes coincided, but in many cases they didnot correspondperfectly. This short Appendix A describes the algorithmused to reconcile any differences and produce a measure of hourlyearnings.
Forworkers employed in themarket sector, I used the followingpro-cedure. First, some respondents simply reported annual income astwelve times their monthly income, without any adjustment forweeks worked. For individuals in this group who worked at least48 weeks in theirmain occupations over the previous year, I used annu-al earnings, divided by the product of weeks per year and hours perweek. For individuals who worked less than 48 weeks, I used themonthly data, divided by 4.35 times hours perweek. I repeated this pro-cess for any individuals whose reportedmonthly earningsmultiplied bytwelve lay within 90 to 110% of their reported annual earnings. For re-maining individuals, if the implied hourly wage from themonthly earn-ings report was within 20% of the implied hourly wage from the annualdata, I averaged the two. From here, I settled any remaining discrepan-cies in individuals whoworked less than 48 weeks by using themonth-ly data. Among discrepant individuals who worked more than48 weeks, I discarded values that implied hourly earnings of greaterthan 200pesos or less than 1 peso,which correspond to the top and bot-tom 0.5% of thewage distribution from census data. Finally, if remainingdiscrepant observationswere professionals, technicalworkers, or direc-tors, I used annual data. For the remaining occupations, I used monthlyearnings.
For self-employed workers, I followed the same procedure, exceptthat in the final step, I usedmonthly earnings for all workers, regardlessof occupation.
References
Abbott, Robert D., White, Lon R., Webster Ross, G., Petrovitch, Helen, Masaki, Kamal H.,Snowdon, David A., David Curb, J., 1998. Height as a marker of childhood develop-ment and late-life cognitive function: the Honolulu–Asia aging study. Pediatrics 102(3), 602–609.
Appendix Table 1Imputed earnings regressions. OLS estimates, dependent variable: Ln(sectoral earningsscore).
All workers Workers with non-missing earnings
(1) (2)
Height (cm) 0.016*** 0.014***[0.002] [0.002]
Age 0.033*** 0.039***[0.006] [0.007]
Age Squared −0.00047*** −0.0005***[0.00007] [0.00009]
Indigenous −0.210*** −0.179***[0.048] [0.050]
# of observations 7793 5103#of individuals 4930 3782
Notes: Brackets contain standard errors clustered at the PSU level. The sectoral earningsscore is the average hourly earnings in the worker's occupation–industry–education cellin the 2000 Mexican census. *p b 0.10, **p b 0.05, ***p b 0.01.
Legislators and officials
Professionals
Technicians and associate professionals
Clerks
Service workers and shop and market sales
Skilled agricultural and fishery workers
Crafts and related trades workers
Elementary occupations
11.
52
2.5
33.
5
Inte
llige
nce
in O
ccup
atio
n
1.5 2 2.5 3 3.5 4Strength in Occupation
Le
e
T
erks
Plant and machine operators and assemblers
Brawn
Brains
Appendix Fig. 1. Intelligence aptitude and strength requirements in the ISCO. Notes: The figure displays average Dictionary of Occupational Titles intelligence aptitude and strengthrequirement scores in occupation categories from the International Standard Classification of Occupations (ISCO). The brains/brawn categorization is the author's creation.
95T.S. Vogl / Journal of Development Economics 107 (2014) 84–96
Banerjee, Abhijit, Duflo, Esther, Postl-Vinay, Gilles, Watts, Tim, 2010. Long-run health im-pacts of income shocks: wine and phyllozera in nineteenth-century France. Rev.Econ. Stat. 92 (4), 714–728.
Barker, David J.P. (Ed.), 2001. Fetal Origins of Cardiovascular and Lung Disease. MarcelDekker, Inc., New York.
Behrmann, Jere R., Hoddiott, John, Maluccio, John A., Martorell, Reynaldo, 2009. Brainsversus brawn: labor market returns to intellectual and health human capital in apoor developing country. Middlebury College Economics Discussion Paper No. 0907.
Berger, Abi, 2001. Insulin-like growth factor and cognitive function. Br. Med. J. 322, 203.Berkman, Douglas S., Lescano, Andres G., Gillman, Robert H., Lopez, Sonia L., Black,
Maureen M., 2002. Effects of stunting, diarrhoeal disease, and parasitic infectionduring infancy on cognition in late childhood: a follow-up study. Lancet 359, 565–571.
Black, Sandra E., Devereux, Paul J., Salvanes, Kjell G., 2007. From the cradle to the labormarket? The effect of birth weight on adult outcomes. Q. J. Econ. 122 (1), 409–439.
Bowles, Samuel, Gintis, Herbert, Osborne, Melissa, 2001. The determinants of earnings:a behavioral approach. J. Econ. Lit. 39 (4), 1137–1176.
Breslau, Naomi, 1995. Psychiatric sequelae of low birth weight. Epidemiol. Rev. 17,96–106.
Card, David, 2001. Estimating the return to schooling: progress on some persistent econo-metric problems. Econometrica 69 (5), 1127–1160.
Carroll, John B., 1993. Human Cognitive Abilities: A Survey of Factor Analytic Studies.Cambridge University Press, Cambridge.
Case, Anne, Paxson, Christina, 2006. Stature and status: height, ability, and labor marketoutcomes. Working Paper No. 12466. NBER, Cambridge, MA.
Case, Anne, Paxson, Christina, 2008. Stature and status: height, ability, and labor marketoutcomes. J. Polit. Econ. 116 (3), 499–532.
Case, Anne, Paxson, Christina, 2010. Causes and consequences of early life health.Demography 47, 65–85 (Supplement).
Deaton, Angus, 1997. The Analysis of Household Surveys: A Microeconometric Approachto Development Policy. Johns Hopkins University Press, Baltimore, MD.
Dodds, Richard, Denison, H.J., Ntani, G., Cooper, R., Cooper, C., Sayer, A.A., Baird, J., 2012.Birth weight and muscle strength: a systematic review and meta-analysis. J. Nutr.Health Aging 16 (7), 609–615.
Duflo, Esther, 2001. Schooling and labor market consequences of school constructionin Indonesia: evidence from an unusual policy experiment. Am. Econ. Rev. 91 (4),795–813.
England, Paula, Kilbourne, Barbara, 1988. In: Richardson, T.X., England, Paula, Barbara, K.(Eds.), Occupational Measures from the Dictionary of Occupational Titles for 1980 CensusDetailed Occupations. Inter-university Consortium for Political and Social Research, AnnArbor, MI.
Foster, Andrew D., Rosenzweig, Mark R., 1995. Learning by doing and learning fromothers: human capital and technical change in agriculture. J. Polit. Econ. 103 (6),1176–1209.
Freedman, Daniel G., 1979. Human Sociobiology. Free Press, New York.Gibbons, Robert, Katz, Lawrence, Lemieux, Thomas, Parent, Daniel, 2005. Comparative ad-
vantage, learning and sectoral wage determination. J. Labor Econ. 23, 681–723.Grantham-McGregor, Sally M., 1995. A review of studies of the effect of severe malnutri-
tion on mental development. J. Nutr. 125, 2238S (Supplement).Grantham-McGregor, Sally M., Powell, C.A., Walker, S.P., Himes, J.H., 1991. Nutritional
supplementation, psychosocial stimulation, and mental development of stuntedchildren: the Jamaican study. Lancet 1991 (338), 1–5.
Haddad, Lawrence J., Bouis, Howarth E., 1991. The impact of nutritional status onagricultural productivity: wage evidence from the Philippines. Oxf. Bull. Econ. Stat.53, 45–68.
Hamermesh, Daniel S., Biddle, Jeff E., 1994. Beauty and the labor market. Am. Econ. Rev.84 (5), 1174–1194.
Hanushek, Eric A., Woessmann, Ludger, 2008. The role of cognitive skills in economicdevelopment. J. Econ. Lit. 46 (3), 607–668.
Heckman, James J., Stixrud, Jora, Urzua, Sergio, 2006. The effects of cognitive and non-cognitive abilities on labor market outcomes and social behavior. J. Labor Econ. 24(3), 411–482.
Hensley, Wayne E., 1993. Height as a measure of success in academe. Psychology 30,40–46.
Huang, Wei, Xiaoyan Lei, Geert Ridder, John Strauss, and Yaohui Zhao. (2012). “Health,Height, Height Shrinkage and SES at Older Ages: Evidence from China.” Mimeo,Harvard University
Komlos, John, 1990. Height and social status in eighteenth-century Germany. J. Interdiscip.Hist. 20, 607–621.
LaFave, Daniel, and Duncan Thomas. (2013). “Height and Cognition at Work: LaborMarket Performance in a Low Income Setting.” Mimeo, Colby College.
Loh, Eng Sang, 1993. The economic effects of physical appearance. Soc. Sci. Q. 74, 420–438.Lundborg, Petter, Nystedt, Paul, Rooth, Dan-Olof, 2009. The height premium in earnings:
the role of cognitive ability and physical strength. IZA Working Paper 4266.Maccini, Sharon, Yang, Dean, 2009. Under the weather: health, schooling, and economic
consequences of early-life rainfall. Am. Econ. Rev. 99 (3), 1006–1026.Magnusson, Patrik K.E., Rasmussen, Finn, Gyllensten, Ulf B., 2006. Height at age 18 years is
a strong predictor of attained education later in life: cohort study of over 950000Swedish men. Int. J. Epidemiol. 35, 658–663.
Margo, Robert, Steckel, Richard H., 1982. The height of American slaves: new evidence onslave nutrition and health. Soc. Sci. Hist. 6, 516–538.
96 T.S. Vogl / Journal of Development Economics 107 (2014) 84–96
Maurer, Jurgen, 2010. Height, education and cognitive function at older ages: internationalevidence from Latin America and the Caribbean. Econ. Hum. Biol. 8 (2), 168–176.
Mendez, Michelle A., Adair, Linda S., 1999. Severity and timing of stunting in the first twoyears of life affect performance on cognitive tests in late childhood. J. Nutr. 129 (8),1555–1562.
Ohnsorge, Franziska, Trefler, Daniel, 2007. Sorting it out: international trade with hetero-geneous workers. J. Polit. Econ. 115 (5), 868–892.
Paxson, Christina, Schady, Norbert, 2007. Cognitive development among young childrenin Ecuador: the roles of wealth, health, and parenting. J. Hum. Resour. 42, 49–84.
Perkins, Jessica M., Khan, Kashif T., Smith, George Davey, Subramanian, S.V., 2011. Patternsand trends of adult height in India in 2005–2006. Econ. Hum. Biol. 9 (2), 184–193.
Persico, Nicola, Postlewaite, Andrew, Silverman, Daniel, 2004. The effect of adolescent ex-perience on labor market outcomes: the case of height. J. Polit. Econ. 112, 1019–1053.
Pitt, MarkM., Rosenzweig, Mark R., Hassan, Mohammad Nazmul, 2012. Human capital in-vestment and the gender division of labor in a brawn-based economy. Am. Econ. Rev.102 (7), 3531–3560.
Raven, J.C., Court, J.H., Raven, J., 1983. Manual for Raven's Progressive Matrices andVocabulary Scales. Lewis, London.
Richards, Marcus, Hardy, Rebecca, Kuh, Diana, Wadsworth, Michael E.J., 2002. Birthweight,postnatal growth and cognitive function in a national U.K. birth cohort. Int.J. Epidemiol. 31, 342–348.
Rosenzweig, Mark R., and Junsen Zhang. (2012). “Economic Growth, ComparativeAdvantage, and Gender Differences in Schooling Outcomes: Evidence fromBirthweight Differences of Chinese Twins.” Mimeo, Yale University.
Roy, Andrew D., 1951. Some thoughts on the distribution of earnings. Oxf. Econ. Pap. 3(2), 135–146.
Ruggles, Steve, Sobek, Matthew, Alexander, Trent, et al., 2008. Integrated PublicUse Microdata Series: Version 4.0 [Machine-readable database]. MinnesotaPopulation Center, Minneapolis, MN ([producer and distributor]. Online:http://usa.ipums.org/).
Scrimshaw, Nevin S., Taylor, Carl E., Gordon, John E., 1968. Interactions of nutrition andinfection. WHO Monograph Series No. 57. World Health Organization, Geneva.
Strauss, John, Thomas, Duncan, 1998. Health, nutrition, and economic development.J. Econ. Lit. 36 (2), 766–817.
Tanner, James M., 1979. A concise history of growth studies from Buffon to Boas. In:Falkner, Frank, Tanner, James M. (Eds.), Human Growth, Volume 3: Neurobiologyand Nutrition. Springer, New York, pp. 515–593.
Thomas, Duncan, Strauss, John, 1997. Health and wages: evidence on men and women inurban Brazil. J. Econ. 77 (1), 159–185.
Tuvemo, Torsten, Jonsson, Björn, Persson, Ingemar, 1999. Intellectual and physicalperformance and morbidity in relation to height in a cohort of 18-year-old Swedishconscripts. Horm. Res. 52, 186–191.