Embed Size (px)
Citation preview
Annual Report 2015
Highgate School
Annual Report
2015
Highgate School Sports Day 2016
Annual Report 2015
Page 1
1. CONTEXT
School Name: Highgate School School Number: 1063
Principal: Phil Johansen Partnership Greenhill South
Highgate School is situated in Highgate, an established eastern suburb of the city of Adelaide, South Australia. It comprises a Reception to Year 7 School on the one site. Highgate is a large school with approximately 580 students in 2015. It is a school with high academic achievement with engaged and able students, high parental involvement and support and a dedicated and hardworking staff. The school combines traditional values with a modern progressive curriculum. Approximately 36% of students come from a non-English speaking background. Highgate also hosts an International Student program. Highgate School enjoys strong community support. Set in a safe and pleasant environment away from main roads, the School has easy access to the city’s central business district just ten minutes’ drive away.
2. REPORT FROM GOVERNING COUNCIL
Governing Council continued to discuss and improve the school through its governance processes. The OHSC committee worked closely with the OHSC Director to update the facilities, the committee still struggles with the development of policies in regard to the state and national requirements. The learning support team continued to inform the school through a data driven view and organised several workshops to inform parents around the learning occurring. A media team was developed to improve marketing through IT and to provide greater students access to IT. The committee has now been formalised into a governing council subcommittee. An outcome of the work of this committee is the implementation of a 1:1 computer program for year 5 -7. Fundraising had a very successful year, with greater community participation and more funds raised. The grounds committee which includes student voice has identified several areas to improve; this has begun through working bees. The development of a natural play space was a key initiative. The sports committee has managed a reorganisation of the way sports funds are managed. The finance committee has managed the reduction of income well through what has been a very difficult time because of fluctuating student numbers. The Governing Council is a representation of a group of highly skilled parents who generously donate their time and expertise to the school.
3. 2014 HIGHLIGHTS
Highlights 2015
Highgate School provides a rich, engaging curriculum and is well supported by its dedicated staff and
supportive school community. Our students are given the opportunity to participate in a wide range of
activities, both in and out of school. Below are a few of the many highlights of the year.
Academic
The Foundation organised an amazing Art exhibition in conjunction with SALA, showcasing artwork from all students R-7.
Annual Report 2015
Page 2
Students participated in the SASTA Oliphant Awards Competition. Students won first prize and third prize for their respective age groups in the Programming and Robotics section and the Scientific Enquiry section. Three students received high commendations from the judges for their entries.
Highgate won the Interschool Readers Cup. Students were accepted based on a written application, and competed in teams of 4 to answer questions from 5 set books.
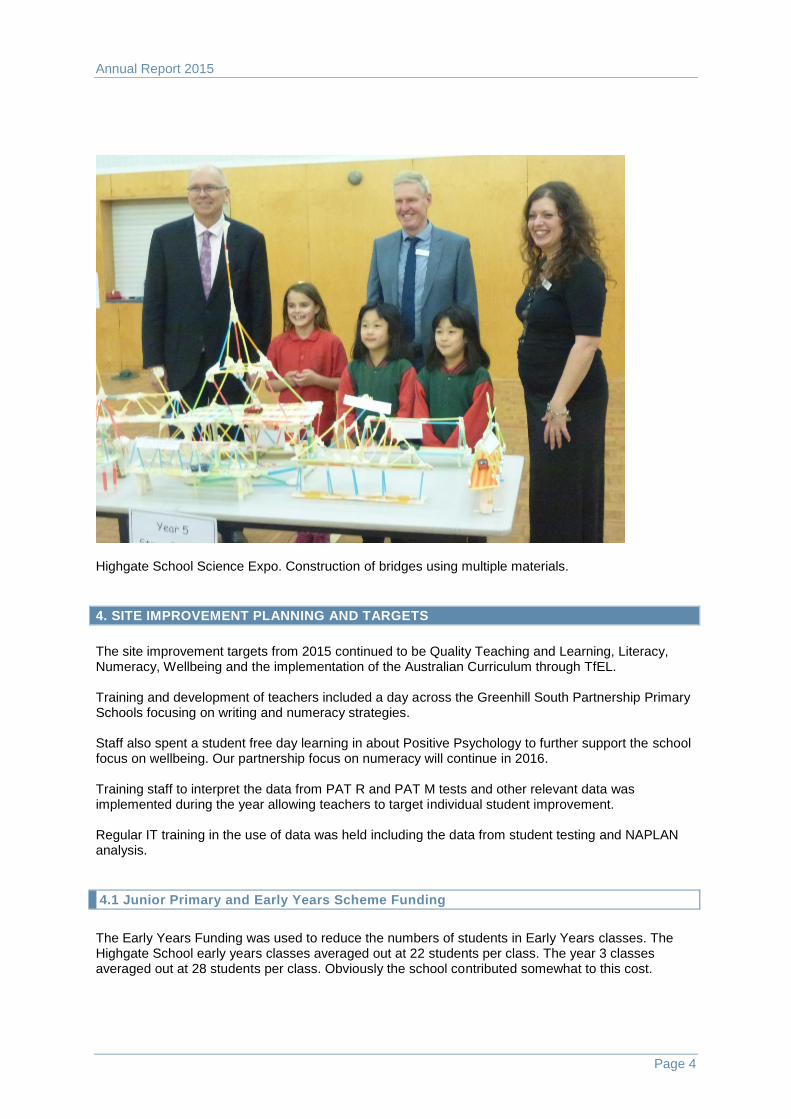
To celebrate Science Week Highgate School celebrated our first Science Expo on Thursday night, 20 August. Congratulations to the students who made over 200 bridges.
Students competed in the UNSW competitions with 3 students winning medals in Science and Computing. This means they have achieved the highest score in that test in NT and SA at that year level.
A Year 7 student received The Prudence medal and prize for the highest number of consecutive correct answers in the Australian Mathematics Competition
Four students in one school is a fantastic achievement
Two robotics teams took part in the First Lego League Competition. This year our first all girls’ team and a boys’ team competed.
A number of students achieved Credits, Distinctions, and High Distinctions in the English, Science, Maths and Computing competitions (results in student achievement area).
Year 7 students once again travelled to Canberra, which is always a highlight for their final Primary year. This year they had the good fortune to be able to attend the Remembrance Day Ceremony at the War Memorial.
All classes participated in a diversity of excursions and incursions which complemented the in-class learning. Incursions included dance, sports clinics, the Adelaide Symphony Orchestra and Camp Quality puppets, while excursions included Old Tailem Town, the Magistrates Court, Urrbrae Wetlands and the Central Market to name but a few.
All teachers participated in a range of whole school training including Maths and Grammar. 5 teachers participated in a Mathematician in Residence programme.
Six teachers attended the Future Schools Conference in Sydney which included sessions on Young Learners and Technology, Special Education and Technology, and Teaching Kids Code
A number of teachers and SSOs completed training in understanding Autism.
SSOs were trained in Quicksmart Maths and Minilit
Performing Arts
Music and the Performing Arts enjoy a high profile at Highgate School, and many of our students
learn one or more instruments, or play or sing in a band, or all three!
The band and Senior Choir performed at many functions both in school and in the community.
Junior Choir entertained the audience at Rosefield Uniting Church
Senior Choir again received an “A” for the Festival of Music assessment.
5 students attended a 2 day concert band workshop run by DECD at the Ridley Centre, Wayville, joining with over 200 like-minded Year 6 & 7 students to make music, learn new pieces, make new friends, practise, work hard and have fun!
Annual Report 2015
Page 3
Together with visiting students from other schools, Highgate School hosted a concert on behalf of the Save the Children organisation to celebrate Children’s Week.
Highgate participated in the Primary Schools’ Festival of Music concert series at the Festival Theatre and the band entertained Festival Choir visitors with their foyer performance.
Students were involved in the Festival as: programme comperes, vocal soloists, assisting artist, choreography leaders and orchestra members.
Sport
Teachers, coaches, parents and students from other schools gave students a wide range of sporting
opportunities. This is reflected in the many sporting participations and achievements in 2015.
Highgate Pedal Prix team won two of the four races this year, and came second by one point in a score of several hundred points.
Students represented the school at the district and State level in sports including aerobics, cricket, cycling, football, hockey, netball, rugby, soccer, and swimming.
For the second year in a row the Highgate SAPSASA cricket team, the Highgate SAPSASA football team made it through to the Grand Final. The Highgate SAPSASA softball team and the Highgate SAPSASA boy’s netball team won the knock-out large schools knockout competition.
We held a very successful R-7 Sports Day at the Unley Oval. The weather was glorious, and everyone practised hard to make the day the success it was.
71 students completed the Premiers “be active” Challenge
Year 5 students took part in the Urrbrae Sports Clinic run by Year 11 students.
Community
This year marked Highgate’s final Lantern Festival parade. Year Four students participated in the parade with their hand-made lanterns. Highgate steps down to allow other schools to participate.
A Facebook page was established
Amy Pfeiffer, our Pastoral Care Worker, was appointed to the school offering a dimension of care and support to all members of the school community.
Fundraising Committee organised a fantastic “Back to the 80’s” Quiz Night. This major fundraiser for the year raised over $13,000. The committee also ran very successful Mothers’ and Fathers’ Day stalls, and the Walkathon, and this year introduced the inaugural “Friendraiser” afternoon.
The Year 6 students continue to be involved with the Lourdes Valley Southern Cross Home. This year each student presented their buddy with a clay hand and a short biography they had written for their buddy to complete the Intergenerational Project.
The school community generously donated clothing, toiletries and food to charities during the year.
Through the recycling programme students raised money for the Zoo to assist endangered species
The Early Years garden and the front of the school on Highgate Street was transformed through the hard work of the Grounds Committee and enthusiastic helpers at working bees!
Highgate once again hosted work experience and Community Care students.
Annual Report 2015
Page 4
Highgate School Science Expo. Construction of bridges using multiple materials.
4. SITE IMPROVEMENT PLANNING AND TARGETS
The site improvement targets from 2015 continued to be Quality Teaching and Learning, Literacy, Numeracy, Wellbeing and the implementation of the Australian Curriculum through TfEL. Training and development of teachers included a day across the Greenhill South Partnership Primary Schools focusing on writing and numeracy strategies. Staff also spent a student free day learning in about Positive Psychology to further support the school focus on wellbeing. Our partnership focus on numeracy will continue in 2016. Training staff to interpret the data from PAT R and PAT M tests and other relevant data was implemented during the year allowing teachers to target individual student improvement. Regular IT training in the use of data was held including the data from student testing and NAPLAN analysis.
4.1 Junior Primary and Early Years Scheme Funding
The Early Years Funding was used to reduce the numbers of students in Early Years classes. The Highgate School early years classes averaged out at 22 students per class. The year 3 classes averaged out at 28 students per class. Obviously the school contributed somewhat to this cost.
Annual Report 2015
Page 5
4.2 Better Schools Funding
Highgate School received $28000 in funding for a school of 600 students from Better Schools Funding. The money was used to improve leaning outcomes for students who are behind. Specifically it was used to set up and maintain several projects such as multilit and minilit and implement Quick Smart Maths for year 6 and 7. http://www.decd.sa.gov.au/SchoolFundingReform/
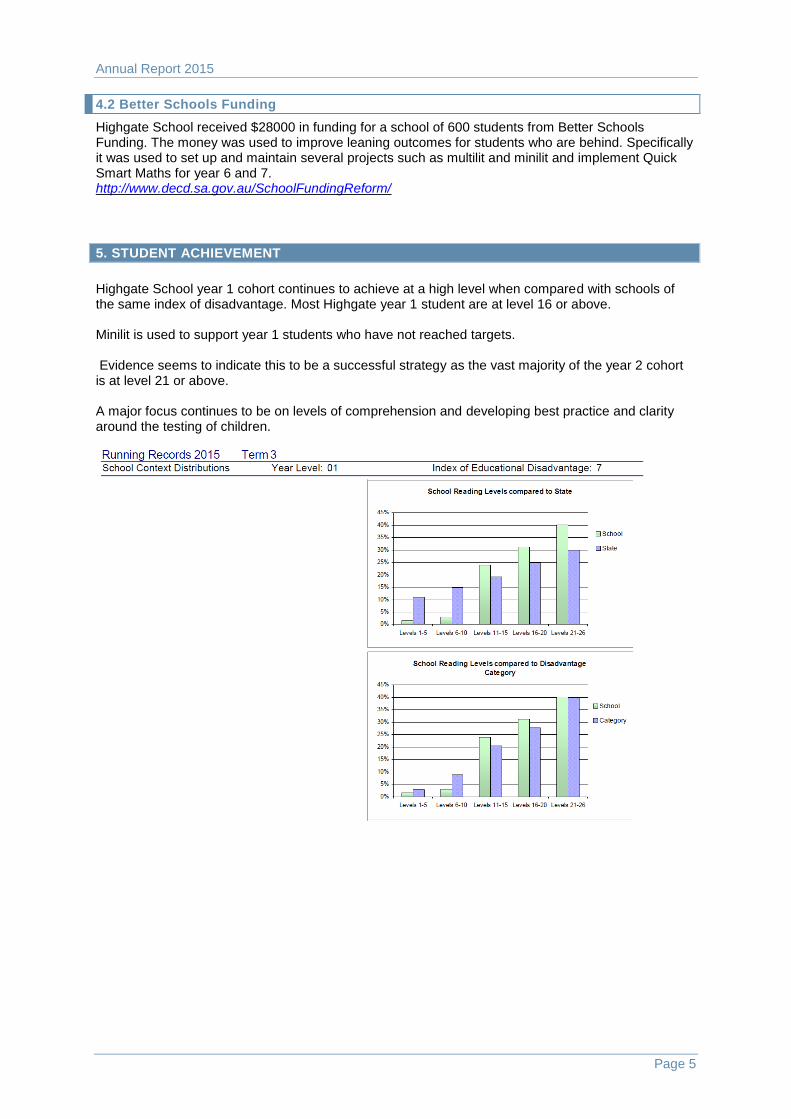
5. STUDENT ACHIEVEMENT
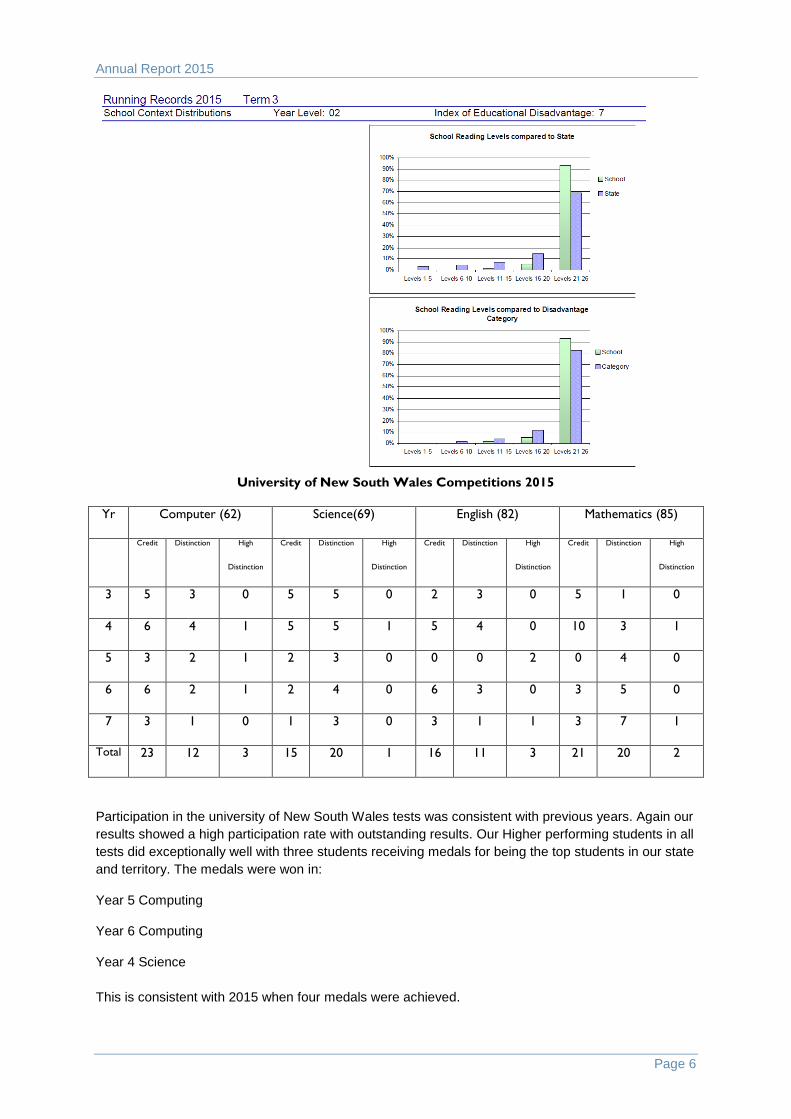
Highgate School year 1 cohort continues to achieve at a high level when compared with schools of the same index of disadvantage. Most Highgate year 1 student are at level 16 or above. Minilit is used to support year 1 students who have not reached targets. Evidence seems to indicate this to be a successful strategy as the vast majority of the year 2 cohort is at level 21 or above. A major focus continues to be on levels of comprehension and developing best practice and clarity around the testing of children.
Annual Report 2015
Page 6
University of New South Wales Competitions 2015
Yr Computer (62) Science(69) English (82) Mathematics (85)
Credit Distinction High
Distinction
Credit Distinction High
Distinction
Credit Distinction High
Distinction
Credit Distinction High
Distinction
3 5 3 0 5 5 0 2 3 0 5 1 0
4 6 4 1 5 5 1 5 4 0 10 3 1
5 3 2 1 2 3 0 0 0 2 0 4 0
6 6 2 1 2 4 0 6 3 0 3 5 0
7 3 1 0 1 3 0 3 1 1 3 7 1
Total 23 12 3 15 20 1 16 11 3 21 20 2
Participation in the university of New South Wales tests was consistent with previous years. Again our
results showed a high participation rate with outstanding results. Our Higher performing students in all
tests did exceptionally well with three students receiving medals for being the top students in our state
and territory. The medals were won in:
Year 5 Computing
Year 6 Computing
Year 4 Science
This is consistent with 2015 when four medals were achieved.
Annual Report 2015
Page 7
5.1 NAPLAN
Highgate School continues to achieve at high levels in all areas of NAPLAN. Again year 5 students have the lowest achievement of the year levels tested and yet their results are strong when compared to other schools. In 2014 Highgate School has begun the process of targeting individual students for improvement, which has continued in 2015. This strategy will include the use of NAPLAN individual scores and results from PAT M tests to target improvement for individual students in all year levels.
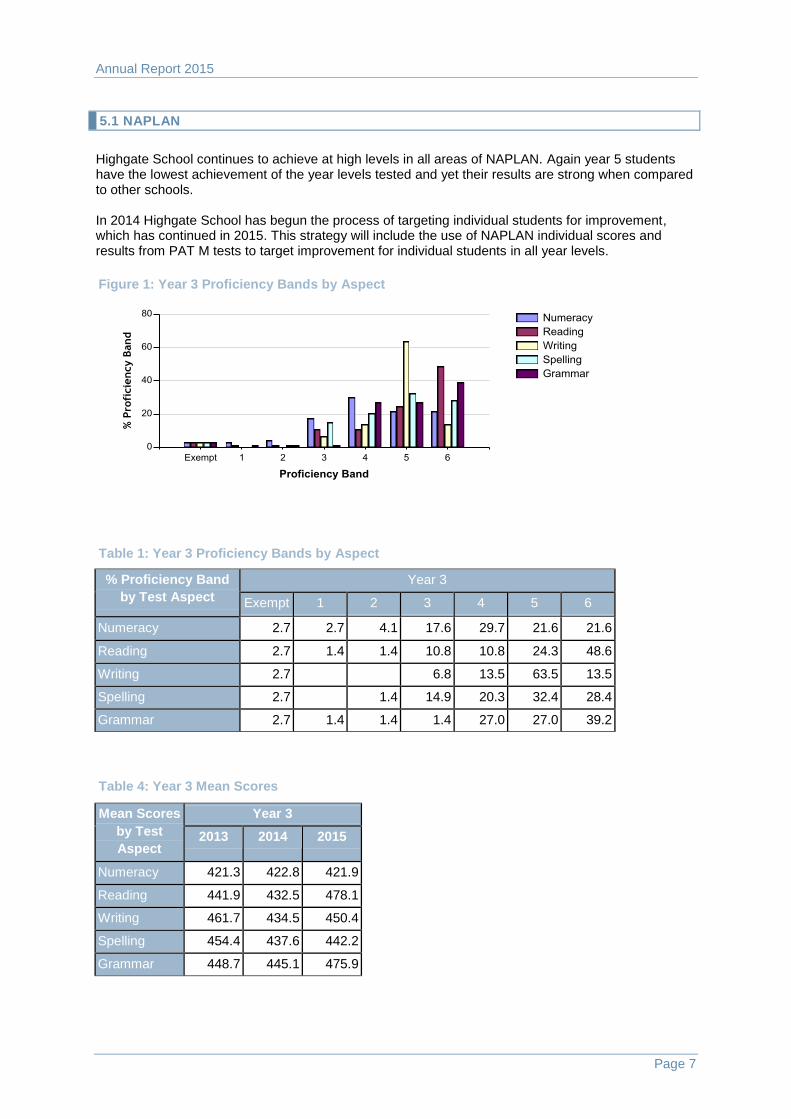
Figure 1: Year 3 Proficiency Bands by Aspect
Table 1: Year 3 Proficiency Bands by Aspect
% Proficiency Band
by Test Aspect
Year 3
Exempt 1 2 3 4 5 6
Numeracy 2.7 2.7 4.1 17.6 29.7 21.6 21.6
Reading 2.7 1.4 1.4 10.8 10.8 24.3 48.6
Writing 2.7 6.8 13.5 63.5 13.5
Spelling 2.7 1.4 14.9 20.3 32.4 28.4
Grammar 2.7 1.4 1.4 1.4 27.0 27.0 39.2
Table 4: Year 3 Mean Scores
Mean Scores
by Test
Aspect
Year 3
2013 2014 2015
Numeracy 421.3 422.8 421.9
Reading 441.9 432.5 478.1
Writing 461.7 434.5 450.4
Spelling 454.4 437.6 442.2
Grammar 448.7 445.1 475.9
Annual Report 2015
Page 8
The Year 3 cohort of students has maintained their high level. When compared with like schools a realistic target is to achieve around 60% of students in the top two bands in all areas with no students in the bottom bands. In 2015 numeracy levels were maintained. A focus on numeracy began during 2015 and will continue for the next three years. 72% was achieved in reading in the top two bands up from 54%. In 2016 NAPLAN 76% was achieved in the top two bands in writing, up from 60%, 60% was achieved in the top two bands in spelling up from 47% and 66% was achieved in the top two bands in grammar, up from 55% There was a slight increase in numbers of students in the bottom two bands. Year 5.
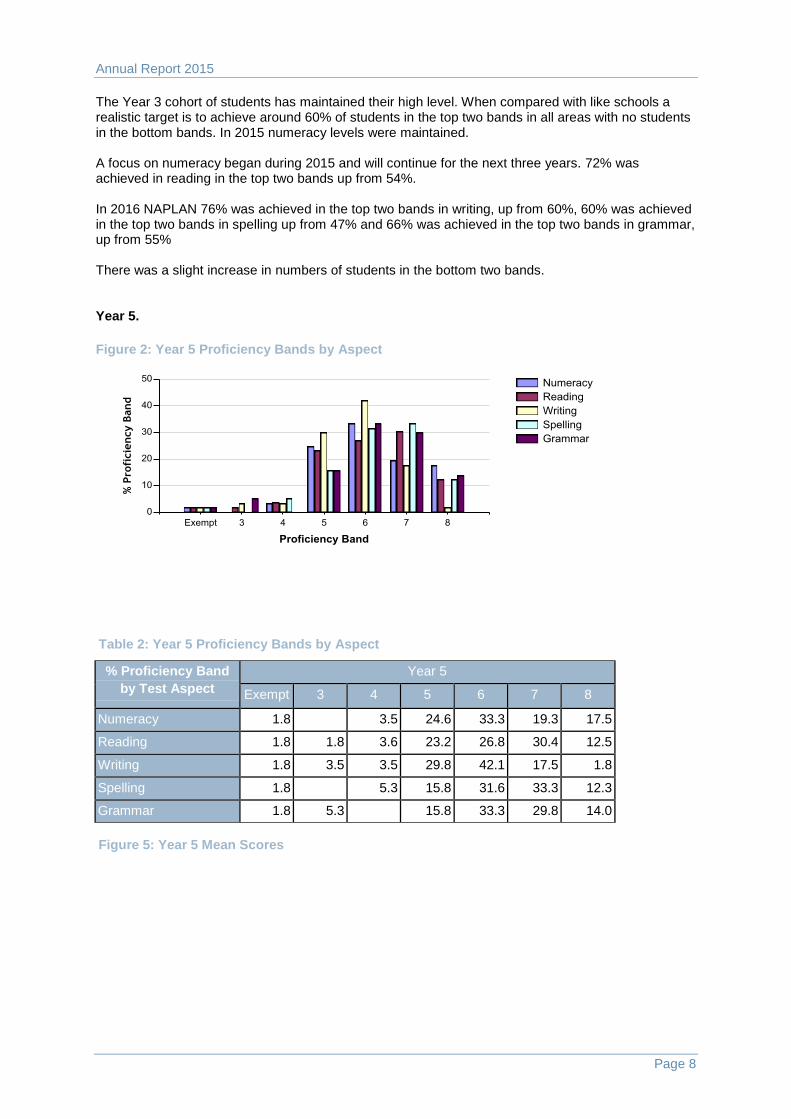
Figure 2: Year 5 Proficiency Bands by Aspect
Table 2: Year 5 Proficiency Bands by Aspect
% Proficiency Band
by Test Aspect
Year 5
Exempt 3 4 5 6 7 8
Numeracy 1.8 3.5 24.6 33.3 19.3 17.5
Reading 1.8 1.8 3.6 23.2 26.8 30.4 12.5
Writing 1.8 3.5 3.5 29.8 42.1 17.5 1.8
Spelling 1.8 5.3 15.8 31.6 33.3 12.3
Grammar 1.8 5.3 15.8 33.3 29.8 14.0
Figure 5: Year 5 Mean Scores
Annual Report 2015
Page 9
Table 5: Year 5 Mean Scores
Mean Scores
by Test
Aspect
Year 5
2013 2014 2015
Numeracy 505.4 499.1 522.0
Reading 523.5 513.8 519.9
Writing 494.8 452.2 490.0
Spelling 509.4 512.5 524.4
Grammar 507.3 512.2 521.3
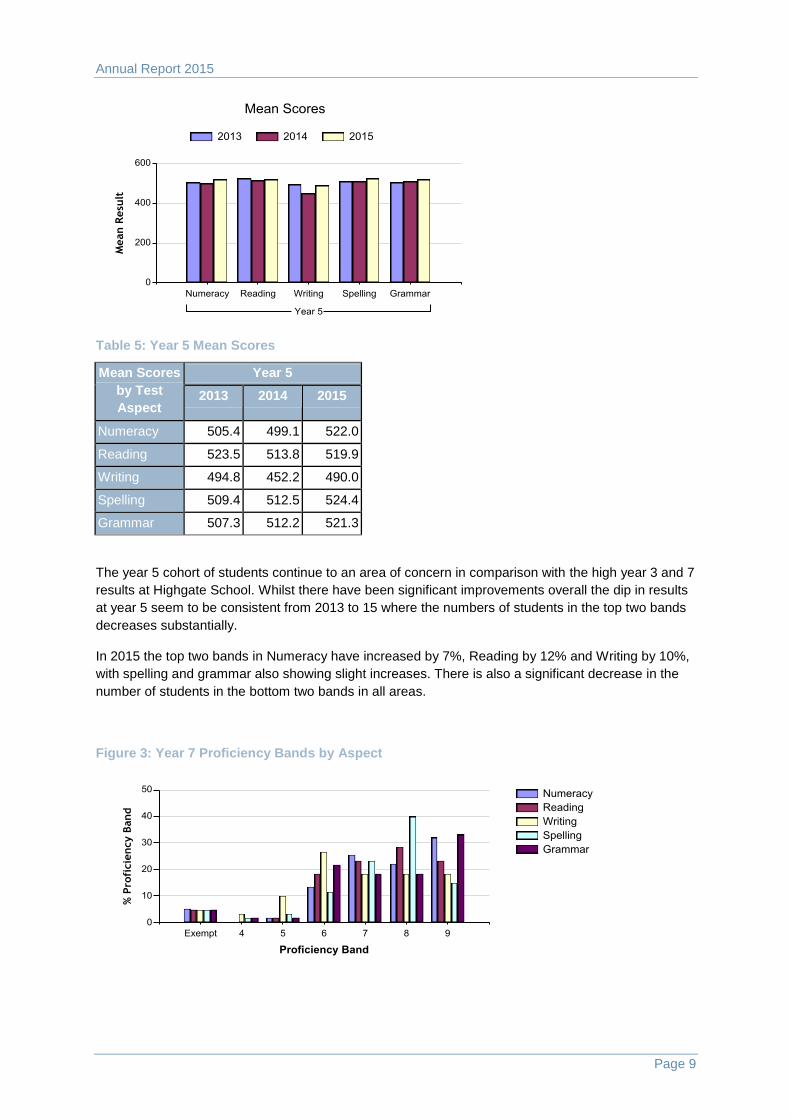
The year 5 cohort of students continue to an area of concern in comparison with the high year 3 and 7
results at Highgate School. Whilst there have been significant improvements overall the dip in results
at year 5 seem to be consistent from 2013 to 15 where the numbers of students in the top two bands
decreases substantially.
In 2015 the top two bands in Numeracy have increased by 7%, Reading by 12% and Writing by 10%,
with spelling and grammar also showing slight increases. There is also a significant decrease in the
number of students in the bottom two bands in all areas.
Figure 3: Year 7 Proficiency Bands by Aspect
Annual Report 2015
Page 10
Table 3: Year 7 Proficiency Bands by Aspect
% Proficiency Band
by Test Aspect
Year 7
Exempt 4 5 6 7 8 9
Numeracy 5.1 1.7 13.6 25.4 22.0 32.2
Reading 5.0 1.7 18.3 23.3 28.3 23.3
Writing 5.0 3.3 10.0 26.7 18.3 18.3 18.3
Spelling 5.0 1.7 3.3 11.7 23.3 40.0 15.0
Grammar 5.0 1.7 1.7 21.7 18.3 18.3 33.3
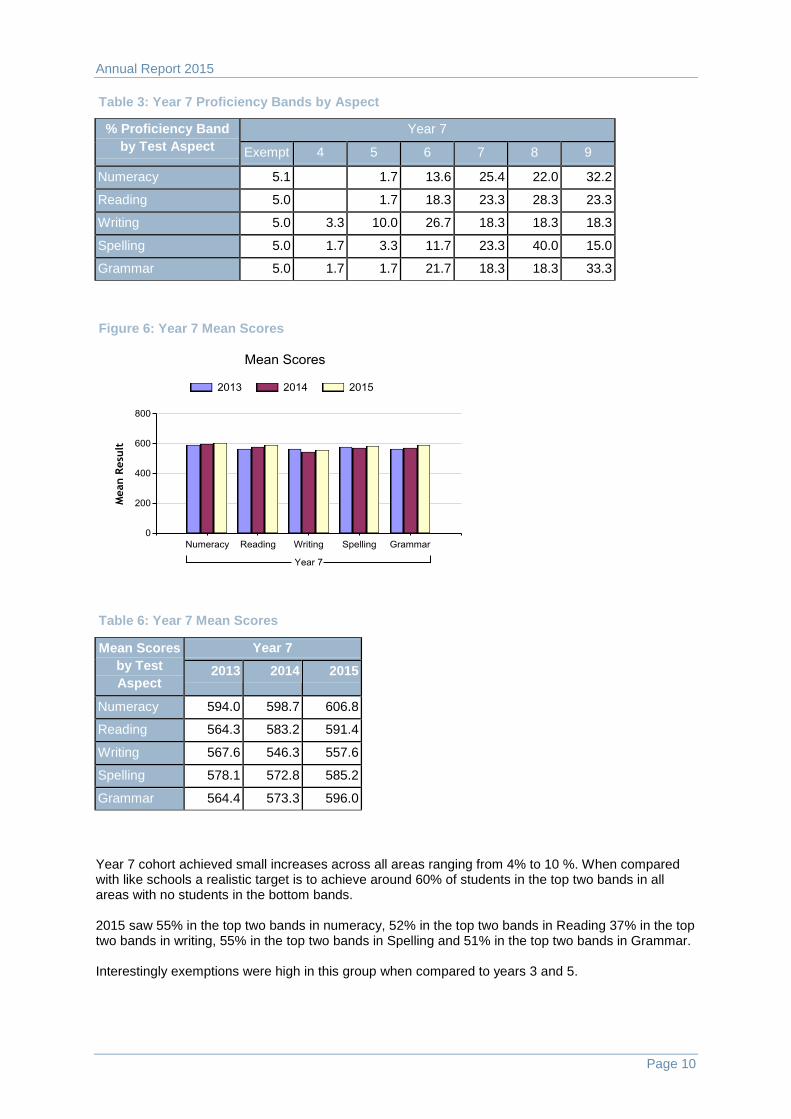
Figure 6: Year 7 Mean Scores
Table 6: Year 7 Mean Scores
Mean Scores
by Test
Aspect
Year 7
2013 2014 2015
Numeracy 594.0 598.7 606.8
Reading 564.3 583.2 591.4
Writing 567.6 546.3 557.6
Spelling 578.1 572.8 585.2
Grammar 564.4 573.3 596.0
Year 7 cohort achieved small increases across all areas ranging from 4% to 10 %. When compared with like schools a realistic target is to achieve around 60% of students in the top two bands in all areas with no students in the bottom bands. 2015 saw 55% in the top two bands in numeracy, 52% in the top two bands in Reading 37% in the top two bands in writing, 55% in the top two bands in Spelling and 51% in the top two bands in Grammar. Interestingly exemptions were high in this group when compared to years 3 and 5.
Annual Report 2015
Page 11
Student Data
Attendance
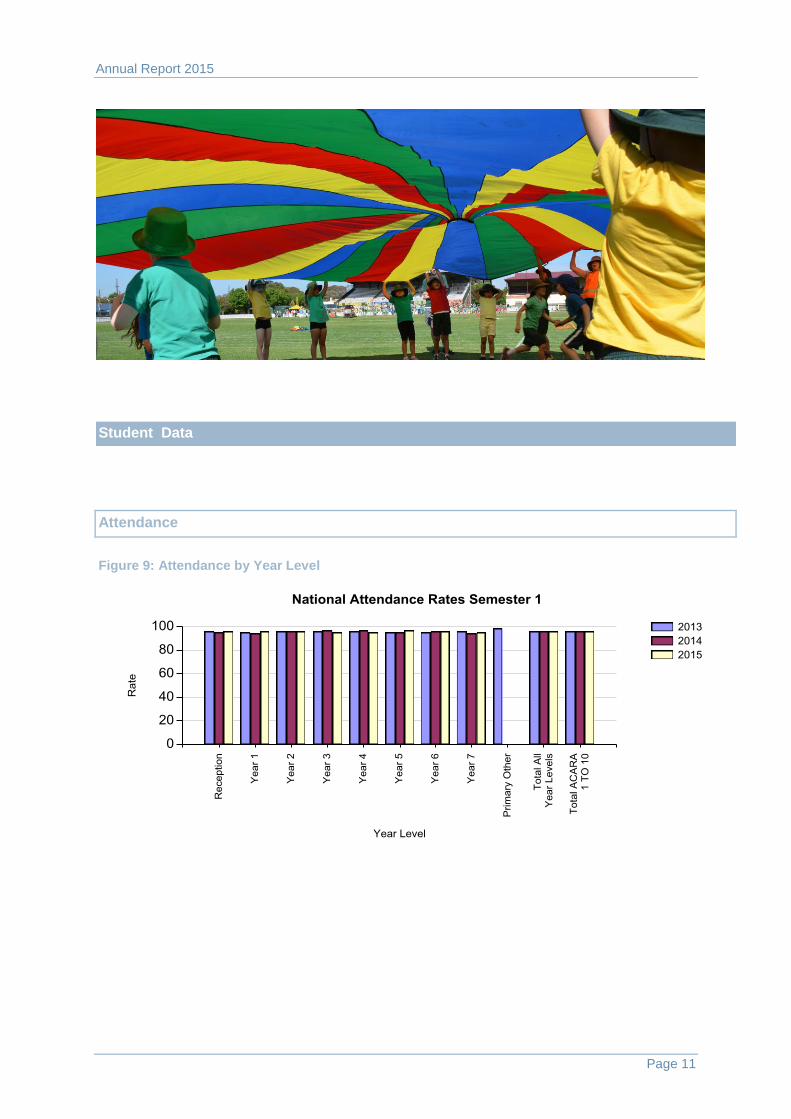
Figure 9: Attendance by Year Level
Annual Report 2015
Page 12
Table 9: Attendance by Year Level
Attendance by Year Level % Attendance
2013 2014 2015
Reception 95.7 94.9 95.8
Year 1 95.3 94.4 95.5
Year 2 95.7 95.6 96.1
Year 3 96.2 96.5 95.0
Year 4 95.4 96.8 94.9
Year 5 95.1 95.3 96.4
Year 6 95.0 95.5 95.8
Year 7 95.4 93.9 95.3
Primary Other 98.7
Total All Year Levels 95.5 95.4 95.6
Total ACARA 1 TO 10 95.4 95.4 95.6
Attendance remains consistent over several years at 95+% overall.
7. CLIENT OPINION
Annual Report 2015
Page 13
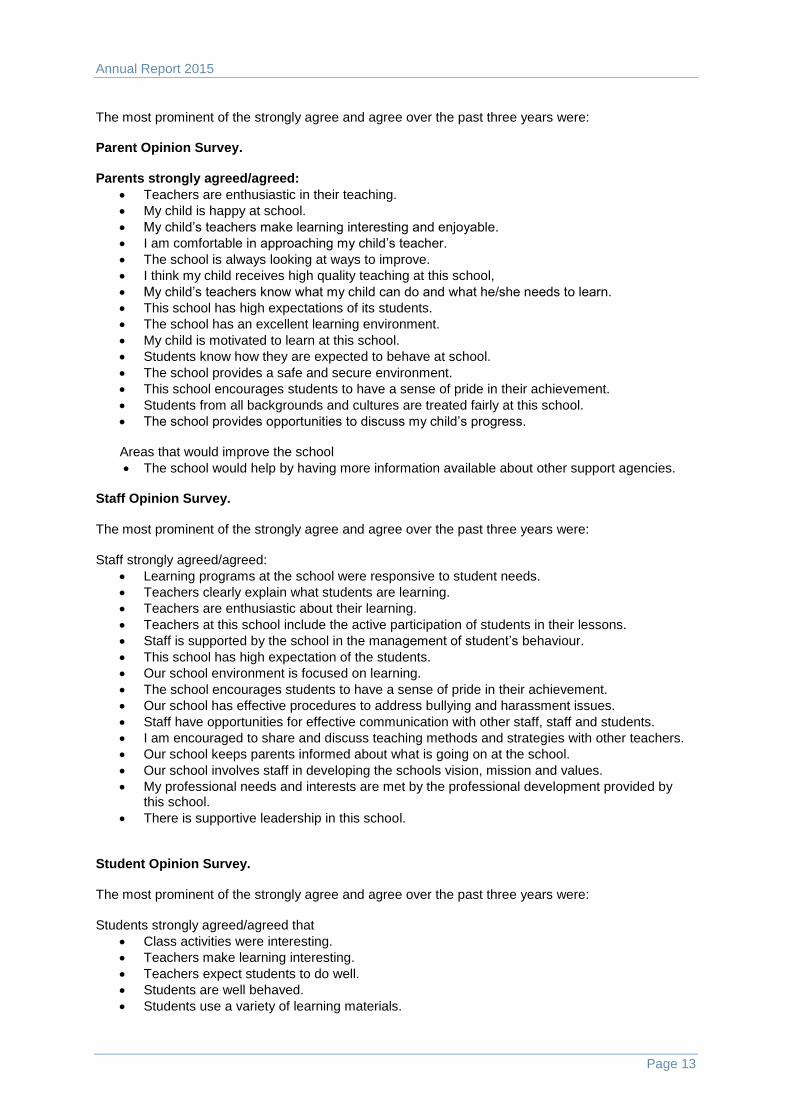
The most prominent of the strongly agree and agree over the past three years were: Parent Opinion Survey. Parents strongly agreed/agreed:
Teachers are enthusiastic in their teaching.
My child is happy at school.
My child’s teachers make learning interesting and enjoyable.
I am comfortable in approaching my child’s teacher.
The school is always looking at ways to improve.
I think my child receives high quality teaching at this school,
My child’s teachers know what my child can do and what he/she needs to learn.
This school has high expectations of its students.
The school has an excellent learning environment.
My child is motivated to learn at this school.
Students know how they are expected to behave at school.
The school provides a safe and secure environment.
This school encourages students to have a sense of pride in their achievement.
Students from all backgrounds and cultures are treated fairly at this school.
The school provides opportunities to discuss my child’s progress. Areas that would improve the school
The school would help by having more information available about other support agencies. Staff Opinion Survey. The most prominent of the strongly agree and agree over the past three years were: Staff strongly agreed/agreed:
Learning programs at the school were responsive to student needs.
Teachers clearly explain what students are learning.
Teachers are enthusiastic about their learning.
Teachers at this school include the active participation of students in their lessons.
Staff is supported by the school in the management of student’s behaviour.
This school has high expectation of the students.
Our school environment is focused on learning.
The school encourages students to have a sense of pride in their achievement.
Our school has effective procedures to address bullying and harassment issues.
Staff have opportunities for effective communication with other staff, staff and students.
I am encouraged to share and discuss teaching methods and strategies with other teachers.
Our school keeps parents informed about what is going on at the school.
Our school involves staff in developing the schools vision, mission and values.
My professional needs and interests are met by the professional development provided by this school.
There is supportive leadership in this school. Student Opinion Survey. The most prominent of the strongly agree and agree over the past three years were: Students strongly agreed/agreed that
Class activities were interesting.
Teachers make learning interesting.
Teachers expect students to do well.
Students are well behaved.
Students use a variety of learning materials.
Annual Report 2015
Page 14
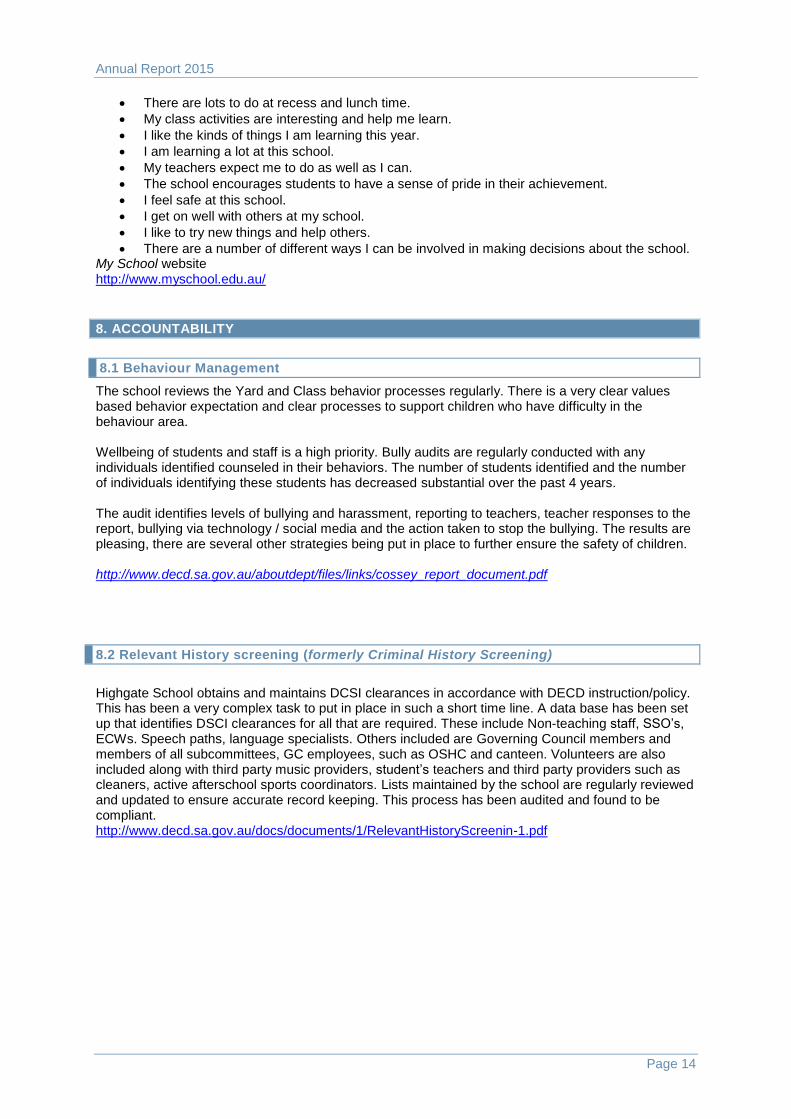
There are lots to do at recess and lunch time.
My class activities are interesting and help me learn.
I like the kinds of things I am learning this year.
I am learning a lot at this school.
My teachers expect me to do as well as I can.
The school encourages students to have a sense of pride in their achievement.
I feel safe at this school.
I get on well with others at my school.
I like to try new things and help others.
There are a number of different ways I can be involved in making decisions about the school. My School website http://www.myschool.edu.au/
8. ACCOUNTABILITY
8.1 Behaviour Management
The school reviews the Yard and Class behavior processes regularly. There is a very clear values based behavior expectation and clear processes to support children who have difficulty in the behaviour area. Wellbeing of students and staff is a high priority. Bully audits are regularly conducted with any individuals identified counseled in their behaviors. The number of students identified and the number of individuals identifying these students has decreased substantial over the past 4 years. The audit identifies levels of bullying and harassment, reporting to teachers, teacher responses to the report, bullying via technology / social media and the action taken to stop the bullying. The results are pleasing, there are several other strategies being put in place to further ensure the safety of children. http://www.decd.sa.gov.au/aboutdept/files/links/cossey_report_document.pdf
8.2 Relevant History screening (formerly Criminal History Screening)
Highgate School obtains and maintains DCSI clearances in accordance with DECD instruction/policy. This has been a very complex task to put in place in such a short time line. A data base has been set up that identifies DSCI clearances for all that are required. These include Non-teaching staff, SSO’s, ECWs. Speech paths, language specialists. Others included are Governing Council members and members of all subcommittees, GC employees, such as OSHC and canteen. Volunteers are also included along with third party music providers, student’s teachers and third party providers such as cleaners, active afterschool sports coordinators. Lists maintained by the school are regularly reviewed and updated to ensure accurate record keeping. This process has been audited and found to be compliant. http://www.decd.sa.gov.au/docs/documents/1/RelevantHistoryScreenin-1.pdf
Annual Report 2015
Page 15
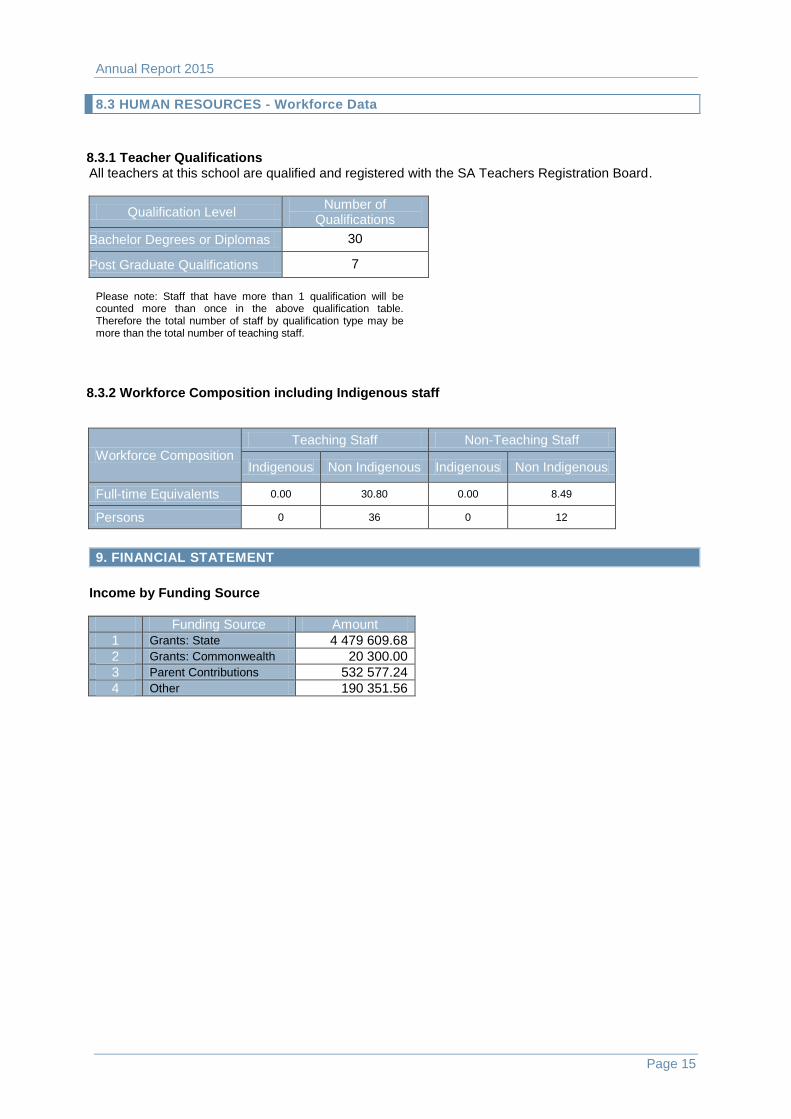
8.3 HUMAN RESOURCES - Workforce Data
8.3.1 Teacher Qualifications All teachers at this school are qualified and registered with the SA Teachers Registration Board.
Qualification Level Number of
Qualifications
Bachelor Degrees or Diplomas 30
Post Graduate Qualifications 7
Please note: Staff that have more than 1 qualification will be counted more than once in the above qualification table. Therefore the total number of staff by qualification type may be more than the total number of teaching staff.
8.3.2 Workforce Composition including Indigenous staff
Workforce Composition Teaching Staff Non-Teaching Staff
Indigenous Non Indigenous Indigenous Non Indigenous
Full-time Equivalents 0.00 30.80 0.00 8.49
Persons 0 36 0 12
9. FINANCIAL STATEMENT
Income by Funding Source
Funding Source Amount
1 Grants: State 4 479 609.68
2 Grants: Commonwealth 20 300.00
3 Parent Contributions 532 577.24
4 Other 190 351.56