Embed Size (px)
Citation preview
HoKua Place Section 343‐5e HRS Draft
Environmental Impact Statement Volume II
Prepared for:
Accepting Authority
State of Hawaiʻi Land Use Commission &
Petitioner
HG Kauaʻi Joint Venture LLC
Prepared by:
Ho`okuleana LLC … to take responsibility …
1539 Kanapuʻu Drive Kailua, Hawai`i 96734
(808) 226‐3567 www.Hookuleana.com [email protected]
May 2015
Volume II
Exhibit A ‐ Kapaʻa Housing Market Study Exhibit B ‐ Kapaʻa Highlands II Sustainability Plan Exhibit C ‐ Kapaʻa Highlands Agricultural Master Plan Exhibit D ‐ Department of Water, County of Kauaʻi Managers Report 12‐10 Exhibit E ‐ Irrigation Supply for the Kapaʻa Highlands Agricultural Subdivision
Water Master Plan Exhibit F ‐ Preliminary Engineering Report Drainage Improvements Kapaʻa Highlands Phase II Exhibit G ‐ Preliminary Engineering Report Wastewater Improvements Kapaʻa Highlands
Phase II Exhibit H ‐ Traffic Impact Assessment Report Kapaʻa Highlands Subdivision Kapa‘a, Kaua‘i,
Hawaii TMK: (4) 4‐3‐03:01 ‐Comments from State of Hawaii Department of Transportation and Responses Relative to TIAR Submitted December 9, 2013 ‐Review of Traffic Impact Assessment Report for Kapaa Highlands Subdivision Kauai, Kapaa, TMK: (4) 4‐3‐003:001 dated March 26, 2014 ‐Traffic Consultant Response to HWY‐PS 2.6887, Traffic Impact Assessment Report (December 9, 2013), Kapaa Highlands Subdivision, Kapaa, Kauai TMK: (4) 4‐3‐003:001 dated June 6, 2014
Exhibit I ‐ Kapaʻa Highlands Legal Descrip on and Map Exhibit J ‐ Botanical Survey Kapa`a Highlands Phase II, TMK (4) 4‐3‐003:001 Kaua`i, Hawai`i
April‐May 2012 Exhibit K ‐ Biological Surveys Conducted on the Kapa‘a Highlands Phase II Project Site, TMK:
(4) 4‐3‐003:001, Island of Kaua‘i, Hawai‘i Exhibit L ‐ An Archaeological Assessment with Subsurface Testing for the Proposed Kapaʻa
Highlands Phase II Project, Kapaʻa Ahupuaʻa, Kawaihau District, Kauaʻi TMK (4) 4‐3‐3: 1
Exhibit M ‐ A Cultural Impact Assessment for the Proposed Kapaʻa Highlands Phase II, Kapa`a Ahupuaʻa, Kawaihau District, Kauaʻi
Exhibit N ‐ Comment Letters, Scoping Letters & Letters of Support Exhibit O ‐ Kaua‘i County Planning Commission Tentative Subdivision Approval for HoKua
Farm Lots, June 19, 2014 Comments and Responses to EIS Preparation Notice

HoKua Place Draft EIS
Exhibits
Comments ‐ Responses to EISPN

Exhibit A
Kapaʻa Housing Market Study
KAPAA HOUSING MARKET STUDY Page 1
By Ricky Cassiday [email protected] 3/11/14
I. INTRODUCTION The Data@Work is a market research firm that specializes in analyzing residential real estate markets for developers and lenders. We have been retained to perform a study analyzing the market for proposed master planned community on the island of Kauai, called Kapaa Highlands. This study focuses on the historical and projected market conditions and trends in accessing the ability of the project to be successful in selling its residential properties at a price and at a velocity. The study entailed collecting, comparing and analyzing information that has a bearing on the numerous aspects of market demand for the proposed project, including but not limited to publicly available real property, economic and commercial data. The author makes every effort to verify that all of the information in study and in particular the market description and analysis is accurate, but is aware that 100% accuracy is unlikely. Finally, the analysis and statements herein are based on independent research by the author.
II. PROJECT DESCRIPTION & STUDY OUTLINE Project Kapaa Highlands is a master planned project on the Island of Kauai targeting primary housing demand from local and in-migrant families, as well as offshore second home demand for view estate ownership. It sits above the historic town of Kapaa and below the foothills of the mountain chain that forms the island. It is equidistant from the two major resorts on the island (and at the center of the third, the Coconut Coast). Thus, it is at or close to the centers of employment and commercial activity. As Kapaa is arguably at the center of the island, the target market for this development will be spread across a wide range of households, but mainly appealing to local families looking for reasonably priced housing that is well-located with regard to the centers of employment in the county, as well as to a good range of shopping, recreational and social facilities. The development contains a portion of the Kapaa bypass road, a major arterial road adjacent to the property. As such, the property is accessible from three sides and is adjacent to already improved county roads. Furthermore, the property has no significant restraints relative to adequate water availability and wastewater. Finally, the Kapaa Middle School is located adjacent to the property and adds to the attractiveness of the site to the local population.
KAPAA HIGHLANDS PRODUCT MIX AND SALES PROJECTION
Product� Units�
House Lot Packages, On Large Lots (10,000 sf) 36 House Lot Packages, On Medium Lots (7,500 sf) 50 Multi-Family Dwelling Units (4 Plex, 8 DU/Ac) 500 Affordable Housing Dwelling Units (12 DU/Ac) 183
The units described above include condominiums (Multi-Family pads and Affordable Housing) and single-family homes (House Lot package).
KAPAA HOUSING MARKET STUDY Page 2
By Ricky Cassiday [email protected] 3/11/14
[Note that some of the House/Lot package units may be sold as home sites, depending on future demand and market conditions]. The condominium units will be designed in a range of bedroom configurations that will best meet the demand for housing by providing designs that apply to different family types, including starter families, empty nesters, families with children, and households that qualify for affordably priced housing. The design of the single family units will appeal to some of those in the aforementioned condominium demographic groupings, but will go further by addressing the needs of large families, families wanting to be close to the Middle School, trans-generational families needing adequate (read larger and more defined) living space, and professional families or those with multiple wage-earners. The design of the condominiums could include stacked flats and townhomes, both of which have cost and livability advantages. They will located in multi-unit buildings (four and six-plex, etc.) and laid out in a way that will be taking advantage of the site’s benefits: including those of the ocean views, the cooling winds, the warming sunlight, etc. Their density would range from 8 to 12 units per acre. The single-family units will be designed to take advantage of the area topography, as well as wind and sun direction and views. By having two different lot sizes allows for the land plan to address two demographics: the smaller lot size units would be most appropriate to starter families, and larger lot size units would be appropriate for larger families and multigenerational households. It is worth being mindful that, generally speaking, the high cost of housing production in Hawaii, and Kauai in particular, often pushes housing prices beyond what local families, particularly workforce families, can afford. To counter that, often Kauai home purchasers include a number of income earners into the purchase, both family members and non-family members. It is this market demand segment that the larger lot size and house size units will address. In keeping with the county’s affordable housing requirement, the requisite number of units will be produced and priced according to the existing income guidelines when marketed. The current affordable requirement is 30%, and the fulfillment of that will be a benefit to the local families seeking better housing or a more convenient location. Additionally, while the market homes will be priced to the market, and done so at the time of the start of construction, they will also be more affordably priced, relative to much of the new construction on the island. This is because the large size of the overall development (750+ units) is conducive to achieving construction economies of scale, both for infrastructure and vertical construction - which can be passed on to the consumer. Further, these homes and condos will also be designed with the needs of local families in mind, as opposed to the offshore buyer market. This will thus ‘lessen’ the overall demand for them, resulting in a more moderate price point. This stands in contrast to many other new home construction projects and developments on the island and in the state, which seek to address the needs of the offshore buyer (and are priced accordingly higher). Finally, it is important to note that this development will benefit those in the community who will not be purchasing here, but who nonetheless are in the market for affordable housing. This is because this, or any, provision of new housing acts to soften the pressures that push housing prices higher – national and local studies and data has shown that the supply of new housing into an existing market place results in a moderating trend in prices.
KAPAA HOUSING MARKET STUDY Page 3
By Ricky Cassiday [email protected] 3/11/14
Study Outline In an effort to evaluate the proposed project, the study will begin by describing the area, the housing stock and the economy. It will take account of the economic factors and trends that affect housing relative to the county and to the proposed project. Thereafter, it will describe the housing market in general, and in particular to this project. In doing so, it will describe and analyze the factors and trends behind the general and specific supply and demand for housing. And it will summarize the findings and finish with some concluding remarks and expectations.
III. OVERVIEW of COUNTY and MARKET Subject Propertyʼs Community Kauai County is the fourth largest county in the state, as ranked by population and economic activity, behind the City & County of Honolulu (Oahu), Maui County and the Big Island of Hawaii. The majority of the island’s roughly 52,000 residents lives and works in the coastal areas leaving the interior of Kauai natural and pristine. Kauai's weather is near perfect year round with daytime temperatures ranging from the mid 70's to the mid 80's, slightly warmer in the summer. The northeast trade winds average about 15 mph for most of the year, and provide refreshing breezes. Rain showers usually fall in the evening and early morning hours, predominantly over the mountain ranges. The temperature of the ocean ranges from 68 to 80 degrees Fahrenheit. It has one of the strongest brands in the global visitor industry, as well as arguably the most diversified visitor industry of any of the islands, combining large resort master planned communities, cruise ship visitations, time share developments and small-scale bed and breakfasts. The breadth and depth of this economic base, like the rest of the state, rests on the county’s economy’s unique comparative advantage relative to the other visitor destinations world-wide: it has a very high quality of life, a function of a naturally beautiful setting, with a benign environment and near perfect climate. Indeed, the proof of its attractiveness can be found in the quality of the number of ‘rich and famous’ who have bought in Hawaii, starting with Lawrence Rockefeller in 1960 (followed by John Wayne, George Harrison, Peter Gruber, Charles Schwab, Michael Dell, Ben Stiller, Oprah Winfrey, Akio Morita, Michael Creighton, etc.) Kauai has three major resort destinations: • Princeville, a 45-minute drive from the Airport, is a resort that runs across a large plateau
overlooking one of the largest deep-water bays in Hawaii. The view of the sunset, looking west, is extraordinarily beautiful.
• Poipu, also a 45-minute drive from the airport, sits above the south shore, with numerous
bays and beaches safe for swimming. It has the largest concentration of hotels and golf courses on the island. .
• Coconut Coast, a 20 minute drive from the airport, this area was the favored area of
Hawaiian royalty and the original site of resort development on the island and, save for Waikiki, the state. It today hosts one of the largest percentage of accommodations, shops, recreation, restaurants and historical sites on the island.
The majority of the primary housing development is located within the Kapaa and Lihue urban zones, with secondary sources located areas in and around Poipu, Kilauea/Hanalei, and Hanapepe and Waimea. Second home development is located within and around the three major

KAPAA HOUSING MARKET STUDY Page 4
By Ricky Cassiday [email protected] 3/11/14
resort communities, as well as in locations that are close to the coastline and/or in westward facing locales).
Subject Propertyʼs Housing Stock Most of the primary housing inventory and on-going development is located within the Kapaa and Lihue urban zones. Primary housing is also concentrated, but to a lesser degree, in and around the communities of Poipu, Kilauea/Hanalei, and Hanapepe and Waimea. Since the 1990s, Kauai’s housing stock has grown faster than the population, as measured by the average annual growth rate for dwellings: it grew by 3.5% p.a. between 1990 and 2000, the highest in the State. The growth rate dropped to around 1.7% over the 2000-2010 period. Many of these new units have been targeted for the visitor or second home industry. For instance, in 1990, the percentage of occupied housing units was about 92.5% of the county’s total housing stock. By 2006, according to the Hawaii Housing Study, that dropped to 76.2 percent, the greatest rate of change among the four counties. Since 2006, however, there has been a reversal of that trend, with the percent of housing stock being build for primary homeownership has increased to 89.6%. By way of context, housing development and construction was most active on Kauai during the time when the major resorts were developed in the 1970 and 1980s. Thereafter, primary housing production reached only half that level, save for periods of housing reconstruction that followed a major hurricane event.
In the years after the establishment of the resorts, there was a boom in condominium production, but many of these projects that were developed targeted the offshore buyer market. TMK records
KAPAA HOUSING MARKET STUDY Page 5
By Ricky Cassiday [email protected] 3/11/14
show that over 70% of the condo units and 12% of the single-family homes are owned by out of state residents. Census records have shown that a quarter of the County’s housing stock did not house residents in 2000. Thus, while the Census categorizes these units as “vacant,” they may be actually rented to vacationers, reserved by owners as a second home, or both. Demand in the housing market hence comes from residents, investors, and non-residents. As a result, the average prices for housing units are skewed upwards and do not necessarily reflect residents’ ability to pay for housing. Kauai housing stock is 78% owner occupied and 22% vacant, per their definition (it includes seasonal or recreational use, which itself constitutes 64% of all vacant units, with rental units constituting 20% of that total). Indeed, housing inventory shows that about 3,000 of the 4,000 condominium units in the county, or 73%, are owned out-of-state. This would account for the high prices of condos in the county, the second highest in the state. Median resale price this May 2013 for a condo on Kauai is $323,000.
HOUSING CHARACTERISTICS OF THE MARKET
Kauai County Units Occupied housing units 23,051 Owner-occupied housing units 13,968 Renter-occupied housing units 9,272 Vacant housing units 6,553 For rent 1,312 Rented, not occupied 61 For sale only 251 Sold, not occupied 51 For seasonal, recreational use 4,172 All other vacant units 706 Homeowner vacancy rate (percent) 1.8% Rental vacancy rate (percent) 12.3%
Note that the homeowner vacancy rate is low but the rental vacancy rate is high. This is indicative of a community that has high priced houses – therefore the homeowner vacancy rates are low. Additionally, as it is a very desirable place to live, there are a lot of rental units for vacation rental – and therefore the rental vacancy rate is high.
HOUSING CHARACTERISTICS OF THE MARKET, BY AREA
Waimea Koloa Lihue Kawaihau Hanalei Total Detached Home 2,270 4,843 4,706 5,212 2,013 19,044 Townhouse 57 128 142 36 113 484 Condominium 0 195 326 190 366 1,082 Duplex/multiplex 85 201 24 142 22 484 Apartment 328 139 564 202 185 1,428 Co-op 0 67 107 0 0 184 Other/Not 0 179 65 148 52 345 2,739 5,752 5,935 5,930 2,751 23,051
Note that the area of the proposed development is Kawaihau, highlighted in blue, and that area has very few dwellings that are attached units (condo, townhouse, etc.).

KAPAA HOUSING MARKET STUDY Page 6
By Ricky Cassiday [email protected] 3/11/14
IV. THE ECONOMY Simply put, residential for-sale and rental values move closely in synch with an area’s economic growth, and economic growth is determined in the short run by the balance of trade between the area and it’s major trading partners. And the mechanism by which this growth in values occurs is via rising incomes and higher job counts. We start by looking at the economic outlook for the state and the county. As the major industry is tourism, the county’s significant visitor sources would be the US, Canada and Asia As such, we look at the economic trends in all three sources.
GLOBAL ECONOMY: The overall global economic forecast by the IMF earlier this year noted that the recovery had solidified, but the unemployment remained high. It said global financial risks have shrunk, including the chance of a fallback in economic activity (a double dip).
If the advanced economies continue to repair their public and financial balance sheets, and stimulate employment, and if emerging markets do not overheat their economies, global financial markets and property markets will stabilize and grow.
UNITES STATES: The US economy is projected to grow by 3 percent in 2014, as firmer private final demand takes the burden to stimulate the economy off of federal fiscal policy. More and more, the risks to the economic outlook are abating: the recovery in housing prices and the slight growth in the job
KAPAA HOUSING MARKET STUDY Page 7
By Ricky Cassiday [email protected] 3/11/14
market are big positives looking ahead. Given the slack in the economy, inflation is expected to remain subdued, but with a rise in the interest rates in the cards.
Looking ahead, the US economy will be on the rise. That, plus the perception of a growing economy, should be sufficient to grow the Hawaii state and the Oahu county economies. As an improved US economy is manifested in terms of higher visitor industry revenues, this commensurate growth in state economic activity will then put pressure on housing, via higher job counts (immigration) and incomes.
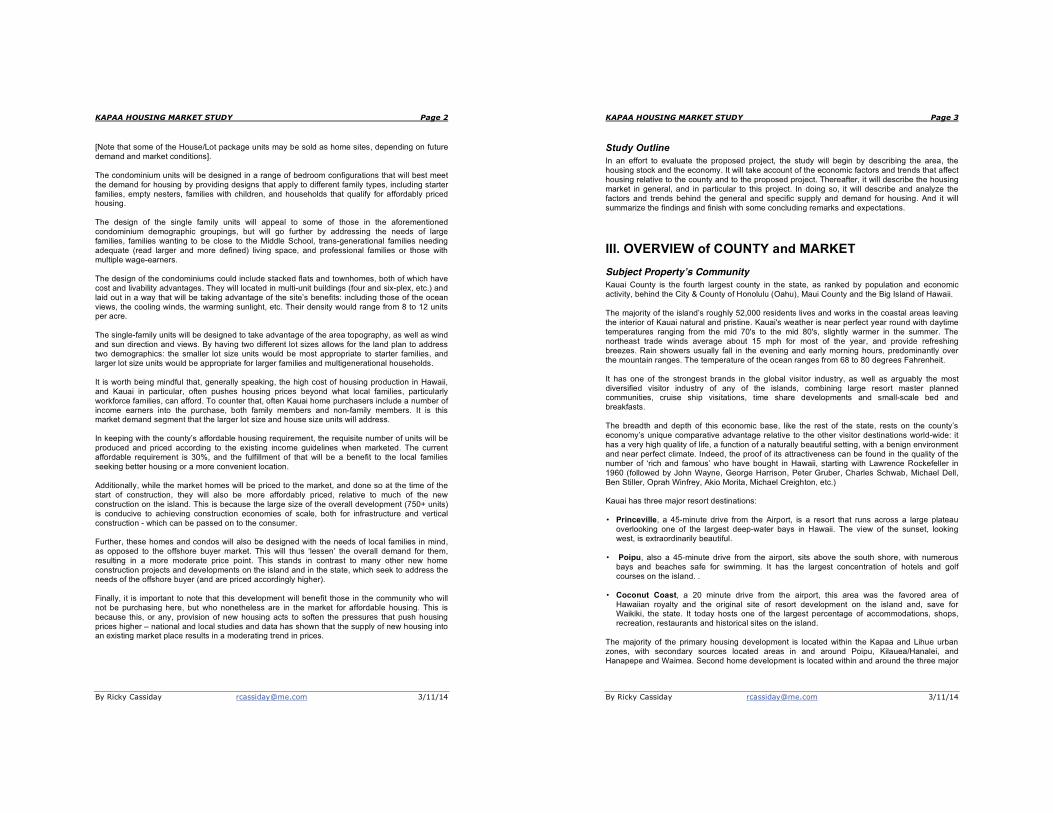
HAWAII STATE: According to the state economic forecasters, Hawaii’s economy continues to grow strongly in 2013 at an accelerating rate. The state has very low unemployment relative to the rest of the nation, thanks to a resurgent demand in the visitor industry, which is the major engine of economic growth in the county and the state (as seen below).
KAPAA HOUSING MARKET STUDY Page 8
By Ricky Cassiday [email protected] 3/11/14
Historically, Hawaii's economy follows those of the Pacific Rim countries, which bodes well for the future.
KAPAA HOUSING MARKET STUDY Page 9
By Ricky Cassiday [email protected] 3/11/14
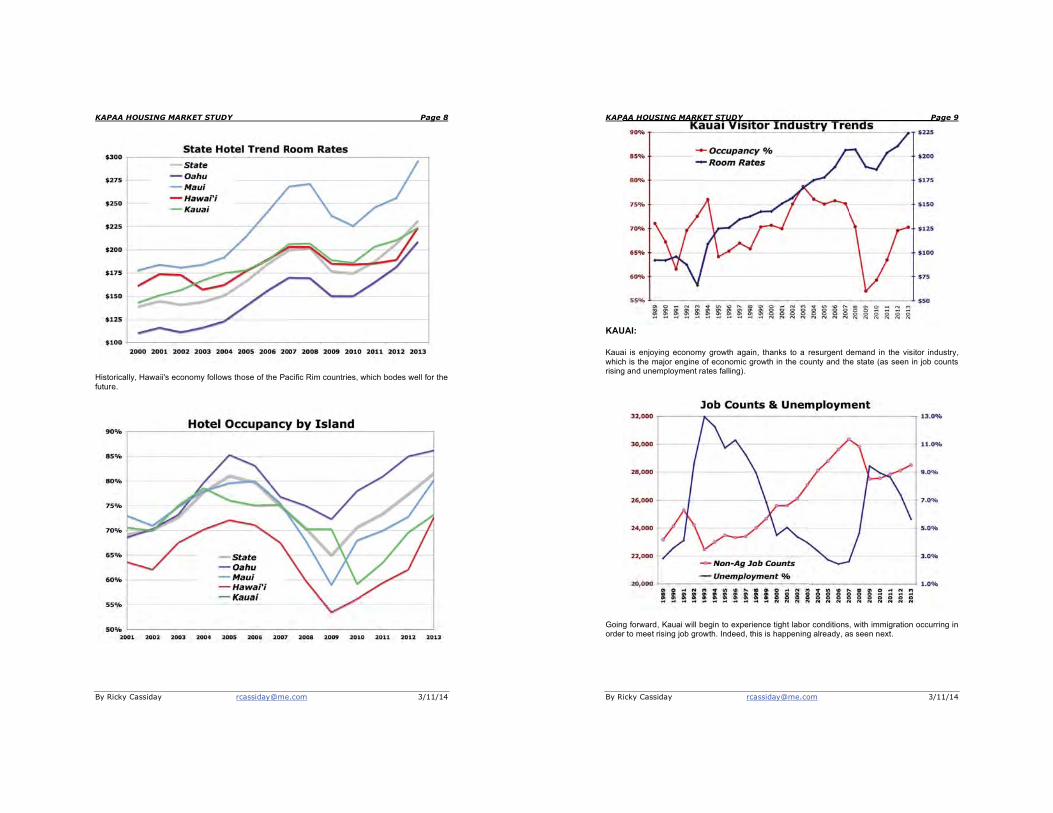
KAUAI: Kauai is enjoying economy growth again, thanks to a resurgent demand in the visitor industry, which is the major engine of economic growth in the county and the state (as seen in job counts rising and unemployment rates falling).
Going forward, Kauai will begin to experience tight labor conditions, with immigration occurring in order to meet rising job growth. Indeed, this is happening already, as seen next.
AA HOUSING MARKET STUDY Pa
KAPAA HOUSING MARKET STUDY Page 10
By Ricky Cassiday [email protected] 3/11/14
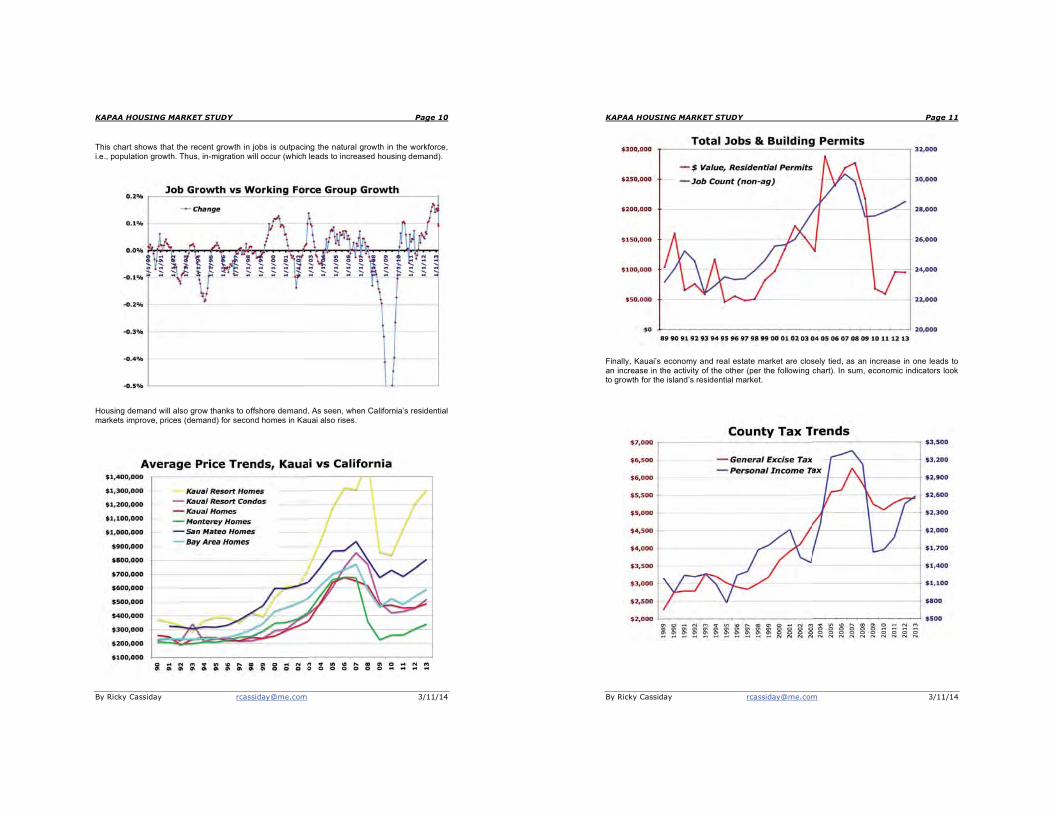
This chart shows that the recent growth in jobs is outpacing the natural growth in the workforce, i.e., population growth. Thus, in-migration will occur (which leads to increased housing demand).
Housing demand will also grow thanks to offshore demand. As seen, when California’s residential markets improve, prices (demand) for second homes in Kauai also rises.
KAPAA HOUSING MARKET STUDY Page 11
By Ricky Cassiday [email protected] 3/11/14
Finally, Kauai’s economy and real estate market are closely tied, as an increase in one leads to an increase in the activity of the other (per the following chart). In sum, economic indicators look to growth for the island’s residential market.
KAPAA HOUSING MARKET STUDY Page 12
By Ricky Cassiday [email protected] 3/11/14
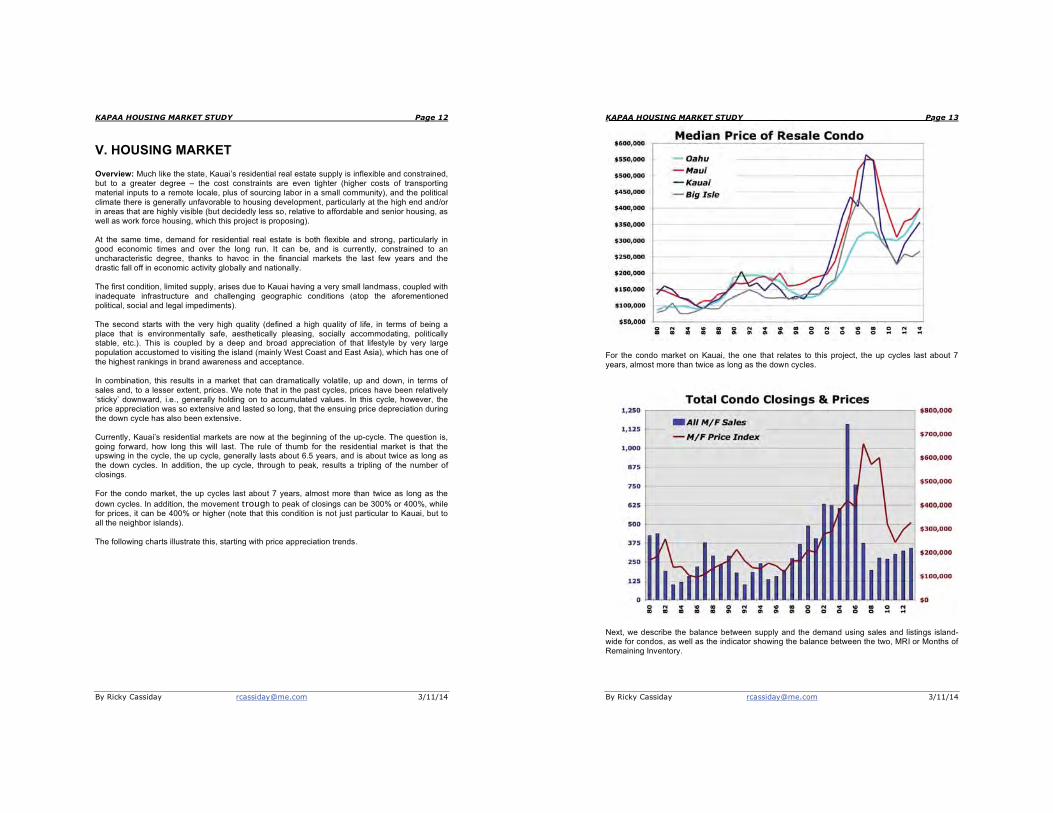
V. HOUSING MARKET Overview: Much like the state, Kauai’s residential real estate supply is inflexible and constrained, but to a greater degree – the cost constraints are even tighter (higher costs of transporting material inputs to a remote locale, plus of sourcing labor in a small community), and the political climate there is generally unfavorable to housing development, particularly at the high end and/or in areas that are highly visible (but decidedly less so, relative to affordable and senior housing, as well as work force housing, which this project is proposing). At the same time, demand for residential real estate is both flexible and strong, particularly in good economic times and over the long run. It can be, and is currently, constrained to an uncharacteristic degree, thanks to havoc in the financial markets the last few years and the drastic fall off in economic activity globally and nationally. The first condition, limited supply, arises due to Kauai having a very small landmass, coupled with inadequate infrastructure and challenging geographic conditions (atop the aforementioned political, social and legal impediments). The second starts with the very high quality (defined a high quality of life, in terms of being a place that is environmentally safe, aesthetically pleasing, socially accommodating, politically stable, etc.). This is coupled by a deep and broad appreciation of that lifestyle by very large population accustomed to visiting the island (mainly West Coast and East Asia), which has one of the highest rankings in brand awareness and acceptance. In combination, this results in a market that can dramatically volatile, up and down, in terms of sales and, to a lesser extent, prices. We note that in the past cycles, prices have been relatively ‘sticky’ downward, i.e., generally holding on to accumulated values. In this cycle, however, the price appreciation was so extensive and lasted so long, that the ensuing price depreciation during the down cycle has also been extensive. Currently, Kauai’s residential markets are now at the beginning of the up-cycle. The question is, going forward, how long this will last. The rule of thumb for the residential market is that the upswing in the cycle, the up cycle, generally lasts about 6.5 years, and is about twice as long as the down cycles. In addition, the up cycle, through to peak, results a tripling of the number of closings. For the condo market, the up cycles last about 7 years, almost more than twice as long as the down cycles. In addition, the movement trough to peak of closings can be 300% or 400%, while for prices, it can be 400% or higher (note that this condition is not just particular to Kauai, but to all the neighbor islands). The following charts illustrate this, starting with price appreciation trends.
KAPAA HOUSING MARKET STUDY Page 13
By Ricky Cassiday [email protected] 3/11/14
For the condo market on Kauai, the one that relates to this project, the up cycles last about 7 years, almost more than twice as long as the down cycles.
Next, we describe the balance between supply and the demand using sales and listings island-wide for condos, as well as the indicator showing the balance between the two, MRI or Months of Remaining Inventory.
KAPAA HOUSING MARKET STUDY Pa
KAPAA HOUSING MARKET STUDY Page 14
By Ricky Cassiday [email protected] 3/11/14
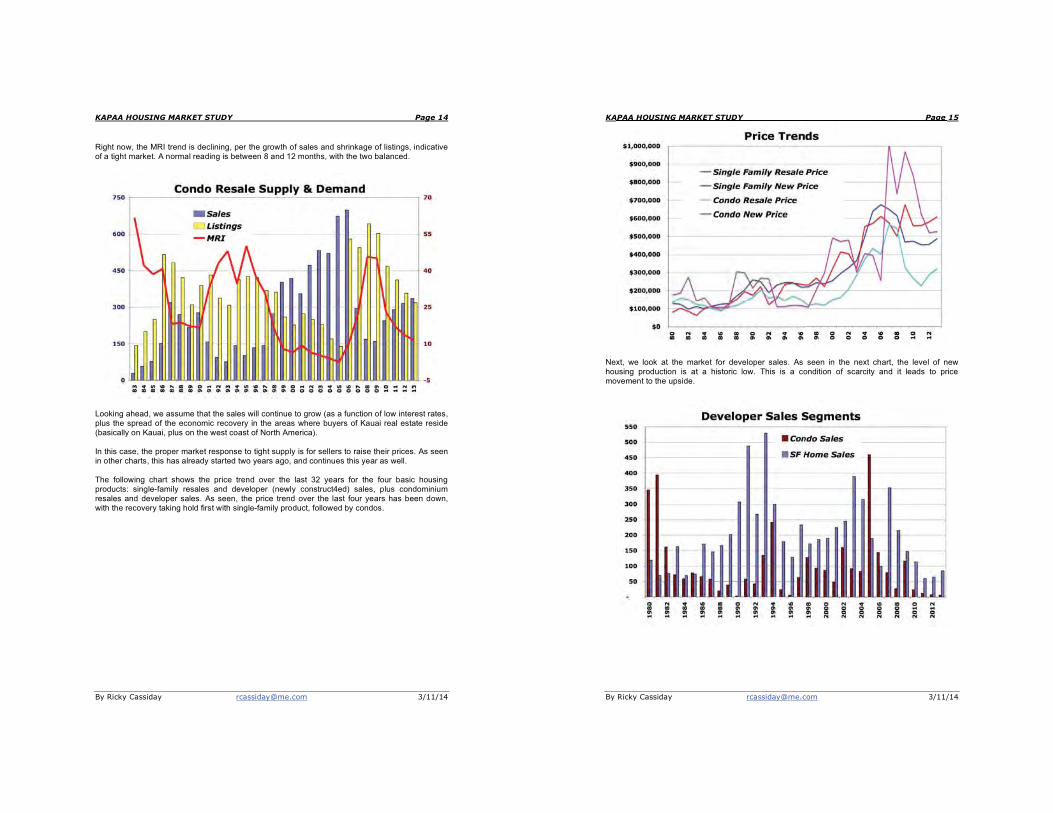
Right now, the MRI trend is declining, per the growth of sales and shrinkage of listings, indicative of a tight market. A normal reading is between 8 and 12 months, with the two balanced.
Looking ahead, we assume that the sales will continue to grow (as a function of low interest rates, plus the spread of the economic recovery in the areas where buyers of Kauai real estate reside (basically on Kauai, plus on the west coast of North America). In this case, the proper market response to tight supply is for sellers to raise their prices. As seen in other charts, this has already started two years ago, and continues this year as well. The following chart shows the price trend over the last 32 years for the four basic housing products: single-family resales and developer (newly construct4ed) sales, plus condominium resales and developer sales. As seen, the price trend over the last four years has been down, with the recovery taking hold first with single-family product, followed by condos.
KAPAA HOUSING MARKET STUDY Page 15
By Ricky Cassiday [email protected] 3/11/14
Next, we look at the market for developer sales. As seen in the next chart, the level of new housing production is at a historic low. This is a condition of scarcity and it leads to price movement to the upside.
gg

KAPAA HOUSING MARKET STUDY Page 16
By Ricky Cassiday [email protected] 3/11/14
When that happens, the general public will get a sense that there is a housing shortage, and pressure will be brought politically to increase the supply of affordable housing. In and of itself, that will help to alleviate the demand existing for affordable rental units. That said, it is likely that the demand for reasonably priced housing will vastly outpace the supply. Another way of seeing this is the long-term production of housing chart. Not only has housing production been low of late, but this also says that the current stock of housing is old, and dated.
KAPAA HOUSING MARKET STUDY Page 17
By Ricky Cassiday [email protected] 3/11/14
VI. FUTURE KAUAI HOUSING SUPPLY PERMITS The easiest way to look ahead to where the housing market is going in the short-term is by examining the activity in permits (where developers apply for permission, and pay their fees, for building residential units). A high level of activity indicates more supply is in the works, which means that more demand will be met, and the potential for prices adjusting downwards. With less supply in the works, prices will feel pressure upwards (and higher prices in the future, when demand recovers). In addition, low levels of per unit value indicate that the units being built are for the lower end of the market (and vice versa). And, this has not been the case overtime on Kauai, indicating that most of the new housing has been targeted on the upper income end of the housing market. An overview of the TOTAL RESIDENTIAL PERMITS AND VALUES Chart shows that the number of permitted units has sunk so low that it is at an all-time historical low. On the other hand, the value per permitted unit is at a record high.
Note that the 2013 data is extrapolated, using actual data through April 2013.

KAPAA HOUSING MARKET STUDY Page 18
By Ricky Cassiday [email protected] 3/11/14
The following chart shows the actual breakdown between condos and single-family homes.
As seen, the number of permits is very low – caused mainly by the condo market.
KAPAA HOUSING MARKET STUDY Page 19
By Ricky Cassiday [email protected] 3/11/14
VII. HOUSING DEMAND The prime determinant of housing demand is household formation, itself is a function of the economy and demographic and social trends. As noted above, in the short term, residential housing demand is driven by economics – specifically of job creation/income growth, as well as interest rate trends.
Incomes to buy homes, and they drive immigration, which is a prime source of housing demand (sometimes linked to population growth). This linkage is best illustrated in the RESIDENTIAL SALES & JOB GROWTH Chart. Note how closely the two trends track one another, up until the 2004-2005 period, when high prices prevented many families from buying a house. This then shows how the lack of housing supply on an on-going basis drives prices higher, and thus lowers the sales of homes. Further note, the gap that has opened up between the two trends starting in 2005. In previous recessions, a similar pattern occurred, with the sales of homes (blue line) picking up during the recovery. This was because a lot of families doubled up (multiple families living in one dwelling) during the recession. Thereafter, they took the economic gains they made in the recovery and invested it in housing. This will be happening in the next few years. If the subject property were under construction, then this unmet housing demand would turn to this project as a source of housing supply.
KAPAA HOUSING MARKET STUDY Page 20
By Ricky Cassiday [email protected] 3/11/14
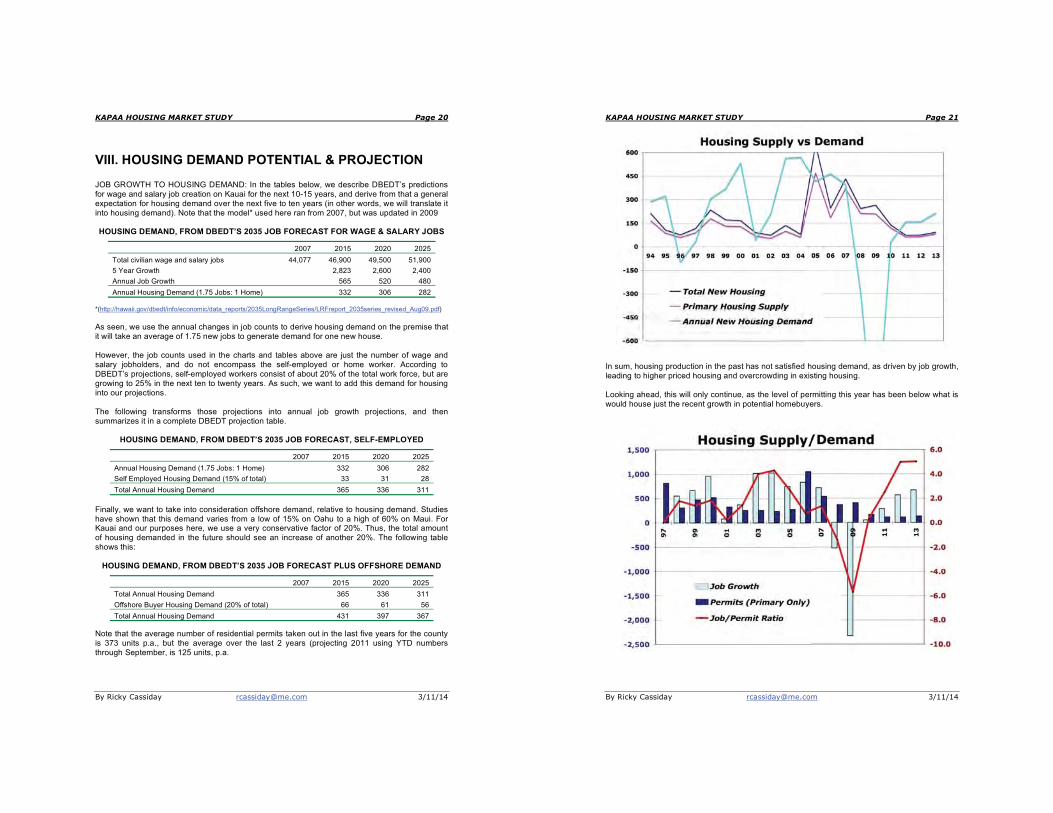
VIII. HOUSING DEMAND POTENTIAL & PROJECTION JOB GROWTH TO HOUSING DEMAND: In the tables below, we describe DBEDT’s predictions for wage and salary job creation on Kauai for the next 10-15 years, and derive from that a general expectation for housing demand over the next five to ten years (in other words, we will translate it into housing demand). Note that the model* used here ran from 2007, but was updated in 2009 HOUSING DEMAND, FROM DBEDT’S 2035 JOB FORECAST FOR WAGE & SALARY JOBS
2007 2015 2020 2025 Total civilian wage and salary jobs 44,077 46,900 49,500 51,900 5 Year Growth 2,823 2,600 2,400 Annual Job Growth 565 520 480 Annual Housing Demand (1.75 Jobs: 1 Home) 332 306 282
*(http://hawaii.gov/dbedt/info/economic/data_reports/2035LongRangeSeries/LRFreport_2035series_revised_Aug09.pdf) As seen, we use the annual changes in job counts to derive housing demand on the premise that it will take an average of 1.75 new jobs to generate demand for one new house. However, the job counts used in the charts and tables above are just the number of wage and salary jobholders, and do not encompass the self-employed or home worker. According to DBEDT’s projections, self-employed workers consist of about 20% of the total work force, but are growing to 25% in the next ten to twenty years. As such, we want to add this demand for housing into our projections. The following transforms those projections into annual job growth projections, and then summarizes it in a complete DBEDT projection table.
HOUSING DEMAND, FROM DBEDT’S 2035 JOB FORECAST, SELF-EMPLOYED
2007 2015 2020 2025 Annual Housing Demand (1.75 Jobs: 1 Home) 332 306 282 Self Employed Housing Demand (15% of total) 33 31 28 Total Annual Housing Demand 365 336 311
Finally, we want to take into consideration offshore demand, relative to housing demand. Studies have shown that this demand varies from a low of 15% on Oahu to a high of 60% on Maui. For Kauai and our purposes here, we use a very conservative factor of 20%. Thus, the total amount of housing demanded in the future should see an increase of another 20%. The following table shows this:
HOUSING DEMAND, FROM DBEDT’S 2035 JOB FORECAST PLUS OFFSHORE DEMAND
2007 2015 2020 2025 Total Annual Housing Demand 365 336 311 Offshore Buyer Housing Demand (20% of total) 66 61 56 Total Annual Housing Demand 431 397 367
Note that the average number of residential permits taken out in the last five years for the county is 373 units p.a., but the average over the last 2 years (projecting 2011 using YTD numbers through September, is 125 units, p.a.
KAPAA HOUSING MARKET STUDY Page 21
By Ricky Cassiday [email protected] 3/11/14
In sum, housing production in the past has not satisfied housing demand, as driven by job growth, leading to higher priced housing and overcrowding in existing housing. Looking ahead, this will only continue, as the level of permitting this year has been below what is would house just the recent growth in potential homebuyers.
KAPAA HOUSING MARKET STUDY Page 22
By Ricky Cassiday [email protected] 3/11/14
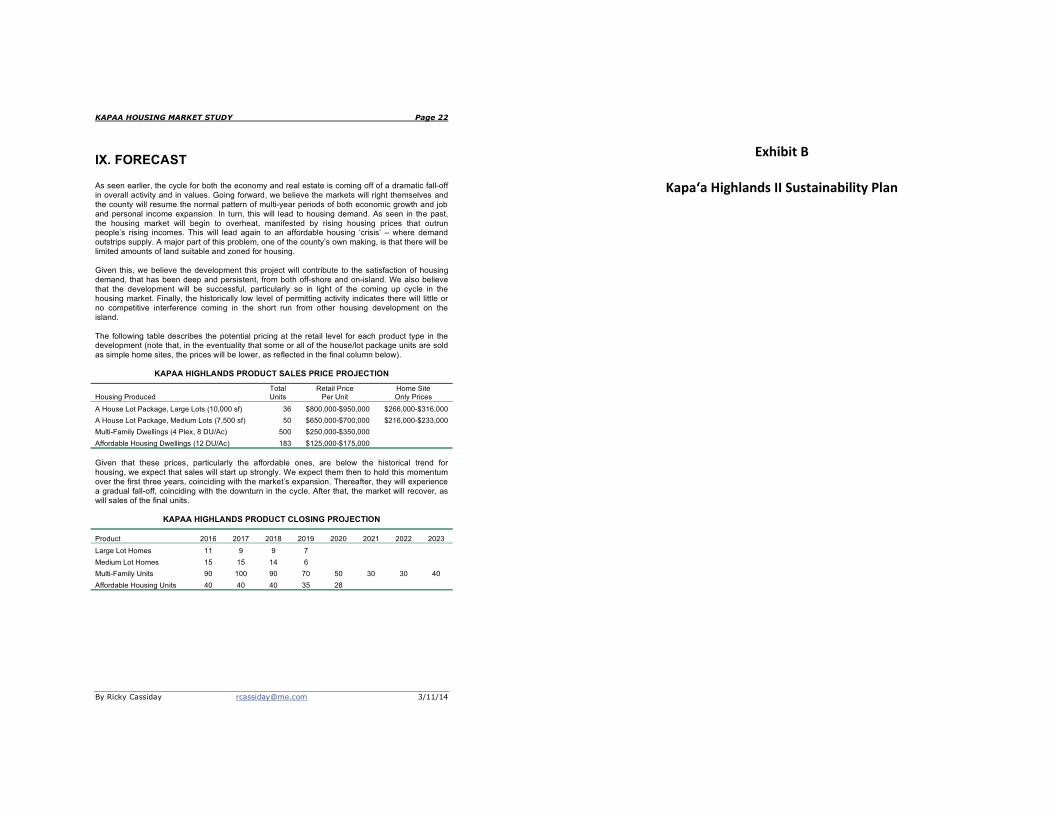
IX. FORECAST As seen earlier, the cycle for both the economy and real estate is coming off of a dramatic fall-off in overall activity and in values. Going forward, we believe the markets will right themselves and the county will resume the normal pattern of multi-year periods of both economic growth and job and personal income expansion. In turn, this will lead to housing demand. As seen in the past, the housing market will begin to overheat, manifested by rising housing prices that outrun people’s rising incomes. This will lead again to an affordable housing ‘crisis’ – where demand outstrips supply. A major part of this problem, one of the county’s own making, is that there will be limited amounts of land suitable and zoned for housing. Given this, we believe the development this project will contribute to the satisfaction of housing demand, that has been deep and persistent, from both off-shore and on-island. We also believe that the development will be successful, particularly so in light of the coming up cycle in the housing market. Finally, the historically low level of permitting activity indicates there will little or no competitive interference coming in the short run from other housing development on the island. The following table describes the potential pricing at the retail level for each product type in the development (note that, in the eventuality that some or all of the house/lot package units are sold as simple home sites, the prices will be lower, as reflected in the final column below).
KAPAA HIGHLANDS PRODUCT SALES PRICE PROJECTION
Housing Produced�Total Units�
Retail Price Per Unit�
Home Site Only Prices�
A House Lot Package, Large Lots (10,000 sf) 36 $800,000-$950,000� $266,000-$316,000�A House Lot Package, Medium Lots (7,500 sf) 50 $650,000-$700,000� $216,000-$233,000�Multi-Family Dwellings (4 Plex, 8 DU/Ac) 500 $250,000-$350,000� �
Affordable Housing Dwellings (12 DU/Ac) 183 $125,000-$175,000� � Given that these prices, particularly the affordable ones, are below the historical trend for housing, we expect that sales will start up strongly. We expect them then to hold this momentum over the first three years, coinciding with the market’s expansion. Thereafter, they will experience a gradual fall-off, coinciding with the downturn in the cycle. After that, the market will recover, as will sales of the final units.
KAPAA HIGHLANDS PRODUCT CLOSING PROJECTION
Product� 2016 2017 2018 2019 2020 2021 2022 2023 Large Lot Homes 11 9 9 7 Medium Lot Homes 15 15 14 6 Multi-Family Units 90 100 90 70 50 30 30 40 Affordable Housing Units 40 40 40 35 28
Exhibit B
Kapaʻa Highlands II Sustainability Plan

Kapa�a Highlands II Sustainability Plan
�
��
�Prepared�by:�
Ho�okuleana LLC … to take responsibility …
�
�
25�K�ne�ohe�Bay�Drive,�Suite�212�Kailua,�Hawai�i�96734�
(808)�254�2223�(O�ahu)�(808)�329�4447�(Big�Island)�
www.Hookuleana.com�[email protected]�
KKapa�a Highlands II Sustainability Plan
Table of Contents
Table of Contents
Chapter Page Number
1.� Introduction 1
2.� Sustainability Programs and Plans 10
3.� Natural and Cultural Resources 17
4.� Consistency with Regional Land Use Planning 18
5.� Sustainable Design Features 20
6.� Transportation 28
7.� Economic Opportunities 30
8.� Open Space and Parks 31
9.� Water Management 32
10.�Energy Management 35
11.�Health and Active Lifestyles 37
12.�Education 39
13.�Housing 40
14.�Social Sustainability 43
Kapa�a Highlands II Sustainability Plan�
Chapter 1; Introduction Page 1
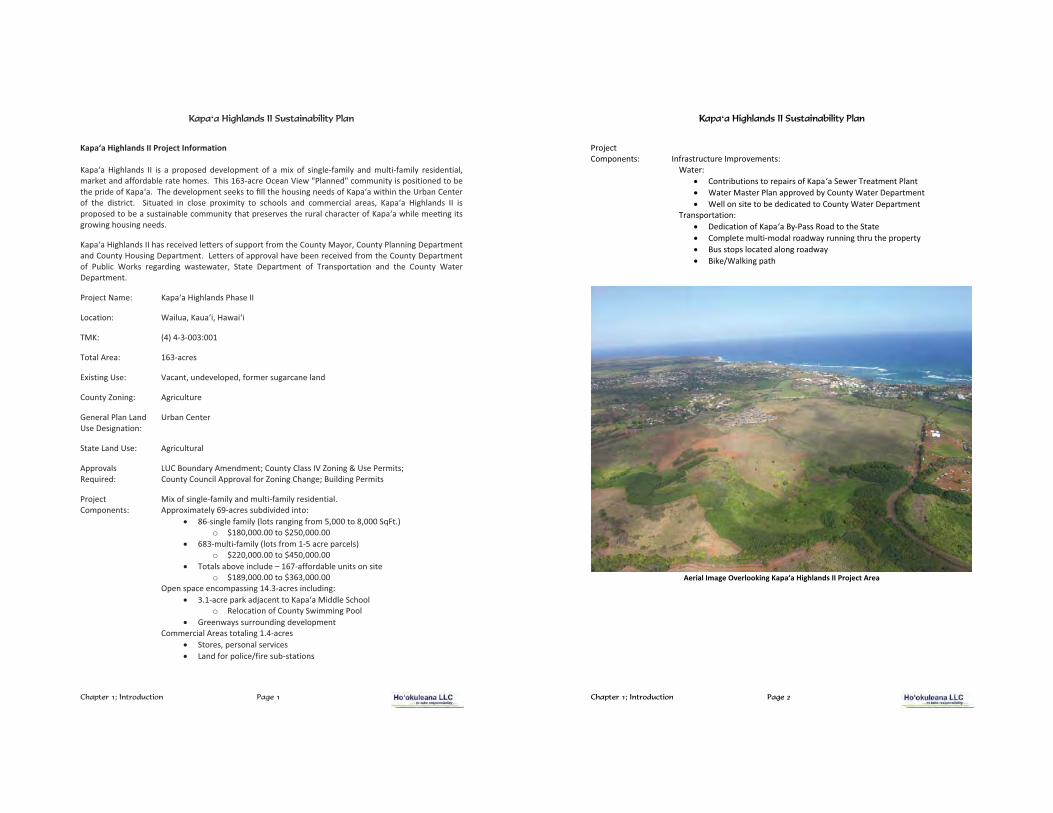
Kapa�a�Highlands�II�Project�Information��Kapa�a� Highlands� II� is� a� proposed� development� of� a� mix� of� single�family� and� multi�family� residential,�market�and�affordable�rate�homes.��This�163�acre�Ocean�View�"Planned"�community�is�positioned�to�be�the�pride�of�Kapa�a.��The�development�seeks�to��ll�the�housing�needs�of�Kapa�a�within�the�Urban�Center�of� the� district.� � Situated� in� close� proximity� to� schools� and� commercial� areas,� Kapa�a� Highlands� II� is�proposed�to�be�a�sustainable�community�that�preserves�the�rural�character�of�Kapa�a�while�mee�ng�its�growing�housing�needs.��Kapa�a�Highlands�II�has�received�le�ers�of�support�from�the�County�Mayor,�County�Planning�Department�and�County�Housing�Department.��Letters�of�approval�have�been�received�from�the�County�Department�of� Public� Works� regarding� wastewater,� State� Department� of� Transportation� and� the� County� Water�Department.��Project�Name:� Kapa�a�Highlands�Phase�II���Location:��� Wailua,�Kaua�i,�Hawai�i���TMK:� (4)�4�3�003:001���Total�Area:�� 163�acres���Existing�Use:�� Vacant,�undeveloped,�former�sugarcane�land�
�County�Zoning:�� Agriculture���General�Plan�Land�� Urban�Center�Use�Designation:� ���State�Land�Use:�� Agricultural���Approvals�� LUC�Boundary�Amendment;�County�Class�IV�Zoning�&�Use�Permits;��Required:�� County�Council�Approval�for�Zoning�Change;�Building�Permits��Project� Mix�of�single�family�and�multi�family�residential.�Components:� Approximately�69�acres�subdivided�into:��
� 86�single�family�(lots�ranging�from�5,000�to�8,000�SqFt.)��o $180,000.00�to�$250,000.00�
� 683�multi�family�(lots�from�1�5�acre�parcels)��o $220,000.00�to�$450,000.00�
� Totals�above�include�–�167�affordable�units�on�site�o $189,000.00�to�$363,000.00�
� Open�space�encompassing�14.3�acres�including:�� 3.1�acre�park�adjacent�to�Kapa�a�Middle�School�
o Relocation�of�County�Swimming�Pool�� Greenways�surrounding�development�
� Commercial�Areas�totaling�1.4�acres�� Stores,�personal�services�� Land�for�police/fire�sub�stations�
�
KKapa�a Highlands II Sustainability Plan
Chapter 1; Introduction Page 2
�� �� ������ ���� ���������� ������ � ���� ��� �
� ���������������� ���������������� ! �# ��� ���%��� � ��� �'��� �%�������� *��+������+���� �- ���� �� � � %%������� ����� �* *���� *���������+���� �- ���� ��
#������������ � - *������������������<+-����>��*�����? ����� � ����% � ���%��-��*�%���*!�+������@��?���? ���� �+ � <���������%���� * �%��@���*!�+ � <�J Q��%J��@����?�
Aerial Image Overlooking Kapa‘a Highlands II Project Area

KKapa�a Highlands II Sustainability Plan
Chapter 1; Introduction Page 3
KKapa�a Highlands II Sustainability Plan
Chapter 1; Introduction Page 4
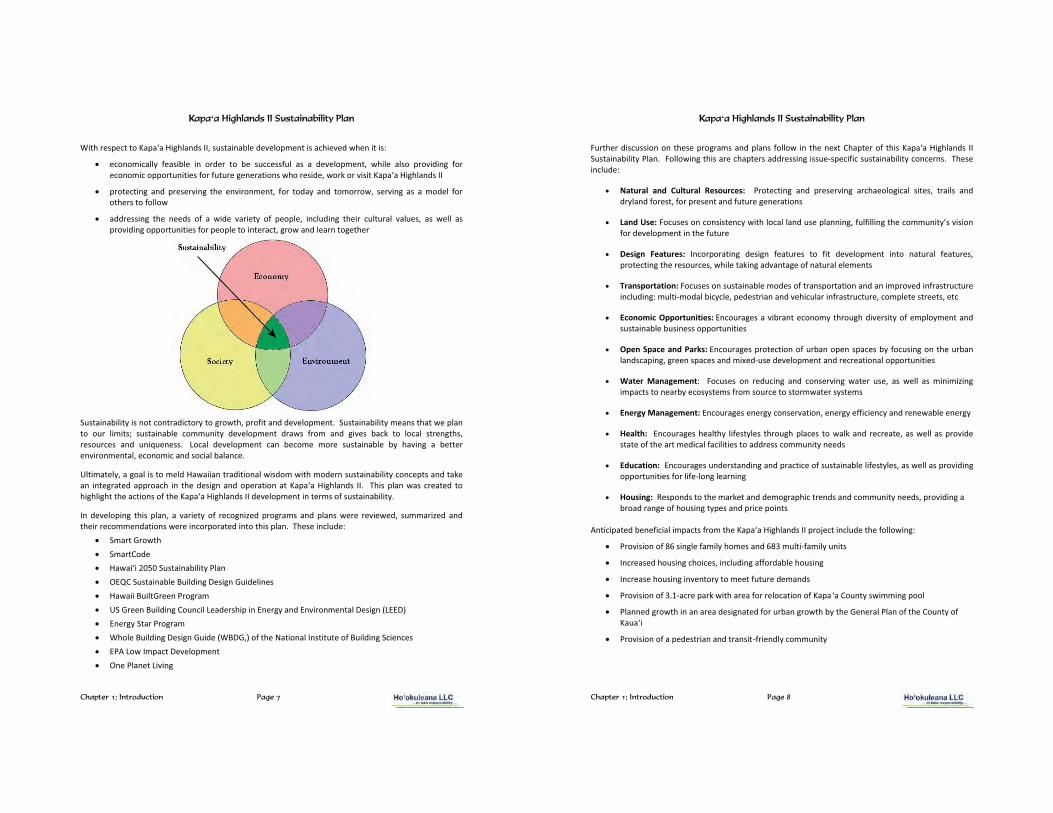
Kapaʻa Highlands II Sustainability Plan
#?��� Kapa��� X�@?%��*�� �� ����������%��+� %��� ��� �� ���� ? ���� � � �� ��� @��%�Y ���� @� �� ��*� ������������� *� ��� �������@� ������ ���%� [��%��+Y� �������� �� �@�?� ��*� �����%� � � ���� !��?��� �? � Kapa���X�@?%��*���� ��� ��Y����! %%�����? ����* ���������+\�
#?��� %��� � � �� ��� �� ��*���� @��*��@� Kapa��� X�@?%��*�� �� ��!�*� �� �� � ���������% � ���� Y� !��?����% � ������������������ �?��@?������� ? ���� Y����%���� ����J ?�%* ���� ��\
< �� �*��������@��? �@%���%����� ]�����^����������%��+Y_�! � ]�%� ��? �X�!�������� !����^�� ���� _�– �� �����? �� ��^��������
��%��+\_
�������*������%�X�!���������� ]�Y����� ���*���%�� �� ��� ���*��? ���� `��? �������*��������� �! ���? � �!�\� � #? � ! �%�?� ��*� %����������� ��� �? � %��*� ��*� �� ��� ���� �� @�� � ���?� ��� ��*� �?�� *� �? �X�!������!�%*�� !\�����X�!��������%�� Y������%���*���%���%� ���� ��� ��� ���*��? ���� \�� z%%� �������� �? ������%� ������ ��Y� �����? ��J� ����*����������� �J�Y� ��� �? �!�� *���%% +����*�%�����%����Y���*�����? ��?� %�� ���*��� ���* ��?��� �� %� � *����� � ���*�� �������X�!������@�*����*�* ��� �\��{'�%+| ʻĀina – That Which Sustains the People {���� ]�Y�? Y������%+�����* *�����!����@������ ���'�%+| #? ������Y��?���!?��?�� *�Y������? ����*����������%�� {���}�@%��?� � *�������~%��*~|Y�����{!�� |Y����{�� ��|Y���*�����{�J+|�! ��? �����*����� ���%�� ���*��? ����� �����? ��������%� %������?���� �! ��� ��% ���*��? �� ������\� �X�!������mo‘oleloY�����*������Y� ]� ����? ������?� ���� %��� �! ���? �X�!������� ��% ���*��? � ��?�����*��? �\ �����+�*�������������X�!������%��*�- �����Y��?�� !?��?�����������? �� ��% �- ��*������%�� ������%�� Y��������%��� �������� � ��� �� �%+� *������� ��*������%� X�!������ %��*� � ��Y� ��� �? � � ��� * ������� � ���������� �J��!% *@ �����? � ������ ����������? �\������? �X�!���������*Y��%%���� ������������%���*���%���%� ���� ��� ���� %�� *\��z%%�� ���%���%%+���@��������\ X�!��������%�� � ��%� ������*��? ���%� ����^�%�?�������_���%�� �����? �%��*\��#?���%�� ����������������@�� ���� ��Y������� ��%��@���������! ��? ������\����������* �-� �� *�������� �������? �! %%� ��@�����? � ��?Y�!?��?�������������%�J ����� ��\ #? �X�!���������� ��������%����������{%�� �%%+Y�����@������%����@����?����+�!��?��? �%��*Y|�* ���*������ ������Y� ���������% � �� � ��*� �?��� � ��� ��� �? � %���%Y� @����%� ��*� @%���%� ������ ��\� � <+�����%+���J��@��� ���*� �� ����@��? �%��*Y����!�%%���������%�� \��#?�������@?���!�*� %������?���?���� ��?��� *�����?�����*�����+ ��Y����� ��? ��%+� ��������%%�! *��? ����������? ��?� �����X�!���\ #? ���*������%� %��*��� � ����? �X�!������ ��%��*�� ��%� *������?�����@���%��������� �����������% ���������@���%�� �����*������z-� {���?Y�����|\� � �����%�������� [�� *���� !� ������� %��*��� \� � ��� ���!�* %+�� %� � *����������%��Y��? ��% �����? ���%��*����X�!����Y�!����? �������% ����� �� ��? ����� ���X�!������%��*�*�������Y�����*��@�������?� �%+�����@ � ����+�� �Y�� �%+�����+ ����@�\

KKapa�a Highlands II Sustainability Plan
Chapter 1; Introduction Page 5
#?��� !�� �? � �� � ���� %��*� �� � �+�� �Y� !?��?� ������� *� ��� � ����%� %��*���� � � @� ���� ���� �? ���������������? �� �-�?� ��� ��� ������ ��Y���*�������? ��� ������* �������� �������%*�����*�����? �!�� �{���� %%��z�����z�����|\�� ���?��* *�����+ ������� Y�����? �* ��?�����%%����� {J��@����[� ��|Y��? �� !������?� -*���* *��? �%��*Y�@����@������%����������?�����? ������� ��?� ��\��#? ��������� ��% �� � ��!� *����% *�%��*\ ����? �� ���� � ���Y��? �!�*���� �{���� ��%��������� �����*|���*�� ����(p�@|�� ������� *\��#? �� ���� !��� �� ��� *� !��* �� ���@ � ��� �� ��@� ? �*\� � #? � � ���� � �%���� � � *� ��� ��* � ��J �� ��*�* ����������%�� �������� ��@������? ��@���%���%�@�*��������*���?�@?��?� ��{������ �|Y�!?��!����? �@�*��� � � ������ \� }��?� �� � ���� ��� ���� !��� �% *� �+� �� %�! � �?� �Y� �� ����� ���\� � X � ��� ���� ������� *� �� ? �*���Y� ��������\��#? ��������� � *����@ � �%�����@ � �������% �����? ��� ��������� � ��������� ���� ��+�� �\��X ��������!��������� *��+��� ���%����Y��� ��\����� ]���% Y��? � �������!��� �������% �����? �� �?�!�� ��%�!���*���@�������+�� ��{��� ?�� ?����?��%�Y�����|\ '���@ ��% ���� %�����%��*�!��%*��+����%%+������ � {��%��*|�������� {��!�*������ ��|���*�!��%*�� � ��J *� !��?� ���� !�%%� �%�@�� ���\� � # ������ ��%����� *� ���%% � ����� ��� ����%+� �����������Y� �������%+��? �� *������?� �����*�����* ������ �\�� ��� { ���������Q��?��������|�! ���� � *� ��� ������ ���� ���� � ��*� %��*� ����@ � ��� ����@���? ��?��@�\��z�� ������ ���� ��!����� *���� ��* ��+���*� �� *������ ��%�������J��@� ��������%��+������ !�*� �? � ������ ��� ��*� ����%+� �? � � *�� ��� ����\� � #? � �����%� ������ � ����� *� %��*�����@ � ��\ Sustainability – United Nations Context �������Y��? ����� *���������� � ��+�� � �%������ * ��! @������ �'����� ����X�% ��<��*�%��*���� �?��� �� ��%*� ����������� ��� }������ ��� ��*� - � %��� ��\� � #? � > ���� ��� �? � <��*�%��*�����������Y��������������� Y�!����������� * ����? �� � �%�z�� ��%+�������z�� ]������� �����A/42/427 - - � %��� �����*���� �������%���-�� �������}������ ��Y ������� �?��� � �Y� ^#�!�*�� ���������% � - � %��� ��_� ��� �? � <��*�%��*� ^��� ������� ���� _� * ��� ��^���������% �* � %��� ��_����
���������% � * � %��� ��� ��� * � %��� ��� �?��� � ��� �? � � *�� ��� �? � � � ��� !��?��������������@��? ����%��+�������� �@ � ����������� ���? ���!��� *�\� � ������������!��?�������!��J +����� �����
� �? � ���� ��� ��� �� *��Y� ��� ������%�� �? � �� ����%� � *�� ��� �? � !�%*��� ���Y� ��� !?��?��� �*��@������+��?��%*�� �@�� �`���*�
� �? � �* �� ��� %����������� ����� *� �+� �? � ���� � ��� � �?��%�@+� ��*� �����%��@���������� ��� �? � ������ ��������%��+����� ��� � �����*����� �� *�\�
��� �������* ���� �� Y� �? ����� @+� ��� ���������% �* � %��� ���������������� �?����+�����@�?������ ��@����*�� �! ��?������+���*����� \��
KKapa�a Highlands II Sustainability Plan
Chapter 1; Introduction Page 6
Sustainability in Hawai‘i (Hawaiʻi 2050) #? ���%%�!��@�* ��������Y����������*�@��*��@�������% ��� ��������� *�����? �X�!�� �������\ Definition: z�X�!������?�����?� � ���? ���%%�!��@�
� > �� �����? ���%�� Y��?���� Y�� ���+���*�?����+����������� �����%��*���������� �
� ���J ������%��� �� �! �� �������Y������%���*���������+Y���*� ������ ���%������� �
� ' ����? �� *������? �� � ���!��?��������������@��? ����%��+�������� �@ � ����������� ���? ���!��� *�
Vision: �����@ �������%+ ��*�!��?�������!��� ���� ��� ���-��-���*� ����%%� ��*���*��%����*��@����������\� �� �% ��� ������ �? � ���� �� ��*� ��%� �� ��� �� ���������% � X�!����\� � z�� �� ��%�Y� ��� @��%�� ��� ������������ ��+Y� �����%� ��*� ��������+� ! %%-� ��@� ��*� ������ ���%� �� !�*�?��� � � ��� ��%��� � ��*���?� � *\� Hawai‘i 2050 Guiding Principles of Sustainability
� <�%��� � �������Y������%Y���������+���*� ������ ���%������� �\
� R �� �����*�%�� �!��?����? ������%� ���� ����*�%��������������%��*�\
� z�?� � ���*�� ���� *���* *+������ �����+\
� X�����? �?������%�� \
� '�J �* ����������� *����� ���@��? �� � ���� *��!��?��������������@��? �� *��������� �@ � ������\
� �����% ������? ��?��������+�� ��@��* ���� ���� �����@ � ���* �������\
� }� +�� �— ��*���*��%�Y�����%� �Y���������� �Y������ �� ����*�@�� �� ���— ?����� ��������%��+������?� ���@������������% �X�!����\
����������%��+����X�!������ ������?� ���@���[��%��+����%�� ��?�����?� � ���? ���%%�!��@�@��%��
� ��� ��?���� �� �� ��� ��� �? � ��%�� Y� �?���� Y� � ���+� ��*� ?����+� ��� ��� ���� ��� ��%��* ��������� �\
� ��� ���J �� �� ��%��� � � �! �� �������� ���� ��+Y� �����%� ��*� ��������+� ! %%-� ��@Y� ��* ������ ���%��� !�*�?��\
� ��� � ��� �? � � *�� ��� �? � � � ��� ��������+� !��?���� ����������@� �? � ���%��+� ��� ���� @ � ����������� ���? ���!��� *�\
#+����%%+Y� ~����������%��+~� ��� * ���� *� ��� �� �? -�? � *� � ��� *��@��� {��� *� � %�!Y|� ?�@?%�@?���@� �? � �����+Y� ������ �����*����� �+\��#? ���?� � � ���������������% �* � %��� ��� [�� ����� @����������? � ������� ��������%%�% � %�\��
KKapa�a Highlands II Sustainability Plan
Chapter 1; Introduction Page 7
���?� �� ������Kapa���X�@?%��*����Y����������% �* � %��� ��������?� � *�!? ��������
� ��������%%+� � ����% � ��� �* � ��� � � ���� ����%� ��� �� * � %��� ��Y !?�% � �%��� ����*��@� ��� ������������������ ��������� �@ � ������ !?�� ��* Y�!�J���������Kapa���X�@?%��*����
� ��� ����@� ��*� � � ���@� �? � ������ ��Y� ��� ��*�+� ��*� �����!Y� � ���@� ��� �� ��* %� �����? �������%%�!
� �** ����@� �? � � *�� ��� �� !�* � ��� �+� ��� � ��% Y� ���%�*��@� �? �� ��%���%� ��%� �Y� ��� ! %%� �������*��@����������� ������ ��% ������� ���Y�@�!���*�% �����@ �? �
����������%��+�������������*����+����@�!�?Y���������*�* � %��� ��\� ����������%��+�� �����?���! ��%������ ��� %�����`� ���������% � ��������+� * � %��� ��� *�!�� ���� ��*� @�� �� ���J� ��� %���%� �� �@�?�Y� ���� �� ��*� ���[� � ��\� ����%� * � %��� ��� ���� � ��� � �� � ���������% � �+� ?����@� �� � �� � ������ ���%Y� ����������*������%���%��� \� �%����� %+Y���@��%�������� %*�X�!��������*������%�!��*���!��?���* ������������%��+����� ������*���J ���� ��� @�� *� ������?� ��� �? � * ��@�� ��*� �� ������ ��� Kapa��� X�@?%��*�� ��\ #?��� �%��� !��� � �� *� ���?�@?%�@?���? �������������? �Kapa���X�@?%��*���� * � %��� ������� ����������������%��+\�� ��� * � %����@� �?��� �%��Y� �� ��� �+� ��� ��@��� *� ��@���� ��*� �%���� ! � �� ! *Y� ������� *� ��*��? �� ���� �*�������! ��������� *�������?����%��\��#? � ����%�* �
� �������!�? � ������* � X�!��������������������%��+�%�� � �}������������% �<��%*��@�- ��@�����* %�� � � X�!����<��%�� ���@�� � ���� ��<��%*��@�������%�� �* �?������}� @+���*�}������ ���%�- ��@��{�}}-) � }� @+������@�� � �?�% �<��%*��@�- ��@�����* �{�<-�Y|�����? ��������%��������� ����<��%*��@���� �� � � }z���!��������- � %��� �� � �� �%�� �������@
KKapa�a Highlands II Sustainability Plan
Chapter 1; Introduction Page 8
���? �*��������������? � ���@������*��%���� ��%%�!� ��� �? �� ]���?��� ���� �?���Kapa���X�@?%��*�� �� ����������%��+�%��\ ��%%�!��@��?���� ��?��� ���** ����@����� -�� ����������������%��+����� ��\ #? � ����%�* �
� Natural and Cultural Resources: �� ����@� ��*� � � ���@� ��?� �%�@���%� ��� �Y� ���%�� ��*�*+%��*��� ��Y����� � �����*����� �@ � ������
� Land Use: ����� ������������ ��+�!��?�%���%�%��*��� ��%�����@Y���%��%%��@��? ���������+�������������* � %��� �������? �����
� Design Features: ����������@� * ��@�� � ��� �� ��� ���� * � %��� ��� ����� �����%� � ��� �Y���� ����@��? � ���� �Y�!?�% ���J��@��*�����@ ���������%� % � ����
� Transportation: ����� ��������������% ���* ��������������������*��������� *����������� ����%�*��@����%��-��*�%����+�% Y�� * ��������*�� ?���%������������ Y ����% � ��� ��Y� ��
� Economic Opportunities: }�����@ ����������� �����+��?��@?�*�� ���+���� ��%�+� �����*����������% ������ �� ���������� �
� Open Space and Parks: }�����@ ����� ����� �� ������� ������ ���+��������@�����? ������%��*������@Y�@ ������ ����*���] *-�� �* � %��� �� ��*� � ������%����������� �
� Water Management� ����� �� ��� *����@� ��*� ���� ���@ !�� � �� Y� ��� ! %%� ��� ���������@����������� � ��+� ���+�� �� �������� ��� ����!�� �+�� ��
� Energy Management: }�����@ �� � @+����� ������Y� � @+� ����� ��+���*� � !��% � � @+
� Health: }�����@ ��? �%�?+� %�� ��+% �� �?��@?��%�� �� ���!�%J���*� � �� Y����! %%� �������* ����� �����? ����� *���%�����%��� ������** �����������+�� *�
� Education: }�����@ ����* ����*��@���*������� �������������% �%�� ��+% �Y����! %%��������*��@����������� �����%�� -%��@�% ����@�
� Housing: > ����*������? ���J ����*�* ��@��?���� �*����*���������+�� *�Y�����*��@������*���@ ����?�����@ �+� ����*���� �������
z�������� *�� � �����%��������������? �Kapa���X�@?%��*���� ��� �� ���%�* ��? ���%%�!��@�
� �����������������@% �����%+�?�� � ��*�������%��-����%+������
� ��� �� *�?�����@��?��� �Y����%�*��@�����*��% �?�����@
� ��� �� �?�����@���� ���+����� ������ �* ���*�
� ������������\�-�� ���J�!��?�� ����� %�����������������������+��!�����@����%
� %��� * @�!�?�������� ��* ��@��� *���������@�!�?��+��? �� � �% %�� ����? ������+����������
� �������������� * ��������*���������� �*%+���������+

KKapa�a Highlands II Sustainability Plan
Chapter 1; Introduction Page 9
Kapa���X�@?%��*�����!�%%�� ������������% ���������+���*�!�%%��������� �? ���%%�!��@� Sustainability Programs and Plans: Kapa���X�@?%��*��!�%%��������� ��? ��� �������% ������? ������������������%��+���@������*��%���\ Natural and Cultural Resources: �� ��?� �%�@���%���� ��� �J��!����� ]��������? ���� �+\���?��%*���+���?� �%�@���%%+� ��@�������� ��������Y� ��� �Y� �� ��? � ��*������� � � ����� *� *���@� �����������Y�Kapa���X�@?%��*��������������� *��������������%���� �!��?����� �%�!����*��% �\ Land Use: Kapa��� X�@?%��*�� ��� ������� �� !��?� %���%� %��*� �� �%���� ���%�*��@� �? � � �%� %��� ��� �? �����+ ���������Y��? ��������#�!��- � %��� ���%�����*��? �������-���%���<�������������+�%��\ Design Features: Kapa��� X�@?%��*�� ��� !�%%� ���%�* � ���������% � * ��@�� � ��� �� ���%�*��@� ���� @� �� ��� *�� ���%��? ���@�����?��@?�����Y�!�%%����*�!��*�!�`�����@���� ��%�����@���*�%��*������@��������� ������%�� ���%�����`�*�+%�@?���@�* ��@�` ��*� � @+� ����� ���%�@?����]�� �\� Transportation: Kapa��� X�@?%��*�� ��� !�%%� �������� � ���� ������ ����� ���� ��*� �+�� �`� ��%��-��*�%���� ���� �� *���*�`���*�����% � ��� ���* ��@�\ Economic Opportunities: Kapa���X�@?%��*������� ���!��� ���������� ���%��� ��!?��?�!�%%�����* ������ �+� ��� ���� ���������� �` ������������ ��*� �����������- %�� *� ��%�+� ��� !�%%� ?�� *� ���� � �����%������������? �%�c�%� �����+ *���@������������\ Open Space and Parks: Kapa��� X�@?%��*�� �� ����� � �� �� ���� � ��*� �� �� @ �!�+� � ��� ����������@� ��\�-�� �� ���%�*��@� �� �\�-�� � ��J� ��� �? � ����� *� %�������� ��� �? � ������� �����+��!�����@����%\ Water Management�� Kapa��� X�@?%��*�� �� !�%%� �����%%� !�� � ����� ��� ��]�� �Y ���%���� � ��*� ?�@?� ����� ��+����% ������ *�� ���*���!�� ��� \�� Energy Management: Kapa���X�@?%��*���� !�%%��������� � � @+����� ���������*� ����� ��+�� ��� �`���%�� � @+����!�� �? ����@`� �����@ ��?�����%������+�� �����*���? � � !��% � � @+����� �\ Health: Kapa���X�@?%��*�� ���� %�+������*�* ��@� !�%%�� �� �������������+� ������?� ��* ������*��? ���������+� ��� ?�� � �� ������� � �� ��� ��� �? �� ? �%�?� �?��@?� !�%J��% � ��*� ��J��% � ��������������������\ Education: Kapa���X�@?%��*���� !�%%����*���� �!��?��? �-�}���� ��� ��?����? �����%��+���� ��� �����%��+��� �** �� *\������**�����Y ���\�-�� ���J�!�%%�� ����%�* *�����? ��%�����* �? �������������+��!�����@����%�!�%%�� � %���� *�!��?����? ��J\ Housing: Kapa���X�@?%��*���� ������������? �������������+�z���*��% �X�����@��*����� ���\���� ��*���� ������� �+����?�����@��+� ���?�� !�%%��** ����������������? �?�����@�� *������? ���%��*\ Social: Kapa��� X�@?%��*�� ��� ����� �� �����%� ����������%��+� �?��@?� �����%%+-����� *� �������� �?�� !�%%��������[��%��+����%�� Y�� �� �����%�� ��*���������+�%�����%��+�����%%� ��* ������*��? ���������+\
KKapa�a Highlands II Sustainability Plan
Chapter 2; Sustainability Programs and Plans Page 10
�
Sustainability Programs and Plans In developing this Kapa��� X�@?%��*�� �� Sustainability Plan, a variety of recognized sustainability programs and plans were reviewed, summarized and incorporated into this plan. In part, the recommendations from these programs and plans serve as guides to the sustainability actions noted in this Plan. These include:
� Smart Growth
� SmartCode
� X�!��������������������%��+�%�� {X�!���������|
� OEQC Sustainable Building Design Guidelines
� X�!����<��%�� ���@��
� US Green Build��@�������%�� �* �?������}� @+���*�}������ ���%�- ��@��{�}}-|
� ENERGY STAR Program
� �?�% �<��%*��@�- ��@�����* �{�<-�Y|�����? ��������%��������� ����<��%*��@���� �� �
� EPA Low Impact Development
� One Planet Living
� Complete Streets In this chapter, these various programs and plans are summarized. As you will see, there are several consistent principles and themes that run through the various programs and plans. While some are broad-based and include several of these, others are focused on single issues. Following are some of the consistent messages found in these programs and plans:
� Soft touch on the land
� Respect and protection of natural and cultural resources
� �� ���������%� % � ����{�?�*��@Y�� ���%�����Y�%�@?���@Y� ��|
� Diversity of land uses, housing types, prices
� Live, work, play, shop and learn
� Walking, bicycle and transit transportation focused
� Reuse and minimization of waste
� Renewable and efficient electric
� People and community focused Kapa���X�@?%��*���� will implement, to the extent feasible and practicable, measures to promote energy conservation, sustainable design, environmental stewardship and protection of the natural and cultural resources into the project. These actions are in part, based on the recommendations noted in the following sustainability programs and plans.

KKapa�a Highlands II Sustainability Plan
Chapter 2; Sustainability Programs and Plans Page 11
Smart Growth Network
In 1996, the U.S. Environmental Protection Agency joined with several non-profit and government organizations to form the Smart Growth Network. The Network was formed in response to increasing community concerns about the need for new ways to grow that boost the economy, protect the environment, and enhance community vitality.
Smart growth refers to the management of growth to make it possible “for communities to grow in ways that support economic development and jobs; create strong neighborhood with a range of housing, commercial, and transportation options; and achieve healthy communities that provide families with a �% ��� ������ ��\_��{�������!�?�� �!�J| #? �� ������� �� *�������% ���?���define Smart Growth
1. Mix land uses �\ Take advantage of compact building design 3. Create a range of housing opportunities and choices 4. Create walkable neighborhoods �\ Foster distinctive, attractive communities with a strong sense of place 6. Preserve open space, farmland, natural beauty, and critical environmental areas 7. Strengthen and direct development towards existing communities 8. Provide a variety of transportation choices 9. Make development decisions predictable, fair, and cost effective ��\ Encourage community and stakeholder collaboration in development decisions
SmartCode
The SmartCode is a form-based code that incorporates Smart Growth and New Urbanism principles. It is a unified development ordinance, addressing
development at all scales of design, from regional planning on down to the building signage. The SmartCode is also a transect-based code. A “transect” is usually seen as a continuous cross-section of natural habitats for plants and animals, ranging from shorelines to wetlands to uplands.
It is based on the rural-to-urban transect rather than separated-use zoning, thereby able to integrate a full range of environmental techniques.
The SmartCode is a model transect-based planning and zoning document based on environmental analysis. It addresses all scales of planning, from the region to the community to the block and building. The SmartCode is distributed by the nonprofit Center for Applied Transect Studies
{�z#�\|��
Kapa���X�@?%��*���� has incorporated the SmartCode principles and transects into its layout and design.
KKapa�a Highlands II Sustainability Plan
Chapter 2; Sustainability Programs and Plans Page 12
Hawai‘i 2050 Sustainability Plan (Hawai‘i 2050) #? � X�!����� ���� � %��Y� ���*� *� ��� �?��� � ���Y� X�!����� > ��� *������� �� {X>�|Y� � � �� ��� �� @��* � �� goals, objectives, policies, and priorities for the State. #? � X�!���� ���� � %�����@� z��� {X>�� ���|� ���� �� �?��� �? � ���� � �?�%%����� � ��� ����� � �? � [��%��+� ��� %�� � ��� X�!������ � � ��� ��*� ���� �population through the pursuit of desirable courses of action in six major areas of statewide concern which merit priority attention: economic development, population growth and land resource
management, affordable housing, crime and criminal justice, quality education and principles of sustainability. �������Y��? �% @��%��� ����?��� *��? �� ���������������J���� ���� �� !��? �X�!�������� ��%�����*��? ����� ��� �%�����@� ��� ��� ��*� ��� � �� � �? � X�!����� ����� %��\� � #? � � ������ ��� �? � X�!���� �����sustainability plan raises questions about the long-term limits of growth in the State and highlights the � *����� @����%�����@���*������@�������� �X�!������ ���� \� �#?��Y� �? ���� ���� ����� �? �X�!���������sustainability plan focuses on the revitalization of the State's long-term planning process to better guide t? ����� �* � %��� ������X�!���\� #? �%������ ��* ���% *����� @�������������*���*����������� � ������@��* ���!�*��� ���@��? �%���������������%��+�@��%�\��#? �%����������� �����@��% ���@ �����*�� ��?��J�\������+����������������Y�to be addressed immediately, include:
1. ��� �� �����*��% �?�����@����������� �����?��� ?�%*����������������� *��������� \ �\ Strengthen public education. 3. Reduce reliance on fossil (carbon-��� *|��� %�\ 4. Increase recycling, reuse and waste reduction strategies. �\ Develop a more diverse and resilient economy. 6. Create a sustainability ethic. 7. Increase production and consumption of local foods and products, particularly agriculture. 8. Provide access to long-term care and elderly housing. 9. Preserve and perpetuate our Kanaka Maoli and island cultural values.
��� ����Y� �? � ���� � ����%��? *� ����������%��+� ��� �� ���� � �����+� �+� ����������@� �? � X�!���� ���������������%��+� �%��� * ���������Y� @��*��@� ������% �� ��*� @��%�Y� ����� �?��� � ���Y� X�!���� > ��� *� ������ ��{�? �X�!�������� ��%�����@����|\ "Sustainability" definition was added to the Planning Act as: “achieving the following:
{�| Respect of the culture, character, beauty, and history of the State's island communities; {�| Striking a balance between economic, social, community, and environmental priorities; and {�| Meeting the needs of the present without compromising the ability of future generations to
meet their own needs." The Act also added “principles of sustainability” as one of the six major areas of statewide concern which merit priority attention, economic development, population growth and land resource management, affordable housing, crime and criminal justice, quality education and principles of sustainability.”

KKapa�a Highlands II Sustainability Plan
Chapter 2; Sustainability Programs and Plans Page 13
OEQC’s Sustainable Building Design Guidelines The Environmental Cou���%Y� ��� ���� ��� �� ^%��� ��� �? �J%���Y_� �*��� *����* %�� �� ��� ���������% � <��%*��@� - ��@�� ��� X�!�� �� {����� ���Y� ����\|��These guidelines do not constitute rules or law. A sustainable building is built to minimize energy use, expense, waste and impact on the environment. It seeks to improve the region's sustainability by meeting �? �� *�����X�!�� ���� ��* ������*�����������*�+�!��?��������������@�the needs of future generations. Compared to conventional projects, a resource-efficient building project will:
1. Use less energy for operation and maintenance �\ Contain less embodied energy (i.e. locally produced building products often contain less
embodied energy than imported products because they require less energy-consuming ������������\|�
3. Protect the environment by preserving/conserving water and other natural resources and by minimizing impact on the site and ecosystems
4. Minimize health risks to those who construct, maintain and occupy the building �\ Minimize construction waste 6. Recycle and reuse generated construction wastes 7. Use resource-efficient building materials (e.g. materials with recycled content and low
embodied energy, and materials that are recyclable, renewable, environmentally benign, non-��]��Y�%�!�����{��%���% ��@������������*|� ��tting, durable, and that give high life cycle value ����? �����\|�
8. ���* ��? �?�@? ���[��%��+���*�����������%�������� ����� �{����*��% |��������*�%�� ��+�% ������\� In the design and construction of Kapa���X�@?%��*����, Three Stooges, LLC will seek to implement feasible measures to conform to these general guidelines.
Hawaii BuiltGreen Program #? �X�!����<��%�� ���@������������ !�* ���@���to “incentivize” the designing and building of energy ��*� ���� � ����� ��� ?�� �� ��� X�!���\ Originally * � %�� *� ��� ����� �+� �� ���%��Q����� � ���� �?���between the State Dept. of Business, Economic
Devel��� ��� ¡� #������ {-<}-#|Y� ��-�} and five other partners. Now promoted by the State, BIA, X�!�������%��+�companies and other organizations. X�!����� <��ltGreen is a self-certification program administered by the Building Industry Association of X�!����Y� !?��?� ��� �� ��� ������%� ��* � �@���������� ����%��� *� !��?� �? � �������%� z����������� ��� X�� �Builders. This is a local initiative based on homegrown knowledge of professionals familiar with the ���[� ����*����������X�!���\� #? �X�!����<�iltGreen program focuses on design choices through:
� Protecting Site Features and Functions � Energy Performance and Comfort � X �%�?���*���*���z�����%��+ � Durability and Materials Conservation � Environmentally-�� �*%+�X�� ��� ������
KKapa�a Highlands II Sustainability Plan
Chapter 2; Sustainability Programs and Plans Page 14
Leadership in Energy and Environmental Design (LEED) US Green Building Council
#? � ��� � �� <��%*��@� ������%��� Leadership in Energy and Environmental Design (�}}-|���@����������%����+�@ �����lding certification system, providing third-party verification that a building or community was designed and built using strategies aimed at improving performance across all the metrics that matter most: energy savings, water efficiency, CO�
emissions reduction, improved indoor environmental quality, and stewardship of resources and sensitivity to their impacts.
Specific LEED programs include: � X�� � � Neighborhood Development � New Commercial Construction and Major Renovation projects � Existing Building Operations and Maintenance � Commercial Interiors projects
LEED for Homes is a voluntary rating system that promotes the design and construction of high performance "green" homes. A green home uses less energy, water and natural resources; creates less waste; and is healthier and more comfortable for the occupants. LEED for Neighborhood Development is a collaboration between the U.S. Green Building Council, the Congress for the New Urbanism and the Natural Resources Defense Council. The LEED for Neighborhood Development Rating System integrates the principles of smart growth and green building into the first national standard for neighborhood design. LEED for Neighborhood Development recognizes development projects that successfully protect and enhance the overall health, natural environment and quality of life of our communities. The rating system encourages urban smart growth best practices, promoting the design of neighborhoods that reduce vehicle miles traveled and communities where jobs and services are accessible by foot or public transit.
ENERGY STAR Program ENERGY STAR is a joint program of the U.S. Environmental Protection Agency and the U.S. Department of Energy. ��� ����Y� �? � ��� }������ ���%� �� ������ z@ ��+� {}z|� ����*�� *�ENERGY STAR as a voluntary labeling program designed to identify and promote energy-efficient products to reduce greenhouse gas emissions. Computers and monitors were the first labeled products. Through ����Y�}z� ]���* *��? � %�� %�����**������%������ � [���� �����*���� and residential heating and cooling equipment. In 1996, EPA partnered
with the US Department of Energy for particular product categories. The ENERGY STAR label is now on major appliances, office equipment, lighting, home electronics, and more. EPA has also extended the label to cover new homes and commercial and industrial buildings.
KKapa�a Highlands II Sustainability Plan
Chapter 2; Sustainability Programs and Plans Page 15
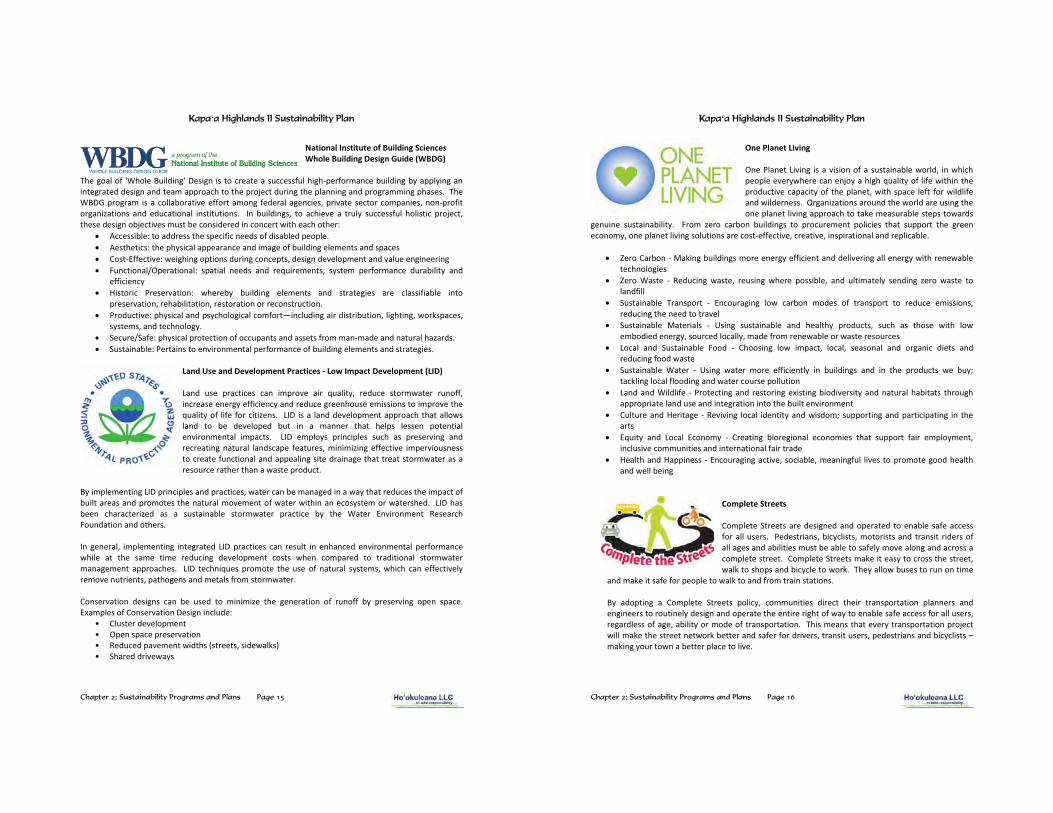
National Institute of Building Sciences Whole Building Design Guide (WBDG)
The goal of 'Whole Building' Design is to create a successful high-performance building by applying an integrated design and team approach to the project during the planning and programming phases. The WBDG program is a collaborative effort among federal agencies, private sector companies, non-profit organizations and educational institutions. In buildings, to achieve a truly successful holistic project, these design objectives must be considered in concert with each other:
� Accessible: to address the specific needs of disabled people. � Aesthetics: the physical appearance and image of building elements and spaces � Cost-Effective: weighing options during concepts, design development and value engineering � Functional/Operational: spatial needs and requirements, system performance durability and
efficiency � X������� � �������� !? �+� ���%*��@� % � �ts and strategies are classifiable into
preservation, rehabilitation, restoration or reconstruction. � Productive: physical and psychological comfort—including air distribution, lighting, workspaces,
systems, and technology. � Secure/Safe: physical protection of occupants and assets from man-made and natural hazards. � Sustainable: Pertains to environmental performance of building elements and strategies.
Land Use and Development Practices - Low Impact Development (LID) Land use practices can improve air quality, reduce stormwater runoff, increase energy efficiency and reduce greenhouse emissions to improve the quality of life for citizens. LID is a land development approach that allows land to be developed but in a manner that helps lessen potential environmental impacts. LID employs principles such as preserving and recreating natural landscape features, minimizing effective imperviousness to create functional and appealing site drainage that treat stormwater as a resource rather than a waste product.
By implementing LID principles and practices, water can be managed in a way that reduces the impact of built areas and promotes the natural movement of water within an ecosystem or watershed. LID has been characterized as a sustainable stormwater practice by the Water Environment Research Foundation and others. In general, implementing integrated LID practices can result in enhanced environmental performance while at the same time reducing development costs when compared to traditional stormwater management approaches. LID techniques promote the use of natural systems, which can effectively remove nutrients, pathogens and metals from stormwater. Conservation designs can be used to minimize the generation of runoff by preserving open space. Examples of Conservation Design include:
¢ Cluster development ¢ Open space preservation ¢ > *�� *���� � ���!�*�?��{�� ��Y���* !�%J�| ¢ Shared driveways
KKapa�a Highlands II Sustainability Plan
Chapter 2; Sustainability Programs and Plans Page 16
One Planet Living
One Planet Living is a vision of a sustainable world, in which people everywhere can enjoy a high quality of life within the productive capacity of the planet, with space left for wildlife and wilderness. Organizations around the world are using the one planet living approach to take measurable steps towards
genuine sustainability. From zero carbon buildings to procurement policies that support the green economy, one planet living solutions are cost-effective, creative, inspirational and replicable.
� Zero Carbon -
�
Making buildings more energy efficient and delivering all energy with renewable technologies
�
Zero Waste - Reducing waste, reusing where possible, and ultimately sending zero waste to landfill
�
Sustainable Transport - Encouraging low carbon modes of transport to reduce emissions, reducing the need to travel
�
Sustainable Materials - Using sustainable and healthy products, such as those with low embodied energy, sourced locally, made from renewable or waste resources
�
Local and Sustainable Food - Choosing low impact, local, seasonal and organic diets and reducing food waste
�
Sustainable Water - Using water more efficiently in buildings and in the products we buy; tackling local flooding and water course pollution
�
Land and Wildlife - Protecting and restoring existing biodiversity and natural habitats through appropriate land use and integration into the built environment
�
��%�� ���*�X ���@ � - Reviving local identity and wisdom; supporting and participating in the arts
�
Equity and Local Economy - Creating bioregional economies that support fair employment, inclusive communities and international fair trade
X �%�?���*�X����� ��� - Encouraging active, sociable, meaningful lives to promote good health and well being
Complete Streets
Complete Streets are
designed and operated to enable safe access for all users. Pedestrians, bicyclists, motorists and transit riders of all ages and abilities must be able to safely move along and across a complete street. Complete Streets make it easy to cross the street, walk to shops and bicycle to work. They allow buses to run on time
and make it safe for people to walk to and from train stations.
By adopting a Complete Streets policy, communities direct their transportation planners and engineers to routinely design and operate the entire right of way to enable safe access for all users, regardless of age, ability or mode of transportation. This means that every transportation project will make the street network better and safer for drivers, transit users, pedestrians and bicyclists – making your town a better place to live.

KKapa�a Highlands II Sustainability Plan
Chapter 3; Natural and Cultural Resources Page 17
��Natural and Cultural Resources
The preservation of the natural and cultural resources is essential for a prosperous and sustainable future. Kapa���X�@?%��*���� holds respect for the culture and the environment and will interlink natural features and cultural features as core components of the community. z�?� �%�@���%���*���%���%���� ��!�%%�� ���� �� *�and maintained with appropriate treatment and buffers from adjacent uses, as necessary.
No ��?� �%�@���%�����%���%�?���������� ��� �J��!����� ]��t on the property. Brief discussions separately with historians of the subject area, Randy Wichman, Walter Smith and z%� �� ��J��?���Y� ����%�* *� �?��� �? � ���� ��� ��� �+� ?��� � �� ��� ��@�� ��%��������� ���� � �? � ����������%��? � �%+������\� Albert Fukushima, who was employed by Lihue Plantation and worked in the subject area, said that no evidence of artifacts, bones, or other indicators of previous historic on-site activity were uncovered *���@��? ���%��������������@�\ Randy Wichman and Walter Smith concurred that the subject land was ������� ��%+���%����� *������@������ �%+���?��* *�+ ��\� ���������X-����� *�����? �^��� �� % ����� }��_ for the adjacent Kapa���'�**% ���?��%��?����? ���� ���+����� � � z�?� �%�@���%� �� X�������%%+� ��?� � ���� � ��� �? � ������� ��� ��%��������� ��� ��@�� ��� � �%+� ��hundred years. ����? �%�� �����Y��? ����� �X������� � �������-��������{�X-|����� *���% �� ����^�����@�������� _�����? �potential developer at that time. #? � ]����������@%+Y� ��* �� ����������� ���@����@������*���? �\� Nearly all have lost their banks and flattened out. �� ��%+Y��X-�?��� [� �� *��?����? ����%������ ��*��? �%�������������? � ������@� �����������? ���� ���@������*���? ����������? �* � %��� ������@ �\��#? �z��%���������������� *���� ���*�����@� ��*� z�?� �%�@���%� ��� ���+� ��� +� ��� �? � ��� � ��� * ��@�� ��*� * � %��� ��� �?�� � ���order to properly record the rem���������? ��%�����������@������*���? �\� �?��%*���+���?� �%�@���%%+� ��@�����������������Y���� �Y� or other indicators of previous historic on-site activity � � ����� *� *���@� �����������Y �? � z��%������ ��� ������� *� ��� �? �� � ��� ��� � ��@�conducted �������������%���� �!��?��? � [�� � ��������X-\� Additionally, w? � � � ]�����@���J�!�%%�������� � ��� *Y��? ���J�������? � �!�%%��!�%%�� �� �����* ���*� �� *�����? ����������������� !��� �Y����� ���*� ������@�!�%%�����%��!��?���Kapa���X�@?%��*����. Whenever feasible, rocks from Kapa���X�@?%��*���� !�%%�� ��� *�������?�!�%%��{������� �����������������J����������� |\ Greenbelts � �� %���� ���* � %�� *�� ����?��������*��? �* � %�� *�� ��\��� �� %����������� @����%�����@����%� ���� � �����������!%��+�J ���@� %��*�� ��� ��%+��� �\� �#? ������ ���� �? �� �� %�� ��� ���� � �����������!%Y�� � ���� �@?����@���!�������� @��@�������� �����? Y���*����� � � ��? �� ����@���*��? ��?���� �����? area. z���]���� ly ��\�-�� ��� ������ *������ ��@ �!�+�� ��\
KKapa�a Highlands II Sustainability Plan
Chapter 4; Consistency with Land Use Plans Page 18
��Consistency with Regional Land Use Planning
Consistency with local land use planning documents is an essential element of sustainability. The local plans articulate and illustrate the community’s vision. Without consistency with that vision, a development project cannot be sustainable. Two primary planning documents address land use development in Kapa��Y� �? �General Plan of the County of Kaua�� and the Kapa��-Wailua Basin Community Plan.
Following are brief summaries of each. The General Plan of the County of Kauaʻi (General Plan) The General Plan of the County of Kauai (“General Plan”) was adopted in 1971 and updated in November 2000. The General Plan is a statement of the County’s vision for Kaua�i and establishes strategies for achieving that vision. Section 7-1.2 of the amended Chapter 7 of the Kauai County Code states: Pursuant to the provision of the Charter for the County of Kaua�i, the General Plan sets forth in graphics and text, policies to govern the future physical development of the county. The General Plan is intended to improve the physical environment of the County and the health, safety and general welfare of Kaua�i’s people. The General Plan states the County’s vision for Kaua�i and establishes strategies for achieving that vision. The strategies are expressed in terms of policies and implementing actions. They may be augmented and changed as new strategies are developed.
The General Plan is a direction-setting policy document. It is not intended to be regulatory. It is intended to be a guide for future amendments to the lands regulations and to be considered in reviewing specific zoning amendment and development applications. The vision, the maps and text policies, and the implementing actions are intended to guide the county actions and decisions. In addition, the maps and text policies are intended to guide the County in specific types of actions: making revisions to land use and land development Regulations; deciding on zoning changes; preparing and adopting Development Plans and Public Facility Plans; and preparing and adopting capital improvement plans. The General Plan contains six major themes, each with various policies for implementation. The major themes are as follows:
1. Caring for Land, Water and Culture
2. Developing Jobs and Businesses
3. Preserving Kaua�����>��%��?����
4. Enhancing Towns & Communities and Providing for Growth
5. Building Public Facilities and Services
6. Improving Housing, Parks and Schools

KKapa�a Highlands II Sustainability Plan
Chapter 4; Consistency with Land Use Plans Page 19
In particular, the proposed reclassification of the Property responds and conforms to Theme No. 6. Market studies have shown that the population growth and correlating need and demand for housing is extremely high on Kaua�i.
The proposed reclassification, which will allow residents to purchase an affordable house and lot as well as allow other residents to purchase a lot to design and build their own homes, will present an opportunity to address the critical community need for residential housing. It should also be noted that the proposed development will assist in maintaining a viable economy as construction-related employment opportunities for residents would be generated.
Kapaʻa-Wailua Basin Community Plan The Kapa�a-Wailua Basin community plan outlines the regional issues and opportunities that will be subjects for future community planning. A “Build-Out Analysis” of the Kapa�a-Wailua Basin was prepared in the General Plan Update. As of 1998, this area had an estimated 4,700 dwelling units, making it the largest residential community on Kauai. Based on the General Plan Land Use Map designations, the analysis found that an additional 4,000 units could be developed if the General Plan-designated lands were fully zoned, subdivided and built out. z������Y������ ����������%*�� ����%�� ��������> ��* ����%�� ��Y������������� ����>��% >esidential areas and approximately 1,100 more units in the Agricultural areas. This would increase the housing units and population of the area by 85%. The “Build-Out Analysis” specifically included the subject property as an “expansion area”. The new General Plan Land Use Map designates the subject property as Urban Center. The Kapa���X�@?%��*�������� ����������������*����% � �����? ���%��� ������? ��������� � �%�%����+�developing within the designated Urban District, contiguous to Kapa��� ��!�� ��d its neighboring residential community.
KKapa�a Highlands II Sustainability Plan
Chapter 5; Sustainable Design Features Page 20
� Sustainable Design Features
Thoughtful planning of site, neighborhood and improvements design, incorporating mixed-use land uses, walkable streets, encouraging walking, bicycling and public transportation, and respect for the natural and cultural features creates opportunities for more environmentally-responsible and sustainable development. These sustainable neighborhoods are beneficial to the community, the individual and the environment.
Several sustainability programs and plans (noted previously in Chapter 2) identify and address a wide variety of design features that may be incorporated into a development project to enhance its sustainability. These items design features include:
� Site Planning o Respect for the Land – Work with topography o Siting - Proximity to mass transit, shopping, employment centers, recreation, schools o Interconnectivity – Connection with neighbors, Multi-modal transportation (to be
discussed in another section of this Plan) o Intensity of Layout – Village Center; Clustering into compact villages o Natural/Cultural Resources – Protection of natural and cultural resources (to be
addressed in another section of this Plan)
� Improvements Planning o Alternatives – Provide a range of housing options at various price levels (to be discussed
in another section of this Plan) o Orientation – Ventilation; Take advantage of natural air flow o Shading – Eve overhang; Vegetation o Landscaping – Native plants; Low irrigation o Energy Efficiency – (to be discussed in another section of this Plan)
The objectives of Kapa���X�@?%��*���� are to create an attractive master-planned residential community with a variety of housing opportunities and mixed uses, as well as recreational resources. Site Planning As a mixed-use community, the objectives of Kapa���X�@?%�nds II are to:
¢ Create a diverse, sustained community of mixed uses, including residential, retail and commercial spaces, recreational spaces, and open space.
¢ ��%����� ���������� �� �������? �%��*���*������%������*��@�Y�* � %��������? ���X�!������sense of place and nourish a sustaining living environment.
¢ ���* � ?�����@� ��� �? � !�J��@� ����%� �� ��� X�!����� � ��+� � ��� ��� !�J��� � * ���*Y�resultantly improving overall quality of life through the reduction of commuting and facilitation of everyday function.
¢ Openly embrace a diversity of people and activities through offering mixed uses and housing types.
¢ Contribute to the social fabric of the community by providing infrastructure and facilities, and by including recreational, and civic sites.
¢ Engender and incorporate intelligent, planned sustainability by design. ¢ Emphasize non-vehicular transit for mainstream community-wide travel.

KKapa�a Highlands II Sustainability Plan
Chapter 5; Sustainable Design Features Page 21
Kapa���X�@?%��*���� is strategically located north of Kapa�����!�. The Kapa�a By-Pass Road separates the Kapa�����!����*��? Kapa���X�@?%��*���� development. Kapa���X�@?%��*���� is on the north-west corner of the Kapa�a By-Pass Road and Olohena Road. Olohena Road runs along and adjacent to the east and north boundaries of the Property. The Kapa� a Middle School is located on the northern end of the Property fronted by Olohena Road. The area also has a long-standing and growing residential base. This area will continue to be the focus of such development a�� �? � ��%��*��� ����%������ @�!�. This region is also the near commercial and industrial heart of Kaua��, serving the needs of the visitor, residents and other industries of the western half of the Island. Kapa��� X�@?%��*�� �� is a compact, mixed-use, master-planned community offering a wide range of housing types and affordability, and a variety of businesses and employment opportunities with supporting retail, commercial, infrastructure, recreational and open space uses. The Project proposes to develop Phase II of Kapa��� X�@?%��*�� ����� ��� ����]���� %+� ��-acre single-family and multi-family residential subdivision. z���]���� %+� ��-acres will be subdivided into single family lots ranging from 5,000 to 8,000 square feet and multi-family lots from 1-acre to 5-acre parcels. A total of 683 multi-family units and 86 single family units are planned. Open space encompassing 14.3- acres will be developed and associated infrastructure (e.g., new roadways, utilities, drainage, wastewater). Affordable housing will be provided in accordance with County of Kaua`i requirements. A 3.1-acre park is proposed adjacent to the existing Kapa�a Middle School. The park will have an area for �? ������+�s proposed relocation of the Kapa�a county swimming pool. A 0.4-acre parcel is proposed for commercial use. A country type store and small personal service types of use are anticipated. A remnant parcel of a one acre on the Makai side of the Kapa� a Bypass road is also proposed as commercial use or for sub-stations for the police and fire departments. Approximately 14.3-acres are proposed for open greenway areas. The site is presently fallow, undeveloped, and predominantly vegetated with weeds. The undesirable dumping of old cars, appliances, rubbish associated with undeveloped lands continue to exist on the property. The proposed project will increase the productive use of the property and significantly upgrade the immediate vicinity. The proposed development will have minimal impact in terms of agriculture. Although the Property was previously used as part of large scale agricultural activities, it is presently fallow, and undeveloped. With the closing of the sugar plantations on Kaua�i, close proximity to existing residential areas, and demand for affordable housing, large-scale agricultural operations were not deemed feasible. Construction of the proposed development will involve grading, excavation and trenching of presently undeveloped areas within the project site. The project will require alteration of existing landforms to create more efficient land development areas. Appropriate engineering, design and construction measures will be undertaken to minimize potential erosion of soils during construction. On-Site grading and infrastructure improvements and residential construction will result in an increase in dust, storm run-offs and noise. The prevailing trade wind pattern is from the north-east directions. Potential airborne matters will generally be carried in the south-west direction, away from the school and existing residential areas. X�! � Y� ��� ���������Y� �? � ! �� %+� !��*�� ��+� ��+� �? � ��� ����%�
KKapa�a Highlands II Sustainability Plan
Chapter 5; Sustainable Design Features Page 22
airborne matters towards the school and existing residential neighborhoods. Construction noise relating to infrastructure installations will be expected. In the short term, during construction, measures will be taken to minimize impacts such as increased dust, noise and traffic. �������������������� ���?�%%�����%+�!��?��? ��������������X�!����z*���������� �Rules, S-11-60.11.33 on Fugitive Dust. Dust preventive measures will include;
� Planning of construction phases to minimize the amount of dust generating materials and activities, centralizing on-site vehicular traffic routes and locating of potential dust-generating equipment in areas of the least impact.
� Provide adequate water source at the site prior to start of construction. � Landscape and provide rapid covering of bare areas developed during construction. � Minimize dust from shoulders and access roads. � Provide dust control measures during weekends, after hours, and prior to daily construction. � Control dust from debris being hauled away from the site.
A national Pollutant Discharge Elimination System (NPDES) general permit will be acquired prior to construction to minimize storm run-offs during construction. Mitigation measures will be instituted following site-specific assessments, incorporating structural and non-structural BMPs such as minimizing soil exposure and implementing erosion control measures such as silt fences and sediment basins. Following construction, erosion is anticipated to decrease since the soils will have been graded, built over, paved over or landscaped. Landscaping in turn will provide erosion control. Mass grading of the development areas will be in compliance with the County of Kaua�����@�*��@��*����� � [�� � ������*�!�%%� [�� ��-}��� ���������? ����� �-�X���������water construction activities, including BMPs to minimize off-site impacts. The Property is encompassed by the Kapa�a By-Pass Road to the south and Olohena Road to the east and the north side. The by-pass road is owned by the Applicant and the Applicant intends to dedicate said road to the Department of Transportation (DOT) for continued public use. There is a round-about located at the south east corner of Olohena Road and the Kapa�a By-Pass Road. ��?��� X�@?!�+� ��� ��� ����% � ���� �? � �� �+� �+� *����@� ����?� ��� �%�? ��� ��*� ��J��� �� ��approximately 0.5 mile. The project will have a complete multi-modal roadway from the Kapa�a By-Pass Road running north through the Property to Olohena Road. A couple of bus stops will be located along the roadway. A bike/walking path is proposed from the south of the property to the Kapa�a Middle School located on the North portion of the Property. Improvements Planning There are three major sources of unwanted heat in homes: direct solar impacts on a building and through windows and skylights; heat transfer and infiltration, of exterior high temperatures, through the materials and elements of the structure; and the internal heat produced by appliances, equipment and inhabitants.
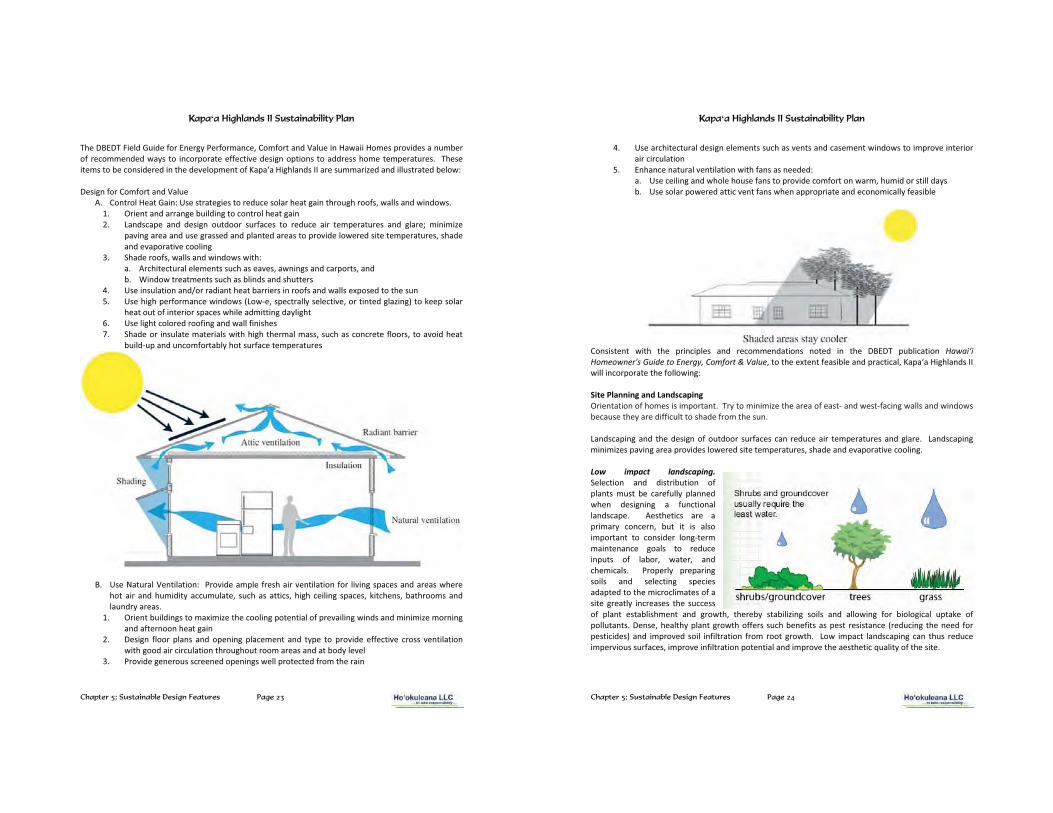
KKapa�a Highlands II Sustainability Plan
Chapter 5; Sustainable Design Features Page 23
#? �-<}-#��� %*����* ����}� @+� ������ Y����������*���%� ����X�!����X�� ������* ��������er of recommended ways to incorporate effective design options to address home temperatures. These items to be considered in the development of Kapa���X�@?%��*���� are summarized and illustrated below: Design for Comfort and Value
A. �����%�X ����������� ����� @� ����� *�� ���%��? ���@�����?��@?�����Y�!�%%����*�!��*�!�\ 1. Orient and arrange building to control heat gain 2. Landscape and design outdoor surfaces to reduce air temperatures and glare; minimize
paving area and use grassed and planted areas to provide lowered site temperatures, shade and evaporative cooling
3. Shade roofs, walls and windows with: a. Architectural elements such as eaves, awnings and carports, and b. Window treatments such as blinds and shutters
4. �� �����%��������*Q���*�����? ������ �������fs and walls exposed to the sun 5. �� �?�@?�� ������ �!��*�!��{��!-e, spectrally selective, or tinted glazing) to keep solar
heat out of interior spaces while admitting daylight 6. �� �%�@?����lored roofing and wall finishes �\ Shade or insulate materials with high thermal mass, such as concrete floors, to avoid heat
build-up and uncomfortably hot surface temperatures
B. �� ������%�� ���%������� ���ide ample fresh air ventilation for living spaces and areas where hot air and humidity accumulate, such as attics, high ceiling spaces, kitchens, bathrooms and laundry areas.
1. Orient buildings to maximize the cooling potential of prevailing winds and minimize morning and afternoon heat gain
2. Design floor plans and opening placement and type to provide effective cross ventilation with good air circulation throughout room areas and at body level
3. Provide generous screened openings well protected from the rain
KKapa�a Highlands II Sustainability Plan
Chapter 5; Sustainable Design Features Page 24
4. ��e architectural design elements such as vents and casement windows to improve interior air circulation
5. Enhance natural ventilation with fans as needed: a. �� �� �%��@���*�!?�% �?��� �������������* ������rt on warm, humid or still days b. �� ���%����! *������ vent fans when appropriate and economically feasible
Consistent with the principles and recommendations noted in the DBEDT publication Hawai�i Homeowner's Guide to Energy, Comfort & Value, to the extent feasible and practical, Kapa���X�@?%��*���� will incorporate the following: Site Planning and Landscaping Orientation of homes is important. Try to minimize the area of east- and west-facing walls and windows because they are difficult to shade from the sun. Landscaping and the design of outdoor surfaces can reduce air temperatures and glare. Landscaping minimizes paving area provides lowered site temperatures, shade and evaporative cooling. Low impact landscaping. Selection and distribution of plants must be carefully planned when designing a functional landscape. Aesthetics are a primary concern, but it is also important to consider long-term maintenance goals to reduce inputs of labor, water, and chemicals. Properly preparing soils and selecting species adapted to the microclimates of a site greatly increases the success of plant establishment and growth, thereby stabilizing soils and allowing for biological uptake of pollutants. Dense, healthy plant growth offers such benefits as pest resistance (reducing the need for pesticides) and improved soil infiltration from root growth. Low impact landscaping can thus reduce impervious surfaces, improve infiltration potential and improve the aesthetic quality of the site.
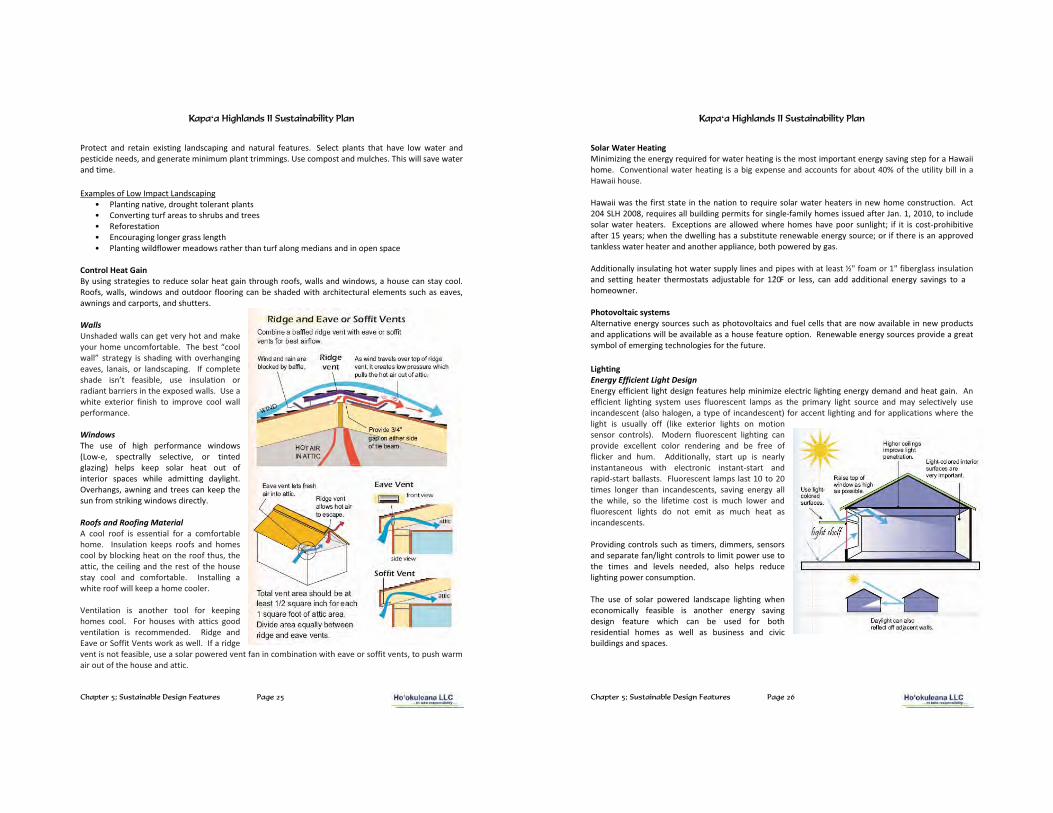
KKapa�a Highlands II Sustainability Plan
Chapter 5; Sustainable Design Features Page 25
Protect and retain existing landscaping and natural features. Select plants that have low water and pesticide needs, and generate minimum plant trimmings. �� �����������*���%�? �\ This will save water and time. Examples of Low Impact Landscaping
¢ Planting native, drought tolerant plants ¢ Converting turf areas to shrubs and trees ¢ Reforestation ¢ Encouraging longer grass length ¢ Planting wildflower meadows rather than turf along medians and in open space
Control Heat Gain By using strategies to reduce solar heat gain through roofs, walls and windows, a house can stay cool. Roofs, walls, windows and outdoor flooring can be shaded with architectural elements such as eaves, awnings and carports, and shutters. Walls ���?�* *�!�%%������@ ��� +�?�����*���J �your home uncomfortable. The best “cool wall” strategy is shading with overhanging eaves, lanais, or landscaping. If complete �?�* � ������ � ����% Y� �� � ����%������ ��radiant barriers in the exposed walls. �� ���white exterior finish to improve cool wall performance. Windows The use of high performance windows (Low-e, spectrally selective, or tinted glazing) helps keep solar heat out of interior spaces while admitting daylight. Overhangs, awning and trees can keep the sun from striking windows directly. Roofs and Roofing Material A cool roof is essential for a comfortable home. Insulation keeps roofs and homes cool by blocking heat on the roof thus, the attic, the ceiling and the rest of the house stay cool and comfortable. Installing a white roof will keep a home cooler. Ventilation is another tool for keeping homes cool. For houses with attics good ventilation is recommended. Ridge and Eave or Soffit Vents work as well. If a ridge vent is not feasible, use a solar powered vent fan in combination with eave or soffit vents, to push warm air out of the house and attic.
KKapa�a Highlands II Sustainability Plan
Chapter 5; Sustainable Design Features Page 26
Solar Water Heating '��������@��? � � @+� [�� *����!�� �? ����@�����? ��������������� � @+������@��� �������X�!����home. Conventional water heating is a big expense and accounts for about 40% of the utility bill in a X�!����?��� \� X�!����!����? first state in the nation to require solar water heaters in new home construction. Act 204 ��X�����Y�requires all building permits for single-family homes issued after Jan. 1, 2010, to include solar water heaters. Exceptions are allowed where homes have poor sunlight; if it is cost-prohibitive after 15 years; when the dwelling has a substitute renewable energy source; or if there is an approved tankless water heater and another appliance, both powered by gas. Additionally insulating hot water supply lines and pipes with at least ½" foam or 1" fiberglass insulation and setting heater thermostats adjustable for 120§� �� �� % ��Y� ���� �**� �**������%� � @+� �����@�� ��� ��homeowner. Photovoltaic systems Alternative energy sources such as photovoltaics and fuel cells that are now available in new products and applications will be available as a house feature option. Renewable energy sources provide a great symbol of emerging technologies for the future.
Lighting Energy Efficient Light Design Energy efficient light design features help minimize electric lighting energy demand and heat gain. An efficient lighting system uses fluorescent lamps as the primary light source and may selectively use incandescent (also halogen, a type of incandescent) for accent lighting and for applications where the light is usually off (like exterior lights on motion sensor controls). Modern fluorescent lighting can provide excellent color rendering and be free of flicker and hum. Additionally, start up is nearly instantaneous with electronic instant-start and rapid-start ballasts. Fluorescent lamps last 10 to 20 times longer than incandescents, saving energy all the while, so the lifetime cost is much lower and fluorescent lights do not emit as much heat as incandescents. Providing controls such as timers, dimmers, sensors and separate fan/light controls to limit power use to the times and levels needed, also helps reduce lighting power consumption. The use of solar powered landscape lighting when economically feasible is another energy saving design feature which can be used for both residential homes as well as business and civic buildings and spaces.
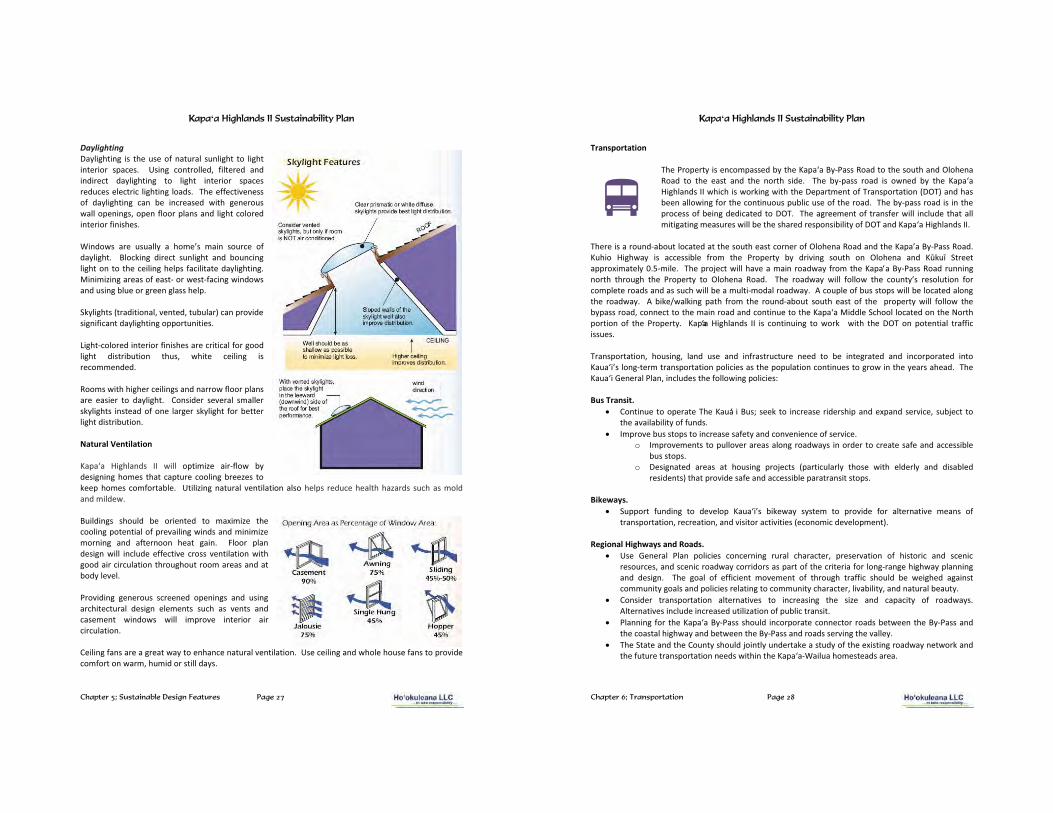
KKapa�a Highlands II Sustainability Plan
Chapter 5; Sustainable Design Features Page 27
Daylighting Daylighting is the use of natural sunlight to light ��� ��� ���� �\� � ����@ controlled, filtered and indirect daylighting to light interior spaces reduces electric lighting loads. The effectiveness of daylighting can be increased with generous wall openings, open floor plans and light colored interior finishes. ���*�!�� � � ����%%+� �� ?�� ��� ����� ���� � ���daylight. Blocking direct sunlight and bouncing light on to the ceiling helps facilitate daylighting. Minimizing areas of east- or west-facing windows and using blue or green glass help. Skylights (traditional, vented, tubular) can provide significant daylighting opportunities. Light-colored interior finishes are critical for good light distribution thus, white ceiling is recommended. Rooms with higher ceilings and narrow floor plans are easier to daylight. Consider several smaller skylights instead of one larger skylight for better light distribution. Natural Ventilation Kapa��� X�@?%��*�� �� will optimize air-flow by designing homes that capture cooling breezes to J �� ?�� ����������% \� � ���%����@� �����%� � ���%������ �%��� helps reduce health hazards such as mold and mildew. Buildings should be oriented to maximize the cooling potential of prevailing winds and minimize morning and afternoon heat gain. Floor plan design will include effective cross ventilation with good air circulation throughout room areas and at body level. Providing generous screened openings and using architectural design elements such as vents and casement windows will improve interior air circulation. Ceiling fans are a great way to enhance natural ventilation. �� �� �%��@���*�!?�% �?��� �������������* �comfort on warm, humid or still days.
KKapa�a Highlands II Sustainability Plan
Chapter 6; Transportation Page 28
� Transportation
The Property is encompassed by the Kapa�a By-Pass Road to the south and Olohena Road to the east and the north side. The by-pass road is owned by the Kapa���Highlands II which is working with the Department of Transportation (DOT) and has been allowing for the continuous public use of the road. The by-pass road is in the process of being dedicated to DOT. The agreement of transfer will include that all mitigating measures will be the shared responsibility of DOT and Kapa���X�@?%��*����.
There is a round-about located at the south east corner of Olohena Road and the Kapa’a By-Pass Road. Kuhio Highway is accessible from the Property by driving south on Olohena and �¨J�� Street approximately 0.5-mile. The project will have a main roadway from the Kapa�a By-Pass Road running north through the Property to Olohena Road. The roadway will follow the county’s resolution for complete roads and as such will be a multi-modal roadway. A couple of bus stops will be located along the roadway. A bike/walking path from the round-about south east of the property will follow the bypass road, connect to the main road and continue to the Kapa�a Middle School located on the North portion of the Property. Kapa��� X�@?%��*�� ��� ��� ���������@� ��� !�J with the DOT on potential traffic issues. Transportation, housing, land use and infrastructure need to be integrated and incorporated into Kaua�����long-term transportation policies as the population continues to grow in the years ahead. The Kaua���� � �%�Plan, includes the following policies: Bus Transit.
� Continue to operate The Kaua� i Bus; seek to increase ridership and expand service, subject to the availability of funds.
� Improve bus stops to increase safety and convenience of service. o Improvements to pullover areas along roadways in order to create safe and accessible
bus stops. o Designated areas at housing projects (particularly those with elderly and disabled
residents) that provide safe and accessible paratransit stops. Bikeways.
� Support funding to develop Kaua�i’s bikeway system to provide for alternative means of transportation, recreation, and visitor activities (economic development).
Regional Highways and Roads.
� �� � � � �%� %��� ��%��� �� ���� ���@� ��%� �?���� Y� � � ������� ��� ?������� ��*� �� ��� resources, and scenic roadway corridors as part of the criteria for long-range highway planning and design. The goal of efficient movement of through traffic should be weighed against community goals and policies relating to community character, livability, and natural beauty.
� Consider transportation alternatives to increasing the size and capacity of roadways. Alternatives include increased utilization of public transit.
� Planning for the Kapa�a By-Pass should incorporate connector roads between the By-Pass and the coastal highway and between the By-Pass and roads serving the valley.
� The State and the County should jointly undertake a study of the existing roadway network and the future transportation needs within the Kapa�a-Wailua homesteads area.
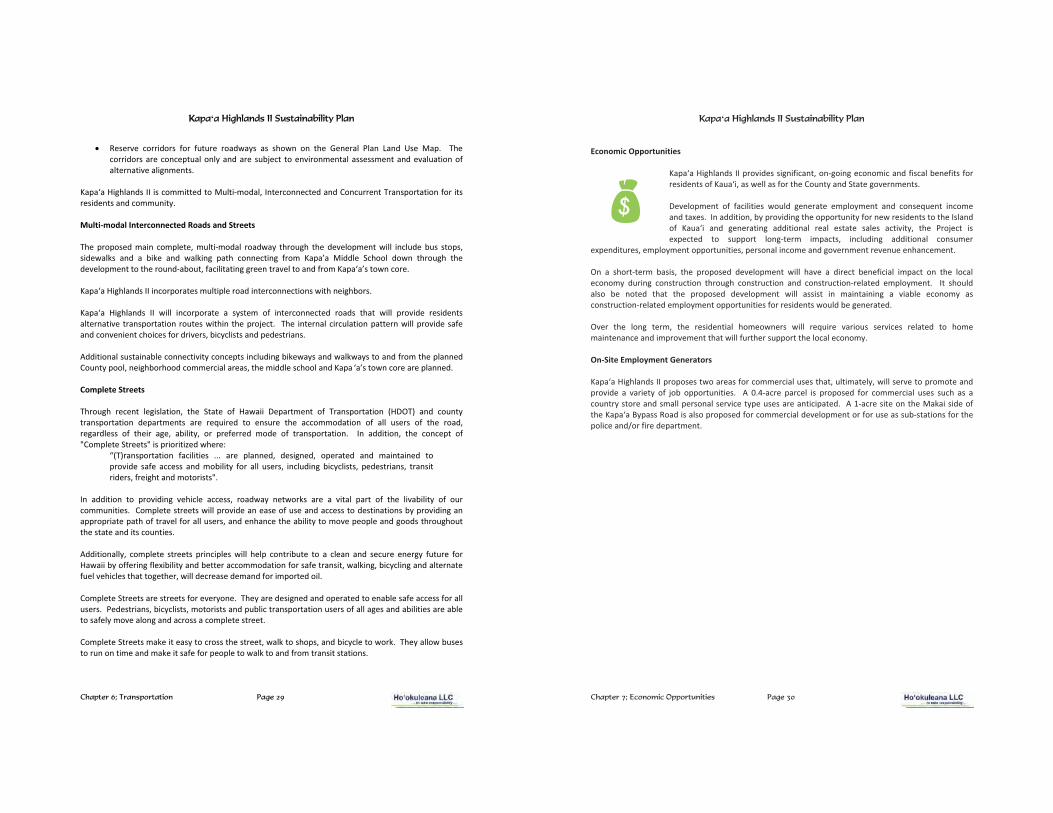
KKapa�a Highlands II Sustainability Plan
Chapter 6; Transportation Page 29
� > � � � ���*��� ��� ���� � ��*!�+�� ��� �?�!�� ��� �? � � � �%� %��� ���*� �� � '��\ The corridors are conceptual only and are subject to environmental assessment and evaluation of alternative alignments.
Kapa���X�@?%��*���� is committed to Multi-modal, Interconnected and Concurrent Transportation for its residents and community. Multi-modal Interconnected Roads and Streets The proposed main complete, multi-modal roadway through the development will include bus stops, sidewalks and a bike and walking path connecting from Kapa’a Middle School down through the development to the round-about, facilitating green travel to and from Kapa�a’s town core. Kapa���X�@?%��*���� incorporates multiple road interconnections with neighbors. Kapa��� X�@?%��*�� �� will incorporate a system of interconnected roads that will provide residents alternative transportation routes within the project. The internal circulation pattern will provide safe and convenient choices for drivers, bicyclists and pedestrians. Additional sustainable connectivity concepts including bikeways and walkways to and from the planned County pool, neighborhood commercial areas, the middle school and Kapa �������!���� �� ��%��� *\ Complete Streets Through recent legislation, the State of Hawaii Department of Transportation (HDOT) and county transportation departments are required to ensure the accommodation of all users of the road, regardless of their age, ability, or preferred mode of transportation. In addition, the concept of "Complete Streets" is prioritized where:
“(T)ransportation facilities ... are planned, designed, operated and maintained to provide safe access and mobility for all users, including bicyclists, pedestrians, transit riders, freight and motorists".
In addition to providing vehicle access, roadway networks are a vital part of the livability of our communities. Complete streets will provide an ease of use and access to destinations by providing an appropriate path of travel for all users, and enhance the ability to move people and goods throughout the state and its counties. Additionally, complete streets principles will help contribute to a clean and secure energy future for Hawaii by offering flexibility and better accommodation for safe transit, walking, bicycling and alternate fuel vehicles that together, will decrease demand for imported oil. Complete Streets are streets for everyone. They are designed and operated to enable safe access for all users. Pedestrians, bicyclists, motorists and public transportation users of all ages and abilities are able to safely move along and across a complete street. Complete Streets make it easy to cross the street, walk to shops, and bicycle to work. They allow buses to run on time and make it safe for people to walk to and from transit stations.
Kapa�a Highlands II Sustainability Plan ��
Chapter 7; Economic Opportunities Page 30
�Economic�Opportunities��
Kapa�a�Highlands�II�provides�significant,�on�going�economic�and�fiscal�benefits�for�residents�of�Kaua‘i,�as�well�as�for�the�County�and�State�governments.����Development� of� facilities� would� generate� employment� and� consequent� income�and�taxes.��In�addition,�by�providing�the�opportunity�for�new�residents�to�the�Island�of� Kaua‘i� and� generating� additional� real� estate� sales� activity,� the� Project� is�expected� to� support� long�term� impacts,� including� additional� consumer�
expenditures,�employment�opportunities,�personal�income�and�government�revenue�enhancement.��On� a� short�term� basis,� the� proposed� development� will� have� a� direct� beneficial� impact� on� the� local�economy� during� construction� through� construction� and� construction�related� employment.� � It� should�also� be� noted� that� the� proposed� development� will� assist� in� maintaining� a� viable� economy� as�construction�related�employment�opportunities�for�residents�would�be�generated.����Over� the� long� term,� the� residential� homeowners� will� require� various� services� related� to� home�maintenance�and�improvement�that�will�further�support�the�local�economy.��On�Site�Employment�Generators��Kapa�a�Highlands�II�proposes�two�areas�for�commercial�uses�that,�ultimately,�will�serve�to�promote�and�provide� a� variety� of� job� opportunities.� � A� 0.4�acre� parcel� is� proposed� for� commercial� uses� such� as� a�country�store�and�small�personal�service�type�uses�are�anticipated.� �A�1�acre�site�on�the�Makai�side�of�the�Kapa�a�Bypass�Road�is�also�proposed�for�commercial�development�or�for�use�as�sub�stations�for�the�police�and/or�fire�department.����
KKapa�a Highlands II Sustainability Plan
Chapter 8; Open Space and Parks Page 31
� Open Space and Parks
Kapa��� X�@?%��*�� �� ?�%*�� �� ��� ��� �? � ������ ��� �+� ��� %��J��@� �����%�� ��� ����*��� ������ ������ ������� ��������? ���������+. #? � � � � � �%� ��J�� !��?��� ����� �� ��!�Y� ���%�*��@� �� � ��?� ��J\� � z� �����+- �!� *� �\�-�� ��J� ��� %���� *� !��?��� !�%J��@� *������ � ���� �? � �� �+Y� ���������?� ��������? ���� �����%�? ���>��*���*��? ��+-�������*����*-�����\� �#? ���J������������������ ��%%��� %*Y�������%%��� %*Y����J ���%%������Y� ����������%��� �Y�
����������% ����*������ �� �� �\� �� ������ ���*��� ��@ �!�+�� ��� ����������@���\�-�� ��!�%%�� �* � %�� * !��?����? ���� ��. z��\�-�� ���J��������� *�!��?����? ���� ���������*��� � �����\� ���*�����? ������ *� %������������? �������������+��!�����@����%�!�%%�� �����%��% �!��?����? ��\�-�� ���J\ #? ����������������\�-�� ���J� !��?� �� �����+� �!�����@� ���%� !��?��� �? � ����� *� * � %��� ��� !�%%� ����* � ��* ���� !��?� ������������+����% ��� %+� � ������%��������� �\ Kapa��� X�@?%��*�� ��� ��� �������� !��? X>�� ª� ���-a-�{<|� {�|� {z|� !?��?� ���� �� �?��� �«'��� ��� ���� � ��� ���^��� ��Y�� � � ���*Y�!? �* ����% Y� ��� �������� ��? �[��%��+����������%��� ������*��� ������ � ���� �\_ #? ���%��� �������?� � ��?������ ���� �� ������%%�!��
�\ �* ����+���%� *��� ���� ���� ������? �������%���� �����@ � ���� �` �\ }��� ��?���� !�* � %��� ����� ���������% �!��?��? �������%� ������ ����+�* ��@���@���*�
%������@����?�* � %��� �������������� ��? ��%� ��������������%�%��*�������*� ]�����@ ���%����� !�������*��%��@��? ��?� %�� `
�\ � � Y���������Y���*Y�!? �* ����% Y������ ���*� ��� ��?� %�� ��� ������ ���*��� ���� ���� �`���*
�\ }�����@ ��?�� �* � %��� ����!?��?�� �����������%�* � �* ������%���� ������%��*�� �\ ����� ���Y�?������Y���%���%����� �� ]������!�%%�� �� �� *�����? ����� ������ ���*��? ��� ����! %%��!�+������? ��?� %�� \ #? �� ���������%�!�%*%�� Y��� ��Y����� Y������[� � ��%�@���%�� � � �������� ���? ����� ������ \ #?��Y��� ������ ���*� � ������!�%%������ ��*� � %+���� �� *\���J���*�� ��? ������������� �!��?�� !�%J��@�*������ �������? ���� ��\ #? ������ *���� ���!�%%������*� � %+���������� �������� ������ � ���� �\� �#? ������ *���� ���!�%%���������%� ���@����������%� ����������? � ]�����@�����@��?����?���� �����? ���� ���*�!�%%�������� ������%����� !�������*��%��@��? ��?� %�� \
KKapa�a Highlands II Sustainability Plan
Chapter 9; Water Management Page 32
� Water Management
As an overarching philosophy in all source alternatives, Kapa���X�@?%��*���� ���������� *���� !�� � ���� ������� ���� @� �� ��� *�� � �����������Y� ���� � � ���� �� ��*�minimize water use. #? �@��%������� *�� ��? �����%�!�� ��� ��?��gh a combination of !�� ������@� [���� �����*����� @� �\ z� ���� � ��� � ��� �� ��+� � � ���% � �� *� ��� ����%���� � �*-user conservation, ���%�*��@� !�� � ���������� *���@� *� � � ��*�Y� ���%��� *�������� ��*� �� � ����� ���
%��*������@������� �\�����������������%*�� ���@��������%+� *�� *��?��@?� �*-user conservation. }����� ��� ��]�� �� ��*� ���%���� �� !�%%� *�� � ��*��� !�� � �� . #? � !�� � *����������� �+�� �� !�%%� � ��������� *� ��� � � ��� !�� � %���� ��*� ?�� �!� �� ��*� ����� �� �� !�%% � � �����@ *� �� maintain fixtures to prevent leaks. ���*������@� !�%%� ��?���� � �%���� ��*��� *� ����� � ��*� ��? � �������� �plants suitable for coastal locations. < �������@ � ��������� ��!�%%�� �* ��@� *���*����% � �� *����������� �����%���������*�����������*��%+�operations. WaterSense
WaterSense, a partnership program by the U.S. Environmental Protection Agency, seeks to protect the future of our nation's water supply by offering people a simple way to use less water with water- ����� ��� ��*����Y� � !� ?�� �Y� ��*� � ��� �\ ��� � �� ����@����@ �? ������ �+�������J ?�%* �����
� Promote the value of water efficiency. � ���* ������� ��!��?� ��+�!�+�������� �!�� Y�������?�
�� %�� %� �����*�������*���� ����������� ���� ����? %��people use water more efficiently.
� Encourage innovation in manufacturing. � - � �� �!�� ��� ���*� *�� ����������!�� � ���� ��
��*����������� \
#? ���@���� J�� ���? %�������� ����J ������!�� � �?��� �� �?��� ��� ���� +���*����������?�@?� ������ ���%�����*�*��!��?��������������g performance. �*�������*�� ��� ���?���?�� � �� *�the WaterSense label ?�� � � �� � ���� *� ��� � � ��� % ���� ��� � � ��� �� � ����� ��� !��?���� ���������@�performance. ��� �� � ��� � +� ��� ?�� �� ��� �? � ���� *� ���� �� ! � ��� �����%%� ��� � �� � %�� % *� ����ets or faucet ��� ���� �� ��� �? �� ���?����Y� ��� ���%*� ��� � �� ��%%���� @�%%���� ��� !�� � � � + �Y� ��*� �� � �?��� ¬�����%%��������? � � @+��������������%+Y�? ��Y���*�� ����?���!�� � Water Efficient Fixtures Water is a finite resource—even though about ���� � �������? �}��?�������� ������� *��+�!�� Y�% ����?������ � ����������%��% ����?������� \ }��?�z� ������� ������� �@ ��������@�%%�������!�� ���*�+�at home. � ������%%��� ����� � ���% ���!�� ��+������%%��@�!�� - ����� �����]�� ����*���pliances. The �� �@ �?��� ?�%*��� �*��������?����¬����� �+ ������? ��!�� ���*�� ! ���%%���*�������� �������¬����� �+ ���+������%%��@�!�� - ����� �����]�� ����*����%���� �\�
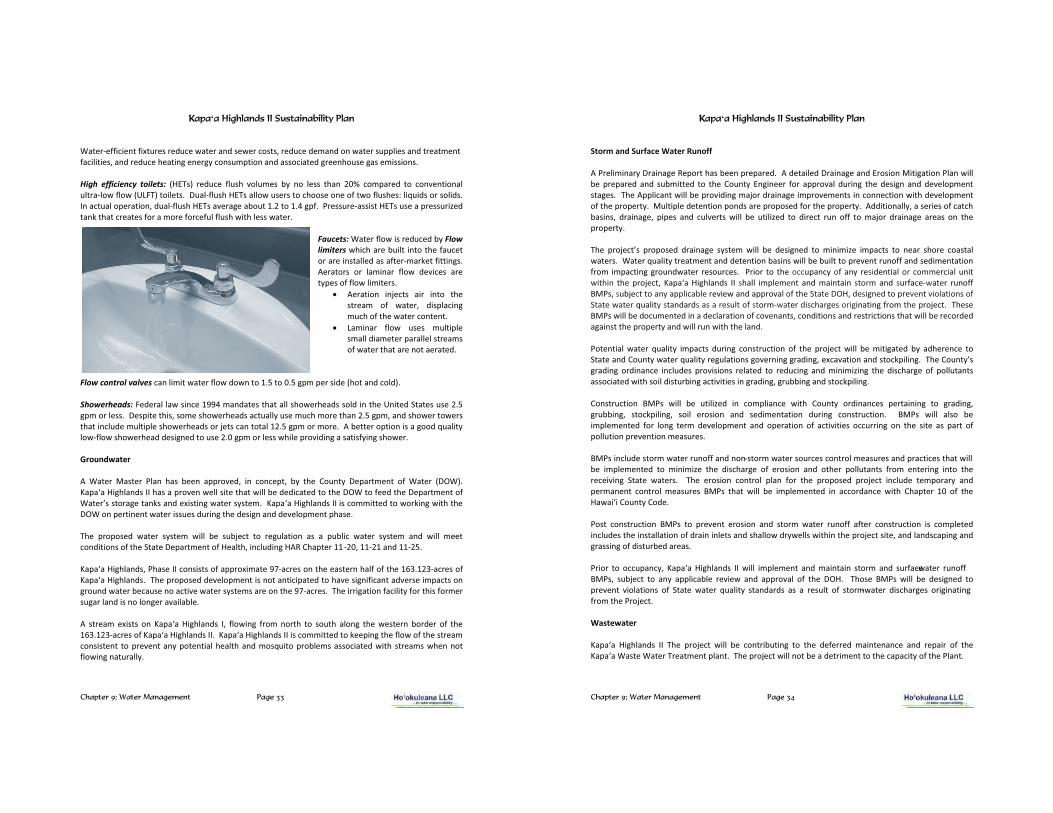
KKapa�a Highlands II Sustainability Plan
Chapter 9; Water Management Page 33
Water- ����� �����]�� �� *�� �!�� ���*�� ! ������Y *�� �* ���*����!�� �����%� ����*�� ��� �� ����%��� �Y���*� *�� �? ����@� � @+���������������* �������� *�@ �?��� �@��� ��������\ High efficiency toilets: {X}#�|� *�� � �%��?� ��%�� �� �+ ��� % ��� �?��� ���� ����� *� ��� ���� ������%�ultra-low �%�!�{���#|����% ��. Dual-�%��?�X}#� �%%�!��� ������?��� ��� �����!���%��? ���%�[��*��or ��%�*�\� ��������%��� �����Y�*��%-�%��?�X}#� �� �@ ��������\������\��@��\� Pressure-�������X}#���� ��� ����� *�tank that creates for a more forceful flush with less water.
Faucets: Wa� ��%�!���� *�� *��+�Flow limiters which are built into the faucet ��� ������%% *��� after-market fittings. z ����� �� %������ �%�!� * ��� �� � types of flow limiters.
� Aeration injects air into the �� ��� ��� !�� Y� *���%����@ much of the water content.
� Laminar flow uses multiple ���%%�*��� � ����%% % streams ���!�� ��?���� ������ �� *\
Flow control valves can limit water �%�!�*�!������\������\��@���� ���* �{?�����*���%*|\ Showerheads: � * �%�%�!����� ���������*�� ���?����%% �?�! ? �*����%*�����? ����� *����� ���� ��\��gpm or less. - ���� ��?��Y���� ��?�! ? �*�������%%+��� ����? �� ��?����\��@��Y���*��?�! ���! ���?������%�* ��%���% ��?�! ? �*����� �����������%���\��@������� \� z�� �� �������������@��*�[��%��+�low-�%�!��?�! ? �* * ��@� *������ ��\��@�����% ���!?�% �����*��@�� satisfying shower. Groundwater z� ��� � '��� � %��� ?��� � �� ����� *Y� ��� ���� ��Y� �+� �? � �����+� - ���� ��� ��� ��� {-��|\ Kapa���X�@?%��*� �� ?�������� ��! %%���� ��?���!�%%�� �* *���� *�����? �-���to fe *��? �- ���� ������Water’s storage tanks ��*� ]�����@�!�� ��+�� �. Kapa���X�@?%��*���� ���������� *����!�J��@�!��?��? �-������� ��� ���!�� ����� ��*���@��? �* ��@����*�* � %��� ����?�� \ #? � ����� *� !�� � �+�� �� !�%%� � � ���� ��� ��� @�%������ ��� � ���%��� !�� � �+�� �� ��*� !�%%� � �����*�����������? ����� �- ���� ������X �%�?Y����%�*��@�Xz>��?��� ������Y���������*������\�� Kapa���X�@?%��*�Y�?�� ��������������������]���� ���-acres on �? � ��� ��?�%������? ����\���-acres of Kapa���X�@?%��*�\� The ����� *�* � %��� ������������������� *����?�� ���@����������*� � ������������@���*�!�� �� ���� ��������� �!�� ��+�� ���� �����? ���-acres. The irrigation facility for this former ��@��%��*�������%��@ �����%��% \� A stream exists on Kapa��� X�@?%��*� �Y� �%�!��@� ���� ���?� ��� ����?� �%��@� �? � ! �� �� ��* � ��� �? ����\���-acres of Kapa���X�@?%��*� ��. Kapa���X�@?%��*���� ���������� *����J ���@��? ��%�!�����? ��� ���������� ��� ���� � �����+���� ����%�? �%�?���*����[��������% ����������� *�!��?� ��reams when not flowing naturally.
KKapa�a Highlands II Sustainability Plan
Chapter 9; Water Management Page 34
Storm and Surface Water Runoff z� %�����+�-����@ �> ����?���� ��� �� *\� z�* ���% *�-����@ ���*�}������'���@������%���!�%%�� � � �� *� ��*� ������� *� ��� �? � �����+� }�@�� � ��� ������%� *���@� �? � * ��@�� ��*� * �elopment stages. #? �z��%������!�%%�� �����*��@������*����@ ������ � ����������� ������!��?�* � %��� ���of the property. '�%���% �* � ���������*��� ������ *�����? ���� �+\� z**������%%+Y���� � ���f catch ������Y� *����@ Y� ��� � ��*� ��%� ��� !�%%� � � ���%�� *� ��� *� ��� ��� ���� ��� ����� *����@ � � ��� ��� �? �property. #? � ��� ����� ����� *� *����@ � �+�� �� !�%%� � � * ��@� *� ��� ������� � �������� ��� � �� �?� � ������%�waters. ��� �[��%��+�� ��� �����*�* � �������������!�%%�� ����%������ � �����������*�� *�� ������������ ��������@�@���*!�� � ���� �\ Prior to the occupancy of any resi* ����%�or commercial unit within the project, Kapa��� X�@?%��*�� �� shall impleme��� ��*� ��������� storm ��*� surface-water runoff BMPs, subject to any applicable �� !���*�������%�of the ���� �-�XY�* ��@� *�to prevent violations of State water quality s���*�*s as a result of storm-water *���?�@ ��originating from the project. These <'��!�%%�� �*���� �� *������* �%������������� �����Y����*���������*� �����������?���!�%%�� � ��* *��@�������? ���� �+���*�!�%%����!��?��? �%��*\ �� ����%� !�� � [��%��+� �������� *���@� ������������ ��� �? � ��� ��� !�%%� � � ����@�� *� �+� �*? �� � �� ���� ���*������+�!�� �[��%��+� @�%�������@�� ���@�@�*��@Y� ]�����������*�����J��%��@. The �����+���@�*��@� �*����� � ���%�* �� ���������� %�� *� ��� *����@� ��*� ���������@� �? � *���?�@ � �� pollutants �������� *�!��?����%�*�������@��������� �����@�*��@Y�@�����@���*�����J��%��@\ ������������ <'� !�%%� � � ���%�� *� ��� ����%���� � !��?� �����+� �*����� �� � ������@� ��� @�*��@Y @�����@Y� ����J��%��@Y� ���%� ������ ��*� � *�� �������� *���@� �����������. BMPs will also be imp% � �� *� ��� %��@� � �� * � %��� ��� ��*� �� ������ ��� �������� �� ������@� ��� �? � ��� � ��� ���� �� pollution prevention measures. <'�����%�* ������!�� ���������*����������!�� ����� �������%�� ��� ����*������� ���?���!�%%�� � ���% � �� *� ��� ������� � �? � *���?�@ � ��� ������ ��*� ��? � ��%%������� ���� �� ��@� ����� �? �receiving State waters. The erosion control plan for the p���� *� ��� ��� ���%�* � � ����+� ��* � ��� ��� �����%� � ��� �� <'�� �?��� !�%%� � � ���% � �� *� ��� ����*��� � !��?� �?��� � ��� ��� �? X�!����������+���* \ ���� ������������ <'�� ��� � � ��� ������ ��*� ����� !�� � ������ ��� � ������������ ��� ����% � * inclu* ���? ������%%���������*������% �����*��?�%%�!�*+! %%��!��?����? ���� ������ Y���*�%��*������@ ��*�@�����@����*����� *�� ��\ Prior to occupancy, Kapa��� X�@?%��*�� �� !�%%� ���% � ��� ��*� ��������� ����� ��*� ����� -water runoff <'�Y� ���� ��� ��� ��+� ���%����% � �� !� ��*� ������%� ��� �? � -�X. #?�� � <'�� !�%%� � � * ��@� *� �� � � ��� ���%������� ��� ���� � !�� � [��%��+� ����*�*�� ��� � result of storm�!�� � *���?�@ �� ��@������@ from the Project. Wastewater Kapa��� X�@?%��*�� �� #? � ��� ��� !�%%� � � ����������@� ��� �? � * � *� ����� ���� � ��*� ���� ��� �? �Kapa�a Waste Water Treatment plant. #? ���� ���!�%%������ ���* ��� �������? �capacity of the Plant.

KKapa�a Highlands II Sustainability Plan
Chapter 10; Energy Management Page 35
Energy Management
Pursuant to Chapter 344 (State Environmental Policy) and Chapter 226 (Hawai’i State Planning Act), HRS, all Kapa���X�@?%��*�� �� activities, buildings and grounds will be designed with a significant emphasis on energy conservation and efficiency. Efficient design practices and technologies will be the cornerstone of Kapa��� X�@?%��*�� ��’s design phase. Buildings within Kapa��� X�@?%��*�� �� will further comply with the County of Kaua’i Energy Conservation Code (Kaua’i
County Ordinance 890). Furthermore, solar water heaters will be utilized as made requisite under Section 196-6.5, HRS. Kapa���X�@?%��*���� !�%%����� �!��?������in regards to suggestions and proposals for customized demand-oriented management programs offering rebates for the installation of alternative energy efficient technologies and measures
Kaua�� Oahu State ' *��������� �{����| $55,723 $67,019 $63,741 Electricity Price (May 2011) 44.27 cents/kWh 30.1 cents/kWh -
Kapa��� X�@?%��*�� �� is committed to renewable energy and energy efficiently as ways to reduce environmental harm and self sufficiency. Kapa��� X�@?%��*�� �� will continue to improve programs and create new programs as the development is initiated. Residents of the State of Hawaii pay the highest electricit+��� ������? ���\��#? ��� �@ �z� ��������*���\��� ���QJ�?� �������\� � ��� �? � ���� ����X�!���Y���ahu currently has the lowest residential electricity rates, while Lana�i has the highest. Residential rates on Kaua��� �� �@ � � �! �� 40-45 cents/kWh. Hawaii %� �� ��� ����� *� ��%� ��� ����]���� %+� ���� ��� ���� ����%� % ������+� ��*������\� � #? � ��� �variation across the state is largely a result of difference in power plant efficiencies, power purchasing agreement and other infrastructure. #? �Kaua�����%��*����%��+����� ���� �{^����”) is the sole electric utility on Kaua��. ���� began serving the people of Kauai on November 1, 2002, when it purchased Kauai Electric from Connecticut-based Citizens Communications. ��������z� ������� ! ��� % ��������� ����e, but it’s by no means the only one. ������one of approximately 900 electric cooperatives serving electric consumers in 47 states. Like all ���� ���� �Y�������� �� ����������-for-profit organization that is owned and controlled by the people it serves. ������ � ���� ���Y���������� ��!��?��������������� % ������+������@������? ������@����imported fossil fuels. ���������? ����� �� @��%��� ���*��� *��? �� *���� � @+� ����� ��+��+� ������@��? ����� !�* � � @+�efficiency portfolio standard with a target of reducing energy consumption by 30% of forecasted energy consumption by 2030 (4,300 GWh) and beginning the process for separating efficiency from the existing renewable portfolio standard. Energy efficiency in homes and buildings
� Hawai‘i Revised Statutes section 46-��\�� [�� �� �%%� �����+� �@ ��� �� ��� �%�� � �� ^�����+� ���processing of permit applications for construction projects incorporating energy and environmental design building standards.”
KKapa�a Highlands II Sustainability Plan
Chapter 10; Energy Management Page 36
#�� *�� �� �� � @+���������������*�* ���*Y�Kapa���X�@?%��*���� will consider the implementation of % � ������� �? ����� *����� ��}������ ���%��� ������z@ ��+� {}z|�}� @+������@��`� ���%�*��@�efficient insulation, high performance windows, compact construction, efficient ventilation systems, and energy efficient lighting elements and appliances. Kapa���X�@?%��*���� will furthermore seek to harness energy conservations and technologies to facilitate the possibility of net energy metering in building design to empower residents and tenants to reduce their electricity costs and provide energy back to the grid. Energy conservation and efficiency measures will be implemented and emphasized where applicable in the design of Kapa���X�@?%��*����. Energy-efficiency technologies to be considered include:
¢ Solar energy for water heating ¢ Photovoltaic systems, fuel cells, biofuels and other renewable energy sources ¢ Optimal utilization of daytime sunlight ¢ High efficiency light fixtures ¢ Roof and wall insulation, radiant barriers and energy efficient windows ¢ Optimized air-flow ¢ �����%%���������? ��� �������������@ ¢ ��� %%�@ ������*������@��������* �����?�*��@Y�*���������%Y���*�? ��-mitigation � Portable solar lighting (i.e. parking lots)
A photovoltaic system that can generate up to 1.18 MW of electricity i�������� *����?�� �������? ������a X�@?%��*�� ��� ��\� � ���� �� ���� �� *� ����� ��� �@ � ��� ��� � %%� ��� ������� ��%��*� ���%��+� ���� ���� �electricity generated from the solar farm for 20 years. ^Creating more renewable energy alternatives is one of the most critical challenges we face,” Kauai Mayor Bernard Carvalho said at a dedication ceremony for the solar farm. #? ���� ����� �*���� ���� ��� ����������-acre property, and has 5,376 solar panels mounted on posts and piers. #? ���� %���� �@ �������12-feet off the ground.
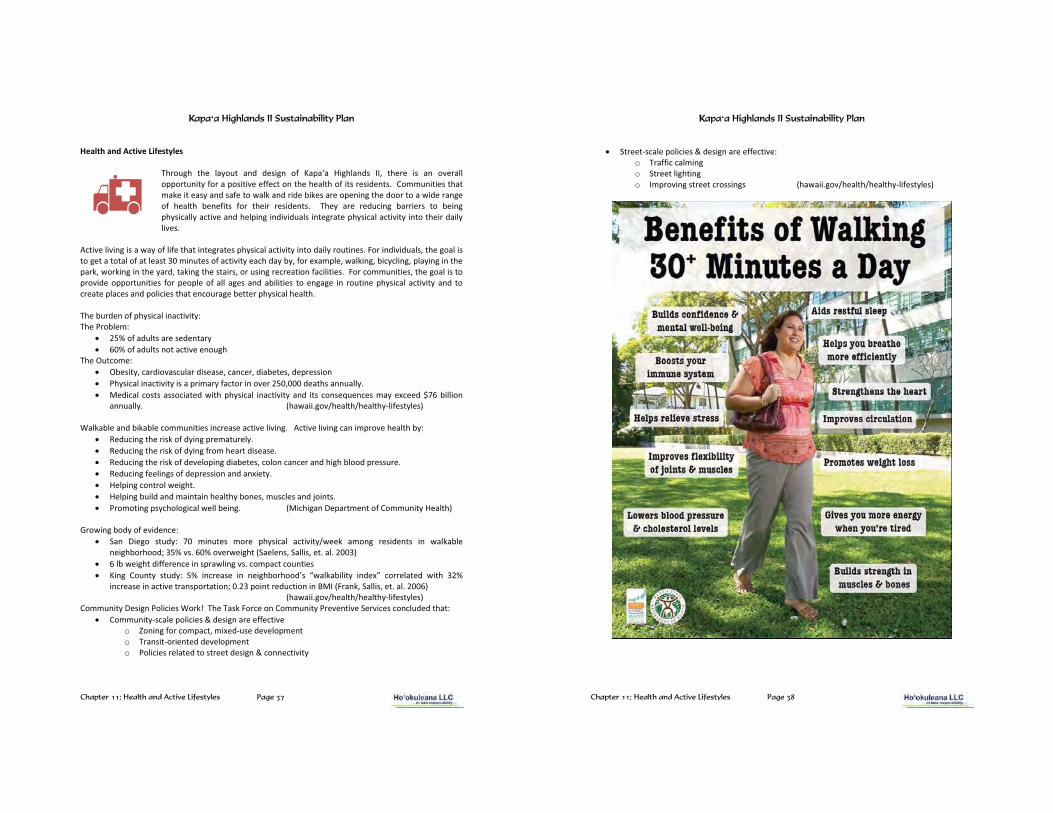
KKapa�a Highlands II Sustainability Plan
Chapter 11; Health and Active Lifestyles Page 37
Health and Active Lifestyles
Through the layout and design of Kapa�a Highlands II, there is an overall opportunity for a positive effect on the health of its residents. Communities that make it easy and safe to walk and ride bikes are opening the door to a wide range of health benefits for their residents. They are reducing barriers to being physically active and helping individuals integrate physical activity into their daily lives.
Active living is a way of life that integrates physical activity into daily routines. For individuals, the goal is to get a total of at least 30 minutes of activity each day by, for example, walking, bicycling, playing in the park, working in the yard, taking the stairs, or using recreation facilities. For communities, the goal is to provide opportunities for people of all ages and abilities to engage in routine physical activity and to create places and policies that encourage better physical health. The burden of physical inactivity: The Problem:
� 25% of adults are sedentary � 60% of adults not active enough
The Outcome: � Obesity, cardiovascular disease, cancer, diabetes, depression � Physical inactivity is a primary factor in over 250,000 deaths annually. � Medical costs associated with physical inactivity and its consequences may exceed $76 billion
annually. (hawaii.gov/health/healthy-lifestyles) Walkable and bikable communities increase active living. Active living can improve health by:
� Reducing the risk of dying prematurely. � Reducing the risk of dying from heart disease. � Reducing the risk of developing diabetes, colon cancer and high blood pressure. � Reducing feelings of depression and anxiety. � Helping control weight. � Helping build and maintain healthy bones, muscles and joints. � Promoting psychological well being. (Michigan Department of Community Health)
Growing body of evidence:
� San Diego study: 70 minutes more physical activity/week among residents in walkable neighborhood; 35% vs. 60% overweight (Saelens, Sallis, et. al. 2003)
� 6 lb weight difference in sprawling vs. compact counties � King County study: 5% increase in neighborhood’s “walkability index” correlated with 32%
increase in active transportation; 0.23 point reduction in BMI (Frank, Sallis, et. al. 2006) (hawaii.gov/health/healthy-lifestyles)
Community Design Policies Work! The Task Force on Community Preventive Services concluded that: � Community-scale policies & design are effective
o Zoning for compact, mixed-use development o Transit-oriented development o Policies related to street design & connectivity
KKapa�a Highlands II Sustainability Plan
Chapter 11; Health and Active Lifestyles Page 38
� Street-scale policies & design are effective: o Traffic calming o Street lighting o Improving street crossings (hawaii.gov/health/healthy-lifestyles)
KKapa�a Highlands II Sustainability Plan
Chapter 12; Education Page 39
Education
Schools servicing the project include Kapa�� Elementary, Kapa���'�**% ���?��%�and Kapa���X�@?���?��%\�� Kapa��� '�**% � ��?��%� ��* �� �? � ��� ��� ��� � ��� �? � ���?\� � Kapa��� }% � ���+�School and Kapa��� X�@?� ��?��%� �?� � �� ������� !?��?� ��� ����] imately 2-miles �����? ���� ������ \
Kapa���}% � ���+���?��%�� � ��@�*���-����*������ �����? �%�@ ��� % � ���+���?��%������? ����� \��It �?� �����������!��?��������X�@?���?��%\� ��������} lementary School’s capacity is 1,373 students, and the 2009/2010 scho�%�+ �� ��%%� ���!������ students (Department of Education, 2010a)\�� Kapa���'�**% �SchoolY�!��?�����%��� ������Y��� st�* ���Y�!����� � *�����������*�?������ ��%%� ������652 ���* ����{- ���� ������}*�������Y������|\� Kapa�� X�@? School currently ha�������* �����*+����� ��@��Y����!��?����������+�����Y��� (Department of }*�������Y������|\ #? ������ *���� ���!�%%�@ � �� ���� �� *�* ���*�������* ��� ��%%� ���!��?����? � @���\ Kapa���X�@?%��*�����!�%%����*���� �!��?��? �-�}���� ��� ��?����? �-�}�������%��+���� ��� �����%��+������������ ��������� %+��** �� *\ Additionally, ���\�-�� ���J� �������� *��*��� ��� ��� �? � ]�����@��������'�**% ���?��%\� �#? ���J�!�%%�have an area for the county’s proposed relocation of the Kapa’a county s!�����@� ���%\ Kapa���X�@?%��*�� ��� �%��� �%���� ��� * � %��� �� ��J Q!�%J��@� ���?� ���� �? � ����?� ��� �? � ��� �+� ��� �? � �������'�**% ���?��%��������%���� ���J��@���*�!�%J��@�����*��? �* � %��� ��\
�
KKapa�a Highlands II Sustainability Plan
Chapter 13; Housing Page 40
��Housing
Kapa���X�@?%��*���� �����! %%�%���� *����� ��%��� *���� �������? ���%��*���������� ��@ ���@�����+�?�����@�* ���*� ���� %���%���*� ��-��@���� ����%� �Y����! %%��������?� �� ���* ?�� �* ���*������ !� ���� ��!� �?��\ ����� *�����? ���**% �����? ���%��*Y��? ���� �������%�� ����? �� �� ����� ��%�+� �����*� �����������+Y��%����? ������Y�� ��? �Y��?�����@Y� � �����Y ��\ ������������ ��? �?���������!�������������*�� %�!��? �����?�%%������? �����������?�����?�� ������? ���%��*\�
#? ������ *�* � %��� ��Y��������X�@?%��*��?�� ���Y�!�%%����%�� ����-�� �����%��*�������@% -����%+���*���%��-����%+� ��* ����%���*����� ���%������ �\��- � %��� �������? ��� �+�!�%%��** ����������������? ���@���������* ���*��������*��% �?�����@�����? �����+����������Y�!��?������@��������%+���� ����@� � � �� �������� � ��% ������@�!�?\ Kapa���X�@?%��*���� !�%%� ����*������+��@��� ���������* ���*����?�����@�!��?��������� �+�����*��@���!�* ���@ ����?�����@����������� �����%���� ��������*��% �?�����@��%� ����� �\��Kapa���X�@?%��*���� !�%%�� J����� �� ���*�������������] *������ ���������+��%%�!��@���������%% % *������%�*�� ���+\ z���*��% �?�����@�* ���*�� ]?���� *��� ��@�����������!�*� � �*��� � �? � %���� � � �%� + ��\� > � �����J �����*� ��?�� ���*���� *����� ����?���@ �������@% -����%+�?�����@�����? �}������������ �\� �#? ��� ����� ��� �?��� * ���*� ��� ?�����@� !�%%� ������� � ��� ��� �� Y� �� ���%%+� ��� �? � � �� ��� ����*��% �?�����@\� �#? ������ *�* � %��� ���!�%%�������� ����%% ������@���� �����? ��� �������%+-��*-* ���*�� ��� ���������������� ���?�����@���J ���+�����*��@������ �+�����**������%�?�����@���*�������*����������� �����%��@-� ��%���%� ��* ���\�� #? � ��!��?��� %�����@� -������� ?��� ����������%� �������+� �� �**������%� ��* ����%� * � %��� ��Y� ���* ���� *� ��� � ������ �\�\�\�� {<��%*-���� z��%+���|� ��� �? � ������� � � �%� %��\� “���*�� � �����%+�* ��@��� *����������� ��������+ ������%+���* � %�� *����%�* ����� ��%���� *�� ��������Y�����?�����%�? ���>��*\� #?���� ��!���� �����%+�* ��@��� *���������'�] *��� ���*�����?�!����������� �� �����? �� !������*��� �'��\� �!� *����%+��+��? ����� ���*����%+��+�z����Q¯'<�{���������� ���|Y��?���^ ]��������� �_�����������?����% �*+��������*�� *��? ��������'�**% ��?��%\_ ��� �� ����� % �� � ��� �? � ���%�����Y� �? � %�����@� -� ���� !�� � ^� � � � !����@� ��� @ � �%� ������� ���#? � ����@ �� ������ � ������� ��� �� �*� ��-�� �� ��� ����� �� ��� �? � ����� *������\� #? � ����� *��� �*� ��� ��� ��� ��������� �!��?� �? ������+�������a������ � �%�%�����*�!�%%�����* ������������������*��% �?�����@\� z���*��% �?�����@� ������������� �� *����������Y� � ��!��?�����%%��@� �%� ���� ���J �� ��*� ��� ���?� �? � �����+� ��� @ � �%%+� �������� � ��� ��+� � ������� �?��� ����� �� �**������%�����*��% � ?�����@Y� ������%�%+� !? �� �����@����� ��� * � %�� *� ����� � ��Y� ���������� � ��*�������� ���!��?����� � �%�%��\_ Current Housing Stock #? �?�����@�����J�������������������%+����@% �����%+Y����Y�!��?������? *�?�����@���%+�������\ z���*������� �%%����@% -����%+�?�� ��� ����%�����%������� *�% ����?�����Y������\ #? ����*������������J��������� -����% � ��*� ���� % �� ?�%*\� ��� ��� �%��� ��%+� ���� �!� ������ *Y !��?� �? � ��%��� � ��� �? � ��������� ���-�!� *Y� ��? ������ ���%����%Y������������?�� % �� �����\� z�������������? ����*��������! ����%������ �����Y�!��?����������? � �������*��� + ������� �����@ \� ��������? ����*��������������� ��� �� *����Y�!��?��!��� *������� ���\
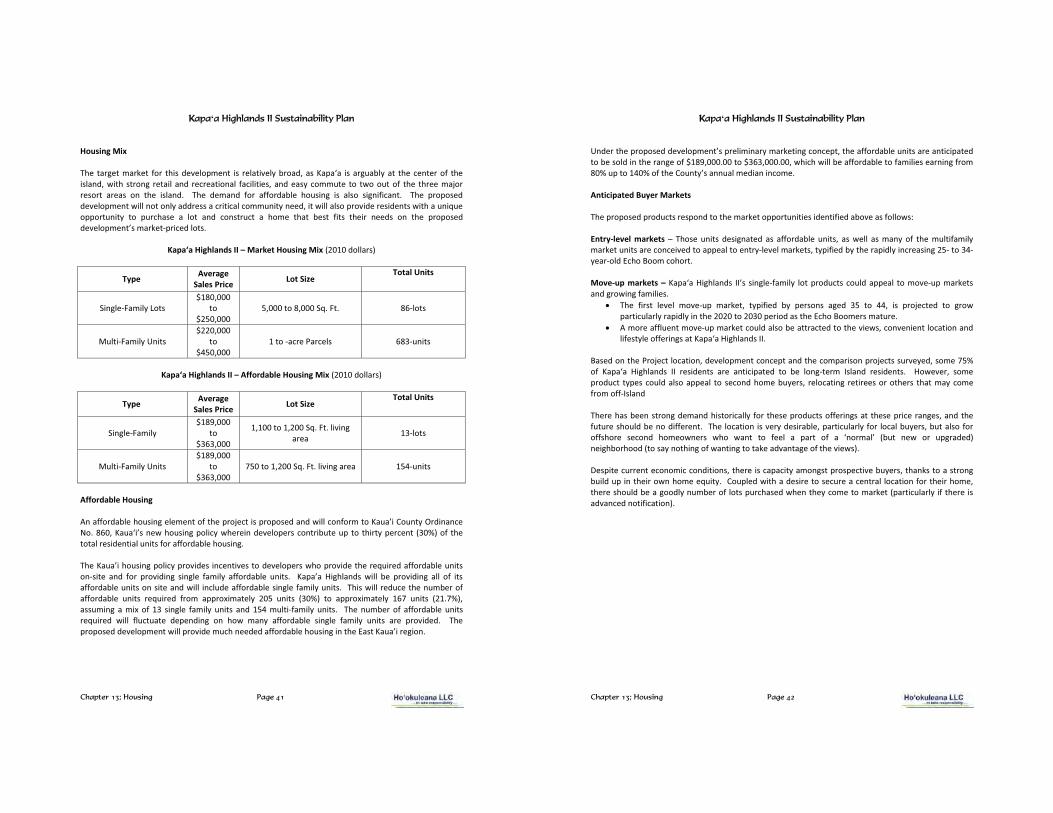
KKapa�a Highlands II Sustainability Plan
Chapter 13; Housing Page 41
Housing Mix #? ��@ ����J �� ��� �?���* � %��� ��� ��� %���� %+����*Y����������� ����@���%+���� �? � �� ���� �? ���%��*Y�!��?� ����@� ���%� ��*� � ������%� ����%��� �Y���*� ��+������� � ��� �!�������� �? � �? ������ ���� � ��� ��� �? � ��%��*\� #? � * ���*� ��� ����*��% � ?�����@� ��� �%��� ��@��������\� � #? � ����� *�* � %��� �� !�%%�������%+��** �����������%���������+�� *Y����!�%%��%�������* � ��* ����!��?������[� ����������+� ��� ���?�� � �� %��� ��*� ��������� �� ?�� � �?��� � ��� ����� �? �� � *�� ��� �? � ����� *�* � %��� �������J �-��� *�%���\
Kapaʻa Highlands II – Market Housing Mix {�����*�%%��|
Type Average Sales Price Lot Size
Total Units
���@% -F���%+ ���� ¬���Y���
���¬���Y���
�Y��������Y�����[\���\ ��-%���
'�%��-����%+������ ¬���Y����
���¬���Y���
�����-�� ��� %� ���-�����
Kapaʻa Highlands II – Affordable Housing Mix {�����*�%%��|
Type Average Sales Price Lot Size
Total Units
���@% -F���%+ ¬���Y���
���¬���Y���
�Y��������Y�����[\���\�%����@�� � ��-%���
'�%��-����%+������ ¬���Y���
���¬���Y���
��������Y��� �[\���\�%����@�� � ���-�����
Affordable Housing z������*��% �?�����@� % � �������? ���� ����������� *���*�!�%%�����������������������+��*����� ���\����Y����������� !�?�����@���%��+�!? ���* � %�� ���������� ������� �?��+�� � ��� {���|���� �? �����%� ��* ����%��������������*��% �?�����@\��� #? ��������?�����@���%��+�����* �� ��� ���� �����* � %�� ��!?������* ��? � [�� *�����*��% ���������-��� � ��*� ��� ����*��@� ���@% � ����%+� ����*��% � �����\� � ������� X�@?%��*�� !�%%� � � ����*��@� �%%� ��� ��������*��% ������������� ���*�!�%%� ���%�* �����*��% ����@% �����%+������\� �#?���!�%%� *�� ��? ����� ��������*��% � ������ [�� *� ���� ����]���� %+� ���� ������ {���|� ��� ����]���� %+� ���� ������ {��\��|Y��������@� �� ��]� ��� ��� ���@% � ����%+� ������ ��*� ���� ��%��-����%+� �����\� #? � ���� � ��� ����*��% � ������ [�� *� !�%%� �%������ � * � �*��@� ��� ?�!� ���+� ����*��% � ���@% � ����%+� ������ � � ����* *\� #? ������ *�* � %��� ���!�%%�����* ����?�� * *�����*��% �?�����@�����? �}����������� @���\
KKapa�a Highlands II Sustainability Plan
Chapter 13; Housing Page 42
��* ��? ������ *�* � %��� ������ %�����+���J ���@����� ��Y��? �����*��% �������� ���������� *����� ���%*�����? ���@ ����¬���Y���\������¬���Y���\��Y�!?��?�!�%%�� �����*��% ��������%� �� ����@������������������������? ������+��������%�� *��������� \ Anticipated Buyer Markets #? ������ *���*����� ����*�����? ���J ������������ ���* ����� *����� ������%%�!�� Entry-level markets – #?�� � ������ * ��@��� *� ��� ����*��% � �����Y� ��� ! %%� ��� ���+� ��� �? � ��%������%+���J ��������� ����� �� *������� �%���� ��+-% � %���J ��Y��+���� *��+��? ����*%+���� ����@���- �����-+ �-�%*�}�?��<������?��\ Move-up markets – Kapa���X�@?%��*�� ����� ���@% -����%+� %�����*����� ���%*���� �%� ������ -�����J �����*�@�!��@�����%� �\
� #? � ����� % � %� ��� -��� ��J �Y� �+���� *� �+� � ����� �@ *� ��� ��� ��Y� ��� ��� �� *� ��� @�!�������%�%+����*%+�����? ��������������� ��*�����? �}�?��<��� ������ \
� z��� ����%� ������ -�����J �����%*��%���� ������� *�����? ��� !�Y����� �� ���%����������*�%�� ��+% ���� ��@�����Kapa���X�@?%��*����\
<�� *�����? ��� ���%�������Y�* � %��� ������� �����*��? �������������� ������� + *Y���� �������� Kapa��� X�@?%��*�� �� ��* ���� � � ��������� *� ��� � � %��@-� �� ��%��*� ��* ���\ X�! � Y� ��� ���*���� �+� �����%*��%������ �%� ��� � ���*�?�� ���+ �Y� %������@� �� ������? �� �?�����+���� ��������-��%��* T? �?���� ������@�* ���*�?�������%%+� �� �? � ���*�������� ��@����� �? � ���� ���@ �Y���*��? ����� ��?��%*�� ����*��� ��\� #? � %�������� ���� + * ����% Y�������%�%+���� %���%���+ �Y������%����������?� � � ���*� ?�� �!� �� !?�� !���� ��� � % �� ���� ��� �� �����%�� {���� � !� �� ��@�* *|�� �@?��?��*�{�����+����?��@����!�����@������J �*�����@ �����? ��� !�|\ - ���� ��� ��� �����������*������Y��? �����������+�����@������� ���� ���+ �Y��?��J�����������@����%* �������? ���!��?�� � [���+\� ����% *�!��?���* �� ����� �� ���� ���%� %������������? ��?�� Y �? ��?��%*�� ���@��*%+����� ����%�������?�� *�!? ���? +���� ������J ��{������%�%+��� �? �����*���� *�������������|\

KKapa�a Highlands II Sustainability Plan
Chapter 14; Social Sustainability Page 43
Social Sustainability A community is composed of people, as well as places where they live; it is as much a social environment as a physical development. Thus, communities must not only be environmentally sustainable, they must also be socially sustainable. A socially sustainable development supports more equitable distribution of resources, supports diversity within the community, meets the basic needs of
residents and invests in social and human capital, thereby sustaining the quality of life and community livability for all residents into the future. Socially sustainable development includes the following:
� recognizes, respects and values cultural and social diversity;
� preserve and maintains a high quality of life for all of its residents;
� meets basic needs of food, shelter, education, work, income and safe living and working;
� is equitable, ensuring that the benefits of development are distributed fairly across society;
� promotes education, creativity and the development of human potential;
� preserves our cultural and biological heritage, thus strengthening our sense of connectedness to our history and environment;
� is democratic, promoting citizen participation and involvement;
� promotes the context of “Live Aloha,” with people living together harmoniously and in mutual support and respect for each other
We saved the concept of Social Sustainability for the end of the analysis, to serve as a summary of the many socially-focused actions suggested in prior sections of this Sustainability Plan. Following are just a few of the issues previously mentioned:
� Affordable housing will be incorporated within the development, allowing for a diversity and mix of housing types and options
� Complete streets with walkways and bile lanes, allowing for slow movement through the neighborhoods for easy social interaction
� Space for the relocated County swimming pool
� Allocation for commercial spaces, affording project residents the opportunity to work near where they live
� Proximity to the Middle School affords multi-generation al interaction and learning
� Cooperation with the State by making land available for the Kapa‘a Bypass Road, helping regional residents
� Project layout and design will create an opportunity for both residents and the community to have a positive effect on their health through walkable and bikable transportation options.
� Consistency with long range planning documents, implementing the community’s vision for the future
Exhibit C
Kapaʻa Highlands Agricultural Master Plan


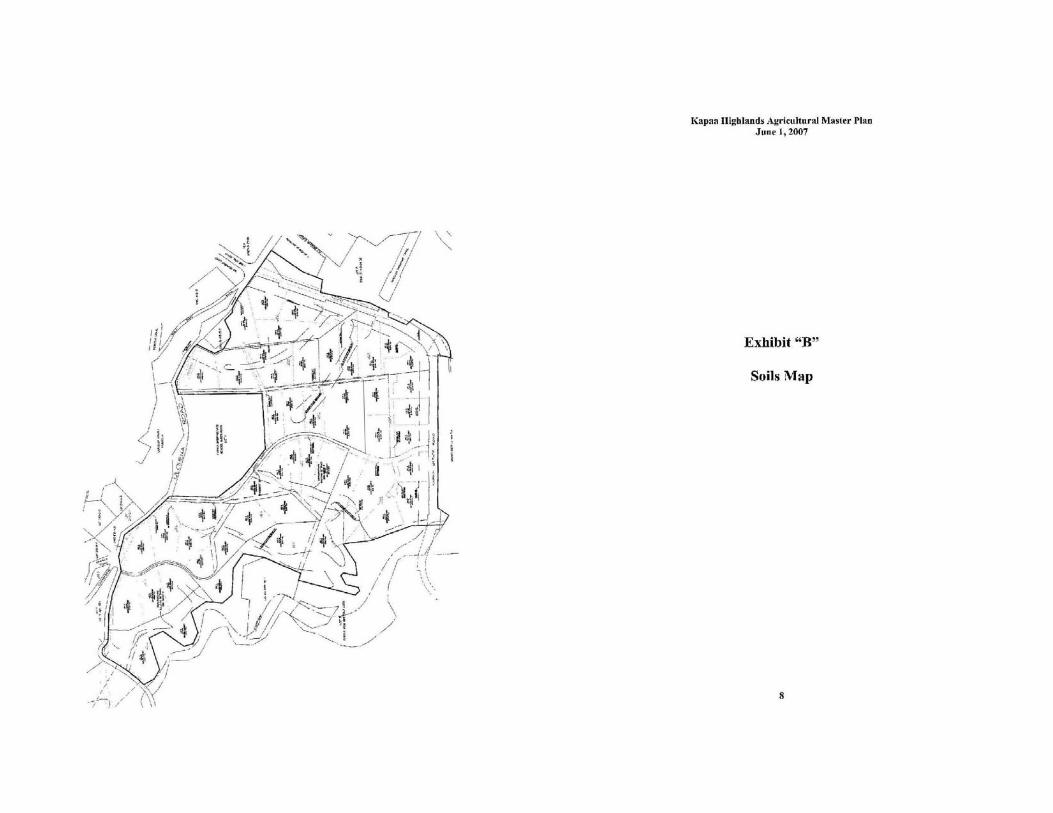
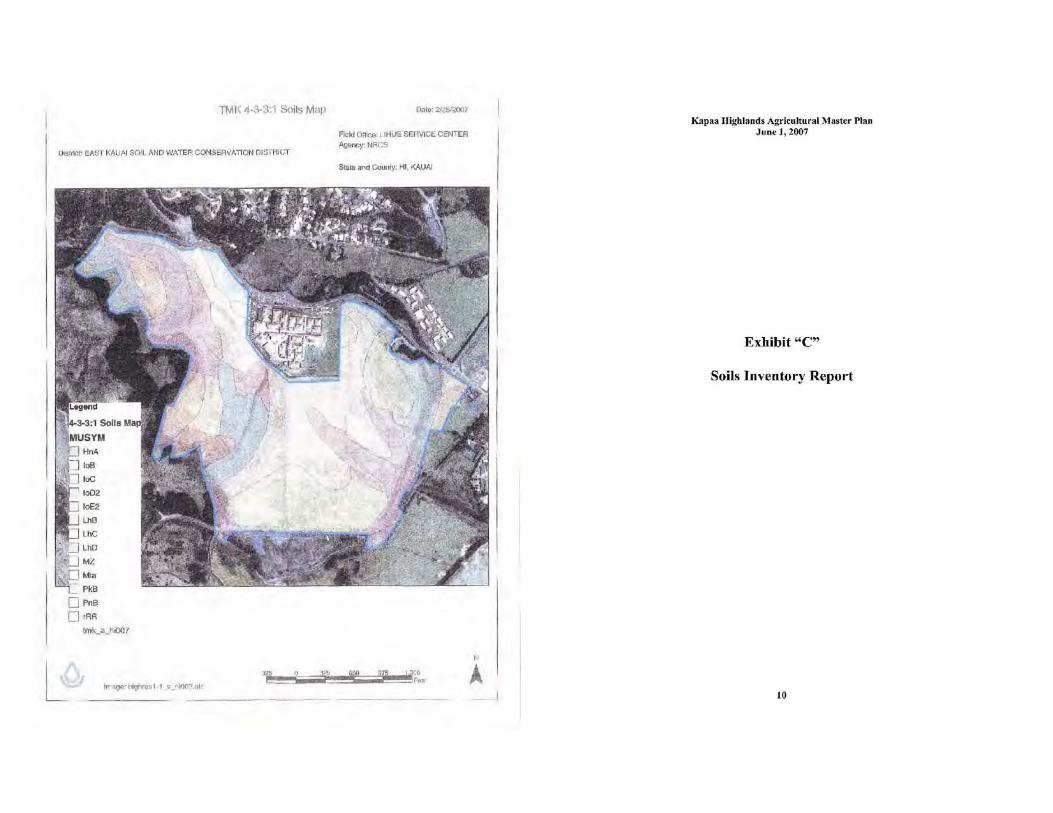


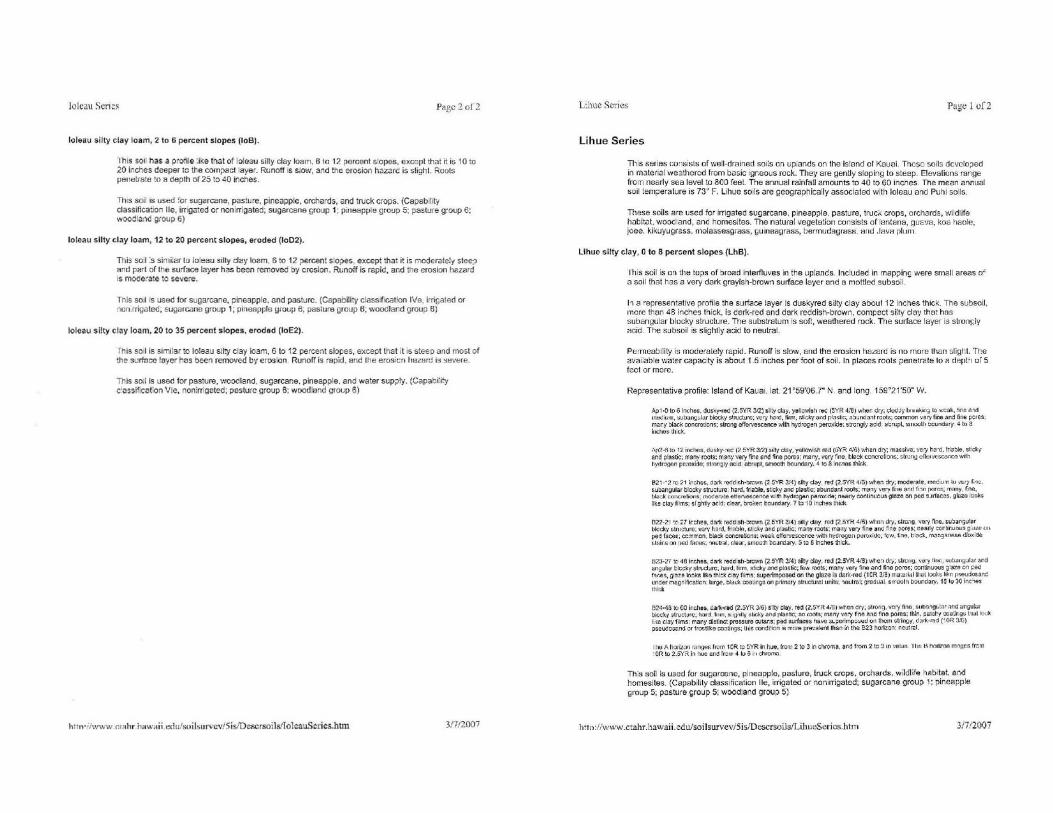


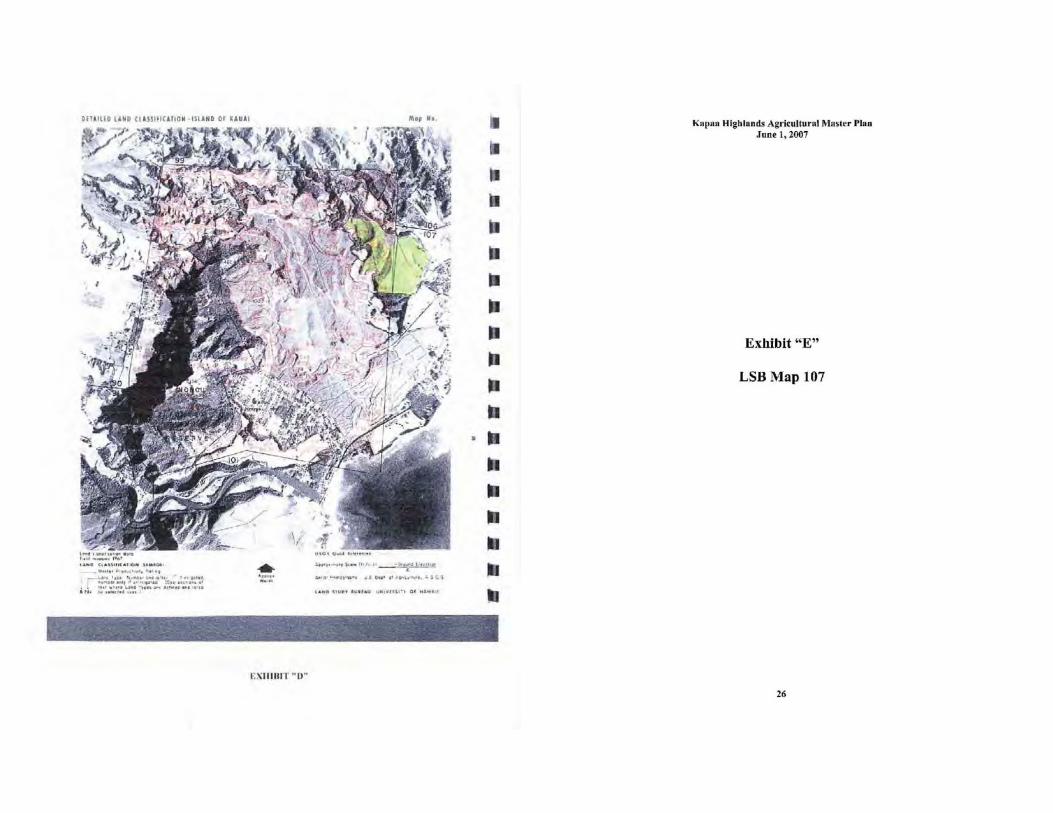
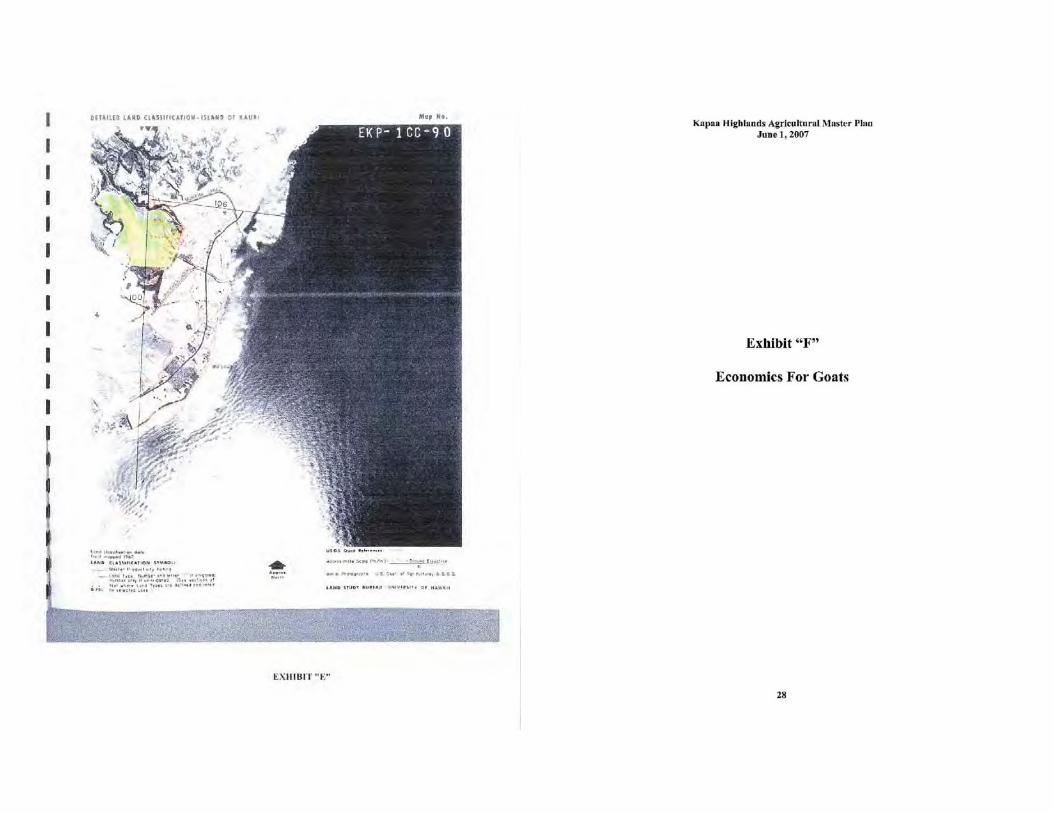
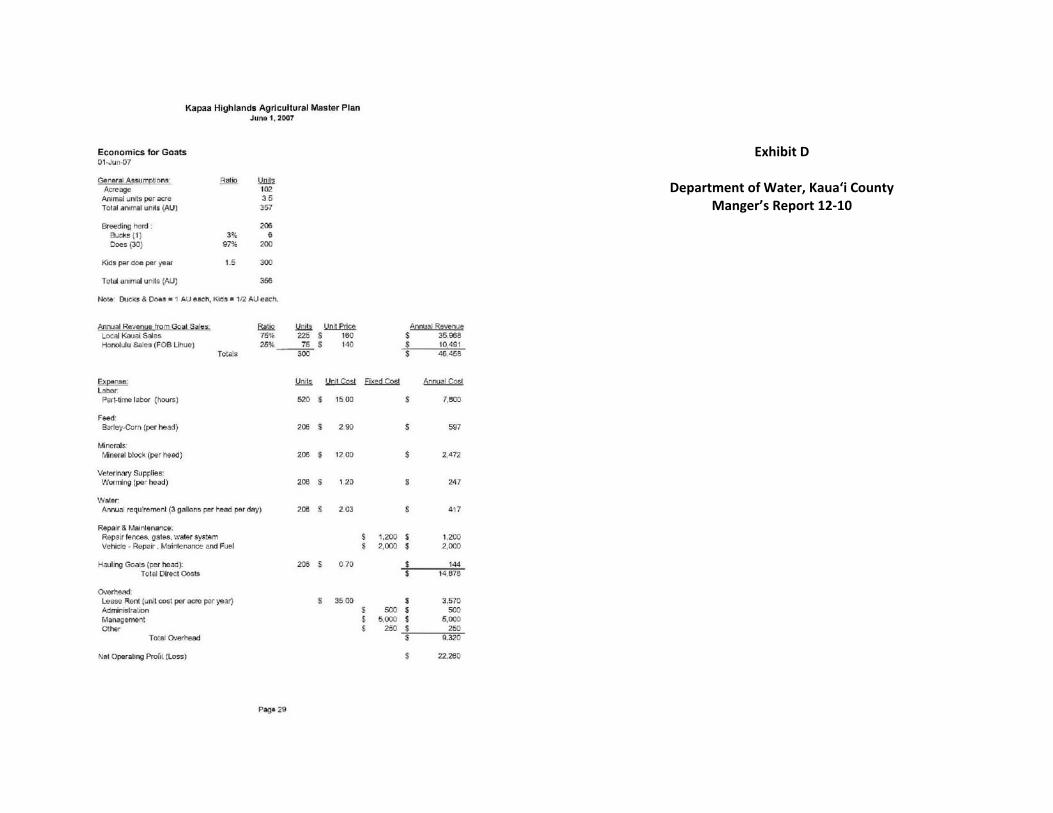
Exhibit D
Department of Water, Kauaʻi County Manger’s Report 12-10

Exhibit E
Irrigation Supply For the Kapaʻa Highlands Agricultural Subdivision
Water Master Plan

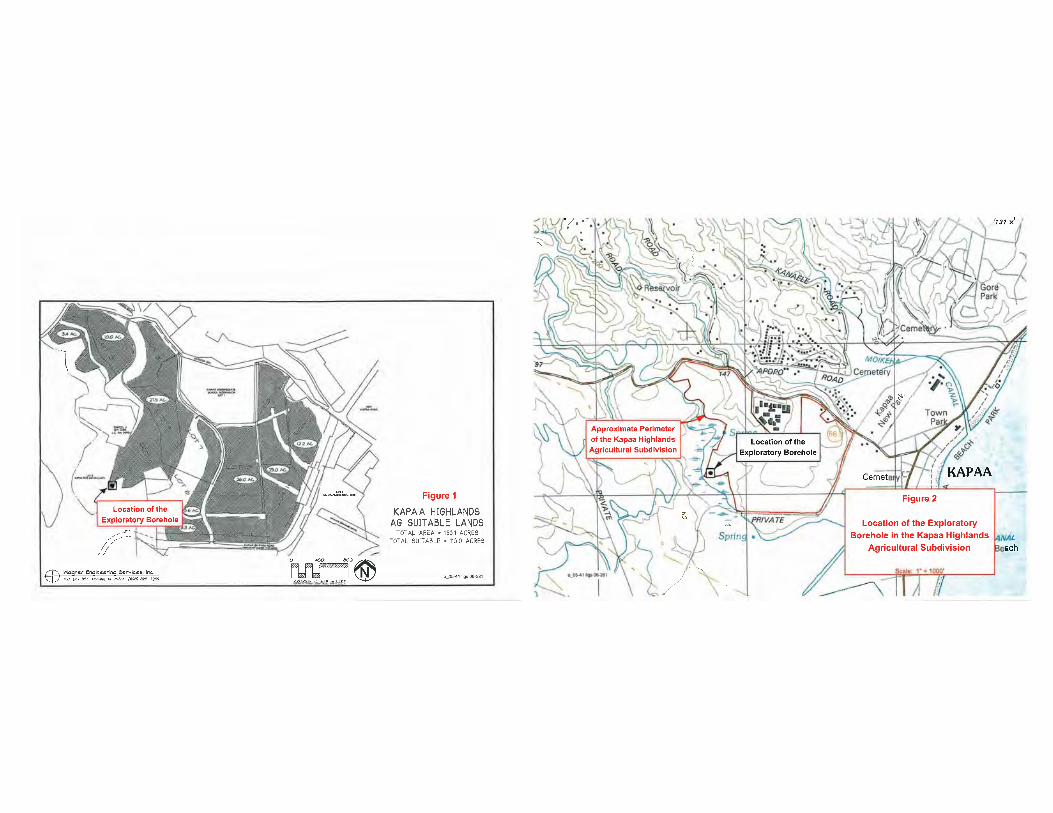
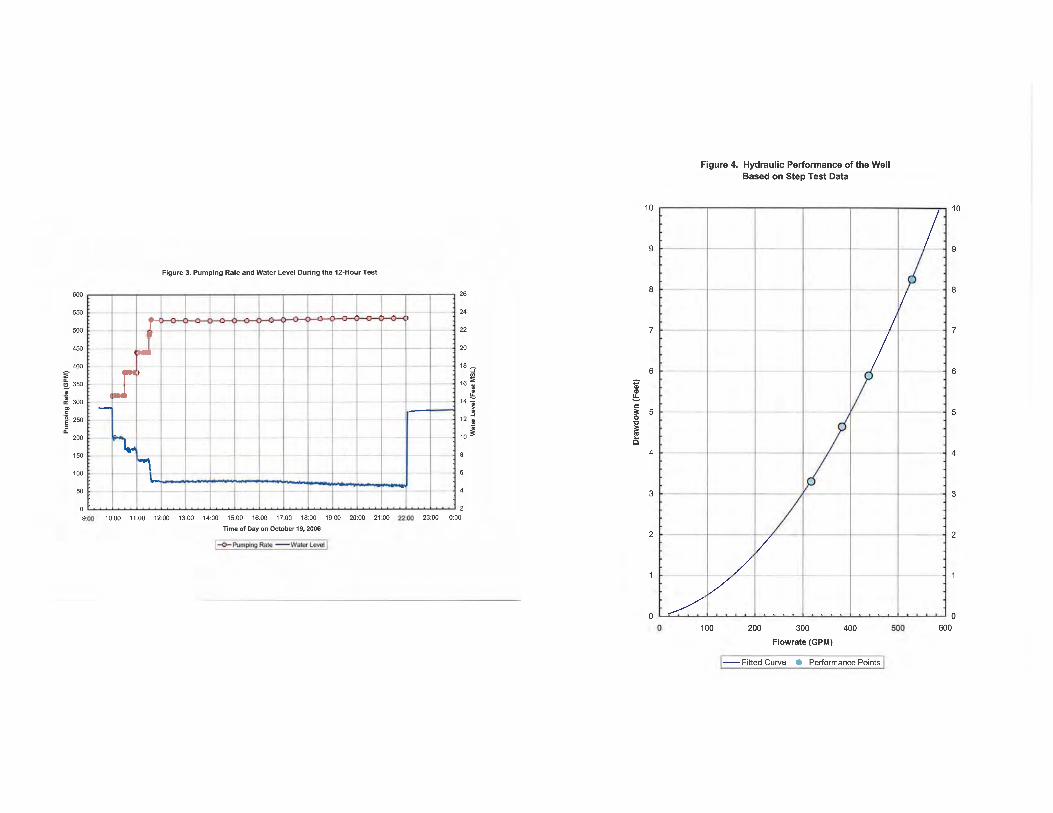

������
Exhibit�E���Part�2��
Private�Water�System�


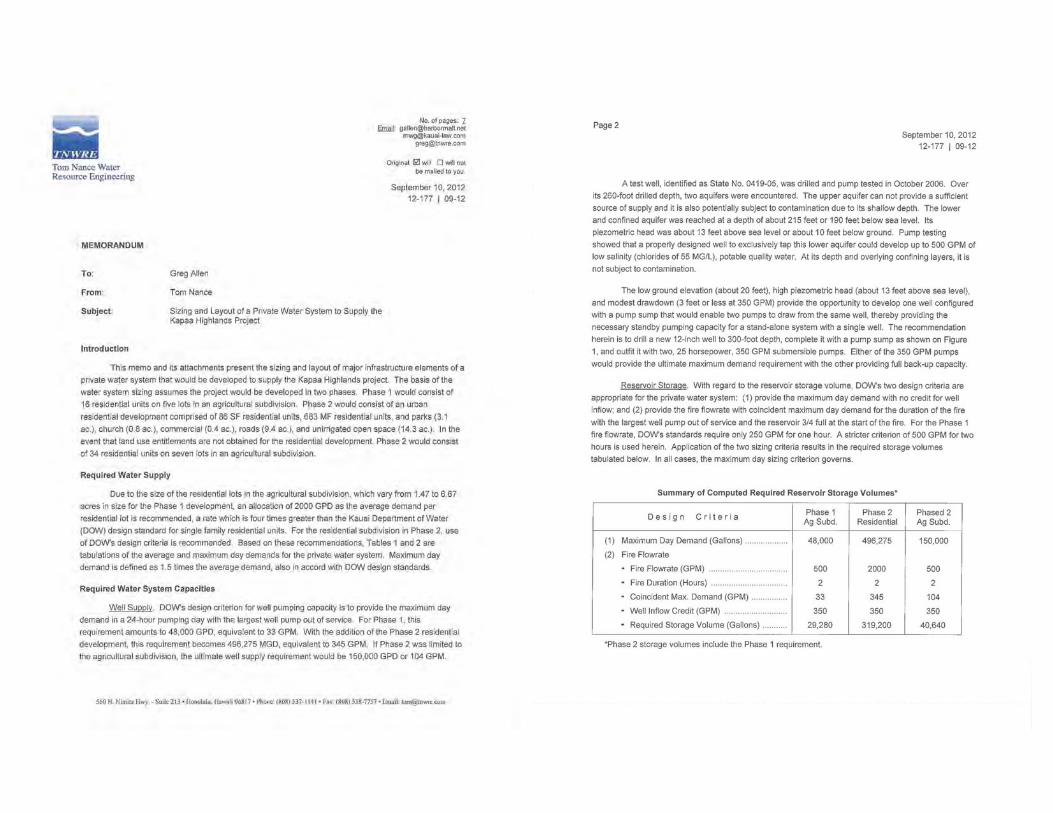

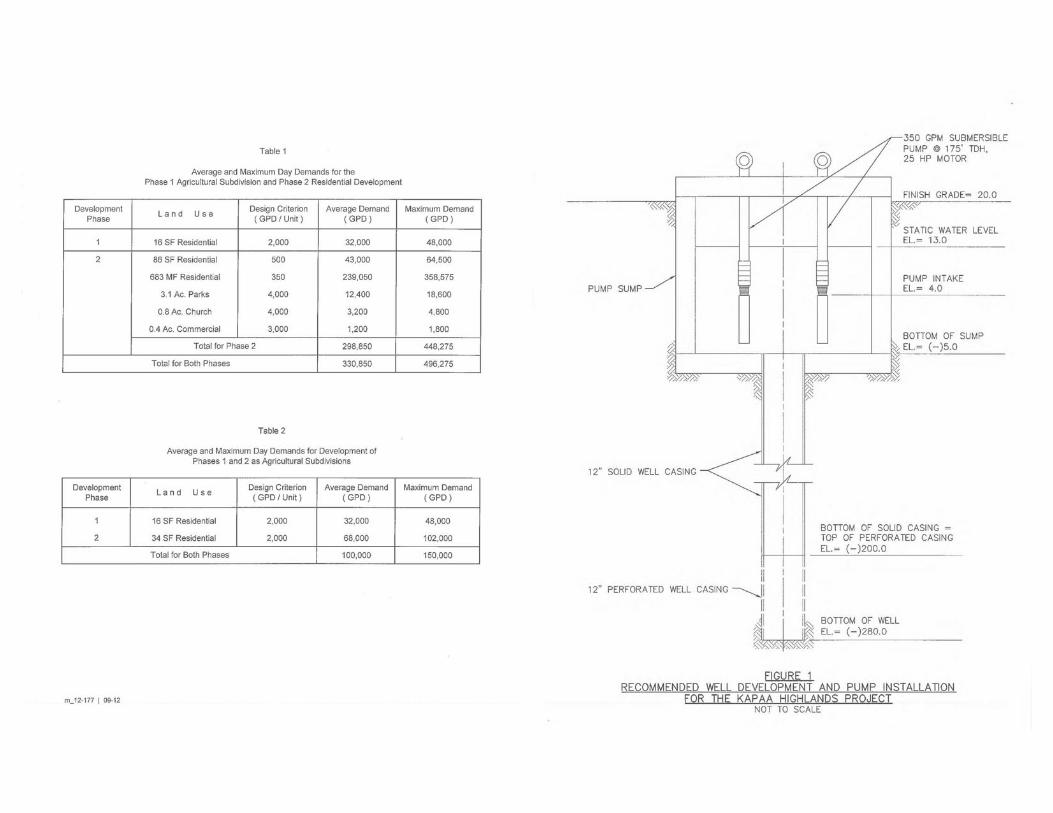


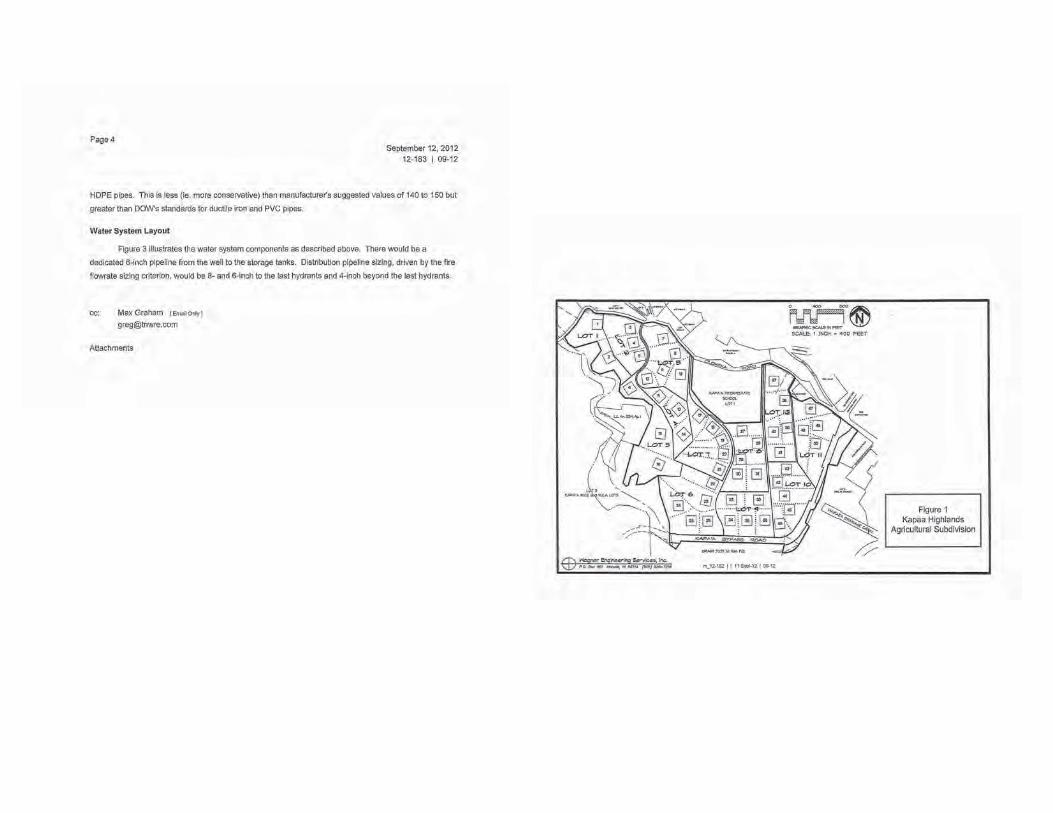
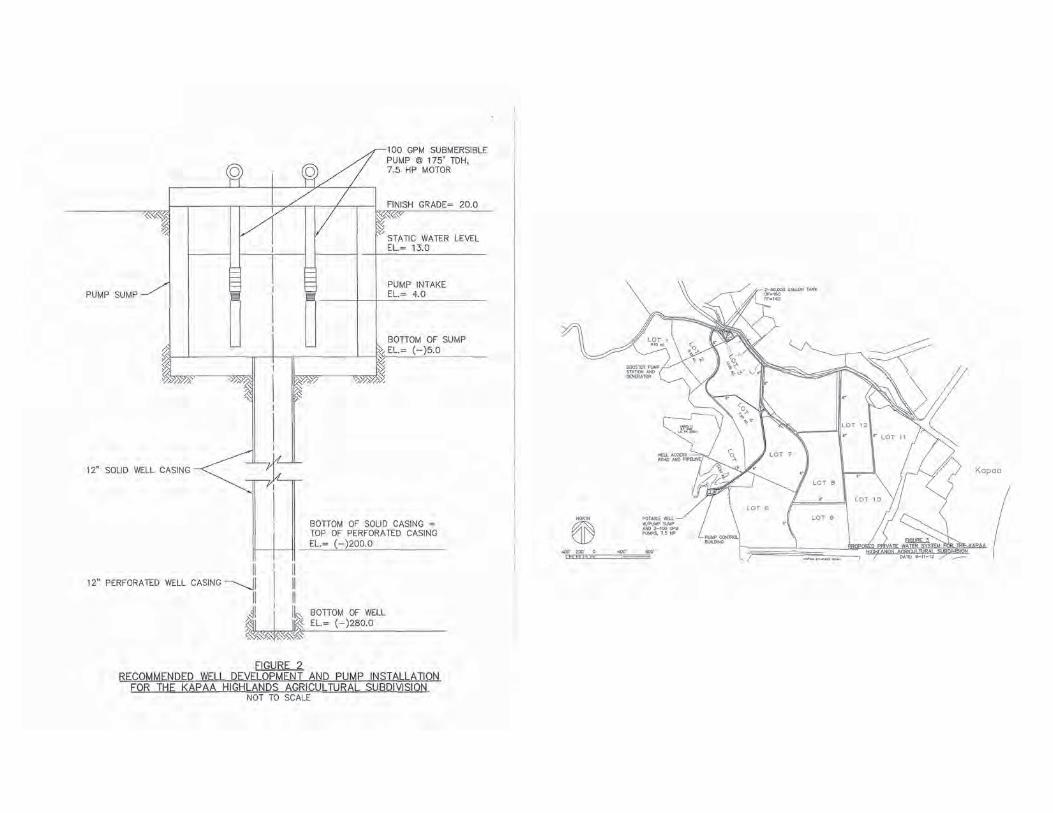

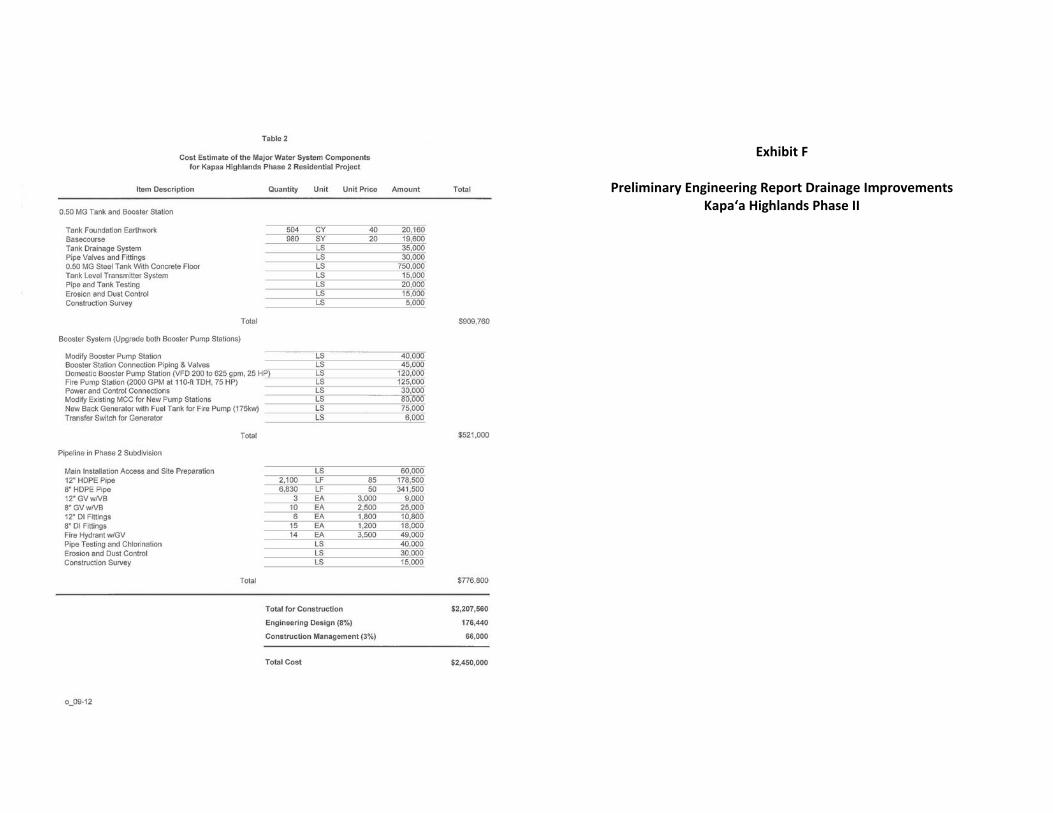
Exhibit F
Preliminary Engineering Report Drainage Improvements Kapaʻa Highlands Phase II
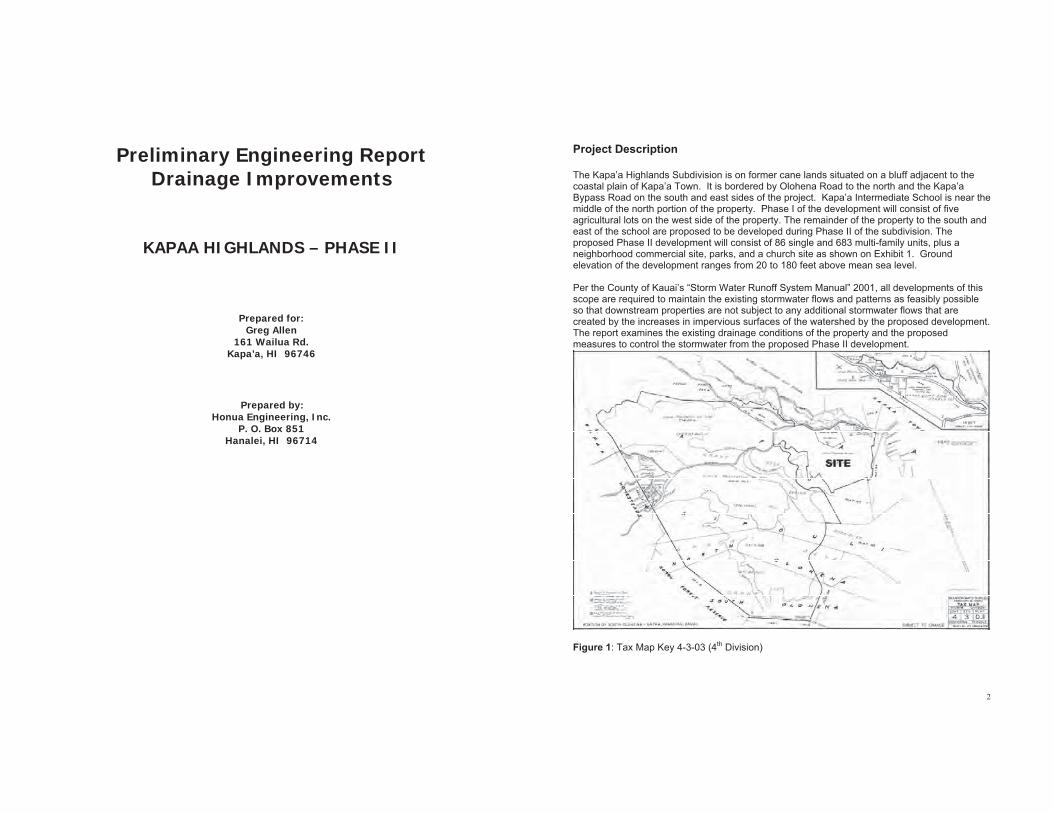
Preliminary Engineering Report Drainage Improvements
KAPAA HIGHLANDS – PHASE II
Prepared for: Greg Allen
161 Wailua Rd. Kapa’a, HI 96746
Prepared by: Honua Engineering, Inc.
P. O. Box 851 Hanalei, HI 96714
2
Project Description
The Kapa’a Highlands Subdivision is on former cane lands situated on a bluff adjacent to the coastal plain of Kapa’a Town. It is bordered by Olohena Road to the north and the Kapa’a Bypass Road on the south and east sides of the project. Kapa’a Intermediate School is near the middle of the north portion of the property. Phase I of the development will consist of five agricultural lots on the west side of the property. The remainder of the property to the south and east of the school are proposed to be developed during Phase II of the subdivision. The proposed Phase II development will consist of 86 single and 683 multi-family units, plus a neighborhood commercial site, parks, and a church site as shown on Exhibit 1. Ground elevation of the development ranges from 20 to 180 feet above mean sea level.
Per the County of Kauai’s “Storm Water Runoff System Manual” 2001, all developments of this scope are required to maintain the existing stormwater flows and patterns as feasibly possible so that downstream properties are not subject to any additional stormwater flows that are created by the increases in impervious surfaces of the watershed by the proposed development. The report examines the existing drainage conditions of the property and the proposed measures to control the stormwater from the proposed Phase II development.
Figure 1: Tax Map Key 4-3-03 (4th Division)
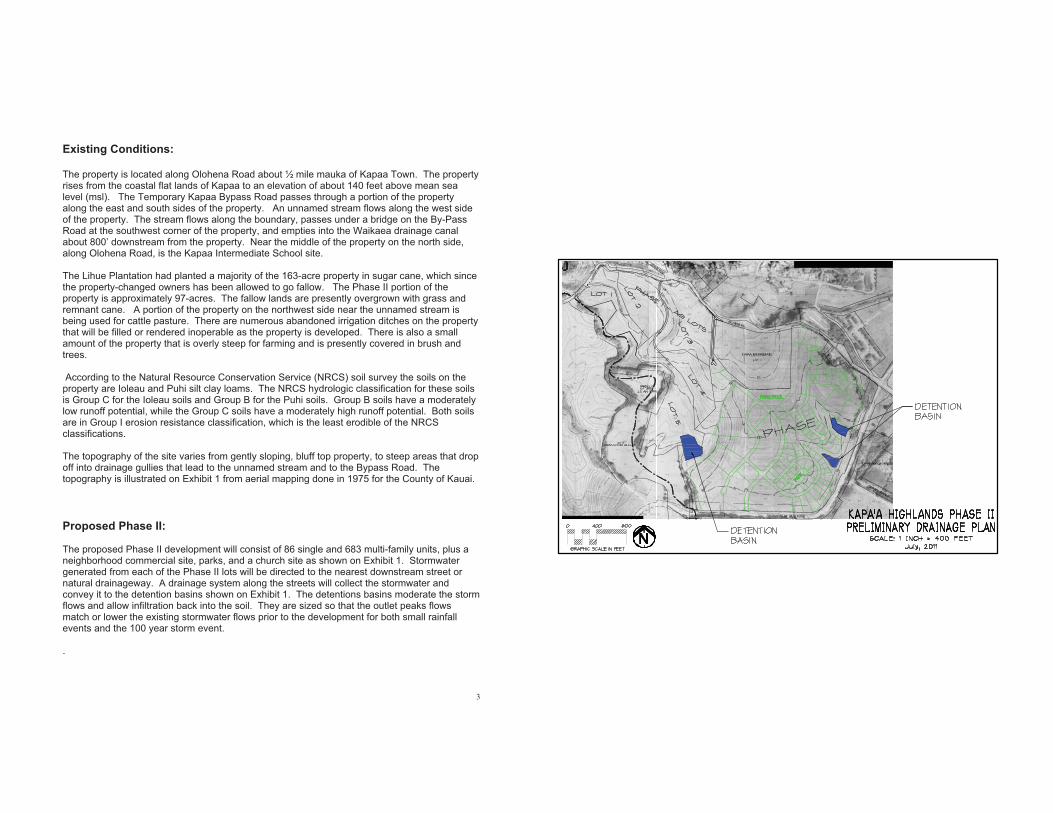
3
Existing Conditions:
The property is located along Olohena Road about ½ mile mauka of Kapaa Town. The property rises from the coastal flat lands of Kapaa to an elevation of about 140 feet above mean sea level (msl). The Temporary Kapaa Bypass Road passes through a portion of the property along the east and south sides of the property. An unnamed stream flows along the west side of the property. The stream flows along the boundary, passes under a bridge on the By-Pass Road at the southwest corner of the property, and empties into the Waikaea drainage canal about 800’ downstream from the property. Near the middle of the property on the north side, along Olohena Road, is the Kapaa Intermediate School site.
The Lihue Plantation had planted a majority of the 163-acre property in sugar cane, which since the property-changed owners has been allowed to go fallow. The Phase II portion of the property is approximately 97-acres. The fallow lands are presently overgrown with grass and remnant cane. A portion of the property on the northwest side near the unnamed stream is being used for cattle pasture. There are numerous abandoned irrigation ditches on the property that will be filled or rendered inoperable as the property is developed. There is also a small amount of the property that is overly steep for farming and is presently covered in brush and trees.
According to the Natural Resource Conservation Service (NRCS) soil survey the soils on the property are Ioleau and Puhi silt clay loams. The NRCS hydrologic classification for these soils is Group C for the Ioleau soils and Group B for the Puhi soils. Group B soils have a moderately low runoff potential, while the Group C soils have a moderately high runoff potential. Both soils are in Group I erosion resistance classification, which is the least erodible of the NRCS classifications.
The topography of the site varies from gently sloping, bluff top property, to steep areas that drop off into drainage gullies that lead to the unnamed stream and to the Bypass Road. The topography is illustrated on Exhibit 1 from aerial mapping done in 1975 for the County of Kauai.
Proposed Phase II:
The proposed Phase II development will consist of 86 single and 683 multi-family units, plus a neighborhood commercial site, parks, and a church site as shown on Exhibit 1. Stormwater generated from each of the Phase II lots will be directed to the nearest downstream street or natural drainageway. A drainage system along the streets will collect the stormwater and convey it to the detention basins shown on Exhibit 1. The detentions basins moderate the storm flows and allow infiltration back into the soil. They are sized so that the outlet peaks flows match or lower the existing stormwater flows prior to the development for both small rainfall events and the 100 year storm event.
.

Exhibit G
Preliminary Engineering Report Wastewater Improvements Kapaʻa Highlands Phase II
July 11, 2011 Project No: 1892
Preliminary Engineering Report Wastewater Improvements
KAPAA HIGHLANDS – PHASE II
Prepared for: Greg Allen
161 Wailua Rd. Kapa’a, HI 96746
Prepared by: Honua Engineering, Inc.
P. O. Box 851 Hanalei, HI 96714
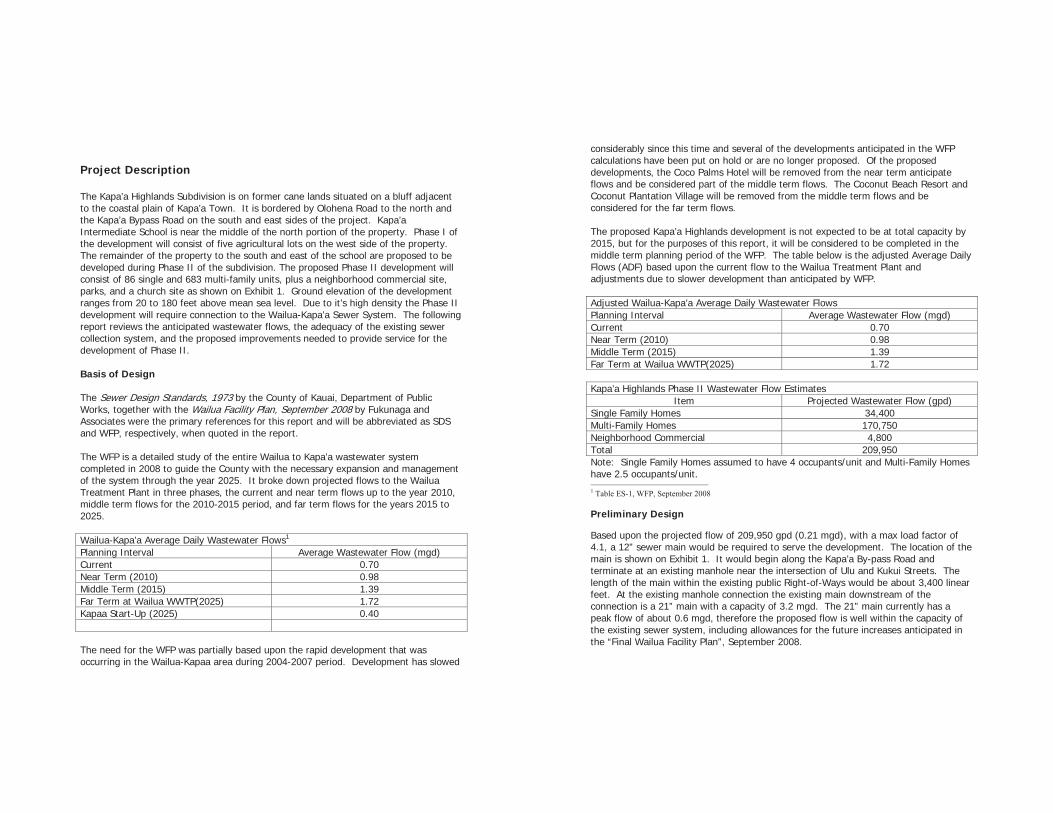
Project Description
The Kapa’a Highlands Subdivision is on former cane lands situated on a bluff adjacent to the coastal plain of Kapa’a Town. It is bordered by Olohena Road to the north and the Kapa’a Bypass Road on the south and east sides of the project. Kapa’a Intermediate School is near the middle of the north portion of the property. Phase I of the development will consist of five agricultural lots on the west side of the property. The remainder of the property to the south and east of the school are proposed to be developed during Phase II of the subdivision. The proposed Phase II development will consist of 86 single and 683 multi-family units, plus a neighborhood commercial site, parks, and a church site as shown on Exhibit 1. Ground elevation of the development ranges from 20 to 180 feet above mean sea level. Due to it’s high density the Phase II development will require connection to the Wailua-Kapa’a Sewer System. The following report reviews the anticipated wastewater flows, the adequacy of the existing sewer collection system, and the proposed improvements needed to provide service for the development of Phase II.
Basis of Design
The Sewer Design Standards, 1973 by the County of Kauai, Department of Public Works, together with the Wailua Facility Plan, September 2008 by Fukunaga and Associates were the primary references for this report and will be abbreviated as SDS and WFP, respectively, when quoted in the report.
The WFP is a detailed study of the entire Wailua to Kapa’a wastewater system completed in 2008 to guide the County with the necessary expansion and management of the system through the year 2025. It broke down projected flows to the Wailua Treatment Plant in three phases, the current and near term flows up to the year 2010, middle term flows for the 2010-2015 period, and far term flows for the years 2015 to 2025.
Wailua-Kapa’a Average Daily Wastewater Flows1
Planning Interval Average Wastewater Flow (mgd) Current 0.70 Near Term (2010) 0.98Middle Term (2015) 1.39Far Term at Wailua WWTP(2025) 1.72Kapaa Start-Up (2025) 0.40
The need for the WFP was partially based upon the rapid development that was occurring in the Wailua-Kapaa area during 2004-2007 period. Development has slowed
considerably since this time and several of the developments anticipated in the WFP calculations have been put on hold or are no longer proposed. Of the proposed developments, the Coco Palms Hotel will be removed from the near term anticipate flows and be considered part of the middle term flows. The Coconut Beach Resort and Coconut Plantation Village will be removed from the middle term flows and be considered for the far term flows.
The proposed Kapa’a Highlands development is not expected to be at total capacity by 2015, but for the purposes of this report, it will be considered to be completed in the middle term planning period of the WFP. The table below is the adjusted Average Daily Flows (ADF) based upon the current flow to the Wailua Treatment Plant and adjustments due to slower development than anticipated by WFP.
Adjusted Wailua-Kapa’a Average Daily Wastewater Flows Planning Interval Average Wastewater Flow (mgd) Current 0.70 Near Term (2010) 0.98Middle Term (2015) 1.39Far Term at Wailua WWTP(2025) 1.72
Kapa’a Highlands Phase II Wastewater Flow Estimates Item Projected Wastewater Flow (gpd)
Single Family Homes 34,400Multi-Family Homes 170,750Neighborhood Commercial 4,800Total 209,950 Note: Single Family Homes assumed to have 4 occupants/unit and Multi-Family Homes have 2.5 occupants/unit. 1 Table ES-1, WFP, September 2008
Preliminary Design
Based upon the projected flow of 209,950 gpd (0.21 mgd), with a max load factor of 4.1, a 12” sewer main would be required to serve the development. The location of the main is shown on Exhibit 1. It would begin along the Kapa’a By-pass Road and terminate at an existing manhole near the intersection of Ulu and Kukui Streets. The length of the main within the existing public Right-of-Ways would be about 3,400 linear feet. At the existing manhole connection the existing main downstream of the connection is a 21” main with a capacity of 3.2 mgd. The 21” main currently has a peak flow of about 0.6 mgd, therefore the proposed flow is well within the capacity of the existing sewer system, including allowances for the future increases anticipated in the “Final Wailua Facility Plan”, September 2008.
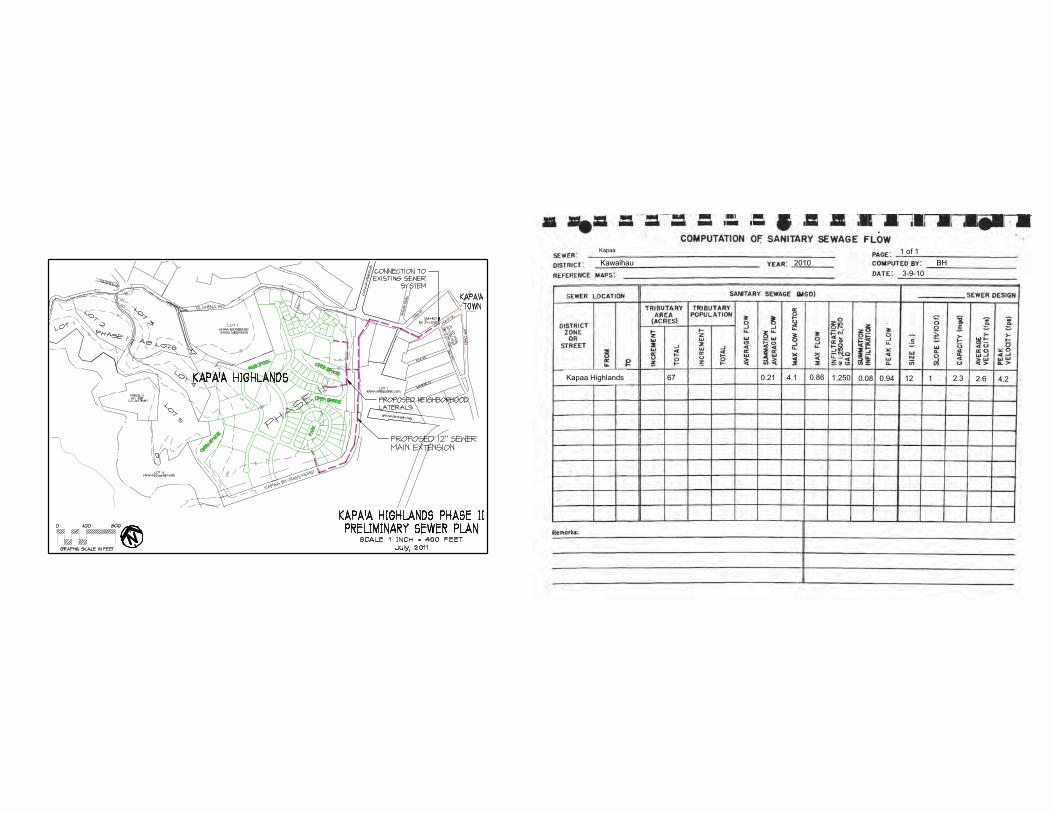
Kapaa
Kawaihau 20101 of 1
BH3-9-10
Kapaa Highlands 0.21 4.1 0.86 1,250 0.08 0.9467 12 1 2.3 4.22.6

Exhibit H
Traffic Impact Assessment Report Kapa’a Highlands Subdivision
Kapa’a, Kauaʻi, Hawaiʻi TMK: (4) 4-3-03:01
Phillip Rowell and Associates47-273 ‘D’ Hui Iwa Street Kaneohe, Hawaii 96744 Phone: (808) 239-8206 FAX: (808) 239-4175 Email:[email protected]
December 9, 2013
Mr. Greg AllenKapa’a Highlands161 Wailua RoadKapa’a Hawaii 96746
Re: Traffic Impact Assessment Report Kapa’a Highlands SubdivisionKapa’a, Kauai, HawaiiTMK: (4) 4-3-03:01
Phillip Rowell and Associates have completed the following Traffic Impact Assessment Report(TIAR) for Kapa’a Highlands Subdivision. The report is presented in the following format:
A. Project Location and DescriptionB. Purpose and Objective of StudyC. Study ApproachD. Description of Existing Streets and Intersection ControlsE. Existing Peak Hour Traffic VolumesF. Public TransportationG. Level-of-Service ConceptH. Existing Levels-of-ServiceJ. Background Traffic ProjectionsK. Project Trip GenerationL. Background Plus Project ProjectionsM. Traffic Impact AssessmentN. Project Road SystemO. Other Traffic Related IssuesP. Summary and Recommendations
A. Project Location and Description
1. The proposed project is located west of Kapa’a Town and adjacent to Kapa’a IntermediateSchool, generally in the southwest quadrant of the intersection of Olohena Road and Kapa’aBypass. See Attachment A.
2. The project is a residential subdivision with single-family and multi-family residences andneighborhood supporting retail. The project has two phases as shown on Attachment B.The development plan is summarized as follows:
Phase 1 Phase 216 Single-Family Units 100 Single-Family Units
700 Multi-Family Units8,000 SF Neighborhood Retail
3. Access to and egress from Phase 1 will be via driveways along the south side of OlohenaRoad west of Kapa’a Intermediate School.

Mr. Greg AllenKapa’a HighlandsJanuary 6, 2014Page 2
1 Institute of Transportation Engineers, Transportation and Land Development, Washington, D.C., 2002, p. 3-6
4. Access to and egress from Phase 2 will be provided via a new intersection along the northside of Kapa’a Bypass and a new intersection along the south side of Olohena Road.These two intersections will be connected by a new curvilinear roadway running through theproject. For purposes of discussion in the report, this roadway is referred to as Road ‘A.’
B. Purpose and Objective of Study
1. Quantify and describe the traffic related characteristics of the proposed project.
2. Identify potential deficiencies adjacent to the project that will impact traffic operations in thevicinity of the proposed project.
C. Study Approach
1. A preliminary trip generation analysis was performed to define the scope of work and studyarea. This analysis determined that the proposed project will generate less than 500 tripsduring either the morning or afternoon peak hour. Based on Institute of TransportationEngineers standards, the traffic study should be a “small development: traffic impactassessment.”1 Accordingly, the study area was defined to include the intersection of Kapa’aBypass at Olohena Road and the intersections providing access to and egress from Phase2 of the project (Kapaa Bypass at Road ‘A’ and Olohena Road at Road ‘A’). Phase 1 lotsare serviced by individual driveways which will have negligible traffic volumes.
State of Hawaii Department of Transportation reviewed the first draft of the report anddirected that the study area be expanded to include the intersections of Kuhio Highway atKukui Street and Kuhio Highway at Kapaa Bypass. See Attachment O.
The County of Kauai directed that the intersection of Olohena Road at Kaapuni Road andKaehula Road be included in the study area. See Attachment P.
2. A field reconnaissance was performed to identify existing roadway cross-sections,intersection lane configurations, traffic control devices, and surrounding land uses.
3. Current weekday peak hour traffic volumes were obtained from manual traffic counts at thestudy intersections.
4. Existing intersection levels-of-service were determined using the methodology describedin the 2000 Highway Capacity Manual. Existing deficiencies were identified based on theresults of the level-of-service analysis and field observations.
5. Peak hour traffic that the proposed project will generate was estimated using trip generationanalysis procedures recommended by the Institute of Transportation Engineers. Projectgenerated traffic was distributed and assigned to the adjacent roadway network.
6. A level-of-service analysis for future traffic conditions with traffic generated by the studyproject was performed.
Mr. Greg AllenKapa’a HighlandsJanuary 6, 2014Page 3
2 Honua Engineering, Inc., Traffic Considerations Kapa’a Highlands Project, March 28, 2012
7. The impacts of traffic generated by the proposed project were quantified and summarized.
8. A report documenting the conclusions of the analyses performed and recommendationswas prepared.
D. Description of Existing Streets and Intersection Controls
Kapa’a Bypass is a two-lane, two-way roadway along the southern and eastern boundaries of theproject. This section of Kapa’a Bypass is owned by the Kapa’a Highlands developer, who hasentered a memorandum of understanding with State of Hawaii Department of Transportation todedicate the roadway to the State upon approval of Kapa’a Highlands subdivision2. According toState of Hawaii Department of Transportation traffic count data from 2010, Kapa’a Bypass has aweekday traffic volume of 7,400 vehicles per day.
Olohena Road is a two-lane, two-way roadway along the northern boundary of the project. OlohenaRoad also provides service to Kapa’a Intermediate School.
Kuhio Highway though Kapaa Town is a two-lane, two-way State highway along the east of thestudy area.
Existing Intersections
The intersection of Kuhio Highway at Kukui Street is a four-legged, signalized intersection locatedapproximately 1,600 feet east of the project. The northbound and southbound approaches areKuhio Highway and the eastbound and westbound approaches are Kukui Street. The northboundand southbound left turns are protected-permissive.
The intersection of Kuhio Highway at Kapaa Bypass is a three-legged, unsignalized intersectionapproximately two miles south of Kukui Street. The northbound and southbound approaches areKuhio Highway. The eastbound approach is the Kapaa Bypass and is the controlled approach. Thenorthbound approach is coned during the morning peak hours to provide on left turn and onethrough lane. The coning also allows the eastbound to southbound left turn to operate as a freeright turn. During the afternoon peak hours and off peak hours, there is one left turn lane and twothrough lanes. The southbound approach has one through lane and one right turn lane. Theeastbound approach has one left turn lane and one right turn lane.
The intersection Kapa’a Bypass and Olohena Road is a four-legged roundabout. All approachesare one lane only. The north leg of the intersection is one-way southbound into the intersection.The remaining three legs are two-way.
The intersection of Olohena Road at Kaapuni Road and Kaehula Road is actually two intersections.Olohena Road is the eastbound and westbound approaches and Kaapuni Road is the STOP signcontrolled approach at Olohena Road. Kaehula Road intersects Kaapuni Road west of OlohenaRoad.
The intersection configurations are summarized on Attachment C.

Mr. Greg AllenKapa’a HighlandsJanuary 6, 2014Page 4
3 Institute of Transportation Engineers, Transportation Impact Analyses for Site Development: A Recommended Practice, 2006,page 60
E. Existing Peak Hour Traffic Volumes
Current weekday peak hour traffic volumes at the intersection of Kapa’a Bypass at Olohena Roadwere obtained from manual traffic counts. The counts at the intersection of Olohena Road at KapaaBypass were performed Tuesday, May 15, 2012. The counts at the intersection of Kuhio Highwaywere performed Thursday, August 8, 2013, and the counts at the intersection of Kuhio Highway atKapaa Bypass were performed on Tuesday, October 29, 2013.
The traffic counts include mopeds, motorcycles, buses, trucks and other large vehicles.
During the surveys, the following was observed at the intersection of Olohena Road at KapaaBypass:
1. The number of pedestrians crossing the approaches to the intersection are minimal, evenwith the bus stop and transfer site at the park along the north side of Olohena Road eastof the intersection.
2. Long queues of 15 vehicles or more along the westbound approach of Olohena Road werenoted during the morning peak hour.
The existing peak hour traffic volumes are summarized on Attachments D and E.
F. Public Transportation
The Kauai Bus operates along Olohena Road and Kapa’a Bypass. A major bus stop and transferpoint is located along Olohena Road east of Kapa’a Bypass in the parking lot adjacent to the park.
G. Level-of-Service Concept
"Level-of-Service" is a term which denotes any of an infinite number of combinations of trafficoperating conditions that may occur on a given lane or roadway when it is subjected to varioustraffic volumes. Level-of-service (LOS) is a qualitative measure of the effect of a number of factorswhich include space, speed, travel time, traffic interruptions, freedom to maneuver, safety, drivingcomfort and convenience.
There are six levels-of-service, A through F, which relate to the driving conditions from best toworst, respectively. The characteristics of traffic operations for each level-of-service aresummarized in Table 1. In general, LOS A represents free-flow conditions with no congestion.LOS F, on the other hand, represents severe congestion with stop-and-go conditions. Level-of-service D is typically considered acceptable for peak hour conditions in urban areas.3
Corresponding to each level-of-service shown in the table is a volume/capacity ratio. This is theratio of either existing or projected traffic volumes to the capacity of the intersection. Capacity isdefined as the maximum number of vehicles that can be accommodated by the roadway during aspecified period of time. The capacity of a particular roadway is dependent upon its physical
Mr. Greg AllenKapa’a HighlandsJanuary 6, 2014Page 5
characteristics such as the number of lanes, the operational characteristics of the roadway (one-way, two-way, turn prohibitions, bus stops, etc.), the type of traffic using the roadway (trucks, buses,etc.) and turning movements.
Table 1 Level-of-Service Definitions for Signalized Intersections(1)
Level of Service InterpretationVolume-to-Capacity
Ratio(2)Stopped Delay
(Seconds)
A, B Uncongested operations; all vehicles clear in a singlecycle.
0.000-0.700 <20.0
C Light congestion; occasional backups on criticalapproaches
0.701-0.800 20.1-35.0
D Congestion on critical approaches but intersectionfunctional. Vehicles must wait through more than onecycle during short periods. No long standing linesformed.
0.801-0.900 35.1-55.0
E Severe congestion with some standing lines on criticalapproaches. Blockage of intersection may occur ifsignal does not provide protected turning movements.
0.901-1.000 55.1-80.0
F Total breakdown with stop-and-go operation >1.001 >80.0
Notes:(1) Source: Highway Capacity Manual, 2000.(2) This is the ratio of the calculated critical volume to Level-of-Service E Capacity.
Like signalized intersections, the operating conditions of intersections controlled by stop signs canbe classified by a level-of-service from A to F. However, the method for determining level-of-servicefor unsignalized intersections is based on the use of gaps in traffic on the major street by vehiclescrossing or turning through that stream. Specifically, the capacity of the controlled legs of anintersection is based on two factors: 1) the distribution of gaps in the major street traffic stream, and2) driver judgement in selecting gaps through which to execute a desired maneuver. The criteriafor level-of-service at an unsignalized intersection is therefore based on delay of each turningmovement. Table 2 summarizes the definitions for level-of-service and the corresponding delay.
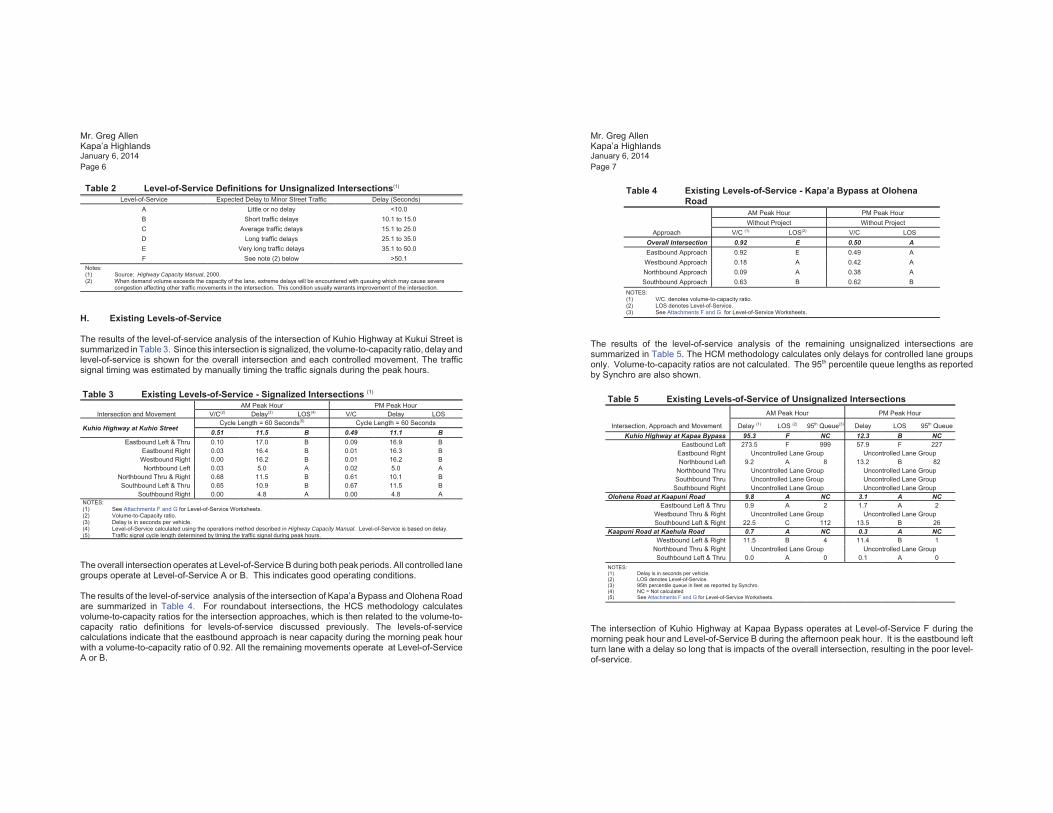
Mr. Greg AllenKapa’a HighlandsJanuary 6, 2014Page 6
Table 2 Level-of-Service Definitions for Unsignalized Intersections(1)
Level-of-Service Expected Delay to Minor Street Traffic Delay (Seconds) A Little or no delay <10.0B Short traffic delays 10.1 to 15.0C Average traffic delays 15.1 to 25.0D Long traffic delays 25.1 to 35.0E Very long traffic delays 35.1 to 50.0F See note (2) below >50.1
Notes:(1) Source: Highway Capacity Manual, 2000.(2) When demand volume exceeds the capacity of the lane, extreme delays will be encountered with queuing which may cause severe
congestion affecting other traffic movements in the intersection. This condition usually warrants improvement of the intersection.
H. Existing Levels-of-Service
The results of the level-of-service analysis of the intersection of Kuhio Highway at Kukui Street issummarized in Table 3. Since this intersection is signalized, the volume-to-capacity ratio, delay andlevel-of-service is shown for the overall intersection and each controlled movement. The trafficsignal timing was estimated by manually timing the traffic signals during the peak hours.
Table 3 Existing Levels-of-Service - Signalized Intersections (1)
Intersection and MovementAM Peak Hour PM Peak Hour
V/C(2) Delay(3) LOS(4) V/C Delay LOS
Kuhio Highway at Kuhio StreetCycle Length = 60 Seconds(5) Cycle Length = 60 Seconds
0.51 11.5 B 0.49 11.1 BEastbound Left & Thru 0.10 17.0 B 0.09 16.9 B
Eastbound Right 0.03 16.4 B 0.01 16.3 BWestbound Right 0.00 16.2 B 0.01 16.2 BNorthbound Left 0.03 5.0 A 0.02 5.0 A
Northbound Thru & Right 0.68 11.5 B 0.61 10.1 BSouthbound Left & Thru 0.65 10.9 B 0.67 11.5 B
Southbound Right 0.00 4.8 A 0.00 4.8 ANOTES:(1) See Attachments F and G for Level-of-Service Worksheets. (2) Volume-to-Capacity ratio.(3) Delay is in seconds per vehicle.(4) Level-of-Service calculated using the operations method described in Highway Capacity Manual. Level-of-Service is based on delay.(5) Traffic signal cycle length determined by timing the traffic signal during peak hours.
The overall intersection operates at Level-of-Service B during both peak periods. All controlled lanegroups operate at Level-of-Service A or B. This indicates good operating conditions.
The results of the level-of-service analysis of the intersection of Kapa’a Bypass and Olohena Roadare summarized in Table 4. For roundabout intersections, the HCS methodology calculatesvolume-to-capacity ratios for the intersection approaches, which is then related to the volume-to-capacity ratio definitions for levels-of-service discussed previously. The levels-of-servicecalculations indicate that the eastbound approach is near capacity during the morning peak hourwith a volume-to-capacity ratio of 0.92. All the remaining movements operate at Level-of-ServiceA or B.
Mr. Greg AllenKapa’a HighlandsJanuary 6, 2014Page 7
Table 4 Existing Levels-of-Service - Kapa’a Bypass at OlohenaRoad
Approach
AM Peak Hour PM Peak HourWithout Project Without Project
V/C (1) LOS(2) V/C LOS Overall Intersection 0.92 E 0.50 AEastbound Approach 0.92 E 0.49 AWestbound Approach 0.18 A 0.42 ANorthbound Approach 0.09 A 0.38 ASouthbound Approach 0.63 B 0.62 B
NOTES:(1) V/C. denotes volume-to-capacity ratio.(2) LOS denotes Level-of-Service.(3) See Attachments F and G for Level-of-Service Worksheets.
The results of the level-of-service analysis of the remaining unsignalized intersections aresummarized in Table 5. The HCM methodology calculates only delays for controlled lane groupsonly. Volume-to-capacity ratios are not calculated. The 95th percentile queue lengths as reportedby Synchro are also shown.
Table 5 Existing Levels-of-Service of Unsignalized Intersections
Intersection, Approach and Movement
AM Peak Hour PM Peak Hour
Delay (1) LOS (2) 95th Queue(3) Delay LOS 95th QueueKuhio Highway at Kapaa Bypass 95.3 F NC 12.3 B NC
Eastbound Left 273.5 F 999 57.9 F 227Eastbound Right Uncontrolled Lane Group Uncontrolled Lane GroupNorthbound Left 9.2 A 8 13.2 B 82
Northbound Thru Uncontrolled Lane Group Uncontrolled Lane GroupSouthbound Thru Uncontrolled Lane Group Uncontrolled Lane Group
Southbound Right Uncontrolled Lane Group Uncontrolled Lane GroupOlohena Road at Kaapuni Road 9.8 A NC 3.1 A NC
Eastbound Left & Thru 0.9 A 2 1.7 A 2Westbound Thru & Right Uncontrolled Lane Group Uncontrolled Lane GroupSouthbound Left & Right 22.5 C 112 13.5 B 26
Kaapuni Road at Kaehula Road 0.7 A NC 0.3 A NCWestbound Left & Right 11.5 B 4 11.4 B 1
Northbound Thru & Right Uncontrolled Lane Group Uncontrolled Lane GroupSouthbound Left & Thru 0.0 A 0 0.1 A 0
NOTES:(1) Delay is in seconds per vehicle.(2) LOS denotes Level-of-Service. (3) 95th percentile queue in feet as reported by Synchro.(4) NC = Not calculated(5) See Attachments F and G for Level-of-Service Worksheets.
The intersection of Kuhio Highway at Kapaa Bypass operates at Level-of-Service F during themorning peak hour and Level-of-Service B during the afternoon peak hour. It is the eastbound leftturn lane with a delay so long that is impacts of the overall intersection, resulting in the poor level-of-service.
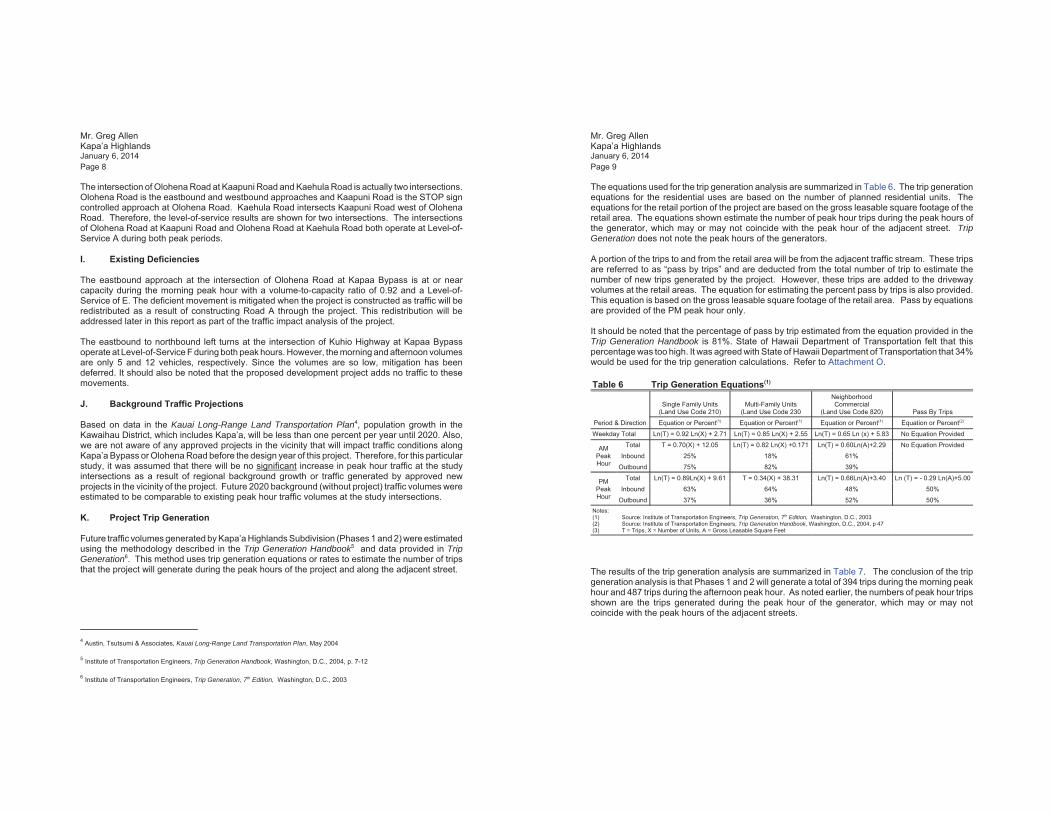
Mr. Greg AllenKapa’a HighlandsJanuary 6, 2014Page 8
4 Austin, Tsutsumi & Associates, Kauai Long-Range Land Transportation Plan, May 2004
5 Institute of Transportation Engineers, Trip Generation Handbook, Washington, D.C., 2004, p. 7-12
6 Institute of Transportation Engineers, Trip Generation, 7th Edition, Washington, D.C., 2003
The intersection of Olohena Road at Kaapuni Road and Kaehula Road is actually two intersections.Olohena Road is the eastbound and westbound approaches and Kaapuni Road is the STOP signcontrolled approach at Olohena Road. Kaehula Road intersects Kaapuni Road west of OlohenaRoad. Therefore, the level-of-service results are shown for two intersections. The intersectionsof Olohena Road at Kaapuni Road and Olohena Road at Kaehula Road both operate at Level-of-Service A during both peak periods.
I. Existing Deficiencies
The eastbound approach at the intersection of Olohena Road at Kapaa Bypass is at or nearcapacity during the morning peak hour with a volume-to-capacity ratio of 0.92 and a Level-of-Service of E. The deficient movement is mitigated when the project is constructed as traffic will beredistributed as a result of constructing Road A through the project. This redistribution will beaddressed later in this report as part of the traffic impact analysis of the project.
The eastbound to northbound left turns at the intersection of Kuhio Highway at Kapaa Bypassoperate at Level-of-Service F during both peak hours. However, the morning and afternoon volumesare only 5 and 12 vehicles, respectively. Since the volumes are so low, mitigation has beendeferred. It should also be noted that the proposed development project adds no traffic to thesemovements.
J. Background Traffic Projections
Based on data in the Kauai Long-Range Land Transportation Plan4, population growth in theKawaihau District, which includes Kapa’a, will be less than one percent per year until 2020. Also,we are not aware of any approved projects in the vicinity that will impact traffic conditions alongKapa’a Bypass or Olohena Road before the design year of this project. Therefore, for this particularstudy, it was assumed that there will be no significant increase in peak hour traffic at the studyintersections as a result of regional background growth or traffic generated by approved newprojects in the vicinity of the project. Future 2020 background (without project) traffic volumes wereestimated to be comparable to existing peak hour traffic volumes at the study intersections.
K. Project Trip Generation
Future traffic volumes generated by Kapa’a Highlands Subdivision (Phases 1 and 2) were estimatedusing the methodology described in the Trip Generation Handbook5 and data provided in TripGeneration6. This method uses trip generation equations or rates to estimate the number of tripsthat the project will generate during the peak hours of the project and along the adjacent street.
Mr. Greg AllenKapa’a HighlandsJanuary 6, 2014Page 9
The equations used for the trip generation analysis are summarized in Table 6. The trip generationequations for the residential uses are based on the number of planned residential units. Theequations for the retail portion of the project are based on the gross leasable square footage of theretail area. The equations shown estimate the number of peak hour trips during the peak hours ofthe generator, which may or may not coincide with the peak hour of the adjacent street. TripGeneration does not note the peak hours of the generators.
A portion of the trips to and from the retail area will be from the adjacent traffic stream. These tripsare referred to as “pass by trips” and are deducted from the total number of trip to estimate thenumber of new trips generated by the project. However, these trips are added to the drivewayvolumes at the retail areas. The equation for estimating the percent pass by trips is also provided.This equation is based on the gross leasable square footage of the retail area. Pass by equationsare provided of the PM peak hour only.
It should be noted that the percentage of pass by trip estimated from the equation provided in theTrip Generation Handbook is 81%. State of Hawaii Department of Transportation felt that thispercentage was too high. It was agreed with State of Hawaii Department of Transportation that 34%would be used for the trip generation calculations. Refer to Attachment O.
Table 6 Trip Generation Equations(1)
Period & Direction
Single Family Units(Land Use Code 210)
Multi-Family Units(Land Use Code 230
NeighborhoodCommercial
(Land Use Code 820) Pass By Trips
Equation or Percent(1) Equation or Percent(1) Equation or Percent(1) Equation or Percent(2)
Weekday Total Ln(T) = 0.92 Ln(X) + 2.71 Ln(T) = 0.85 Ln(X) + 2.55 Ln(T) = 0.65 Ln (x) + 5.83 No Equation Provided
AMPeakHour
Total T = 0.70(X) + 12.05 Ln(T) = 0.82 Ln(X) +0.171 Ln(T) = 0.60Ln(A)+2.29 No Equation Provided
Inbound 25% 18% 61%
Outbound 75% 82% 39%
PMPeakHour
Total Ln(T) = 0.89Ln(X) + 9.61 T = 0.34(X) + 38.31 Ln(T) = 0.66Ln(A)+3.40 Ln (T) = - 0.29 Ln(A)+5.00
Inbound 63% 64% 48% 50%
Outbound 37% 36% 52% 50%Notes:(1) Source: Institute of Transportation Engineers, Trip Generation, 7th Edition, Washington, D.C., 2003(2) Source: Institute of Transportation Engineers, Trip Generation Handbook, Washington, D.C., 2004, p 47(3) T = Trips, X = Number of Units, A = Gross Leasable Square Feet
The results of the trip generation analysis are summarized in Table 7. The conclusion of the tripgeneration analysis is that Phases 1 and 2 will generate a total of 394 trips during the morning peakhour and 487 trips during the afternoon peak hour. As noted earlier, the numbers of peak hour tripsshown are the trips generated during the peak hour of the generator, which may or may notcoincide with the peak hours of the adjacent streets.
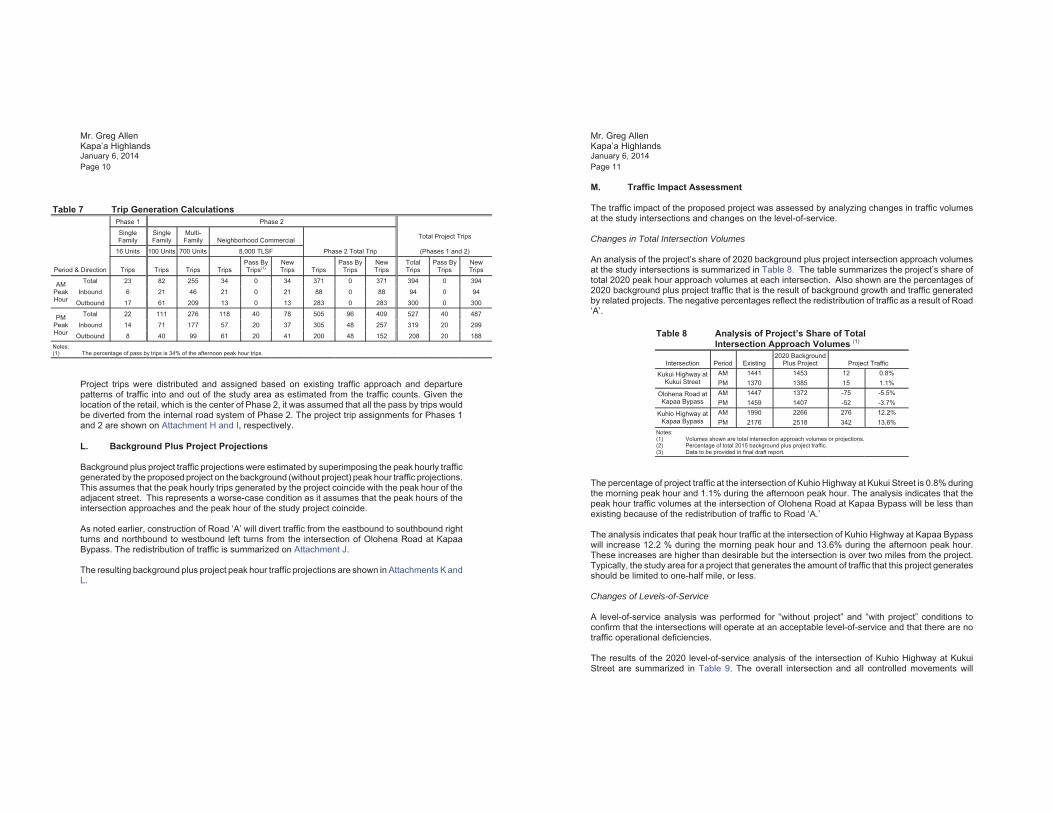
Mr. Greg AllenKapa’a HighlandsJanuary 6, 2014Page 10
Table 7 Trip Generation Calculations
Period & Direction
Phase 1 Phase 2
Total Project Trips
(Phases 1 and 2)
SingleFamily
SingleFamily
Multi-Family Neighborhood Commercial
Phase 2 Total Trip16 Units 100 Units 700 Units 8,000 TLSF
Trips Trips Trips TripsPass ByTrips(1)
NewTrips Trips
Pass ByTrips
NewTrips
TotalTrips
Pass ByTrips
NewTrips
AMPeakHour
Total 23 82 255 34 0 34 371 0 371 394 0 394
Inbound 6 21 46 21 0 21 88 0 88 94 0 94
Outbound 17 61 209 13 0 13 283 0 283 300 0 300
PMPeakHour
Total 22 111 276 118 40 78 505 96 409 527 40 487
Inbound 14 71 177 57 20 37 305 48 257 319 20 299
Outbound 8 40 99 61 20 41 200 48 152 208 20 188Notes:(1) The percentage of pass by trips is 34% of the afternoon peak hour trips.
Project trips were distributed and assigned based on existing traffic approach and departurepatterns of traffic into and out of the study area as estimated from the traffic counts. Given thelocation of the retail, which is the center of Phase 2, it was assumed that all the pass by trips wouldbe diverted from the internal road system of Phase 2. The project trip assignments for Phases 1and 2 are shown on Attachment H and I, respectively.
L. Background Plus Project Projections
Background plus project traffic projections were estimated by superimposing the peak hourly trafficgenerated by the proposed project on the background (without project) peak hour traffic projections.This assumes that the peak hourly trips generated by the project coincide with the peak hour of theadjacent street. This represents a worse-case condition as it assumes that the peak hours of theintersection approaches and the peak hour of the study project coincide.
As noted earlier, construction of Road ‘A’ will divert traffic from the eastbound to southbound rightturns and northbound to westbound left turns from the intersection of Olohena Road at KapaaBypass. The redistribution of traffic is summarized on Attachment J.
The resulting background plus project peak hour traffic projections are shown in Attachments K andL.
Mr. Greg AllenKapa’a HighlandsJanuary 6, 2014Page 11
M. Traffic Impact Assessment
The traffic impact of the proposed project was assessed by analyzing changes in traffic volumesat the study intersections and changes on the level-of-service.
Changes in Total Intersection Volumes
An analysis of the project’s share of 2020 background plus project intersection approach volumesat the study intersections is summarized in Table 8. The table summarizes the project’s share oftotal 2020 peak hour approach volumes at each intersection. Also shown are the percentages of2020 background plus project traffic that is the result of background growth and traffic generatedby related projects. The negative percentages reflect the redistribution of traffic as a result of Road‘A’.
Table 8 Analysis of Project’s Share of TotalIntersection Approach Volumes (1)
Intersection Period Existing2020 Background
Plus Project Project Traffic
Kukui Highway atKukui Street
AM 1441 1453 12 0.8%PM 1370 1385 15 1.1%
Olohena Road atKapaa Bypass
AM 1447 1372 -75 -5.5%PM 1459 1407 -52 -3.7%
Kuhio Highway atKapaa Bypass
AM 1990 2266 276 12.2%PM 2176 2518 342 13.6%
Notes:(1) Volumes shown are total intersection approach volumes or projections. (2) Percentage of total 2015 background plus project traffic.(3) Data to be provided in final draft report.
The percentage of project traffic at the intersection of Kuhio Highway at Kukui Street is 0.8% duringthe morning peak hour and 1.1% during the afternoon peak hour. The analysis indicates that thepeak hour traffic volumes at the intersection of Olohena Road at Kapaa Bypass will be less thanexisting because of the redistribution of traffic to Road ‘A.’
The analysis indicates that peak hour traffic at the intersection of Kuhio Highway at Kapaa Bypasswill increase 12.2 % during the morning peak hour and 13.6% during the afternoon peak hour.These increases are higher than desirable but the intersection is over two miles from the project.Typically, the study area for a project that generates the amount of traffic that this project generatesshould be limited to one-half mile, or less.
Changes of Levels-of-Service
A level-of-service analysis was performed for “without project” and “with project” conditions toconfirm that the intersections will operate at an acceptable level-of-service and that there are notraffic operational deficiencies.
The results of the 2020 level-of-service analysis of the intersection of Kuhio Highway at KukuiStreet are summarized in Table 9. The overall intersection and all controlled movements will
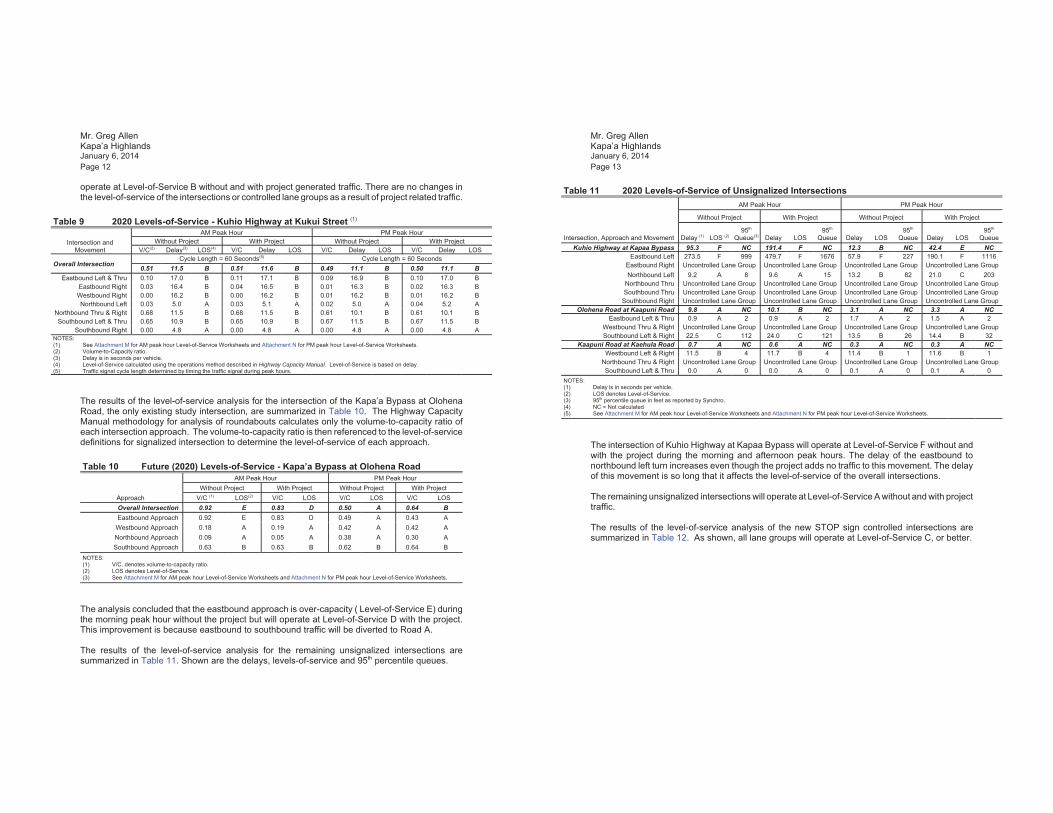
Mr. Greg AllenKapa’a HighlandsJanuary 6, 2014Page 12
operate at Level-of-Service B without and with project generated traffic. There are no changes inthe level-of-service of the intersections or controlled lane groups as a result of project related traffic.
Table 9 2020 Levels-of-Service - Kuhio Highway at Kukui Street (1)
Intersection andMovement
AM Peak Hour PM Peak HourWithout Project With Project Without Project With Project
V/C(2) Delay(3) LOS(4) V/C Delay LOS V/C Delay LOS V/C Delay LOS
Overall IntersectionCycle Length = 60 Seconds(5) Cycle Length = 60 Seconds
0.51 11.5 B 0.51 11.6 B 0.49 11.1 B 0.50 11.1 BEastbound Left & Thru 0.10 17.0 B 0.11 17.1 B 0.09 16.9 B 0.10 17.0 B
Eastbound Right 0.03 16.4 B 0.04 16.5 B 0.01 16.3 B 0.02 16.3 BWestbound Right 0.00 16.2 B 0.00 16.2 B 0.01 16.2 B 0.01 16.2 BNorthbound Left 0.03 5.0 A 0.03 5.1 A 0.02 5.0 A 0.04 5.2 A
Northbound Thru & Right 0.68 11.5 B 0.68 11.5 B 0.61 10.1 B 0.61 10.1 BSouthbound Left & Thru 0.65 10.9 B 0.65 10.9 B 0.67 11.5 B 0.67 11.5 B
Southbound Right 0.00 4.8 A 0.00 4.8 A 0.00 4.8 A 0.00 4.8 ANOTES:(1) See Attachment M for AM peak hour Level-of-Service Worksheets and Attachment N for PM peak hour Level-of-Service Worksheets.(2) Volume-to-Capacity ratio.(3) Delay is in seconds per vehicle.(4) Level-of-Service calculated using the operations method described in Highway Capacity Manual. Level-of-Service is based on delay.(5) Traffic signal cycle length determined by timing the traffic signal during peak hours.
The results of the level-of-service analysis for the intersection of the Kapa’a Bypass at OlohenaRoad, the only existing study intersection, are summarized in Table 10. The Highway CapacityManual methodology for analysis of roundabouts calculates only the volume-to-capacity ratio ofeach intersection approach. The volume-to-capacity ratio is then referenced to the level-of-servicedefinitions for signalized intersection to determine the level-of-service of each approach.
Table 10 Future (2020) Levels-of-Service - Kapa’a Bypass at Olohena Road
Approach
AM Peak Hour PM Peak HourWithout Project With Project Without Project With Project
V/C (1) LOS(2) V/C LOS V/C LOS V/C LOS Overall Intersection 0.92 E 0.83 D 0.50 A 0.64 BEastbound Approach 0.92 E 0.83 D 0.49 A 0.43 AWestbound Approach 0.18 A 0.19 A 0.42 A 0.42 ANorthbound Approach 0.09 A 0.05 A 0.38 A 0.30 ASouthbound Approach 0.63 B 0.63 B 0.62 B 0.64 B
NOTES:(1) V/C. denotes volume-to-capacity ratio.(2) LOS denotes Level-of-Service.(3) See Attachment M for AM peak hour Level-of-Service Worksheets and Attachment N for PM peak hour Level-of-Service Worksheets.
The analysis concluded that the eastbound approach is over-capacity ( Level-of-Service E) duringthe morning peak hour without the project but will operate at Level-of-Service D with the project.This improvement is because eastbound to southbound traffic will be diverted to Road A.
The results of the level-of-service analysis for the remaining unsignalized intersections aresummarized in Table 11. Shown are the delays, levels-of-service and 95th percentile queues.
Mr. Greg AllenKapa’a HighlandsJanuary 6, 2014Page 13
Table 11 2020 Levels-of-Service of Unsignalized Intersections
Intersection, Approach and Movement
AM Peak Hour PM Peak Hour
Without Project With Project Without Project With Project
Delay (1) LOS (2)95th
Queue(3) Delay LOS95th
Queue Delay LOS95th
Queue Delay LOS95th
QueueKuhio Highway at Kapaa Bypass 95.3 F NC 191.4 F NC 12.3 B NC 42.4 E NC
Eastbound Left 273.5 F 999 479.7 F 1676 57.9 F 227 190.1 F 1116Eastbound Right Uncontrolled Lane Group Uncontrolled Lane Group Uncontrolled Lane Group Uncontrolled Lane GroupNorthbound Left 9.2 A 8 9.6 A 15 13.2 B 82 21.0 C 203
Northbound Thru Uncontrolled Lane Group Uncontrolled Lane Group Uncontrolled Lane Group Uncontrolled Lane GroupSouthbound Thru Uncontrolled Lane Group Uncontrolled Lane Group Uncontrolled Lane Group Uncontrolled Lane Group
Southbound Right Uncontrolled Lane Group Uncontrolled Lane Group Uncontrolled Lane Group Uncontrolled Lane GroupOlohena Road at Kaapuni Road 9.8 A NC 10.1 B NC 3.1 A NC 3.3 A NC
Eastbound Left & Thru 0.9 A 2 0.9 A 2 1.7 A 2 1.5 A 2Westbound Thru & Right Uncontrolled Lane Group Uncontrolled Lane Group Uncontrolled Lane Group Uncontrolled Lane GroupSouthbound Left & Right 22.5 C 112 24.0 C 121 13.5 B 26 14.4 B 32
Kaapuni Road at Kaehula Road 0.7 A NC 0.6 A NC 0.3 A NC 0.3 A NCWestbound Left & Right 11.5 B 4 11.7 B 4 11.4 B 1 11.6 B 1
Northbound Thru & Right Uncontrolled Lane Group Uncontrolled Lane Group Uncontrolled Lane Group Uncontrolled Lane GroupSouthbound Left & Thru 0.0 A 0 0.0 A 0 0.1 A 0 0.1 A 0
NOTES:(1) Delay is in seconds per vehicle.(2) LOS denotes Level-of-Service. (3) 95th percentile queue in feet as reported by Synchro.(4) NC = Not calculated(5) See Attachment M for AM peak hour Level-of-Service Worksheets and Attachment N for PM peak hour Level-of-Service Worksheets.
The intersection of Kuhio Highway at Kapaa Bypass will operate at Level-of-Service F without andwith the project during the morning and afternoon peak hours. The delay of the eastbound tonorthbound left turn increases even though the project adds no traffic to this movement. The delayof this movement is so long that it affects the level-of-service of the overall intersections.
The remaining unsignalized intersections will operate at Level-of-Service A without and with projecttraffic.
The results of the level-of-service analysis of the new STOP sign controlled intersections aresummarized in Table 12. As shown, all lane groups will operate at Level-of-Service C, or better.
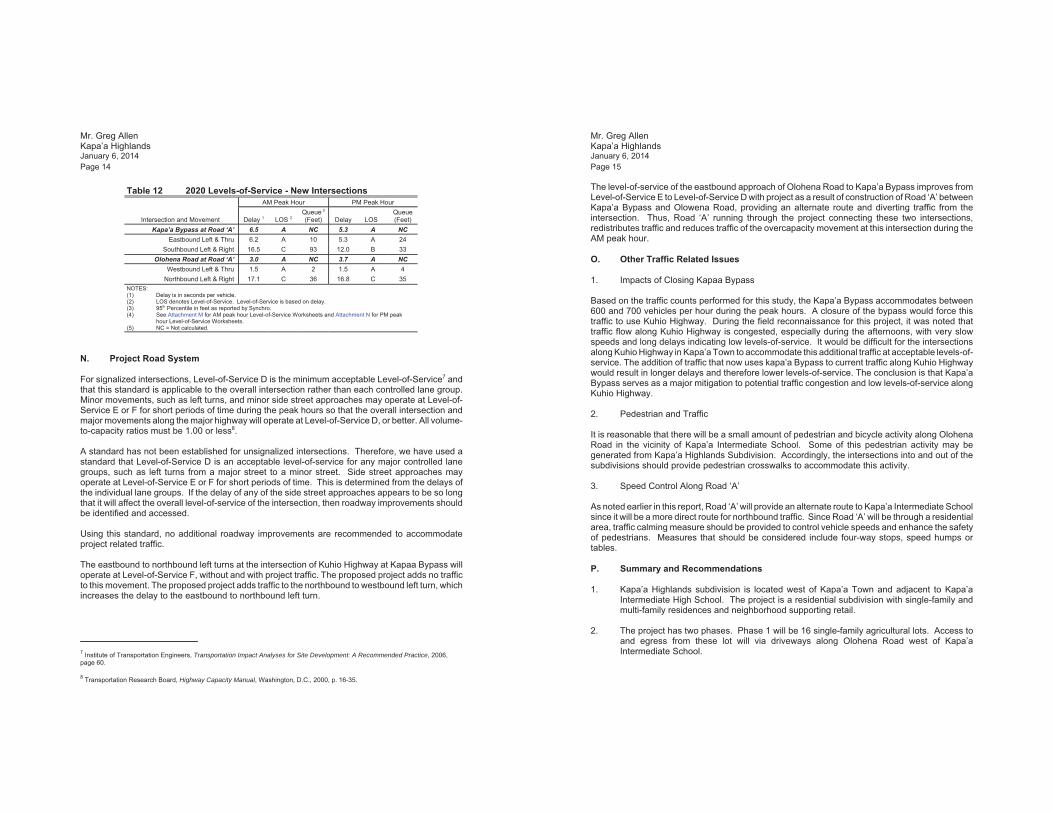
Mr. Greg AllenKapa’a HighlandsJanuary 6, 2014Page 14
7 Institute of Transportation Engineers, Transportation Impact Analyses for Site Development: A Recommended Practice, 2006,page 60.
8 Transportation Research Board, Highway Capacity Manual, Washington, D.C., 2000, p. 16-35.
Table 12 2020 Levels-of-Service - New Intersections
Intersection and Movement
AM Peak Hour PM Peak Hour
Delay 1 LOS 2Queue 3
(Feet) Delay LOS Queue(Feet)
Kapa’a Bypass at Road ‘A’ 6.5 A NC 5.3 A NCEastbound Left & Thru 6.2 A 10 5.3 A 24
Southbound Left & Right 16.5 C 93 12.0 B 33Olohena Road at Road ‘A’ 3.0 A NC 3.7 A NC
Westbound Left & Thru 1.5 A 2 1.5 A 4Northbound Left & Right 17.1 C 36 16.8 C 35
NOTES:(1) Delay is in seconds per vehicle.(2) LOS denotes Level-of-Service. Level-of-Service is based on delay. (3) 95th Percentile in feet as reported by Synchro.(4) See Attachment M for AM peak hour Level-of-Service Worksheets and Attachment N for PM peak
hour Level-of-Service Worksheets.(5) NC = Not calculated.
N. Project Road System
For signalized intersections, Level-of-Service D is the minimum acceptable Level-of-Service7 andthat this standard is applicable to the overall intersection rather than each controlled lane group.Minor movements, such as left turns, and minor side street approaches may operate at Level-of-Service E or F for short periods of time during the peak hours so that the overall intersection andmajor movements along the major highway will operate at Level-of-Service D, or better. All volume-to-capacity ratios must be 1.00 or less8.
A standard has not been established for unsignalized intersections. Therefore, we have used astandard that Level-of-Service D is an acceptable level-of-service for any major controlled lanegroups, such as left turns from a major street to a minor street. Side street approaches mayoperate at Level-of-Service E or F for short periods of time. This is determined from the delays ofthe individual lane groups. If the delay of any of the side street approaches appears to be so longthat it will affect the overall level-of-service of the intersection, then roadway improvements shouldbe identified and accessed.
Using this standard, no additional roadway improvements are recommended to accommodateproject related traffic.
The eastbound to northbound left turns at the intersection of Kuhio Highway at Kapaa Bypass willoperate at Level-of-Service F, without and with project traffic. The proposed project adds no trafficto this movement. The proposed project adds traffic to the northbound to westbound left turn, whichincreases the delay to the eastbound to northbound left turn.
Mr. Greg AllenKapa’a HighlandsJanuary 6, 2014Page 15
The level-of-service of the eastbound approach of Olohena Road to Kapa’a Bypass improves fromLevel-of-Service E to Level-of-Service D with project as a result of construction of Road ‘A’ betweenKapa’a Bypass and Olowena Road, providing an alternate route and diverting traffic from theintersection. Thus, Road ‘A’ running through the project connecting these two intersections,redistributes traffic and reduces traffic of the overcapacity movement at this intersection during theAM peak hour.
O. Other Traffic Related Issues
1. Impacts of Closing Kapaa Bypass
Based on the traffic counts performed for this study, the Kapa’a Bypass accommodates between600 and 700 vehicles per hour during the peak hours. A closure of the bypass would force thistraffic to use Kuhio Highway. During the field reconnaissance for this project, it was noted thattraffic flow along Kuhio Highway is congested, especially during the afternoons, with very slowspeeds and long delays indicating low levels-of-service. It would be difficult for the intersectionsalong Kuhio Highway in Kapa’a Town to accommodate this additional traffic at acceptable levels-of-service. The addition of traffic that now uses kapa’a Bypass to current traffic along Kuhio Highwaywould result in longer delays and therefore lower levels-of-service. The conclusion is that Kapa’aBypass serves as a major mitigation to potential traffic congestion and low levels-of-service alongKuhio Highway.
2. Pedestrian and Traffic
It is reasonable that there will be a small amount of pedestrian and bicycle activity along OlohenaRoad in the vicinity of Kapa’a Intermediate School. Some of this pedestrian activity may begenerated from Kapa’a Highlands Subdivision. Accordingly, the intersections into and out of thesubdivisions should provide pedestrian crosswalks to accommodate this activity.
3. Speed Control Along Road ‘A’
As noted earlier in this report, Road ‘A’ will provide an alternate route to Kapa’a Intermediate Schoolsince it will be a more direct route for northbound traffic. Since Road ‘A’ will be through a residentialarea, traffic calming measure should be provided to control vehicle speeds and enhance the safetyof pedestrians. Measures that should be considered include four-way stops, speed humps ortables.
P. Summary and Recommendations
1. Kapa’a Highlands subdivision is located west of Kapa’a Town and adjacent to Kapa’aIntermediate High School. The project is a residential subdivision with single-family andmulti-family residences and neighborhood supporting retail.
2. The project has two phases. Phase 1 will be 16 single-family agricultural lots. Access toand egress from these lot will via driveways along Olohena Road west of Kapa’aIntermediate School.

Mr. Greg AllenKapa’a HighlandsJanuary 6, 2014Page 16
3. The second phase will consists of 100 single-family units, 700 multi-family units and 8,000square feet of neighborhood supporting retail. Access to and egress from Phase 2 will beprovided via a new intersection along the north side of Kapa’a Bypass and a newintersection along the south side of Olohena Road.
4. The conclusion of the trip generation analysis is that Phases 1 and 2 will generate a totalof 394 trips during the morning peak hour and 487 trips during the afternoon peak hour.
5. The level-of-service analysis of the intersection of Kuhio Highway at Kukui Streetdetermined that the overall intersection and all controlled movements will operate at Level-of-Service B without and with project generated traffic. There are no changes in the level-of-service of the intersections or controlled lane groups as a result of project related traffic.
6. A level-of-service analysis of the intersection of Kapa’a Bypass at Olohena Road concludedthat the eastbound approach to the roundabout is currently over-capacity ( Level-of-ServiceE) during the morning peak hour without the project but will operate at Level-of-Service Dwith the project. This improvement is because eastbound to southbound traffic will bediverted from the intersection to Road A.
7. The intersection of Kuhio Highway at Kapaa Bypass will operate at Level-of-Service Fwithout and with the project during the morning and afternoon peak hours. The delay of theeastbound to northbound left turn increases even though the project adds no traffic to thismovement. The delay of this movement is so long that it affects the level-of-service of theoverall intersections. The proposed project adds no traffic to this movement. The proposedproject adds traffic to the northbound to westbound left turn, which increases the delay tothe eastbound to northbound left turn, but is not considered significant. The morning andafternoon peak hour projections for this lane group are 5 and 12 vehicles per hour,respectively. Traffic impacts due to the project are not considered significant.
Mr. Greg AllenKapa’a HighlandsJanuary 6, 2014Page 17
8. Based on the results of the level-of-service analysis, no roadway improvements arerecommended to accommodate project related traffic. The project actually has a positiveimpact as a result of constructing Road ‘A’, which will divert traffic away from theintersection of Olohena Road and Kapaa Bypass. The eastbound to southbound movementwill be over-capacity without Road ‘A’.
Respectfully submitted,PHILLIP ROWELL AND ASSOCIATES
Phillip J. Rowell, P.E.Principal
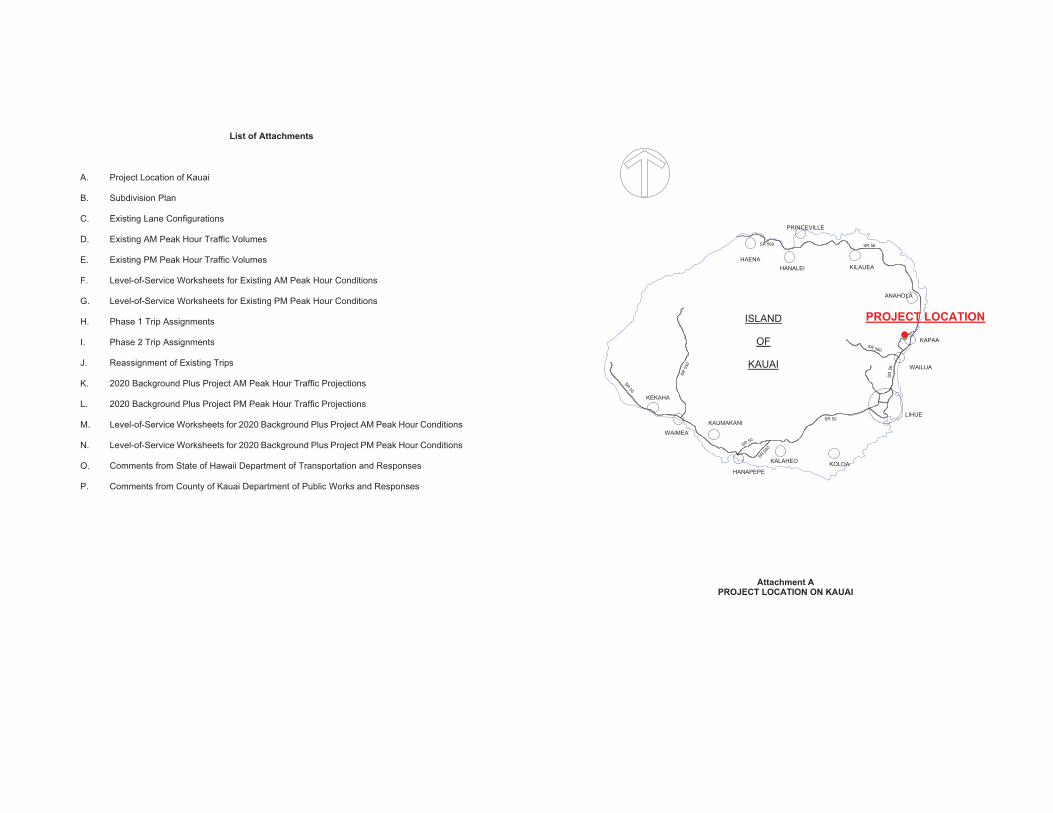
List of Attachments
A. Project Location of Kauai
B. Subdivision Plan
C. Existing Lane Configurations
D. Existing AM Peak Hour Traffic Volumes
E. Existing PM Peak Hour Traffic Volumes
F. Level-of-Service Worksheets for Existing AM Peak Hour Conditions
G. Level-of-Service Worksheets for Existing PM Peak Hour Conditions
H. Phase 1 Trip Assignments
I. Phase 2 Trip Assignments
J. Reassignment of Existing Trips
K. 2020 Background Plus Project AM Peak Hour Traffic Projections
L. 2020 Background Plus Project PM Peak Hour Traffic Projections
M. Level-of-Service Worksheets for 2020 Background Plus Project AM Peak Hour Conditions
N. Level-of-Service Worksheets for 2020 Background Plus Project PM Peak Hour Conditions
O. Comments from State of Hawaii Department of Transportation and Responses
P. Comments from County of Kauai Department of Public Works and Responses
PRINCEVILLE
HAENAHANALEI KILAUEA
ANAHOLA
KAPAA
WAILUA
LIHUE
KOLOAKALAHEO
HANAPEPE
KAUMAKANI
WAIMEA
KEKAHA
SR50
SR 50
SR 50
SR
56
SR 560
SR55
0
SR54
0
SR 56
SR 580
ISLAND
OF
KAUAI
Attachment APROJECT LOCATION ON KAUAI
PROJECT LOCATION
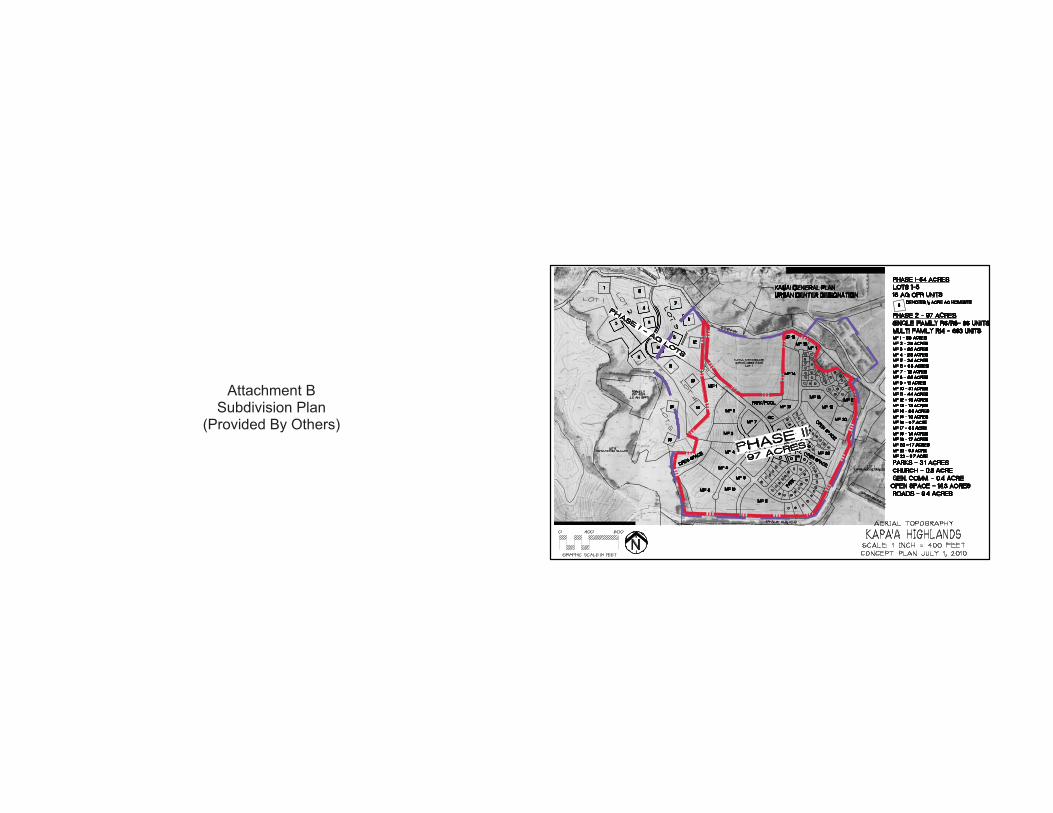
Attachment BSubdivision Plan
(Provided By Others)
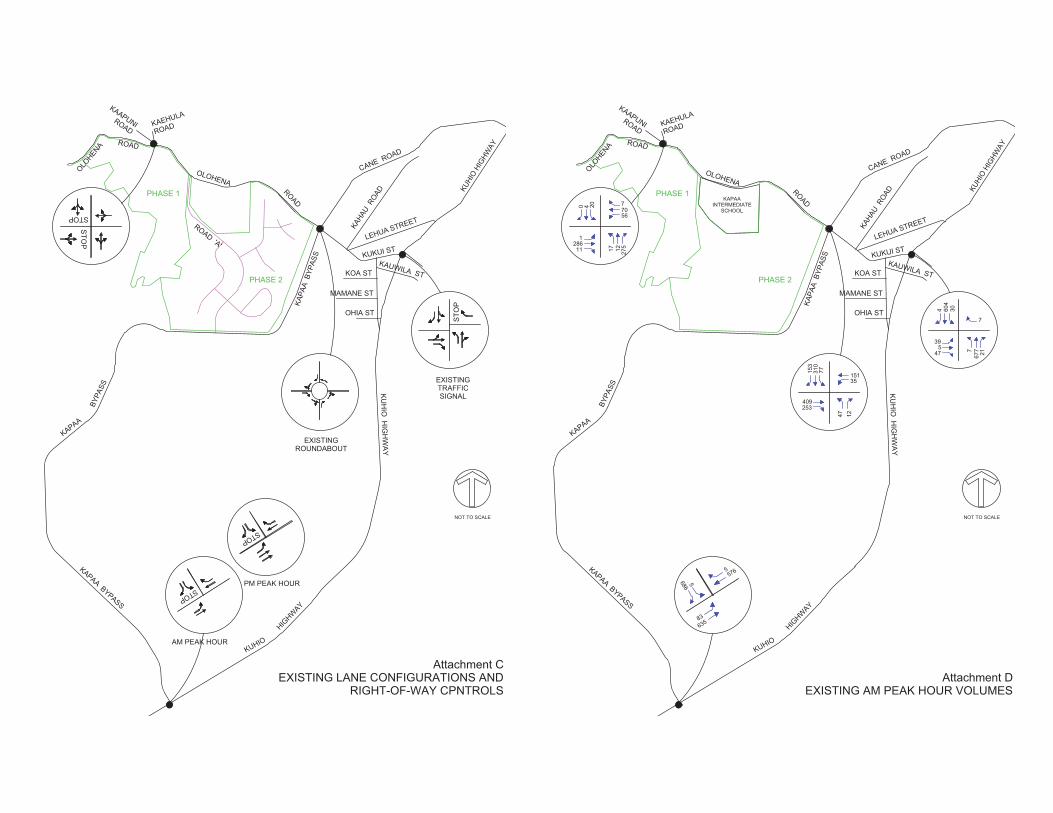
Attachment CEXISTING LANE CONFIGURATIONS AND
RIGHT-OF-WAY CPNTROLS
NOT TO SCALE
PHASE 1
PHASE 2
KAPAABYPASS
KUHIO
HIGHW
AY
KU
HIO
HIG
HW
AY
KUHI
OHI
GHWAY
OLOHENA
ROAD
OLOHENA ROAD
KAAPUNIROADKAEHULA
ROAD
KUKUI ST
CANE ROAD
KAHA
URO
AD
LEHUA STREET
KOA ST
MAMANE ST
OHIA ST
KAUWILA ST
KAPA
ABY
PASS
KAPAA
BYPA
SS
ROAD'A'
STO
P
STOP
STOP
STOP
AM PEAK HOUR
PM PEAK HOUR
STO
P
EXISTINGTRAFFICSIGNAL
EXISTINGROUNDABOUT
Attachment DEXISTING AM PEAK HOUR VOLUMES
NOT TO SCALE
KAPAAINTERMEDIATE
SCHOOL
PHASE 1
PHASE 2
5686
5576
83635
4 604
30
7
21677747
539
153
310
77
15135
1247
253409
0 4 20 77056
275121711
2861
KAPAABYPASS
KUHIO
HIGHW
AY
KU
HIO
HIG
HW
AY
KUHI
OHI
GHWAY
OLOHENA
ROAD
OLOHENA ROAD
KAAPUNIROADKAEHULA
ROAD
KUKUI ST
CANE ROAD
KAHA
URO
AD
LEHUA STREET
KOA ST
MAMANE ST
OHIA ST
KAUWILA ST
KAPA
ABY
PASS
KAPAA
BYPA
SS
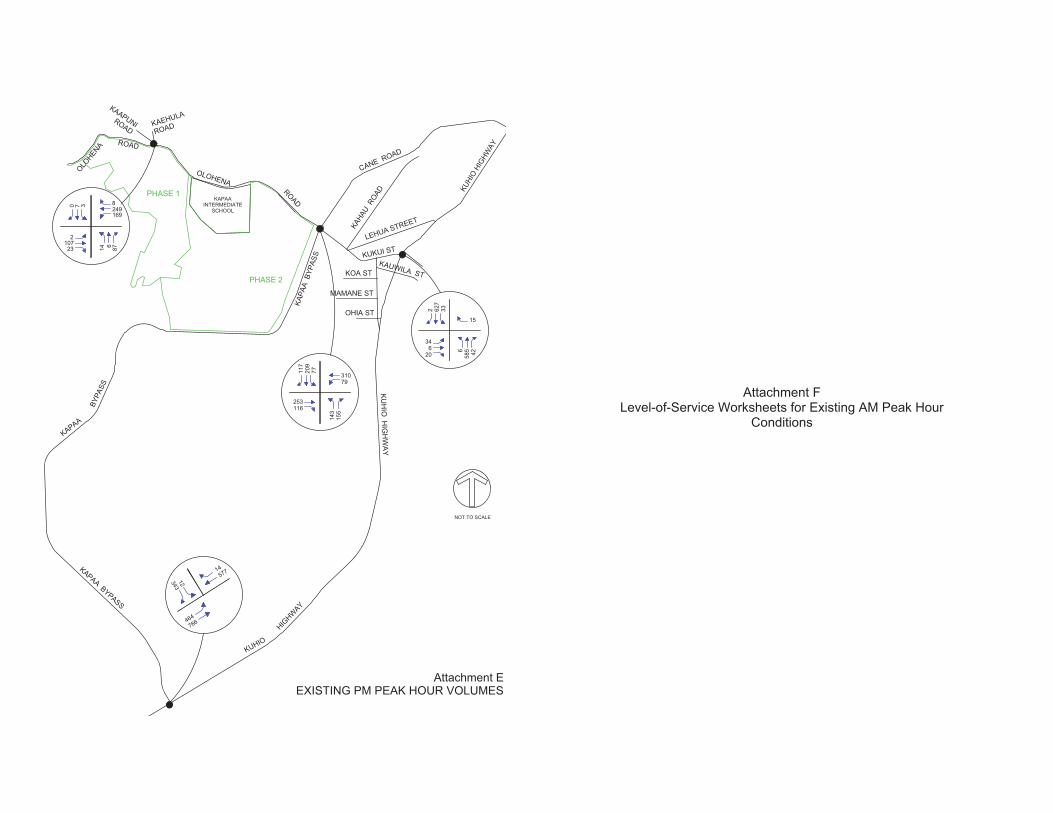
Attachment EEXISTING PM PEAK HOUR VOLUMES
NOT TO SCALE
KAPAAINTERMEDIATE
SCHOOL
PHASE 1
PHASE 2
12343
14577
464766
2 627
33
15
658
5 42
346
20
117
209
77 31079
143
155
253116
KAPAABYPASS
KUHIO
HIGHW
AY
KU
HIO
HIG
HW
AY
KUHI
OHI
GHWAY
OLOHENA
ROAD
OLOHENA ROAD
KAAPUNIROADKAEHULA
ROAD
KUKUI ST
CANE ROAD
KAHA
URO
AD
LEHUA STREET
KOA ST
MAMANE ST
OHIA ST
KAUWILA ST
KAPA
ABY
PASS
KAPAA
BYPA
SS
0 7 3 8249169
8761423107
2
Attachment FLevel-of-Service Worksheets for Existing AM Peak Hour
Conditions

HCM Signalized Intersection Capacity Analysis1: KUKUI STREET & KUHIO HIGHWAY 11/15/2013
HCM Signalized Intersection Capacity Analysis Kapaa Highlands TIARPhillip Rowell & Associates 2013 AM Peak Hour
Movement EBL EBT EBR WBL WBT WBR NBL NBT NBR SBL SBT SBRLane ConfigurationsIdeal Flow (vphpl) 1900 1900 1900 1900 1900 1900 1900 1900 1900 1900 1900 1900Total Lost time (s) 4.0 4.0 4.0 4.0 4.0 4.0 4.0Lane Util. Factor 1.00 1.00 1.00 1.00 1.00 1.00 1.00Frt 1.00 0.85 0.86 1.00 1.00 1.00 0.85Flt Protected 0.96 1.00 1.00 0.95 1.00 1.00 1.00Satd. Flow (prot) 1783 1583 1611 1770 1854 1858 1583Flt Permitted 0.96 1.00 1.00 0.28 1.00 0.95 1.00Satd. Flow (perm) 1783 1583 1611 523 1854 1774 1583Volume (vph) 39 5 47 0 0 7 7 677 21 30 604 4Peak-hour factor, PHF 0.92 0.92 0.92 0.92 0.92 0.92 0.92 0.92 0.92 0.92 0.92 0.92Adj. Flow (vph) 42 5 51 0 0 8 8 736 23 33 657 4RTOR Reduction (vph) 0 0 37 0 0 6 0 2 0 0 0 2Lane Group Flow (vph) 0 47 14 0 0 2 8 757 0 0 690 2Turn Type Perm Perm custom Perm Perm PermProtected Phases 4 2 6Permitted Phases 4 4 8 2 6 6Actuated Green, G (s) 16.0 16.0 16.0 36.0 36.0 36.0 36.0Effective Green, g (s) 16.0 16.0 16.0 36.0 36.0 36.0 36.0Actuated g/C Ratio 0.27 0.27 0.27 0.60 0.60 0.60 0.60Clearance Time (s) 4.0 4.0 4.0 4.0 4.0 4.0 4.0Lane Grp Cap (vph) 475 422 430 314 1112 1064 950v/s Ratio Prot c0.41v/s Ratio Perm 0.03 0.03 0.00 0.02 0.39 0.00v/c Ratio 0.10 0.03 0.00 0.03 0.68 0.65 0.00Uniform Delay, d1 16.6 16.3 16.2 4.9 8.1 7.9 4.8Progression Factor 1.00 1.00 1.00 1.00 1.00 1.00 1.00Incremental Delay, d2 0.4 0.1 0.0 0.1 3.4 3.1 0.0Delay (s) 17.0 16.4 16.2 5.0 11.5 10.9 4.8Level of Service B B B A B B AApproach Delay (s) 16.7 16.2 11.4 10.9Approach LOS B B B B
Intersection SummaryHCM Average Control Delay 11.5 HCM Level of Service BHCM Volume to Capacity ratio 0.51Actuated Cycle Length (s) 60.0 Sum of lost time (s) 8.0Intersection Capacity Utilization 66.2% ICU Level of Service CAnalysis Period (min) 15c Critical Lane Group
Queues1: KUKUI STREET & KUHIO HIGHWAY 11/15/2013
Queues Kapaa Highlands TIARPhillip Rowell & Associates 2013 AM Peak Hour
Lane Group EBT EBR WBR NBL NBT SBL SBT SBRLane ConfigurationsVolume (vph) 5 47 7 7 677 30 604 4Lane Group Flow (vph) 47 51 8 8 759 0 690 4Turn Type Permcustom Perm Perm PermProtected Phases 4 2 6Permitted Phases 4 8 2 6 6Minimum Split (s) 20.0 20.0 20.0 20.0 20.0 20.0 20.0 20.0Total Split (s) 20.0 20.0 20.0 40.0 40.0 40.0 40.0 40.0Total Split (%) 33.3% 33.3% 33.3% 66.7% 66.7% 66.7% 66.7% 66.7%Yellow Time (s) 3.5 3.5 3.5 3.5 3.5 3.5 3.5 3.5All-Red Time (s) 0.5 0.5 0.5 0.5 0.5 0.5 0.5 0.5Lead/LagLead-Lag Optimize?v/c Ratio 0.10 0.11 0.01 0.03 0.68 0.65 0.00Control Delay 17.3 6.6 0.0 5.1 12.0 11.5 3.5Queue Delay 0.0 0.0 0.0 0.0 0.0 0.0 0.0Total Delay 17.3 6.6 0.0 5.1 12.0 11.5 3.5Queue Length 50th (ft) 13 0 0 1 160 141 0Queue Length 95th (ft) 34 21 0 5 270 241 3Internal Link Dist (ft) 1654 6852 2720Turn Bay Length (ft)Base Capacity (vph) 475 460 591 314 1114 1064 951Starvation Cap Reductn 0 0 0 0 0 0 0Spillback Cap Reductn 0 0 0 0 0 0 0Storage Cap Reductn 0 0 0 0 0 0 0Reduced v/c Ratio 0.10 0.11 0.01 0.03 0.68 0.65 0.00
Intersection SummaryCycle Length: 60Actuated Cycle Length: 60Offset: 0 (0%), Referenced to phase 2:NBTL and 6:SBTL, Start of GreenNatural Cycle: 55Control Type: Pretimed
Splits and Phases: 1: KUKUI STREET & KUHIO HIGHWAY
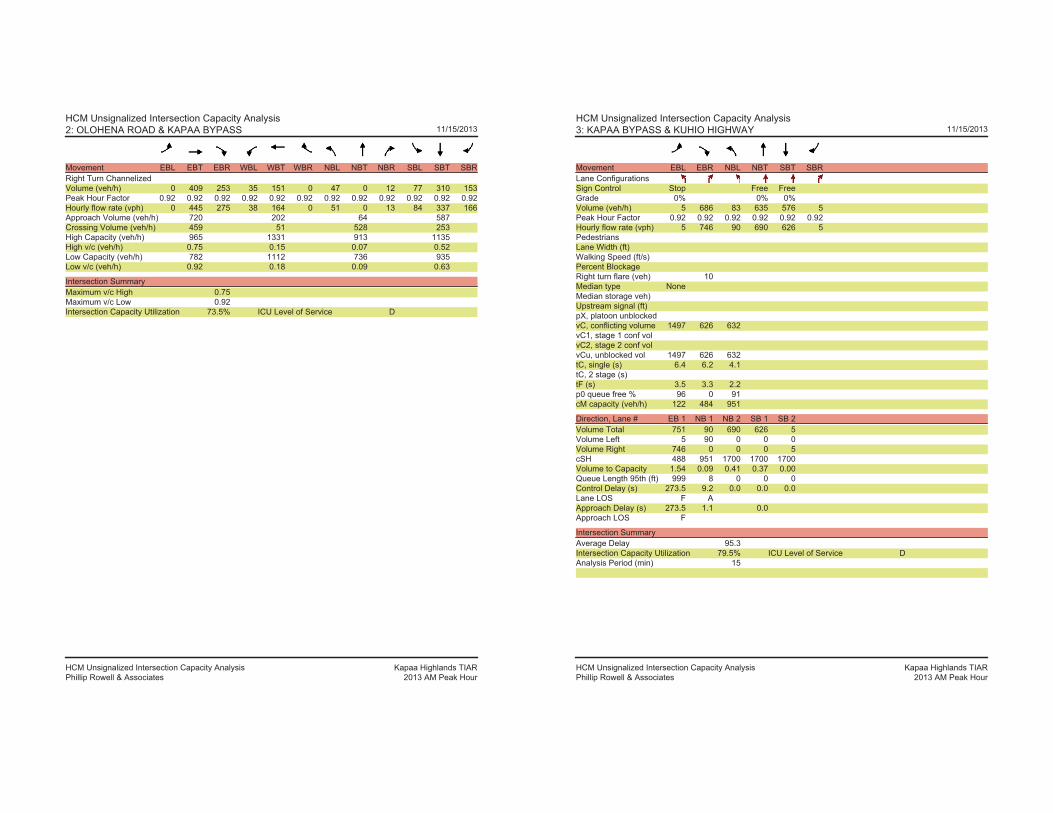
HCM Unsignalized Intersection Capacity Analysis2: OLOHENA ROAD & KAPAA BYPASS 11/15/2013
HCM Unsignalized Intersection Capacity Analysis Kapaa Highlands TIARPhillip Rowell & Associates 2013 AM Peak Hour
Movement EBL EBT EBR WBL WBT WBR NBL NBT NBR SBL SBT SBRRight Turn ChannelizedVolume (veh/h) 0 409 253 35 151 0 47 0 12 77 310 153Peak Hour Factor 0.92 0.92 0.92 0.92 0.92 0.92 0.92 0.92 0.92 0.92 0.92 0.92Hourly flow rate (vph) 0 445 275 38 164 0 51 0 13 84 337 166Approach Volume (veh/h) 720 202 64 587Crossing Volume (veh/h) 459 51 528 253High Capacity (veh/h) 965 1331 913 1135High v/c (veh/h) 0.75 0.15 0.07 0.52Low Capacity (veh/h) 782 1112 736 935Low v/c (veh/h) 0.92 0.18 0.09 0.63
Intersection SummaryMaximum v/c High 0.75Maximum v/c Low 0.92Intersection Capacity Utilization 73.5% ICU Level of Service D
HCM Unsignalized Intersection Capacity Analysis3: KAPAA BYPASS & KUHIO HIGHWAY 11/15/2013
HCM Unsignalized Intersection Capacity Analysis Kapaa Highlands TIARPhillip Rowell & Associates 2013 AM Peak Hour
Movement EBL EBR NBL NBT SBT SBRLane ConfigurationsSign Control Stop Free FreeGrade 0% 0% 0%Volume (veh/h) 5 686 83 635 576 5Peak Hour Factor 0.92 0.92 0.92 0.92 0.92 0.92Hourly flow rate (vph) 5 746 90 690 626 5PedestriansLane Width (ft)Walking Speed (ft/s)Percent BlockageRight turn flare (veh) 10Median type NoneMedian storage veh)Upstream signal (ft)pX, platoon unblockedvC, conflicting volume 1497 626 632vC1, stage 1 conf volvC2, stage 2 conf volvCu, unblocked vol 1497 626 632tC, single (s) 6.4 6.2 4.1tC, 2 stage (s)tF (s) 3.5 3.3 2.2p0 queue free % 96 0 91cM capacity (veh/h) 122 484 951
Direction, Lane # EB 1 NB 1 NB 2 SB 1 SB 2Volume Total 751 90 690 626 5Volume Left 5 90 0 0 0Volume Right 746 0 0 0 5cSH 488 951 1700 1700 1700Volume to Capacity 1.54 0.09 0.41 0.37 0.00Queue Length 95th (ft) 999 8 0 0 0Control Delay (s) 273.5 9.2 0.0 0.0 0.0Lane LOS F AApproach Delay (s) 273.5 1.1 0.0Approach LOS F
Intersection SummaryAverage Delay 95.3Intersection Capacity Utilization 79.5% ICU Level of Service DAnalysis Period (min) 15
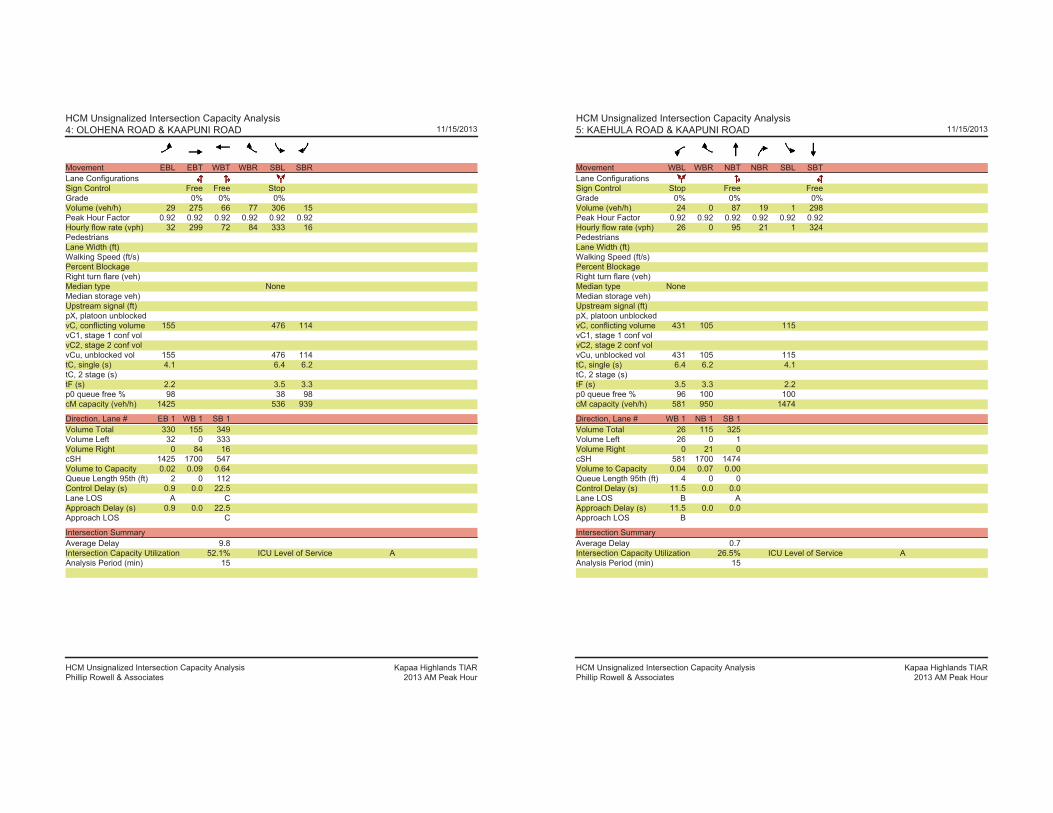
HCM Unsignalized Intersection Capacity Analysis4: OLOHENA ROAD & KAAPUNI ROAD 11/15/2013
HCM Unsignalized Intersection Capacity Analysis Kapaa Highlands TIARPhillip Rowell & Associates 2013 AM Peak Hour
Movement EBL EBT WBT WBR SBL SBRLane ConfigurationsSign Control Free Free StopGrade 0% 0% 0%Volume (veh/h) 29 275 66 77 306 15Peak Hour Factor 0.92 0.92 0.92 0.92 0.92 0.92Hourly flow rate (vph) 32 299 72 84 333 16PedestriansLane Width (ft)Walking Speed (ft/s)Percent BlockageRight turn flare (veh)Median type NoneMedian storage veh)Upstream signal (ft)pX, platoon unblockedvC, conflicting volume 155 476 114vC1, stage 1 conf volvC2, stage 2 conf volvCu, unblocked vol 155 476 114tC, single (s) 4.1 6.4 6.2tC, 2 stage (s)tF (s) 2.2 3.5 3.3p0 queue free % 98 38 98cM capacity (veh/h) 1425 536 939
Direction, Lane # EB 1 WB 1 SB 1Volume Total 330 155 349Volume Left 32 0 333Volume Right 0 84 16cSH 1425 1700 547Volume to Capacity 0.02 0.09 0.64Queue Length 95th (ft) 2 0 112Control Delay (s) 0.9 0.0 22.5Lane LOS A CApproach Delay (s) 0.9 0.0 22.5Approach LOS C
Intersection SummaryAverage Delay 9.8Intersection Capacity Utilization 52.1% ICU Level of Service AAnalysis Period (min) 15
HCM Unsignalized Intersection Capacity Analysis5: KAEHULA ROAD & KAAPUNI ROAD 11/15/2013
HCM Unsignalized Intersection Capacity Analysis Kapaa Highlands TIARPhillip Rowell & Associates 2013 AM Peak Hour
Movement WBL WBR NBT NBR SBL SBTLane ConfigurationsSign Control Stop Free FreeGrade 0% 0% 0%Volume (veh/h) 24 0 87 19 1 298Peak Hour Factor 0.92 0.92 0.92 0.92 0.92 0.92Hourly flow rate (vph) 26 0 95 21 1 324PedestriansLane Width (ft)Walking Speed (ft/s)Percent BlockageRight turn flare (veh)Median type NoneMedian storage veh)Upstream signal (ft)pX, platoon unblockedvC, conflicting volume 431 105 115vC1, stage 1 conf volvC2, stage 2 conf volvCu, unblocked vol 431 105 115tC, single (s) 6.4 6.2 4.1tC, 2 stage (s)tF (s) 3.5 3.3 2.2p0 queue free % 96 100 100cM capacity (veh/h) 581 950 1474
Direction, Lane # WB 1 NB 1 SB 1Volume Total 26 115 325Volume Left 26 0 1Volume Right 0 21 0cSH 581 1700 1474Volume to Capacity 0.04 0.07 0.00Queue Length 95th (ft) 4 0 0Control Delay (s) 11.5 0.0 0.0Lane LOS B AApproach Delay (s) 11.5 0.0 0.0Approach LOS B
Intersection SummaryAverage Delay 0.7Intersection Capacity Utilization 26.5% ICU Level of Service AAnalysis Period (min) 15
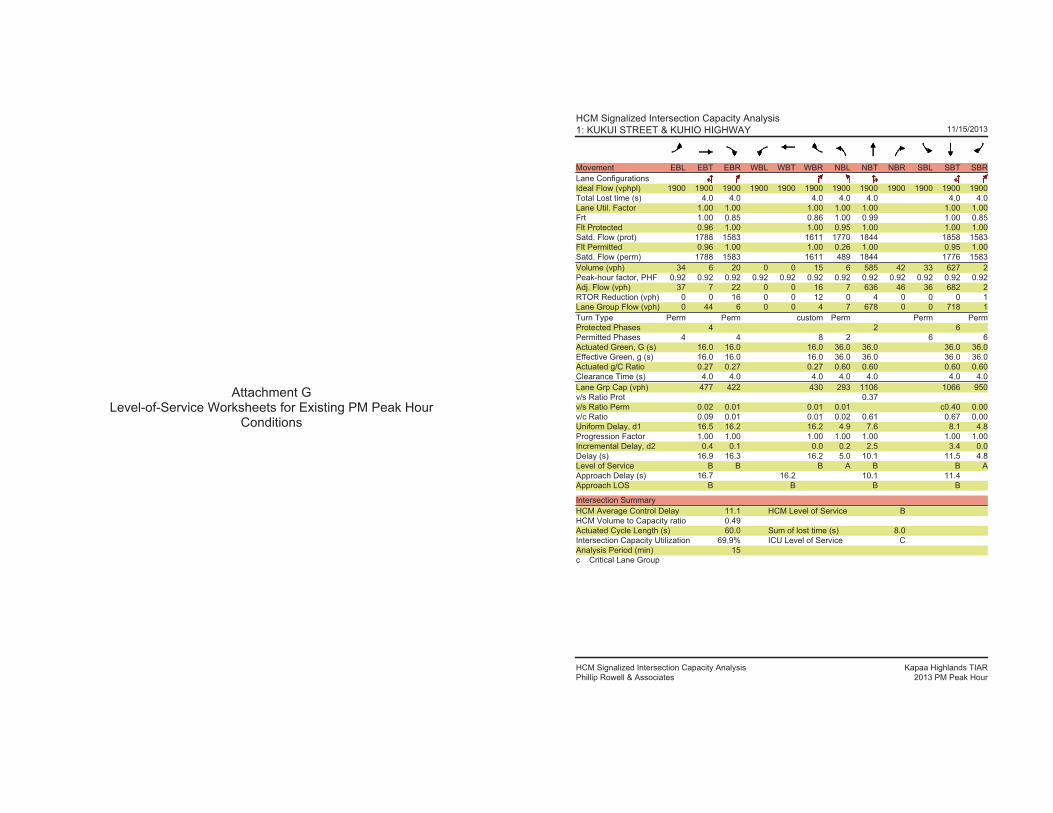
Attachment GLevel-of-Service Worksheets for Existing PM Peak Hour
Conditions
HCM Signalized Intersection Capacity Analysis1: KUKUI STREET & KUHIO HIGHWAY 11/15/2013
HCM Signalized Intersection Capacity Analysis Kapaa Highlands TIARPhillip Rowell & Associates 2013 PM Peak Hour
Movement EBL EBT EBR WBL WBT WBR NBL NBT NBR SBL SBT SBRLane ConfigurationsIdeal Flow (vphpl) 1900 1900 1900 1900 1900 1900 1900 1900 1900 1900 1900 1900Total Lost time (s) 4.0 4.0 4.0 4.0 4.0 4.0 4.0Lane Util. Factor 1.00 1.00 1.00 1.00 1.00 1.00 1.00Frt 1.00 0.85 0.86 1.00 0.99 1.00 0.85Flt Protected 0.96 1.00 1.00 0.95 1.00 1.00 1.00Satd. Flow (prot) 1788 1583 1611 1770 1844 1858 1583Flt Permitted 0.96 1.00 1.00 0.26 1.00 0.95 1.00Satd. Flow (perm) 1788 1583 1611 489 1844 1776 1583Volume (vph) 34 6 20 0 0 15 6 585 42 33 627 2Peak-hour factor, PHF 0.92 0.92 0.92 0.92 0.92 0.92 0.92 0.92 0.92 0.92 0.92 0.92Adj. Flow (vph) 37 7 22 0 0 16 7 636 46 36 682 2RTOR Reduction (vph) 0 0 16 0 0 12 0 4 0 0 0 1Lane Group Flow (vph) 0 44 6 0 0 4 7 678 0 0 718 1Turn Type Perm Perm custom Perm Perm PermProtected Phases 4 2 6Permitted Phases 4 4 8 2 6 6Actuated Green, G (s) 16.0 16.0 16.0 36.0 36.0 36.0 36.0Effective Green, g (s) 16.0 16.0 16.0 36.0 36.0 36.0 36.0Actuated g/C Ratio 0.27 0.27 0.27 0.60 0.60 0.60 0.60Clearance Time (s) 4.0 4.0 4.0 4.0 4.0 4.0 4.0Lane Grp Cap (vph) 477 422 430 293 1106 1066 950v/s Ratio Prot 0.37v/s Ratio Perm 0.02 0.01 0.01 0.01 c0.40 0.00v/c Ratio 0.09 0.01 0.01 0.02 0.61 0.67 0.00Uniform Delay, d1 16.5 16.2 16.2 4.9 7.6 8.1 4.8Progression Factor 1.00 1.00 1.00 1.00 1.00 1.00 1.00Incremental Delay, d2 0.4 0.1 0.0 0.2 2.5 3.4 0.0Delay (s) 16.9 16.3 16.2 5.0 10.1 11.5 4.8Level of Service B B B A B B AApproach Delay (s) 16.7 16.2 10.1 11.4Approach LOS B B B B
Intersection SummaryHCM Average Control Delay 11.1 HCM Level of Service BHCM Volume to Capacity ratio 0.49Actuated Cycle Length (s) 60.0 Sum of lost time (s) 8.0Intersection Capacity Utilization 69.9% ICU Level of Service CAnalysis Period (min) 15c Critical Lane Group

Queues1: KUKUI STREET & KUHIO HIGHWAY 11/15/2013
Queues Kapaa Highlands TIARPhillip Rowell & Associates 2013 PM Peak Hour
Lane Group EBT EBR WBR NBL NBT SBL SBT SBRLane ConfigurationsVolume (vph) 6 20 15 6 585 33 627 2Lane Group Flow (vph) 44 22 16 7 682 0 718 2Turn Type Permcustom Perm Perm PermProtected Phases 4 2 6Permitted Phases 4 8 2 6 6Minimum Split (s) 20.0 20.0 20.0 20.0 20.0 20.0 20.0 20.0Total Split (s) 20.0 20.0 20.0 40.0 40.0 40.0 40.0 40.0Total Split (%) 33.3% 33.3% 33.3% 66.7% 66.7% 66.7% 66.7% 66.7%Yellow Time (s) 3.5 3.5 3.5 3.5 3.5 3.5 3.5 3.5All-Red Time (s) 0.5 0.5 0.5 0.5 0.5 0.5 0.5 0.5Lead/LagLead-Lag Optimize?v/c Ratio 0.09 0.05 0.03 0.02 0.61 0.67 0.00Control Delay 17.3 8.3 0.1 5.2 10.5 12.1 3.5Queue Delay 0.0 0.0 0.0 0.0 0.0 0.0 0.0Total Delay 17.3 8.3 0.1 5.2 10.5 12.1 3.5Queue Length 50th (ft) 12 0 0 1 132 151 0Queue Length 95th (ft) 33 14 0 5 223 257 2Internal Link Dist (ft) 1654 6852 2720Turn Bay Length (ft)Base Capacity (vph) 477 438 631 293 1111 1066 951Starvation Cap Reductn 0 0 0 0 0 0 0Spillback Cap Reductn 0 0 0 0 0 0 0Storage Cap Reductn 0 0 0 0 0 0 0Reduced v/c Ratio 0.09 0.05 0.03 0.02 0.61 0.67 0.00
Intersection SummaryCycle Length: 60Actuated Cycle Length: 60Offset: 0 (0%), Referenced to phase 2:NBTL and 6:SBTL, Start of GreenNatural Cycle: 55Control Type: Pretimed
Splits and Phases: 1: KUKUI STREET & KUHIO HIGHWAY
HCM Unsignalized Intersection Capacity Analysis2: OLOHENA ROAD & KAPAA BYPASS 11/15/2013
HCM Unsignalized Intersection Capacity Analysis Kapaa Highlands TIARPhillip Rowell & Associates 2013 PM Peak Hour
Movement EBL EBT EBR WBL WBT WBR NBL NBT NBR SBL SBT SBRRight Turn ChannelizedVolume (veh/h) 0 253 116 79 310 0 143 0 155 77 209 117Peak Hour Factor 0.92 0.92 0.92 0.92 0.92 0.92 0.92 0.92 0.92 0.92 0.92 0.92Hourly flow rate (vph) 0 275 126 86 337 0 155 0 168 84 227 127Approach Volume (veh/h) 401 423 324 438Crossing Volume (veh/h) 397 155 359 578High Capacity (veh/h) 1014 1226 1045 877High v/c (veh/h) 0.40 0.34 0.31 0.50Low Capacity (veh/h) 826 1017 854 704Low v/c (veh/h) 0.49 0.42 0.38 0.62
Intersection SummaryMaximum v/c High 0.50Maximum v/c Low 0.62Intersection Capacity Utilization 88.5% ICU Level of Service E
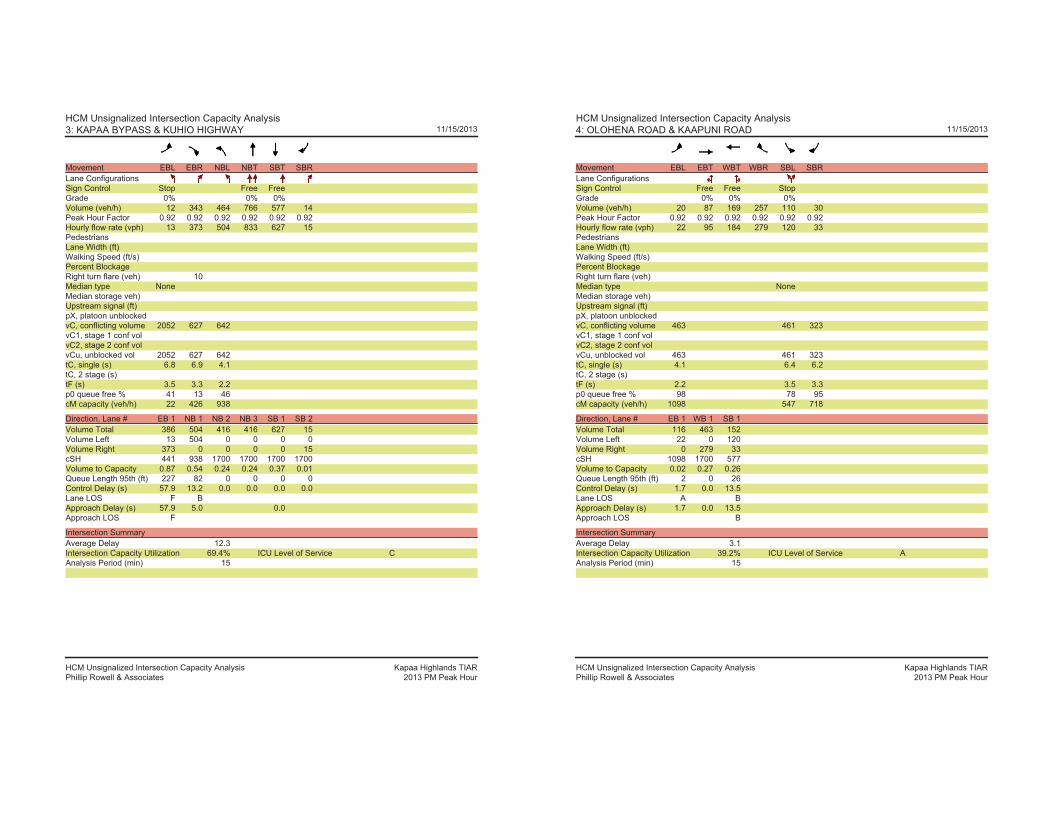
HCM Unsignalized Intersection Capacity Analysis3: KAPAA BYPASS & KUHIO HIGHWAY 11/15/2013
HCM Unsignalized Intersection Capacity Analysis Kapaa Highlands TIARPhillip Rowell & Associates 2013 PM Peak Hour
Movement EBL EBR NBL NBT SBT SBRLane ConfigurationsSign Control Stop Free FreeGrade 0% 0% 0%Volume (veh/h) 12 343 464 766 577 14Peak Hour Factor 0.92 0.92 0.92 0.92 0.92 0.92Hourly flow rate (vph) 13 373 504 833 627 15PedestriansLane Width (ft)Walking Speed (ft/s)Percent BlockageRight turn flare (veh) 10Median type NoneMedian storage veh)Upstream signal (ft)pX, platoon unblockedvC, conflicting volume 2052 627 642vC1, stage 1 conf volvC2, stage 2 conf volvCu, unblocked vol 2052 627 642tC, single (s) 6.8 6.9 4.1tC, 2 stage (s)tF (s) 3.5 3.3 2.2p0 queue free % 41 13 46cM capacity (veh/h) 22 426 938
Direction, Lane # EB 1 NB 1 NB 2 NB 3 SB 1 SB 2Volume Total 386 504 416 416 627 15Volume Left 13 504 0 0 0 0Volume Right 373 0 0 0 0 15cSH 441 938 1700 1700 1700 1700Volume to Capacity 0.87 0.54 0.24 0.24 0.37 0.01Queue Length 95th (ft) 227 82 0 0 0 0Control Delay (s) 57.9 13.2 0.0 0.0 0.0 0.0Lane LOS F BApproach Delay (s) 57.9 5.0 0.0Approach LOS F
Intersection SummaryAverage Delay 12.3Intersection Capacity Utilization 69.4% ICU Level of Service CAnalysis Period (min) 15
HCM Unsignalized Intersection Capacity Analysis4: OLOHENA ROAD & KAAPUNI ROAD 11/15/2013
HCM Unsignalized Intersection Capacity Analysis Kapaa Highlands TIARPhillip Rowell & Associates 2013 PM Peak Hour
Movement EBL EBT WBT WBR SBL SBRLane ConfigurationsSign Control Free Free StopGrade 0% 0% 0%Volume (veh/h) 20 87 169 257 110 30Peak Hour Factor 0.92 0.92 0.92 0.92 0.92 0.92Hourly flow rate (vph) 22 95 184 279 120 33PedestriansLane Width (ft)Walking Speed (ft/s)Percent BlockageRight turn flare (veh)Median type NoneMedian storage veh)Upstream signal (ft)pX, platoon unblockedvC, conflicting volume 463 461 323vC1, stage 1 conf volvC2, stage 2 conf volvCu, unblocked vol 463 461 323tC, single (s) 4.1 6.4 6.2tC, 2 stage (s)tF (s) 2.2 3.5 3.3p0 queue free % 98 78 95cM capacity (veh/h) 1098 547 718
Direction, Lane # EB 1 WB 1 SB 1Volume Total 116 463 152Volume Left 22 0 120Volume Right 0 279 33cSH 1098 1700 577Volume to Capacity 0.02 0.27 0.26Queue Length 95th (ft) 2 0 26Control Delay (s) 1.7 0.0 13.5Lane LOS A BApproach Delay (s) 1.7 0.0 13.5Approach LOS B
Intersection SummaryAverage Delay 3.1Intersection Capacity Utilization 39.2% ICU Level of Service AAnalysis Period (min) 15
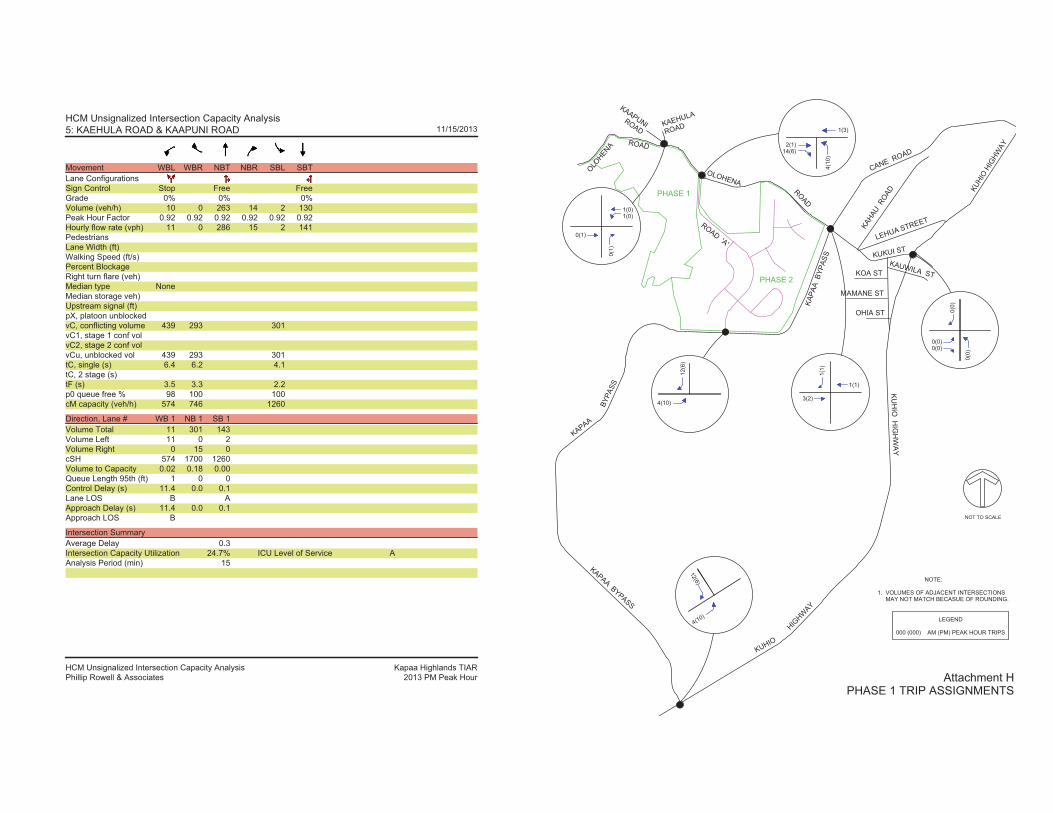
HCM Unsignalized Intersection Capacity Analysis5: KAEHULA ROAD & KAAPUNI ROAD 11/15/2013
HCM Unsignalized Intersection Capacity Analysis Kapaa Highlands TIARPhillip Rowell & Associates 2013 PM Peak Hour
Movement WBL WBR NBT NBR SBL SBTLane ConfigurationsSign Control Stop Free FreeGrade 0% 0% 0%Volume (veh/h) 10 0 263 14 2 130Peak Hour Factor 0.92 0.92 0.92 0.92 0.92 0.92Hourly flow rate (vph) 11 0 286 15 2 141PedestriansLane Width (ft)Walking Speed (ft/s)Percent BlockageRight turn flare (veh)Median type NoneMedian storage veh)Upstream signal (ft)pX, platoon unblockedvC, conflicting volume 439 293 301vC1, stage 1 conf volvC2, stage 2 conf volvCu, unblocked vol 439 293 301tC, single (s) 6.4 6.2 4.1tC, 2 stage (s)tF (s) 3.5 3.3 2.2p0 queue free % 98 100 100cM capacity (veh/h) 574 746 1260
Direction, Lane # WB 1 NB 1 SB 1Volume Total 11 301 143Volume Left 11 0 2Volume Right 0 15 0cSH 574 1700 1260Volume to Capacity 0.02 0.18 0.00Queue Length 95th (ft) 1 0 0Control Delay (s) 11.4 0.0 0.1Lane LOS B AApproach Delay (s) 11.4 0.0 0.1Approach LOS B
Intersection SummaryAverage Delay 0.3Intersection Capacity Utilization 24.7% ICU Level of Service AAnalysis Period (min) 15
Attachment HPHASE 1 TRIP ASSIGNMENTS
NOT TO SCALE
PHASE 1
PHASE 2
12(6)
4(10)
0(0)
0(0)
0(0)0(0)
1(1)
1(1)
3(2)
KAPAABYPASS
KUHIO
HIGHW
AY
KU
HIO
HIG
HW
AY
KUHI
OHI
GHWAY
OLOHENA
ROAD
OLOHENA ROAD
KAAPUNIROADKAEHULA
ROAD
KUKUI ST
CANE ROAD
KAHA
URO
AD
LEHUA STREET
KOA ST
MAMANE ST
OHIA ST
KAUWILA ST
KAPA
ABY
PASS
KAPAA
BYPA
SS
1(0)1(0)
0(1)
0(1)
1(3)
4(10
)
2(1)14(6)
12(6
)
4(10)
LEGEND
000 (000) AM (PM) PEAK HOUR TRIPS
NOTE:
1. VOLUMES OF ADJACENT INTERSECTIONSMAY NOT MATCH BECASUE OF ROUNDING.
ROAD'A'

Attachment IPHASE 2 TRIP ASSIGNMENTS
NOT TO SCALE
PHASE 1
PHASE 2
198(126)
82(200)
1(3)
2(6)
3(2)6(4)
9(29
)
9(29)
57(36)
KAPAABYPASS
KUHIO
HIGHW
AY
KU
HIO
HIG
HW
AY
KUHI
OHI
GHWAY
OLOHENA
ROAD
OLOHENA ROAD
KAAPUNIROADKAEHULA
ROAD
KUKUI ST
CANE ROAD
KAHA
URO
AD
LEHUA STREET
KOA ST
MAMANE ST
OHIA ST
KAUWILA ST
KAPA
ABY
PASS
KAPAA
BYPA
SS
14(9)14(9)
4(14
)
4(14)
198(
126)
62(200)
18(57)
57(3
6)
28(1
8)9(29)
LEGEND
000 (000) AM (PM) PEAK HOUR TRIPS
NOTE:
1. VOLUMES OF ADJACENT INTERSECTIONSMAY NOT MATCH BECASUE OF ROUNDING.
ROAD'A'
Attachment JREASSIGNMENT OF EXISTING TRIPS
NOT TO SCALE
PHASE 1
PHASE 2
KAPAABYPASS
KUHIO
HIGHW
AY
KU
HIO
HIG
HW
AY
KUHI
OHI
GHWAY
OLOHENA
ROAD
OLOHENA ROAD
KAAPUNIROADKAEHULA
ROAD
KUKUI ST
CANE ROAD
KAHA
URO
AD
LEHUA STREET
KOA ST
MAMANE ST
OHIA ST
KAUWILA ST
KAPA
ABY
PASS
KAPAA
BYPA
SS
<30> (<70>)
<125> (<80>)125 (80)
30 (7
0)
125
(80)
<125> (<80>)
30 (70)<30> (<70>)
<30>
(<70
>)<125> (<80>)
LEGEND
000 (000) AM (PM) PEAK HOUR TRIPS
NOTE:
1. VOLUMES OF ADJACENT INTERSECTIONSMAY NOT MATCH BECASUE OF ROUNDING.
ROAD'A'
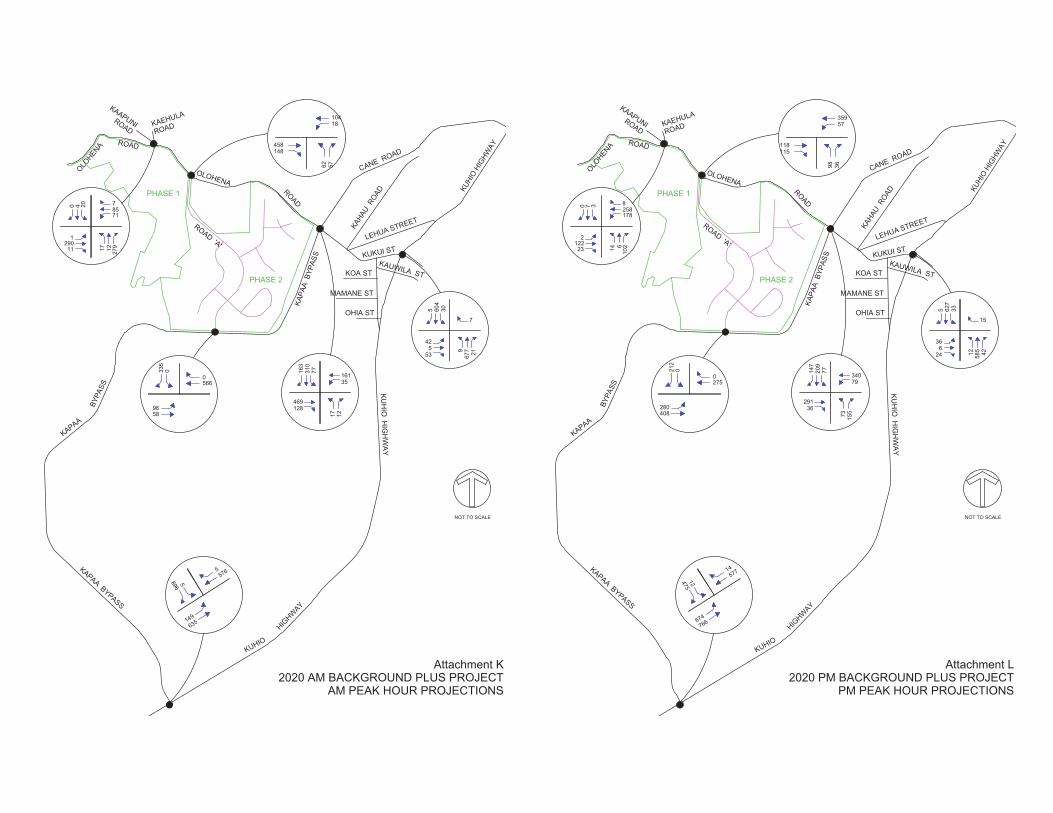
Attachment K2020 AM BACKGROUND PLUS PROJECT
AM PEAK HOUR PROJECTIONS
NOT TO SCALE
PHASE 1
PHASE 2
5896
5576
149635
5 604
30
7
967
7 21
425
53
163
310
77 16135
17 12
469128
KAPAABYPASS
KUHIO
HIGHW
AY
KU
HIO
HIG
HW
AY
KUHI
OHI
GHWAY
OLOHENA
ROAD
OLOHENA ROAD
KAAPUNIROADKAEHULA
ROAD
KUKUI ST
CANE ROAD
KAHA
URO
AD
LEHUA STREET
KOA ST
MAMANE ST
OHIA ST
KAUWILA ST
KAPA
ABY
PASS
KAPAA
BYPA
SS
0 4 20 78571
279121711
2901
10418
5762
148458
335
0
0566
5896
ROAD'A'
Attachment L2020 PM BACKGROUND PLUS PROJECT
PM PEAK HOUR PROJECTIONS
NOT TO SCALE
PHASE 1
PHASE 2
12475
14577
674766
5 627
33
15
12 585 42
366
24
147
209
77 34079
73 155
29136
KAPAABYPASS
KUHIO
HIGHW
AY
KU
HIO
HIG
HW
AY
KUHI
OHI
GHWAY
OLOHENA
ROAD
OLOHENA ROAD
KAAPUNIROADKAEHULA
ROAD
KUKUI ST
CANE ROAD
KAHA
URO
AD
LEHUA STREET
KOA ST
MAMANE ST
OHIA ST
KAUWILA ST
KAPA
ABY
PASS
KAPAA
BYPA
SS
0 7 3 8258178
10261423
1222
212
0
0275
408280
35957
3698
115118
ROAD'A'
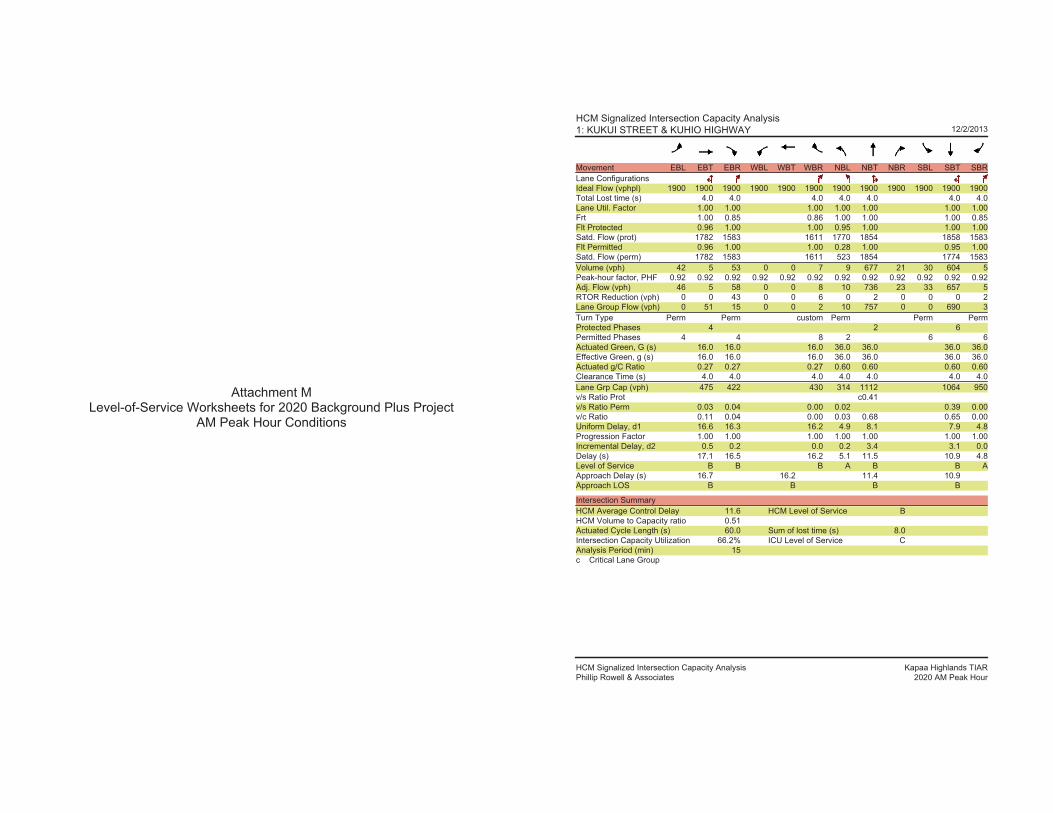
Attachment MLevel-of-Service Worksheets for 2020 Background Plus Project
AM Peak Hour Conditions
HCM Signalized Intersection Capacity Analysis1: KUKUI STREET & KUHIO HIGHWAY 12/2/2013
HCM Signalized Intersection Capacity Analysis Kapaa Highlands TIARPhillip Rowell & Associates 2020 AM Peak Hour
Movement EBL EBT EBR WBL WBT WBR NBL NBT NBR SBL SBT SBRLane ConfigurationsIdeal Flow (vphpl) 1900 1900 1900 1900 1900 1900 1900 1900 1900 1900 1900 1900Total Lost time (s) 4.0 4.0 4.0 4.0 4.0 4.0 4.0Lane Util. Factor 1.00 1.00 1.00 1.00 1.00 1.00 1.00Frt 1.00 0.85 0.86 1.00 1.00 1.00 0.85Flt Protected 0.96 1.00 1.00 0.95 1.00 1.00 1.00Satd. Flow (prot) 1782 1583 1611 1770 1854 1858 1583Flt Permitted 0.96 1.00 1.00 0.28 1.00 0.95 1.00Satd. Flow (perm) 1782 1583 1611 523 1854 1774 1583Volume (vph) 42 5 53 0 0 7 9 677 21 30 604 5Peak-hour factor, PHF 0.92 0.92 0.92 0.92 0.92 0.92 0.92 0.92 0.92 0.92 0.92 0.92Adj. Flow (vph) 46 5 58 0 0 8 10 736 23 33 657 5RTOR Reduction (vph) 0 0 43 0 0 6 0 2 0 0 0 2Lane Group Flow (vph) 0 51 15 0 0 2 10 757 0 0 690 3Turn Type Perm Perm custom Perm Perm PermProtected Phases 4 2 6Permitted Phases 4 4 8 2 6 6Actuated Green, G (s) 16.0 16.0 16.0 36.0 36.0 36.0 36.0Effective Green, g (s) 16.0 16.0 16.0 36.0 36.0 36.0 36.0Actuated g/C Ratio 0.27 0.27 0.27 0.60 0.60 0.60 0.60Clearance Time (s) 4.0 4.0 4.0 4.0 4.0 4.0 4.0Lane Grp Cap (vph) 475 422 430 314 1112 1064 950v/s Ratio Prot c0.41v/s Ratio Perm 0.03 0.04 0.00 0.02 0.39 0.00v/c Ratio 0.11 0.04 0.00 0.03 0.68 0.65 0.00Uniform Delay, d1 16.6 16.3 16.2 4.9 8.1 7.9 4.8Progression Factor 1.00 1.00 1.00 1.00 1.00 1.00 1.00Incremental Delay, d2 0.5 0.2 0.0 0.2 3.4 3.1 0.0Delay (s) 17.1 16.5 16.2 5.1 11.5 10.9 4.8Level of Service B B B A B B AApproach Delay (s) 16.7 16.2 11.4 10.9Approach LOS B B B B
Intersection SummaryHCM Average Control Delay 11.6 HCM Level of Service BHCM Volume to Capacity ratio 0.51Actuated Cycle Length (s) 60.0 Sum of lost time (s) 8.0Intersection Capacity Utilization 66.2% ICU Level of Service CAnalysis Period (min) 15c Critical Lane Group

Queues1: KUKUI STREET & KUHIO HIGHWAY 12/2/2013
Queues Kapaa Highlands TIARPhillip Rowell & Associates 2020 AM Peak Hour
Lane Group EBT EBR WBR NBL NBT SBL SBT SBRLane ConfigurationsVolume (vph) 5 53 7 9 677 30 604 5Lane Group Flow (vph) 51 58 8 10 759 0 690 5Turn Type Permcustom Perm Perm PermProtected Phases 4 2 6Permitted Phases 4 8 2 6 6Minimum Split (s) 20.0 20.0 20.0 20.0 20.0 20.0 20.0 20.0Total Split (s) 20.0 20.0 20.0 40.0 40.0 40.0 40.0 40.0Total Split (%) 33.3% 33.3% 33.3% 66.7% 66.7% 66.7% 66.7% 66.7%Yellow Time (s) 3.5 3.5 3.5 3.5 3.5 3.5 3.5 3.5All-Red Time (s) 0.5 0.5 0.5 0.5 0.5 0.5 0.5 0.5Lead/LagLead-Lag Optimize?v/c Ratio 0.11 0.12 0.01 0.03 0.68 0.65 0.01Control Delay 17.4 6.4 0.0 5.3 12.0 11.5 3.2Queue Delay 0.0 0.0 0.0 0.0 0.0 0.0 0.0Total Delay 17.4 6.4 0.0 5.3 12.0 11.5 3.2Queue Length 50th (ft) 14 0 0 1 160 141 0Queue Length 95th (ft) 36 23 0 6 270 241 3Internal Link Dist (ft) 1654 6852 2720Turn Bay Length (ft)Base Capacity (vph) 475 465 591 314 1114 1064 952Starvation Cap Reductn 0 0 0 0 0 0 0Spillback Cap Reductn 0 0 0 0 0 0 0Storage Cap Reductn 0 0 0 0 0 0 0Reduced v/c Ratio 0.11 0.12 0.01 0.03 0.68 0.65 0.01
Intersection SummaryCycle Length: 60Actuated Cycle Length: 60Offset: 0 (0%), Referenced to phase 2:NBTL and 6:SBTL, Start of GreenNatural Cycle: 55Control Type: Pretimed
Splits and Phases: 1: KUKUI STREET & KUHIO HIGHWAY
HCM Unsignalized Intersection Capacity Analysis2: OLOHENA ROAD & KAPAA BYPASS 12/2/2013
HCM Unsignalized Intersection Capacity Analysis Kapaa Highlands TIARPhillip Rowell & Associates 2020 AM Peak Hour
Movement EBL EBT EBR WBL WBT WBR NBL NBT NBR SBL SBT SBRRight Turn ChannelizedVolume (veh/h) 0 469 128 35 161 0 17 0 12 77 310 163Peak Hour Factor 0.92 0.92 0.92 0.92 0.92 0.92 0.92 0.92 0.92 0.92 0.92 0.92Hourly flow rate (vph) 0 510 139 38 175 0 18 0 13 84 337 177Approach Volume (veh/h) 649 213 32 598Crossing Volume (veh/h) 459 18 593 232High Capacity (veh/h) 965 1365 866 1155High v/c (veh/h) 0.67 0.16 0.04 0.52Low Capacity (veh/h) 782 1143 695 953Low v/c (veh/h) 0.83 0.19 0.05 0.63
Intersection SummaryMaximum v/c High 0.67Maximum v/c Low 0.83Intersection Capacity Utilization 75.6% ICU Level of Service D
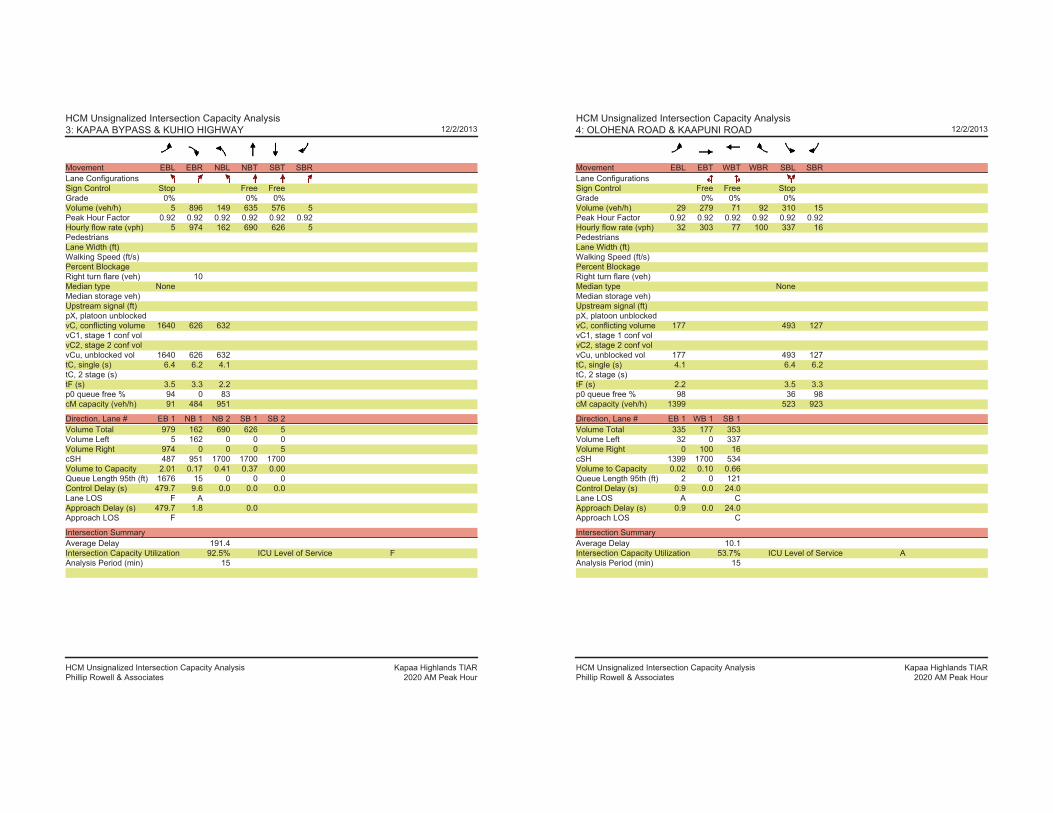
HCM Unsignalized Intersection Capacity Analysis3: KAPAA BYPASS & KUHIO HIGHWAY 12/2/2013
HCM Unsignalized Intersection Capacity Analysis Kapaa Highlands TIARPhillip Rowell & Associates 2020 AM Peak Hour
Movement EBL EBR NBL NBT SBT SBRLane ConfigurationsSign Control Stop Free FreeGrade 0% 0% 0%Volume (veh/h) 5 896 149 635 576 5Peak Hour Factor 0.92 0.92 0.92 0.92 0.92 0.92Hourly flow rate (vph) 5 974 162 690 626 5PedestriansLane Width (ft)Walking Speed (ft/s)Percent BlockageRight turn flare (veh) 10Median type NoneMedian storage veh)Upstream signal (ft)pX, platoon unblockedvC, conflicting volume 1640 626 632vC1, stage 1 conf volvC2, stage 2 conf volvCu, unblocked vol 1640 626 632tC, single (s) 6.4 6.2 4.1tC, 2 stage (s)tF (s) 3.5 3.3 2.2p0 queue free % 94 0 83cM capacity (veh/h) 91 484 951
Direction, Lane # EB 1 NB 1 NB 2 SB 1 SB 2Volume Total 979 162 690 626 5Volume Left 5 162 0 0 0Volume Right 974 0 0 0 5cSH 487 951 1700 1700 1700Volume to Capacity 2.01 0.17 0.41 0.37 0.00Queue Length 95th (ft) 1676 15 0 0 0Control Delay (s) 479.7 9.6 0.0 0.0 0.0Lane LOS F AApproach Delay (s) 479.7 1.8 0.0Approach LOS F
Intersection SummaryAverage Delay 191.4Intersection Capacity Utilization 92.5% ICU Level of Service FAnalysis Period (min) 15
HCM Unsignalized Intersection Capacity Analysis4: OLOHENA ROAD & KAAPUNI ROAD 12/2/2013
HCM Unsignalized Intersection Capacity Analysis Kapaa Highlands TIARPhillip Rowell & Associates 2020 AM Peak Hour
Movement EBL EBT WBT WBR SBL SBRLane ConfigurationsSign Control Free Free StopGrade 0% 0% 0%Volume (veh/h) 29 279 71 92 310 15Peak Hour Factor 0.92 0.92 0.92 0.92 0.92 0.92Hourly flow rate (vph) 32 303 77 100 337 16PedestriansLane Width (ft)Walking Speed (ft/s)Percent BlockageRight turn flare (veh)Median type NoneMedian storage veh)Upstream signal (ft)pX, platoon unblockedvC, conflicting volume 177 493 127vC1, stage 1 conf volvC2, stage 2 conf volvCu, unblocked vol 177 493 127tC, single (s) 4.1 6.4 6.2tC, 2 stage (s)tF (s) 2.2 3.5 3.3p0 queue free % 98 36 98cM capacity (veh/h) 1399 523 923
Direction, Lane # EB 1 WB 1 SB 1Volume Total 335 177 353Volume Left 32 0 337Volume Right 0 100 16cSH 1399 1700 534Volume to Capacity 0.02 0.10 0.66Queue Length 95th (ft) 2 0 121Control Delay (s) 0.9 0.0 24.0Lane LOS A CApproach Delay (s) 0.9 0.0 24.0Approach LOS C
Intersection SummaryAverage Delay 10.1Intersection Capacity Utilization 53.7% ICU Level of Service AAnalysis Period (min) 15
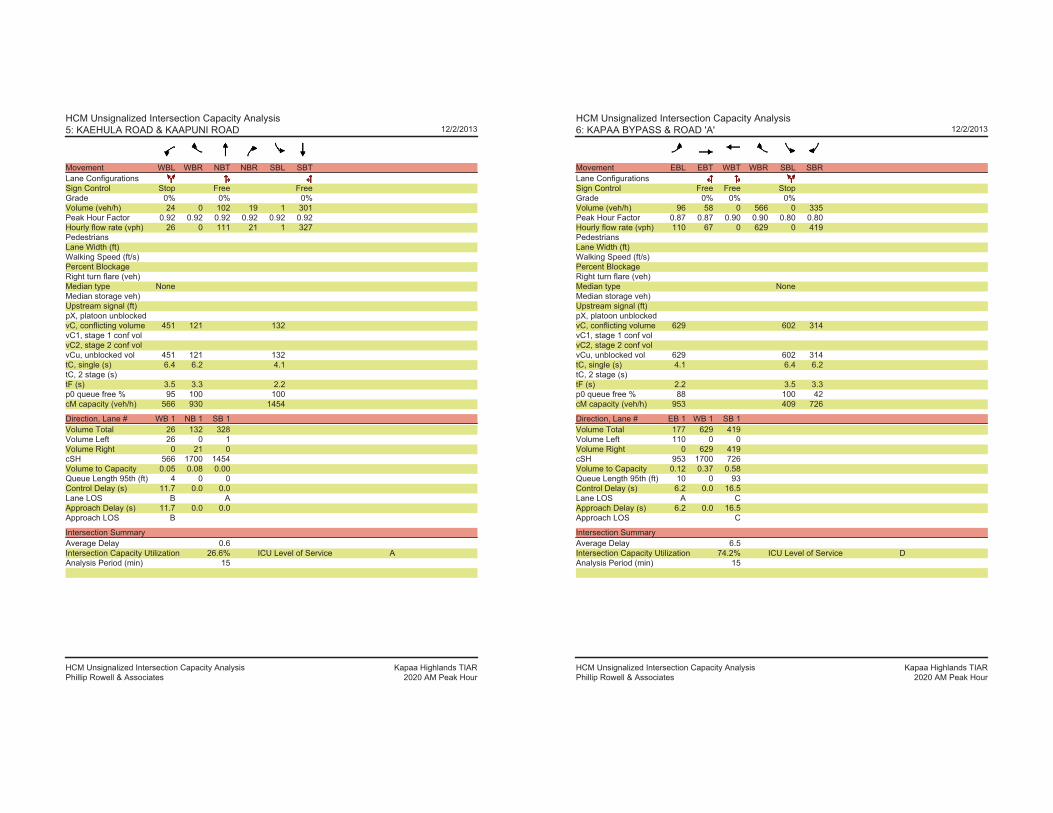
HCM Unsignalized Intersection Capacity Analysis5: KAEHULA ROAD & KAAPUNI ROAD 12/2/2013
HCM Unsignalized Intersection Capacity Analysis Kapaa Highlands TIARPhillip Rowell & Associates 2020 AM Peak Hour
Movement WBL WBR NBT NBR SBL SBTLane ConfigurationsSign Control Stop Free FreeGrade 0% 0% 0%Volume (veh/h) 24 0 102 19 1 301Peak Hour Factor 0.92 0.92 0.92 0.92 0.92 0.92Hourly flow rate (vph) 26 0 111 21 1 327PedestriansLane Width (ft)Walking Speed (ft/s)Percent BlockageRight turn flare (veh)Median type NoneMedian storage veh)Upstream signal (ft)pX, platoon unblockedvC, conflicting volume 451 121 132vC1, stage 1 conf volvC2, stage 2 conf volvCu, unblocked vol 451 121 132tC, single (s) 6.4 6.2 4.1tC, 2 stage (s)tF (s) 3.5 3.3 2.2p0 queue free % 95 100 100cM capacity (veh/h) 566 930 1454
Direction, Lane # WB 1 NB 1 SB 1Volume Total 26 132 328Volume Left 26 0 1Volume Right 0 21 0cSH 566 1700 1454Volume to Capacity 0.05 0.08 0.00Queue Length 95th (ft) 4 0 0Control Delay (s) 11.7 0.0 0.0Lane LOS B AApproach Delay (s) 11.7 0.0 0.0Approach LOS B
Intersection SummaryAverage Delay 0.6Intersection Capacity Utilization 26.6% ICU Level of Service AAnalysis Period (min) 15
HCM Unsignalized Intersection Capacity Analysis6: KAPAA BYPASS & ROAD 'A' 12/2/2013
HCM Unsignalized Intersection Capacity Analysis Kapaa Highlands TIARPhillip Rowell & Associates 2020 AM Peak Hour
Movement EBL EBT WBT WBR SBL SBRLane ConfigurationsSign Control Free Free StopGrade 0% 0% 0%Volume (veh/h) 96 58 0 566 0 335Peak Hour Factor 0.87 0.87 0.90 0.90 0.80 0.80Hourly flow rate (vph) 110 67 0 629 0 419PedestriansLane Width (ft)Walking Speed (ft/s)Percent BlockageRight turn flare (veh)Median type NoneMedian storage veh)Upstream signal (ft)pX, platoon unblockedvC, conflicting volume 629 602 314vC1, stage 1 conf volvC2, stage 2 conf volvCu, unblocked vol 629 602 314tC, single (s) 4.1 6.4 6.2tC, 2 stage (s)tF (s) 2.2 3.5 3.3p0 queue free % 88 100 42cM capacity (veh/h) 953 409 726
Direction, Lane # EB 1 WB 1 SB 1Volume Total 177 629 419Volume Left 110 0 0Volume Right 0 629 419cSH 953 1700 726Volume to Capacity 0.12 0.37 0.58Queue Length 95th (ft) 10 0 93Control Delay (s) 6.2 0.0 16.5Lane LOS A CApproach Delay (s) 6.2 0.0 16.5Approach LOS C
Intersection SummaryAverage Delay 6.5Intersection Capacity Utilization 74.2% ICU Level of Service DAnalysis Period (min) 15
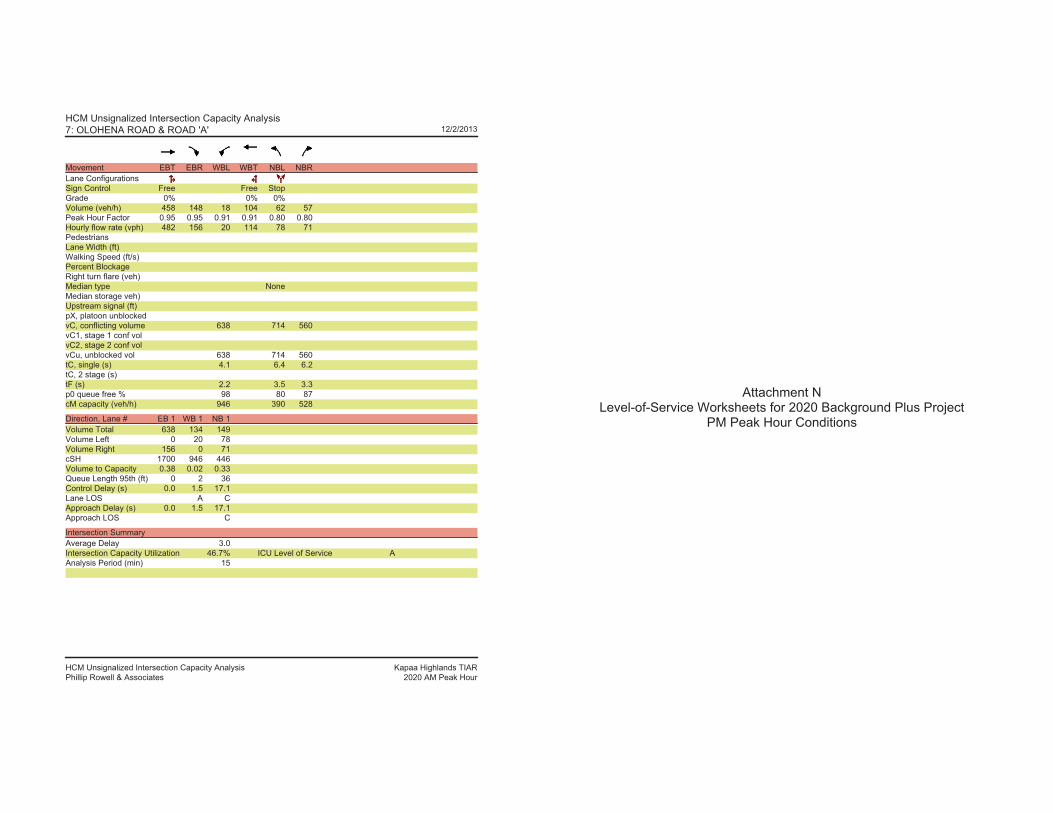
HCM Unsignalized Intersection Capacity Analysis7: OLOHENA ROAD & ROAD 'A' 12/2/2013
HCM Unsignalized Intersection Capacity Analysis Kapaa Highlands TIARPhillip Rowell & Associates 2020 AM Peak Hour
Movement EBT EBR WBL WBT NBL NBRLane ConfigurationsSign Control Free Free StopGrade 0% 0% 0%Volume (veh/h) 458 148 18 104 62 57Peak Hour Factor 0.95 0.95 0.91 0.91 0.80 0.80Hourly flow rate (vph) 482 156 20 114 78 71PedestriansLane Width (ft)Walking Speed (ft/s)Percent BlockageRight turn flare (veh)Median type NoneMedian storage veh)Upstream signal (ft)pX, platoon unblockedvC, conflicting volume 638 714 560vC1, stage 1 conf volvC2, stage 2 conf volvCu, unblocked vol 638 714 560tC, single (s) 4.1 6.4 6.2tC, 2 stage (s)tF (s) 2.2 3.5 3.3p0 queue free % 98 80 87cM capacity (veh/h) 946 390 528
Direction, Lane # EB 1 WB 1 NB 1Volume Total 638 134 149Volume Left 0 20 78Volume Right 156 0 71cSH 1700 946 446Volume to Capacity 0.38 0.02 0.33Queue Length 95th (ft) 0 2 36Control Delay (s) 0.0 1.5 17.1Lane LOS A CApproach Delay (s) 0.0 1.5 17.1Approach LOS C
Intersection SummaryAverage Delay 3.0Intersection Capacity Utilization 46.7% ICU Level of Service AAnalysis Period (min) 15
Attachment NLevel-of-Service Worksheets for 2020 Background Plus Project
PM Peak Hour Conditions
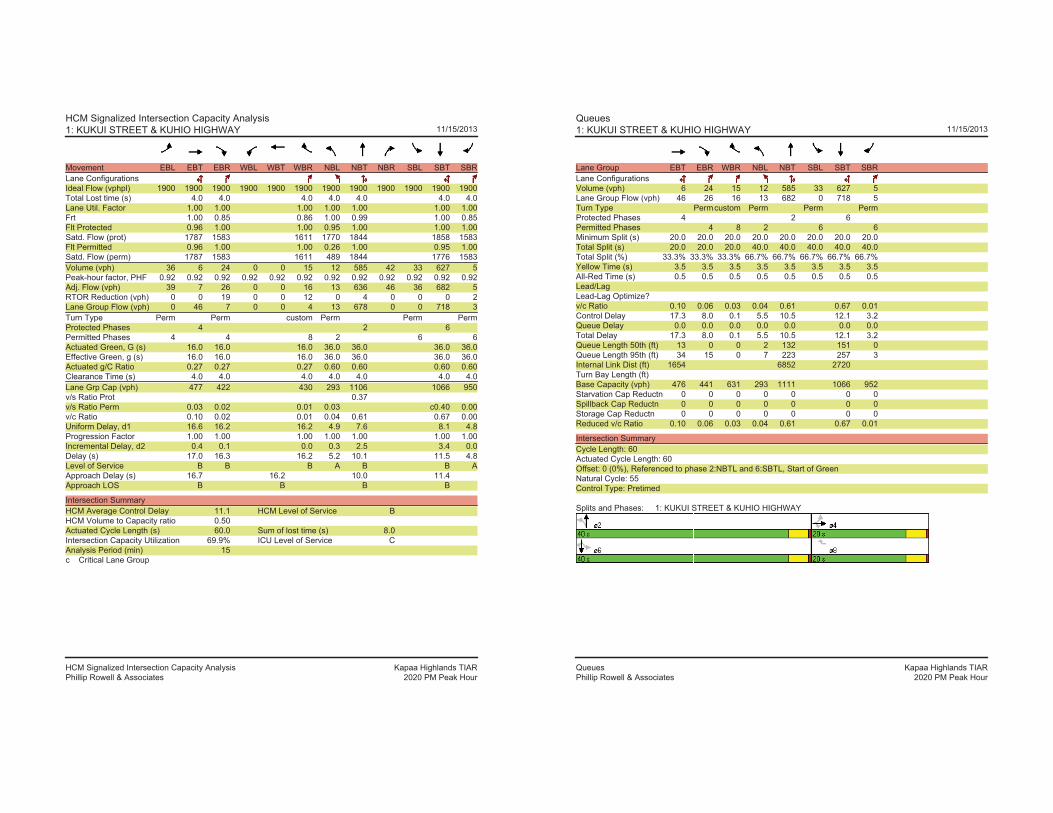
HCM Signalized Intersection Capacity Analysis1: KUKUI STREET & KUHIO HIGHWAY 11/15/2013
HCM Signalized Intersection Capacity Analysis Kapaa Highlands TIARPhillip Rowell & Associates 2020 PM Peak Hour
Movement EBL EBT EBR WBL WBT WBR NBL NBT NBR SBL SBT SBRLane ConfigurationsIdeal Flow (vphpl) 1900 1900 1900 1900 1900 1900 1900 1900 1900 1900 1900 1900Total Lost time (s) 4.0 4.0 4.0 4.0 4.0 4.0 4.0Lane Util. Factor 1.00 1.00 1.00 1.00 1.00 1.00 1.00Frt 1.00 0.85 0.86 1.00 0.99 1.00 0.85Flt Protected 0.96 1.00 1.00 0.95 1.00 1.00 1.00Satd. Flow (prot) 1787 1583 1611 1770 1844 1858 1583Flt Permitted 0.96 1.00 1.00 0.26 1.00 0.95 1.00Satd. Flow (perm) 1787 1583 1611 489 1844 1776 1583Volume (vph) 36 6 24 0 0 15 12 585 42 33 627 5Peak-hour factor, PHF 0.92 0.92 0.92 0.92 0.92 0.92 0.92 0.92 0.92 0.92 0.92 0.92Adj. Flow (vph) 39 7 26 0 0 16 13 636 46 36 682 5RTOR Reduction (vph) 0 0 19 0 0 12 0 4 0 0 0 2Lane Group Flow (vph) 0 46 7 0 0 4 13 678 0 0 718 3Turn Type Perm Perm custom Perm Perm PermProtected Phases 4 2 6Permitted Phases 4 4 8 2 6 6Actuated Green, G (s) 16.0 16.0 16.0 36.0 36.0 36.0 36.0Effective Green, g (s) 16.0 16.0 16.0 36.0 36.0 36.0 36.0Actuated g/C Ratio 0.27 0.27 0.27 0.60 0.60 0.60 0.60Clearance Time (s) 4.0 4.0 4.0 4.0 4.0 4.0 4.0Lane Grp Cap (vph) 477 422 430 293 1106 1066 950v/s Ratio Prot 0.37v/s Ratio Perm 0.03 0.02 0.01 0.03 c0.40 0.00v/c Ratio 0.10 0.02 0.01 0.04 0.61 0.67 0.00Uniform Delay, d1 16.6 16.2 16.2 4.9 7.6 8.1 4.8Progression Factor 1.00 1.00 1.00 1.00 1.00 1.00 1.00Incremental Delay, d2 0.4 0.1 0.0 0.3 2.5 3.4 0.0Delay (s) 17.0 16.3 16.2 5.2 10.1 11.5 4.8Level of Service B B B A B B AApproach Delay (s) 16.7 16.2 10.0 11.4Approach LOS B B B B
Intersection SummaryHCM Average Control Delay 11.1 HCM Level of Service BHCM Volume to Capacity ratio 0.50Actuated Cycle Length (s) 60.0 Sum of lost time (s) 8.0Intersection Capacity Utilization 69.9% ICU Level of Service CAnalysis Period (min) 15c Critical Lane Group
Queues1: KUKUI STREET & KUHIO HIGHWAY 11/15/2013
Queues Kapaa Highlands TIARPhillip Rowell & Associates 2020 PM Peak Hour
Lane Group EBT EBR WBR NBL NBT SBL SBT SBRLane ConfigurationsVolume (vph) 6 24 15 12 585 33 627 5Lane Group Flow (vph) 46 26 16 13 682 0 718 5Turn Type Permcustom Perm Perm PermProtected Phases 4 2 6Permitted Phases 4 8 2 6 6Minimum Split (s) 20.0 20.0 20.0 20.0 20.0 20.0 20.0 20.0Total Split (s) 20.0 20.0 20.0 40.0 40.0 40.0 40.0 40.0Total Split (%) 33.3% 33.3% 33.3% 66.7% 66.7% 66.7% 66.7% 66.7%Yellow Time (s) 3.5 3.5 3.5 3.5 3.5 3.5 3.5 3.5All-Red Time (s) 0.5 0.5 0.5 0.5 0.5 0.5 0.5 0.5Lead/LagLead-Lag Optimize?v/c Ratio 0.10 0.06 0.03 0.04 0.61 0.67 0.01Control Delay 17.3 8.0 0.1 5.5 10.5 12.1 3.2Queue Delay 0.0 0.0 0.0 0.0 0.0 0.0 0.0Total Delay 17.3 8.0 0.1 5.5 10.5 12.1 3.2Queue Length 50th (ft) 13 0 0 2 132 151 0Queue Length 95th (ft) 34 15 0 7 223 257 3Internal Link Dist (ft) 1654 6852 2720Turn Bay Length (ft)Base Capacity (vph) 476 441 631 293 1111 1066 952Starvation Cap Reductn 0 0 0 0 0 0 0Spillback Cap Reductn 0 0 0 0 0 0 0Storage Cap Reductn 0 0 0 0 0 0 0Reduced v/c Ratio 0.10 0.06 0.03 0.04 0.61 0.67 0.01
Intersection SummaryCycle Length: 60Actuated Cycle Length: 60Offset: 0 (0%), Referenced to phase 2:NBTL and 6:SBTL, Start of GreenNatural Cycle: 55Control Type: Pretimed
Splits and Phases: 1: KUKUI STREET & KUHIO HIGHWAY
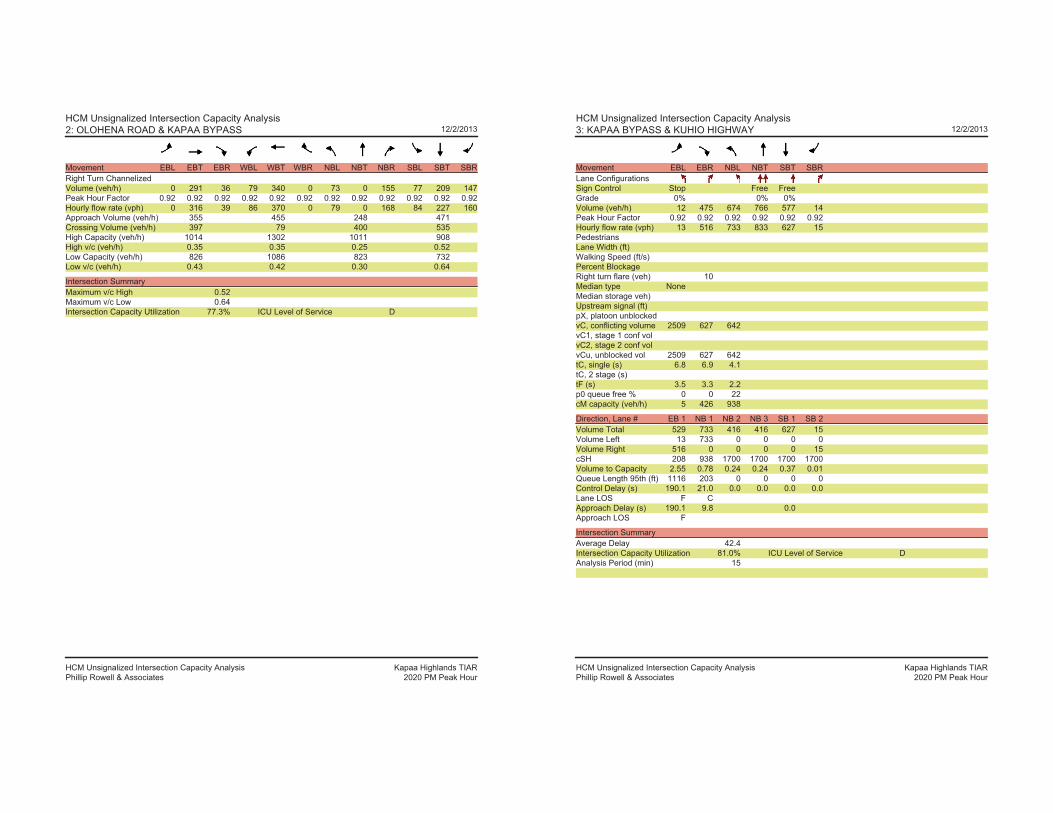
HCM Unsignalized Intersection Capacity Analysis2: OLOHENA ROAD & KAPAA BYPASS 12/2/2013
HCM Unsignalized Intersection Capacity Analysis Kapaa Highlands TIARPhillip Rowell & Associates 2020 PM Peak Hour
Movement EBL EBT EBR WBL WBT WBR NBL NBT NBR SBL SBT SBRRight Turn ChannelizedVolume (veh/h) 0 291 36 79 340 0 73 0 155 77 209 147Peak Hour Factor 0.92 0.92 0.92 0.92 0.92 0.92 0.92 0.92 0.92 0.92 0.92 0.92Hourly flow rate (vph) 0 316 39 86 370 0 79 0 168 84 227 160Approach Volume (veh/h) 355 455 248 471Crossing Volume (veh/h) 397 79 400 535High Capacity (veh/h) 1014 1302 1011 908High v/c (veh/h) 0.35 0.35 0.25 0.52Low Capacity (veh/h) 826 1086 823 732Low v/c (veh/h) 0.43 0.42 0.30 0.64
Intersection SummaryMaximum v/c High 0.52Maximum v/c Low 0.64Intersection Capacity Utilization 77.3% ICU Level of Service D
HCM Unsignalized Intersection Capacity Analysis3: KAPAA BYPASS & KUHIO HIGHWAY 12/2/2013
HCM Unsignalized Intersection Capacity Analysis Kapaa Highlands TIARPhillip Rowell & Associates 2020 PM Peak Hour
Movement EBL EBR NBL NBT SBT SBRLane ConfigurationsSign Control Stop Free FreeGrade 0% 0% 0%Volume (veh/h) 12 475 674 766 577 14Peak Hour Factor 0.92 0.92 0.92 0.92 0.92 0.92Hourly flow rate (vph) 13 516 733 833 627 15PedestriansLane Width (ft)Walking Speed (ft/s)Percent BlockageRight turn flare (veh) 10Median type NoneMedian storage veh)Upstream signal (ft)pX, platoon unblockedvC, conflicting volume 2509 627 642vC1, stage 1 conf volvC2, stage 2 conf volvCu, unblocked vol 2509 627 642tC, single (s) 6.8 6.9 4.1tC, 2 stage (s)tF (s) 3.5 3.3 2.2p0 queue free % 0 0 22cM capacity (veh/h) 5 426 938
Direction, Lane # EB 1 NB 1 NB 2 NB 3 SB 1 SB 2Volume Total 529 733 416 416 627 15Volume Left 13 733 0 0 0 0Volume Right 516 0 0 0 0 15cSH 208 938 1700 1700 1700 1700Volume to Capacity 2.55 0.78 0.24 0.24 0.37 0.01Queue Length 95th (ft) 1116 203 0 0 0 0Control Delay (s) 190.1 21.0 0.0 0.0 0.0 0.0Lane LOS F CApproach Delay (s) 190.1 9.8 0.0Approach LOS F
Intersection SummaryAverage Delay 42.4Intersection Capacity Utilization 81.0% ICU Level of Service DAnalysis Period (min) 15
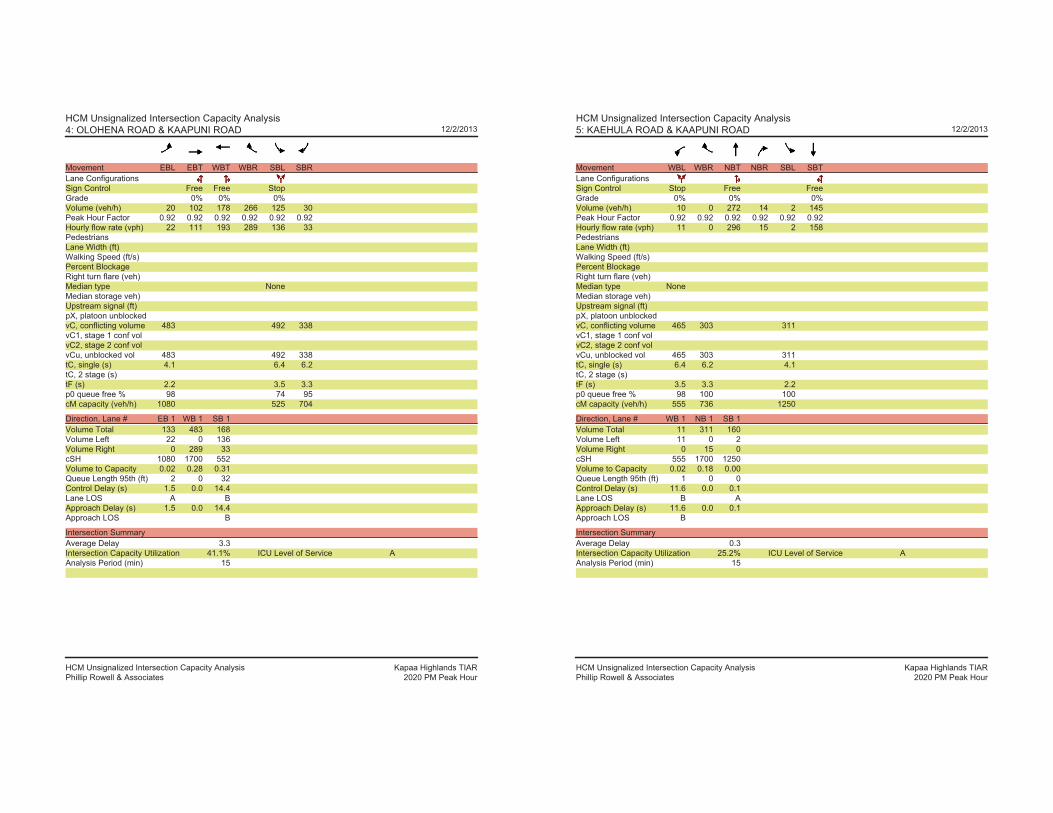
HCM Unsignalized Intersection Capacity Analysis4: OLOHENA ROAD & KAAPUNI ROAD 12/2/2013
HCM Unsignalized Intersection Capacity Analysis Kapaa Highlands TIARPhillip Rowell & Associates 2020 PM Peak Hour
Movement EBL EBT WBT WBR SBL SBRLane ConfigurationsSign Control Free Free StopGrade 0% 0% 0%Volume (veh/h) 20 102 178 266 125 30Peak Hour Factor 0.92 0.92 0.92 0.92 0.92 0.92Hourly flow rate (vph) 22 111 193 289 136 33PedestriansLane Width (ft)Walking Speed (ft/s)Percent BlockageRight turn flare (veh)Median type NoneMedian storage veh)Upstream signal (ft)pX, platoon unblockedvC, conflicting volume 483 492 338vC1, stage 1 conf volvC2, stage 2 conf volvCu, unblocked vol 483 492 338tC, single (s) 4.1 6.4 6.2tC, 2 stage (s)tF (s) 2.2 3.5 3.3p0 queue free % 98 74 95cM capacity (veh/h) 1080 525 704
Direction, Lane # EB 1 WB 1 SB 1Volume Total 133 483 168Volume Left 22 0 136Volume Right 0 289 33cSH 1080 1700 552Volume to Capacity 0.02 0.28 0.31Queue Length 95th (ft) 2 0 32Control Delay (s) 1.5 0.0 14.4Lane LOS A BApproach Delay (s) 1.5 0.0 14.4Approach LOS B
Intersection SummaryAverage Delay 3.3Intersection Capacity Utilization 41.1% ICU Level of Service AAnalysis Period (min) 15
HCM Unsignalized Intersection Capacity Analysis5: KAEHULA ROAD & KAAPUNI ROAD 12/2/2013
HCM Unsignalized Intersection Capacity Analysis Kapaa Highlands TIARPhillip Rowell & Associates 2020 PM Peak Hour
Movement WBL WBR NBT NBR SBL SBTLane ConfigurationsSign Control Stop Free FreeGrade 0% 0% 0%Volume (veh/h) 10 0 272 14 2 145Peak Hour Factor 0.92 0.92 0.92 0.92 0.92 0.92Hourly flow rate (vph) 11 0 296 15 2 158PedestriansLane Width (ft)Walking Speed (ft/s)Percent BlockageRight turn flare (veh)Median type NoneMedian storage veh)Upstream signal (ft)pX, platoon unblockedvC, conflicting volume 465 303 311vC1, stage 1 conf volvC2, stage 2 conf volvCu, unblocked vol 465 303 311tC, single (s) 6.4 6.2 4.1tC, 2 stage (s)tF (s) 3.5 3.3 2.2p0 queue free % 98 100 100cM capacity (veh/h) 555 736 1250
Direction, Lane # WB 1 NB 1 SB 1Volume Total 11 311 160Volume Left 11 0 2Volume Right 0 15 0cSH 555 1700 1250Volume to Capacity 0.02 0.18 0.00Queue Length 95th (ft) 1 0 0Control Delay (s) 11.6 0.0 0.1Lane LOS B AApproach Delay (s) 11.6 0.0 0.1Approach LOS B
Intersection SummaryAverage Delay 0.3Intersection Capacity Utilization 25.2% ICU Level of Service AAnalysis Period (min) 15

HCM Unsignalized Intersection Capacity Analysis6: KAPAA BYPASS & ROAD 'A' 12/2/2013
HCM Unsignalized Intersection Capacity Analysis Kapaa Highlands TIARPhillip Rowell & Associates 2020 PM Peak Hour
Movement EBL EBT WBT WBR SBL SBRLane ConfigurationsSign Control Free Free StopGrade 0% 0% 0%Volume (veh/h) 280 408 275 0 0 212Peak Hour Factor 0.92 0.92 0.92 0.92 0.92 0.92Hourly flow rate (vph) 304 443 299 0 0 230PedestriansLane Width (ft)Walking Speed (ft/s)Percent BlockageRight turn flare (veh)Median type NoneMedian storage veh)Upstream signal (ft)pX, platoon unblockedvC, conflicting volume 299 1351 299vC1, stage 1 conf volvC2, stage 2 conf volvCu, unblocked vol 299 1351 299tC, single (s) 4.1 6.4 6.2tC, 2 stage (s)tF (s) 2.2 3.5 3.3p0 queue free % 76 100 69cM capacity (veh/h) 1262 126 741
Direction, Lane # EB 1 WB 1 SB 1Volume Total 748 299 230Volume Left 304 0 0Volume Right 0 0 230cSH 1262 1700 741Volume to Capacity 0.24 0.18 0.31Queue Length 95th (ft) 24 0 33Control Delay (s) 5.3 0.0 12.0Lane LOS A BApproach Delay (s) 5.3 0.0 12.0Approach LOS B
Intersection SummaryAverage Delay 5.3Intersection Capacity Utilization 74.6% ICU Level of Service DAnalysis Period (min) 15
HCM Unsignalized Intersection Capacity Analysis7: OLOHENA ROAD & ROAD 'A' 12/2/2013
HCM Unsignalized Intersection Capacity Analysis Kapaa Highlands TIARPhillip Rowell & Associates 2020 PM Peak Hour
Movement EBT EBR WBL WBT NBL NBRLane ConfigurationsSign Control Free Free StopGrade 0% 0% 0%Volume (veh/h) 118 115 57 359 98 36Peak Hour Factor 0.92 0.92 0.92 0.92 0.92 0.92Hourly flow rate (vph) 128 125 62 390 107 39PedestriansLane Width (ft)Walking Speed (ft/s)Percent BlockageRight turn flare (veh)Median type NoneMedian storage veh)Upstream signal (ft)pX, platoon unblockedvC, conflicting volume 253 705 191vC1, stage 1 conf volvC2, stage 2 conf volvCu, unblocked vol 253 705 191tC, single (s) 4.1 6.4 6.2tC, 2 stage (s)tF (s) 2.2 3.5 3.3p0 queue free % 95 72 95cM capacity (veh/h) 1312 384 851
Direction, Lane # EB 1 WB 1 NB 1Volume Total 253 452 146Volume Left 0 62 107Volume Right 125 0 39cSH 1700 1312 450Volume to Capacity 0.15 0.05 0.32Queue Length 95th (ft) 0 4 35Control Delay (s) 0.0 1.5 16.8Lane LOS A CApproach Delay (s) 0.0 1.5 16.8Approach LOS C
Intersection SummaryAverage Delay 3.7Intersection Capacity Utilization 52.9% ICU Level of Service AAnalysis Period (min) 15
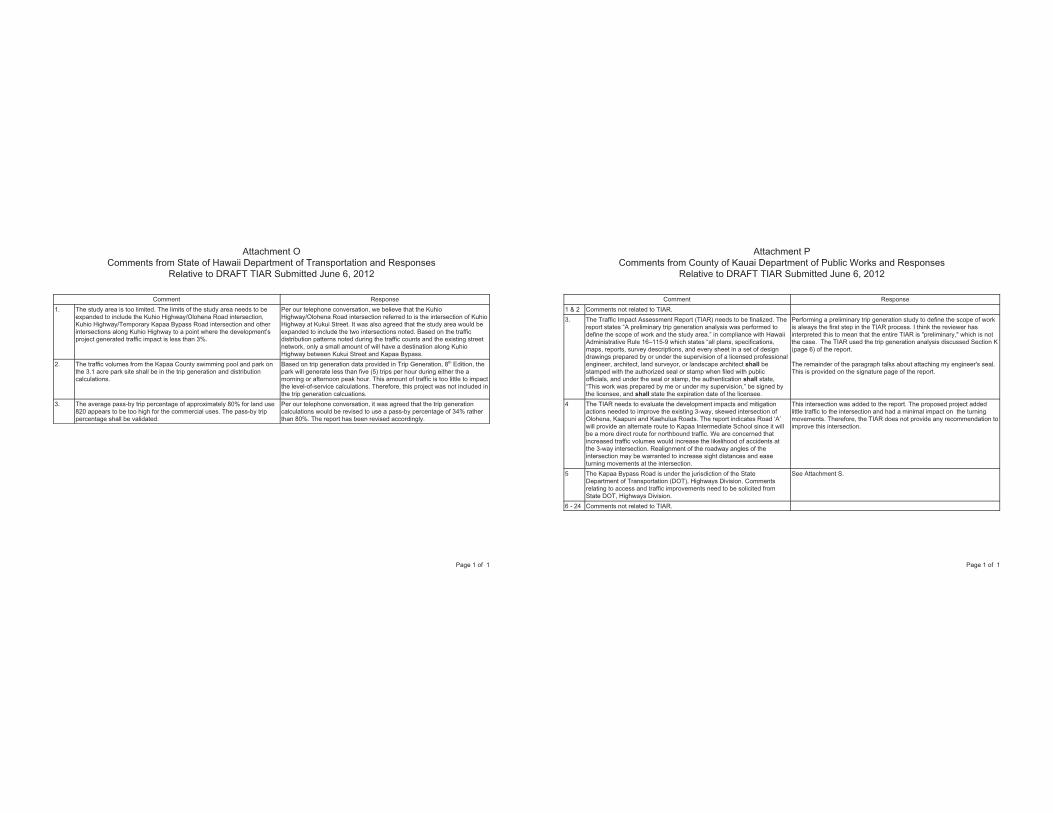
Page 1 of 1
Attachment OComments from State of Hawaii Department of Transportation and Responses
Relative to DRAFT TIAR Submitted June 6, 2012
Comment Response1. The study area is too limited. The limits of the study area needs to be
expanded to include the Kuhio Highway/Olohena Road intersection,Kuhio Highway/Temporary Kapaa Bypass Road intersection and otherintersections along Kuhio Highway to a point where the development’sproject generated traffic impact is less than 3%.
Per our telephone conversation, we believe that the KuhioHighway/Olohena Road intersection referred to is the intersection of KuhioHighway at Kukui Street. It was also agreed that the study area would beexpanded to include the two intersections noted. Based on the trafficdistribution patterns noted during the traffic counts and the existing streetnetwork, only a small amount of will have a destination along KuhioHighway between Kukui Street and Kapaa Bypass.
2. The traffic volumes from the Kapaa County swimming pool and park onthe 3.1 acre park site shall be in the trip generation and distributioncalculations.
Based on trip generation data provided in Trip Generation, 8th Edition, thepark will generate less than five (5) trips per hour during either the amorning or afternoon peak hour. This amount of traffic is too little to impactthe level-of-service calculations. Therefore, this project was not included inthe trip generation calcuations.
3. The average pass-by trip percentage of approximately 80% for land use820 appears to be too high for the commercial uses. The pass-by trippercentage shall be validated.
Per our telephone conversation, it was agreed that the trip generationcalculations would be revised to use a pass-by percentage of 34% ratherthan 80%. The report has been revised accordingly.
Page 1 of 1
Attachment PComments from County of Kauai Department of Public Works and Responses
Relative to DRAFT TIAR Submitted June 6, 2012
Comment Response1 & 2 Comments not related to TIAR.3. The Traffic Impact Assessment Report (TIAR) needs to be finalized. The
report states “A preliminary trip generation analysis was performed todefine the scope of work and the study area.” in compliance with HawaiiAdministrative Rule 16–115-9 which states “all plans, specifications,maps, reports, survey descriptions, and every sheet in a set of designdrawings prepared by or under the supervision of a licensed professionalengineer, architect, land surveyor, or landscape architect shall bestamped with the authorized seal or stamp when filed with publicofficials, and under the seal or stamp, the authentication shall state,“This work was prepared by me or under my supervision,” be signed bythe licensee, and shall state the expiration date of the licensee.
Performing a preliminary trip generation study to define the scope of workis always the first step in the TIAR process. I think the reviewer hasinterpreted this to mean that the entire TIAR is "preliminary," which is notthe case. The TIAR used the trip generation analysis discussed Section K(page 6) of the report.
The remainder of the paragraph talks about attaching my engineer's seal.This is provided on the signature page of the report.
4 The TIAR needs to evaluate the development impacts and mitigationactions needed to improve the existing 3-way, skewed intersection ofOlohena, Kaapuni and Kaehulua Roads. The report indicates Road ‘A’will provide an alternate route to Kapaa Intermediate School since it willbe a more direct route for northbound traffic. We are concerned thatincreased traffic volumes would increase the likelihood of accidents atthe 3-way intersection. Realignment of the roadway angles of theintersection may be warranted to increase sight distances and easeturning movements at the intersection.
This intersection was added to the report. The proposed project addedlittle traffic to the intersection and had a minimal impact on the turningmovements. Therefore, the TIAR does not provide any recommendation toimprove this intersection.
5 The Kapaa Bypass Road is under the jurisdiction of the StateDepartment of Transportation (DOT), Highways Division. Commentsrelating to access and traffic improvements need to be solicited fromState DOT, Highways Division.
See Attachment S.
6 - 24 Comments not related to TIAR.

������������� ���� � ����� ��������� ������ ����� �������������� ������������������������������ !"
������� ��������
!# ���������$%&��'�������(���� ������)����� �*��+� �)�� ��������&,���+��% ���*����� ���)��,-&,����� ���*����� ��)���������./ %�/ �����0/ ��1/ � �)���) ��� 2)����+���� ���#
��2������+��#
�# ���������,%�� ����� ��������������)�����)������������)�$ � 3*� ������+�����) ��������� � *����)����'���������� �����)� ���) ��)��*� ���� ������� ����� �����*���� �����)��*� ��) ���������) �����������������)�������� �����#�)����������������� ��������� ��)�����)����������� ����)����� �*� ���#�)������ �����)� �������� ��������� ��� � �!�#�4�, ��!"#14&,#�)����������)� � �*�����)�$�)����+)� * �$ � 3*� ����������������� ���!!5� � 6����%�%�������567�8 �9���+� ��:���������������8����� �����+���� ������� �������� *567�;�������+���)�����67�;8���)�< ����=���)5������������)��*� ��8�����)�, ��&,� ������� ����� *����� �����)�=���)��>���5������������)��*� ��8567�3+���+���8���)�&,#>������ +������)�)����������������) ��)����'������������������)���67������������������+���� ��#��� ����+� �� �� �� � �*������)��������������) �������� ���#?�����+ � �*�����)����%������������� ����@����� ��@�����+����$�)����+)� * ��$ � 3*� ���) ������� ������#�� ������ �����������������) ���������������������+ �����'���+���� ������ ���#
;������)����'������� ���+������ ���)�������� �)�������� ��A��)�����#����������������� ������*��� ��*���������� ����#
�)������� ��������� ��)�����������������)�� �������������)��������������)��)��B��)��������)��������+�)�������+�� 2)��� ��!���)��������)��������+�)� ��������� 2)���#�)����������)�����������������) �+� � ����������'���+���� ����� �� ��)����'��������� ���� �����)����������#������������� ������)����'�������� 2���+)������ ��)���������������)��)�� ����������������+�)�������+�� 2)��� ����7&��+����������������+�)� ��������� 2)���#
��� ������������) � ��+� �� �� �� � �*�����)��������������� ���� ������� ��������)�� �������������)�������+)������� ����������� ���)�����������������������������)����������� ���� �)������ ���)�� �������������)��������������������� ���� �)�)�������� ���� �)������������++���)���+� �� �� �����)��)��C ��)��������)������)�;�������D�����> �� ��#
6 ���*�������)����������) ����������)�$ � 3*� ���)�) � ��� �*���������) �)�� ���) ��������+ ���� �����)�$ � �� #>��)����)�$ � 3*� ����� ��������� ���� �����+������ ���+$�)����+)� *��$ � �������������� ���#
"# ���������,��)����� ���� 2�������������)����'����� ��������+ � ����� ������������7��)�� �� ����)�$ � 3*� �����������+�� ���� ���)����*��������+67� ��)������ ����57��)�� �� � ��$ � 3*� ��8#��������������� ������� ���)���+)�)�&��'���E�&) ������������ � �� �)����������������
�)��� ��� ����+��������� ��������� �� ������������������ ������������������ ���� ���)���� �� *#����������2 ��)�� ������ ����) ��� �������� �)������������� ���������7��)�� �� ����������+�� ���� ������)�$ � ��������� ����)���� ���)�����)���� ���$ � 3*� ��#������� ������� 2��)�
�
!
�) �� ������� ��� ����+�� �������������+ ��%� *�������������������������� �� ��*#3���+�) ��)����+���+��'������� ��������������)� �)��)����)��� ����������� ��67�������������������������#7�)�����������+ ���������������� ��)�� ������� ���� �)��)������ �����*����@������� �)���� ����� ���67�#
�)����������������������� ������ �������� ������� ���������������� ������ ��������� ��*�����+�)�������+�� 2)����)���)�� ������� ���� �)�7��)�� �� ����)������ �������� ��� � ���67�<#
0# �)�����)��������)�$ � 3*� ���� ����������������)$�)����+)� *�) ���������������)�����#���)��+)���� ���+��� ������%� *�� ����$�)����+)� *���)�7��)�� ����� ������)�����*������������������������ �� ���#
&�������������������)�)�&� ����+3� ��)���7����� � +�����) ��)�����* �� ��������F� ��������������)��������������$�)����+)� * �$�2�������� ���)�����)����������������$�)����+)� * �$ � 3*� ��#�����$ � 3*� �� ��)�����)����������������$�)����+)� * �$ � 3*� �������%� *����)������ �*���'����� �� �������)������������������������������)�����#������)�������������������+�������������������������)�67� � �*���#
B# ����%����� �� ������*�)������������������)�$ � 3*� ���� ����������������)�� �� �� �������� �����+�� ������)��������������)�����������������)�����#?�����+�����)��)���+)� �����)�$ � 3*� ���� ��) ������� ������#���������)�$ � 3*� ���� �������������� ������) ����������������)�� ��� �������)���+)� *����������$ � ���������<�+�����#
;��������)�)�;�>� ��=���&� � �) � ����������� �G� �� ���H �� ��� ��*G+���������#H��� ���������) � ��� � ���������� �� ���+$ � 3*� �� ��� ��� ����G������H������)����������� ����'����������� �� �67�������+���)������+ �� ��������� 2)���� ���) ��)��B�)����������@����� �������) ������)����#������� ���!��� +�!0#
�
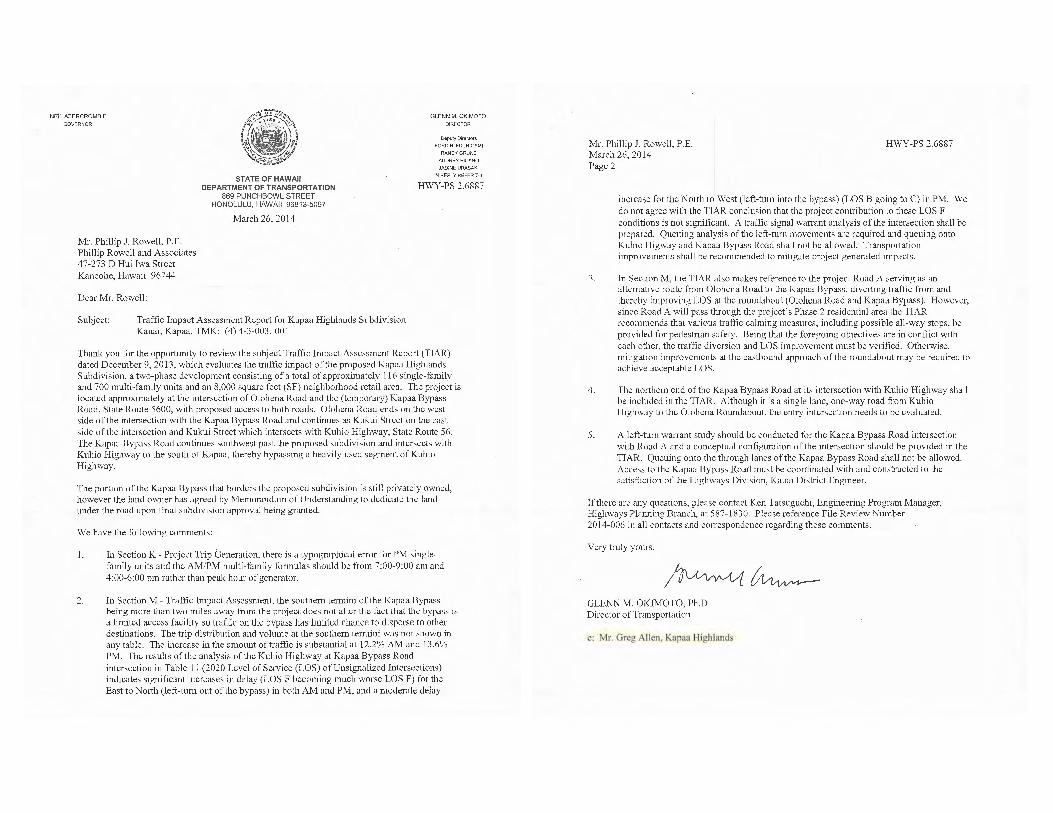

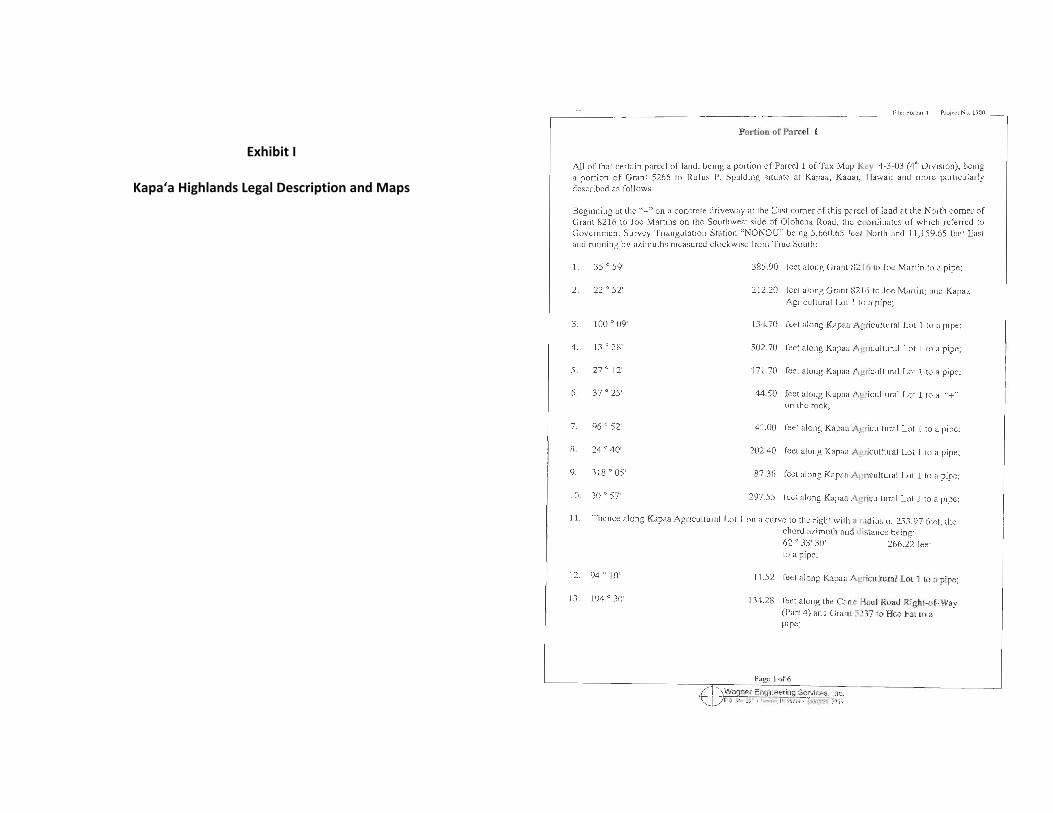
Exhibit I
Kapaʻa Highlands Legal Description and Maps

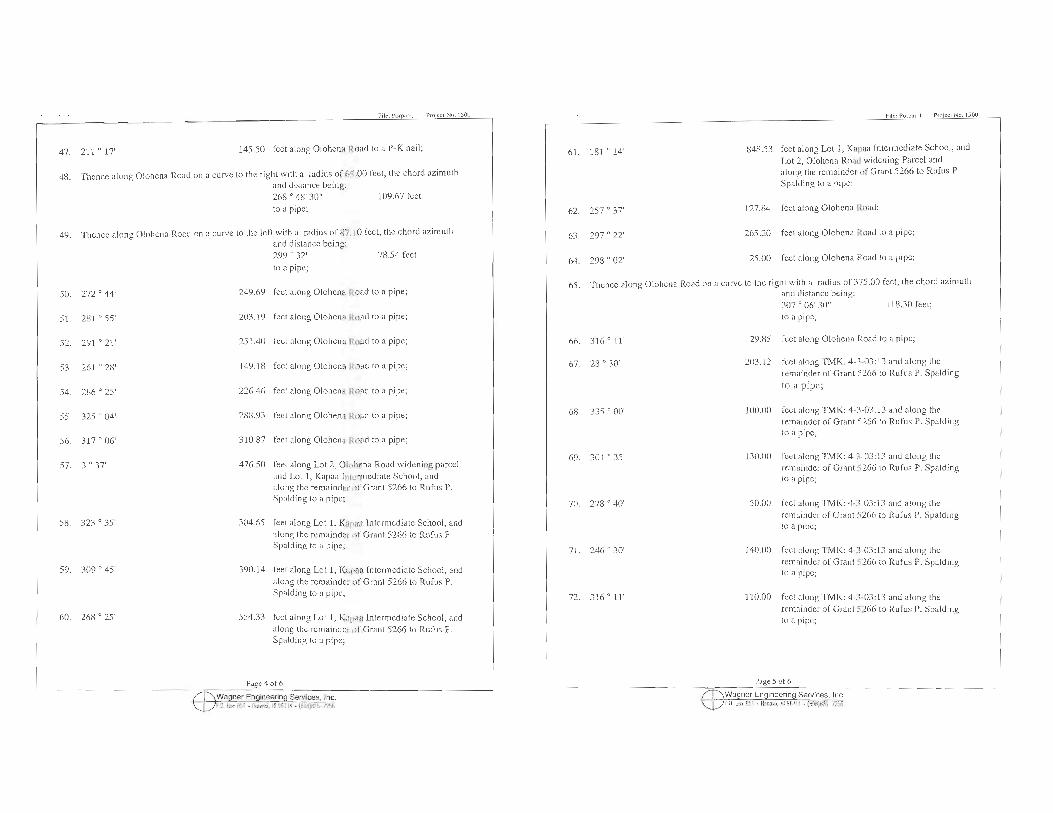


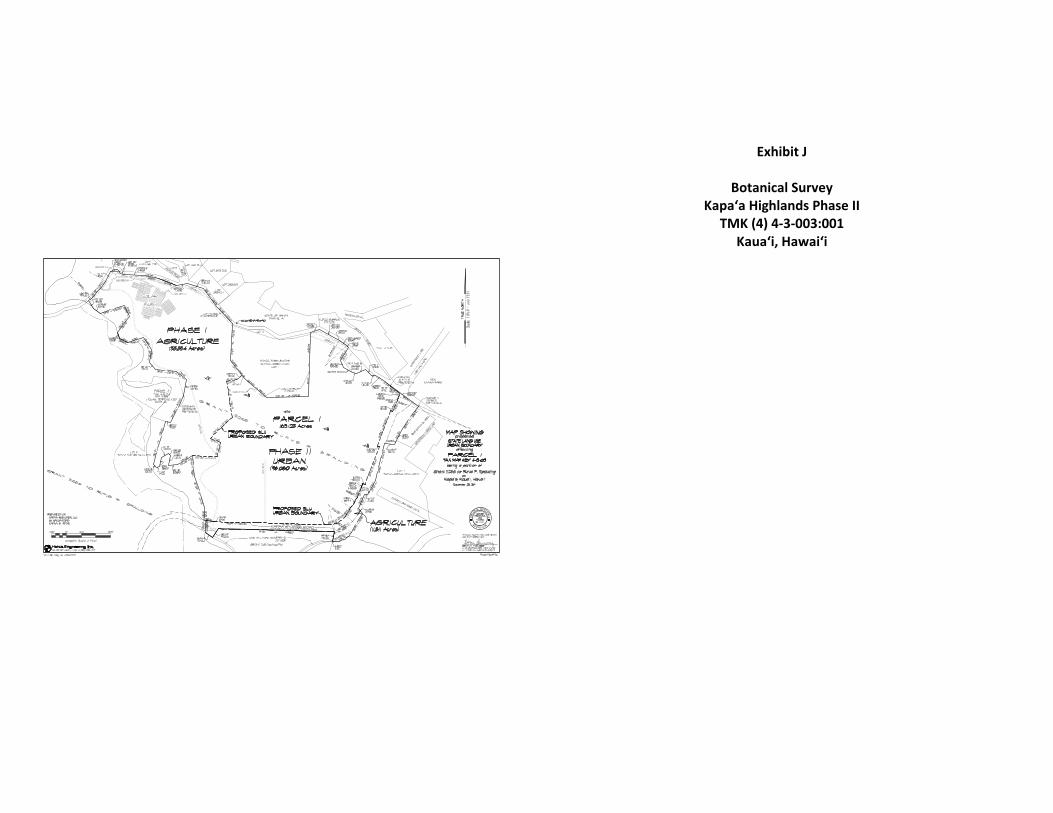
Exhibit J
Botanical Survey Kapaʻa Highlands Phase II
TMK (4) 4-3-003:001 Kauaʻi, Hawaiʻi
Kapa`a Highlands Phase II – Botanical Survey K.R. Wood & M. Kirkpatrick 1
1
Botanical Survey Kapa`a Highlands Phase II
TMK (4) 4-3-003:001 Kaua`i, Hawai`i
April-May 2012
Prepared by
Kenneth R. Wood1 / Research Biologist Megan Kirkpatrick / M.S. Environmental Science
1P. O. Box 745, `Ele`ele, Kaua`i, Hawai`i, U.S.A. 96705 [email protected]
Kapa`a Highlands Phase II – Botanical Survey K.R. Wood & M. Kirkpatrick 2
2
TABLE OF CONTENTS
Summary………………………………………………….3
Study Area..……………………...…….…………………3
Survey Methods…………………………………………..4
Description of Vegetation....…..………….......………….4
Conclusion……………………………………...…...……5
Checklist (Table 1)………………………………....…….6
Survey Area (Figure 1 & 2)………….……………..........8
References…………………………………………….…..9
Kapa`a Highlands Phase II – Botanical Survey K.R. Wood & M. Kirkpatrick 3
3
Botanical Survey Kapa`a Highlands Phase II
TMK (4) 4-3-003:001 Kaua`i, Hawai`i
April 2012
Kenneth R. Wood, Research Biologist, & Megan Kirkpatrick, M.S. Environmental Science P.O. Box 745, `Ele`ele, Kaua`i, Hawai`i, U.S.A. 96705, [email protected],
Summary: During April and May of 2012 a botanical survey was conducted on a 97 acre parcel
in Kapa`a, Kaua`i, referred to as Kapa`a Highlands Phase II (TMK (4)3-8-003:001). This
research documented 44 vascular plant species within the survey area. Forty taxa were non-
native plant species, three taxa were very common indigenous native species, and one taxon was
a Polynesian introduction (Table 1). NO FEDERALLY LISTED AS THREATENED OR ENDANGERED
PLANT SPECIES WERE OBSERVED WITHIN OR NEAR THE SURVEY AREA. This report includes a
general description of the study site; the methods of survey; and a vascular plant checklist of all
plant species observed.
STUDY AREA. On April 19, 2012 and May 7, 2012, K. R. Wood (Endangered Species
Specialist) and assistant Megan D. Kirkpatrick (M.S. Environmental Science) conducted a
biological inventory on an undeveloped parcel of property in Kapa`a, Kaua`i (TMK [4]3-8-
003:001) (Figures 1 & 2). The survey area is approximately 97 acres of undeveloped land. The
primary objectives of this field survey were to:
a) search for threatened and endangered plant species as well as species of concern;
b) provide a complete vascular plant checklist of both native and non-native plant taxa
observed on property; and
c) provide a summary concerning the conservation status of all native taxa observed;
Kapa`a Highlands Phase II – Botanical Survey K.R. Wood & M. Kirkpatrick 4
4
SURVEY METHODS. A walk-through survey method was used. Transects included
walking/driving around boundaries of property (TMK (4)3-8-003:001) and several transects
through the interior portions of property. Plant identifications were made in the field and were
recorded by the author (Table 1). Plant names and authors of dicots and monocots follow
Wagner et al. (1990) and pteridophytes follow Palmer (2003). Plants of particular interest were
collected by the second author (MK) as herbarium specimen vouchers and deposited at the
National Tropical Botanical Garden (NTBG) herbarium. Specimens were placed in newspaper
sheets and pressed in-between cardboard herbarium presses and dried at the NTBG.
DESCRIPTION OF VEGETATION.
The study area represents a lowland non-native mesic plant community dominated by secondary
vegetation of trees, shrubs, and grasses, many of which are considered invasive. The land is
vacant and currently undeveloped and has a past history of grazing and sugarcane cultivation.
The non-native grass Panicum maximum (Poaceae – Guinea grass) and non-native shrub or small
tree Leucaena leucocephala (Fabaceae – koa haole) are by far the dominant species found at the
site. Additional common non-native trees and shrubs include: Lantana camara (Verbenaceae –
l�kana), Indigofera suffruticosa (Fabaceae – indigo), Syzygium cumini (Myrtaceae – Java plum),
Psidium guajava (Myrtaceae – guava), Spathodea campanulata (Bignoniaceae – African tulip),
and Senna surattensis (Fabaceae – kolomona). Several less common non-native trees and shrubs
include: Clidemia hirta (Melastomataceae – Koster's curse), Cinnamomum camphora (Lauraceae
– camphor tree), Falcataria moluccana (Fabaceae – albezia), Ficus microcarpa (Moraceae –
Chinese banyan), and Schefflera actinophylla (Araliaceae – octopus tree). No Hawaiian endemic
species (i.e., restricted to only Hawai`i) were observed. One Polynesian introduction was
observed, namely Aleurites moluccana (Euphorbiaceae – kukui tree) which is common
throughout the Hawaiian islands. The three indigenous species found at the site are quite
common and include: Hibiscus tiliaceus (Malvaceae – hau) which is also often an invasive tree
species, the fern species Psilotum nudum (Psilotaceae – moa), and Waltheria indica
(Sterculiaceae - `uhaloa). For complete checklist of species see Table 1 which also includes the
common names and status (i.e., indigenous/naturalized) category of each taxon.

Kapa`a Highlands Phase II – Botanical Survey K.R. Wood & M. Kirkpatrick 5
5
CONCLUSION.
NO THREATENED OR ENDANGERED PLANT SPECIES WERE OBSERVED WITHIN OR
ANYWHERE NEAR THE SURVEY AREA DURING RESEARCH -and therefore there are no
concerns about possible impacts to rare plant species at the Kapa`a Highlands Phase II project.
The current conditions of this study site indicate that the area has been dominated by non-native
weedy species for a very long time. The senior author certifies his expertise with more than 25
years conducting biological inventories within the Hawaiian Islands and has specialized in the
conservation of Hawai`i’s Federally Listed as Endangered plant species, including those
considered Candidates for listing, Species of Concern, or Federally Listed as Threatened
(USFWS 1999a, 1999b, 2004, 2010).
Kapa`a Highlands Phase II – Botanical Survey K.R. Wood & M. Kirkpatrick 6
6
TABLE 1. Checklist of Vascular Plants Observed in Kapa`a Highlands Phase II Survey Area (TMK (4) 4-3-003:001)
Status Symbols: ind=Indigenous (naturally occurring in Hawai`i, yet found in other areas of the world), nat=Naturalized (non-native), pol=Polynesian introduction. Note: Checklist alphabetical by genus. Flowering plants follow Wagner et al. 1990; pteridophytes follow Palmer 2003.
FAMILY GENUS / SPECIES COMMONNAME STATUS
Asparagaceae Agave sisalana Perrine sisal, sisal hemp, century plant, malina nat
Asteraceae Ageratum conyzoides L.maile hohono, maile honohono, maile kula nat
Euphorbiaceae Aleurites moluccana (L.) Willd. kukui, kuikui, candlenut pol
Blechnaceae Blechnum appendiculatum Willd. nat
Poaceae Brachiaria mutica (Forssk.) Stapf California grass, Para grass nat
Fabaceae Canavalia cathartica Thouars maunaloa nat
Fabaceae
Chamaecrista nictitans (L.) Moench var. glabrata (Vogel) H. S. Irwin & Barneby partridge pea, lauk� nat
Poaceae Chloris barbata (L.) Sw. swollen fingergrass, mau‘u lei nat
Lauraceae Cinnamomum camphora (L.) J.Presl camphor tree nat
Melastomataceae Clidemia hirta (L.) D.Don Koster's curse nat
Asteraceae Cyanthillium cinereum (L.) H.Rob. little ironweed nat
Thelypteridaceae Cyclosorus dentatus (Forssk.) Ching pai‘i‘ih� nat
Poaceae Cynodon dactylon (L.) Pers. Bermuda grass, m�nienie nat
Cyperaceae Cyperus pilosus Vahl nat
Poaceae Eragrostis brownii (Kunth) Nees ex Steud. sheepgrass nat
Fabaceae Falcataria moluccana (Miq.) Barneby & J.W.Grimes nat
Moraceae Ficus microcarpa L.f. Chinese banyan, Malayan banyan nat
Cyperaceae Fimbristylis miliacea (L.) Vahl nat
Malvaceae Hibiscus tiliaceus L. hau ind
Lamiaceae Hyptis pectinata (L.) Poit. comb hyptis nat
Fabaceae Indigofera suffruticosa Mill. indigo, ‘inik�, ‘inikoa, kol� nat
Verbenaceae Lantana camara L. l�kana, l�‘au kalakala, lanakana (Ni‘ihau), nat

Kapa`a Highlands Phase II – Botanical Survey K.R. Wood & M. Kirkpatrick 7
7
FAMILY GENUS / SPECIES COMMONNAME STATUS
Fabaceae Leucaena leucocephala (Lam.) de Wit koa haole, �koa, lilikoa nat
Malvaceae Malvastrum coromandelianum (L.) Garcke false mallow nat
Poaceae Melinis repens (Willd.) Zizka Natal redtop, Natal grass nat
Fabaceae Mimosa pudica L. sensitive plant, sleeping grass, pua hilahila nat
Fabaceae Neonotonia wightii (Wight & Arn.) Verdc. nat
Lomariopsidaceae Nephrolepis brownii (Desv.) Hovenkamp & Miyam. nat
Poaceae Panicum maximum Jacq. Guinea grass nat
Asteraceae Parthenium hysterophorus L. false ragweed, Santa Maria nat
Asteraceae Pluchea carolinensis (Jacq.) G.Don sourbush, marsh fleabane nat
Myrtaceae Psidium guajava L. common guava, kuawa, nat
Psilotaceae Psilotum nudum (L.) P.Beauv. moa, moa nahele ind
Euphorbiaceae Ricinus communis L. castor bean, p�‘aila nat
Araliaceae Schefflera actinophylla (Endl.) Harms octopus tree, umbrella tree nat
Poaceae Schizostachyum sp. ‘ohe nat
Fabaceae Senna surattensis (Burm.f.) H.S.Irwin & Barneby kolomona, kalamona nat
Malvaceae Sida spinosa L. prickly sida nat
Bignoniaceae Spathodea campanulata P.Beauv.African tulip tree, fountain tree nat
Asteraceae Sphagneticola trilobata (L.) Pruski wedelia nat
Verbenaceae Stachytarpheta jamaicensis (L.) Vahl Jamaica vervain, �w� nat
Myrtaceae Syzygium cumini (L.) Skeels Java plum, jambolan plum nat
Acanthaceae Thunbergia fragrans Roxb.white thunbergia, sweet clock-vine nat
Sterculiaceae Waltheria indica L. ‘uhaloa, ‘ala‘ala p� loa ind
Kapa`a Highlands Phase II – Botanical Survey K.R. Wood & M. Kirkpatrick 8
8
Figure 1. Aerial Image of Kapa`a Highlands Project Area.
Figure 2. Kapa`a Highlands Phase II concept plan.


![5.2 College Station Groundwater Strategiesbrazosgwater.org/2021-Water-Plan/Volume_II/IPP_Vol_II_5... · 2020-03-11 · Carters Creek [TCEQ Segment 1209C]) were identified on the TCEQ](https://img.pdfslide.net/doc/110x75/5f257f3e0c5b7e1068273780/52-college-station-groundwater-st-2020-03-11-carters-creek-tceq-segment-1209c.jpg)