Embed Size (px)
Citation preview


How to obtain more informationFor information about this product or the wide range of services and data available from Statistics Canada, visit our website, www.statcan.gc.ca. You can also contact us by Email at [email protected] Telephone, from Monday to Friday, 8:30 a.m. to 4:30 p.m., at the following numbers:
• Statistical Information Service 1-800-263-1136 • National telecommunications device for the hearing impaired 1-800-363-7629 • Fax line 1-514-283-9350
Depository Services Program
• Inquiries line 1-800-635-7943 • Fax line 1-800-565-7757
Note of appreciationCanada owes the success of its statistical system to a long-standing partnership between Statistics Canada, the citizens of Canada, its businesses, governments and other institutions. Accurate and timely statistical information could not be produced without their continued co-operation and goodwill.
Standards of service to the publicStatistics Canada is committed to serving its clients in a prompt, reliable and courteous manner. To this end, Statistics Canada has developed standards of service that its employees observe. To obtain a copy of these service standards, please contact Statistics Canada toll-free at 1-800-263-1136. The service standards are also published on www.statcan.gc.ca under “Contact us” > “Standards of service to the public.”
Published by authority of the Minister responsible for Statistics Canada
© Her Majesty the Queen in Right of Canada as represented by the Minister of Industry, 2019
All rights reserved. Use of this publication is governed by the Statistics Canada Open Licence Agreement.
An HTML version is also available.
Cette publication est aussi disponible en français.
Release date: February 27, 2019
Catalogue number 89-657-X2019002 ISBN 978-0-660-29529-9

3 Diversity of the Black population in Canada: An overview
Diversity of the Black population in Canada: An overview
Context
The Black population has contributed to Canada’s heritage since the arrival of Mathieu Da Costa (a navigator and interpreter for Pierre Du Gua de Mons and Samuel de Champlain), whose presence in Canada dates back to the early 1600s.
Black people in Canada have diverse backgrounds and experiences – while some can trace their roots in Canada for many generations, others have immigrated in recent decades. They have contributed in many ways to the growth, diversity and development of the country.
In conjunction with both the United Nations’ initiatives for the International Decade for People of African Descent (2015-2024), and Black History Month, this portrait aims to highlight the diversity of the Black population in terms of their ethnic and cultural origins, places of birth and languages.
TABle of ConTenTs
Context 3
Population of interest 4
In 2016, close to 1.2 million people in Canada reported being Black 4
The Black population is a young population... 5
...with a history in Canada 5
About half of the Black population is or has ever been a landed immigrant or permanent resident in Canada... 6
...who came at different points in time 6
...and through different gateways to Canada 7
The source regions of immigration have changed over time 8
More than 170 different places of birth for the Black immigrants in Canada 8
Overall, more than 200 ethnic or cultural origins were reported by the Black population in Canada 10
The long established Black population in Canada is more likely to report several ethnic or cultural origins 11
The mother tongues reported among the first generation Black population are much more diverse than the mother tongues among the third generation or more 12
A higher percent of people within the Black population (28.0%) speak French at home compared to the total population (23.3%) 13
The vast majority of the Black population live in large urban areas 14
Atlantic provinces: Longest history 15
Quebec: French speaking 16
Ontario: Largest Black population in Canada 17
The Prairie Provinces: Fastest growing 18
British Columbia: Few recent Black immigrants 19
The Territories: Smallest Black population in Canada 20
Conclusion 21
Acknowledgments 21
Notes 21
Appendix 22
4Diversity of the Black population in Canada: An overview
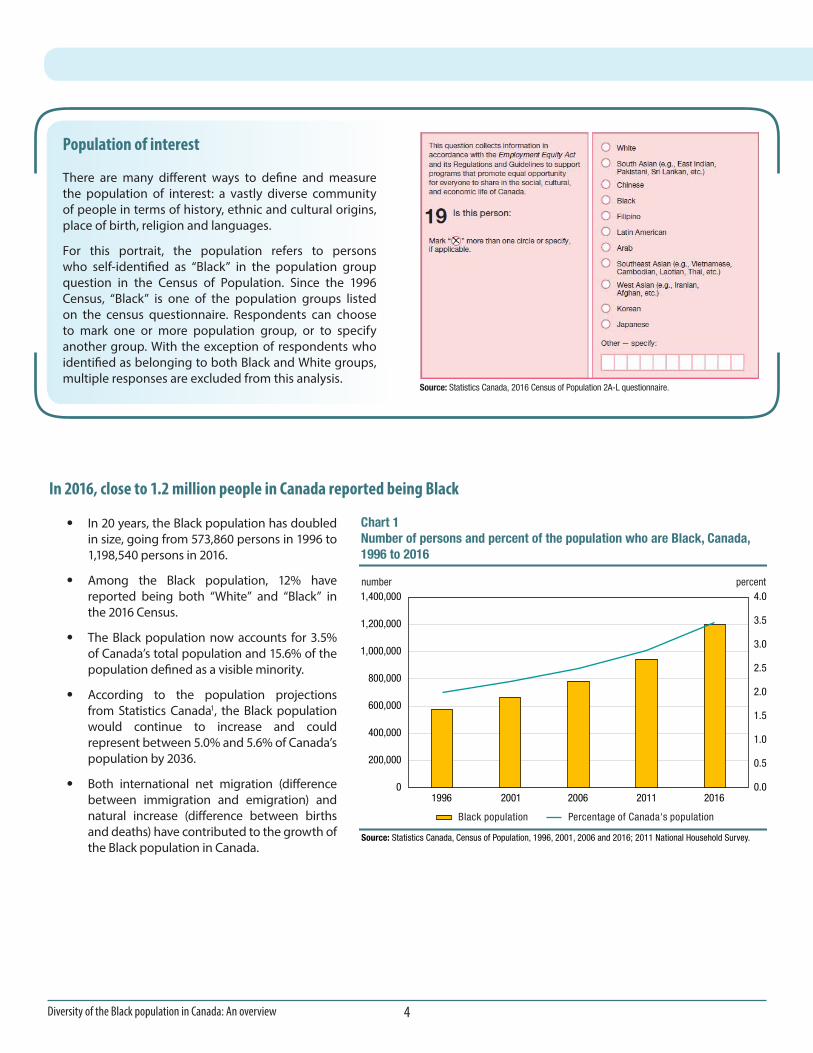
• In 20 years, the Black population has doubled in size, going from 573,860 persons in 1996 to 1,198,540 persons in 2016.
• Among the Black population, 12% have reported being both “White” and “Black” in the 2016 Census.
• The Black population now accounts for 3.5% of Canada’s total population and 15.6% of the population defined as a visible minority.
• According to the population projections from Statistics Canada1, the Black population would continue to increase and could represent between 5.0% and 5.6% of Canada’s population by 2036.
• Both international net migration (difference between immigration and emigration) and natural increase (difference between births and deaths) have contributed to the growth of the Black population in Canada.
In 2016, close to 1.2 million people in Canada reported being Black
Population of interest
There are many different ways to define and measure the population of interest: a vastly diverse community of people in terms of history, ethnic and cultural origins, place of birth, religion and languages.
For this portrait, the population refers to persons who self-identified as “Black” in the population group question in the Census of Population. Since the 1996 Census, “Black” is one of the population groups listed on the census questionnaire. Respondents can choose to mark one or more population group, or to specify another group. With the exception of respondents who identified as belonging to both Black and White groups, multiple responses are excluded from this analysis.
Source: Statistics Canada, 2016 Census of Population 2A-L questionnaire.
Chart 1Number of persons and percent of the population who are Black, Canada, 1996 to 2016
Source: Statistics Canada, Census of Population, 1996, 2001, 2006 and 2016; 2011 National Household Survey.
0.0
0.5
1.0
1.5
2.0
2.5
3.0
3.5
4.0
0
200,000
400,000
600,000
800,000
1,000,000
1,200,000
1,400,000
1996 2001 2006 2011 2016
percentnumber
Black population Percentage of Canada's population

5 Diversity of the Black population in Canada: An overview
The Black population is a young population...
• In 2016, the Black population was younger than the total population in Canada. The median age for the Black population was 29.6 years, while it was 40.7 years for the total population.
• Children under 15 years old represented 26.6% of the Black population, while they represented 16.9% of the total population. At the other end of the age spectrum, 7.3% of the Black population were aged 65 years and over, compared to 15.9% of the total population.
• Similar to the total population, there are slightly more Black women than Black men. In 2016, 51.6% of the Black population was comprised of women. This was similar to the proportion in the total Canadian population, where 50.8% of the population was comprised of women.
...with a history in Canada
Chart 2Age pyramid for the Black and total populations, Canada, 2016
Source: Statistics Canada, Census of Population, 2016.
FemalesMales
age
percentage
(2016) Black population(2016) Total population
85+80-8475-79
70-7465-6960-6455-5950-5445-4940-4435-3930-3425-2920-2415-1910-14
5-90-4
12 10 8 6 4 2 0 0 2 4 6 8 10 12
percent
Source: Statistics Canada, Census of Population, 2016.
Chart 3Distribution of the Black and total populations by generation status, Canada, 2016
Black population Total population
First generationPersons who were born outside Canada
Second generationPersons who were born in Canada and had at least one parent born outside Canada
Third generation or morePersons who were born in Canada with both parents born in Canada
Generation status indicates for how many generations a person and their family have been in Canada.
8.6
58.4 35.0
17.7 56.4
23.9
0
10
20
30
40
50
60
70
80
90
100
Canada is the top place of birth of the Black population. In 2016, more than 4 in 10 Black people were born in Canada.

6Diversity of the Black population in Canada: An overview
About half of the Black population is or has ever been a landed immigrant or permanent resident in Canada...
...who came at different points in time
In 2016, about 623,195 Black people were immigrants, which included landed immigrants/permanent residents and Canadian citizens by naturalization.2
Chart 4Immigrant status for the Black population, Canada, 2016
Source: Statistics Canada, Census of Population, 2016.
Immigrant
Non-permanent resident
Canadian citizen by birth
44.3%52.0%
3.7%
Chart 5Period of immigration for Black immigrants, Canada, 2016
Source: Statistics Canada, Census of Population, 2016.
110,805
75,835
113,965
180,855
141,735
0
20,000
40,000
60,000
80,000
100,000
120,000
140,000
160,000
180,000
200,000
Before 1981 1981 to 1990 1991 to 2000 2001 to 2010 2011 to 2016
number
Period of immigration

7 Diversity of the Black population in Canada: An overview
...and through different gateways to Canada
• In the late 1960s, Canada’s immigration policy changed significantly. The discriminatory policy based on race or national origins was removed and the first point-based system focusing on criteria such as occupational skills, education and knowledge of official languages was introduced to select economic immigrants.
• Among those who still lived in Canada in 2016, the majority of the Black immigrants who landed in the 1980s and 1990s were sponsored by their family already living in the country.
• Women outnumbered men among those who were admitted in these two decennials. Most of them came from Jamaica and Haiti.
• By contrast, the largest share (40.3%) of newcomers (2011 to 2016) were admitted under the economic program. About three in 10 Black newcomers were refugees.
• Top countries of birth of economic newcomers were: Nigeria, Haiti, Cameroon, Côte d’Ivoire and Jamaica.
• Top countries of birth of new refugees were: the Democratic Republic of the Congo, Eritrea, Haiti, Somalia and Ethiopia.
• About 44,285 Black people were non-permanent residents in Canada in 2016. They were living temporarily in Canada on a work or study permit or as refugee claimants (asylum seekers).
percent
Source: Statistics Canada, Census of Population, 2016.
Chart 6Distribution of Black immigrants living in Canada in 2016 by broad admission categories and period of immigration
0
10
20
30
40
50
60
70
1981 to 1990 1991 to 2000 2001 to 2005 2006 to 2010 2011 to 2016
Period of immigration
Economic immigrants Immigrants sponsored by family Refugees Other immigrants

8Diversity of the Black population in Canada: An overview
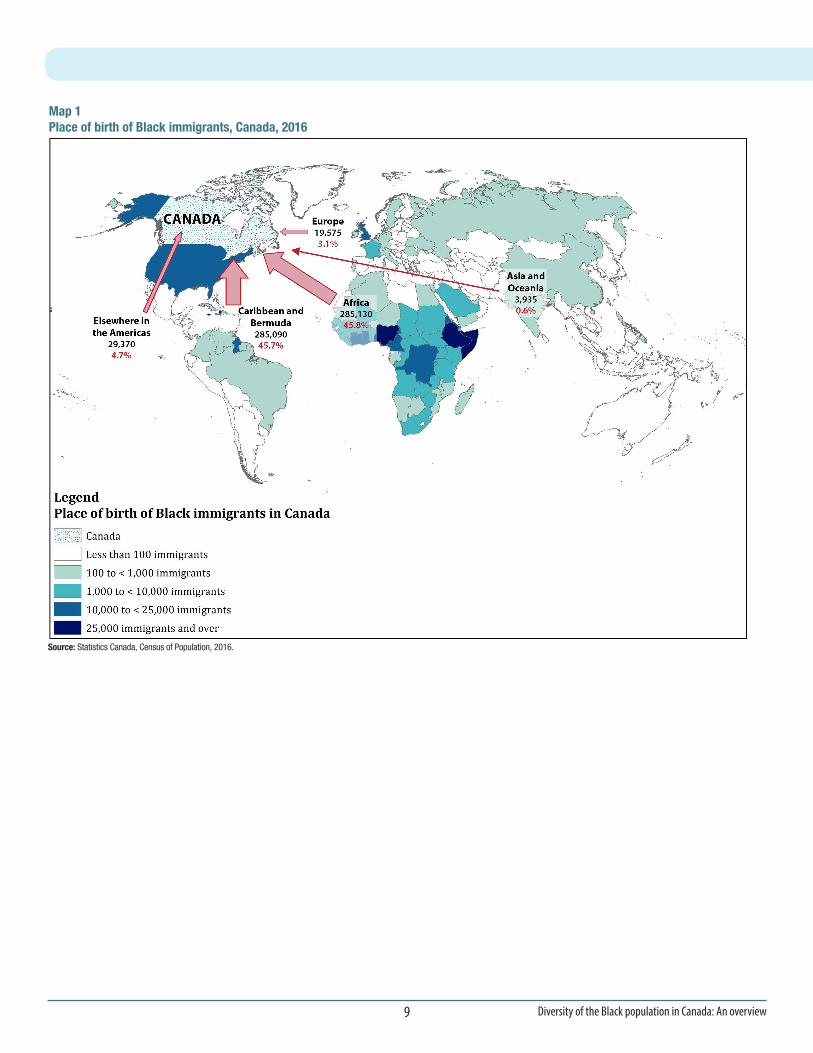
More than 170 different places of birth for the Black immigrants in Canada
Table 1 Top countries of birth for Black immigrants, Canada, 2016
number percentpercent
of womenTotal 623,195 100.0 53.3
Jamaica 122,550 19.7 56.9Haiti 92,040 14.8 56.2Nigeria 41,415 6.6 48.4Ethiopia 30,960 5.0 50.8Somalia 25,300 4.1 55.5Democratic Republic of the Congo 24,385 3.9 52.6Ghana 22,475 3.6 49.9Trinidad and Tobago 20,925 3.4 55.6Cameroon 18,335 2.9 50.1United States 14,505 2.3 46.6Other 210,305 33.7 52.0
Source: Statistics Canada, Census of Population, 2016.
Jamaica and Haiti are the two main countries of birth for Black immigrants in Canada.
Long-established Black immigrants were mostly from the Caribbean, but recent immigrants were predominantly from Africa.
• According to the 2016 Census, more than half (56.7%) of the Black immigrants who landed before 1981 were born in Jamaica and Haiti.
• Black newcomers now come from about 125 different countries. The top countries of birth for Black immigrants admitted between 2011 and 2016 were Haiti, Nigeria, Jamaica, Cameroon and the Democratic Republic of the Congo.
The source regions of immigration have changed over time
percent
Source: Statistics Canada, Census of Population, 2016.
Chart 7Region of birth of Black immigrants by period of immigration, Canada, 2016
4.8
27.7
46.8
62.7 65.1
83.3
64.0
46.6
29.0 27.3
0
10
20
30
40
50
60
70
80
90
100
Before 1981 1981 to 1990 1991 to 2000 2001 to 2010 2011 to 2016
Period of immigration
Caribbean and Bermuda
Rest of the Americas
Europe
Africa
Asia and Oceania
9 Diversity of the Black population in Canada: An overview
Map 1 Place of birth of Black immigrants, Canada, 2016
Source: Statistics Canada, Census of Population, 2016.
10Diversity of the Black population in Canada: An overview
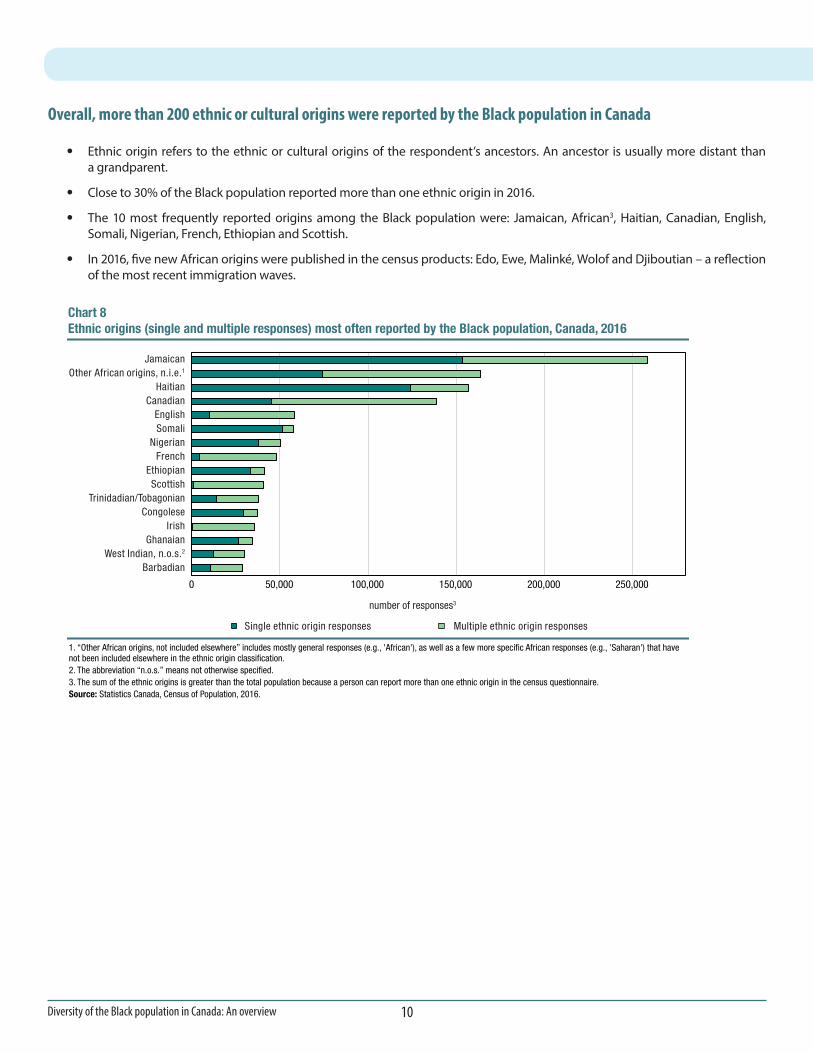
• Ethnic origin refers to the ethnic or cultural origins of the respondent’s ancestors. An ancestor is usually more distant than a grandparent.
• Close to 30% of the Black population reported more than one ethnic origin in 2016.
• The 10 most frequently reported origins among the Black population were: Jamaican, African3, Haitian, Canadian, English, Somali, Nigerian, French, Ethiopian and Scottish.
• In 2016, five new African origins were published in the census products: Edo, Ewe, Malinké, Wolof and Djiboutian – a reflection of the most recent immigration waves.
overall, more than 200 ethnic or cultural origins were reported by the Black population in Canada
Chart 8Ethnic origins (single and multiple responses) most often reported by the Black population, Canada, 2016
1. “Other African origins, not included elsewhere” includes mostly general responses (e.g., 'African'), as well as a few more specific African responses (e.g., 'Saharan') that have not been included elsewhere in the ethnic origin classification.2. The abbreviation “n.o.s.” means not otherwise specified.3. The sum of the ethnic origins is greater than the total population because a person can report more than one ethnic origin in the census questionnaire.Source: Statistics Canada, Census of Population, 2016.
0 50,000 100,000 150,000 200,000 250,000
BarbadianWest Indian, n.o.s.2
GhanaianIrish
CongoleseTrinidadian/Tobagonian
ScottishEthiopian
FrenchNigerian
SomaliEnglish
CanadianHaitian
Other African origins, n.i.e.1
Jamaican
Single ethnic origin responses Multiple ethnic origin responses
number of responses3
11 Diversity of the Black population in Canada: An overview
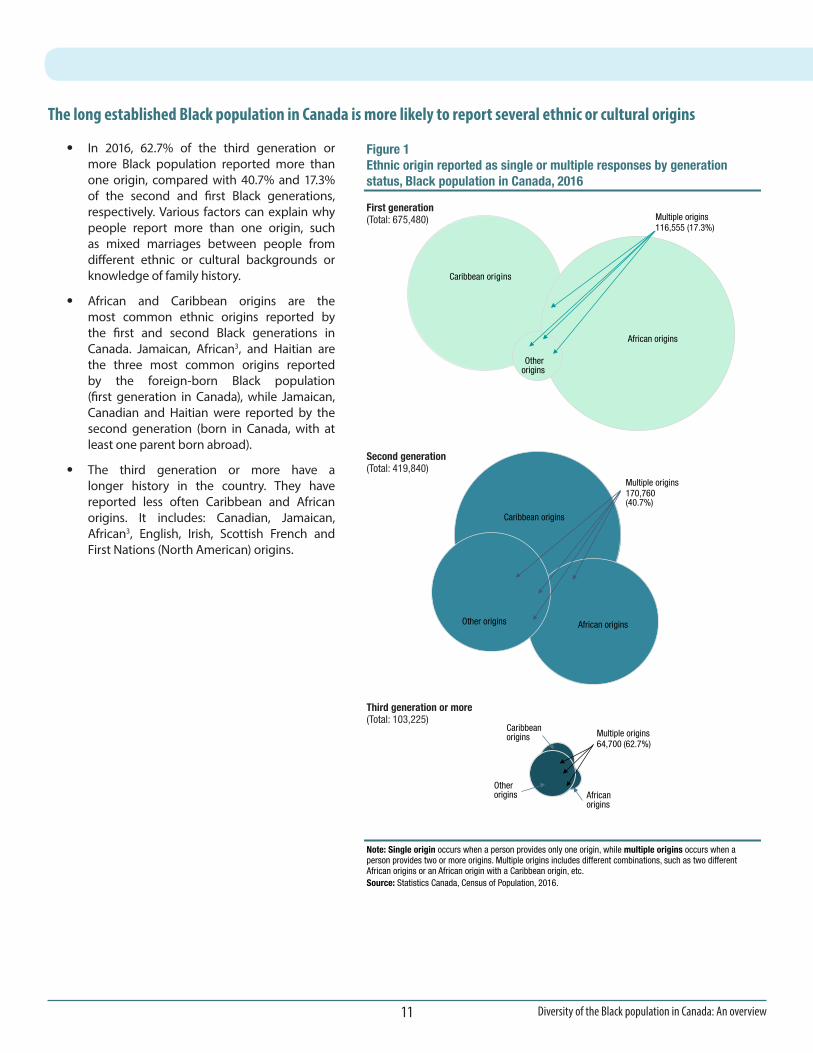
• In 2016, 62.7% of the third generation or more Black population reported more than one origin, compared with 40.7% and 17.3% of the second and first Black generations, respectively. Various factors can explain why people report more than one origin, such as mixed marriages between people from different ethnic or cultural backgrounds or knowledge of family history.
• African and Caribbean origins are the most common ethnic origins reported by the first and second Black generations in Canada. Jamaican, African3, and Haitian are the three most common origins reported by the foreign-born Black population (first generation in Canada), while Jamaican, Canadian and Haitian were reported by the second generation (born in Canada, with at least one parent born abroad).
• The third generation or more have a longer history in the country. They have reported less often Caribbean and African origins. It includes: Canadian, Jamaican, African3, English, Irish, Scottish French and First Nations (North American) origins.
The long established Black population in Canada is more likely to report several ethnic or cultural origins
Figure 1Ethnic origin reported as single or multiple responses by generation status, Black population in Canada, 2016
Note: Single origin occurs when a person provides only one origin, while multiple origins occurs when a person provides two or more origins. Multiple origins includes different combinations, such as two different African origins or an African origin with a Caribbean origin, etc. Source: Statistics Canada, Census of Population, 2016.
Caribbean origins
African origins
Otherorigins
Multiple origins 116,555 (17.3%)
Caribbean origins
African originsOther origins
Multiple origins 170,760 (40.7%)
Caribbeanorigins
African origins
Other origins
First generation(Total: 675,480)
Second generation(Total: 419,840)
Third generation or more(Total: 103,225)
Multiple origins 64,700 (62.7%)
12Diversity of the Black population in Canada: An overview
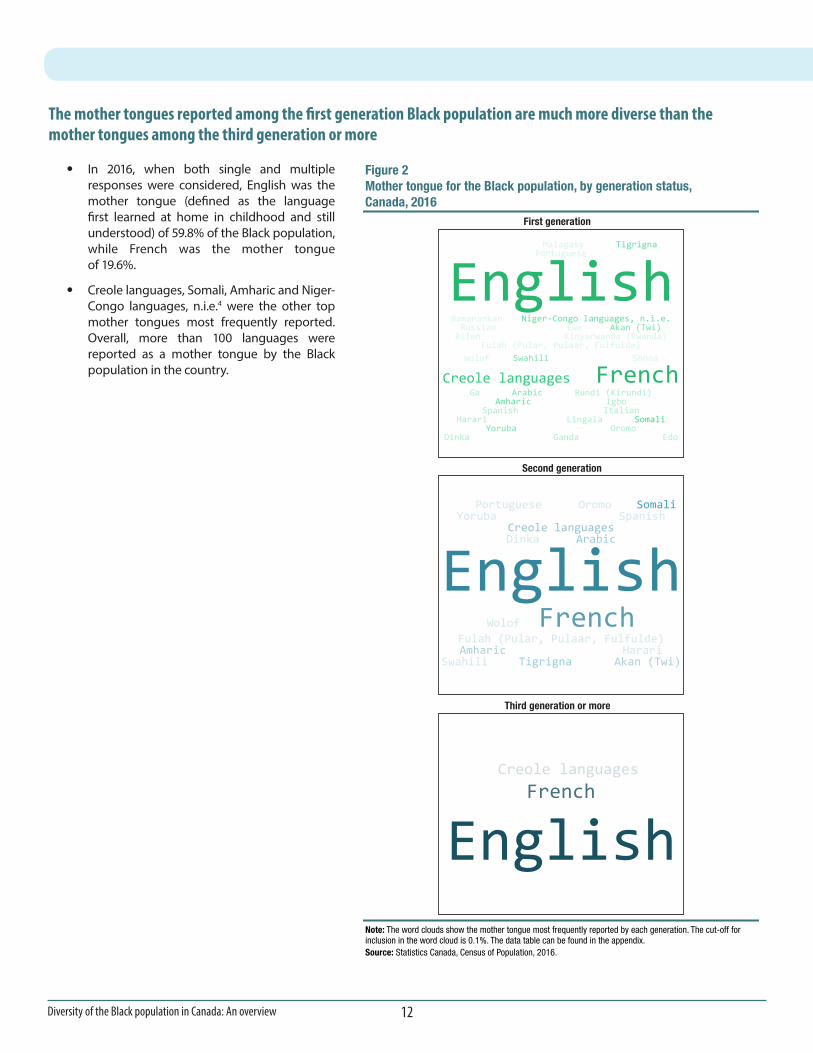
• In 2016, when both single and multiple responses were considered, English was the mother tongue (defined as the language first learned at home in childhood and still understood) of 59.8% of the Black population, while French was the mother tongue of 19.6%.
• Creole languages, Somali, Amharic and Niger-Congo languages, n.i.e.4 were the other top mother tongues most frequently reported. Overall, more than 100 languages were reported as a mother tongue by the Black population in the country.
The mother tongues reported among the first generation Black population are much more diverse than the mother tongues among the third generation or more
Figure 2Mother tongue for the Black population, by generation status, Canada, 2016
Note: The word clouds show the mother tongue most frequently reported by each generation. The cut-off for inclusion in the word cloud is 0.1%. The data table can be found in the appendix.Source: Statistics Canada, Census of Population, 2016.
Portuguese Oromo SomaliYoruba Spanish
Creole languagesDinka Arabic
English Wolof French
Fulah (Pular, Pulaar, Fulfulde) Amharic Harari
Swahili Tigrigna Akan (Twi)
Creole languages French
English
Malagasy TigrignaPortuguese
EnglishBamanankan Niger-Congo languages, n.i.e. Russian Ewe Akan (Twi)
Bilen Kinyarwanda (Rwanda) Fulah (Pular, Pulaar, Fulfulde)
Wolof Swahili Shona
Creole languages FrenchGa Arabic Rundi (Kirundi)
Amharic Igbo Spanish Italian
Harari Lingala SomaliYoruba Oromo
Dinka Ganda Edo
First generation
Second generation
Third generation or more

13 Diversity of the Black population in Canada: An overview
• The Black population is more likely to speak a language other than English or French at home (28.0% - when all categories are taken into consideration) than the total population (21.8%). In many cases, the Black population speaks English or French primarily at home, in addition to other languages on a regular basis.
• Both the Black population and the total population show similar percentages for those who speak English at home – around 74%.
Table 2 Frequency of English, French and other languages spoken at home for the Black and total populations, Canada, 2016
Black population Total populationnumber percent number percent
EnglishLanguages spoken at home 1,198,540 100.0 34,460,050 100.0
English spoken at home 887,955 74.1 25,694,855 74.6 Primarily 753,605 62.9 22,031,180 63.9
Only 656,370 54.8 19,650,025 57.0 Mostly 97,235 8.1 2,381,155 6.9
Equally with another language 65,275 5.4 1,488,820 4.3 Regularly (secondary use) 69,075 5.8 2,174,855 6.3
No mention of English 310,585 25.9 8,765,195 25.4 FrenchLanguages spoken at home 1,198,540 100.0 34,460,050 100.0
French spoken at home 335,350 28.0 8,028,300 23.3 Primarily 235,315 19.6 6,842,960 19.9
Only 143,835 12.0 5,994,055 17.4 Mostly 91,480 7.6 848,905 2.5
Equally with another language 54,935 4.6 366,160 1.1 Regularly (secondary use) 45,100 3.8 819,180 2.4
No mention of French 863,190 72.0 26,431,750 76.7 Other language(s)Languages spoken at home 1,198,540 100.0 34,460,050 100.0
Other language(s) spoken at home 335,655 28.0 7,500,780 21.8 Primarily 113,205 9.4 3,950,050 11.5
Only 61,635 5.1 2,280,995 6.6 Mostly 51,570 4.3 1,669,055 4.8
Equally with another language 79,745 6.7 1,481,480 4.3 Regularly (secondary use) 142,705 11.9 2,069,250 6.0
No mention of other language 862,885 72.0 26,959,270 78.2
Source: Statistics Canada, Census of Population, 2016.
A higher percent of people within the Black population (28.0%) speak french at home compared to the total population (23.3%)

14Diversity of the Black population in Canada: An overview
• In 2016, 94.3% of Black people lived in Canada’s census metropolitan areas (CMAs), compared with 71.2% of the country’s total population.
• Toronto, Montréal, Ottawa-Gatineau, Edmonton and Calgary were each home to at least 50,000 people who reported being Black in 2016.
• Toronto has the largest Black population in the country, with 442,015 people or 36.9% of Canada’s Black population. The size of this population has increased in 15 years, but it now represents a smaller share of Canada’s Black population than in 2001 (46.9%).
• CMAs of Ottawa-Gatineau (Quebec part), Lethbridge and Moncton had the fastest growing Black population in the country between 1996 and 2016.
• Black people represented 7.5% of Toronto’s total population, the highest proportion among census metropolitan areas. Montréal and Ottawa-Gatineau had the second and third highest proportions.
The vast majority of the Black population live in large urban areas
Chart 9Black population as a percentage of the population in selected census metropolitan areas, Canada, 2016
Source: Statistics Canada, Census of Population, 2016.
percent
0 1 2 3 4 5 6 7 8
Hamilton
Winnipeg
Windsor
Halifax
Calgary
Edmonton
Ottawa - Gatineau (Quebec part)
Oshawa
Ottawa - Gatineau
Ottawa - Gatineau (Ontario part)
Montréal
Toronto
15 Diversity of the Black population in Canada: An overview
ATlAnTIC ProvInCes: longesT hIsTory
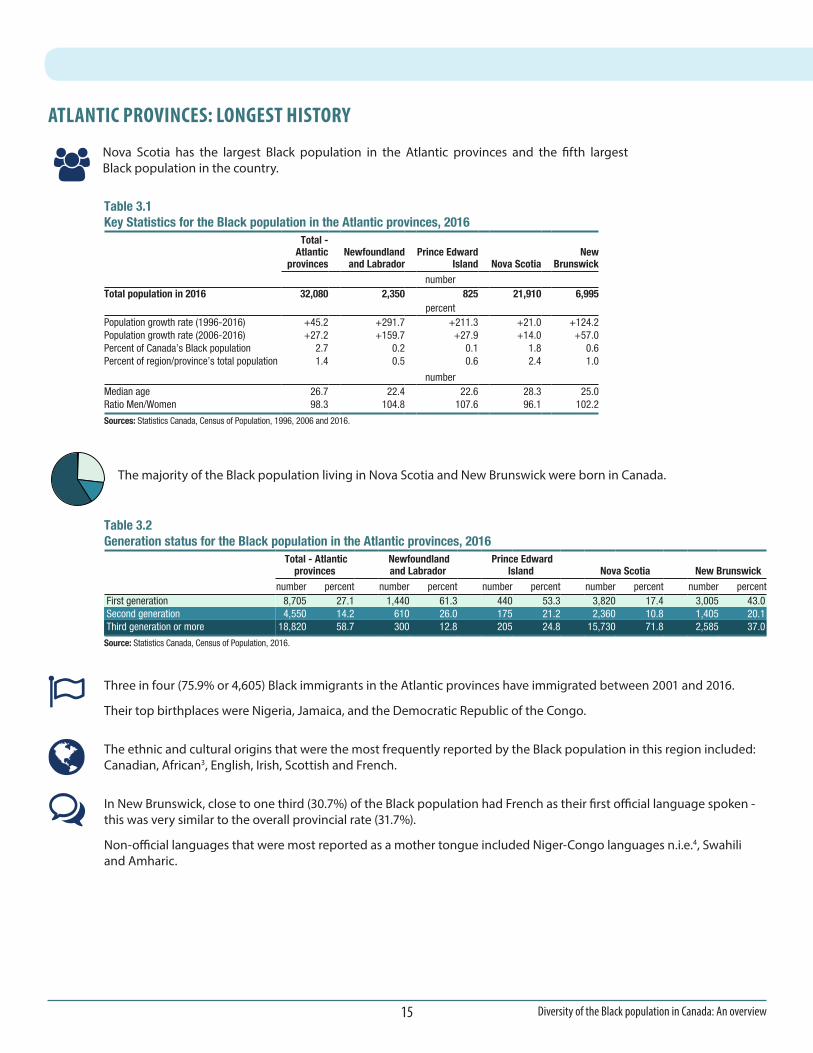
Table 3.1 Key Statistics for the Black population in the Atlantic provinces, 2016
Total - Atlantic
provincesNewfoundland and Labrador
Prince Edward Island Nova Scotia
New Brunswick
numberTotal population in 2016 32,080 2,350 825 21,910 6,995
percentPopulation growth rate (1996-2016) +45.2 +291.7 +211.3 +21.0 +124.2Population growth rate (2006-2016) +27.2 +159.7 +27.9 +14.0 +57.0Percent of Canada’s Black population 2.7 0.2 0.1 1.8 0.6Percent of region/province’s total population 1.4 0.5 0.6 2.4 1.0
numberMedian age 26.7 22.4 22.6 28.3 25.0Ratio Men/Women 98.3 104.8 107.6 96.1 102.2
Sources: Statistics Canada, Census of Population, 1996, 2006 and 2016.
Table 3.2 Generation status for the Black population in the Atlantic provinces, 2016
Total - Atlantic provinces
Newfoundland and Labrador
Prince Edward Island Nova Scotia New Brunswick
number percent number percent number percent number percent number percent First generation 8,705 27.1 1,440 61.3 440 53.3 3,820 17.4 3,005 43.0 Second generation 4,550 14.2 610 26.0 175 21.2 2,360 10.8 1,405 20.1 Third generation or more 18,820 58.7 300 12.8 205 24.8 15,730 71.8 2,585 37.0
Source: Statistics Canada, Census of Population, 2016.
The majority of the Black population living in Nova Scotia and New Brunswick were born in Canada.
Three in four (75.9% or 4,605) Black immigrants in the Atlantic provinces have immigrated between 2001 and 2016.
Their top birthplaces were Nigeria, Jamaica, and the Democratic Republic of the Congo.
The ethnic and cultural origins that were the most frequently reported by the Black population in this region included: Canadian, African3, English, Irish, Scottish and French.
In New Brunswick, close to one third (30.7%) of the Black population had French as their first official language spoken - this was very similar to the overall provincial rate (31.7%).
Non-official languages that were most reported as a mother tongue included Niger-Congo languages n.i.e.4, Swahili and Amharic.
Nova Scotia has the largest Black population in the Atlantic provinces and the fifth largest Black population in the country.

16Diversity of the Black population in Canada: An overview
QueBeC: frenCh sPeAkIng
The Black population in Quebec is predominately first generation living in the country, but some have also called Canada home for many generations.
In Quebec, nearly 43% of the foreign-born Black population were born in Haiti. In fact, the largest Haitian community in Canada live in the census metropolitan area of Montréal.
About 52,935 (or three in 10) Black immigrants in Quebec are newcomers in the country and were admitted between 2011 and 2016. Close to six in 10 of them came from African countries, but Haiti remains the top source country of recent immigrants.
About 180 different ethnic and cultural origins were reported by Black people in Quebec, with Haitian as the top reported origin.
French is the most reported mother tongue by the first (38.5%), second (72.8%) and third generation or more (57.2%) of Black people living in Quebec.
• French is an official language in all of the top six countries of birth of Black immigrants living in Quebec (Haiti, Cameroon, the Democratic Republic of the Congo, Côte D’Ivoire, Senegal and France).
• About 28% of the Black population reported that they had a mother tongue other than English or French. The top three languages were Creole, Niger-Congo languages n.i.e.4 and Rundi (Kirundi).
• When considering the two official languages of Canada, the Black population with French as their first official language spoken represented 81.1%, while the share of those with English as their first official language spoken was 18.1%.
Table 4.1 Key statistics for the Black population in Quebec, 2016
Quebecnumber
Total population in 2016 319,230percent
Population growth rate (1996-2016) +141.9Population growth rate (2006-2016) +69.7Percent of Canada’s Black population 26.6Percent of region/province’s total population 4.0
numberMedian age 29.5Ratio Men/Women 93.3
Sources: Statistics Canada, Census of Population, 1996, 2006 and 2016.
Table 4.2 Generation status for the Black population in Quebec, 2016
Quebec number percent
First generation 194,010 60.8 Second generation 109,680 34.4 Third generation or more 15,535 4.9
Source: Statistics Canada, Census of Population, 2016.
Quebec has the second largest Black population, with 26.6% of Canada’s total Black population.
In 20 years, the Black population has more than doubled in size in this province – going from 131,970 people in 1996 to 319,230 people in 2016.

17 Diversity of the Black population in Canada: An overview
onTArIo: lArgesT BlACk PoPulATIon In CAnADA
Close to half of Ontario’s Black population was born in Canada, which reflects in part, their long immigration history in this province.
In Ontario, Black immigrants came from 150 different countries. About one-half were born in the Caribbean, with Jamaica (33.9%) as the leading source country.
Nigeria, Trinidad and Tobago, Somalia, Ghana and Ethiopia were the five other most frequently reported countries for Black immigrants.
About 44,415 people in Ontario were Black newcomers (2011 to 2016) and represented 14.1% of all Black immigrants in Ontario. Top countries of birth for this group were Jamaica, Nigeria, Haiti and Ethiopia.
Overall, more than 200 ethnic and cultural origins were reported by the Black population in Ontario, with Jamaican as the most frequently reported origin.
Nearly 80% of Black people in Ontario reported English as their mother tongue, and close to 6% reported French.
Somali, Akan (Twi) and Amharic were the other most frequently reported mother tongues by the Black population in Ontario.
Among the 83,940 immigrants with French as their first official language spoken in Ontario, 31.4% were Black. This proportion reached 48.4% among newcomers (2011-2016).
Table 5.1 Key statistics for the Black population in Ontario, 2016
Ontarionumber
Total population in 2016 627,710percent
Population growth rate (1996-2016) +76.2Population growth rate (2006-2016) +32.5Percent of Canada’s Black population 52.4Percent of region/province’s total population 4.7
numberMedian age 30.6Ratio Men/Women 89.4
Sources: Statistics Canada, Census of Population, 1996, 2006 and 2016.
Table 5.2 Generation status for the Black population in Ontario, 2016
Ontario number percent
First generation 335,025 53.4 Second generation 240,900 38.4 Third generation or more 51,790 8.3
Source: Statistics Canada, Census of Population, 2016.
Ontario was home to slightly more than half (52.4%) of the total Black population in Canada.
Although the overall Black population in Ontario is growing, its share of the Black population in the country has decreased in 15 years. In 2001, 62.1% of Canada’s Black population was living in this province.
18Diversity of the Black population in Canada: An overview
The PrAIrIe ProvInCes: fAsTesT growIng
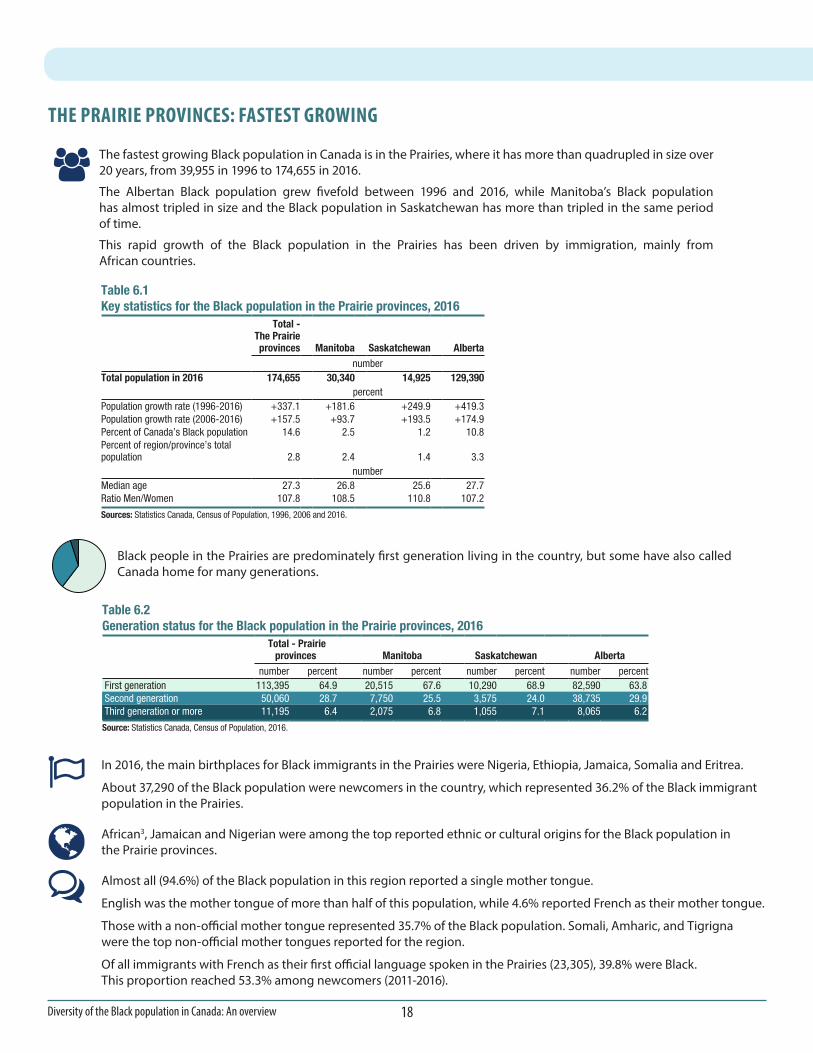
Table 6.1 Key statistics for the Black population in the Prairie provinces, 2016
Total - The Prairie provinces Manitoba Saskatchewan Alberta
numberTotal population in 2016 174,655 30,340 14,925 129,390
percentPopulation growth rate (1996-2016) +337.1 +181.6 +249.9 +419.3Population growth rate (2006-2016) +157.5 +93.7 +193.5 +174.9Percent of Canada’s Black population 14.6 2.5 1.2 10.8Percent of region/province’s total population 2.8 2.4 1.4 3.3
numberMedian age 27.3 26.8 25.6 27.7Ratio Men/Women 107.8 108.5 110.8 107.2
Sources: Statistics Canada, Census of Population, 1996, 2006 and 2016.
Table 6.2 Generation status for the Black population in the Prairie provinces, 2016
Total - Prairie provinces Manitoba Saskatchewan Alberta
number percent number percent number percent number percent First generation 113,395 64.9 20,515 67.6 10,290 68.9 82,590 63.8 Second generation 50,060 28.7 7,750 25.5 3,575 24.0 38,735 29.9 Third generation or more 11,195 6.4 2,075 6.8 1,055 7.1 8,065 6.2
Source: Statistics Canada, Census of Population, 2016.
In 2016, the main birthplaces for Black immigrants in the Prairies were Nigeria, Ethiopia, Jamaica, Somalia and Eritrea.
About 37,290 of the Black population were newcomers in the country, which represented 36.2% of the Black immigrant population in the Prairies.
African3, Jamaican and Nigerian were among the top reported ethnic or cultural origins for the Black population in the Prairie provinces.
Almost all (94.6%) of the Black population in this region reported a single mother tongue.
English was the mother tongue of more than half of this population, while 4.6% reported French as their mother tongue.
Those with a non-official mother tongue represented 35.7% of the Black population. Somali, Amharic, and Tigrigna were the top non-official mother tongues reported for the region.
Of all immigrants with French as their first official language spoken in the Prairies (23,305), 39.8% were Black. This proportion reached 53.3% among newcomers (2011-2016).
The fastest growing Black population in Canada is in the Prairies, where it has more than quadrupled in size over 20 years, from 39,955 in 1996 to 174,655 in 2016.
The Albertan Black population grew fivefold between 1996 and 2016, while Manitoba’s Black population has almost tripled in size and the Black population in Saskatchewan has more than tripled in the same period of time.
This rapid growth of the Black population in the Prairies has been driven by immigration, mainly from African countries.
Black people in the Prairies are predominately first generation living in the country, but some have also called Canada home for many generations.
19 Diversity of the Black population in Canada: An overview
BrITIsh ColuMBIA: few reCenT BlACk IMMIgrAnTs
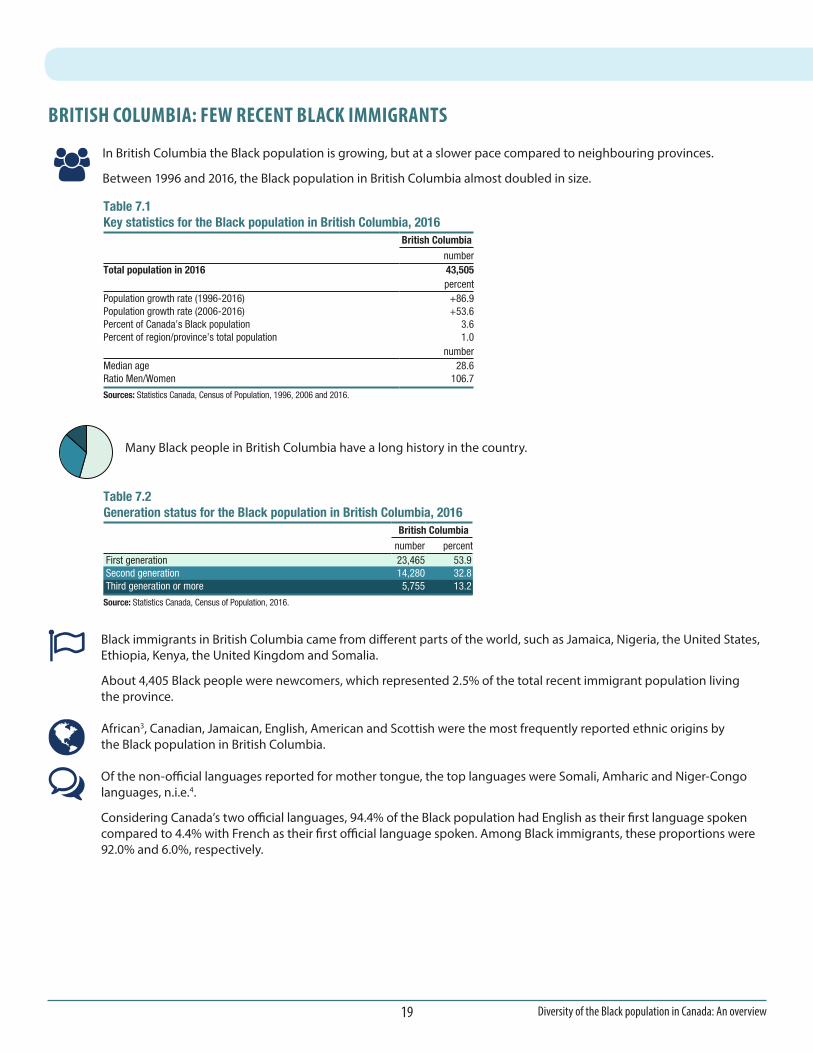
Table 7.1 Key statistics for the Black population in British Columbia, 2016
British Columbianumber
Total population in 2016 43,505percent
Population growth rate (1996-2016) +86.9Population growth rate (2006-2016) +53.6Percent of Canada’s Black population 3.6Percent of region/province’s total population 1.0
numberMedian age 28.6Ratio Men/Women 106.7
Sources: Statistics Canada, Census of Population, 1996, 2006 and 2016.
Table 7.2 Generation status for the Black population in British Columbia, 2016
British Columbia number percent
First generation 23,465 53.9 Second generation 14,280 32.8 Third generation or more 5,755 13.2
Source: Statistics Canada, Census of Population, 2016.
Many Black people in British Columbia have a long history in the country.
Black immigrants in British Columbia came from different parts of the world, such as Jamaica, Nigeria, the United States, Ethiopia, Kenya, the United Kingdom and Somalia.
About 4,405 Black people were newcomers, which represented 2.5% of the total recent immigrant population living the province.
African3, Canadian, Jamaican, English, American and Scottish were the most frequently reported ethnic origins by the Black population in British Columbia.
Of the non-official languages reported for mother tongue, the top languages were Somali, Amharic and Niger-Congo languages, n.i.e.4.
Considering Canada’s two official languages, 94.4% of the Black population had English as their first language spoken compared to 4.4% with French as their first official language spoken. Among Black immigrants, these proportions were 92.0% and 6.0%, respectively.
In British Columbia the Black population is growing, but at a slower pace compared to neighbouring provinces.
Between 1996 and 2016, the Black population in British Columbia almost doubled in size.

20Diversity of the Black population in Canada: An overview
The TerrITorIes: sMAllesT BlACk PoPulATIon In CAnADA
Table 8.1 Key statistics for the Black population in the Territories, 2016
Total - The Territories
Yukon Territory
Northwest Territories Nunavut
numberTotal population in 2016 1,350 265 760 325
percentPopulation growth rate (1996-2016) +285.7 +112.0 +322.2 +622.2Population growth rate (2006-2016) +125.0 +112.0 +102.7 +225.0Percent of Canada’s Black population 0.1 0.0 0.1 0.0Percent of region/province’s total population 1.2 0.8 1.8 0.9
numberMedian age 35.3 35.9 35.0 36.4Ratio Men/Women 118.5 82.8 133.8 120.0
Sources: Statistics Canada, Census of Population, 1996, 2006 and 2016.
Table 8.2 Generation status for the Black population in the Territories, 2016
Total - The Territories Yukon Territory
Northwest Territories Nunavut
number percent number percent number percent number percent First generation 865 64.1 120 45.3 515 67.8 230 70.8 Second generation 360 26.7 95 35.8 185 24.3 80 24.6 Third generation or more 125 9.3 50 18.9 60 7.9 15 4.6
Source: Statistics Canada, Census of Population, 2016.
The Territories had the fewest number of Black people in the country.
Top places of birth for the Black population in the Territories are: Canada, Jamaica, Zimbabwe, Nigeria, Ethiopia and Somalia.
Canadian and Jamaican were the two most frequently reported ethnic or cultural origins for the Black population in the Territories.
The top reported mother tongues: English, French, Niger-Congo languages, n.i.e.4, Arabic and Shona.
The first generation Black population makes up the majority of the total Black population in the Territories.
21 Diversity of the Black population in Canada: An overview
Conclusion
This portrait of Canada’s Black population from the Centre for Gender, Diversity and Inclusion Statistics is based mainly on 2016 Census data. It provides a demographic overview of the Black population, as well as key statistics related to their ethnic, cultural and linguistic diversity and a few geographical highlights. However, this portrait is not meant to be exhaustive.
Although it highlights the great diversity within the Black population, it does not present any result related to the several challenges and issues faced by many members of Black communities in Canada.
Challenges and issues such as those related to labour market integration, income inequalities, differential access to resources, health conditions, discrimination, school dropout, etc., may impact differently various groups within the Black population. Moreover, although the Black population generally has similar characteristics compared to the overall population, they often present different socio-economic outcomes. For example, the unemployment rate for the Black population is higher than for Canada’s total population.
Disaggregated 2016 Census data tables with selected demographic, cultural, labour market and income characteristics are available on Statistics Canada’s Census program website which can provide insights on similarities and differences within the Black population as well as between the Black population and other populations in Canada.
New analytical products will be released later which will describe in more detail the characteristics of Canada’s Black population, as well as their socio-economic outcomes.
Acknowledgments
This portrait was prepared by Hélène Maheux and Deniz Do, analysts of the Social and Aboriginal Statistics Division. Special thanks to Jean-Pierre Corbeil and Éric Caron Malenfant for their advice and guidance. The authors also wish to thank Émilie Lavoie, Alejandro Paez Silva, Julien Acaffou, Christine Bizier, Nathalie Villemure and Denis Theriault for their input and assistance in the verification and finalizing of this portrait. They would also like to thank Jennifer Arkell for the creation of the cover page for this portrait.
The authors are also grateful for the members of the Expert Working Group on Black Communities for their invaluable insight and comments for this project. Members include: Malinda S. Smith (professor, University of Alberta), Myrlande Pierre (researcher, Centre de recherche en immigration, ethnicité et citoyenneté de l’UQAM), Carl James (professor, York University), Scot Wortley (professor, University of Toronto), and Frantz Voltaire (director, Centre international de documentation et d’information haïtienne, caribéenne et afro-canadienne).
notes
1. Statistics Canada (2017). Immigration and Diversity: Population Projections for Canada and its Regions, 2011 to 2036, Statistics Canada, Catalogue no. 91-551-X. (low immigration and high immigration scenarios).
2. Naturalization is the process through which landed immigrants/permanent residents acquire Canadian citizenship.
3. “Other African origins, not included elsewhere” includes mostly general responses (e.g., ‘African’), as well as a few more specific African responses (e.g., ‘Saharan’) that have not been included elsewhere in the ethnic origin classification.
4. n.i.e. = not included elsewhere

22Diversity of the Black population in Canada: An overview
Data table for figure 2 Mother tongue for the Black population, by generation status, Canada, 2016
percent
First generation English 45.0French 14.6Creole languages 8.9Somali 4.1Amharic 2.9Niger-Congo languages, n.i.e.1 2.7Tigrigna 2.1Akan (Twi) 1.8Swahili 1.6Yoruba 1.3Arabic 1.1Rundi (Kirundi) 0.8Kinyarwanda (Rwanda) 0.7Igbo 0.6Oromo 0.6Lingala 0.5Wolof 0.5Shona 0.5Fulah (Pular, Pulaar, Fulfulde) 0.4Portuguese 0.3Spanish 0.3Ewe 0.2Edo 0.2Dinka 0.2Bamanankan 0.2Ganda 0.2Ga 0.1Harari 0.1Bilen 0.1Malagasy 0.1Italian 0.1Russian 0.1
Second generationEnglish 68.5French 22.2Somali 1.6Creole languages 0.8Amharic 0.4Akan (Twi) 0.4Tigrigna 0.3Arabic 0.3Swahili 0.2Oromo 0.2Portuguese 0.1Yoruba 0.1Fulah (Pular, Pulaar, Fulfulde) 0.1Wolof 0.1Dinka 0.1Spanish 0.1Harari 0.1
Third generation or moreEnglish 88.6French 9.8Creole languages 0.1
1. The abbreviation “n.i.e” means not included elsewhere.Note: The word clouds show the mother tongue most frequently reported by each generation of the Black population. The cut-off for inclusion in the word cloud is 0.1%. Source: Statistics Canada, Census of Population, 2016.
Appendix