Embed Size (px)
Citation preview
HS2 Outline Business Case
Economic Case
1
Table of Contents
1 Executive Summary3 Introduction3 Our assessment of the Economic Case for HS2 4 Key Issues 8 Strategic Alternatives 11
2 What is the role of this Economic Case13
3 The Assessment Framework 16 The Scheme 16 Assessing the costs and benefits of HS2 ndash an introduction 16 Treatment of risk and uncertainty 17 The approach to forecasting demand for HS2 18 Assessing the benefits of HS2 19 Assessing the costs of HS220 What impact do these changes have on the reference Economic Case for HS2 24
4 The Alternatives to HS2 29 Introduction29 Summary of previous work 30 Rationale for further work on the Strategic Alternatives 30 Scope of new work 31 Short-listed alternatives32
5 HS2 ndash robustness of Economic Case 45 Introduction45 Risk Analysis 46 Extensions to standard assessment 49 Threats and Opportunities 58
6 Value for Money Assessment 62 Introduction62 Does the scheme represent lsquovalue for moneyrsquo 63 Conclusion 66
2
1 Executive Summary
Introduction
11 This Economic Case is intended to assess the value for money of HS2
whilst also considering the range of alternative options for delivering the
strategic objectives of HS2 It adheres to the general guidance on
evaluating proposals published by HM Treasury in the Green Book and
the more detailed advice provided by the Department for Transport (DfT)
on how to apply Green Book principles to transport investments
(WebTAG)1
12 This document reproduces previously published analysis on both the
HS2 proposal2 and the alternative options3 In compliance with both the
Green Book and WebTAG it intends to provide a consolidated
assessment of the costs and benefits of each of the options considered
13 WebTAG has been developed over many years and has benefited
greatly from the UKrsquos long tradition of applying cost benefit analysis to
transport infrastructure investment proposals Comparisons show that
the UK appraisal system compares very well with those in other
countries and the UK has led the world in setting out its guidance on
analysing the impact of proposals in an open and transparent way4
14 At each key stage of the development of HS2 we have conducted an
analysis of the costs and benefits to allow us to understand the value for
money of the proposed investment Over the course of the last year
HS2 Ltd in their role in providing advice to Government on the value-for-
money of the scheme has made some significant improvements to their
analytical tools We are therefore able to provide a much improved
understanding of the costs and benefits of the proposal This document
provides an updated economic appraisal of the scheme based on HS2
Ltdrsquos latest advice on the schemersquos impacts on peoplersquos travel choices
1 Department for Transport lsquoTransport Analysis Guidance ndash WebTAGrsquo httpswwwgovuktransport-analysis-guidance-webtag 2 HS2 Ltd (2013) lsquoThe Economic Case for HS2rsquo
httpassetshs2orguksitesdefaultfilesinsertsS26A201_Economic20case_0pdf 3 Department for Transport (2013) lsquoThe Strategic Case for HS2rsquo httpswwwgovukgovernmentpublicationshs2-strategic-case and Atkins (2013) lsquoAppraisal of Rail Alternatives to HS2rsquo httpswwwgovukgovernmentpublicationsrail-alternatives-to-hs2 4 httpswwwgovukgovernmentuploadssystemuploadsattachment_datafile209530final-overview-reportpdf
3
Our assessment of the Economic Case for HS2
Standard Assessment ndash the lsquoreference casersquo
15 The appraisal aims to capture all of the impacts ndash positive and negative
ndash as well as the associated risks and uncertainty so that the decision-
maker is provided with a full assessment of the pros and cons of
different courses of action Where possible these impacts are
expressed in units of money and it is from these monetary valuations
that the benefit cost ratio ndash a measure of the return to the investment - is
calculated
16 A wide range of benefits are quantified in monetary terms ranging from
direct benefits to transport users from travel time savings reductions in
crowding and improvements in reliability to wider economic impacts
safety and environmental impacts such as noise and air quality The
table below provides a breakdown of these benefits and the extent to
which they contribute to the case for HS2 HS2 is expected to generate
significant levels of benefits with benefits totalling pound281bn for Phase 1
and pound710bn for the full network (NPV 2011 prices)
Table 1 - Breakdown of the benefits from the HS2 proposals
poundbn (2011 PV) Phase One Full Network
Time Savings 200 512
Crowding benefits 41 75
Car User Benefits 06 12
Transport User Benefits 246 599
Agglomeration 24 87
Imperfect Competition 17 40
Increased Labour Force Participation
02 05
Wider Economic Impacts 43 133
Other Impacts 04 08
Loss to Government of indirect tax
-12 -29
Total 281 710
Notes Other impacts include reduction in car noise carbon impacts HS1 link reduction in car accidents and the noise from HS2 trains Numbers may not add due to rounding The Time Savings relate to overall time savings not solely in-vehicle time savings
17 The standard appraisal does not solely account for the benefits resulting
from the scheme but also assesses the net costs to Government of the
scheme It accounts for the upfront costs of building the full HS2 network
combined with the costs of operating the network once built as well as
the implications for revenue The table below summarises the net costs
to Government which are subsequently combined with the benefits to
generate a Benefit Cost Ratio (BCR) for the scheme
4
Table 2 - Breakdown of the net cost to Government from HS2
Phase One poundBn (2011 PV)
Full Network poundBn (2011 PV)
Capital Costs 218 405
Operating Costs 82 221
Total Costs 299 626
Revenues 132 311
Net Costs 167 315
18 Using the typical assumptions presented in WebTAG and used in
standard transport appraisals for the full Y-Network the scheme
represents high value for money with a Benefit Cost Ratio of 23 to 1
implying a return of over pound2 for every pound1 invested While the BCR for
Phase 1 (London to the West Midlands) is lower only offering medium
value for money with a BCR of 17 to 1 it still yields substantial benefits
totalling pound281bn
Other impacts
19 For a transformational scheme of the scale of HS2 it is right that we
undertake a rigorous assessment of all its impacts While we are using
the best methods and tools available to assess these there are certain
impacts for which either it is not currently possible to express in
monetary terms or the tools available are less robust
110 Landscape impacts consider the effects of a scheme on the visible
features of a landmass combined with the cultural aspects of the land
itself Any valuation of something which is intangible such as landscape
is challenging and while the Department has used the best available
methods to quantify landscape impacts there remains inherent
uncertainty
111 The Landscape impacts have been estimated at pound10bn for Phase One
and pound29bn for the Y-Network which would reduce the BCR in both
cases by 01 It is therefore concluded that consideration of landscape
impacts are unlikely to substantially alter the value for money of the
scheme
112 There are a set of environmental and socio-economic impacts resulting
from HS2 which are not possible to quantify in monetary terms but have
been considered qualitatively The work undertaken by HS2 Ltd to
develop the Environmental Statement for Phase One and Appraisal of
Sustainability for Phase Two ensures that we have a thorough
understanding of these impacts The main impacts include
5
Heritage ndash Buildings parks and sites of architectural or historical
significance
Townscape ndash The physical and social characteristics of the built
environment and the way we perceive those characteristics
Biodiversity ndash Degree of variation of life forms
Water environment ndash The availability of water resources
Option values ndash The value of the option of using a transport service
for trips not yet anticipated or currently undertaken by other modes
113 Consideration of these additional environmental and socio-economic
impacts does not conclusively alter the case for the scheme as there
are both adverse and beneficial impacts It is also important to note that
HS2 has and will be designed to minimise adverse impacts on the
environment and mitigate impacts as far as possible where they occur
Further mitigation measures not yet considered in this assessment are
therefore likely which will further reduce any negative impacts
The robustness of the lsquostandardrsquo appraisal
114 HS2 will generate benefits for the UK for generations to come
Forecasting such a long way into the future is inherently challenging It is
particularly important to understand the uncertainty attached to those
factors in the appraisal which will have the greatest impact on the
investment case In the case of HS2 as with many transport
investments this means understanding in particular the impact of a
range of different assumptions about economic growth growth in
demand for rail travel construction costs and the valuation of time
savings
115 Section 5 assesses the resilience of the economic case to a range of
different assumptions associated with these factors It uses the
assumptions underpinning the standard assessment as the starting point
This analysis captures the range of benefit cost ratios that could result
from combinations of different assumptions and is based on an
understanding of the probability of different events occurring It provides
a systematic way of assessing the range of different outcomes that could
occur However it is unable to capture all possible outcomes because
there are some events that cannot be described in terms of probabilities
in this way
116 Figure 1 below illustrates the results of this analysis for the full Y-
network and shows the range of possible BCR outcomes mapped
6
against the Departmentrsquos value for money categories to allow
comparisons with other schemes From this analysis we can have
confidence that the scheme will offer high value for money with more
than three quarters of the scenarios tested offering benefit cost ratios
higher than 2 offering a return of more than pound2 for every pound1 invested
Even under the most pessimistic scenarios with high construction costs
historically low economic growth low values of time and low growth in
demand the scheme would still offer positive returns on investment
Figure 1 ndash Y-Network distribution of Benefit-Cost Ratios
117 Figure 2 shows the results of this analysis for Phase 1 of the scheme It also provides us with some degree of confidence that our conclusions on
the value for money of Phase 1 are sound While the overall return is
lower than for the full Y-network in over 75 of scenarios tested Phase
1 is at least medium value for money ndash that is delivering benefits of over
pound150 for every pound1 invested
7
Figure 2 ndash Phase 1 distribution of Benefit-Cost Ratios
Key Issues
118 HS2 is unlike most other transport schemes It is a project with high up-
front capital investment producing benefits over a very long life-span
There are therefore certain standardised assumptions used in a
conventional economic assessment that have a substantial impact on
the BCR for which alternative and potentially reasonable approaches
exist To understand this further specific sensitivity tests were
undertaken on the impact of different key assumptions most notably
demand forecasts and different valuations of time savings
Demand Cap ndash lsquolong term BCRrsquo
119 To date the HS2 economic case has used an approach of capping
demand in the year at which demand for long distance journeys reaches
a certain level a point expected to be reached in 2036 This is despite
very strong rail demand growth over the last 20 years in the decade
from 2002 to 2012 the annual growth in long distance rail travel was
52 While it is unreasonable to expect demand for rail travel to
continue growing indefinitely there is no evidence to suggest demand
growth will stop at that particular point in time
120 Figure 3 below shows that modest changes to the demand cap can lead
to significant changes in the benefit cost ratios
8
0
10
20
30
40
50
60
Like
liho
od
Full network - BCR with WEIs (ratio) 2011 PricesPV
Demand growth stops at 2040
Poor VfM
Low VfM
Medium VfM
High VfM
0of sample
02of sample
37of sample
952of sample
Very high VfM
1of sample
0
10
20
30
40
50
60
Like
liho
od
Full network - BCR with WEIs (ratio) 2011 PricesPV
Demand growth stops at 2027
Poor VfM
Low VfM
Medium VfM
High VfM
02of sample
666of sample
329of sample
04of sample
Very high VfM
0of sample
Figure 3 ndash Full Network distribution of Benefit-Cost Ratios with different demand cap assumptions
Business Value of Time
121 The appraisal of benefits requires that we attach a value to the time
savings travellers enjoy as a result of HS2 The evidence suggests that
those travelling in the course of their work are typically willing to pay
considerably more to reduce travel time than people making leisure or
commuting trips
9
122 The valuation of business travel time savings should reflect peoplersquos willingness-to-pay (WTP) for them The standard approach assumes that
employee wages are a suitable approximation of WTP Wersquove looked at
the evidence on peoplersquos WTP and it shows that the values of time
adopted in the standard analysis are a suitable representation of what
business passengers travelling by rail are willing to pay for quicker
journeys 5
123 There are however reasons to believe that high speed rail schemes
should be assessed with values of time higher than those applied to
conventional rail schemes A review of both UK and international
evidence on the valuation of travel time savings was recently undertaken
for the Department by the Institute for Transport Studies University of
Leeds (ITS Leeds)6 This study concluded that when considering values
of time for high speed rail the existing evidence points to a valuation in
excess of that applied in the economic analysis by as much as 40 ndash 50
A sensitivity test which considers a 40 uplift to the standard values has
been applied to the appraisal 7 8 Given the relatively limited number of
High Speed rail specific studies a low value of time scenario which
considers the wider evidence for the willingness to pay for travel time
savings across all rail travel is also presented Evidence presented in the
ITS Leeds (2013) study suggests applying a figure 20 lower than the
WebTAG 2013 values of time
124 As indicated in the charts below the BCR for the Y-Network in the case
of a lower value of time is expected to be approximately 2 while
consideration of a High Speed Rail specific value results in a BCR
greater than 3 and in this case taking account of the risks and
uncertainty which have been quantified there is a limited chance that
BCR will fall below 2
5 Wardman M Batley R et al (2013) lsquoValuation of Travel time Savings for Business
Passengers ITS Leeds httpswwwgovukgovernmentpublicationsvalues-of-travel-time-savings-for-business-travellers 6 Wardman M Batley R et al (2013) lsquoValuation of Travel time Savings for Business Passengers ITS Leeds httpswwwgovukgovernmentpublicationsvalues-of-travel-time-savings-for-business-travellers 7 Wardman M Batley R et al (2013) lsquoValuation of Travel time Savings for Business
Passengers ITS Leeds httpswwwgovukgovernmentpublicationsvalues-of-travel-time-savings-for-business-travellers 8 On the basis that some of this variation is likely to be related to the longer trip lengths
served by high-speed rail the standard non-work values of time have also been adjusted to reflect the longer distances served by HS2
10
Figure 4 ndash Full Network distribution of Benefit-Cost Ratios with HSR specific value of time
Figure 5 ndash Full Network distribution of Benefit-Cost Ratios with low value of time
Strategic Alternatives
125 A key component of the economic case is consideration of the
alternatives to HS2 The alternatives to HS2 can offer means of
providing more capacity on the rail network while also generating high
value for money Nevertheless the Benefit Cost Ratio should not be
11
taken to unequivocally represent the right answer analysis indicates that
the alternatives are likely to
Be unable to provide as much extra capacity for passengers
Lead to significant levels of disruption to passengers during
construction
Worsen network resilience or performance reliability and
Be unable to offer the same level of journey time savings as HS2
12
2 What is the role of this Economic Case
21 The Governmentrsquos commitment to develop a High Speed Rail network in the UK is at a key stage in programme development which necessitates
revisiting the Economic Case for the scheme
22 This document provides an update to the economic case for HS2 that
was published in January 2012 and subsequently updated in August
20129 Its purpose is threefold
to assess the value for money of HS2
to assess a range of alternative options for delivering the strategic
objectives of HS2 and
to provide an up to date economic assessment of the Phase 2 route
and station choices currently being consulted upon
23 The economic case consolidates analysis on HS2 and the alternatives
already published in October 2013 It should therefore be read in
conjunction with these documents which are listed below
The Strategic Case for HS2 - provides a comprehensive overview
of the HS2 scheme proposal10
The Economic Case for HS2 ndash economic advice for Government on
the case for HS2 prepared by HS2 Ltd11 and
24 The main role of the Economic Case is to consider whether all of the
collective impacts (including on existing transport networks) delivered by
the preferred scheme represent good value for taxpayersrsquo money The
assessment of the HS2 scheme itself draws heavily on the analysis
presented in the economic advice of HS2 Ltd to Government published
in October 2013 However in order to robustly answer the value for
money question this Economic Case also assesses the case for the
various investment alternatives
9 January 2012 httpswwwgovukgovernmentpublicationseconomic-case-for-hs2-value-for-money-statement August 2012 update
httpassetshs2orguksitesdefaultfilesinsertsUpdated20economic20case20for20 HS2pdf 10 Department for Transport (2013) lsquoThe Strategic Case for HS2rsquo httpswwwgovukgovernmentpublicationshs2-strategic-case 11 HS2 Ltd (2013) lsquoEconomic Case for HS2rsquo httpwwwhs2orguknews-resourceseconomic-documents
13
25 By bringing together and summarising information on costs benefits and
risks the Economic Case is able to support decision making However it
should not be seen as unequivocally providing the lsquorightrsquo or only answer
ie the option which appears to offer the best value-for-money is not
necessarily the optimal proposal The Department carries out investment
appraisals following the recommendations in HM Treasury guidance on
the five case model for public sector business cases12 Decision-makers
are presented with evidence against all five cases (strategic economic
financial commercial and management) when considering investment
decisions such as HS213 Therefore while value for money is important it
is only one factor that is taken into account when choosing whether or
not to proceed to the next stage in the decision making process
26 This economic case has been prepared in accordance with the
requirements of HM Treasuryrsquos Green Book and the Department for
Transportrsquos transport appraisal guidance (WebTAG)14 and uses the most
appropriate tools and evidence available Nevertheless there are
challenges to appraising the potential benefits and costs of a
transformational transport scheme such as HS2 In line with National
Audit Office recommendations full consideration has been made of
these challenges and associated uncertainty rather than reliance on
point estimates15
27 A complete assessment of the value for money of a transport scheme
requires comparing a range of options We have therefore looked in
detail at the case for options based on enhancements to the existing rail
network (the Strategic Alternatives - see section 4) as well as the case
for a new high speed line All of these schemes have been compared to
a common scenario that allows us to assess the incremental economic
social environmental and public accounts impacts that each package of
transport interventions may bring about
28 It is important to remember that as with all business cases the
underlying economic case for HS2 will change over time according to
factors such as changes in the economic outlook updates to the
models used by HS2 Ltd to predict behavioural responses to HS2 the
development of non-market valuation techniques refinement of cost
assumptions or scheme design and development of the Departmentrsquos
demand forecasting and appraisal framework The assessment
12 lsquoPublic Sector Business Cases using the Five Case model A Toolkitrsquo httpswwwgovukgovernmentuploadssystemuploadsattachment_datafile190601Green_ Book_guidance_public_sector_business_cases_using_the_Five_Case_Model_guidancepdf 13 See httpswwwgovuktransport-analysis-guidance-webtag for more details 14 httpswwwgovuktransport-analysis-guidance-webtag 15 NAO (2013) High Speed 2 A Review of Early Programme Preparation page 12 httpwwwnaoorgukwp-contentuploads201307Full-Reportpdf
14
presented here will continue to develop in the months and years ahead
so this should not be taken as the final word on the Economic Case for
either Phase 1 or Phase 2 of the scheme
15
3 The Assessment Framework
The Scheme
31 HS2 is one piece of infrastructure being planned and built in two phases
Phase One will see a new line run from London Euston through Old
Oak Common to new stations serving Birmingham airport and
Birmingham city centre It also includes a connection to the West Coast
Main Line (WCML) north of Birmingham allowing lsquoclassic compatiblersquo
trains to continue from the high speed line direct to destinations such as
Manchester and Glasgow
32 The proposals for Phase Two will extend high speed lines to Manchester
in the North West and to Leeds in Yorkshire and Humberside with
intermediate stations at Manchester Interchange (near Manchester
airport) the East Midlands Hub at Toton and Sheffield Meadowhall
Trains which can travel on the existing rail infrastructure as well as HS2
will then continue onto the existing network and travel further North to
Scotland It also incorporates a connection with the WCML further south
at Crewe meaning key destinations like Liverpool Runcorn Crewe and
Warrington would benefit from direct services
33 HS2 will link 8 of Britainrsquos 10 largest cities to the High Speed
infrastructure with other cities served by compatible trains running on to
the existing train network Further details of the proposed route
assessed within this Economic Case are available in the Phase 2 line-of-
route consultation document16
Assessing the costs and benefits of HS2 ndash an introduction
34 The influence of a major transport scheme such as HS2 is likely to be
widespread and complex and will lead to changes in transport
conditions that will affect the decisions of individuals both directly and
indirectly It is therefore imperative that an appropriate level of effort is
put into assessing these consequences to understand the extent to
which scheme objectives are met and problems solved and to estimate
the value for money of the project
35 Over the past two years in order to fulfil their duty of providing advice to
Government HS2 Ltd has implemented a very substantial programme of
updates and improvements to its transport modelling suite While HS2
Ltd has appraised the impacts of HS2 using the best available modelling
tools it also recognises that there are inevitable uncertainties and
16 HS2 Phase 2 Route Consultation httpwwwhs2orgukroute-consultation
16
challenges associated with assessing the costs and benefits of the
largest transport infrastructure scheme in the UK since the origin of the
motorways
36 Rather than describe in full the modelling tools used for the analysis the
focus here is on the changes implemented since August 2012 Further
details of the assumptions methods and models used to assess HS2
can be found in the methodological overview of the Planet Framework
Model and the associated Assumptions Report17
37 Changes to the assessment framework can be split into four elements
The treatment of risk and uncertainty
The approach to forecasting demand for HS2
Assessing the benefits of HS2 and
Assessing the costs of HS2
38 The remainder of this section summarises the changes that have been
implemented Further detail of their combined impact on the economic
case for HS2 is provided below as well as in supporting material
published by HS2 Ltd18
Treatment of risk and uncertainty
39 To assess the impacts of HS2 the Department and HS2 Ltd have used
the best tools and evidence base available There are however specific
challenges to assessing such a transformational scheme as HS2 HS2 is
the largest transport infrastructure project for a generation the impacts
of which need to be assessed almost 80 years into the future at a time
when even the short-term economic outlook is uncertain
310 In recognition of these challenges rather than focus on a single point
estimate of the costs and benefits of the scheme HS2 Ltd in their advice
to Government adopt a broader approach This approach recognises
major potential sources of risk and uncertainty and analyses the
likelihood of different outcomes
311 In keeping with the advice of HS2 Ltd this Economic Case provides a
thorough assessment of the robustness of the value for money of the
scheme to different events and circumstances While it is still necessary
17 HS2 Ltd (2013) lsquoPlanet Framework Model (PFM V43) ndash Model Descriptionrsquo and HS2 Ltd (2013) lsquoPFM v43 Assumptions reportrsquo httpwwwhs2orguknews-resourceseconomic-documents 18 HS2 Ltd (2013) lsquoThe Summary of Key Changes to the Economic Case since August 2012rsquo httpwwwhs2orguknews-resourceseconomic-documents
17
to consider a lsquoreference casersquo (ie a point estimate of costs and benefits)
against which the alternatives to HS2 can be understood the analysis
presented here also explicitly considers the potential range of outcomes
given some of the many known sources of uncertainty
The approach to forecasting demand for HS2
312 HS2 Ltd has specified and implemented a wide-ranging programme of
work to ensure that its projections of long-distance travel continue to
reflect the best available evidence These changes apply both to the
consideration of HS2 and its alternatives Model development has
focused on the key areas described below19
Base year demand ndash forecasting future transport demand requires
detailed information on current travel patterns HS2 Ltd has
improved its understanding of why people travel and the mode of
travel they use In particular they have gathered an improved
understanding of the categorisation of trips into business leisure
and commuting purposes through using National Rail Travel Survey
data to estimate journey purposes at a more disaggregated
geographic level
The lsquowithout-schemersquo scenario - estimating the incremental benefits
of HS2 and the Strategic Alternatives requires comparison against a
scenario in which HS2 is not built The Department has announced
a number of planned enhancements to transport infrastructure in
England and Wales which have been reflected in the lsquowithout
schemersquo scenario20
Estimating the size of the market - forecasts of rail demand rely on
estimating the relationship between passenger demand and a
range of influences that are known to affect rail patronage such as
economic growth and rail fares The demand forecasts have been
updated to incorporate new evidence from the Passenger Demand
Forecasting Handbook on the behavioural relationships used to
forecast rail demand21
Forecasting external factors - in addition to understanding the
sensitivity of rail passengers to a range of influences we must also
take a view on how those influences are likely to evolve through
19 For further details see lsquoThe Summary of Key Changes to the Economic Case since August 2012rsquo httpwwwhs2orguknews-resourceseconomic-documents 20 High Level Output Specification 2012 httpswwwgovukgovernmentpublicationshigh-level-output-specification-2012 21 For further information regarding the Passenger Demand Forecasting Handbook see httpwwwatocorgabout-atoccommercial-activitiespassenger-demand-forecasting-council
18
time The updated Economic Case reflects more recent forecasts of
variables such as economic growth and fuel costs22
Train service patterns - to establish the benefits of the schemes a
train service specification which covers trains on both the high
speed and existing network needs to be developed Alterations to
the demand forecasts have meant revisiting the train service
patterns to ensure they correspond to estimated demand
Assessing the benefits of HS2
313 To conduct a cost benefit analysis of all impacts it is necessary to place
a value on the changes to the wellbeing of both transport users and non
transport users resulting from the introduction of HS2 or its alternatives
To bring these impacts to the same units for comparison monetary
valuations are applied wherever possible
314 As with the methods used to forecast passenger demand for HS2 and its
alternatives the techniques applied to translate this into a complete cost
benefit analysis of HS2 have been reviewed and updated in the following
key areas
Application of crowding values - The Department has updated both
the methodology and values used to place a monetary value on
crowding relief to bring it in line with the most recent evidence from
the Passenger Demand Forecasting Handbook This suggests that
passengers place lower value on reducing crowding than previously
thought
Business Values of time - The values used previously were based
on income and travel data from the National Travel Survey from
1999-2001 and have now been updated with National Travel
Survey data from 2008-201023
Non-work values of time - The Department has reviewed the
evidence on how the non-work values of time are likely to increase
over time The most recent evidence demonstrates that the non-
work values grow more strongly over time than was previously
assumed24
22 As with any appraisal there is a lead time for producing analysis which in certain cases (most notably GDP forecasts) has prevented the very latest projections from being incorporated 23 Department for Transport (2013) TAG Unit A1-3 user and provider impacts httpswwwgovukgovernmentpublicationswebtag-tag-unit-a1-3-user-and-provider-impacts 24 A series of research reports which collect recent evidence on the non-work values of time can be found at httpswwwgovukgovernmentcollectionstransport-appraisal-and-strategic-modelling-tasm-research-reports
19
315 For further details please see the lsquoPFM V43 Summary of Key Changes
since August 2012rsquo25
Assessing the costs of HS2
316 In order to establish the value for money of a transport intervention it is
necessary to compare the benefits generated with the costs incurred In
the case of HS2 this covers both the up-front costs of delivering the
necessary infrastructure and rolling stock (the capital costs) and the
costs required to provide rail services once the infrastructure is available
for use (the operating costs) Both cost elements have undergone
revision since the last iteration of the Economic Case for the scheme
Capital Costs
317 The cost estimates prepared for the January 2012 Economic Case were
estimated when the scheme was at a far earlier stage of development
A public consultation on the route options for Phase 1 had just been
completed while Phase 2 was at the preliminary pre-consultation phase
Since January 2012 the capital cost estimates for both phases of the
scheme have undergone considerable review and further design
development and alterations have been made to the scheme Changes
to Phase 1 include more tunnels increased certainty of design at
stations increased number of bridges and further refinement of the
earthworks and retaining walls For Phase 2 the initial preferred route
has different approaches to Manchester including the inclusion of a
station at Manchester Airport and the recognition of additional mining
risks on the Leeds leg
318 Further details of the changes to both capital and rolling stock cost
estimates can be found in the HS2 Ltd Cost and Risk Status Report26
Phase 1 Construction Costs
319 The latest estimate of base costs for constructing Phase 1 of HS2 is
pound1565bn (2011 Q2 prices)27 This includes all costs associated with
purchasing land and property
tunnelling works
building stations depots and stabling
25 httpwwwhs2orguknews-resourceseconomic-documents 26 HS2 Ltd (2013) lsquoCost and Risk Status Reportrsquo httpwwwhs2orguknews-resourceseconomic-documents 27 This estimate includes certain sunk costs which are excluded from the appraisal in line with the guidance specified in WebTAG Unit 359
20
laying tracks signals and associated railway systems
insurance and
staff costs and other overheads
320 On the current scope and delivery timetable for the scheme HS2 has
been set a lsquotarget pricersquo to deliver Phase 1 within base cost plus a 10
allowance (pound1716bn in 2011 prices) with the allowance designed to
manage design changes through the Hybrid Bill process There are
robust mechanisms and suitable allocation of risks that support the
achievability of this target
321 In order to understand the opportunities and threats associated with
meeting the target price HS2 Ltd has completed a structured
assessment of risks their likelihood and their consequences Over
three-hundred of these risks have been included within a quantitative
risk assessment (QRA) More detail is provided in HS2 Ltdrsquos Cost and
Risk Status Report
322 The results of the quantified risk assessment are expressed in terms of
the probability that the cost of building Phase 1 will fall below a certain
level So the higher the level of certainty required the higher the
associated cost threshold
323 To inform the standard appraisal within the economic case the expected
or average value of the quantified risks in line with HM Treasury Green
Book guidance have been considered HS2 Ltdrsquos cost estimation work
established a lsquoP50rsquo cost estimate of pound194bn (2011 prices)28 which is the
basis of the DfT spending allocation in the Spending Review 2013
324 The Treasury will hold an additional contingency as part of an overall
funding envelope announced in the Spending Review 2013 of pound214bn
(2011 prices) This represents total allowances of 37 on top of base
costs but the Department and HS2 Ltd are determined to deliver the
project below this level at the target price of pound1716bn (2011 prices)
325 Figure 6 indicates the range of cost outcomes considered within the
economic case The impact of this range on the relationship between
scheme benefits and costs is described in section 5 of this document
28 This estimate includes certain sunk costs which are excluded from the appraisal in line with
the guidance specified in WebTAG Unit 359
21
00
50
100
150
200
250
Lower Bound Reference Case P50 Overall funding envelope P95
poundb
n (
20
11
Q2
Pri
ce
s)
Contingency
Base Cost
Figure 6 ndash Range of cost outcomes considered
326 Basing the level of contingency allowances on the results of a
quantitative risk assessment represents best practice Optimism bias is
considered inappropriate to be applied in the appraisal of schemes
beyond the Strategic Outline Business Case stage of development on
the basis that cost estimates will be mature at this stage of development
327 The approach has been agreed with HM Treasury on the basis that
We will do further work to understand and quantify the broadest
possible set of risks associated with the delivery of HS2 at the point
in time at which it is most appropriate to do so This will include
Developing our treatment of construction cost inflation
Further work to develop a procurement strategy for HS2 and
Working closely with rail industry stakeholders to better understand
the impact of HS2 upon their businesses
A Cost and Risk Group including HMT and Infrastructure UK
oversees a programme of work expected to focus on the following
Ensuring a shared detailed understanding of costs risks and
contingency from a delivery and controls standpoint
Ensuring a continued focus on cost reduction and control
Providing an advisory and challenge function and
Ensuring this work takes account of best practice in other projects
22
Phase 2 Construction Costs
328 Since the base cost estimates for Phase 2 are less mature it is not
appropriate to use the same approach to contingency allowances as
used for Phase 1 Instead a similar approach as employed in previous
updates to the economic case for HS2 has been used This involves
applying a combination of quantitative risk assessment and optimism
bias to generate an expected value of total contingency allowances
329 The latest estimate of base costs for delivering the infrastructure needed
for phase 2 of HS2 is pound125bn (2011 Q2 prices) As for phase 1 to
inform the reference scenario within the economic case we have
considered the expected or average value of the quantified risks in line
with HM Treasury Green Book guidance The expected value of risk
provision at P50 is 34 of the base construction cost excluding indirect
costs Indirect costs have had a risk allowance of 10 applied to them
330 An additional optimism bias of 32 has then been applied to phase 2
construction costs (excluding indirect costs) The overall optimism bias
applied to direct costs (construction and land) at P50 is therefore 66
which is in line with WebTAG rail appraisal guidance The level of
contingency is 52 higher than the base cost estimate including indirect
costs (pound190bn in 2011 prices at P50)
331 A target price for Phase 2 has not yet been identified due to its relatively
early stage of development However to ensure that we have assessed
the case for HS2 against an appropriately wide range of outcomes we
have also considered a scenario in which the entire provision for funding
agreed with HM Treasury is needed for construction This represents
total allowances of 89 on top of direct base costs with 10 applied to
indirect costs (a total of pound212bn in 2011 prices at P95)
Rolling Stock Costs
332 HS2 Ltd has taken forward detailed work to assess the latest view on the
likely cost of HS2 rolling stock This has involved reassessing the fleet
requirement (including removing 260 metre units as a service offering)
given the latest view on service patterns assessing recent market
activity in order to benchmark costs taking market soundings making
separate provision (including a 100 risk allowance) for design costs
and considering procurement approaches
333 This latest cost estimation work has led to a revised central estimate for
rolling stock costs of pound69bn (2011 prices) of which pound135bn is
contingency
23
Operating Costs
334 HS2 Ltd has conducted a technical review of the estimated operating
costs of HS2 with the aim being to update assumptions in line with the
latest available benchmarks and to reflect improved information
associated with more detailed scheme design and development
335 The most significant operating cost changes in terms of their impact on
overall costs have been
HS2 rolling stock electricity consumption ndash Methods used to
evaluate this cost have significantly improved and
Improvements have been made to the methods used to calculate
Train Operating Company overheads and administrative costs
336 HS2 Ltd in consultation with DfT has also reviewed the level of
optimism bias applied to HS2 operating costs In carrying out this review
the aim has been to better reflect the maturity of cost estimates the
availability of relevant benchmarks and the quality of the evidence on
which they are based As a result differing levels of Optimism Bias are
applied to different costs ranging from 10 applied to rolling stock
electricity costs to 41 applied to infrastructure operations and
maintenance costs
337 Unlike previous iterations of the Economic Case for HS2 no optimism
bias allowance is applied to classic line savings Previously the
application of optimism bias to cost savings acted to increase the
assumed level of savings Further details of the changes to operating
cost estimates are available in the HS2 Ltd Economic Case29
What impact do these changes have on the reference Economic Case
for HS2
338 In order to understand the impact of the changes described above on
the Benefit Cost Ratio (BCR) of HS2 a lsquoreferencersquo case has been
developed which adheres to the detailed advice provided by the
Department for Transport on how to apply Green Book principles to
transport investments (WebTAG)30 This allows for comparison with the
benefit cost ratio as presented in the August 2012 Economic Case
29 HS2 Ltd (2013) lsquoEconomic Case for HS2rsquo httpwwwhs2orguknews-resourceseconomic-documents 30 Department for Transport lsquoTransport Analysis Guidance ndash WebTAGrsquo
httpswwwgovuktransport-analysis-guidance-webtag
24
update and also provides a point estimate against which the Economic
Case for each of the alternatives can be compared
339 Further details regarding how each of the changes to the modelling
framework noted above have impacted on the BCR of HS2 can be found
in the lsquoPFM V43 Summary of Key Changes since August 2012rsquo report31
Benefits
340 The total net transport benefits (excluding Wider Economic Impacts) of
the HS2 Y-Network (including both Phase 1 and Phase 2) are calculated
to be pound599bn (2011 PV and prices) with a net revenue impact of
pound311bn (2011 PV and prices) Overall this represents an increase in
benefits of pound117bn (2011 PV and prices) compared to the August 2012
estimate Revenue has remained relatively unchanged
341 For Phase 1 total benefits equal pound246bn (2011 PV and prices) with a
net revenue of pound132bn (2011 PV and prices) As with the Y-network this
represents a substantial increase in benefits from pound188bn in August
2012 Revenue remains broadly unchanged from an estimate of
pound132bn in August 2012 The table below provides a summary of the
benefits of Phase 1 and the Full Network
Table 3 - Breakdown of the benefits from the HS2 proposals
poundm (2011 PV) Phase One Full Network
AccessEgress Cost Savings pound1094 pound1115
Crowded time savings pound4068 pound7514
BoardInterchange time savings
pound810 pound4146
Wait Time Savings pound3508 pound8081
Walk Time Savings pound404 pound1330
In Vehicle time savings pound14142 pound36503
Car User Benefits pound568 pound1162
Transport User Benefits pound24594 pound59852
Notes Numbers may not add due to rounding
342 In comparison with the previous appraisals of the scheme there is an
increase in the level of user benefits originating from travel time savings
despite the reduction to the business value of time One of the primary
drivers of this is the updates to the modelling which reflect an improved
understanding of why people travel This indicated that a greater
proportion of journeys are undertaken by business travellers between
the locations covered by HS2
343 An assessment has also been made of the non-monetised benefits of
the scheme taking account of the impact of HS2 on factors such as
31 This report can be found at httpwwwhs2orguknews-resourceseconomic-documents
25
heritage biodiversity and journey ambience Further details of this
assessment can be found in Section 6 It concludes that consideration of
these additional impacts does not imply conclusively that they improve
or worsen the case for the scheme as there are both adverse and
beneficial impacts
Costs
344 Since the assessment made in August 2012 scheme capital costs have
increased from pound188bn to pound218bn (2011 PV and prices) for Phase 1
For the full Y-Network the increase is from pound364bn to pound405bn (2011 PV
and prices)32 This includes a rolling stock cost estimate of pound65bn (2011
PV and prices including a full replacement) In contrast operating costs
have remained similar to the August 2012 assessment (although this is
largely a coincidental result of changes in both directions) The scheme
costs are summarised in the table below
Table 4 - Breakdown of the net cost to Government from HS2
poundbn (2011 PV) PHASE ONE FULL NETWORK
Capital Costs 218 405
Operating Costs 82 221
Total Costs 299 626
Revenues 132 311
Net Costs 167 315
Wider Economic Impacts
345 The Wider Economic Impacts (WEIs) resulting from HS2 are valued at
pound43bn for Phase 1 and pound133bn for the entire Y-Network In August
2012 these figures were calculated as pound48bn for Phase 1 and pound154bn
for the Y-Network The table below describes the Wider Economic
Impacts of the scheme
32 This assessment differs from the pound426bn total funding package for HS2 as it takes account of discounting and reflects a lower level of contingency
26
Table 5 ndash Wider Economic Impacts
poundm (2011 PV) Phase One Full Network
Agglomeration pound2413 pound8706
Imperfect Competition pound1692 pound4053
Increased Labour Force Participation pound235 pound535
Total pound4341 pound13293
346 Further details of the impact these changes have had on the benefits
and costs of the scheme can be found in the lsquoThe Summary of Key
Changes to the Economic Case since August 2012rsquo This report
indicates that the changes which had the most significant impact on the
BCR were
Improved estimates of base year transport demand and our
understanding of why people travel which increased the estimated
proportion of business travellers and therefore increased scheme
benefits
The changes to the value of travel time savings for business
passengers which reduced scheme benefits
Incorporating new evidence on the value passengers place on
reducing crowding which reduced scheme benefits
Revisions to capital cost estimates which increased scheme costs
Updated train service specifications both on HS2 and the classic
lines when HS2 is operational which increased scheme benefits
and
Updates to the lsquowithout schemersquo case to incorporate all committed
rail infrastructure investment which reduced scheme benefits
Benefit Cost Ratio
347 The impact of these changes on the benefit cost ratio (BCR) for the
reference case is presented in the table below The resulting BCR
(excluding Wider Economic Impacts) is 14 for Phase 1 and 18 for the
entire Y-Network The equivalent figures presented in August 2012 were
14 for phase 1 and 19 for the entire network
348 The benefits and costs of proceeding with Phase Two of the scheme
once Phase One has been completed have also been analysed The
BCR for Phase Two once Phase One is built is expected to be 21
excluding Wider Economic Impacts
27
349 When Wider Economic Impacts are included the BCR has stayed largely
constant for Phase 1 at 17 whereas for the Y-Network it has fallen from
approximately 25 to 23 The BCR including Wider Economic Impacts
for Phase 2 assuming Phase 1 is in place is 27
Table 6 - Reference Case BCR calculation (60 year appraisal period)
poundm (2011 PV) PHASE 1 Y-NETWORK PHASE 2
Net Transport Benefits
(PVB)
238 577 319
Net Transport Benefits
including Wider
Economic Impacts
(PVB)
281 710 407
Capital Costs 218 405 187
Net Operating Costs 82 221 137
Net Revenues 132 311 173
Net Cost to
Government (PVC)
167 315 151
BCR (excluding Wider
Economic Impacts)
14 18 21
BCR (including Wider
Economic Impacts)
17 23 27
28
4 The Alternatives to HS2
Introduction
41 The Government has considered a wide range of alternative options to a
high speed rail network to-date These include assessing the case for
using other modes of transport building a new conventional speed line
and enhancing the existing rail network
42 The latest assessment of alternative options has mainly focussed on
enhancements to the existing rail network since these are most likely to
deliver capacity and journey time improvements comparable to those of
HS2 Given the scale of HS2 few alternative schemes will be able on
their own to deliver an equivalent level of functionality It was therefore
considered more appropriate to examine packages of interventions
43 The alternatives to HS2 have been reviewed and enhanced for the
economic and strategic case documents Packages of infrastructure
works and train service specifications were built up through an iterative
and joint process involving experts from the Department for Transport
Network Railrsquos route teams and technical advisors The benefits and
costs of these schemes have been modelled and are presented below
44 This chapter briefly describes the different packages of alternatives the
extent to which they have the potential to improve capacity and journey
times as well as outlining the costs and benefits of each It should be
read in conjunction with Chapter 6 of the Strategic Case which assesses
in more detail how well the alternatives meet the objectives of HS2
which are
To provide sufficient capacity to meet long term demand and to
improve resilience and reliability across the network
To improve connectivity by delivering better journey times and
making travel easier
It is deemed that any solution must
Minimise disruption to the existing network
Use proven technology that we know can deliver the required
results
Be affordable and represent good value to the taxpayer
Minimise impacts on local communities and the environment
29
45 Further technical detail on the packages and their assessment can be
found in a report published by the Departmentrsquos technical advisors
Atkins 33 Despite the alternatives being at an earlier stage of
development than HS2 they have been assessed using consistent
methods and assumptions wherever appropriate
Summary of previous work
46 Previous reports have considered numerous different packages of rail
interventions as alternatives to both HS2 Phase 1 and the Y network34
These range from a capital cost of pound3 to pound23 billion (2009 prices and
values) including enhancements such as lengthening trains providing
increased lines of track in busy areas and electrifying some stretches of
train line
47 The January 2012 update of these reports 35 reassessed the three
conventional rail alternatives to HS2 which were thought to have the
strongest business cases An alternative proposal put forward by the
51M group of local authorities which built on the Departmentrsquos previous
work was also analysed Whilst all of these packages represented
medium to very high value for money it was considered that they did not
deliver benefits on the same scale as HS2
Rationale for further work on the Strategic Alternatives
48 To inform the economic and strategic cases for HS2 it is necessary to
review packages of alternative investments in the classic rail network
The analysis underpinning HS2 has progressed significantly since the
January 2012 update particularly in the design and modelling of Phase
2 making it essential to revisit the alternatives Also since the previous
update some of the proposed infrastructure interventions have been
taken forward by the Department necessitating their removal from the
packages of alternatives
49 The Department took this opportunity to carry out further work on the
Phase 1 alternative changing aspects of the previous package (Rail
Package 2) specifically to provide more capacity on commuter train
services into London In addition alternatives to the HS2 Y network were
significantly redeveloped to include more infrastructure spending with
the aim of better meeting the objectives of HS2 increasing capacity and
33 Atkins (2013) lsquoHS2 Strategic Alternatives Final Report 28 October 2013rsquo httpswwwgovukgovernmentpublicationsrail-alternatives-to-hs2 34 For example Atkins (2011) lsquoHigh Speed 2 Strategic Alternatives Study London to West Midlands Rail Alternatives ndash Update of Economic Appraisalrsquo February 2011 35 Atkins 2012 lsquoHigh Speed Rail Strategic Alternatives Study Update following consultationrsquo January 2012
30
improving journey times to a larger extent than the previously assessed
package (Scenario B) The Y network alternatives were also extended to
deal more explicitly with short distance and cross country flows
410 For the first time it has been decided to consider alternatives to Phase 2
of HS2 where it is assumed in the do minimum that Phase 1 has
already been built The analysis of these options can be compared to the
HS2 Phase 2 outputs presented in Table 6
Scope of new work
411 The packages of alternatives were derived through a series of
workshops with Network Rail These workshops generated Train
Service Specifications (TSS) alongside lists of the additional
infrastructure that would be required to run them forming the proposed
packages of alternatives
412 For each route three packages were produced high medium and
low The high packages had the greatest increases in infrastructure and
rolling stock to support more ambitious TSS whereas the low packages
had more modest requirements to support smaller improvements to the
TSS These packages were necessarily produced without the ability to
model the package outputs and therefore at this stage did not consider
in detail the potential value for money of the schemes Instead they
were based on Network Railrsquos knowledge of current asset conditions on
the routes and their professional judgement that the proposals would be
feasible
413 Following the assembly of these packages tests were performed in an
attempt to maximise the value for money of each As a result of the
modelling adjustments to the necessary infrastructure and TSS were
made with pieces of infrastructure that appeared to offer low value for
money removed In addition some additional infrastructure thought
necessary to run the desired TSS was included The results of this
optimisation process were then used to generate five packages of
infrastructure works and TSSs (described below) that would form the
final sets of alternatives
414 In order to ensure that these alternatives were feasible the five
packages were then sense checked bearing in mind that the level of
design and testing is at a very high level and should any of the
alternatives be taken forward more detailed analysis would need to be
conducted Network Rail considered whether the optimised TSS were
feasible with the levels of infrastructure proposed and suggested
31
changes where necessary The results of this iterative and joint process
are presented below
Short-listed alternatives
415 There are five different alternative packages to HS2 covering three
hypothetical scenarios
Package P1 Alternative to HS2 Phase 1
Packages P2A and P2B Alternatives to HS2 Phase 2 (assuming
Phase 1 has been built) and
Packages YA and YB Alternatives to the HS2 full Y network
(Phases 1 and 2 combined)
416 Package P1 only includes upgrades to the West Coast Main Line
(WCML) In the other four packages a more extensive network is
covered with additions to services and infrastructure on the WCML
East Coast Main Line (ECML) Midland Main Line (MML) and some
Cross Country (XC) services
417 All packages look to implement infrastructure and train service changes
that provide extra capacity where it is needed particularly for
passengers as well as securing journey time savings where possible
Alternative to HS2 Phase 1
418 Package P1 considers alternatives to Phase 1 and took previous
alternative packages RP2 and 51M (an alternative developed by a group
of local authorities) as a starting point before considering the scope for
further refinements with the aim of better meeting the objectives of HS2
The primary deliverable of this alternative is to provide additional
capacity to the West Cost Mainline (WCML) by addressing
Train service frequency on the WCML lsquofastrsquo lines which would be increased to 16 trains per hour (tph) into London Euston
Additional capacity improvements delivered through assuming that
all Pendolino trains would be extended to 11 cars with the
reduction of one First Class carriage to Standard to increase the
number of seats and
Commuter capacity requirements by assuming all commuter
services are extended to 12 cars
32
419 The table below summarises the outcomes of these improvements in
terms of connectivity (measured by journey times) and capacity
(measured in all day seats) and compares them to HS2 It should be
noted that the journey times have not been subject to detailed modelling
or timetabling and so further work could lead to changes in assumed
journey time savings
Table 7 - Journey Times and Additional Capacity for Package P1 against the do-minimum
TRAIN JOURNEY PACKAGE P1 HS2 PHASE 1
Journey times (mins)
Journey time
saving (mins)
Journey times
Journey time
saving (mins)
London ndash Birmingham New Street
73 11 49 35
London ndash Manchester 122 5 100 27
London ndash Liverpool 126 5 106 25
WITHOUT SCHEME
ALL DAY SEATS
PACKAGE P1 ALL DAY SEATS
HS2 PHASE 1 MINIMUM
ALL DAY SEATS
Euston services
128200 216100 238600
Notes This represents the increase in weekday seated capacity arriving into London estimated for 2036 weekday timetable Source Atkins (2013) lsquoHS2 Strategic Alternatives Final Report 28 October 2013rsquo httpswwwgovukgovernmentpublicationsrail-alternatives-to-hs2 Appendix D
420 Package P1 delivers modest journey time improvements to locations on
the WCML The reductions are due to removing stops and some
performance allowances Additional capacity is also provided in this
package on both Long Distance High Speed (LDHS) as well as London
Midland services
421 HS2 however performs better in terms of total seats provided on the
west coast corridor with the opportunity to further reduce crowding on
the key flows from London Euston particularly on inter-city services It
also results in significantly greater improvements in journey times
between London and key conurbations than the packages of alternatives
thus performing better in meeting both the connectivity and capacity
objectives
422 Furthermore HS2 is not subject to the same operational constraints as
upgrades to the existing network The question of the quality of the
33
infrastructure capacity provided is reflected in its resilience and this is
crucially affected by the intensity of use of the railway While HS2
reduces usage of the fast tracks on the West Coast Main Line the P1
alternative intensifies usage This means that under the upgrade options
service reliability is unlikely to be better and may well be worse in
comparison to the situation today
423 The P1 upgrade alternative to Phase 1 entails a lot of disruption to the
existing network Indicative estimates suggest that while HS2 Phase 1
results in 223 weekend closures the Phase 1 alternative leads to 410
weekend closures which is almost double that for HS2
Alternatives to HS2 Phase 2
424 The following two packages are considered as alternatives to HS2
Phase 2 assuming HS2 Phase 1 has already been built and is in the do
minimum
Package P2A HS2 Phase 1 is built interventions on ECML MML
WCML and XC trains to Nottingham are routed via HS2 and
Package P2B HS2 Phase 1 is built interventions on ECML MML
WCML and XC trains to Nottingham are routed via ECML
425 In these packages where HS2 Phase 1 is built there is a reduced level
of investment in the WCML compared to Package P1 restricted to works
north of where HS2 re-joins the classic network In addition to HS2
Phase 1 these packages would deliver
Package P2A
A 9 train per hour timetable for long-distance ECML services with
all rolling stock assumed to be operated by 140mph capable IEP
sets and Leeds and Newcastle both having a 4tph service from
Kings Cross (the former with 2tph extending to Bradford and the
latter with 3tph continuing to Edinburgh)
Retaining a 6 train per hour long-distance service pattern on the
MML
Additional HS2 trains from London to Birmingham and Manchester
with a link enabling services from Euston to Sheffield Derby and
Nottingham
Additional classic line services on the WCML
34
Improvements to commuter services in particular frequency
improvements at the bottom end of the MML and frequency and
journey time improvements to Cambridge and
Additional Cross-Country services through Birmingham including
making use of Curzon Street and a short section of HS2 for
conventional IEP services to the East Midlands and beyond
Package P2B
426 Identical to Package P2A except for
An 11 train per hour timetable for long-distance ECML services and
Additional HS2 trains from London to Birmingham and Manchester
with a link enabling services from Euston to Sheffield and Derby but
not Nottingham
427 The journey time savings and additional capacity in these packages are
summarised in the table below
Table 8 Journey Times and Journey Time Savings for Package P2A Package P2B and HS2 Phase 2
TRAIN JOURNEY PACKAGE P2A PACKAGE P2B HS2 PHASE 2
Journey times (mins)
Journey time
savings (mins)
Journey times (mins)
Journey time
savings (mins)
Journey times (mins)
Journey time
savings (mins)
London ndash Nottingham 67 26 70 23 511 42
London ndash Leeds 96 30 96 30 82 44
London ndash Newcastle 141 14 141 14 138 17
London ndash Edinburgh 220 25 220 25 222 23
Birmingham ndash Nottingham 27 45 27 45 191 53
Birmingham ndash Leeds 73 49 73 49 55 67
Birmingham ndash Newcastle 129 70 129 70 127 72 1Journey time is to Toton Interchange station
Table 9 Additional Capacity for Package P2A Package P2B and HS2 Phase 1+ 2
TRAIN LINE WITHOUT SCHEME
ALL DAY SEATS
P2A ALL DAY SEATS
P2B ALL DAY SEATS
HS2 PHASE 1 + 2 MINMUM ALL DAY SEATS
Total 544500 611700 608100 652600
Notes The lsquowithout schemersquo comparator in this case includes HS2 Phase 1 Source Atkins (2013) lsquoHS2 Strategic Alternatives Final Report 28 October 2013rsquo httpswwwgovukgovernmentpublicationsrail-alternatives-to-hs2 Appendix D
35
428 Journey times are roughly the same to all destinations in both Packages
P2A and P2B The fact that HS2 Phase 1 is built in these packages
removes any journey time savings on the WCML
429 The greater quantity of trains running across the network increases
seated capacity particularly on long distance services This is expected
to result in corresponding reductions in crowding on most train services
despite significant increases in demand from the improved journey times
Capacity is also increased on HS2 in Package P2A as more trains use
Phase 1 as a quicker way to get to Nottingham
430 HS2 performs better in terms of total seats particularly on long distance
inter-city services It also results in significantly greater improvements in
journey times between London and key conurbations than the packages
of alternatives
431 As with the Phase 1 alternatives the quality and resilience of the rail
network is likely to be worse under the alternatives than for HS2 while
the levels of disruption during construction are significantly higher
Indicative estimates suggest that while HS2 Phase 2 by itself results in
163 weekend closures the Phase 2 alternatives lead to between 2380
and 2430 weekend closures which is more than ten times that for HS2
Alternatives to the Y Network
432 The Y network alternatives have been significantly redeveloped for this
update to the economic case to improve the extent to which they meet
the objectives of HS2 The alternatives address short-comings across
the West Coast Midland and East Coast Mainline and aspects of the
Cross Country Routes
433 The following two packages are considered as alternatives to the Y
network
Package YA No HS2 Phase 1 ECML high level of intervention
MML medium level of intervention other interventions on WCML
and XC and
Package YB No HS2 Phase 1 ECML medium level of intervention
MML high level of intervention other interventions on WCML and
XC
434 Packages YA and YB differ mainly in the level of investment in the
ECML versus the MML In package YA there is a greater level of
36
investment in the ECML and lower level on the MML while in package
YB the situation is reversed In addition to the Phase 1 alternative these
packages would deliver
Package YA
An 11 train per hour timetable for long-distance ECML services
with all rolling stock assumed to be operated by 140mph capable
IEP sets and with Nottingham and Sheffield served from Kings
Cross and Leeds and Newcastle both having a 4tph service from
Kings Cross (the former with 2tph extending to Bradford and the
latter with 3tph continuing to Edinburgh)
Retaining a 6 train per hour long-distance service pattern on the
MML
Improvements on the WCML as per alternative Package P1
Significant journey time and frequency improvements from
Birmingham to Derby Nottingham Sheffield Leeds York and
Newcastle and
Enhancements to commuter services
Package YB
435 Identical to Package YA except for
A 10 train per hour timetable for long-distance ECML services and
An 8 train per hour long-distance service pattern on the MML
436 The journey time savings and additional capacity obtained from these
packages are summarised in the table below
37
Table 10 Journey Times and Journey Time Savings for Package YA Package YB and HS2 Phase 2
TRAIN JOURNEY
PACKAGE YA PACKAGE YB HS2 Y NETWORK
Journey times (mins)
Journey time
savings
Journey times (mins)
Journey time
savings
Journey times (mins)
Journey time
savings
London ndash Birmingham
73 11 73 11 45 39
London ndash Manchester
122 5 122 5 68 59
London ndash Nottingham
70 23 73 20 511 42
London ndash Leeds
96 30 99 27 82 44
London - York 94 10 97 7 81 23
London ndash Newcastle
141 14 144 11 138 17
London ndash Edinburgh
220 25 223 22 222 23
Birmingham ndash Leeds
78 44 84 38 55 67
1Journey time is to Toton Interchange Station
Table 11 Additional Capacity for Package YA Package YB and HS2 Y-Network
WITHOUT SCHEME
ALL DAY SEATS
PACKAGE YA ALL DAY
SEATS
PACKAGE YB ALL DAY
SEATS
HS2 Y-
NETWORK
Total 434100 578800 569900 652600
Source Atkins (2013) lsquoHS2 Strategic Alternatives Final Report 28 October 2013rsquo httpswwwgovukgovernmentpublicationsrail-alternatives-to-hs2 Appendix D
437 In Packages YA and YB WCML destinations generally see journey time
savings of 5-10 minutes with destinations on the northern end of the
ECML observing journey time savings of 20-30 minutes Journey times
to ECML destinations as well as Nottingham are most improved in
Package YA some journey times to locations in the East Midlands are
lower in Package YB but others are higher (eg Derby and Leicester)
438 The difference in infrastructure enhancements across the two packages
can clearly be seen in the additional seated capacity Overall Package
YA delivers the bigger increase in capacity which subsequently result in
reductions in expected load factors except on London Midland services
439 HS2 however performs better against the connectivity and capacity
objectives It results in greater increases in the number of total seats
especially on long distance inter-city services which is unsurprising
given the cities which HS2 serves directly The same is true of journey
times with HS2 leading to higher journey time savings particularly
38
between London and the key cities For destinations not directly served
by HS2 the journey time improvements are smaller however in many
cases they are still higher than for the alternatives
440 The quality and resilience of the rail network will suffer significantly more
under the alternatives than under HS2 due to greater strain being placed
on the existing rail network while the levels of disruption caused are
significantly higher Indicative estimates suggest that while HS2 Phase 2
by itself results in 386 weekend closures the Y network alternatives lead
to between 2770 and 2790 weekend closures which is significantly
higher than that for HS2
Summary of Benefits
441 Breakdowns of the present value benefits (PVB) from the five tested
packages are presented in the table below
Table 12 Net Present Benefits of the Alternatives
poundbn (2011 PV)
HS2 PHASE 1 ALTERNATIVE
HS2 PHASE 2 ALTERNATIVES
HS2 Y NETWORK ALTERNATIVES
Benefit Package P1 Package P2A
Package P2B
Package YA
Package YB
In Vehicle Time
27 121 120 143 122
Access Walk
01 02 00 -01 -01
Wait 24 29 31 62 64
Interchange -04 08 06 -06 -05
Crowding 28 26 26 60 57
Car User Benefits
03 07 07 10 08
Loss of indirect tax
-05 -12 -12 -17 -16
Present Value Benefits
74 181 180 253 231
No reliability benefits are being claimed as part of journey time benefits
Benefits of Alternative to HS2 Phase 1
442 The benefits delivered by Package P1 are split almost equally between
journey time savings crowding benefits and reductions in waiting times
Despite the package including additional pieces of infrastructure it
delivers slightly less passenger benefits than a previous package termed
RP2 which was considered as an alternative in January 2012
39
Benefits of Alternatives to HS2 Phase 2
443 Packages P2A and P2B deliver roughly the same journey time benefits
(around pound12bn) but there are differences in the locations that these
benefits accrue to across the two packages The greater quantum of
trains running across the network has significant wait time and crowding
benefits in both packages and there are some interchange benefits
Benefits of Alternatives to the HS2 Y Network
444 Packages YA and YB deliver journey time benefits within the same order
of magnitude (pound12-14bn) but again there are differences in the locations
these benefits accrue to with YA further benefiting ECML destinations
Nottingham and Sheffield whereas YB generates more benefits for
other MML destinations There are significant wait time and crowding
benefits in both packages as well as slight interchange disbenefits
Summary of Costs
445 Each package of alternatives to HS2 has an estimated cost made up of
a capital cost covering the infrastructure and rolling stock (trains) and an
operating cost of running and maintaining the rolling stock and railway
446 Estimates of the construction cost of the packages were developed by
Network Rail in collaboration with industry experts The costs were
estimated using a series of high level unit rates representing the early
stage of development these schemes are in
447 The construction cost of each scheme includes allowances for scheme
design contractor preliminaries and project management loss of
revenue from disruption to the rail network and land costs To reflect the
relatively low level of design and development of these costs optimism
bias has been included at a rate of 66 as advised by the Departments
WebTAG guidance for projects at this stage of development
448 The additional rolling stock required for each of these schemes can be
purchased and treated as capital costs or leased to form a component
of the operating costs In order to provide the greatest consistency with
HS2 rolling stock is assumed to be purchased in all packages However
a sensitivity test has been conducted where rolling stock is leased as
this is the standard approach for UK railways This increases the total
40
cost of the schemes by roughly 10-20 overall Further sensitivity tests
can be seen in the Atkins report36
449 Operating costs have been estimated for each scheme The Department
has reviewed the level of optimism bias applied to classic line operating
costs In carrying out this review the aim has been to better reflect the
quality of the evidence on which they are based As a result differing
levels of optimism bias are applied to different elements of operating
costs ranging from 16 to 30 The overall level of optimism bias is
lower than for high speed trains reflecting the better relative
understanding of aspects of conventional rolling stock in the UK
450 There are two main cost items which have not been included for the
strategic alternatives packages but are included in HS2rsquos costs
infrastructure maintenance and station costs However these omissions
are expected to be small in relation to the overall package cost
Table 13 Cost of the Alternatives
poundbn (2011 PV) HS2 PHASE 1 ALTERNATIVE
HS2 PHASE 2 ALTERNATIVES
HS2 Y NETWORK ALTERNATIVES
Cost Package P1 Package P2A
Package P2B
Package YA
Package YB
Construction Costs 19 102 105 123 107
Rolling Stock Purchase Costs
14 19 18 27 27
Operating Costs 62 89 83 117 113
Total Cost 95 210 206 267 247
451 Operating costs make up two thirds of the total cost of Package P1 this
is unsurprising given the greater frequency of train services and
lengthened trains included in the package The total costs are not
directly comparable with the latest estimate of RP2 since rolling stock
was assumed to be leased not purchased as is shown above
452 In the remaining four packages costs are split almost equally between
construction and operation This corresponds to a higher number of
schemes included in these packages as well as some larger
infrastructure enhancements The scheme with the highest cost is
Package YA This is in part driven by an extensive package of upgrades
on the ECML
36 Atkins (2013) lsquoHS2 Strategic Alternatives Final Report 28 October 2013rsquo httpswwwgovukgovernmentpublicationsrail-alternatives-to-hs2
41
Benefit Cost Ratio
453 The table below brings together the costs and benefits of the five
packages and presents their benefit cost ratios
Table 14 Costs and Benefits of Alternatives and resulting initial BCR
poundbn (2011 PV) HS2 PHASE 1 ALTERNATIV
E
HS2 PHASE 2 ALTERNATIVES
HS2 Y NETWORK ALTERNATIVES
Package P1 Package P2A
Package P2B
Package YA
Package YB
Net Transport Benefits (PVB) (poundbn)
74 181 180 253 231
Total Cost (poundbn) 95 210 206 267 247
Revenue (poundbn) 53 120 121 169 161
Net Costs to Government (PVC) (poundbn)
43 90 85 98 86
Benefit Cost Ratio 17 20 21 26 27
Wider Economic Impacts (poundbn)
11 41 40 54 51
Benefit Cost Ratio with WEIs
20 25 26 31 33
454 All of the packages have a benefit cost ratio (including WEIs) higher than
2 The Phase 1 alternative is categorised as providing medium value for
money whilst all other packages provide high value for money 37
Packages YA and YB both have benefit cost ratios greater than 3 when
including WEIs
455 Package P1 has a lower benefit cost ratio than RP2 (401 when
assessed in January 2012) This has been driven by changes to both
the estimated costs and benefits On the cost side a more robust
approach to estimating rolling-stock capital costs and additional service
provision in Package P1 have increased the costs The updated
modelling framework (PfM v43) suggests less mode shift results from
the intervention leading to lower estimates of transport user benefits
and revenue generation
456 There are only minor differences between the benefit cost ratios of
Packages P2A and P2B as well as Packages YA and YB However it is
important to point out that there are differences in the locations that
these benefits accrue to across the packages Other considerations
such as deliverability could differ between YA and YB
37 BCR for Package 1 is 199 so is formally classified as offering medium value for money
42
Sensitivities
457 Estimating the future costs of infrastructure schemes rolling stock and
operations is challenging It is important to acknowledge uncertainty
around what might happen in the future and to understand the impact
this could have on the results of the appraisal Nevertheless the earlier
stage of development of the alternative options justifies a less detailed
approach to considering uncertainty than that of HS2 Focus is therefore
on the key sensitivities likely to influence the results and justifications for
those which have been conducted are provided below
458 The following four sensitivities have been carried out to investigate the
robustness of the value for money conclusions
Sensitivity 1 ndash rolling stock is assumed to be leased
Rolling stock was assumed to be purchased in the appraisal to be
consistent with HS2 allowing the benefits costs and BCRs to be
compared However were these schemes to be implemented it is
highly likely that additional rolling stock would be leased not
purchased We therefore need to understand the implications this
would have on the value for money
Sensitivity 2 ndash a 25 increase in the schemes capital costs
The infrastructure schemes which make up the packages of
alternatives are at a very early stage of development It is therefore
possible that once further design and development work is carried
out the cost of these schemes could increase This sensitivity is
intended to assess whether the packages of alternatives still
represent value for money in this scenario
Sensitivity 3 ndash higher rates of optimism bias equal to those applied
to high speed trains are applied to operating costs38
To assess whether the alternatives represent value for money if
there is more uncertainty surrounding operating costs than is
currently applied
Sensitivity 4 ndash combines sensitivities 2 and 3 above
459 The table below shows the central case BCRs and how these change in
each of the sensitivity tests
38 The exact rates and a comparison to those used in the central case can be found in the
Atkins report
43
Table 15 Benefit Cost Ratios for Sensitivity Tests
HS2 PHASE 1 ALTERNATIVE
HS2 PHASE 2 ALTERNATIVES
HS2 Y NETWORK ALTERNATIVES
Package P1 Package P2A
Package P2B
Package YA
Package YB
Central Case 17 20 21 26 27
Sensitivity 1 12 16 16 18 19
Sensitivity 2 16 16 16 20 20
Sensitivity 3 15 19 19 23 23
Sensitivity 4 14 15 15 18 18
460 In all of the sensitivity tests the benefit cost ratios remain above 1 that is
the benefits of the schemes remain higher than the costs
461 In sensitivity 1 where rolling stock is assumed to be leased both YA and
YB are categorised as medium rather than high value for money The
BCRs of the remaining packages are also lower than in the central case
Sensitivities 2 and 3 result in small changes to the BCRs of all packages
but these do not change the value for money conclusions It is only when
higher than expected capital costs are combined with a higher
uncertainty around operating costs that there are significant implications
for the value for money of the schemes
Conclusion
462 The alternatives to HS2 offer means of providing more capacity on the
rail network while also generating high value for money particularly the
Y-Network alternatives which generate BCRs above 30 While there are
alternatives to HS2 worth considering they are not as effective at
meeting the objectives of the scheme and are likely to be particularly
disruptive The analysis indicates they are likely to
Be unable to provide as much extra capacity for passengers
Lead to significant levels of disruption to passengers during
construction
Are likely to worsen resilience or performance reliability and
Be unable to offer the same level of journey time savings as HS2
463 HS2 in contrast is likely to result in a substantial improvement in the
resilience and performance reliability of the network by relieving the
pressure on the WCML of the fastest intercity services It will result in
substantially larger journey time savings on key inter-city routes while
minimising the level of disruption to rail users during construction and
providing a greater uplift in capacity than the alternatives
44
5 HS2 ndash robustness of Economic Case
Introduction
51 The reference case specifies the costs and benefits of HS2 assuming
one particular future state of the world This state of the world contains
assumptions about external factors such as GDP population energy
costs and the relationship between these variables and levels of rail
patronage decades into the future as well as variables currently within
our control such as scheme costs and train timetabling
52 The lsquoreference casersquo is based on the standard assumptions and
approaches specified in WebTAG guidance which provides advice on
best practice for conducting analysis of the impacts of transport
infrastructure investment The guidance has been developed over many
years and has benefited greatly from the UKrsquos long tradition of applying
cost benefit analysis to transport infrastructure investment proposals
Nevertheless the lsquoreference casersquo presents one potential outcome from
many possibilities
53 Forecasting such a long way into the future is inherently challenging it is
particularly important to understand the uncertainty attached to those
factors which will have the greatest impact on the appraisal In the case
of HS2 as with many transport investments this means understanding
in particular the impact of a range of different assumptions about
economic growth growth in demand for rail travel construction costs
and the valuation of time savings
54 An assessment of the resilience of the economic case to a range of
different assumptions associated with these factors has been conducted
using the standard assumptions underpinning the lsquoreference casersquo
outlined in Table 6 as the starting point This analysis captures the
range of benefit cost ratios that could result from combinations of
different assumptions and is based on an understanding of the
probability of different events occurring While it cannot capture all
possible outcomes because there are some events which cannot be
described in terms of probabilities in this way it does provide a
systematic way of assessing the range of different outcomes that could
occur
55 The analysis focuses on the key variables which influence the Economic
Case for HS2 identified as having the largest potential impact and those
45
which are subject to the greatest levels of uncertainty The variables
which meet this criteria are
Future GDP
Values of Time
Approach to capping demand39
Competition and regulation on HS2
Capital Costs
Responsiveness of Rail Demand to changes in GDP and the cost of
rail travel
Reliability benefits
Future cost of travelling by alternative modes of transport
Rail Fares
56 Analysing the uncertainty within each of these variables requires
different approaches This may be because certain techniques are more
suitable for some variables than others or because the information does
not exist to adopt certain methods in particular cases
57 The techniques for assessing risk and uncertainty can be distinguished
into two main approaches Risk analysis allows us to quantify the
combined impact of a number of different risks at the same time giving
us the probability of different overall outcomes Sensitivity tests are used
to obtain an appreciation of the likely impact of individual events
compared to the reference case and are particularly useful for binary
events or variables about which we have limited information on the likely
distribution of outcomes
Risk Analysis
58 Risk analysis lends itself towards variables which can take a range of
different values and for which the possible values can each be judged to
have a specific probability of occurring For example future GDP growth
can take a range of values and statistical techniques can be used to
identify the expected probability of different values occurring based on
historic information and the past performance of the forecasting tools
39 The HS2 reference case assumes that there is no demand growth beyond 2036 demand
is essentially capped in this year
46
used Uncertainty around the precise values for important parameters
such as the impact of GDP on travel demand has also been reflected
59 The key factors considered within the risk analysis are40
Short-term GDP growth (2012-2017)
Long-term GDP growth (2017 onwards)
The responsiveness of rail demand to changes in GDP
The responsiveness of rail demand to changes in the cost of rail
travel
Construction costs
The non-work value of time41
510 The chart below presents the results of the risk analysis for the appraisal
of the Y-Network The distribution of outcomes has been mapped
against the Departmentrsquos value-for-money categories enabling
comparison against other schemes It clearly indicates that taking
account of the sources of uncertainty which have been represented here
(as listed above) there is very little chance of the Benefit Cost ratio
falling below 15 with the expected outcome being a BCR between 20
and 25 In other words even in an unlikely scenario where construction
costs are at their upper limit and long-term GDP growth is the low end
of the range the BCR remains above unity
511 The BCR is most sensitive to the GDP growth rate forecast The more
optimistic the economic outlook is the greater probability of a larger
BCR The BCR is resilient to even extremely low forecast rates of long-
term GDP growth of between 125 and 200 per annum in the
majority of cases where GDP growth is between 125 and 200 per
annum the BCR remains greater than 175
40 Further details of the risk analysis undertaken here can be found at httpwwwhs2orguknews-resourceseconomic-documents 41 Testing the resilience of the Economic Case to different assumptions regarding the Business Value of Time is considered elsewhere
47
Figure 7 ndash Y-Network distribution of Benefit-Cost Ratios
512 This analysis has also been applied to Phase 1 of the scheme
separately as shown in the diagram below While the distribution of
potential outcomes has shifted somewhat to the left (reflecting the lower
reference case BCR) this aspect of the scheme is still robust to a wide
range of outcomes In more than 75 of cases the BCR of Phase 1
represents medium value for money or better
Figure 8 ndash Phase 1 distribution of Benefit-Cost Ratios
48
Extensions to standard assessment
513 HS2 is unlike most other transport schemes It is a project with high up-
front capital investment producing benefits over a very long life-span
There are therefore certain standardised assumptions used in the
standard economic assessment that have a substantial impact on the
BCR for which alternative and potentially reasonable approaches exist
514 To understand this further specific tests were undertaken on the impact
of different assumptions most notably levels of demand forecasts
construction costs and different valuations of time savings This shows
how alternate but reasonable assumptions which have been tailored to
the unique characteristics of high speed rail could alter the results
Business Value of Time
515 Business Travel Time Savings contribute a significant proportion of the
transport user benefits of the scheme As noted previously the values
used to estimate the benefits to business travellers from travel time
savings have been altered in this appraisal to reflect more recent data
on the incomes of business passengers
516 The valuation of travel time savings should reflect peoplersquos willingness-
to-pay for quicker journeys Over the last year the Department has
undertaken a comprehensive review of different approaches for deriving
this willingness-to-pay for business travellers This has included
updating the values in WebTAG with the most recent available data and
comparing those updated values with the existing evidence base of
values from alternative approaches42
517 The comparison of values resulting from different approaches is shown
in the chart below While the assumptions and methods vary between
approaches they are all aiming to estimate the same thing what
businesses would be willing to pay for travel time savings The wide
range in the values presented in the chart both within and between
approaches demonstrates the variability and uncertainty around what
businesses would be willing to pay for travel time savings However the
updated values given in WebTAG of around pound32hour for rail travel are
firmly towards the centre of this range and therefore the Department
has concluded that these values are a suitable representation of
businessesrsquo willingness-to-pay
42 httpswwwgovukgovernmentpublicationsvalues-of-travel-time-savings-for-business-travellers
49
Figure 9 ndash Business values of time implied by different methodologies
518 However when considering values of time for high speed rail schemes
the study concluded that lsquothe evidence does seem to support a business
valuation in excess of the wage ratersquo While there may be good reason
to believe that the Business Value of Time applied to high speed rail
should be higher than that specified in WebTAG we have tested the
robustness of the Economic Case to values both higher and lower than
those in the lsquoreference casersquo
519 To create a lsquohigh value of timersquo scenario the WebTAG 2013 standard
business value of time for rail users has been increased by 4043 This
is consistent with the conclusion in the ITS Leeds (2013) report which
suggests that across their sample of High Speed rail specific studies the
value of time was on average 50 higher than the wage rate while for
UK specific studies this figure was 40
520 There are a relatively limited number of High Speed rail specific studies
so a low business value of time scenario is also considered which takes
account of the wider evidence for the willingness to pay for travel time
savings across all rail travel It therefore assumes that high speed rail
passengers have similar values of time to other rail passengers a
conclusion currently at odds with the existing evidence as noted above
and therefore conservative Evidence presented in the ITS Leeds (2013)
43 Note this is actually lower than the 25 increase on the WebTAG 2012 values proposed
by the study The non-work values have also been varied according to time savings by trip length (as the standard value is averaged across trip length)
50
study suggests applying a figure 20 lower than the WebTAG 2013
values of time
521 The charts below indicate the robustness of the Economic Case for the
Y-Network to the two alternative values of time considered The
Economic Case appears robust to the low scenario with the BCR above
one in all cases considered If the high value of time was adopted then
the BCR is most likely to lie above 3 for the full network
Figure 10 Y-Network distribution of Benefit-Cost Ratios across alternative Business Values of Time
0
5
10
15
20
25
30
35
40
Like
liho
od
Full network - BCR with WEIs (ratio) 2011 PricesPV
Higher willingness to pay for long journeys
Poor VfM
Low VfM
Medium VfM
High Value for Money
0of sample
0of sample
06of sample
951of sample
Very high VfM
43of sample
0
5
10
15
20
25
30
35
40
Like
liho
od
Full network - BCR with WEIs (ratio) 2011 PricesPV
Low Value of Time Scenario
Poor VfM
Low VfM
Medium VfM
High Value for Money
0of sample
33of sample
504of sample
464of sample
Very high VfM
0of sample
ndash
51
Demand Cap
522 The Demand Cap is an important albeit arbitrary assumption that has a
significant influence on the benefits of HS2 Essentially demand is
capped in this appraisal at a specific level which occurs in 2036 in the
reference case Beyond 2036 it is assumed that demand for rail travel
whether High Speed or otherwise is constant and fares no longer grow
at a rate above inflation This represents growth of just 47 in long
distance rail trip rates per person compared to todayrsquos levels
523 Rail demand has in fact grown very strongly over the last 20 years and
even during the recession it has shown little sign of slowing In the
decade from 2002 to 2012 the annual growth in long distance rail travel
was 52 The diagram below compares the forecast of long distance
rail demand used in this appraisal against a continuation of recent trends
in long distance demand clearly indicating that relative to recent trends
our forecasts are conservative particularly when also applying a cap on
demand in 2036
Figure 11 ndash Long distance rail demand forecasts
52
524 Subsequent to the last iteration of the HS2 Economic Case the
Department has conducted an external research project into the
specification of a demand cap for rail projects titled lsquoSpecifying the
Demand Cap for Railrsquo44 This project emphasised the need for a demand
cap to reflect the inherent uncertainty in rail demand forecasting as well
as to allow consistency across the appraisal of interventions However it
uncovered no empirical evidence which could help in determining an
appropriate demand cap specification
0
10
20
30
40
50
60
Like
liho
od
Full network - BCR with WEIs (ratio) 2011 PricesPV
Demand growth stops at 2040
Poor VfM
Low VfM
Medium VfM
High VfM
0of sample
02of sample
37of sample
952of sample
Very high VfM
1of sample
525 To reflect the nature of the demand cap which is being implemented its
apparent conservatism particularly when accounting for recent trends in
rail demand and to recognise the range of alternative approaches that
exist the Economic Case for HS2 has been tested against alternative
options for specifying the demand cap
526 HS2 Ltd has replicated its risk analysis assuming different levels of
demand cap45 which indicates that the downside risk from reducing the
demand cap is smaller than the potential for upside gain if the demand
cap were increased (see figure 12 below) This distribution is to be
expected since events occurring closer in time are more certain and
therefore have lower levels of uncertainty attached to them than events
further into the future
Figure 12 - Y-Network distribution of Benefit-Cost Ratios across different Demand Cap assumptions
44 Bates Worsley Wardman Nash amp Preston 2013 Specifying the Demand Cap for Rail httpswwwgovukgovernmentuploadssystemuploadsattachment_datafile251609specifyi ng-the-demand-cap-for-railpdf 45 The risk analysis assumes that the fares cap which ordinarily is applied at the same year as the demand cap is fixed at 2036
53
0
10
20
30
40
50
60
Like
liho
od
Full network - BCR with WEIs (ratio) 2011 PricesPV
Demand growth stops at 2027
Poor VfM
Low VfM
Medium VfM
High VfM
02of sample
666of sample
329of sample
04of sample
Very high VfM
0of sample
527 These results however should be treated with caution If demand
continued to grow further into the future then higher crowding would
result both in the without scheme scenario against which HS2 and the
Strategic Alternatives are compared and the scenario which includes
HS2 One would expect that changes to capacity would be considered
and that both infrastructure provision and subsequently benefits and
costs would change accordingly Accounting for this in the analysis
could alter the BCR both positively or negatively although it is unclear to
what extent
Construction Costs
528 Section 3 described a range of cost estimates for the construction of
HS2 These range from the HS2 Ltd target price at the lower end up to
the entire provision for funding agreed with HM Treasury
529 The costs used in the reference scenario follow Green Book guidance
and include an expected or average level of contingency allowances
Because of their influence over the benefit cost ratio we have also
examined what happens if construction costs are adjusted both upwards
and downwards
530 We have considered the distribution of cost outcomes alongside other
elements within the risk analysis The impact upon the central BCR for
phase 1 is indicated in table 16 below
54
Table 16 ndash Impact on Phase 1 BCR of differing QRA rates
APPROACH QRA TARGET
PRICE
QRA lsquoP50rsquo QRA lsquoP95rsquo
contingency 10 24 37
Contingency poundbn (2011
PV)
16 37 575
BCR without WEIs 16 14 13
BCR with WEIs 19 17 15
Source DfT calculations using HS2 Ltd appraisal outputs Numbers may not add due to rounding Monetary values are expressed in poundbn (2011 prices)
531 In addition to these central case estimates figure 13 below indicates the
distribution of benefit cost ratios for phase 1 according to the level of
construction costs It indicates that there are significant opportunities to
improve the value for money of HS2 through engineering efficiencies
and robust cost controls At the same time it should be noted that if
unexpected events lead to costs reaching the agreed funding provision
alongside a number of other downside risks materialising the benefit
cost ratio would remain above one
55
Figure 13 ndash Distribution of Phase 1 BCRrsquos for differing construction cost
Low6
Low21
Low46
Medium61
Medium71
Medium51
High33
High8 High
2
0
10
20
30
40
50
60
70
80
90
100
Target price P50 P95
Like
liho
od
Construction cost
Phase 1 - Likelihood of Value for Money
Poor
Low
Medium
High
Very high
Value for Moneycategory
Construction cost scenarios
estimates
532 The equivalent estimates for the entire network are provided in figure 14
below This represents a worst-case scenario where both phase 1 and
phase 2 cost estimates reach their upper bound ie pound214bn (2011
prices) for phase 1 and pound212bn (2011 prices) for phase 2 In this
scenario the BCR of the Y-network would fall by approximately 03 to
around 20 (including wider economic impacts)
56
Figure 14 - Distribution of Y-Network BCRrsquos for differing construction cost estimates
Low1
Low2
Medium19
Medium45
High81
High53
0
10
20
30
40
50
60
70
80
90
100
P50 P95
Like
lihoo
d
Construction cost
Full network - Likelihood of Value for Money
Poor
Low
Medium
High
Very high
Value for Moneycategory
Construction Cost Scenarios
Sensitivity tests
533 In addition to examining the Demand Cap and Business Value of Time
specific sensitivity tests have been employed to assess the robustness
of the Economic Case in certain cases where risk analysis is
inappropriate The most relevant tests applied are those testing the
impact of different assumptions regarding the cost of other modes rail
fares and the quantification of reliability benefits
Cost of other modes
534 One would expect the cost of alternative modes to alter the
attractiveness of travel by rail and therefore HS2 If the costs of road or
air travel fall they become relatively more attractive modes and one
would expect travellers to transfer from rail to road or air travel HS2 Ltd
have tested the sensitivity of rail demand to both higher and lower
energy costs46 with higher energy costs the cost of fuel rises and
therefore the cost of road and air travel also increases
535 These tests have shown that the sensitivity of the BCR for HS2 to
changes in energy costs is marginal with the transport user benefits
only increasing by approximately 1 under the high energy cost
scenario and falling by just less than 1 in the low energy cost scenario
46 These are based on the energy cost scenarios generated by DECC details of which can be found here httpswwwgovukgovernmentorganisationsdepartment-of-energy-climate-changeseriesenergy-and-emissions-projections
57
Fares
536 Fares tests are difficult to interpret due to the fact that the demand cap is
set at a particular level of demand and fares are also capped at this
point Increasing fares reduces demand but since ultimately the same
level of demand is reached the longer period of higher real revenue
growth outweighs the demand impact In the case of Phase 1 increasing
real fares by RPI+2 per annum from 2020 until the demand cap is
reached (rather than RPI+1 as used in the reference case) increases
the BCR (excluding Wider Economic Impacts) to 19 from 14 previously
while for Phase 2 this BCR increases to 29 from 18 previously
537 When the level of fare increases is reduced (to RPI + 0 from 2020 until
the demand cap is reached after which point fares rise at a rate
equivalent to the GDP deflator) the effect is the opposite with the
reduction in revenue significantly outweighing any impact on transport
user benefits and therefore the BCR falls For Phase 1 the BCR
(excluding Wider Economic Impacts) is now 13 compared to 14
previously and for the Y-network it falls from 18 to 16
Reliability
538 Benefits resulting from improvements in reliability are calculated on the
basis of the expected reduction in the average minutes of lateness which
are then converted into journey time savings in an approach consistent
with the Passenger Demand Forecasting Handbook This improvement
in reliability also translates into an increase in the demand for the High
Speed services
539 While it is likely that HS2 will deliver significant improvements to
reliability and the assumed forecast delay on HS2 services is consistent
with international precedent until services operate the level of reliability
benefits is somewhat uncertain Removing reliability benefits from the
appraisal reduces the BCR (without Wider Economic Impacts) of Phase
1 to 12 and for the Y-Network it falls to 15 This however represents an
extreme lower bound of the risk in this area as reliability benefits are
expected to exist the uncertainty relates to their likely scale
Threats and Opportunities
Competition and Regulation on HS2
540 The operational characteristics and regulatory environment in which HS2
might operate are as would be expected at this stage in scheme
development undetermined HS2 Ltd has begun to investigate how
different operating environments and responses by train operators may
impact on the Economic Case Initial work has considered how
58
competition between HS2 operators and those on existing networks
might influence pricing decisions under the current fare regime
541 The analysis indicates that conventional rail operators may have the
incentive to reduce fares to capture market share from HS2 thus
potentially limiting the scope for HS2 to set higher fares Whilst
reductions in fares on conventional rail will reduce the revenue on HS2
this will be broadly off-set by an increase in revenue on the existing rail
network The full implications on value for money are uncertain as the
models do not attempt to estimate passenger benefits However the
revenue impacts do not suggest anything which would alter the value for
money conclusions
542 It is important to note that this work is in its early stages and subject to
significant further analysis
Impact of HS2 on Economic Geography
543 The standard approach to estimating impacts of transport schemes as
adopted throughout this Economic Case seeks to capture the impacts
on business as well as wider society This includes amongst other
things the benefits to business travellers from faster journeys and
reduced crowding as well as the value of increased production and the
benefits to company efficiency from being closer together The economic
appraisal calculates net national impact and cannot be used to analyse
sub-national impacts
544 With advice from an independent panel of experts HS2 Ltd has
undertaken a programme of work to help us understand the scale of the
potential economic benefits of HS2 and how they might be spread
across the country47 This work complements the standard assessment
of economic impacts described
545 This work looks at the potential benefits of HS2 in a different way to this
Economic Case by examining how improvements in connectivity would
increase competitiveness of areas outside of London and change the
future pattern of growth The results from this new analysis suggest that
HS2 could increase economic output by between pound8bn and pound15bn per
year48 and that whilst all regions benefit the city regions in the Midlands
and the North do particularly well
546 This is the first attempt to measure economic impact in terms of
productivity and location effects and results should be considered
47httpassetshs2orguksitesdefaultfilesinsertsHigh20Speed20Rail2C20Transport 20Investment20and20Economic20Impactpdf
48 Results are modelled for 2037 and reported in 2013 prices
59
provisional HS2 Ltd will continue to refine this work and further develop
the evidence in this area but this study represents a significant
development and should be seen as a complement to (not a substitute
for) the scheme appraisal presented in this Economic Case Given
fundamental differences in approaches results are not directly
comparable and are in no way additive but this work suggests that
there may be important economic benefits not captured within the
current appraisal of HS2 These are particularly relevant and have the
potential to be significant in the case of a transformational scheme such
as HS2
Existing Rail Network
547 Assumptions about the future of the existing rail network play an
important role in assessing the costs and benefits of HS2 There are two
key areas of relevance
The nature of the classic rail network if HS2 was not constructed
lsquothe without schemersquo scenario ndash this allows comparison between
HS2 and a scenario in which HS2 is not built and
The train service specification (TSS) on the existing network if HS2
is built
548 This appraisal uses a lsquowithout schemersquo scenario based on lsquocommitted schemes only largely those described in the Departmentrsquos 2012 High
Level Output Specification49 While further improvements to the existing
network could be expected throughout the 2020s and 2030s it would be
inappropriate to speculate what these may be particularly as future
investment may complement rather than compete with HS2 The
inclusion of further investment could improve or worsen the case for HS2
depending on the extent to which it is complementary or otherwise
549 As long distance services transfer onto HS2 capacity will be created on
the existing network to introduce different services There are many
options for making best use of this released capacity including extra
commuter and freight trains and other regional and local services that
would otherwise be impossible to run The HS2 economic case relies
upon assumptions about the train service specification (TSS) on the
classic rail network when HS2 opens however this represents one
possible set of assumptions used for business case modelling purposes
There are many other potential combinations of released capacity
49 High Level Output Specification 2012 httpswwwgovukgovernmentpublicationshigh-level-output-specification-2012
60
550 Further work will be undertaken to optimise the use of released capacity
as the project develops in accordance with the set of principles
described in the Strategic Case for HS250 The finalisation of the TSS
will be expected to impact on the value-for-money of the scheme and the
extent of the upside or downward risk is dependent upon how well the
final TSS matches demand for rail services
Calculation of scheme benefits
551 HS2 Ltd has calculated user benefits using the lsquorule of a halfrsquo 51
Depending on the nature of demand it is possible for this assumption to
lead to either an underestimate or an overestimate of the benefits to
passengers This is not unique to HS2 and this uncertainty around the
accuracy of the lsquorule of a halfrsquo approximation exists in all transport
appraisals particularly on projects which offer large journey time savings
It is to be noted however that alternative methods exist which can
generate lower benefits although these are less commonly used poorly
understood and subject to their own uncertainty
Scheme opening date
552 Phase 1 of HS2 is currently scheduled to open during 2026 while Phase
2 of the scheme is scheduled to open in 2033 There remain risks to
these delivery dates which range from passage through a complex
Parliamentary approvals process to the engineering work required being
delivered on time
553 Were the delivery of HS2 to be delayed it would likely increase scheme
costs and could alter scheme benefits and revenues The scale of the
impact on the Economic Case would depend on the nature of the delay
and the implications for the resulting profile of costs revenues and
benefits over time
554 Delay might itself lead to higher costs than would otherwise be the case
Preliminary work suggests that a delay to the Hybrid Bill process (for
example for one year) could result in inefficient delivery due to the
nature of the HS2 Ltd corporate and indirect cost structure which could
result in perhaps pound100m of additional costs above current estimates
50 Department for Transport (2013) lsquoThe Strategic Case for HS2rsquo httpswwwgovukgovernmentpublicationshs2-strategic-case 51 The rule of half estimates the changes to consumer welfare (in this case the welfare of
transport users) resulting from changes in supply assuming a constant demand curve
61
6 Value for Money Assessment
Introduction
61 The Economic Case needs to reach a conclusion on whether the
scheme represents good value for taxpayersrsquo money This requires
comparing HS2 against a ldquowithout schemerdquo reference case in order to
assess the economic social environmental and public account impacts
that a transport intervention may incur The analysis presented in
Sections 3 and 5 allows such conclusions to be drawn and the
Departmentrsquos WebTAG guidance provides a framework for doing so
62 In order to allow comparison across schemes WebTAG specifies value
for money categories within which schemes can be placed and the table
below describes these categories
Table 17 ndash Value for Money Categories
VALUE FOR MONEY CATEGORY
BENEFIT COST RATIO
Poor Less than 10
Low Between 10 and 15
Medium Between 15 and 20
High Between 20 and 40
Very High Greater than 40
63 As previously discussed the long-term forecasting horizon required
when considering a project such as HS2 combined with its inherent
scale and complexity limits the ability of a single lsquoreference casersquo BCR
to generate informative conclusions on the value for money of the
scheme It is appropriate therefore to consider how robust the Economic
Case for HS2 remains across a range of possible future scenarios and
therefore draws heavily on the analysis in Section 5
64 Not all potential scheme impacts can be assessed in monetary terms
and of those that can we have more robust evidence for the
monetisation of some impacts than others In assessing value for money
WebTAG recommends using a three stage approach
We start with those impacts where the evidence for the
monetisation is robust We call the resulting BCR the ldquoinitialrdquo BCR
62
We then add those impacts where monetisation is possible but
where the evidence for doing so may not be as robust The
resulting BCR is called the lsquoadjusted BCRrsquo
Finally those impacts for which it is not possible to provide
monetary values are accounted for in a qualitative manner and the
potential ability for these impacts to shift the value for money
category is assessed
65 The table below presents the categories within which the assessment of
differing impacts are ordinarily placed Even within these categories the
robustness of the analysis can vary for example the quantification of
Wider Economic Impacts is considered more robust in this assessment
than landscape impacts
Table 18 - Three stage approach to monetisation of impacts
Initial BCR robust monetisable impacts
Adjusted BCR less robust but monetisable impacts
Judgement whether non-monetised impacts could shift value for money assessment
Travel Time Savings
Crowding benefits
Noise
Air Quality
Greenhouse Gases
Physical Activity
Accidents
Indirect Tax Revenue
Reliability
Wider Economic Impacts
Landscape
Townscape
Heritage of Historic Resources
Biodiversity
Water environment
Security
Access to Services
Affordability
Severance
Option Values
Notes Note that in the economic case for HS2 the reliability benefits have been recorded in
the initial BCR to ensure consistency with previous versions of the economic case This
differs from the treatment recommended in WebTAG Nevertheless paragraph 539 provides
an approximate BCR if reliability benefits are removed
Does the scheme represent lsquovalue for moneyrsquo
66 Table 6 presents the lsquoinitial BCRrsquo for the lsquoreference casersquo for both Phase
1 and the Y-Network It indicates that excluding Wider Economic
Impacts leads to an initial BCR of 14 for Phase 1 and 18 for the Y-
Network
67 Including WEIs provides a BCR of 18 for Phase 1 and 23 for the Y-
Network As noted previously point estimates are unable to demonstrate
the uncertainty inherent within consideration of a project such as HS2 It
63
is therefore imperative to consider how robust these BCR estimates are
to changes in both the external and internal environment
68 The economic analysis of HS2 described in Section 5 suggests that
taking account of certain key sources of uncertainty there is a low
probability that the BCR for the Y-Network will fall below 15 Only in a
very limited number of scenarios where there is an unexpected
prolonged series of low economic growth (averaging 125 to 2 per
annum over the entire appraisal period) combined with the upper range
of cost estimates and pessimistic views on other key variables does the
BCR drop below 15 The most likely outcome taking into account
uncertainty that can be quantified is that the BCR for the Y-Network
represents high value for money with a BCR above 20
69 The Economic Case for Phase 1 has a most likely outcome of
medium value for money with a BCR above 15 however there is a
small likelihood that this could fall into low value for money The
conclusions for Phase 1 and the Y-Network are consistent with the BCR
implied by the lsquoreference casersquo
610 The case for the scheme is strong using the standard tools and
methodology as expressed in WebTAG however as shown in Section 5
using alternative but plausible assumptions on the values of time and
demand capping in particular could make the Economic Case stronger
Furthermore consideration of other factors such as the impact of HS2
on Economic Geography may improve the case even further
Landscape impacts
611 Landscape impacts consider the effects of a scheme on the visible
features of a landmass combined with the physical and cultural aspects
of the land itself Any valuation of something which is intangible such as
landscape is challenging and while the Department has used the best
available methods to quantify landscape impacts the assessment
remains sensitive to a key set of underlying assumptions The monetised
assessment should therefore not be considered a substitute for the
detailed landscape assessment conducted in the Environmental
Statement52
612 The Landscape impacts have been estimated at pound10bn for Phase One
and pound29bn for the Y-Network (Present Value 2011 Prices) which would
reduce the BCR in both cases by 01 Whilst these estimates provide a
useful indication of the potential scale of landscape impacts sensitivity
52 HS2 Phase One Environmental Statement httpswwwgovukgovernmentcollectionshs2-phase-one-environmental-statement-documents
64
tests show that the plausible range on these values is extremely large
and therefore we do not believe them to be sufficiently robust to include
in the adjusted BCR
Non-monetised impacts
613 There are a range of impacts which we are unable to quantify in
monetary terms These include the effect of HS2 on heritage
biodiversity and the water environment and are therefore assessed
qualitatively The Departmentrsquos analysts appraise whether these are
likely to change the value for money categorisation of the scheme The
table below summarises the Departmentrsquos view of the affects of the
scheme on each of the impacts considered This represents a
judgement of the overall impacts across each Phase of the scheme
based on the material contained within the HS2 Environmental
Statement for Phase 1 and the Phase 2 Appraisal of Sustainability
which are mapped against the categories of impact outlined in WebTAG
It is recognised that there will be localised effects which may be greater
or less than the overall categorisation
Table 19 ndash Departmentrsquos assessment of non-monetised impacts
IMPACT ASSESSMENT
Phase 1 Phase 2
Townscape Neutral Neutral
Heritage Moderate Adverse Slight Adverse
Biodiversity Slight Adverse Adverse
Water Environment Moderate Adverse Moderate Adverse
Accessibility Slight Beneficial Slight Beneficial
Personal Affordability Not assessed Not assessed
Severance Slight Adverse Slight Adverse
Option Values Slight Beneficial Slight Beneficial
Physical Fitness Neutral Neutral
Journey Ambience Slight Beneficial Slight Beneficial
Transport Interchange Slight Beneficial Slight Beneficial
614 Consideration of these additional impacts does not imply conclusively
that there is any change in the case for the scheme as there are both
adverse and beneficial impacts It is also important to note that
mitigation measures to account for these impacts will be implemented
While the adverse impacts are likely to outweigh those that are
beneficial it is highly unlikely that the effects will be significant
enough to change the value for money categorisation of the
scheme
65
Conclusion
615 The available evidence indicates that the most likely outcome for the Y-
Network is high value for money while for Phase 1 the most likely
outcome is medium value for money Accounting for landscape impacts
and impacts which cannot be monetised will generate downside but are
unlikely to alter this conclusion
66
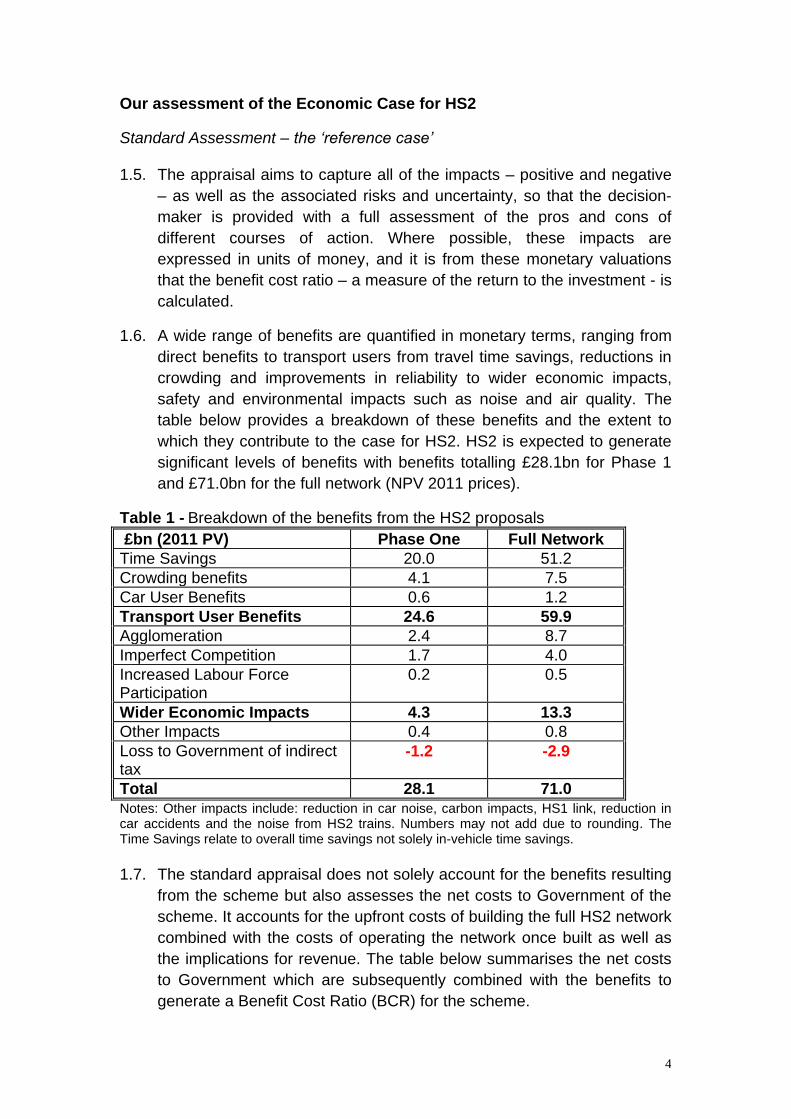
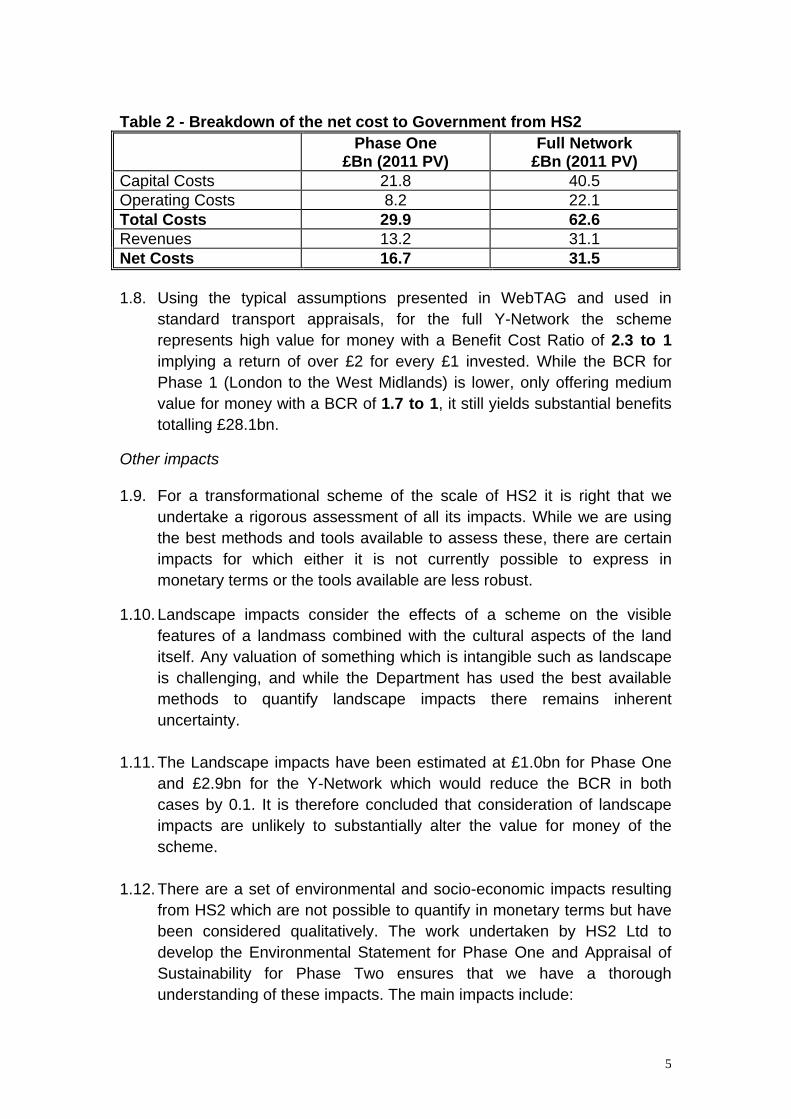
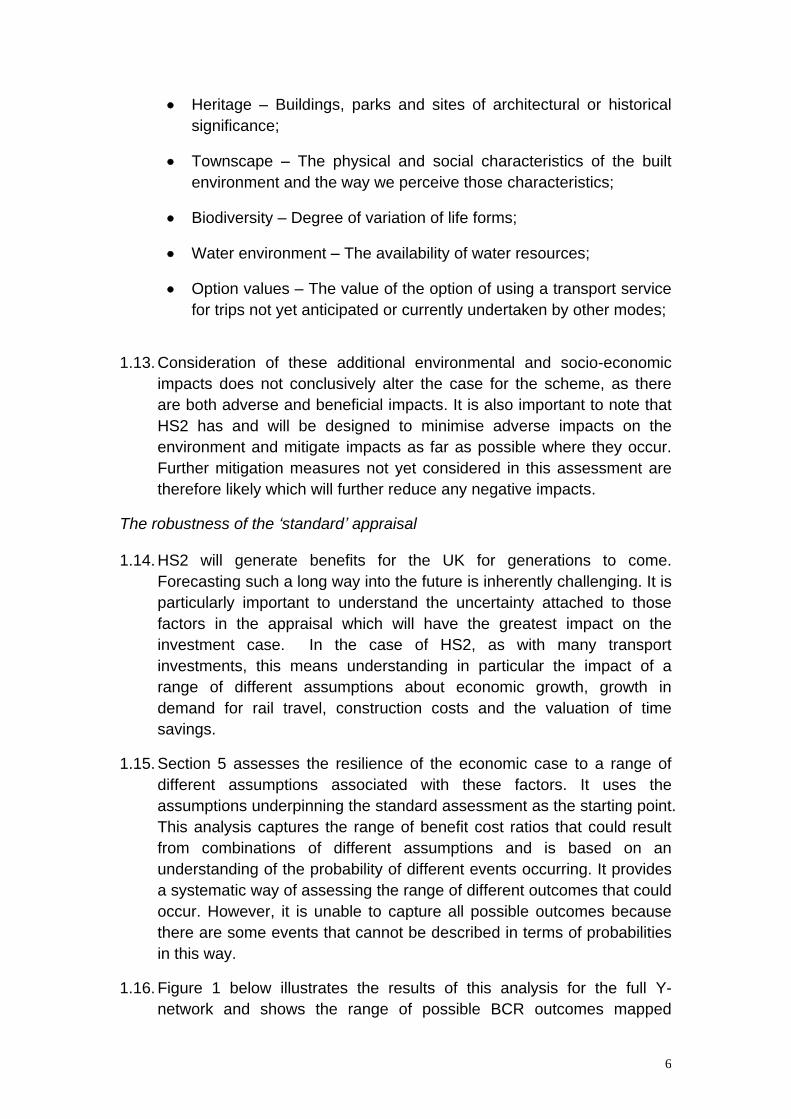
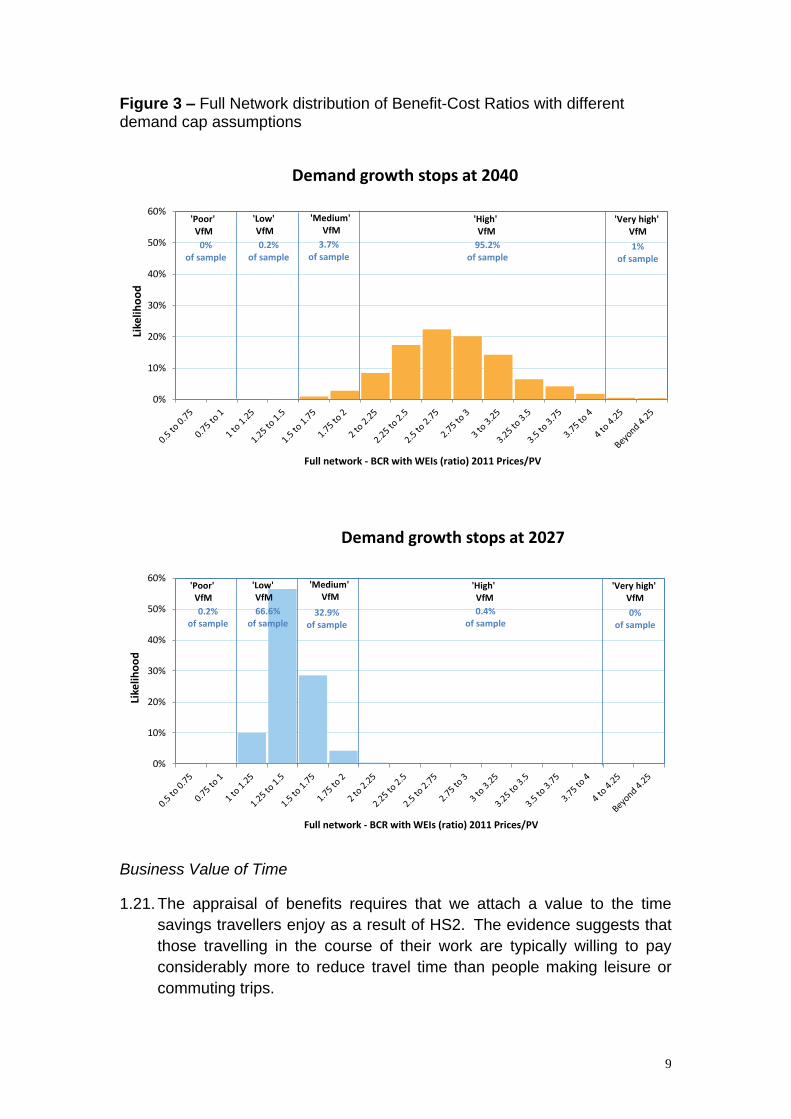
0
10
20
30
40
50
60
Like
liho
od
Full network - BCR with WEIs (ratio) 2011 PricesPV
Demand growth stops at 2040
Poor VfM
Low VfM
Medium VfM
High VfM
0of sample
02of sample
37of sample
952of sample
Very high VfM
1of sample
0
10
20
30
40
50
60
Like
liho
od
Full network - BCR with WEIs (ratio) 2011 PricesPV
Demand growth stops at 2027
Poor VfM
Low VfM
Medium VfM
High VfM
02of sample
666of sample
329of sample
04of sample
Very high VfM
0of sample
Figure 3 ndash Full Network distribution of Benefit-Cost Ratios with different demand cap assumptions
Business Value of Time
121 The appraisal of benefits requires that we attach a value to the time
savings travellers enjoy as a result of HS2 The evidence suggests that
those travelling in the course of their work are typically willing to pay
considerably more to reduce travel time than people making leisure or
commuting trips
9
122 The valuation of business travel time savings should reflect peoplersquos willingness-to-pay (WTP) for them The standard approach assumes that
employee wages are a suitable approximation of WTP Wersquove looked at
the evidence on peoplersquos WTP and it shows that the values of time
adopted in the standard analysis are a suitable representation of what
business passengers travelling by rail are willing to pay for quicker
journeys 5
123 There are however reasons to believe that high speed rail schemes
should be assessed with values of time higher than those applied to
conventional rail schemes A review of both UK and international
evidence on the valuation of travel time savings was recently undertaken
for the Department by the Institute for Transport Studies University of
Leeds (ITS Leeds)6 This study concluded that when considering values
of time for high speed rail the existing evidence points to a valuation in
excess of that applied in the economic analysis by as much as 40 ndash 50
A sensitivity test which considers a 40 uplift to the standard values has
been applied to the appraisal 7 8 Given the relatively limited number of
High Speed rail specific studies a low value of time scenario which
considers the wider evidence for the willingness to pay for travel time
savings across all rail travel is also presented Evidence presented in the
ITS Leeds (2013) study suggests applying a figure 20 lower than the
WebTAG 2013 values of time
124 As indicated in the charts below the BCR for the Y-Network in the case
of a lower value of time is expected to be approximately 2 while
consideration of a High Speed Rail specific value results in a BCR
greater than 3 and in this case taking account of the risks and
uncertainty which have been quantified there is a limited chance that
BCR will fall below 2
5 Wardman M Batley R et al (2013) lsquoValuation of Travel time Savings for Business
Passengers ITS Leeds httpswwwgovukgovernmentpublicationsvalues-of-travel-time-savings-for-business-travellers 6 Wardman M Batley R et al (2013) lsquoValuation of Travel time Savings for Business Passengers ITS Leeds httpswwwgovukgovernmentpublicationsvalues-of-travel-time-savings-for-business-travellers 7 Wardman M Batley R et al (2013) lsquoValuation of Travel time Savings for Business
Passengers ITS Leeds httpswwwgovukgovernmentpublicationsvalues-of-travel-time-savings-for-business-travellers 8 On the basis that some of this variation is likely to be related to the longer trip lengths
served by high-speed rail the standard non-work values of time have also been adjusted to reflect the longer distances served by HS2
10
Figure 4 ndash Full Network distribution of Benefit-Cost Ratios with HSR specific value of time
Figure 5 ndash Full Network distribution of Benefit-Cost Ratios with low value of time
Strategic Alternatives
125 A key component of the economic case is consideration of the
alternatives to HS2 The alternatives to HS2 can offer means of
providing more capacity on the rail network while also generating high
value for money Nevertheless the Benefit Cost Ratio should not be
11
taken to unequivocally represent the right answer analysis indicates that
the alternatives are likely to
Be unable to provide as much extra capacity for passengers
Lead to significant levels of disruption to passengers during
construction
Worsen network resilience or performance reliability and
Be unable to offer the same level of journey time savings as HS2
12
2 What is the role of this Economic Case
21 The Governmentrsquos commitment to develop a High Speed Rail network in the UK is at a key stage in programme development which necessitates
revisiting the Economic Case for the scheme
22 This document provides an update to the economic case for HS2 that
was published in January 2012 and subsequently updated in August
20129 Its purpose is threefold
to assess the value for money of HS2
to assess a range of alternative options for delivering the strategic
objectives of HS2 and
to provide an up to date economic assessment of the Phase 2 route
and station choices currently being consulted upon
23 The economic case consolidates analysis on HS2 and the alternatives
already published in October 2013 It should therefore be read in
conjunction with these documents which are listed below
The Strategic Case for HS2 - provides a comprehensive overview
of the HS2 scheme proposal10
The Economic Case for HS2 ndash economic advice for Government on
the case for HS2 prepared by HS2 Ltd11 and
24 The main role of the Economic Case is to consider whether all of the
collective impacts (including on existing transport networks) delivered by
the preferred scheme represent good value for taxpayersrsquo money The
assessment of the HS2 scheme itself draws heavily on the analysis
presented in the economic advice of HS2 Ltd to Government published
in October 2013 However in order to robustly answer the value for
money question this Economic Case also assesses the case for the
various investment alternatives
9 January 2012 httpswwwgovukgovernmentpublicationseconomic-case-for-hs2-value-for-money-statement August 2012 update
httpassetshs2orguksitesdefaultfilesinsertsUpdated20economic20case20for20 HS2pdf 10 Department for Transport (2013) lsquoThe Strategic Case for HS2rsquo httpswwwgovukgovernmentpublicationshs2-strategic-case 11 HS2 Ltd (2013) lsquoEconomic Case for HS2rsquo httpwwwhs2orguknews-resourceseconomic-documents
13
25 By bringing together and summarising information on costs benefits and
risks the Economic Case is able to support decision making However it
should not be seen as unequivocally providing the lsquorightrsquo or only answer
ie the option which appears to offer the best value-for-money is not
necessarily the optimal proposal The Department carries out investment
appraisals following the recommendations in HM Treasury guidance on
the five case model for public sector business cases12 Decision-makers
are presented with evidence against all five cases (strategic economic
financial commercial and management) when considering investment
decisions such as HS213 Therefore while value for money is important it
is only one factor that is taken into account when choosing whether or
not to proceed to the next stage in the decision making process
26 This economic case has been prepared in accordance with the
requirements of HM Treasuryrsquos Green Book and the Department for
Transportrsquos transport appraisal guidance (WebTAG)14 and uses the most
appropriate tools and evidence available Nevertheless there are
challenges to appraising the potential benefits and costs of a
transformational transport scheme such as HS2 In line with National
Audit Office recommendations full consideration has been made of
these challenges and associated uncertainty rather than reliance on
point estimates15
27 A complete assessment of the value for money of a transport scheme
requires comparing a range of options We have therefore looked in
detail at the case for options based on enhancements to the existing rail
network (the Strategic Alternatives - see section 4) as well as the case
for a new high speed line All of these schemes have been compared to
a common scenario that allows us to assess the incremental economic
social environmental and public accounts impacts that each package of
transport interventions may bring about
28 It is important to remember that as with all business cases the
underlying economic case for HS2 will change over time according to
factors such as changes in the economic outlook updates to the
models used by HS2 Ltd to predict behavioural responses to HS2 the
development of non-market valuation techniques refinement of cost
assumptions or scheme design and development of the Departmentrsquos
demand forecasting and appraisal framework The assessment
12 lsquoPublic Sector Business Cases using the Five Case model A Toolkitrsquo httpswwwgovukgovernmentuploadssystemuploadsattachment_datafile190601Green_ Book_guidance_public_sector_business_cases_using_the_Five_Case_Model_guidancepdf 13 See httpswwwgovuktransport-analysis-guidance-webtag for more details 14 httpswwwgovuktransport-analysis-guidance-webtag 15 NAO (2013) High Speed 2 A Review of Early Programme Preparation page 12 httpwwwnaoorgukwp-contentuploads201307Full-Reportpdf
14
presented here will continue to develop in the months and years ahead
so this should not be taken as the final word on the Economic Case for
either Phase 1 or Phase 2 of the scheme
15
3 The Assessment Framework
The Scheme
31 HS2 is one piece of infrastructure being planned and built in two phases
Phase One will see a new line run from London Euston through Old
Oak Common to new stations serving Birmingham airport and
Birmingham city centre It also includes a connection to the West Coast
Main Line (WCML) north of Birmingham allowing lsquoclassic compatiblersquo
trains to continue from the high speed line direct to destinations such as
Manchester and Glasgow
32 The proposals for Phase Two will extend high speed lines to Manchester
in the North West and to Leeds in Yorkshire and Humberside with
intermediate stations at Manchester Interchange (near Manchester
airport) the East Midlands Hub at Toton and Sheffield Meadowhall
Trains which can travel on the existing rail infrastructure as well as HS2
will then continue onto the existing network and travel further North to
Scotland It also incorporates a connection with the WCML further south
at Crewe meaning key destinations like Liverpool Runcorn Crewe and
Warrington would benefit from direct services
33 HS2 will link 8 of Britainrsquos 10 largest cities to the High Speed
infrastructure with other cities served by compatible trains running on to
the existing train network Further details of the proposed route
assessed within this Economic Case are available in the Phase 2 line-of-
route consultation document16
Assessing the costs and benefits of HS2 ndash an introduction
34 The influence of a major transport scheme such as HS2 is likely to be
widespread and complex and will lead to changes in transport
conditions that will affect the decisions of individuals both directly and
indirectly It is therefore imperative that an appropriate level of effort is
put into assessing these consequences to understand the extent to
which scheme objectives are met and problems solved and to estimate
the value for money of the project
35 Over the past two years in order to fulfil their duty of providing advice to
Government HS2 Ltd has implemented a very substantial programme of
updates and improvements to its transport modelling suite While HS2
Ltd has appraised the impacts of HS2 using the best available modelling
tools it also recognises that there are inevitable uncertainties and
16 HS2 Phase 2 Route Consultation httpwwwhs2orgukroute-consultation
16
challenges associated with assessing the costs and benefits of the
largest transport infrastructure scheme in the UK since the origin of the
motorways
36 Rather than describe in full the modelling tools used for the analysis the
focus here is on the changes implemented since August 2012 Further
details of the assumptions methods and models used to assess HS2
can be found in the methodological overview of the Planet Framework
Model and the associated Assumptions Report17
37 Changes to the assessment framework can be split into four elements
The treatment of risk and uncertainty
The approach to forecasting demand for HS2
Assessing the benefits of HS2 and
Assessing the costs of HS2
38 The remainder of this section summarises the changes that have been
implemented Further detail of their combined impact on the economic
case for HS2 is provided below as well as in supporting material
published by HS2 Ltd18
Treatment of risk and uncertainty
39 To assess the impacts of HS2 the Department and HS2 Ltd have used
the best tools and evidence base available There are however specific
challenges to assessing such a transformational scheme as HS2 HS2 is
the largest transport infrastructure project for a generation the impacts
of which need to be assessed almost 80 years into the future at a time
when even the short-term economic outlook is uncertain
310 In recognition of these challenges rather than focus on a single point
estimate of the costs and benefits of the scheme HS2 Ltd in their advice
to Government adopt a broader approach This approach recognises
major potential sources of risk and uncertainty and analyses the
likelihood of different outcomes
311 In keeping with the advice of HS2 Ltd this Economic Case provides a
thorough assessment of the robustness of the value for money of the
scheme to different events and circumstances While it is still necessary
17 HS2 Ltd (2013) lsquoPlanet Framework Model (PFM V43) ndash Model Descriptionrsquo and HS2 Ltd (2013) lsquoPFM v43 Assumptions reportrsquo httpwwwhs2orguknews-resourceseconomic-documents 18 HS2 Ltd (2013) lsquoThe Summary of Key Changes to the Economic Case since August 2012rsquo httpwwwhs2orguknews-resourceseconomic-documents
17
to consider a lsquoreference casersquo (ie a point estimate of costs and benefits)
against which the alternatives to HS2 can be understood the analysis
presented here also explicitly considers the potential range of outcomes
given some of the many known sources of uncertainty
The approach to forecasting demand for HS2
312 HS2 Ltd has specified and implemented a wide-ranging programme of
work to ensure that its projections of long-distance travel continue to
reflect the best available evidence These changes apply both to the
consideration of HS2 and its alternatives Model development has
focused on the key areas described below19
Base year demand ndash forecasting future transport demand requires
detailed information on current travel patterns HS2 Ltd has
improved its understanding of why people travel and the mode of
travel they use In particular they have gathered an improved
understanding of the categorisation of trips into business leisure
and commuting purposes through using National Rail Travel Survey
data to estimate journey purposes at a more disaggregated
geographic level
The lsquowithout-schemersquo scenario - estimating the incremental benefits
of HS2 and the Strategic Alternatives requires comparison against a
scenario in which HS2 is not built The Department has announced
a number of planned enhancements to transport infrastructure in
England and Wales which have been reflected in the lsquowithout
schemersquo scenario20
Estimating the size of the market - forecasts of rail demand rely on
estimating the relationship between passenger demand and a
range of influences that are known to affect rail patronage such as
economic growth and rail fares The demand forecasts have been
updated to incorporate new evidence from the Passenger Demand
Forecasting Handbook on the behavioural relationships used to
forecast rail demand21
Forecasting external factors - in addition to understanding the
sensitivity of rail passengers to a range of influences we must also
take a view on how those influences are likely to evolve through
19 For further details see lsquoThe Summary of Key Changes to the Economic Case since August 2012rsquo httpwwwhs2orguknews-resourceseconomic-documents 20 High Level Output Specification 2012 httpswwwgovukgovernmentpublicationshigh-level-output-specification-2012 21 For further information regarding the Passenger Demand Forecasting Handbook see httpwwwatocorgabout-atoccommercial-activitiespassenger-demand-forecasting-council
18
time The updated Economic Case reflects more recent forecasts of
variables such as economic growth and fuel costs22
Train service patterns - to establish the benefits of the schemes a
train service specification which covers trains on both the high
speed and existing network needs to be developed Alterations to
the demand forecasts have meant revisiting the train service
patterns to ensure they correspond to estimated demand
Assessing the benefits of HS2
313 To conduct a cost benefit analysis of all impacts it is necessary to place
a value on the changes to the wellbeing of both transport users and non
transport users resulting from the introduction of HS2 or its alternatives
To bring these impacts to the same units for comparison monetary
valuations are applied wherever possible
314 As with the methods used to forecast passenger demand for HS2 and its
alternatives the techniques applied to translate this into a complete cost
benefit analysis of HS2 have been reviewed and updated in the following
key areas
Application of crowding values - The Department has updated both
the methodology and values used to place a monetary value on
crowding relief to bring it in line with the most recent evidence from
the Passenger Demand Forecasting Handbook This suggests that
passengers place lower value on reducing crowding than previously
thought
Business Values of time - The values used previously were based
on income and travel data from the National Travel Survey from
1999-2001 and have now been updated with National Travel
Survey data from 2008-201023
Non-work values of time - The Department has reviewed the
evidence on how the non-work values of time are likely to increase
over time The most recent evidence demonstrates that the non-
work values grow more strongly over time than was previously
assumed24
22 As with any appraisal there is a lead time for producing analysis which in certain cases (most notably GDP forecasts) has prevented the very latest projections from being incorporated 23 Department for Transport (2013) TAG Unit A1-3 user and provider impacts httpswwwgovukgovernmentpublicationswebtag-tag-unit-a1-3-user-and-provider-impacts 24 A series of research reports which collect recent evidence on the non-work values of time can be found at httpswwwgovukgovernmentcollectionstransport-appraisal-and-strategic-modelling-tasm-research-reports
19
315 For further details please see the lsquoPFM V43 Summary of Key Changes
since August 2012rsquo25
Assessing the costs of HS2
316 In order to establish the value for money of a transport intervention it is
necessary to compare the benefits generated with the costs incurred In
the case of HS2 this covers both the up-front costs of delivering the
necessary infrastructure and rolling stock (the capital costs) and the
costs required to provide rail services once the infrastructure is available
for use (the operating costs) Both cost elements have undergone
revision since the last iteration of the Economic Case for the scheme
Capital Costs
317 The cost estimates prepared for the January 2012 Economic Case were
estimated when the scheme was at a far earlier stage of development
A public consultation on the route options for Phase 1 had just been
completed while Phase 2 was at the preliminary pre-consultation phase
Since January 2012 the capital cost estimates for both phases of the
scheme have undergone considerable review and further design
development and alterations have been made to the scheme Changes
to Phase 1 include more tunnels increased certainty of design at
stations increased number of bridges and further refinement of the
earthworks and retaining walls For Phase 2 the initial preferred route
has different approaches to Manchester including the inclusion of a
station at Manchester Airport and the recognition of additional mining
risks on the Leeds leg
318 Further details of the changes to both capital and rolling stock cost
estimates can be found in the HS2 Ltd Cost and Risk Status Report26
Phase 1 Construction Costs
319 The latest estimate of base costs for constructing Phase 1 of HS2 is
pound1565bn (2011 Q2 prices)27 This includes all costs associated with
purchasing land and property
tunnelling works
building stations depots and stabling
25 httpwwwhs2orguknews-resourceseconomic-documents 26 HS2 Ltd (2013) lsquoCost and Risk Status Reportrsquo httpwwwhs2orguknews-resourceseconomic-documents 27 This estimate includes certain sunk costs which are excluded from the appraisal in line with the guidance specified in WebTAG Unit 359
20
laying tracks signals and associated railway systems
insurance and
staff costs and other overheads
320 On the current scope and delivery timetable for the scheme HS2 has
been set a lsquotarget pricersquo to deliver Phase 1 within base cost plus a 10
allowance (pound1716bn in 2011 prices) with the allowance designed to
manage design changes through the Hybrid Bill process There are
robust mechanisms and suitable allocation of risks that support the
achievability of this target
321 In order to understand the opportunities and threats associated with
meeting the target price HS2 Ltd has completed a structured
assessment of risks their likelihood and their consequences Over
three-hundred of these risks have been included within a quantitative
risk assessment (QRA) More detail is provided in HS2 Ltdrsquos Cost and
Risk Status Report
322 The results of the quantified risk assessment are expressed in terms of
the probability that the cost of building Phase 1 will fall below a certain
level So the higher the level of certainty required the higher the
associated cost threshold
323 To inform the standard appraisal within the economic case the expected
or average value of the quantified risks in line with HM Treasury Green
Book guidance have been considered HS2 Ltdrsquos cost estimation work
established a lsquoP50rsquo cost estimate of pound194bn (2011 prices)28 which is the
basis of the DfT spending allocation in the Spending Review 2013
324 The Treasury will hold an additional contingency as part of an overall
funding envelope announced in the Spending Review 2013 of pound214bn
(2011 prices) This represents total allowances of 37 on top of base
costs but the Department and HS2 Ltd are determined to deliver the
project below this level at the target price of pound1716bn (2011 prices)
325 Figure 6 indicates the range of cost outcomes considered within the
economic case The impact of this range on the relationship between
scheme benefits and costs is described in section 5 of this document
28 This estimate includes certain sunk costs which are excluded from the appraisal in line with
the guidance specified in WebTAG Unit 359
21
00
50
100
150
200
250
Lower Bound Reference Case P50 Overall funding envelope P95
poundb
n (
20
11
Q2
Pri
ce
s)
Contingency
Base Cost
Figure 6 ndash Range of cost outcomes considered
326 Basing the level of contingency allowances on the results of a
quantitative risk assessment represents best practice Optimism bias is
considered inappropriate to be applied in the appraisal of schemes
beyond the Strategic Outline Business Case stage of development on
the basis that cost estimates will be mature at this stage of development
327 The approach has been agreed with HM Treasury on the basis that
We will do further work to understand and quantify the broadest
possible set of risks associated with the delivery of HS2 at the point
in time at which it is most appropriate to do so This will include
Developing our treatment of construction cost inflation
Further work to develop a procurement strategy for HS2 and
Working closely with rail industry stakeholders to better understand
the impact of HS2 upon their businesses
A Cost and Risk Group including HMT and Infrastructure UK
oversees a programme of work expected to focus on the following
Ensuring a shared detailed understanding of costs risks and
contingency from a delivery and controls standpoint
Ensuring a continued focus on cost reduction and control
Providing an advisory and challenge function and
Ensuring this work takes account of best practice in other projects
22
Phase 2 Construction Costs
328 Since the base cost estimates for Phase 2 are less mature it is not
appropriate to use the same approach to contingency allowances as
used for Phase 1 Instead a similar approach as employed in previous
updates to the economic case for HS2 has been used This involves
applying a combination of quantitative risk assessment and optimism
bias to generate an expected value of total contingency allowances
329 The latest estimate of base costs for delivering the infrastructure needed
for phase 2 of HS2 is pound125bn (2011 Q2 prices) As for phase 1 to
inform the reference scenario within the economic case we have
considered the expected or average value of the quantified risks in line
with HM Treasury Green Book guidance The expected value of risk
provision at P50 is 34 of the base construction cost excluding indirect
costs Indirect costs have had a risk allowance of 10 applied to them
330 An additional optimism bias of 32 has then been applied to phase 2
construction costs (excluding indirect costs) The overall optimism bias
applied to direct costs (construction and land) at P50 is therefore 66
which is in line with WebTAG rail appraisal guidance The level of
contingency is 52 higher than the base cost estimate including indirect
costs (pound190bn in 2011 prices at P50)
331 A target price for Phase 2 has not yet been identified due to its relatively
early stage of development However to ensure that we have assessed
the case for HS2 against an appropriately wide range of outcomes we
have also considered a scenario in which the entire provision for funding
agreed with HM Treasury is needed for construction This represents
total allowances of 89 on top of direct base costs with 10 applied to
indirect costs (a total of pound212bn in 2011 prices at P95)
Rolling Stock Costs
332 HS2 Ltd has taken forward detailed work to assess the latest view on the
likely cost of HS2 rolling stock This has involved reassessing the fleet
requirement (including removing 260 metre units as a service offering)
given the latest view on service patterns assessing recent market
activity in order to benchmark costs taking market soundings making
separate provision (including a 100 risk allowance) for design costs
and considering procurement approaches
333 This latest cost estimation work has led to a revised central estimate for
rolling stock costs of pound69bn (2011 prices) of which pound135bn is
contingency
23
Operating Costs
334 HS2 Ltd has conducted a technical review of the estimated operating
costs of HS2 with the aim being to update assumptions in line with the
latest available benchmarks and to reflect improved information
associated with more detailed scheme design and development
335 The most significant operating cost changes in terms of their impact on
overall costs have been
HS2 rolling stock electricity consumption ndash Methods used to
evaluate this cost have significantly improved and
Improvements have been made to the methods used to calculate
Train Operating Company overheads and administrative costs
336 HS2 Ltd in consultation with DfT has also reviewed the level of
optimism bias applied to HS2 operating costs In carrying out this review
the aim has been to better reflect the maturity of cost estimates the
availability of relevant benchmarks and the quality of the evidence on
which they are based As a result differing levels of Optimism Bias are
applied to different costs ranging from 10 applied to rolling stock
electricity costs to 41 applied to infrastructure operations and
maintenance costs
337 Unlike previous iterations of the Economic Case for HS2 no optimism
bias allowance is applied to classic line savings Previously the
application of optimism bias to cost savings acted to increase the
assumed level of savings Further details of the changes to operating
cost estimates are available in the HS2 Ltd Economic Case29
What impact do these changes have on the reference Economic Case
for HS2
338 In order to understand the impact of the changes described above on
the Benefit Cost Ratio (BCR) of HS2 a lsquoreferencersquo case has been
developed which adheres to the detailed advice provided by the
Department for Transport on how to apply Green Book principles to
transport investments (WebTAG)30 This allows for comparison with the
benefit cost ratio as presented in the August 2012 Economic Case
29 HS2 Ltd (2013) lsquoEconomic Case for HS2rsquo httpwwwhs2orguknews-resourceseconomic-documents 30 Department for Transport lsquoTransport Analysis Guidance ndash WebTAGrsquo
httpswwwgovuktransport-analysis-guidance-webtag
24
update and also provides a point estimate against which the Economic
Case for each of the alternatives can be compared
339 Further details regarding how each of the changes to the modelling
framework noted above have impacted on the BCR of HS2 can be found
in the lsquoPFM V43 Summary of Key Changes since August 2012rsquo report31
Benefits
340 The total net transport benefits (excluding Wider Economic Impacts) of
the HS2 Y-Network (including both Phase 1 and Phase 2) are calculated
to be pound599bn (2011 PV and prices) with a net revenue impact of
pound311bn (2011 PV and prices) Overall this represents an increase in
benefits of pound117bn (2011 PV and prices) compared to the August 2012
estimate Revenue has remained relatively unchanged
341 For Phase 1 total benefits equal pound246bn (2011 PV and prices) with a
net revenue of pound132bn (2011 PV and prices) As with the Y-network this
represents a substantial increase in benefits from pound188bn in August
2012 Revenue remains broadly unchanged from an estimate of
pound132bn in August 2012 The table below provides a summary of the
benefits of Phase 1 and the Full Network
Table 3 - Breakdown of the benefits from the HS2 proposals
poundm (2011 PV) Phase One Full Network
AccessEgress Cost Savings pound1094 pound1115
Crowded time savings pound4068 pound7514
BoardInterchange time savings
pound810 pound4146
Wait Time Savings pound3508 pound8081
Walk Time Savings pound404 pound1330
In Vehicle time savings pound14142 pound36503
Car User Benefits pound568 pound1162
Transport User Benefits pound24594 pound59852
Notes Numbers may not add due to rounding
342 In comparison with the previous appraisals of the scheme there is an
increase in the level of user benefits originating from travel time savings
despite the reduction to the business value of time One of the primary
drivers of this is the updates to the modelling which reflect an improved
understanding of why people travel This indicated that a greater
proportion of journeys are undertaken by business travellers between
the locations covered by HS2
343 An assessment has also been made of the non-monetised benefits of
the scheme taking account of the impact of HS2 on factors such as
31 This report can be found at httpwwwhs2orguknews-resourceseconomic-documents
25
heritage biodiversity and journey ambience Further details of this
assessment can be found in Section 6 It concludes that consideration of
these additional impacts does not imply conclusively that they improve
or worsen the case for the scheme as there are both adverse and
beneficial impacts
Costs
344 Since the assessment made in August 2012 scheme capital costs have
increased from pound188bn to pound218bn (2011 PV and prices) for Phase 1
For the full Y-Network the increase is from pound364bn to pound405bn (2011 PV
and prices)32 This includes a rolling stock cost estimate of pound65bn (2011
PV and prices including a full replacement) In contrast operating costs
have remained similar to the August 2012 assessment (although this is
largely a coincidental result of changes in both directions) The scheme
costs are summarised in the table below
Table 4 - Breakdown of the net cost to Government from HS2
poundbn (2011 PV) PHASE ONE FULL NETWORK
Capital Costs 218 405
Operating Costs 82 221
Total Costs 299 626
Revenues 132 311
Net Costs 167 315
Wider Economic Impacts
345 The Wider Economic Impacts (WEIs) resulting from HS2 are valued at
pound43bn for Phase 1 and pound133bn for the entire Y-Network In August
2012 these figures were calculated as pound48bn for Phase 1 and pound154bn
for the Y-Network The table below describes the Wider Economic
Impacts of the scheme
32 This assessment differs from the pound426bn total funding package for HS2 as it takes account of discounting and reflects a lower level of contingency
26
Table 5 ndash Wider Economic Impacts
poundm (2011 PV) Phase One Full Network
Agglomeration pound2413 pound8706
Imperfect Competition pound1692 pound4053
Increased Labour Force Participation pound235 pound535
Total pound4341 pound13293
346 Further details of the impact these changes have had on the benefits
and costs of the scheme can be found in the lsquoThe Summary of Key
Changes to the Economic Case since August 2012rsquo This report
indicates that the changes which had the most significant impact on the
BCR were
Improved estimates of base year transport demand and our
understanding of why people travel which increased the estimated
proportion of business travellers and therefore increased scheme
benefits
The changes to the value of travel time savings for business
passengers which reduced scheme benefits
Incorporating new evidence on the value passengers place on
reducing crowding which reduced scheme benefits
Revisions to capital cost estimates which increased scheme costs
Updated train service specifications both on HS2 and the classic
lines when HS2 is operational which increased scheme benefits
and
Updates to the lsquowithout schemersquo case to incorporate all committed
rail infrastructure investment which reduced scheme benefits
Benefit Cost Ratio
347 The impact of these changes on the benefit cost ratio (BCR) for the
reference case is presented in the table below The resulting BCR
(excluding Wider Economic Impacts) is 14 for Phase 1 and 18 for the
entire Y-Network The equivalent figures presented in August 2012 were
14 for phase 1 and 19 for the entire network
348 The benefits and costs of proceeding with Phase Two of the scheme
once Phase One has been completed have also been analysed The
BCR for Phase Two once Phase One is built is expected to be 21
excluding Wider Economic Impacts
27
349 When Wider Economic Impacts are included the BCR has stayed largely
constant for Phase 1 at 17 whereas for the Y-Network it has fallen from
approximately 25 to 23 The BCR including Wider Economic Impacts
for Phase 2 assuming Phase 1 is in place is 27
Table 6 - Reference Case BCR calculation (60 year appraisal period)
poundm (2011 PV) PHASE 1 Y-NETWORK PHASE 2
Net Transport Benefits
(PVB)
238 577 319
Net Transport Benefits
including Wider
Economic Impacts
(PVB)
281 710 407
Capital Costs 218 405 187
Net Operating Costs 82 221 137
Net Revenues 132 311 173
Net Cost to
Government (PVC)
167 315 151
BCR (excluding Wider
Economic Impacts)
14 18 21
BCR (including Wider
Economic Impacts)
17 23 27
28
4 The Alternatives to HS2
Introduction
41 The Government has considered a wide range of alternative options to a
high speed rail network to-date These include assessing the case for
using other modes of transport building a new conventional speed line
and enhancing the existing rail network
42 The latest assessment of alternative options has mainly focussed on
enhancements to the existing rail network since these are most likely to
deliver capacity and journey time improvements comparable to those of
HS2 Given the scale of HS2 few alternative schemes will be able on
their own to deliver an equivalent level of functionality It was therefore
considered more appropriate to examine packages of interventions
43 The alternatives to HS2 have been reviewed and enhanced for the
economic and strategic case documents Packages of infrastructure
works and train service specifications were built up through an iterative
and joint process involving experts from the Department for Transport
Network Railrsquos route teams and technical advisors The benefits and
costs of these schemes have been modelled and are presented below
44 This chapter briefly describes the different packages of alternatives the
extent to which they have the potential to improve capacity and journey
times as well as outlining the costs and benefits of each It should be
read in conjunction with Chapter 6 of the Strategic Case which assesses
in more detail how well the alternatives meet the objectives of HS2
which are
To provide sufficient capacity to meet long term demand and to
improve resilience and reliability across the network
To improve connectivity by delivering better journey times and
making travel easier
It is deemed that any solution must
Minimise disruption to the existing network
Use proven technology that we know can deliver the required
results
Be affordable and represent good value to the taxpayer
Minimise impacts on local communities and the environment
29
45 Further technical detail on the packages and their assessment can be
found in a report published by the Departmentrsquos technical advisors
Atkins 33 Despite the alternatives being at an earlier stage of
development than HS2 they have been assessed using consistent
methods and assumptions wherever appropriate
Summary of previous work
46 Previous reports have considered numerous different packages of rail
interventions as alternatives to both HS2 Phase 1 and the Y network34
These range from a capital cost of pound3 to pound23 billion (2009 prices and
values) including enhancements such as lengthening trains providing
increased lines of track in busy areas and electrifying some stretches of
train line
47 The January 2012 update of these reports 35 reassessed the three
conventional rail alternatives to HS2 which were thought to have the
strongest business cases An alternative proposal put forward by the
51M group of local authorities which built on the Departmentrsquos previous
work was also analysed Whilst all of these packages represented
medium to very high value for money it was considered that they did not
deliver benefits on the same scale as HS2
Rationale for further work on the Strategic Alternatives
48 To inform the economic and strategic cases for HS2 it is necessary to
review packages of alternative investments in the classic rail network
The analysis underpinning HS2 has progressed significantly since the
January 2012 update particularly in the design and modelling of Phase
2 making it essential to revisit the alternatives Also since the previous
update some of the proposed infrastructure interventions have been
taken forward by the Department necessitating their removal from the
packages of alternatives
49 The Department took this opportunity to carry out further work on the
Phase 1 alternative changing aspects of the previous package (Rail
Package 2) specifically to provide more capacity on commuter train
services into London In addition alternatives to the HS2 Y network were
significantly redeveloped to include more infrastructure spending with
the aim of better meeting the objectives of HS2 increasing capacity and
33 Atkins (2013) lsquoHS2 Strategic Alternatives Final Report 28 October 2013rsquo httpswwwgovukgovernmentpublicationsrail-alternatives-to-hs2 34 For example Atkins (2011) lsquoHigh Speed 2 Strategic Alternatives Study London to West Midlands Rail Alternatives ndash Update of Economic Appraisalrsquo February 2011 35 Atkins 2012 lsquoHigh Speed Rail Strategic Alternatives Study Update following consultationrsquo January 2012
30
improving journey times to a larger extent than the previously assessed
package (Scenario B) The Y network alternatives were also extended to
deal more explicitly with short distance and cross country flows
410 For the first time it has been decided to consider alternatives to Phase 2
of HS2 where it is assumed in the do minimum that Phase 1 has
already been built The analysis of these options can be compared to the
HS2 Phase 2 outputs presented in Table 6
Scope of new work
411 The packages of alternatives were derived through a series of
workshops with Network Rail These workshops generated Train
Service Specifications (TSS) alongside lists of the additional
infrastructure that would be required to run them forming the proposed
packages of alternatives
412 For each route three packages were produced high medium and
low The high packages had the greatest increases in infrastructure and
rolling stock to support more ambitious TSS whereas the low packages
had more modest requirements to support smaller improvements to the
TSS These packages were necessarily produced without the ability to
model the package outputs and therefore at this stage did not consider
in detail the potential value for money of the schemes Instead they
were based on Network Railrsquos knowledge of current asset conditions on
the routes and their professional judgement that the proposals would be
feasible
413 Following the assembly of these packages tests were performed in an
attempt to maximise the value for money of each As a result of the
modelling adjustments to the necessary infrastructure and TSS were
made with pieces of infrastructure that appeared to offer low value for
money removed In addition some additional infrastructure thought
necessary to run the desired TSS was included The results of this
optimisation process were then used to generate five packages of
infrastructure works and TSSs (described below) that would form the
final sets of alternatives
414 In order to ensure that these alternatives were feasible the five
packages were then sense checked bearing in mind that the level of
design and testing is at a very high level and should any of the
alternatives be taken forward more detailed analysis would need to be
conducted Network Rail considered whether the optimised TSS were
feasible with the levels of infrastructure proposed and suggested
31
changes where necessary The results of this iterative and joint process
are presented below
Short-listed alternatives
415 There are five different alternative packages to HS2 covering three
hypothetical scenarios
Package P1 Alternative to HS2 Phase 1
Packages P2A and P2B Alternatives to HS2 Phase 2 (assuming
Phase 1 has been built) and
Packages YA and YB Alternatives to the HS2 full Y network
(Phases 1 and 2 combined)
416 Package P1 only includes upgrades to the West Coast Main Line
(WCML) In the other four packages a more extensive network is
covered with additions to services and infrastructure on the WCML
East Coast Main Line (ECML) Midland Main Line (MML) and some
Cross Country (XC) services
417 All packages look to implement infrastructure and train service changes
that provide extra capacity where it is needed particularly for
passengers as well as securing journey time savings where possible
Alternative to HS2 Phase 1
418 Package P1 considers alternatives to Phase 1 and took previous
alternative packages RP2 and 51M (an alternative developed by a group
of local authorities) as a starting point before considering the scope for
further refinements with the aim of better meeting the objectives of HS2
The primary deliverable of this alternative is to provide additional
capacity to the West Cost Mainline (WCML) by addressing
Train service frequency on the WCML lsquofastrsquo lines which would be increased to 16 trains per hour (tph) into London Euston
Additional capacity improvements delivered through assuming that
all Pendolino trains would be extended to 11 cars with the
reduction of one First Class carriage to Standard to increase the
number of seats and
Commuter capacity requirements by assuming all commuter
services are extended to 12 cars
32
419 The table below summarises the outcomes of these improvements in
terms of connectivity (measured by journey times) and capacity
(measured in all day seats) and compares them to HS2 It should be
noted that the journey times have not been subject to detailed modelling
or timetabling and so further work could lead to changes in assumed
journey time savings
Table 7 - Journey Times and Additional Capacity for Package P1 against the do-minimum
TRAIN JOURNEY PACKAGE P1 HS2 PHASE 1
Journey times (mins)
Journey time
saving (mins)
Journey times
Journey time
saving (mins)
London ndash Birmingham New Street
73 11 49 35
London ndash Manchester 122 5 100 27
London ndash Liverpool 126 5 106 25
WITHOUT SCHEME
ALL DAY SEATS
PACKAGE P1 ALL DAY SEATS
HS2 PHASE 1 MINIMUM
ALL DAY SEATS
Euston services
128200 216100 238600
Notes This represents the increase in weekday seated capacity arriving into London estimated for 2036 weekday timetable Source Atkins (2013) lsquoHS2 Strategic Alternatives Final Report 28 October 2013rsquo httpswwwgovukgovernmentpublicationsrail-alternatives-to-hs2 Appendix D
420 Package P1 delivers modest journey time improvements to locations on
the WCML The reductions are due to removing stops and some
performance allowances Additional capacity is also provided in this
package on both Long Distance High Speed (LDHS) as well as London
Midland services
421 HS2 however performs better in terms of total seats provided on the
west coast corridor with the opportunity to further reduce crowding on
the key flows from London Euston particularly on inter-city services It
also results in significantly greater improvements in journey times
between London and key conurbations than the packages of alternatives
thus performing better in meeting both the connectivity and capacity
objectives
422 Furthermore HS2 is not subject to the same operational constraints as
upgrades to the existing network The question of the quality of the
33
infrastructure capacity provided is reflected in its resilience and this is
crucially affected by the intensity of use of the railway While HS2
reduces usage of the fast tracks on the West Coast Main Line the P1
alternative intensifies usage This means that under the upgrade options
service reliability is unlikely to be better and may well be worse in
comparison to the situation today
423 The P1 upgrade alternative to Phase 1 entails a lot of disruption to the
existing network Indicative estimates suggest that while HS2 Phase 1
results in 223 weekend closures the Phase 1 alternative leads to 410
weekend closures which is almost double that for HS2
Alternatives to HS2 Phase 2
424 The following two packages are considered as alternatives to HS2
Phase 2 assuming HS2 Phase 1 has already been built and is in the do
minimum
Package P2A HS2 Phase 1 is built interventions on ECML MML
WCML and XC trains to Nottingham are routed via HS2 and
Package P2B HS2 Phase 1 is built interventions on ECML MML
WCML and XC trains to Nottingham are routed via ECML
425 In these packages where HS2 Phase 1 is built there is a reduced level
of investment in the WCML compared to Package P1 restricted to works
north of where HS2 re-joins the classic network In addition to HS2
Phase 1 these packages would deliver
Package P2A
A 9 train per hour timetable for long-distance ECML services with
all rolling stock assumed to be operated by 140mph capable IEP
sets and Leeds and Newcastle both having a 4tph service from
Kings Cross (the former with 2tph extending to Bradford and the
latter with 3tph continuing to Edinburgh)
Retaining a 6 train per hour long-distance service pattern on the
MML
Additional HS2 trains from London to Birmingham and Manchester
with a link enabling services from Euston to Sheffield Derby and
Nottingham
Additional classic line services on the WCML
34
Improvements to commuter services in particular frequency
improvements at the bottom end of the MML and frequency and
journey time improvements to Cambridge and
Additional Cross-Country services through Birmingham including
making use of Curzon Street and a short section of HS2 for
conventional IEP services to the East Midlands and beyond
Package P2B
426 Identical to Package P2A except for
An 11 train per hour timetable for long-distance ECML services and
Additional HS2 trains from London to Birmingham and Manchester
with a link enabling services from Euston to Sheffield and Derby but
not Nottingham
427 The journey time savings and additional capacity in these packages are
summarised in the table below
Table 8 Journey Times and Journey Time Savings for Package P2A Package P2B and HS2 Phase 2
TRAIN JOURNEY PACKAGE P2A PACKAGE P2B HS2 PHASE 2
Journey times (mins)
Journey time
savings (mins)
Journey times (mins)
Journey time
savings (mins)
Journey times (mins)
Journey time
savings (mins)
London ndash Nottingham 67 26 70 23 511 42
London ndash Leeds 96 30 96 30 82 44
London ndash Newcastle 141 14 141 14 138 17
London ndash Edinburgh 220 25 220 25 222 23
Birmingham ndash Nottingham 27 45 27 45 191 53
Birmingham ndash Leeds 73 49 73 49 55 67
Birmingham ndash Newcastle 129 70 129 70 127 72 1Journey time is to Toton Interchange station
Table 9 Additional Capacity for Package P2A Package P2B and HS2 Phase 1+ 2
TRAIN LINE WITHOUT SCHEME
ALL DAY SEATS
P2A ALL DAY SEATS
P2B ALL DAY SEATS
HS2 PHASE 1 + 2 MINMUM ALL DAY SEATS
Total 544500 611700 608100 652600
Notes The lsquowithout schemersquo comparator in this case includes HS2 Phase 1 Source Atkins (2013) lsquoHS2 Strategic Alternatives Final Report 28 October 2013rsquo httpswwwgovukgovernmentpublicationsrail-alternatives-to-hs2 Appendix D
35
428 Journey times are roughly the same to all destinations in both Packages
P2A and P2B The fact that HS2 Phase 1 is built in these packages
removes any journey time savings on the WCML
429 The greater quantity of trains running across the network increases
seated capacity particularly on long distance services This is expected
to result in corresponding reductions in crowding on most train services
despite significant increases in demand from the improved journey times
Capacity is also increased on HS2 in Package P2A as more trains use
Phase 1 as a quicker way to get to Nottingham
430 HS2 performs better in terms of total seats particularly on long distance
inter-city services It also results in significantly greater improvements in
journey times between London and key conurbations than the packages
of alternatives
431 As with the Phase 1 alternatives the quality and resilience of the rail
network is likely to be worse under the alternatives than for HS2 while
the levels of disruption during construction are significantly higher
Indicative estimates suggest that while HS2 Phase 2 by itself results in
163 weekend closures the Phase 2 alternatives lead to between 2380
and 2430 weekend closures which is more than ten times that for HS2
Alternatives to the Y Network
432 The Y network alternatives have been significantly redeveloped for this
update to the economic case to improve the extent to which they meet
the objectives of HS2 The alternatives address short-comings across
the West Coast Midland and East Coast Mainline and aspects of the
Cross Country Routes
433 The following two packages are considered as alternatives to the Y
network
Package YA No HS2 Phase 1 ECML high level of intervention
MML medium level of intervention other interventions on WCML
and XC and
Package YB No HS2 Phase 1 ECML medium level of intervention
MML high level of intervention other interventions on WCML and
XC
434 Packages YA and YB differ mainly in the level of investment in the
ECML versus the MML In package YA there is a greater level of
36
investment in the ECML and lower level on the MML while in package
YB the situation is reversed In addition to the Phase 1 alternative these
packages would deliver
Package YA
An 11 train per hour timetable for long-distance ECML services
with all rolling stock assumed to be operated by 140mph capable
IEP sets and with Nottingham and Sheffield served from Kings
Cross and Leeds and Newcastle both having a 4tph service from
Kings Cross (the former with 2tph extending to Bradford and the
latter with 3tph continuing to Edinburgh)
Retaining a 6 train per hour long-distance service pattern on the
MML
Improvements on the WCML as per alternative Package P1
Significant journey time and frequency improvements from
Birmingham to Derby Nottingham Sheffield Leeds York and
Newcastle and
Enhancements to commuter services
Package YB
435 Identical to Package YA except for
A 10 train per hour timetable for long-distance ECML services and
An 8 train per hour long-distance service pattern on the MML
436 The journey time savings and additional capacity obtained from these
packages are summarised in the table below
37
Table 10 Journey Times and Journey Time Savings for Package YA Package YB and HS2 Phase 2
TRAIN JOURNEY
PACKAGE YA PACKAGE YB HS2 Y NETWORK
Journey times (mins)
Journey time
savings
Journey times (mins)
Journey time
savings
Journey times (mins)
Journey time
savings
London ndash Birmingham
73 11 73 11 45 39
London ndash Manchester
122 5 122 5 68 59
London ndash Nottingham
70 23 73 20 511 42
London ndash Leeds
96 30 99 27 82 44
London - York 94 10 97 7 81 23
London ndash Newcastle
141 14 144 11 138 17
London ndash Edinburgh
220 25 223 22 222 23
Birmingham ndash Leeds
78 44 84 38 55 67
1Journey time is to Toton Interchange Station
Table 11 Additional Capacity for Package YA Package YB and HS2 Y-Network
WITHOUT SCHEME
ALL DAY SEATS
PACKAGE YA ALL DAY
SEATS
PACKAGE YB ALL DAY
SEATS
HS2 Y-
NETWORK
Total 434100 578800 569900 652600
Source Atkins (2013) lsquoHS2 Strategic Alternatives Final Report 28 October 2013rsquo httpswwwgovukgovernmentpublicationsrail-alternatives-to-hs2 Appendix D
437 In Packages YA and YB WCML destinations generally see journey time
savings of 5-10 minutes with destinations on the northern end of the
ECML observing journey time savings of 20-30 minutes Journey times
to ECML destinations as well as Nottingham are most improved in
Package YA some journey times to locations in the East Midlands are
lower in Package YB but others are higher (eg Derby and Leicester)
438 The difference in infrastructure enhancements across the two packages
can clearly be seen in the additional seated capacity Overall Package
YA delivers the bigger increase in capacity which subsequently result in
reductions in expected load factors except on London Midland services
439 HS2 however performs better against the connectivity and capacity
objectives It results in greater increases in the number of total seats
especially on long distance inter-city services which is unsurprising
given the cities which HS2 serves directly The same is true of journey
times with HS2 leading to higher journey time savings particularly
38
between London and the key cities For destinations not directly served
by HS2 the journey time improvements are smaller however in many
cases they are still higher than for the alternatives
440 The quality and resilience of the rail network will suffer significantly more
under the alternatives than under HS2 due to greater strain being placed
on the existing rail network while the levels of disruption caused are
significantly higher Indicative estimates suggest that while HS2 Phase 2
by itself results in 386 weekend closures the Y network alternatives lead
to between 2770 and 2790 weekend closures which is significantly
higher than that for HS2
Summary of Benefits
441 Breakdowns of the present value benefits (PVB) from the five tested
packages are presented in the table below
Table 12 Net Present Benefits of the Alternatives
poundbn (2011 PV)
HS2 PHASE 1 ALTERNATIVE
HS2 PHASE 2 ALTERNATIVES
HS2 Y NETWORK ALTERNATIVES
Benefit Package P1 Package P2A
Package P2B
Package YA
Package YB
In Vehicle Time
27 121 120 143 122
Access Walk
01 02 00 -01 -01
Wait 24 29 31 62 64
Interchange -04 08 06 -06 -05
Crowding 28 26 26 60 57
Car User Benefits
03 07 07 10 08
Loss of indirect tax
-05 -12 -12 -17 -16
Present Value Benefits
74 181 180 253 231
No reliability benefits are being claimed as part of journey time benefits
Benefits of Alternative to HS2 Phase 1
442 The benefits delivered by Package P1 are split almost equally between
journey time savings crowding benefits and reductions in waiting times
Despite the package including additional pieces of infrastructure it
delivers slightly less passenger benefits than a previous package termed
RP2 which was considered as an alternative in January 2012
39
Benefits of Alternatives to HS2 Phase 2
443 Packages P2A and P2B deliver roughly the same journey time benefits
(around pound12bn) but there are differences in the locations that these
benefits accrue to across the two packages The greater quantum of
trains running across the network has significant wait time and crowding
benefits in both packages and there are some interchange benefits
Benefits of Alternatives to the HS2 Y Network
444 Packages YA and YB deliver journey time benefits within the same order
of magnitude (pound12-14bn) but again there are differences in the locations
these benefits accrue to with YA further benefiting ECML destinations
Nottingham and Sheffield whereas YB generates more benefits for
other MML destinations There are significant wait time and crowding
benefits in both packages as well as slight interchange disbenefits
Summary of Costs
445 Each package of alternatives to HS2 has an estimated cost made up of
a capital cost covering the infrastructure and rolling stock (trains) and an
operating cost of running and maintaining the rolling stock and railway
446 Estimates of the construction cost of the packages were developed by
Network Rail in collaboration with industry experts The costs were
estimated using a series of high level unit rates representing the early
stage of development these schemes are in
447 The construction cost of each scheme includes allowances for scheme
design contractor preliminaries and project management loss of
revenue from disruption to the rail network and land costs To reflect the
relatively low level of design and development of these costs optimism
bias has been included at a rate of 66 as advised by the Departments
WebTAG guidance for projects at this stage of development
448 The additional rolling stock required for each of these schemes can be
purchased and treated as capital costs or leased to form a component
of the operating costs In order to provide the greatest consistency with
HS2 rolling stock is assumed to be purchased in all packages However
a sensitivity test has been conducted where rolling stock is leased as
this is the standard approach for UK railways This increases the total
40
cost of the schemes by roughly 10-20 overall Further sensitivity tests
can be seen in the Atkins report36
449 Operating costs have been estimated for each scheme The Department
has reviewed the level of optimism bias applied to classic line operating
costs In carrying out this review the aim has been to better reflect the
quality of the evidence on which they are based As a result differing
levels of optimism bias are applied to different elements of operating
costs ranging from 16 to 30 The overall level of optimism bias is
lower than for high speed trains reflecting the better relative
understanding of aspects of conventional rolling stock in the UK
450 There are two main cost items which have not been included for the
strategic alternatives packages but are included in HS2rsquos costs
infrastructure maintenance and station costs However these omissions
are expected to be small in relation to the overall package cost
Table 13 Cost of the Alternatives
poundbn (2011 PV) HS2 PHASE 1 ALTERNATIVE
HS2 PHASE 2 ALTERNATIVES
HS2 Y NETWORK ALTERNATIVES
Cost Package P1 Package P2A
Package P2B
Package YA
Package YB
Construction Costs 19 102 105 123 107
Rolling Stock Purchase Costs
14 19 18 27 27
Operating Costs 62 89 83 117 113
Total Cost 95 210 206 267 247
451 Operating costs make up two thirds of the total cost of Package P1 this
is unsurprising given the greater frequency of train services and
lengthened trains included in the package The total costs are not
directly comparable with the latest estimate of RP2 since rolling stock
was assumed to be leased not purchased as is shown above
452 In the remaining four packages costs are split almost equally between
construction and operation This corresponds to a higher number of
schemes included in these packages as well as some larger
infrastructure enhancements The scheme with the highest cost is
Package YA This is in part driven by an extensive package of upgrades
on the ECML
36 Atkins (2013) lsquoHS2 Strategic Alternatives Final Report 28 October 2013rsquo httpswwwgovukgovernmentpublicationsrail-alternatives-to-hs2
41
Benefit Cost Ratio
453 The table below brings together the costs and benefits of the five
packages and presents their benefit cost ratios
Table 14 Costs and Benefits of Alternatives and resulting initial BCR
poundbn (2011 PV) HS2 PHASE 1 ALTERNATIV
E
HS2 PHASE 2 ALTERNATIVES
HS2 Y NETWORK ALTERNATIVES
Package P1 Package P2A
Package P2B
Package YA
Package YB
Net Transport Benefits (PVB) (poundbn)
74 181 180 253 231
Total Cost (poundbn) 95 210 206 267 247
Revenue (poundbn) 53 120 121 169 161
Net Costs to Government (PVC) (poundbn)
43 90 85 98 86
Benefit Cost Ratio 17 20 21 26 27
Wider Economic Impacts (poundbn)
11 41 40 54 51
Benefit Cost Ratio with WEIs
20 25 26 31 33
454 All of the packages have a benefit cost ratio (including WEIs) higher than
2 The Phase 1 alternative is categorised as providing medium value for
money whilst all other packages provide high value for money 37
Packages YA and YB both have benefit cost ratios greater than 3 when
including WEIs
455 Package P1 has a lower benefit cost ratio than RP2 (401 when
assessed in January 2012) This has been driven by changes to both
the estimated costs and benefits On the cost side a more robust
approach to estimating rolling-stock capital costs and additional service
provision in Package P1 have increased the costs The updated
modelling framework (PfM v43) suggests less mode shift results from
the intervention leading to lower estimates of transport user benefits
and revenue generation
456 There are only minor differences between the benefit cost ratios of
Packages P2A and P2B as well as Packages YA and YB However it is
important to point out that there are differences in the locations that
these benefits accrue to across the packages Other considerations
such as deliverability could differ between YA and YB
37 BCR for Package 1 is 199 so is formally classified as offering medium value for money
42
Sensitivities
457 Estimating the future costs of infrastructure schemes rolling stock and
operations is challenging It is important to acknowledge uncertainty
around what might happen in the future and to understand the impact
this could have on the results of the appraisal Nevertheless the earlier
stage of development of the alternative options justifies a less detailed
approach to considering uncertainty than that of HS2 Focus is therefore
on the key sensitivities likely to influence the results and justifications for
those which have been conducted are provided below
458 The following four sensitivities have been carried out to investigate the
robustness of the value for money conclusions
Sensitivity 1 ndash rolling stock is assumed to be leased
Rolling stock was assumed to be purchased in the appraisal to be
consistent with HS2 allowing the benefits costs and BCRs to be
compared However were these schemes to be implemented it is
highly likely that additional rolling stock would be leased not
purchased We therefore need to understand the implications this
would have on the value for money
Sensitivity 2 ndash a 25 increase in the schemes capital costs
The infrastructure schemes which make up the packages of
alternatives are at a very early stage of development It is therefore
possible that once further design and development work is carried
out the cost of these schemes could increase This sensitivity is
intended to assess whether the packages of alternatives still
represent value for money in this scenario
Sensitivity 3 ndash higher rates of optimism bias equal to those applied
to high speed trains are applied to operating costs38
To assess whether the alternatives represent value for money if
there is more uncertainty surrounding operating costs than is
currently applied
Sensitivity 4 ndash combines sensitivities 2 and 3 above
459 The table below shows the central case BCRs and how these change in
each of the sensitivity tests
38 The exact rates and a comparison to those used in the central case can be found in the
Atkins report
43
Table 15 Benefit Cost Ratios for Sensitivity Tests
HS2 PHASE 1 ALTERNATIVE
HS2 PHASE 2 ALTERNATIVES
HS2 Y NETWORK ALTERNATIVES
Package P1 Package P2A
Package P2B
Package YA
Package YB
Central Case 17 20 21 26 27
Sensitivity 1 12 16 16 18 19
Sensitivity 2 16 16 16 20 20
Sensitivity 3 15 19 19 23 23
Sensitivity 4 14 15 15 18 18
460 In all of the sensitivity tests the benefit cost ratios remain above 1 that is
the benefits of the schemes remain higher than the costs
461 In sensitivity 1 where rolling stock is assumed to be leased both YA and
YB are categorised as medium rather than high value for money The
BCRs of the remaining packages are also lower than in the central case
Sensitivities 2 and 3 result in small changes to the BCRs of all packages
but these do not change the value for money conclusions It is only when
higher than expected capital costs are combined with a higher
uncertainty around operating costs that there are significant implications
for the value for money of the schemes
Conclusion
462 The alternatives to HS2 offer means of providing more capacity on the
rail network while also generating high value for money particularly the
Y-Network alternatives which generate BCRs above 30 While there are
alternatives to HS2 worth considering they are not as effective at
meeting the objectives of the scheme and are likely to be particularly
disruptive The analysis indicates they are likely to
Be unable to provide as much extra capacity for passengers
Lead to significant levels of disruption to passengers during
construction
Are likely to worsen resilience or performance reliability and
Be unable to offer the same level of journey time savings as HS2
463 HS2 in contrast is likely to result in a substantial improvement in the
resilience and performance reliability of the network by relieving the
pressure on the WCML of the fastest intercity services It will result in
substantially larger journey time savings on key inter-city routes while
minimising the level of disruption to rail users during construction and
providing a greater uplift in capacity than the alternatives
44
5 HS2 ndash robustness of Economic Case
Introduction
51 The reference case specifies the costs and benefits of HS2 assuming
one particular future state of the world This state of the world contains
assumptions about external factors such as GDP population energy
costs and the relationship between these variables and levels of rail
patronage decades into the future as well as variables currently within
our control such as scheme costs and train timetabling
52 The lsquoreference casersquo is based on the standard assumptions and
approaches specified in WebTAG guidance which provides advice on
best practice for conducting analysis of the impacts of transport
infrastructure investment The guidance has been developed over many
years and has benefited greatly from the UKrsquos long tradition of applying
cost benefit analysis to transport infrastructure investment proposals
Nevertheless the lsquoreference casersquo presents one potential outcome from
many possibilities
53 Forecasting such a long way into the future is inherently challenging it is
particularly important to understand the uncertainty attached to those
factors which will have the greatest impact on the appraisal In the case
of HS2 as with many transport investments this means understanding
in particular the impact of a range of different assumptions about
economic growth growth in demand for rail travel construction costs
and the valuation of time savings
54 An assessment of the resilience of the economic case to a range of
different assumptions associated with these factors has been conducted
using the standard assumptions underpinning the lsquoreference casersquo
outlined in Table 6 as the starting point This analysis captures the
range of benefit cost ratios that could result from combinations of
different assumptions and is based on an understanding of the
probability of different events occurring While it cannot capture all
possible outcomes because there are some events which cannot be
described in terms of probabilities in this way it does provide a
systematic way of assessing the range of different outcomes that could
occur
55 The analysis focuses on the key variables which influence the Economic
Case for HS2 identified as having the largest potential impact and those
45
which are subject to the greatest levels of uncertainty The variables
which meet this criteria are
Future GDP
Values of Time
Approach to capping demand39
Competition and regulation on HS2
Capital Costs
Responsiveness of Rail Demand to changes in GDP and the cost of
rail travel
Reliability benefits
Future cost of travelling by alternative modes of transport
Rail Fares
56 Analysing the uncertainty within each of these variables requires
different approaches This may be because certain techniques are more
suitable for some variables than others or because the information does
not exist to adopt certain methods in particular cases
57 The techniques for assessing risk and uncertainty can be distinguished
into two main approaches Risk analysis allows us to quantify the
combined impact of a number of different risks at the same time giving
us the probability of different overall outcomes Sensitivity tests are used
to obtain an appreciation of the likely impact of individual events
compared to the reference case and are particularly useful for binary
events or variables about which we have limited information on the likely
distribution of outcomes
Risk Analysis
58 Risk analysis lends itself towards variables which can take a range of
different values and for which the possible values can each be judged to
have a specific probability of occurring For example future GDP growth
can take a range of values and statistical techniques can be used to
identify the expected probability of different values occurring based on
historic information and the past performance of the forecasting tools
39 The HS2 reference case assumes that there is no demand growth beyond 2036 demand
is essentially capped in this year
46
used Uncertainty around the precise values for important parameters
such as the impact of GDP on travel demand has also been reflected
59 The key factors considered within the risk analysis are40
Short-term GDP growth (2012-2017)
Long-term GDP growth (2017 onwards)
The responsiveness of rail demand to changes in GDP
The responsiveness of rail demand to changes in the cost of rail
travel
Construction costs
The non-work value of time41
510 The chart below presents the results of the risk analysis for the appraisal
of the Y-Network The distribution of outcomes has been mapped
against the Departmentrsquos value-for-money categories enabling
comparison against other schemes It clearly indicates that taking
account of the sources of uncertainty which have been represented here
(as listed above) there is very little chance of the Benefit Cost ratio
falling below 15 with the expected outcome being a BCR between 20
and 25 In other words even in an unlikely scenario where construction
costs are at their upper limit and long-term GDP growth is the low end
of the range the BCR remains above unity
511 The BCR is most sensitive to the GDP growth rate forecast The more
optimistic the economic outlook is the greater probability of a larger
BCR The BCR is resilient to even extremely low forecast rates of long-
term GDP growth of between 125 and 200 per annum in the
majority of cases where GDP growth is between 125 and 200 per
annum the BCR remains greater than 175
40 Further details of the risk analysis undertaken here can be found at httpwwwhs2orguknews-resourceseconomic-documents 41 Testing the resilience of the Economic Case to different assumptions regarding the Business Value of Time is considered elsewhere
47
Figure 7 ndash Y-Network distribution of Benefit-Cost Ratios
512 This analysis has also been applied to Phase 1 of the scheme
separately as shown in the diagram below While the distribution of
potential outcomes has shifted somewhat to the left (reflecting the lower
reference case BCR) this aspect of the scheme is still robust to a wide
range of outcomes In more than 75 of cases the BCR of Phase 1
represents medium value for money or better
Figure 8 ndash Phase 1 distribution of Benefit-Cost Ratios
48
Extensions to standard assessment
513 HS2 is unlike most other transport schemes It is a project with high up-
front capital investment producing benefits over a very long life-span
There are therefore certain standardised assumptions used in the
standard economic assessment that have a substantial impact on the
BCR for which alternative and potentially reasonable approaches exist
514 To understand this further specific tests were undertaken on the impact
of different assumptions most notably levels of demand forecasts
construction costs and different valuations of time savings This shows
how alternate but reasonable assumptions which have been tailored to
the unique characteristics of high speed rail could alter the results
Business Value of Time
515 Business Travel Time Savings contribute a significant proportion of the
transport user benefits of the scheme As noted previously the values
used to estimate the benefits to business travellers from travel time
savings have been altered in this appraisal to reflect more recent data
on the incomes of business passengers
516 The valuation of travel time savings should reflect peoplersquos willingness-
to-pay for quicker journeys Over the last year the Department has
undertaken a comprehensive review of different approaches for deriving
this willingness-to-pay for business travellers This has included
updating the values in WebTAG with the most recent available data and
comparing those updated values with the existing evidence base of
values from alternative approaches42
517 The comparison of values resulting from different approaches is shown
in the chart below While the assumptions and methods vary between
approaches they are all aiming to estimate the same thing what
businesses would be willing to pay for travel time savings The wide
range in the values presented in the chart both within and between
approaches demonstrates the variability and uncertainty around what
businesses would be willing to pay for travel time savings However the
updated values given in WebTAG of around pound32hour for rail travel are
firmly towards the centre of this range and therefore the Department
has concluded that these values are a suitable representation of
businessesrsquo willingness-to-pay
42 httpswwwgovukgovernmentpublicationsvalues-of-travel-time-savings-for-business-travellers
49
Figure 9 ndash Business values of time implied by different methodologies
518 However when considering values of time for high speed rail schemes
the study concluded that lsquothe evidence does seem to support a business
valuation in excess of the wage ratersquo While there may be good reason
to believe that the Business Value of Time applied to high speed rail
should be higher than that specified in WebTAG we have tested the
robustness of the Economic Case to values both higher and lower than
those in the lsquoreference casersquo
519 To create a lsquohigh value of timersquo scenario the WebTAG 2013 standard
business value of time for rail users has been increased by 4043 This
is consistent with the conclusion in the ITS Leeds (2013) report which
suggests that across their sample of High Speed rail specific studies the
value of time was on average 50 higher than the wage rate while for
UK specific studies this figure was 40
520 There are a relatively limited number of High Speed rail specific studies
so a low business value of time scenario is also considered which takes
account of the wider evidence for the willingness to pay for travel time
savings across all rail travel It therefore assumes that high speed rail
passengers have similar values of time to other rail passengers a
conclusion currently at odds with the existing evidence as noted above
and therefore conservative Evidence presented in the ITS Leeds (2013)
43 Note this is actually lower than the 25 increase on the WebTAG 2012 values proposed
by the study The non-work values have also been varied according to time savings by trip length (as the standard value is averaged across trip length)
50
study suggests applying a figure 20 lower than the WebTAG 2013
values of time
521 The charts below indicate the robustness of the Economic Case for the
Y-Network to the two alternative values of time considered The
Economic Case appears robust to the low scenario with the BCR above
one in all cases considered If the high value of time was adopted then
the BCR is most likely to lie above 3 for the full network
Figure 10 Y-Network distribution of Benefit-Cost Ratios across alternative Business Values of Time
0
5
10
15
20
25
30
35
40
Like
liho
od
Full network - BCR with WEIs (ratio) 2011 PricesPV
Higher willingness to pay for long journeys
Poor VfM
Low VfM
Medium VfM
High Value for Money
0of sample
0of sample
06of sample
951of sample
Very high VfM
43of sample
0
5
10
15
20
25
30
35
40
Like
liho
od
Full network - BCR with WEIs (ratio) 2011 PricesPV
Low Value of Time Scenario
Poor VfM
Low VfM
Medium VfM
High Value for Money
0of sample
33of sample
504of sample
464of sample
Very high VfM
0of sample
ndash
51
Demand Cap
522 The Demand Cap is an important albeit arbitrary assumption that has a
significant influence on the benefits of HS2 Essentially demand is
capped in this appraisal at a specific level which occurs in 2036 in the
reference case Beyond 2036 it is assumed that demand for rail travel
whether High Speed or otherwise is constant and fares no longer grow
at a rate above inflation This represents growth of just 47 in long
distance rail trip rates per person compared to todayrsquos levels
523 Rail demand has in fact grown very strongly over the last 20 years and
even during the recession it has shown little sign of slowing In the
decade from 2002 to 2012 the annual growth in long distance rail travel
was 52 The diagram below compares the forecast of long distance
rail demand used in this appraisal against a continuation of recent trends
in long distance demand clearly indicating that relative to recent trends
our forecasts are conservative particularly when also applying a cap on
demand in 2036
Figure 11 ndash Long distance rail demand forecasts
52
524 Subsequent to the last iteration of the HS2 Economic Case the
Department has conducted an external research project into the
specification of a demand cap for rail projects titled lsquoSpecifying the
Demand Cap for Railrsquo44 This project emphasised the need for a demand
cap to reflect the inherent uncertainty in rail demand forecasting as well
as to allow consistency across the appraisal of interventions However it
uncovered no empirical evidence which could help in determining an
appropriate demand cap specification
0
10
20
30
40
50
60
Like
liho
od
Full network - BCR with WEIs (ratio) 2011 PricesPV
Demand growth stops at 2040
Poor VfM
Low VfM
Medium VfM
High VfM
0of sample
02of sample
37of sample
952of sample
Very high VfM
1of sample
525 To reflect the nature of the demand cap which is being implemented its
apparent conservatism particularly when accounting for recent trends in
rail demand and to recognise the range of alternative approaches that
exist the Economic Case for HS2 has been tested against alternative
options for specifying the demand cap
526 HS2 Ltd has replicated its risk analysis assuming different levels of
demand cap45 which indicates that the downside risk from reducing the
demand cap is smaller than the potential for upside gain if the demand
cap were increased (see figure 12 below) This distribution is to be
expected since events occurring closer in time are more certain and
therefore have lower levels of uncertainty attached to them than events
further into the future
Figure 12 - Y-Network distribution of Benefit-Cost Ratios across different Demand Cap assumptions
44 Bates Worsley Wardman Nash amp Preston 2013 Specifying the Demand Cap for Rail httpswwwgovukgovernmentuploadssystemuploadsattachment_datafile251609specifyi ng-the-demand-cap-for-railpdf 45 The risk analysis assumes that the fares cap which ordinarily is applied at the same year as the demand cap is fixed at 2036
53
0
10
20
30
40
50
60
Like
liho
od
Full network - BCR with WEIs (ratio) 2011 PricesPV
Demand growth stops at 2027
Poor VfM
Low VfM
Medium VfM
High VfM
02of sample
666of sample
329of sample
04of sample
Very high VfM
0of sample
527 These results however should be treated with caution If demand
continued to grow further into the future then higher crowding would
result both in the without scheme scenario against which HS2 and the
Strategic Alternatives are compared and the scenario which includes
HS2 One would expect that changes to capacity would be considered
and that both infrastructure provision and subsequently benefits and
costs would change accordingly Accounting for this in the analysis
could alter the BCR both positively or negatively although it is unclear to
what extent
Construction Costs
528 Section 3 described a range of cost estimates for the construction of
HS2 These range from the HS2 Ltd target price at the lower end up to
the entire provision for funding agreed with HM Treasury
529 The costs used in the reference scenario follow Green Book guidance
and include an expected or average level of contingency allowances
Because of their influence over the benefit cost ratio we have also
examined what happens if construction costs are adjusted both upwards
and downwards
530 We have considered the distribution of cost outcomes alongside other
elements within the risk analysis The impact upon the central BCR for
phase 1 is indicated in table 16 below
54
Table 16 ndash Impact on Phase 1 BCR of differing QRA rates
APPROACH QRA TARGET
PRICE
QRA lsquoP50rsquo QRA lsquoP95rsquo
contingency 10 24 37
Contingency poundbn (2011
PV)
16 37 575
BCR without WEIs 16 14 13
BCR with WEIs 19 17 15
Source DfT calculations using HS2 Ltd appraisal outputs Numbers may not add due to rounding Monetary values are expressed in poundbn (2011 prices)
531 In addition to these central case estimates figure 13 below indicates the
distribution of benefit cost ratios for phase 1 according to the level of
construction costs It indicates that there are significant opportunities to
improve the value for money of HS2 through engineering efficiencies
and robust cost controls At the same time it should be noted that if
unexpected events lead to costs reaching the agreed funding provision
alongside a number of other downside risks materialising the benefit
cost ratio would remain above one
55
Figure 13 ndash Distribution of Phase 1 BCRrsquos for differing construction cost
Low6
Low21
Low46
Medium61
Medium71
Medium51
High33
High8 High
2
0
10
20
30
40
50
60
70
80
90
100
Target price P50 P95
Like
liho
od
Construction cost
Phase 1 - Likelihood of Value for Money
Poor
Low
Medium
High
Very high
Value for Moneycategory
Construction cost scenarios
estimates
532 The equivalent estimates for the entire network are provided in figure 14
below This represents a worst-case scenario where both phase 1 and
phase 2 cost estimates reach their upper bound ie pound214bn (2011
prices) for phase 1 and pound212bn (2011 prices) for phase 2 In this
scenario the BCR of the Y-network would fall by approximately 03 to
around 20 (including wider economic impacts)
56
Figure 14 - Distribution of Y-Network BCRrsquos for differing construction cost estimates
Low1
Low2
Medium19
Medium45
High81
High53
0
10
20
30
40
50
60
70
80
90
100
P50 P95
Like
lihoo
d
Construction cost
Full network - Likelihood of Value for Money
Poor
Low
Medium
High
Very high
Value for Moneycategory
Construction Cost Scenarios
Sensitivity tests
533 In addition to examining the Demand Cap and Business Value of Time
specific sensitivity tests have been employed to assess the robustness
of the Economic Case in certain cases where risk analysis is
inappropriate The most relevant tests applied are those testing the
impact of different assumptions regarding the cost of other modes rail
fares and the quantification of reliability benefits
Cost of other modes
534 One would expect the cost of alternative modes to alter the
attractiveness of travel by rail and therefore HS2 If the costs of road or
air travel fall they become relatively more attractive modes and one
would expect travellers to transfer from rail to road or air travel HS2 Ltd
have tested the sensitivity of rail demand to both higher and lower
energy costs46 with higher energy costs the cost of fuel rises and
therefore the cost of road and air travel also increases
535 These tests have shown that the sensitivity of the BCR for HS2 to
changes in energy costs is marginal with the transport user benefits
only increasing by approximately 1 under the high energy cost
scenario and falling by just less than 1 in the low energy cost scenario
46 These are based on the energy cost scenarios generated by DECC details of which can be found here httpswwwgovukgovernmentorganisationsdepartment-of-energy-climate-changeseriesenergy-and-emissions-projections
57
Fares
536 Fares tests are difficult to interpret due to the fact that the demand cap is
set at a particular level of demand and fares are also capped at this
point Increasing fares reduces demand but since ultimately the same
level of demand is reached the longer period of higher real revenue
growth outweighs the demand impact In the case of Phase 1 increasing
real fares by RPI+2 per annum from 2020 until the demand cap is
reached (rather than RPI+1 as used in the reference case) increases
the BCR (excluding Wider Economic Impacts) to 19 from 14 previously
while for Phase 2 this BCR increases to 29 from 18 previously
537 When the level of fare increases is reduced (to RPI + 0 from 2020 until
the demand cap is reached after which point fares rise at a rate
equivalent to the GDP deflator) the effect is the opposite with the
reduction in revenue significantly outweighing any impact on transport
user benefits and therefore the BCR falls For Phase 1 the BCR
(excluding Wider Economic Impacts) is now 13 compared to 14
previously and for the Y-network it falls from 18 to 16
Reliability
538 Benefits resulting from improvements in reliability are calculated on the
basis of the expected reduction in the average minutes of lateness which
are then converted into journey time savings in an approach consistent
with the Passenger Demand Forecasting Handbook This improvement
in reliability also translates into an increase in the demand for the High
Speed services
539 While it is likely that HS2 will deliver significant improvements to
reliability and the assumed forecast delay on HS2 services is consistent
with international precedent until services operate the level of reliability
benefits is somewhat uncertain Removing reliability benefits from the
appraisal reduces the BCR (without Wider Economic Impacts) of Phase
1 to 12 and for the Y-Network it falls to 15 This however represents an
extreme lower bound of the risk in this area as reliability benefits are
expected to exist the uncertainty relates to their likely scale
Threats and Opportunities
Competition and Regulation on HS2
540 The operational characteristics and regulatory environment in which HS2
might operate are as would be expected at this stage in scheme
development undetermined HS2 Ltd has begun to investigate how
different operating environments and responses by train operators may
impact on the Economic Case Initial work has considered how
58
competition between HS2 operators and those on existing networks
might influence pricing decisions under the current fare regime
541 The analysis indicates that conventional rail operators may have the
incentive to reduce fares to capture market share from HS2 thus
potentially limiting the scope for HS2 to set higher fares Whilst
reductions in fares on conventional rail will reduce the revenue on HS2
this will be broadly off-set by an increase in revenue on the existing rail
network The full implications on value for money are uncertain as the
models do not attempt to estimate passenger benefits However the
revenue impacts do not suggest anything which would alter the value for
money conclusions
542 It is important to note that this work is in its early stages and subject to
significant further analysis
Impact of HS2 on Economic Geography
543 The standard approach to estimating impacts of transport schemes as
adopted throughout this Economic Case seeks to capture the impacts
on business as well as wider society This includes amongst other
things the benefits to business travellers from faster journeys and
reduced crowding as well as the value of increased production and the
benefits to company efficiency from being closer together The economic
appraisal calculates net national impact and cannot be used to analyse
sub-national impacts
544 With advice from an independent panel of experts HS2 Ltd has
undertaken a programme of work to help us understand the scale of the
potential economic benefits of HS2 and how they might be spread
across the country47 This work complements the standard assessment
of economic impacts described
545 This work looks at the potential benefits of HS2 in a different way to this
Economic Case by examining how improvements in connectivity would
increase competitiveness of areas outside of London and change the
future pattern of growth The results from this new analysis suggest that
HS2 could increase economic output by between pound8bn and pound15bn per
year48 and that whilst all regions benefit the city regions in the Midlands
and the North do particularly well
546 This is the first attempt to measure economic impact in terms of
productivity and location effects and results should be considered
47httpassetshs2orguksitesdefaultfilesinsertsHigh20Speed20Rail2C20Transport 20Investment20and20Economic20Impactpdf
48 Results are modelled for 2037 and reported in 2013 prices
59
provisional HS2 Ltd will continue to refine this work and further develop
the evidence in this area but this study represents a significant
development and should be seen as a complement to (not a substitute
for) the scheme appraisal presented in this Economic Case Given
fundamental differences in approaches results are not directly
comparable and are in no way additive but this work suggests that
there may be important economic benefits not captured within the
current appraisal of HS2 These are particularly relevant and have the
potential to be significant in the case of a transformational scheme such
as HS2
Existing Rail Network
547 Assumptions about the future of the existing rail network play an
important role in assessing the costs and benefits of HS2 There are two
key areas of relevance
The nature of the classic rail network if HS2 was not constructed
lsquothe without schemersquo scenario ndash this allows comparison between
HS2 and a scenario in which HS2 is not built and
The train service specification (TSS) on the existing network if HS2
is built
548 This appraisal uses a lsquowithout schemersquo scenario based on lsquocommitted schemes only largely those described in the Departmentrsquos 2012 High
Level Output Specification49 While further improvements to the existing
network could be expected throughout the 2020s and 2030s it would be
inappropriate to speculate what these may be particularly as future
investment may complement rather than compete with HS2 The
inclusion of further investment could improve or worsen the case for HS2
depending on the extent to which it is complementary or otherwise
549 As long distance services transfer onto HS2 capacity will be created on
the existing network to introduce different services There are many
options for making best use of this released capacity including extra
commuter and freight trains and other regional and local services that
would otherwise be impossible to run The HS2 economic case relies
upon assumptions about the train service specification (TSS) on the
classic rail network when HS2 opens however this represents one
possible set of assumptions used for business case modelling purposes
There are many other potential combinations of released capacity
49 High Level Output Specification 2012 httpswwwgovukgovernmentpublicationshigh-level-output-specification-2012
60
550 Further work will be undertaken to optimise the use of released capacity
as the project develops in accordance with the set of principles
described in the Strategic Case for HS250 The finalisation of the TSS
will be expected to impact on the value-for-money of the scheme and the
extent of the upside or downward risk is dependent upon how well the
final TSS matches demand for rail services
Calculation of scheme benefits
551 HS2 Ltd has calculated user benefits using the lsquorule of a halfrsquo 51
Depending on the nature of demand it is possible for this assumption to
lead to either an underestimate or an overestimate of the benefits to
passengers This is not unique to HS2 and this uncertainty around the
accuracy of the lsquorule of a halfrsquo approximation exists in all transport
appraisals particularly on projects which offer large journey time savings
It is to be noted however that alternative methods exist which can
generate lower benefits although these are less commonly used poorly
understood and subject to their own uncertainty
Scheme opening date
552 Phase 1 of HS2 is currently scheduled to open during 2026 while Phase
2 of the scheme is scheduled to open in 2033 There remain risks to
these delivery dates which range from passage through a complex
Parliamentary approvals process to the engineering work required being
delivered on time
553 Were the delivery of HS2 to be delayed it would likely increase scheme
costs and could alter scheme benefits and revenues The scale of the
impact on the Economic Case would depend on the nature of the delay
and the implications for the resulting profile of costs revenues and
benefits over time
554 Delay might itself lead to higher costs than would otherwise be the case
Preliminary work suggests that a delay to the Hybrid Bill process (for
example for one year) could result in inefficient delivery due to the
nature of the HS2 Ltd corporate and indirect cost structure which could
result in perhaps pound100m of additional costs above current estimates
50 Department for Transport (2013) lsquoThe Strategic Case for HS2rsquo httpswwwgovukgovernmentpublicationshs2-strategic-case 51 The rule of half estimates the changes to consumer welfare (in this case the welfare of
transport users) resulting from changes in supply assuming a constant demand curve
61
6 Value for Money Assessment
Introduction
61 The Economic Case needs to reach a conclusion on whether the
scheme represents good value for taxpayersrsquo money This requires
comparing HS2 against a ldquowithout schemerdquo reference case in order to
assess the economic social environmental and public account impacts
that a transport intervention may incur The analysis presented in
Sections 3 and 5 allows such conclusions to be drawn and the
Departmentrsquos WebTAG guidance provides a framework for doing so
62 In order to allow comparison across schemes WebTAG specifies value
for money categories within which schemes can be placed and the table
below describes these categories
Table 17 ndash Value for Money Categories
VALUE FOR MONEY CATEGORY
BENEFIT COST RATIO
Poor Less than 10
Low Between 10 and 15
Medium Between 15 and 20
High Between 20 and 40
Very High Greater than 40
63 As previously discussed the long-term forecasting horizon required
when considering a project such as HS2 combined with its inherent
scale and complexity limits the ability of a single lsquoreference casersquo BCR
to generate informative conclusions on the value for money of the
scheme It is appropriate therefore to consider how robust the Economic
Case for HS2 remains across a range of possible future scenarios and
therefore draws heavily on the analysis in Section 5
64 Not all potential scheme impacts can be assessed in monetary terms
and of those that can we have more robust evidence for the
monetisation of some impacts than others In assessing value for money
WebTAG recommends using a three stage approach
We start with those impacts where the evidence for the
monetisation is robust We call the resulting BCR the ldquoinitialrdquo BCR
62
We then add those impacts where monetisation is possible but
where the evidence for doing so may not be as robust The
resulting BCR is called the lsquoadjusted BCRrsquo
Finally those impacts for which it is not possible to provide
monetary values are accounted for in a qualitative manner and the
potential ability for these impacts to shift the value for money
category is assessed
65 The table below presents the categories within which the assessment of
differing impacts are ordinarily placed Even within these categories the
robustness of the analysis can vary for example the quantification of
Wider Economic Impacts is considered more robust in this assessment
than landscape impacts
Table 18 - Three stage approach to monetisation of impacts
Initial BCR robust monetisable impacts
Adjusted BCR less robust but monetisable impacts
Judgement whether non-monetised impacts could shift value for money assessment
Travel Time Savings
Crowding benefits
Noise
Air Quality
Greenhouse Gases
Physical Activity
Accidents
Indirect Tax Revenue
Reliability
Wider Economic Impacts
Landscape
Townscape
Heritage of Historic Resources
Biodiversity
Water environment
Security
Access to Services
Affordability
Severance
Option Values
Notes Note that in the economic case for HS2 the reliability benefits have been recorded in
the initial BCR to ensure consistency with previous versions of the economic case This
differs from the treatment recommended in WebTAG Nevertheless paragraph 539 provides
an approximate BCR if reliability benefits are removed
Does the scheme represent lsquovalue for moneyrsquo
66 Table 6 presents the lsquoinitial BCRrsquo for the lsquoreference casersquo for both Phase
1 and the Y-Network It indicates that excluding Wider Economic
Impacts leads to an initial BCR of 14 for Phase 1 and 18 for the Y-
Network
67 Including WEIs provides a BCR of 18 for Phase 1 and 23 for the Y-
Network As noted previously point estimates are unable to demonstrate
the uncertainty inherent within consideration of a project such as HS2 It
63
is therefore imperative to consider how robust these BCR estimates are
to changes in both the external and internal environment
68 The economic analysis of HS2 described in Section 5 suggests that
taking account of certain key sources of uncertainty there is a low
probability that the BCR for the Y-Network will fall below 15 Only in a
very limited number of scenarios where there is an unexpected
prolonged series of low economic growth (averaging 125 to 2 per
annum over the entire appraisal period) combined with the upper range
of cost estimates and pessimistic views on other key variables does the
BCR drop below 15 The most likely outcome taking into account
uncertainty that can be quantified is that the BCR for the Y-Network
represents high value for money with a BCR above 20
69 The Economic Case for Phase 1 has a most likely outcome of
medium value for money with a BCR above 15 however there is a
small likelihood that this could fall into low value for money The
conclusions for Phase 1 and the Y-Network are consistent with the BCR
implied by the lsquoreference casersquo
610 The case for the scheme is strong using the standard tools and
methodology as expressed in WebTAG however as shown in Section 5
using alternative but plausible assumptions on the values of time and
demand capping in particular could make the Economic Case stronger
Furthermore consideration of other factors such as the impact of HS2
on Economic Geography may improve the case even further
Landscape impacts
611 Landscape impacts consider the effects of a scheme on the visible
features of a landmass combined with the physical and cultural aspects
of the land itself Any valuation of something which is intangible such as
landscape is challenging and while the Department has used the best
available methods to quantify landscape impacts the assessment
remains sensitive to a key set of underlying assumptions The monetised
assessment should therefore not be considered a substitute for the
detailed landscape assessment conducted in the Environmental
Statement52
612 The Landscape impacts have been estimated at pound10bn for Phase One
and pound29bn for the Y-Network (Present Value 2011 Prices) which would
reduce the BCR in both cases by 01 Whilst these estimates provide a
useful indication of the potential scale of landscape impacts sensitivity
52 HS2 Phase One Environmental Statement httpswwwgovukgovernmentcollectionshs2-phase-one-environmental-statement-documents
64
tests show that the plausible range on these values is extremely large
and therefore we do not believe them to be sufficiently robust to include
in the adjusted BCR
Non-monetised impacts
613 There are a range of impacts which we are unable to quantify in
monetary terms These include the effect of HS2 on heritage
biodiversity and the water environment and are therefore assessed
qualitatively The Departmentrsquos analysts appraise whether these are
likely to change the value for money categorisation of the scheme The
table below summarises the Departmentrsquos view of the affects of the
scheme on each of the impacts considered This represents a
judgement of the overall impacts across each Phase of the scheme
based on the material contained within the HS2 Environmental
Statement for Phase 1 and the Phase 2 Appraisal of Sustainability
which are mapped against the categories of impact outlined in WebTAG
It is recognised that there will be localised effects which may be greater
or less than the overall categorisation
Table 19 ndash Departmentrsquos assessment of non-monetised impacts
IMPACT ASSESSMENT
Phase 1 Phase 2
Townscape Neutral Neutral
Heritage Moderate Adverse Slight Adverse
Biodiversity Slight Adverse Adverse
Water Environment Moderate Adverse Moderate Adverse
Accessibility Slight Beneficial Slight Beneficial
Personal Affordability Not assessed Not assessed
Severance Slight Adverse Slight Adverse
Option Values Slight Beneficial Slight Beneficial
Physical Fitness Neutral Neutral
Journey Ambience Slight Beneficial Slight Beneficial
Transport Interchange Slight Beneficial Slight Beneficial
614 Consideration of these additional impacts does not imply conclusively
that there is any change in the case for the scheme as there are both
adverse and beneficial impacts It is also important to note that
mitigation measures to account for these impacts will be implemented
While the adverse impacts are likely to outweigh those that are
beneficial it is highly unlikely that the effects will be significant
enough to change the value for money categorisation of the
scheme
65
Conclusion
615 The available evidence indicates that the most likely outcome for the Y-
Network is high value for money while for Phase 1 the most likely
outcome is medium value for money Accounting for landscape impacts
and impacts which cannot be monetised will generate downside but are
unlikely to alter this conclusion
66
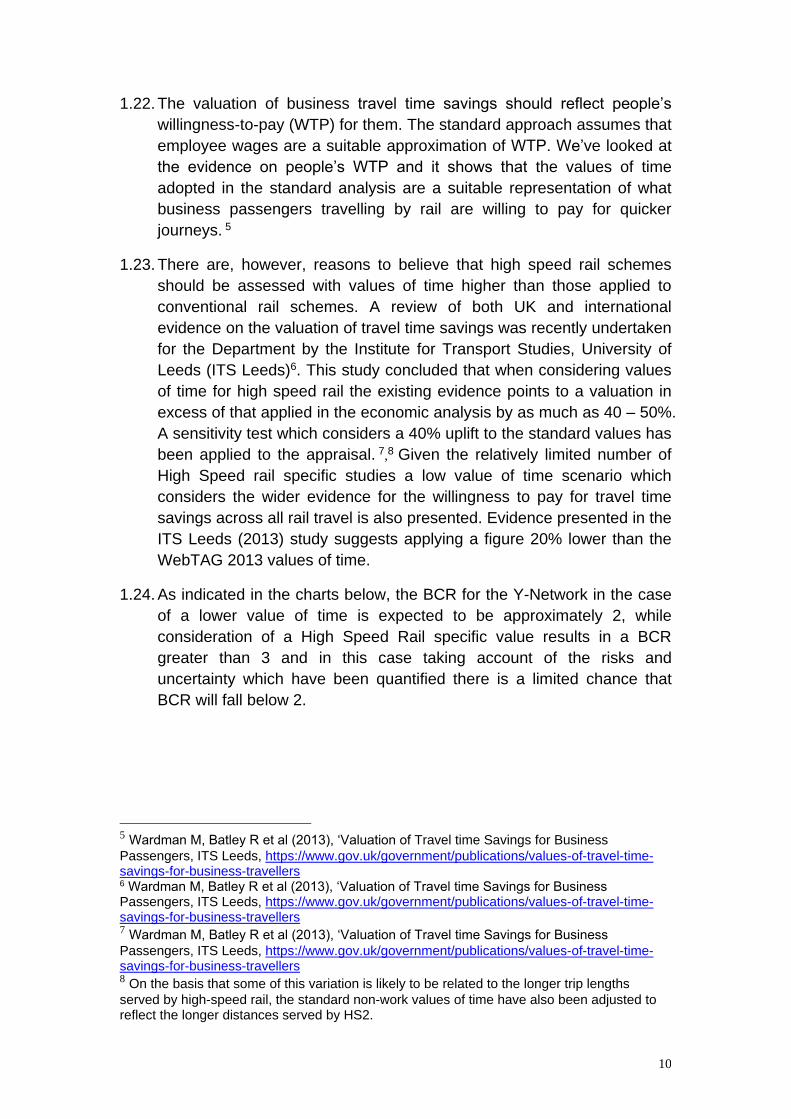
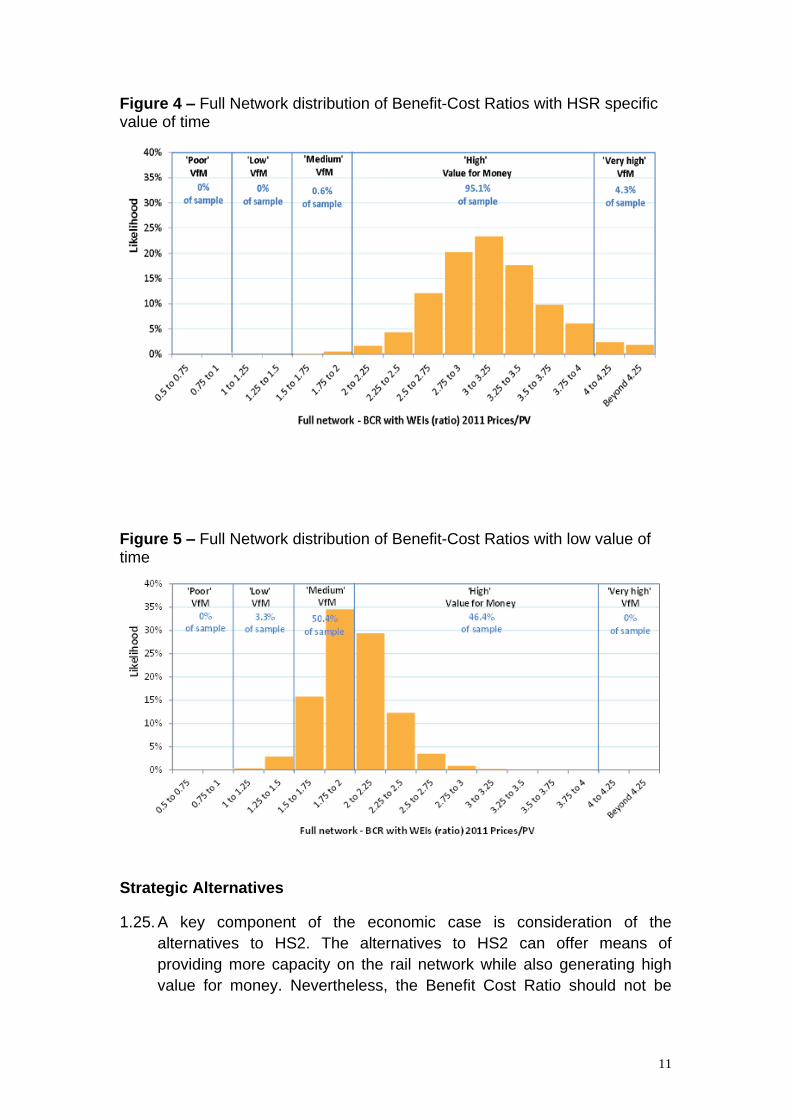
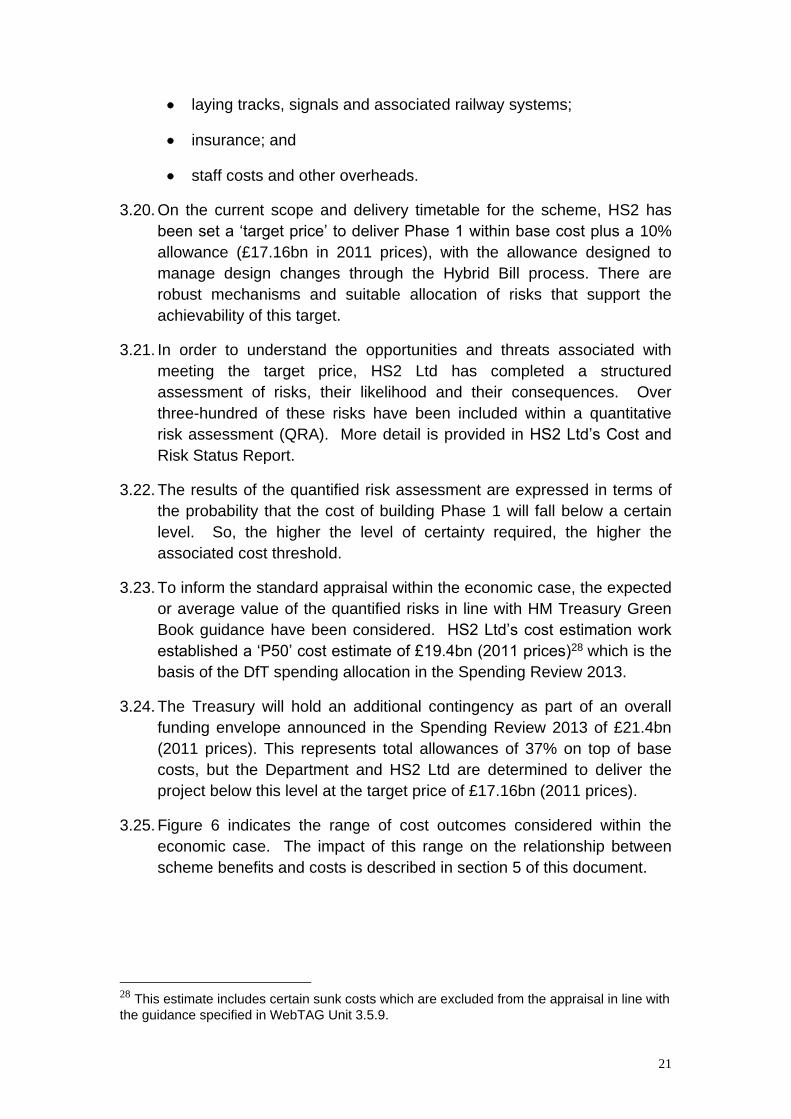
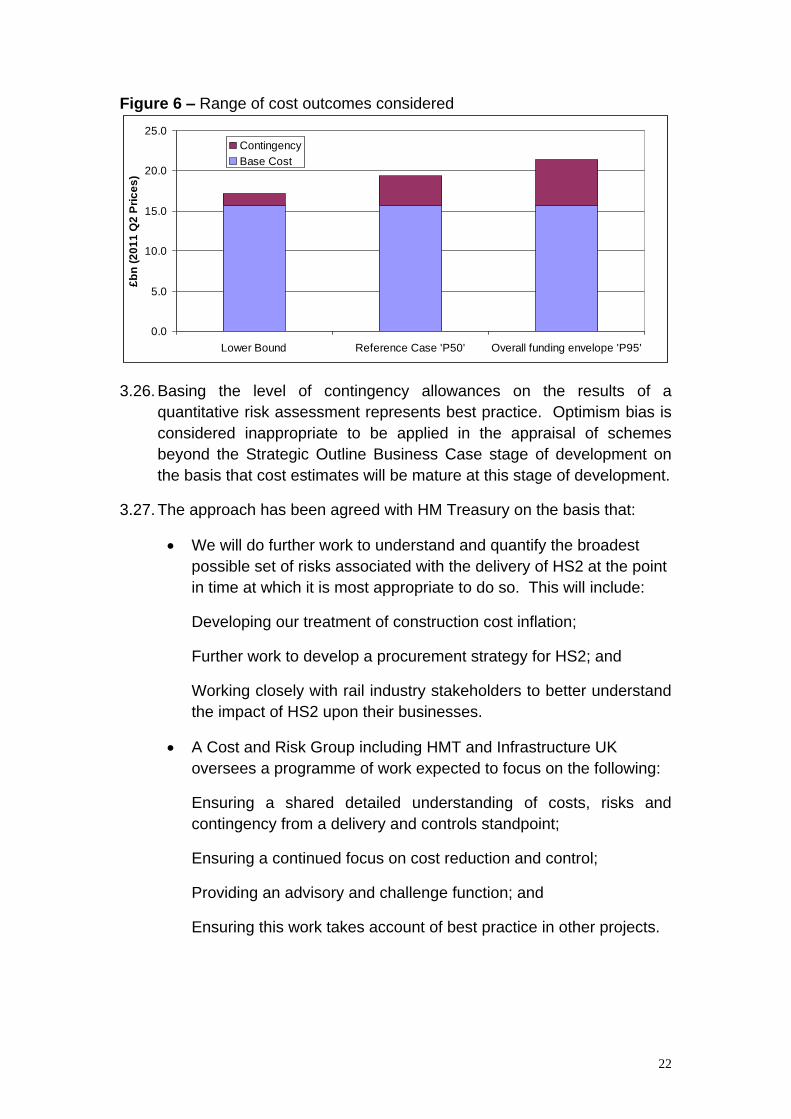
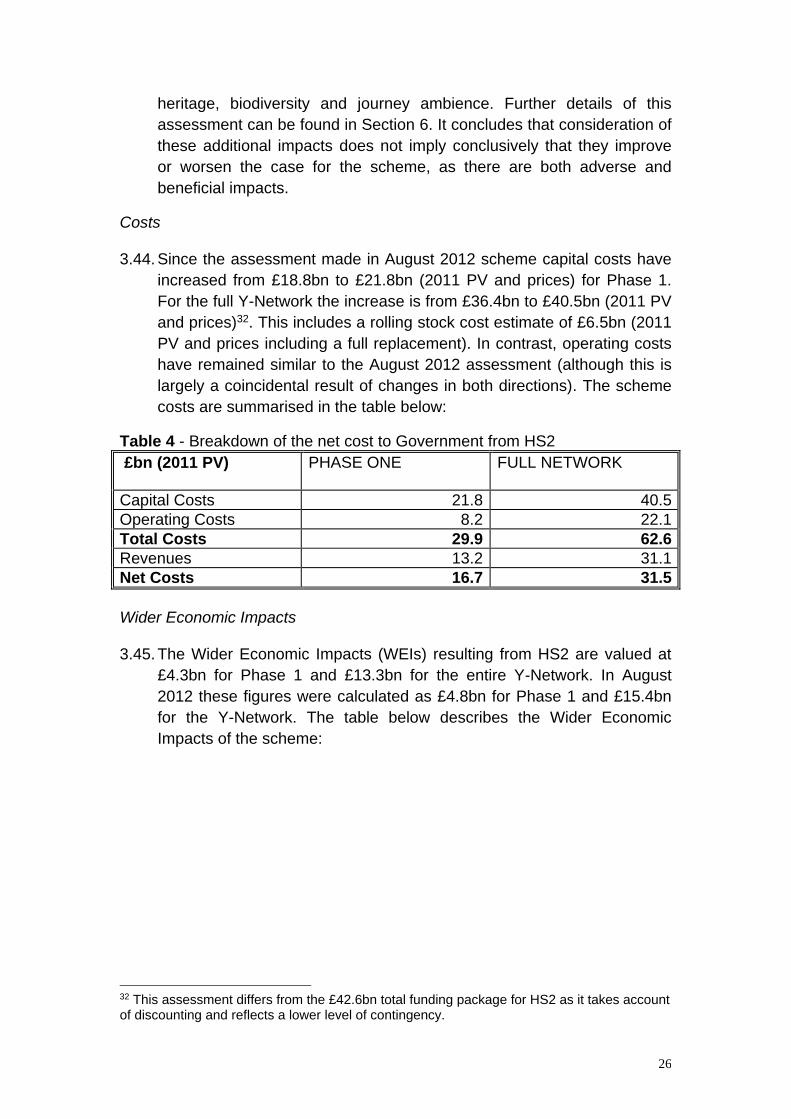
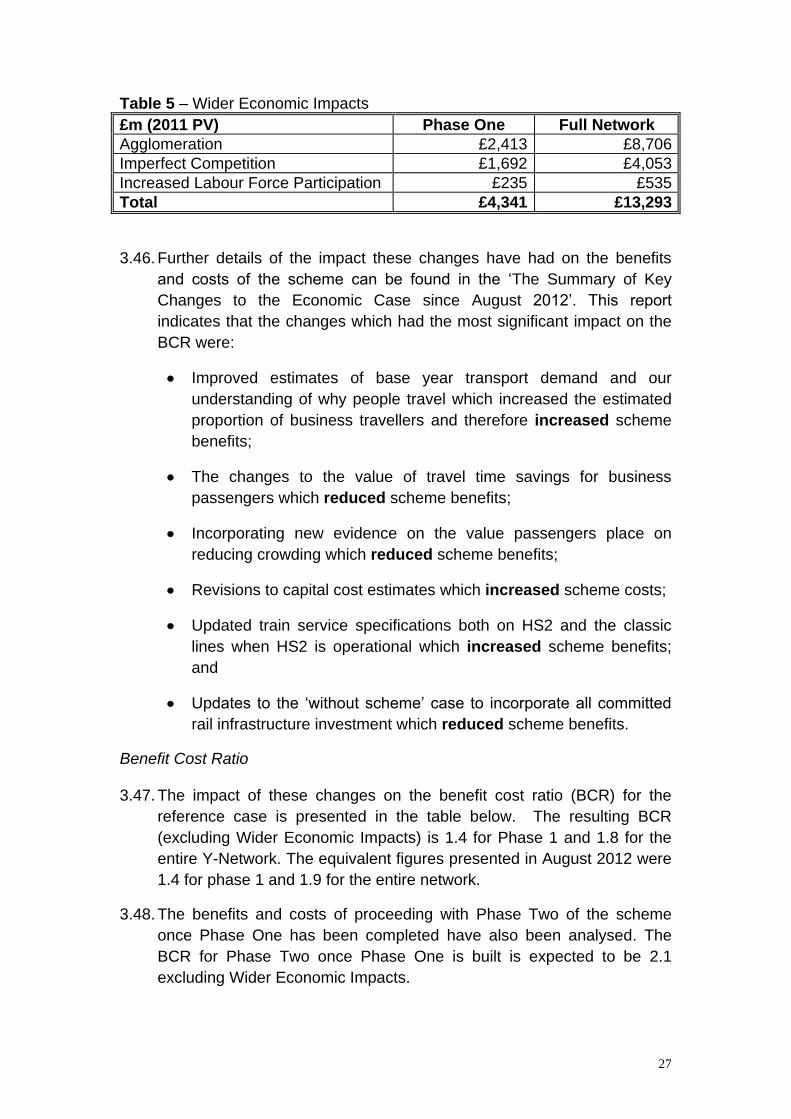
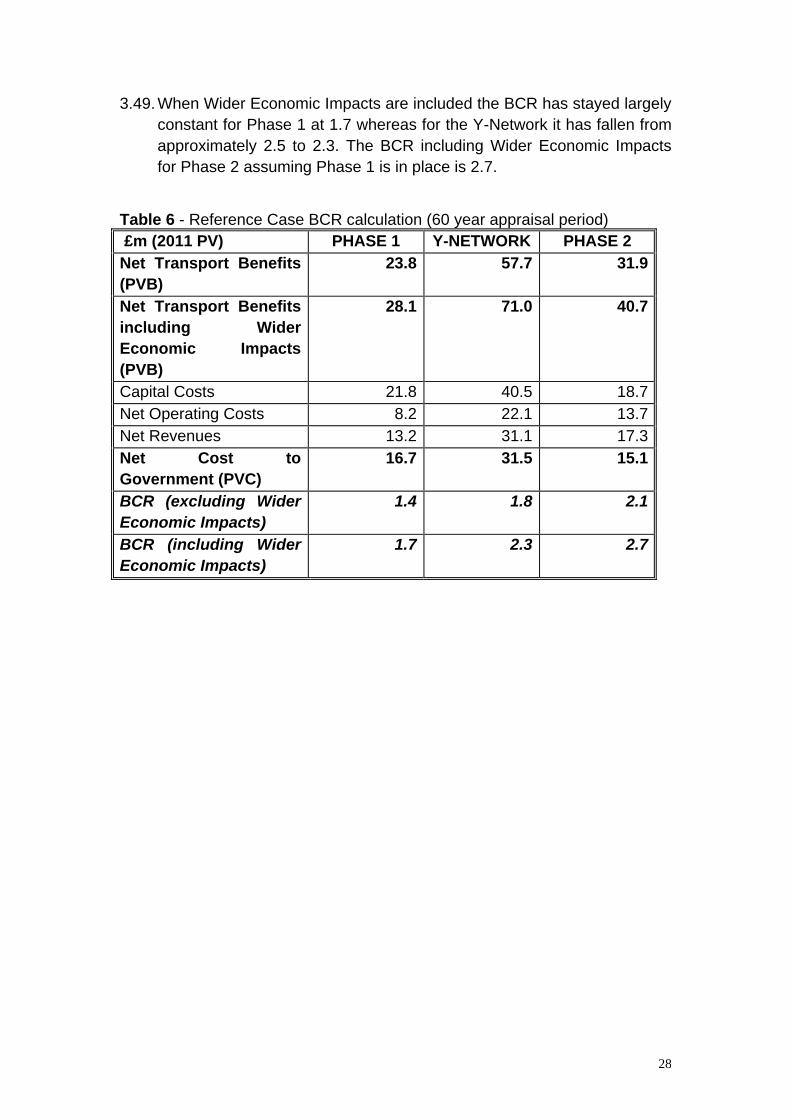
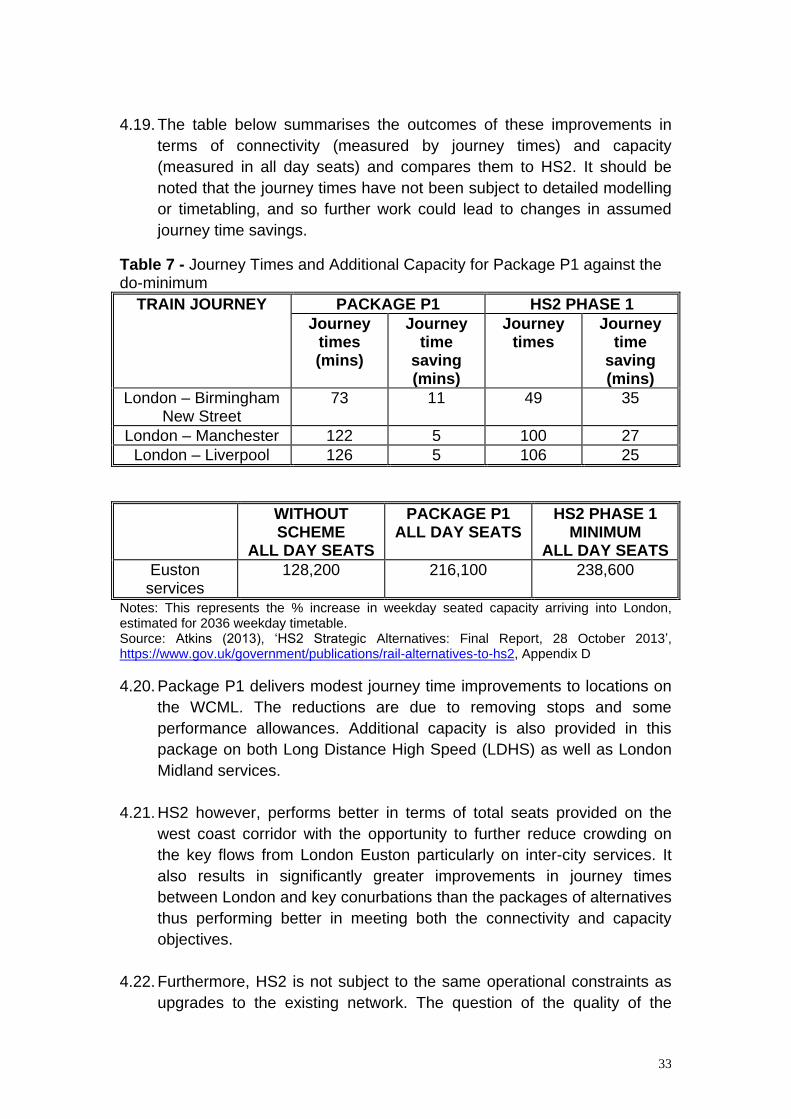
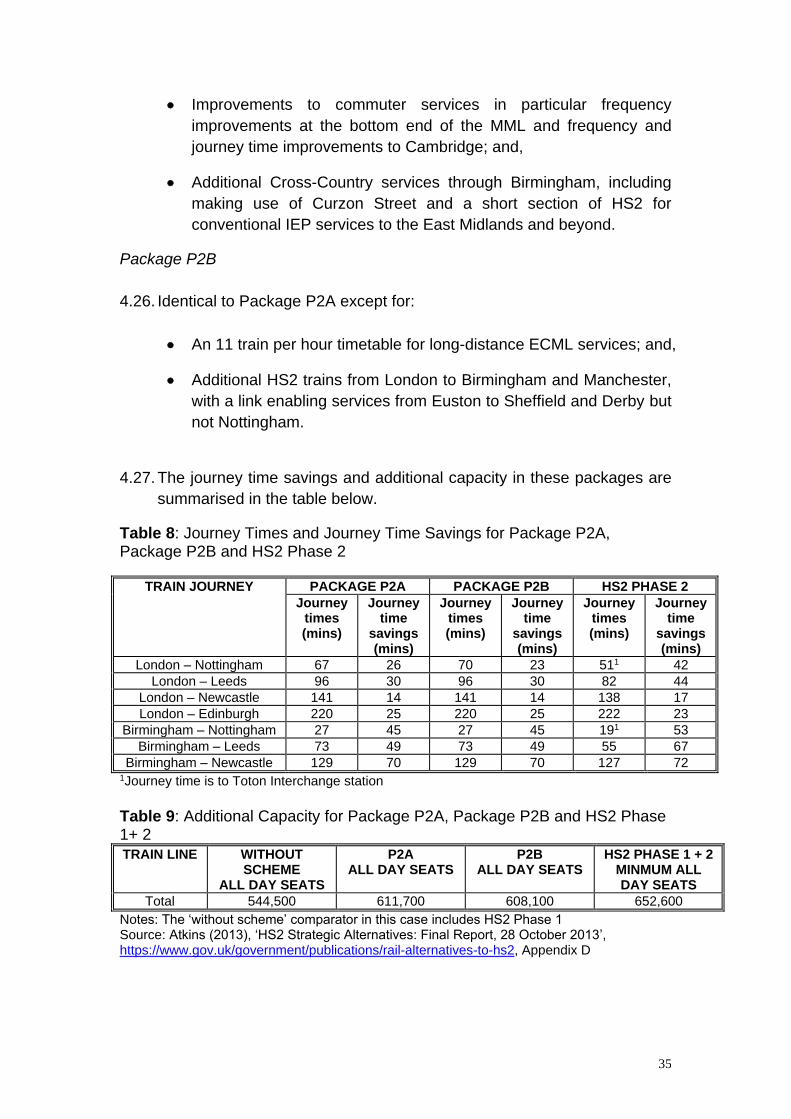
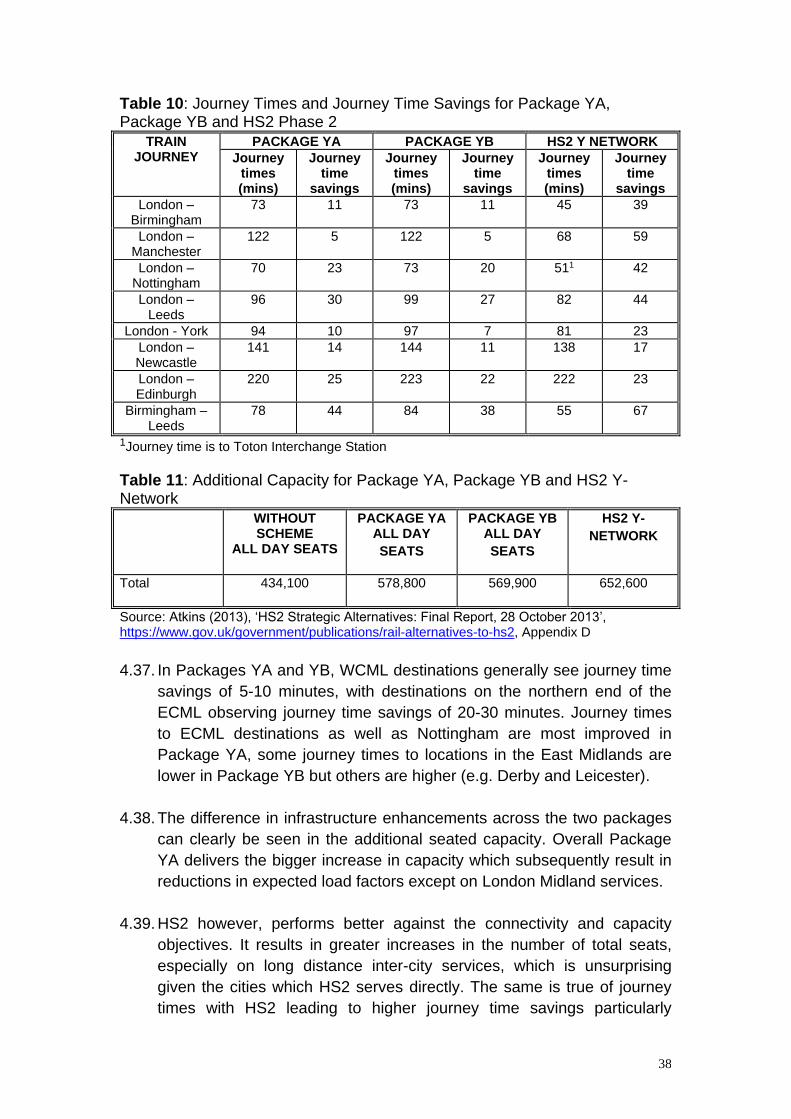
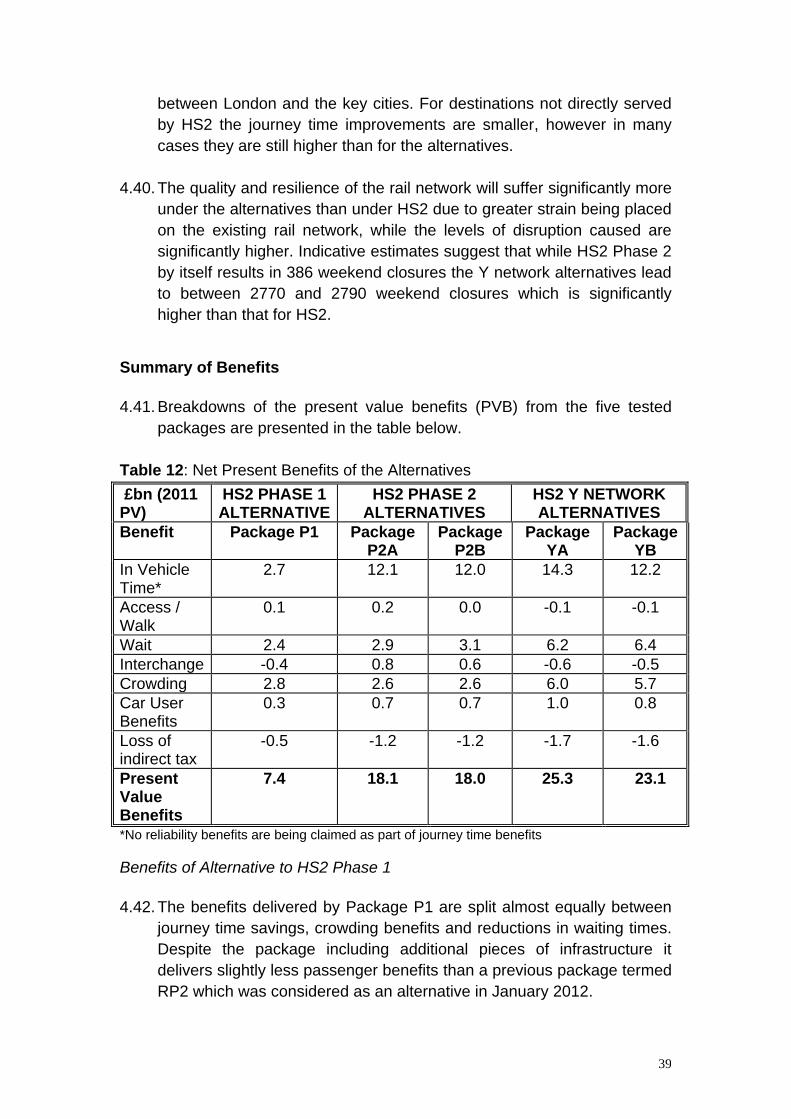
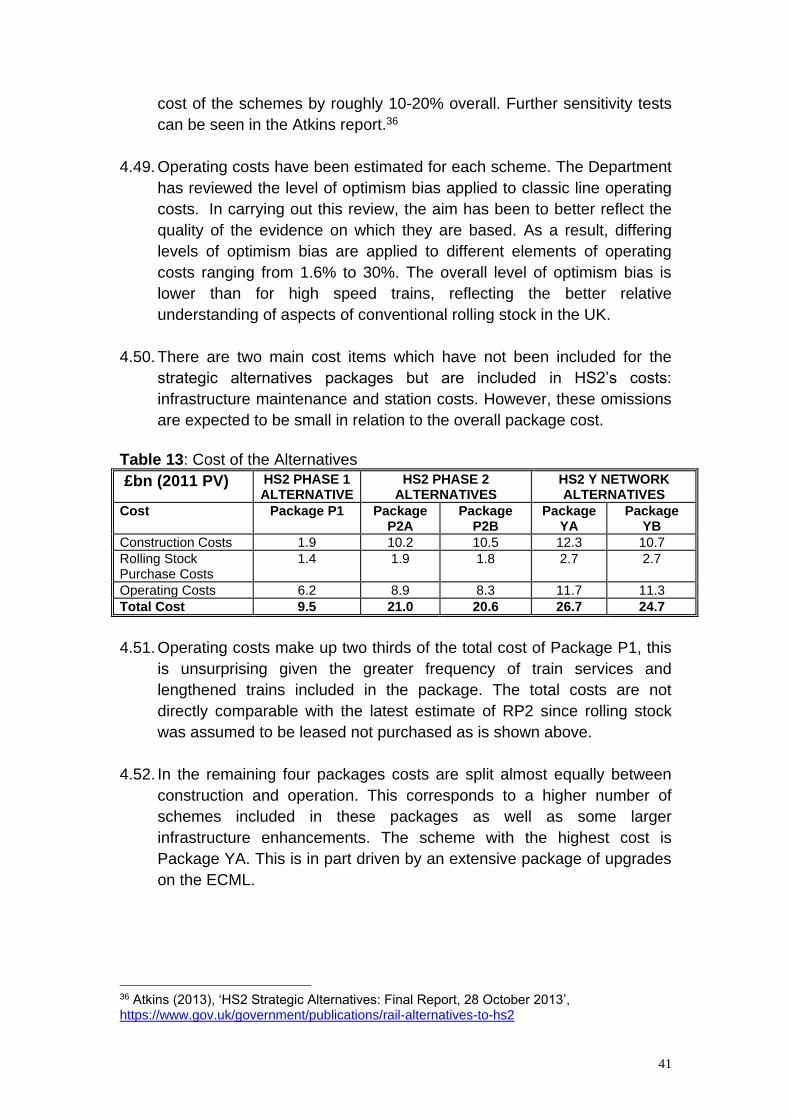
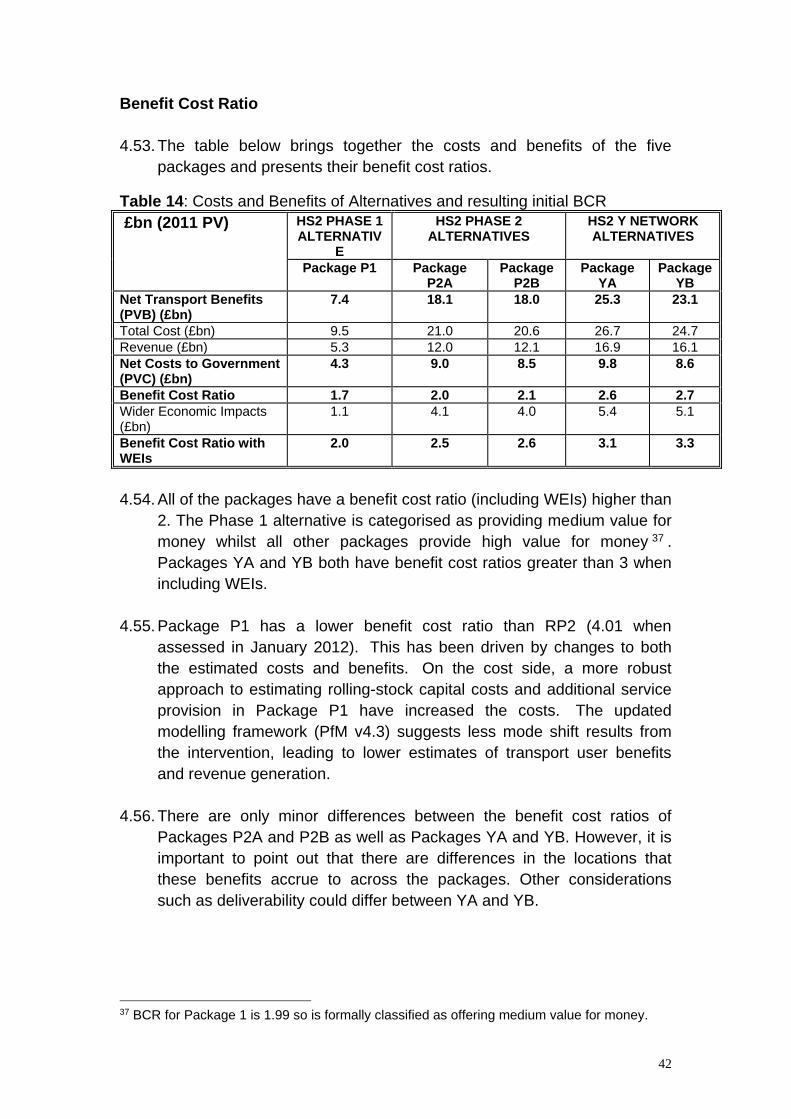
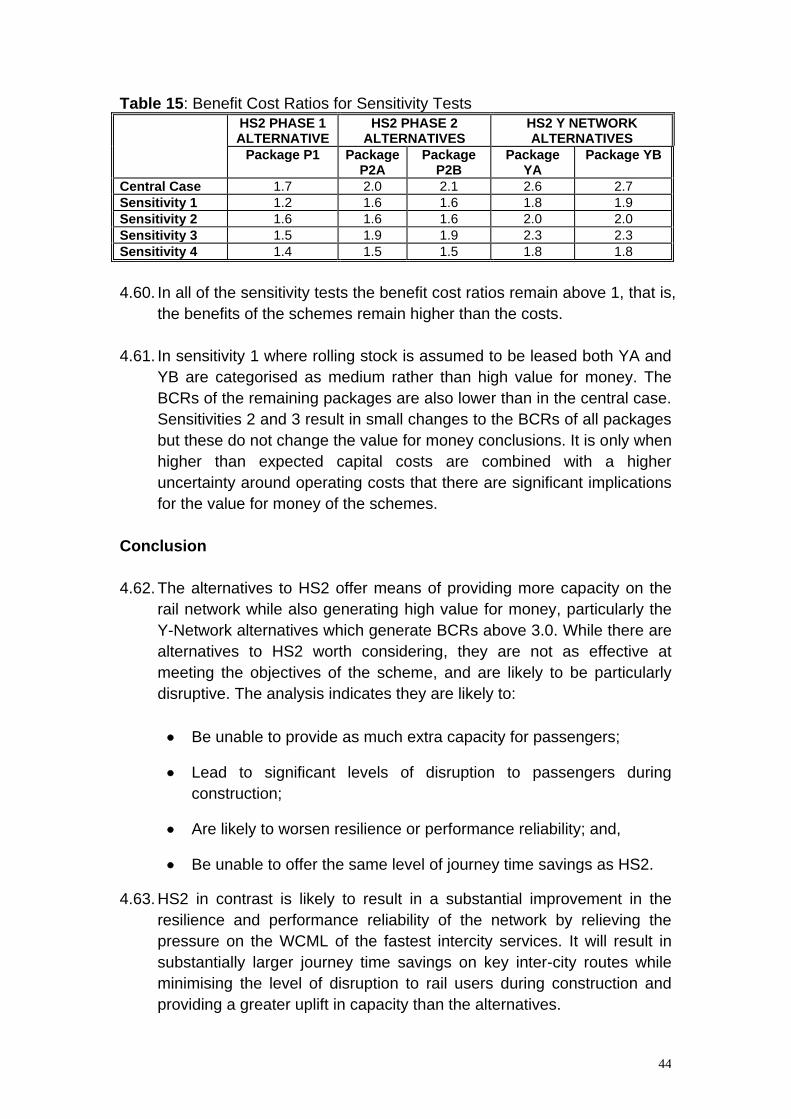
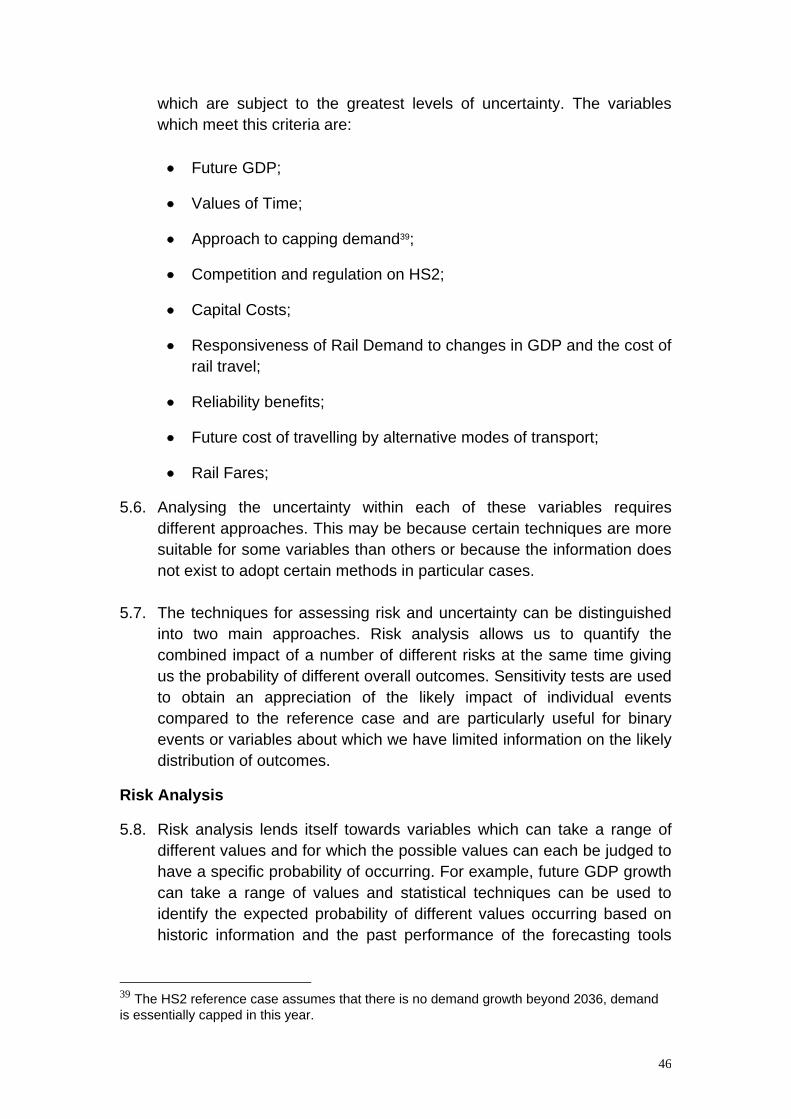
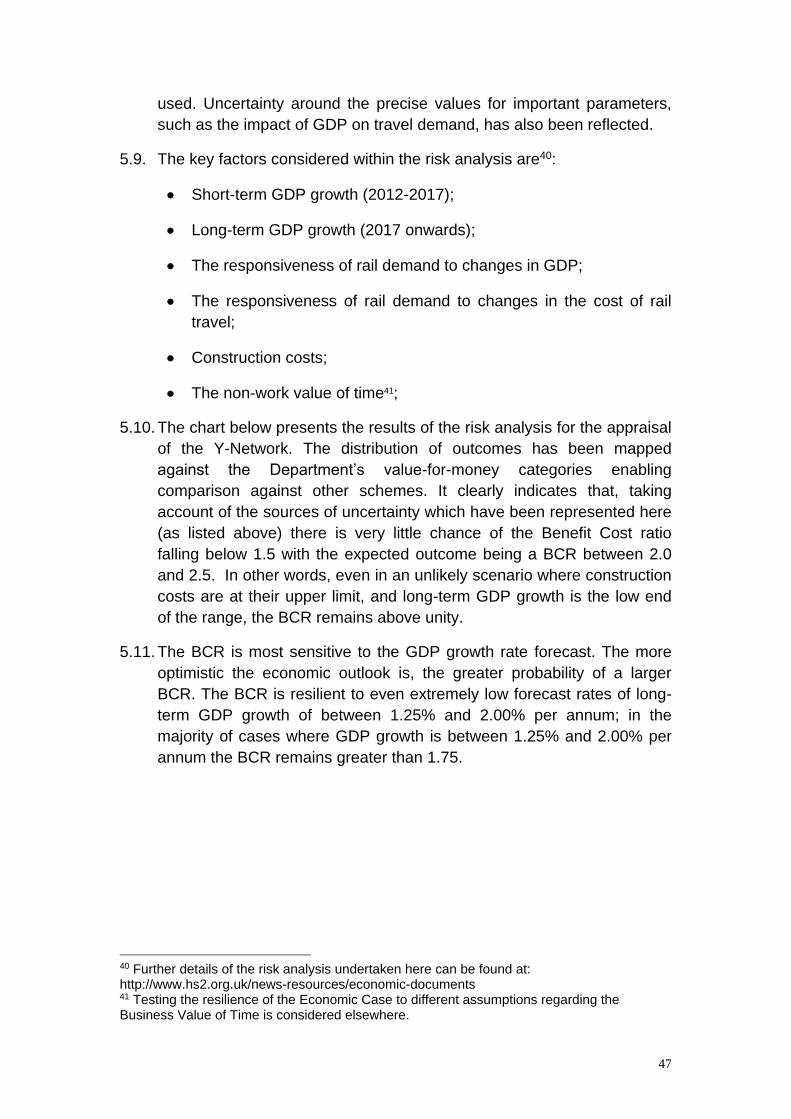
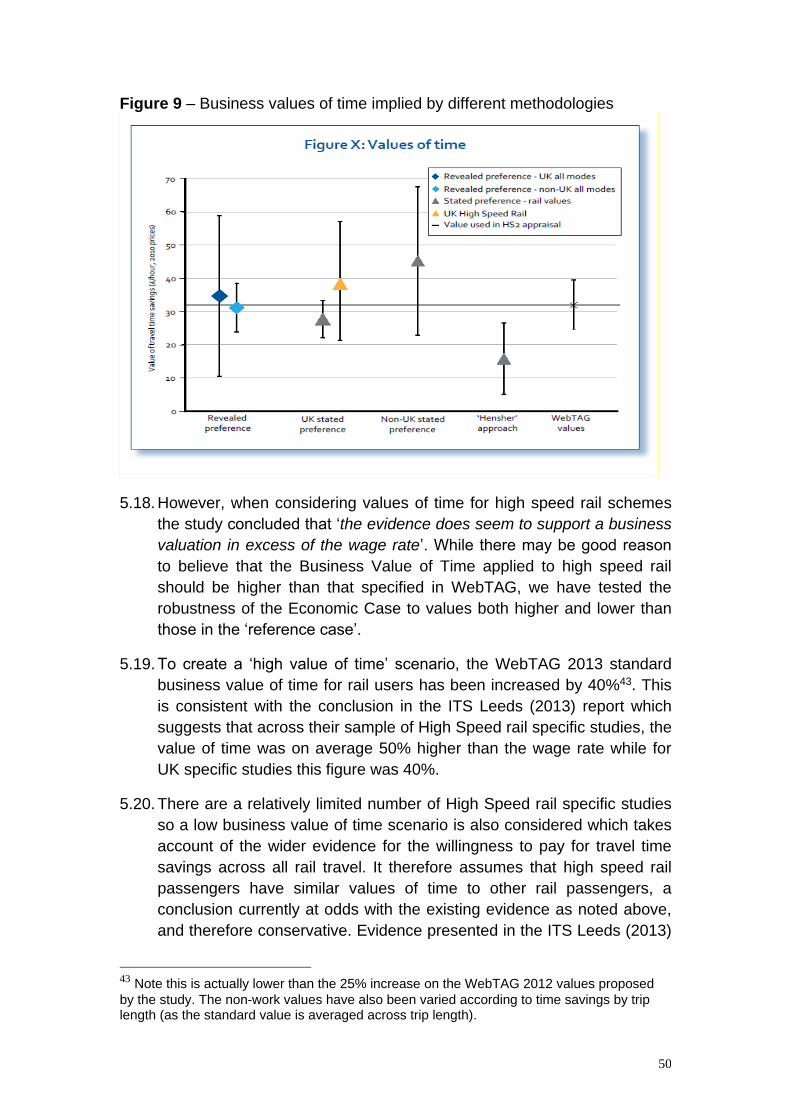
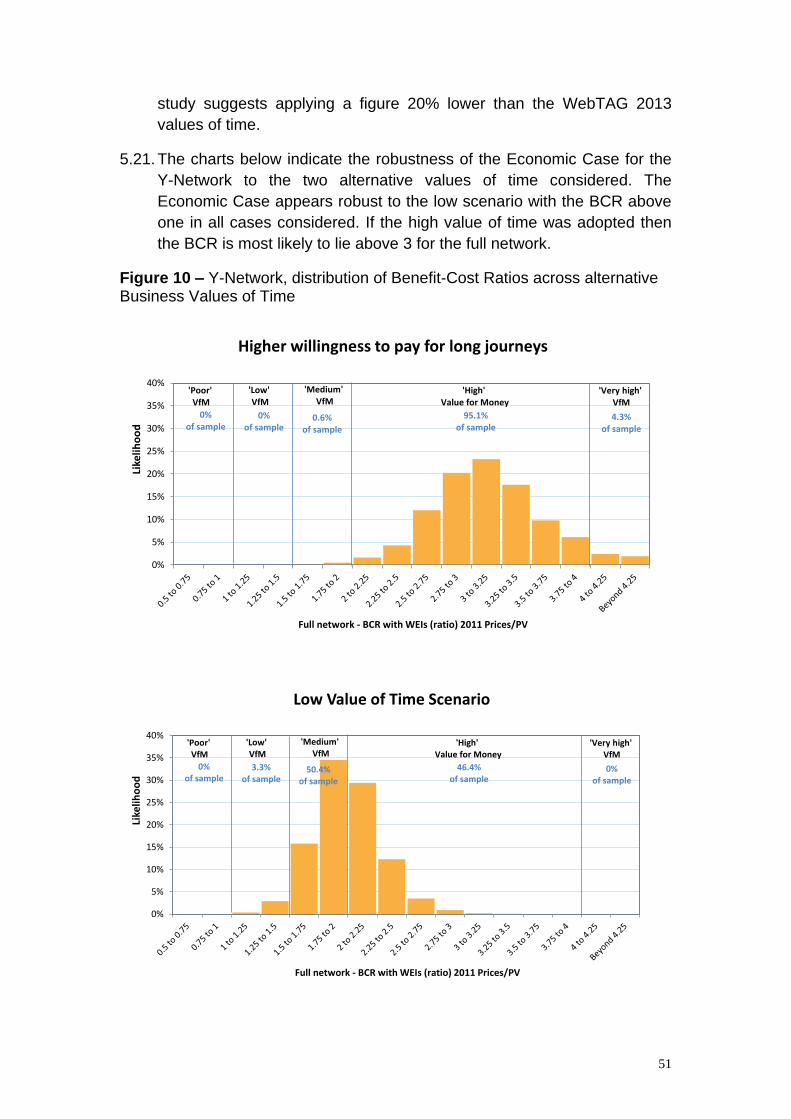
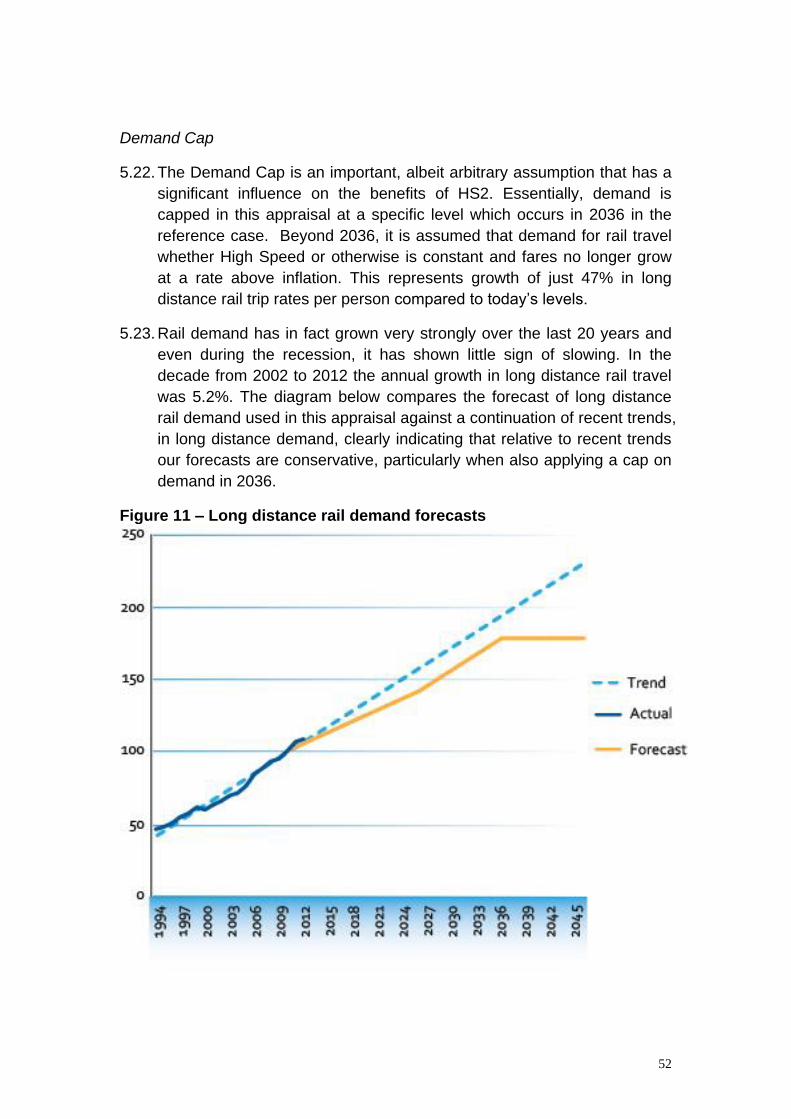
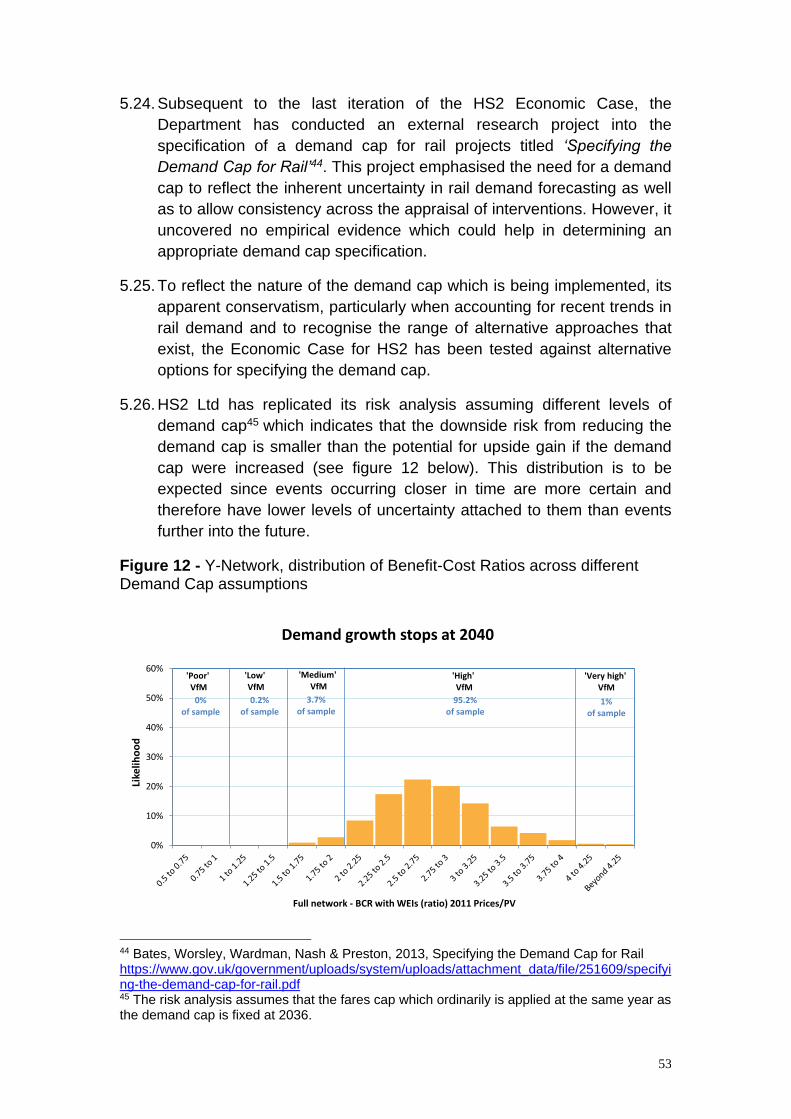
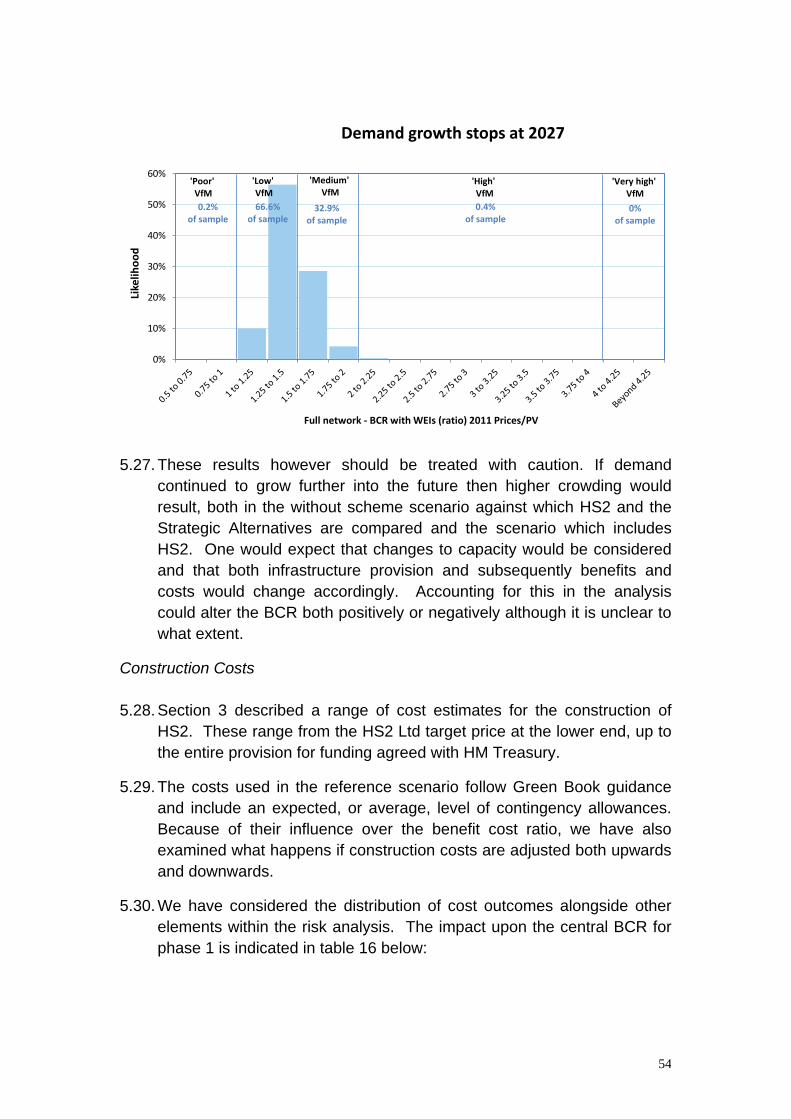
0
10
20
30
40
50
60
Like
liho
od
Full network - BCR with WEIs (ratio) 2011 PricesPV
Demand growth stops at 2027
Poor VfM
Low VfM
Medium VfM
High VfM
02of sample
666of sample
329of sample
04of sample
Very high VfM
0of sample
527 These results however should be treated with caution If demand
continued to grow further into the future then higher crowding would
result both in the without scheme scenario against which HS2 and the
Strategic Alternatives are compared and the scenario which includes
HS2 One would expect that changes to capacity would be considered
and that both infrastructure provision and subsequently benefits and
costs would change accordingly Accounting for this in the analysis
could alter the BCR both positively or negatively although it is unclear to
what extent
Construction Costs
528 Section 3 described a range of cost estimates for the construction of
HS2 These range from the HS2 Ltd target price at the lower end up to
the entire provision for funding agreed with HM Treasury
529 The costs used in the reference scenario follow Green Book guidance
and include an expected or average level of contingency allowances
Because of their influence over the benefit cost ratio we have also
examined what happens if construction costs are adjusted both upwards
and downwards
530 We have considered the distribution of cost outcomes alongside other
elements within the risk analysis The impact upon the central BCR for
phase 1 is indicated in table 16 below
54
Table 16 ndash Impact on Phase 1 BCR of differing QRA rates
APPROACH QRA TARGET
PRICE
QRA lsquoP50rsquo QRA lsquoP95rsquo
contingency 10 24 37
Contingency poundbn (2011
PV)
16 37 575
BCR without WEIs 16 14 13
BCR with WEIs 19 17 15
Source DfT calculations using HS2 Ltd appraisal outputs Numbers may not add due to rounding Monetary values are expressed in poundbn (2011 prices)
531 In addition to these central case estimates figure 13 below indicates the
distribution of benefit cost ratios for phase 1 according to the level of
construction costs It indicates that there are significant opportunities to
improve the value for money of HS2 through engineering efficiencies
and robust cost controls At the same time it should be noted that if
unexpected events lead to costs reaching the agreed funding provision
alongside a number of other downside risks materialising the benefit
cost ratio would remain above one
55
Figure 13 ndash Distribution of Phase 1 BCRrsquos for differing construction cost
Low6
Low21
Low46
Medium61
Medium71
Medium51
High33
High8 High
2
0
10
20
30
40
50
60
70
80
90
100
Target price P50 P95
Like
liho
od
Construction cost
Phase 1 - Likelihood of Value for Money
Poor
Low
Medium
High
Very high
Value for Moneycategory
Construction cost scenarios
estimates
532 The equivalent estimates for the entire network are provided in figure 14
below This represents a worst-case scenario where both phase 1 and
phase 2 cost estimates reach their upper bound ie pound214bn (2011
prices) for phase 1 and pound212bn (2011 prices) for phase 2 In this
scenario the BCR of the Y-network would fall by approximately 03 to
around 20 (including wider economic impacts)
56
Figure 14 - Distribution of Y-Network BCRrsquos for differing construction cost estimates
Low1
Low2
Medium19
Medium45
High81
High53
0
10
20
30
40
50
60
70
80
90
100
P50 P95
Like
lihoo
d
Construction cost
Full network - Likelihood of Value for Money
Poor
Low
Medium
High
Very high
Value for Moneycategory
Construction Cost Scenarios
Sensitivity tests
533 In addition to examining the Demand Cap and Business Value of Time
specific sensitivity tests have been employed to assess the robustness
of the Economic Case in certain cases where risk analysis is
inappropriate The most relevant tests applied are those testing the
impact of different assumptions regarding the cost of other modes rail
fares and the quantification of reliability benefits
Cost of other modes
534 One would expect the cost of alternative modes to alter the
attractiveness of travel by rail and therefore HS2 If the costs of road or
air travel fall they become relatively more attractive modes and one
would expect travellers to transfer from rail to road or air travel HS2 Ltd
have tested the sensitivity of rail demand to both higher and lower
energy costs46 with higher energy costs the cost of fuel rises and
therefore the cost of road and air travel also increases
535 These tests have shown that the sensitivity of the BCR for HS2 to
changes in energy costs is marginal with the transport user benefits
only increasing by approximately 1 under the high energy cost
scenario and falling by just less than 1 in the low energy cost scenario
46 These are based on the energy cost scenarios generated by DECC details of which can be found here httpswwwgovukgovernmentorganisationsdepartment-of-energy-climate-changeseriesenergy-and-emissions-projections
57
Fares
536 Fares tests are difficult to interpret due to the fact that the demand cap is
set at a particular level of demand and fares are also capped at this
point Increasing fares reduces demand but since ultimately the same
level of demand is reached the longer period of higher real revenue
growth outweighs the demand impact In the case of Phase 1 increasing
real fares by RPI+2 per annum from 2020 until the demand cap is
reached (rather than RPI+1 as used in the reference case) increases
the BCR (excluding Wider Economic Impacts) to 19 from 14 previously
while for Phase 2 this BCR increases to 29 from 18 previously
537 When the level of fare increases is reduced (to RPI + 0 from 2020 until
the demand cap is reached after which point fares rise at a rate
equivalent to the GDP deflator) the effect is the opposite with the
reduction in revenue significantly outweighing any impact on transport
user benefits and therefore the BCR falls For Phase 1 the BCR
(excluding Wider Economic Impacts) is now 13 compared to 14
previously and for the Y-network it falls from 18 to 16
Reliability
538 Benefits resulting from improvements in reliability are calculated on the
basis of the expected reduction in the average minutes of lateness which
are then converted into journey time savings in an approach consistent
with the Passenger Demand Forecasting Handbook This improvement
in reliability also translates into an increase in the demand for the High
Speed services
539 While it is likely that HS2 will deliver significant improvements to
reliability and the assumed forecast delay on HS2 services is consistent
with international precedent until services operate the level of reliability
benefits is somewhat uncertain Removing reliability benefits from the
appraisal reduces the BCR (without Wider Economic Impacts) of Phase
1 to 12 and for the Y-Network it falls to 15 This however represents an
extreme lower bound of the risk in this area as reliability benefits are
expected to exist the uncertainty relates to their likely scale
Threats and Opportunities
Competition and Regulation on HS2
540 The operational characteristics and regulatory environment in which HS2
might operate are as would be expected at this stage in scheme
development undetermined HS2 Ltd has begun to investigate how
different operating environments and responses by train operators may
impact on the Economic Case Initial work has considered how
58
competition between HS2 operators and those on existing networks
might influence pricing decisions under the current fare regime
541 The analysis indicates that conventional rail operators may have the
incentive to reduce fares to capture market share from HS2 thus
potentially limiting the scope for HS2 to set higher fares Whilst
reductions in fares on conventional rail will reduce the revenue on HS2
this will be broadly off-set by an increase in revenue on the existing rail
network The full implications on value for money are uncertain as the
models do not attempt to estimate passenger benefits However the
revenue impacts do not suggest anything which would alter the value for
money conclusions
542 It is important to note that this work is in its early stages and subject to
significant further analysis
Impact of HS2 on Economic Geography
543 The standard approach to estimating impacts of transport schemes as
adopted throughout this Economic Case seeks to capture the impacts
on business as well as wider society This includes amongst other
things the benefits to business travellers from faster journeys and
reduced crowding as well as the value of increased production and the
benefits to company efficiency from being closer together The economic
appraisal calculates net national impact and cannot be used to analyse
sub-national impacts
544 With advice from an independent panel of experts HS2 Ltd has
undertaken a programme of work to help us understand the scale of the
potential economic benefits of HS2 and how they might be spread
across the country47 This work complements the standard assessment
of economic impacts described
545 This work looks at the potential benefits of HS2 in a different way to this
Economic Case by examining how improvements in connectivity would
increase competitiveness of areas outside of London and change the
future pattern of growth The results from this new analysis suggest that
HS2 could increase economic output by between pound8bn and pound15bn per
year48 and that whilst all regions benefit the city regions in the Midlands
and the North do particularly well
546 This is the first attempt to measure economic impact in terms of
productivity and location effects and results should be considered
47httpassetshs2orguksitesdefaultfilesinsertsHigh20Speed20Rail2C20Transport 20Investment20and20Economic20Impactpdf
48 Results are modelled for 2037 and reported in 2013 prices
59
provisional HS2 Ltd will continue to refine this work and further develop
the evidence in this area but this study represents a significant
development and should be seen as a complement to (not a substitute
for) the scheme appraisal presented in this Economic Case Given
fundamental differences in approaches results are not directly
comparable and are in no way additive but this work suggests that
there may be important economic benefits not captured within the
current appraisal of HS2 These are particularly relevant and have the
potential to be significant in the case of a transformational scheme such
as HS2
Existing Rail Network
547 Assumptions about the future of the existing rail network play an
important role in assessing the costs and benefits of HS2 There are two
key areas of relevance
The nature of the classic rail network if HS2 was not constructed
lsquothe without schemersquo scenario ndash this allows comparison between
HS2 and a scenario in which HS2 is not built and
The train service specification (TSS) on the existing network if HS2
is built
548 This appraisal uses a lsquowithout schemersquo scenario based on lsquocommitted schemes only largely those described in the Departmentrsquos 2012 High
Level Output Specification49 While further improvements to the existing
network could be expected throughout the 2020s and 2030s it would be
inappropriate to speculate what these may be particularly as future
investment may complement rather than compete with HS2 The
inclusion of further investment could improve or worsen the case for HS2
depending on the extent to which it is complementary or otherwise
549 As long distance services transfer onto HS2 capacity will be created on
the existing network to introduce different services There are many
options for making best use of this released capacity including extra
commuter and freight trains and other regional and local services that
would otherwise be impossible to run The HS2 economic case relies
upon assumptions about the train service specification (TSS) on the
classic rail network when HS2 opens however this represents one
possible set of assumptions used for business case modelling purposes
There are many other potential combinations of released capacity
49 High Level Output Specification 2012 httpswwwgovukgovernmentpublicationshigh-level-output-specification-2012
60
550 Further work will be undertaken to optimise the use of released capacity
as the project develops in accordance with the set of principles
described in the Strategic Case for HS250 The finalisation of the TSS
will be expected to impact on the value-for-money of the scheme and the
extent of the upside or downward risk is dependent upon how well the
final TSS matches demand for rail services
Calculation of scheme benefits
551 HS2 Ltd has calculated user benefits using the lsquorule of a halfrsquo 51
Depending on the nature of demand it is possible for this assumption to
lead to either an underestimate or an overestimate of the benefits to
passengers This is not unique to HS2 and this uncertainty around the
accuracy of the lsquorule of a halfrsquo approximation exists in all transport
appraisals particularly on projects which offer large journey time savings
It is to be noted however that alternative methods exist which can
generate lower benefits although these are less commonly used poorly
understood and subject to their own uncertainty
Scheme opening date
552 Phase 1 of HS2 is currently scheduled to open during 2026 while Phase
2 of the scheme is scheduled to open in 2033 There remain risks to
these delivery dates which range from passage through a complex
Parliamentary approvals process to the engineering work required being
delivered on time
553 Were the delivery of HS2 to be delayed it would likely increase scheme
costs and could alter scheme benefits and revenues The scale of the
impact on the Economic Case would depend on the nature of the delay
and the implications for the resulting profile of costs revenues and
benefits over time
554 Delay might itself lead to higher costs than would otherwise be the case
Preliminary work suggests that a delay to the Hybrid Bill process (for
example for one year) could result in inefficient delivery due to the
nature of the HS2 Ltd corporate and indirect cost structure which could
result in perhaps pound100m of additional costs above current estimates
50 Department for Transport (2013) lsquoThe Strategic Case for HS2rsquo httpswwwgovukgovernmentpublicationshs2-strategic-case 51 The rule of half estimates the changes to consumer welfare (in this case the welfare of
transport users) resulting from changes in supply assuming a constant demand curve
61
6 Value for Money Assessment
Introduction
61 The Economic Case needs to reach a conclusion on whether the
scheme represents good value for taxpayersrsquo money This requires
comparing HS2 against a ldquowithout schemerdquo reference case in order to
assess the economic social environmental and public account impacts
that a transport intervention may incur The analysis presented in
Sections 3 and 5 allows such conclusions to be drawn and the
Departmentrsquos WebTAG guidance provides a framework for doing so
62 In order to allow comparison across schemes WebTAG specifies value
for money categories within which schemes can be placed and the table
below describes these categories
Table 17 ndash Value for Money Categories
VALUE FOR MONEY CATEGORY
BENEFIT COST RATIO
Poor Less than 10
Low Between 10 and 15
Medium Between 15 and 20
High Between 20 and 40
Very High Greater than 40
63 As previously discussed the long-term forecasting horizon required
when considering a project such as HS2 combined with its inherent
scale and complexity limits the ability of a single lsquoreference casersquo BCR
to generate informative conclusions on the value for money of the
scheme It is appropriate therefore to consider how robust the Economic
Case for HS2 remains across a range of possible future scenarios and
therefore draws heavily on the analysis in Section 5
64 Not all potential scheme impacts can be assessed in monetary terms
and of those that can we have more robust evidence for the
monetisation of some impacts than others In assessing value for money
WebTAG recommends using a three stage approach
We start with those impacts where the evidence for the
monetisation is robust We call the resulting BCR the ldquoinitialrdquo BCR
62
We then add those impacts where monetisation is possible but
where the evidence for doing so may not be as robust The
resulting BCR is called the lsquoadjusted BCRrsquo
Finally those impacts for which it is not possible to provide
monetary values are accounted for in a qualitative manner and the
potential ability for these impacts to shift the value for money
category is assessed
65 The table below presents the categories within which the assessment of
differing impacts are ordinarily placed Even within these categories the
robustness of the analysis can vary for example the quantification of
Wider Economic Impacts is considered more robust in this assessment
than landscape impacts
Table 18 - Three stage approach to monetisation of impacts
Initial BCR robust monetisable impacts
Adjusted BCR less robust but monetisable impacts
Judgement whether non-monetised impacts could shift value for money assessment
Travel Time Savings
Crowding benefits
Noise
Air Quality
Greenhouse Gases
Physical Activity
Accidents
Indirect Tax Revenue
Reliability
Wider Economic Impacts
Landscape
Townscape
Heritage of Historic Resources
Biodiversity
Water environment
Security
Access to Services
Affordability
Severance
Option Values
Notes Note that in the economic case for HS2 the reliability benefits have been recorded in
the initial BCR to ensure consistency with previous versions of the economic case This
differs from the treatment recommended in WebTAG Nevertheless paragraph 539 provides
an approximate BCR if reliability benefits are removed
Does the scheme represent lsquovalue for moneyrsquo
66 Table 6 presents the lsquoinitial BCRrsquo for the lsquoreference casersquo for both Phase
1 and the Y-Network It indicates that excluding Wider Economic
Impacts leads to an initial BCR of 14 for Phase 1 and 18 for the Y-
Network
67 Including WEIs provides a BCR of 18 for Phase 1 and 23 for the Y-
Network As noted previously point estimates are unable to demonstrate
the uncertainty inherent within consideration of a project such as HS2 It
63
is therefore imperative to consider how robust these BCR estimates are
to changes in both the external and internal environment
68 The economic analysis of HS2 described in Section 5 suggests that
taking account of certain key sources of uncertainty there is a low
probability that the BCR for the Y-Network will fall below 15 Only in a
very limited number of scenarios where there is an unexpected
prolonged series of low economic growth (averaging 125 to 2 per
annum over the entire appraisal period) combined with the upper range
of cost estimates and pessimistic views on other key variables does the
BCR drop below 15 The most likely outcome taking into account
uncertainty that can be quantified is that the BCR for the Y-Network
represents high value for money with a BCR above 20
69 The Economic Case for Phase 1 has a most likely outcome of
medium value for money with a BCR above 15 however there is a
small likelihood that this could fall into low value for money The
conclusions for Phase 1 and the Y-Network are consistent with the BCR
implied by the lsquoreference casersquo
610 The case for the scheme is strong using the standard tools and
methodology as expressed in WebTAG however as shown in Section 5
using alternative but plausible assumptions on the values of time and
demand capping in particular could make the Economic Case stronger
Furthermore consideration of other factors such as the impact of HS2
on Economic Geography may improve the case even further
Landscape impacts
611 Landscape impacts consider the effects of a scheme on the visible
features of a landmass combined with the physical and cultural aspects
of the land itself Any valuation of something which is intangible such as
landscape is challenging and while the Department has used the best
available methods to quantify landscape impacts the assessment
remains sensitive to a key set of underlying assumptions The monetised
assessment should therefore not be considered a substitute for the
detailed landscape assessment conducted in the Environmental
Statement52
612 The Landscape impacts have been estimated at pound10bn for Phase One
and pound29bn for the Y-Network (Present Value 2011 Prices) which would
reduce the BCR in both cases by 01 Whilst these estimates provide a
useful indication of the potential scale of landscape impacts sensitivity
52 HS2 Phase One Environmental Statement httpswwwgovukgovernmentcollectionshs2-phase-one-environmental-statement-documents
64
tests show that the plausible range on these values is extremely large
and therefore we do not believe them to be sufficiently robust to include
in the adjusted BCR
Non-monetised impacts
613 There are a range of impacts which we are unable to quantify in
monetary terms These include the effect of HS2 on heritage
biodiversity and the water environment and are therefore assessed
qualitatively The Departmentrsquos analysts appraise whether these are
likely to change the value for money categorisation of the scheme The
table below summarises the Departmentrsquos view of the affects of the
scheme on each of the impacts considered This represents a
judgement of the overall impacts across each Phase of the scheme
based on the material contained within the HS2 Environmental
Statement for Phase 1 and the Phase 2 Appraisal of Sustainability
which are mapped against the categories of impact outlined in WebTAG
It is recognised that there will be localised effects which may be greater
or less than the overall categorisation
Table 19 ndash Departmentrsquos assessment of non-monetised impacts
IMPACT ASSESSMENT
Phase 1 Phase 2
Townscape Neutral Neutral
Heritage Moderate Adverse Slight Adverse
Biodiversity Slight Adverse Adverse
Water Environment Moderate Adverse Moderate Adverse
Accessibility Slight Beneficial Slight Beneficial
Personal Affordability Not assessed Not assessed
Severance Slight Adverse Slight Adverse
Option Values Slight Beneficial Slight Beneficial
Physical Fitness Neutral Neutral
Journey Ambience Slight Beneficial Slight Beneficial
Transport Interchange Slight Beneficial Slight Beneficial
614 Consideration of these additional impacts does not imply conclusively
that there is any change in the case for the scheme as there are both
adverse and beneficial impacts It is also important to note that
mitigation measures to account for these impacts will be implemented
While the adverse impacts are likely to outweigh those that are
beneficial it is highly unlikely that the effects will be significant
enough to change the value for money categorisation of the
scheme
65
Conclusion
615 The available evidence indicates that the most likely outcome for the Y-
Network is high value for money while for Phase 1 the most likely
outcome is medium value for money Accounting for landscape impacts
and impacts which cannot be monetised will generate downside but are
unlikely to alter this conclusion
66
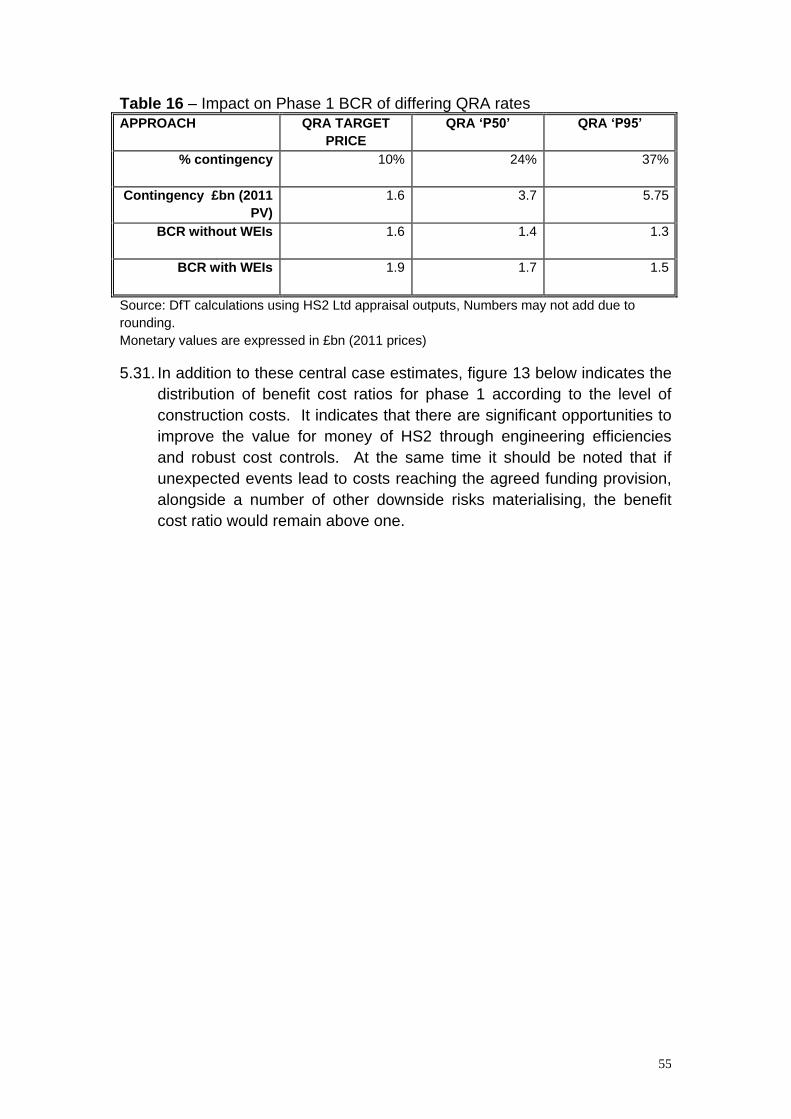
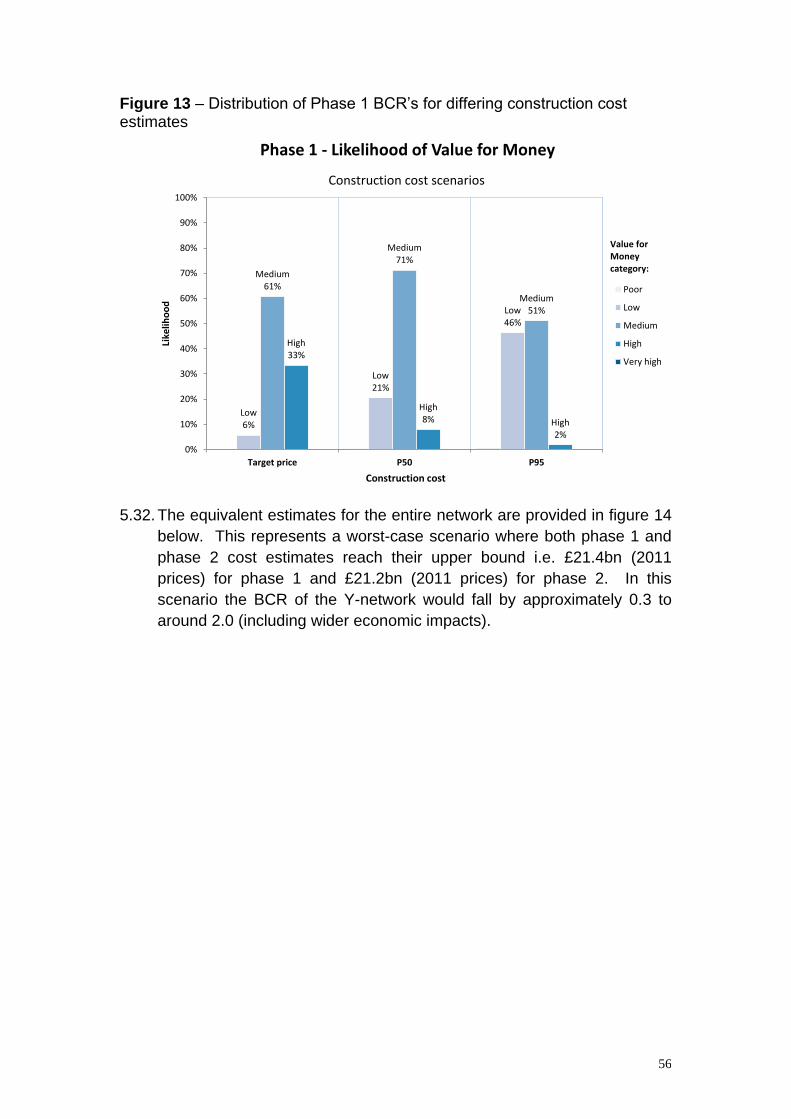
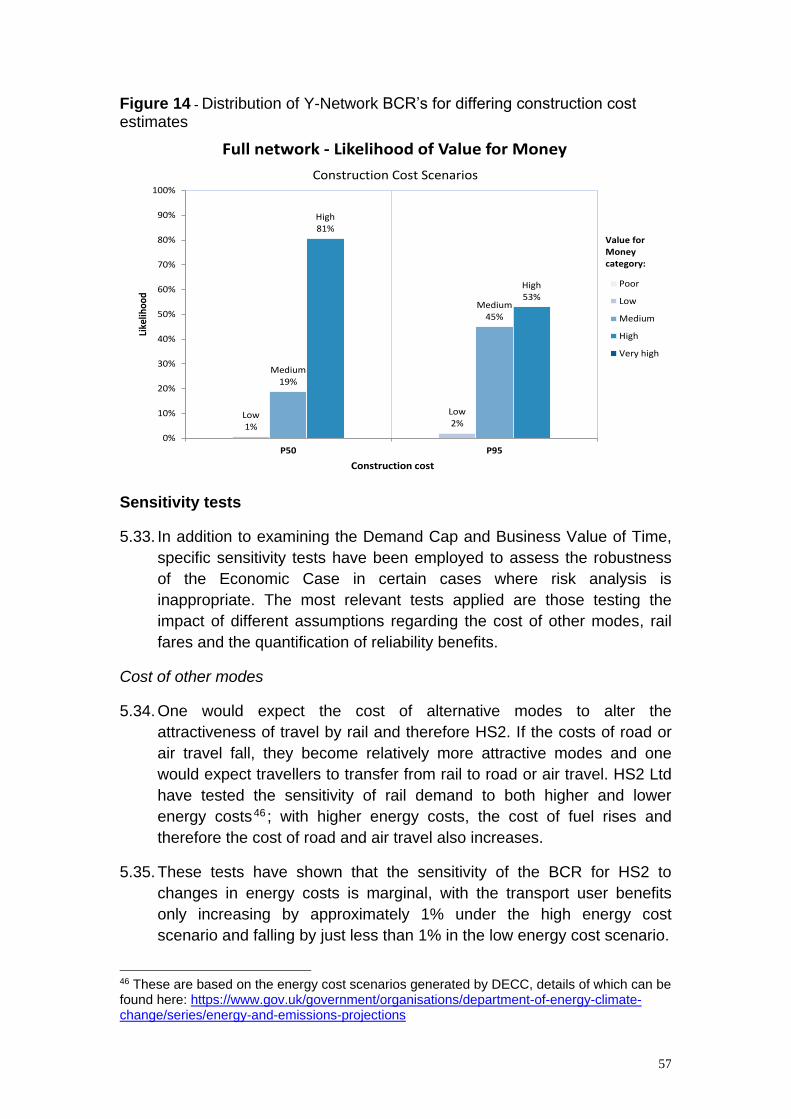
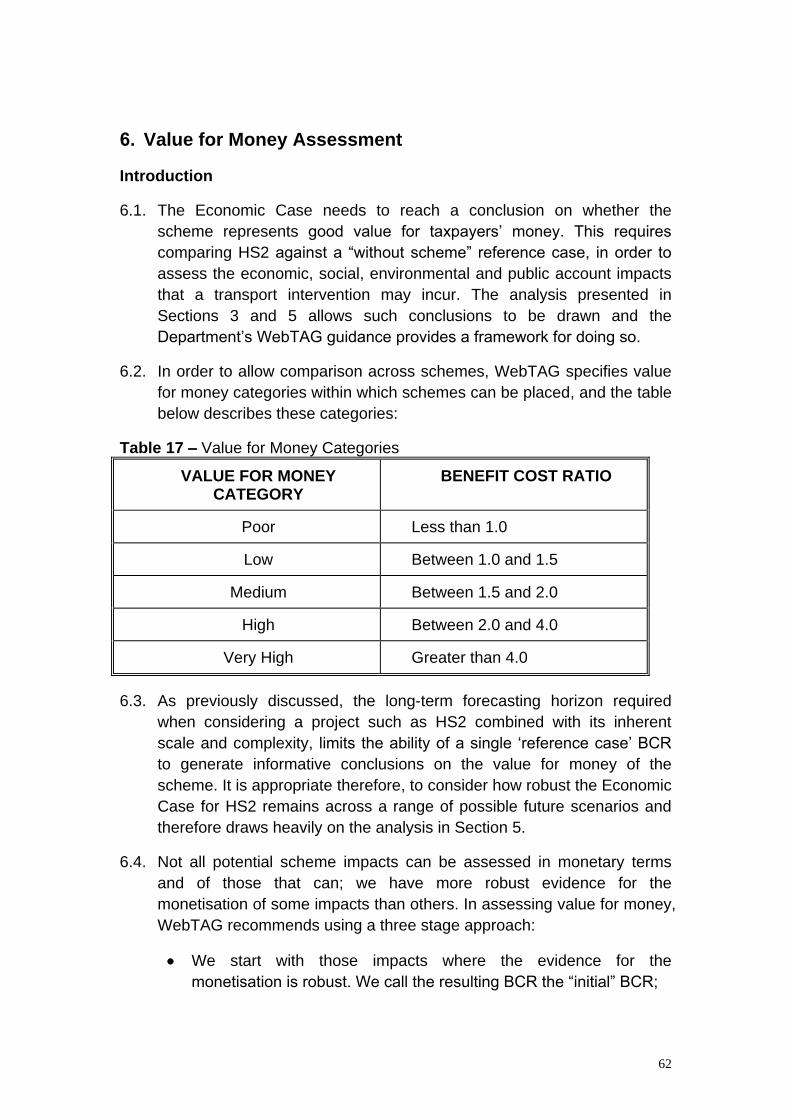
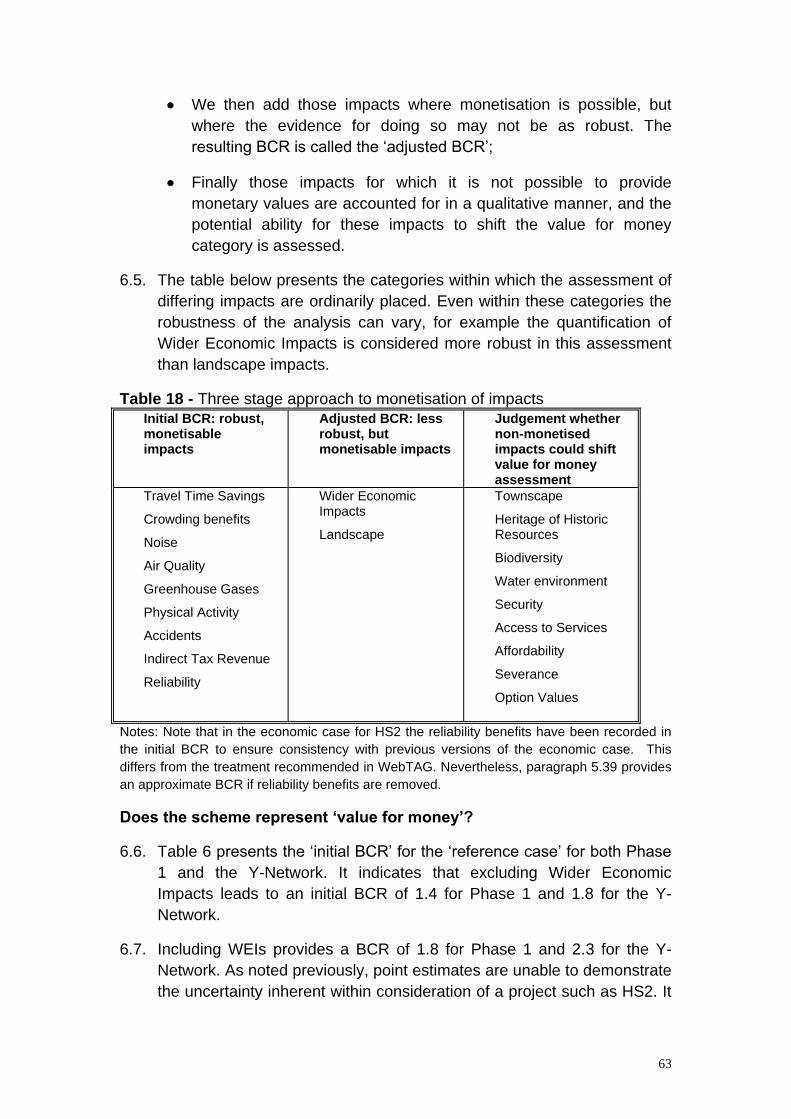
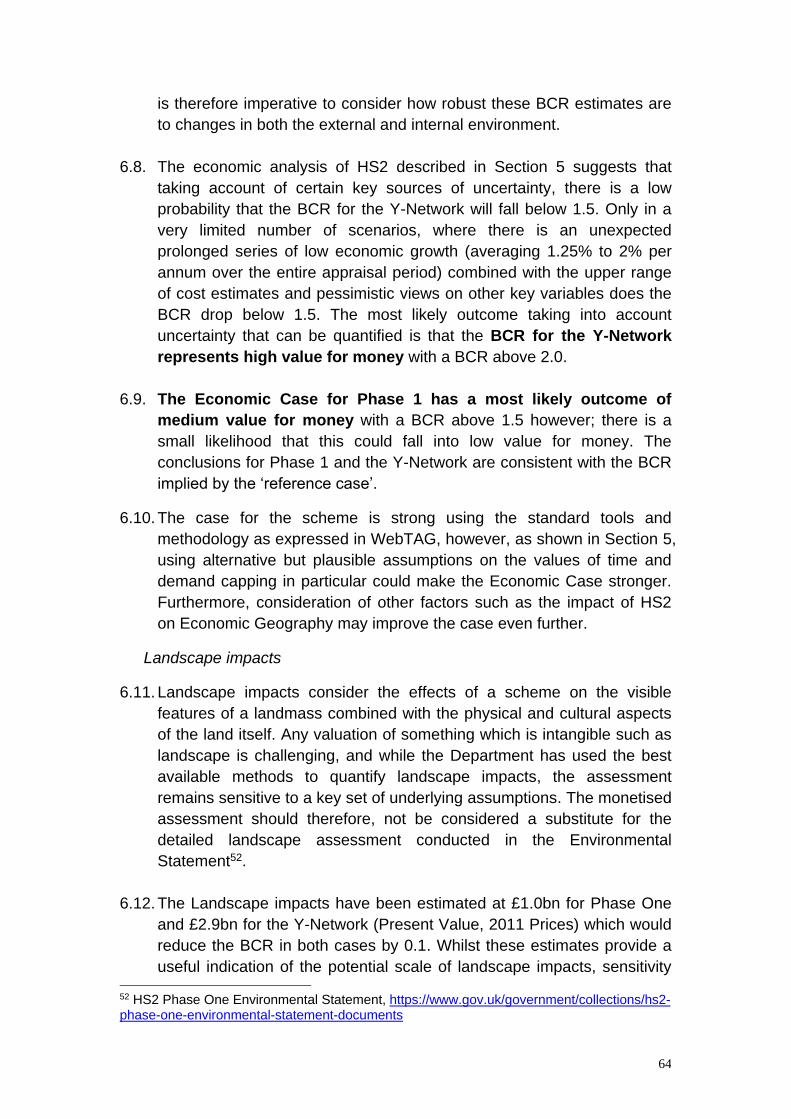