Embed Size (px)
Citation preview
ICES WKARAS REPORT 2011 ICES ADVISORY COMMITTEE
ICES CM 2011/ACOM:42
REF. PGCCDBS
Report of the Workshop on Age Reading of European Atlantic Sardine (WKARAS)
14-18 February 2011
Lisbon, Portugal
International Council for the Exploration of the Sea Conseil International pour l’Exploration de la Mer
H. C. Andersens Boulevard 44–46 DK-1553 Copenhagen V Denmark Telephone (+45) 33 38 67 00 Telefax (+45) 33 93 42 15 www.ices.dk [email protected]
Recommended format for purposes of citation:
ICES. 2011. Report of the Workshop on Age Reading of European Atlantic Sardine (WKARAS) , 14-18 February 2011, Lisbon, Portugal. ICES CM 2011/ACOM:42. 91 pp.
For permission to reproduce material from this publication, please apply to the Gen-eral Secretary.
The document is a report of an Expert Group under the auspices of the International Council for the Exploration of the Sea and does not necessarily represent the views of the Council.
© 2011 International Council for the Exploration of the Sea
ICES WKARAS REPORT 2011 | i
Contents
Executive summary ................................................................................................................ 1
1 Opening of the meeting ................................................................................................ 3
1.1 Terms of reference ................................................................................................ 3
1.2 Participants ............................................................................................................ 3
2 Overview of sardine stock structure and biology .................................................... 6
3 Otolith sampling and preparation .............................................................................. 9
4 Results of the sardine otolith exchange ................................................................... 11
4.1 Age readers experience ...................................................................................... 11 4.2 Material and methods ........................................................................................ 11
4.3 Results .................................................................................................................. 13 4.3.1 Readability .............................................................................................. 13 4.3.2 Age readings comparison ..................................................................... 14 4.3.3 Discussion and conclusions .................................................................. 24
5 Differences in the interpretation of the otolith structure ..................................... 28
6 Studies addressing the main age reading problems ............................................. 34
6.1 Otolith seasonal growth and identification of the edge ................................ 34 6.2 Identification of the first annual ring ............................................................... 36
7 Results of comparative age readings at the Workshop ......................................... 40
8 Evaluation of the 2011 Sardine Otolith Exchange and Workshop ...................... 46
8.1 Otolith readability .............................................................................................. 46 8.2 Between-reader agreement and bias ................................................................ 47
9 The Otolith Reference Collection and development of a future database ......................................................................................................................... 49
10 Manual for the age determination of sardine ......................................................... 50
11 Recommendations and follow up actions ............................................................... 51
12 General conclusions .................................................................................................... 52
13 Contributions to the Workshop (Working Documents and Presentations) ............................................................................................................... 54
14 Acknowledgements ..................................................................................................... 55
15 References ..................................................................................................................... 56
Annex 1: Agenda ................................................................................................................... 58
Annex 2: Age reading criteria protocol (Soares et al., 2007) ......................................... 59

ii | ICES WKARAS REPORT 2011
Annex 3 - Sardine Otolith Exchange 2010 Results: Tables ........................................... 60
Annex 4: Sardine otolith reference collection ................................................................. 68
Annex 6: Recommendations ............................................................................................... 87
ICES WKARAS REPORT 2011 | 1
Executive summary
The Workshop on Age reading of European Atlantic Sardine (WKARAS) was held in Lisbon, Portugal, from 14 to 18 February 2011.
The terms of reference of this Workshop were addressed as specified in Sub-section 1.1.
There were 11 participants in the Workshop from five institutes located in France, Spain and Portugal (Sub-section 1.2). Seven participants had more than 4 years of experience in sardine age reading and are responsible of providing age determina-tions for the assessment of the Iberian sardine stock (Sardine in ICES Sub-Areas VIIIc and IXa) and for the description of the catch and survey age structure of sardine from the Bay of Biscay within the ICES Working Group on Anchovy and Sardine (WGAN-SA). The final Agenda of the Workshop is presented in Annex 1. The activities carried out in the different laboratories regarding otolith sampling, storing and reading methods are presented in Section 3.
This Workshop was preceded by an otolith exchange which was undertaken from September to December 2010 in order to prepare material and data for the workshop (Section 4, Annex 3). Eight readers participated in this exchange, one of them as a guest from the UK with no experience in sardine otolith age reading and therefore whose results were not included in the final analysis of the exchange data.
The otolith exchange included a total of 300 otoliths from samples collected in 2008 spanning the area from ICES Sub-Area VIIIa (Bay of Biscay North) to Sub-Division IXa-South-Cadiz (Gulf of Cadiz). They were prepared and interpreted according to the guidelines in Soares et al. (2007).
The relative accuracy of sardine age determination was generally good: the average percentage of agreement with modal age was 77.0% and 75.2% for the Iberian Stock and the Bay of Biscay respectively and average bias was ca. 0.03 years. Precision was substantially higher in the Bay of Biscay (CV= 14.1%) than that in the Iberian stock area (CV=32.8%), although the latter is strongly influenced by high CVs at age 0 in the Gulf of Cadiz. By excluding age 0, the precision in the Iberian Stock area becomes similar to that in the Bay of Biscay (14.7%), being still above the 5% threshold recom-mended in the PGCCDBS Guidelines for Workshops on Age Calibration.
Compared to the previous Workshop, relative accuracy of sardine age determination within the Iberian Stock area (Cantabrian Sea and South Iberian peninsula areas) has improved substantially and there is less evidence of bias (% of agreement increased ca. 20%) while precision increased in the Cantabrian Sea (CV declined from 17.2 to 15.7%) but decreased in south Iberia (CV increased from 17.6 to 22.0%) (Section 8). In the Bay of Biscay, the relative accuracy was maintained but the precision declined (CV increased from 10.3 to 18.6%).
The identification of the otolith edge and of the first annual ring were the main dis-crepancies between readers in sardine age determination, accounting for 25-53% and 32-43% of the total number of discrepancies in otolith interpretation, respectively (Section 6). These are recurrent issues in sardine age determination (e.g. ICES, 1997; Soares et al., 2007).
The occurrence of a first wide clear translucent ring around the whole otolith slightly closer than typically to the nucleus is generally a source of disagreement among readers, leading part of them to consider it as the first annual ring and the others not.
2 | ICES WKARAS REPORT 2011
The results of an on-going study of otolith seasonal growth showed that the seasonal-ity of the otolith edge varies with fish age, with older individuals forming an opaque edge later in the year for a shorter period as observed in several other clupeids (e.g. anchovy, ICES, 2009a). Marginal growth was also different between the Bay of Biscay and the Portuguese waters, with a longer period of opaque growth in Age 1 individ-uals and more similar seasonal patterns for Ages 2-4 years in the former area.
The attribution of age in years of young individuals was corroborated by preliminary results from the analysis of daily growth rings of sardine juveniles in northern Por-tugal. The diameter of the first annual ring was positively correlated with the fish length at the time of formation. Measurements of ring diameter indicate that the first translucent ring forms at a distance around 1.1 mm from the otolith nucleus, corres-ponding to a diameter around 2 mm. The radius of the potential check did not over-lap with the radius of the true ring (as considered by some readers) but measurements were very close and certainly impossible to discern just by observation of the otolith.
Guidelines related to the age reading problems were modified and their impact on age reading was evaluated by a second reading of a sub-set of the exchange otoliths (Section 7). Changes in relative accuracy and precision between the first and second readings differ among areas: agreement was similar while precision declined sub-stantially in the Gulf of Biscay, generally worse results were obtained for western Portugal and generally better results were obtained for the Gulf of Cadiz.
Although the results available to the workshop did not fully clarify the major age reading uncertainties, the participants considered that sardine age reading would be improved by taking into account age related differences in edge seasonality and by using a flexible gauge to guide the identification of the first annual ring. These changes were accommodated in the age reading protocol (Section 10). Conversely, the present birthdate assumption, 1st of January, was considered to be well adapted to the spawning seasonality and growth pattern of sardine across the area.
A reference collection of annotated (catch area and date, fish length and location of modal rings) otolith digital images was assembled (see Section 9 and image examples in Annex 4). The collection contains 139 otoliths covering the area from northern Gulf of Biscay to the Gulf of Cadiz and Age groups 0-8 years.
Recommendations and follow up actions are presented in Section 11. The Workshop recommends that Age reading Workshops take place regularly at 4-5 years intervals, with participants experienced in the Iberian Stock area, in the Bay of Biscay and in ICES Div. VIIe.
Also the revision of procedures to calculate CV’s by age group, taking into account the problem of inflation observed for age group 0, is recommended.
The Workshop also supports the recommendation of WKARA 2009 to set up of a Workshop on daily ring methodology and interpretation and suggests this is ex-tended to sardine and eventually, to other small pelagic fish (e.g. herring, sprat).
In section 13 a list of the working documents and presentations to WKARAS can be found and the full presentations are available in the ICES WKARAS sharepoint site:
http://groupnet.ices.dk/WKARAS2011/default.aspx.
ICES WKARAS REPORT 2011 | 3
1 Opening of the meeting
The meeting was opened on Monday, 14 February 2011, at IPIMAR, Lisbon and adopted the agenda in Annex 1.
1.1 Terms of reference
According to the resolutions of ICES 2010, the Workshop on Age rea-ding of Euro-pean Atlantic Sardine (WKARAS), was held in Lisbon, Portugal, from 14 to 18 Febru-ary 2011, to:
a ) Estimate (relative) accuracy and precision of sardine age determination in the main fishing areas of the European Atlantic region;
b ) Identify causes of age determination error and provide specific guide-lines for the improvement of precision and reduction of bias between readers and laboratories;
c ) Review age reading conventions and criteria (e.g. related to assump-tions of birth date and seasonality of the otolith edge) and update the age reading protocol.
d ) Create a reference collection of otoliths and start the development of a data base of otolith images from each fishing area;
e ) Address the generic ToRs adopted for workshops on age calibration (see 'PGCCDBS Guidelines for Workshops on Age Calibration').
An otolith exchange was undertaken from September to December 2010 in order to prepare material and data for ToRs , a), b) and d) of WKARAS.
1.2 Participants
The complete list of participants is below. Age readers R1 (Reader 1) to R7 (Reader 7) participated in the exchange and the workshop. Mark Etherton (CEFAS, England) participated in the exchange but could not attend the Workshop. His readings were not included in the analyses since he had no experience in sardine otoliths in the main fishing areas. Andreia Silva and Paula Coelho contributed to discussion of age reading problems during the workshop. Alexandra Silva and Isabel Riveiro are responsible for stock assessment of sardine in VIIIc and IXa within WGANSA.
4 | ICES WKARAS REPORT 2011
Chairs:
Alexandra Silva (IPIMAR, Lisbon, Portugal)
Isabel Riveiro (IEO, Vigo, Spain)
Eduardo Soares (IPIMAR, Lisbon, Portugal)
ICES WKARAS REPORT 2011 | 5
Name Role Address Phone/Fax Email Alexandra Silva Chair
IPIMAR, Av. Brasília, 1449-006 Lisboa, PORTUGAL
(351) 21-3027000 [email protected]
Isabel Riveiro Chair
IEO- Centro Oceanografico de Vigo,Cabo Estay – Canido 36200 Vigo, SPAIN
34 986-492111 [email protected]
Eduardo Soares Chair Reader 2
IPIMAR, Av. Brasília, 1449-006 Lisboa, PORTUGAL
(351) 21-3027000 [email protected]
Delfina Morais Reader 1 IPIMAR, Av. Brasília, 1449-006 Lisboa, PORTUGAL
(351) 21-3027000 [email protected]
Raquel Milhazes Reader 4 IPIMAR, CRIP-Norte, Matosinhos, PORTUGAL
Iñaki Rico Reader 7 Fundación AZTI Herrera kaia Portualde z/g 20110 PASAIA Gipuzkoa, SPAIN
Quena Peleteiro Reader 3 IEO- Centro Oceanografico de Vigo,Cabo Estay – Canido 36200 Vigo, SPAIN
34 986-492111 [email protected]
Isabel Loureiro Reader 5 IEO- Centro Oceanografico de Vigo,Cabo Estay – Canido 36200 Vigo, SPAIN
34 986-492111 [email protected]
Erwan Duhamel Reader 6 IFREMER – Lorient, Station Lorient FRANCE
Andreia V. Silva Observer (part time)
IPIMAR, Av. Brasília, 1449-006 Lisboa, PORTUGAL
(351) 21-3027000 [email protected]
Paula Coelho Observer (Part time)
IPIMAR, Av. Brasília, 1449-006 Lisboa, PORTUGAL
(351) 21-3027000 [email protected]
Mark Etherton Observer
Cefas, Pakefield Road, Lowestoft, Suffolk NR33 0HT, ENGLAND
6 | ICES WKARAS REPORT 2011
2 Overview of sardine stock structure and biology
Sardine is distributed in the Northeast Atlantic from the southern Celtic Sea and North Sea to Mauritania and Senegal, and also across the western and northern Medi-terranean Sea (Parrish et al., 1989). Within European Atlantic waters, sardine is main-ly fished in the coastal waters of the Iberian Peninsula by Spanish and Portuguese purse seiners, in the Bay of Biscay by purse seiners and trawlers (ICES, 2007) and in the English Channel by driftnets (Culley, 1971).
From the results of the SARDYN Project and other recent studies (e.g. Anon., 2006; Laurent et al., 2007; Gonzalez and Zardoya, 2007), there is a single genetic stock of sardine in the north-Atlantic, which spans the continental waters from the Agadir area in north Morocco to the North Sea. Other evidence, such as the distribution of eggs and adult fish, body morphology and growth suggest mixing between sardine from ICES Sub-Area VIIIa and b and the actual assessed stock area. The extent of such mixing is still uncertain. However, area-based assessment trials (Anon., 2006) indicated that mutual influence on population dynamics occurs mainly via migration of juvenile individuals at a local scale, i.e. sardine distributed in the southern Bay of Biscay (ICES Sub-Area VIIIb) are likely to affect the dynamics of sardine in the Can-tabrian area (ICES Sub-Area VIIIc) but the influence on the whole Iberian stock is limited.
For management purposes, sardine from the Iberian Peninsula waters (ICES Sub-Areas VIIIc and IXa) is considered to be a separate stock from sardine in northward areas (ICES Sub-Areas VII and VIIIa,b) (ICES, 2010). At present, there is no request to assess or manage sardine outside the Sub-Areas VIIIc and IXa stock. However, fishe-ries have increased in Sub-Areas VIIIa, b and further North, catch and survey data are being collected and provided to WGANSA and management advice may be re-quired in the future.
Sardine is a batch spawner with indeterminate fecundity (e.g. Ganias et al., 2007). The main spawning period is between October and June (peak December ‒ March), with a latitudinal gradient in the duration and peak of the season, i. e. longer duration and earlier peak in the south (e.g. Coombs et al., 2006; Stratoudakis et al., 2007). Off the Portuguese waters, the duration of the spawning season is 5-7 months and the peak varies between December and February (Nunes et al., 2011). From western Iberia to northern France, peak spawning shifts progressively to late spring months and in the English Channel there is a clear double peak, with the main periods of spawning occurring in spring/summer and again in the autumn (Southward et al., 1988; Solá et al., 1992; Stratoudakis et al., 2007).
Growth is strongly seasonal, taking place mostly outside the spawning period. Growth in length is greater in late spring and summer. Body condition and fat con-tent of sardines peak in early autumn (when spawning resumes), and the lowest val-ues are observed in late winter/early spring with the cessation of spawning (Bandarra et al., 1997; Nunes et al., in press). In the Iberian-Biscay region, sardine grows from 15.3 cm (S.E. = 0.41 cm) at age 1 to 23.0 cm (S.E. = 0.02 cm) at age 10. Annual growth in-crements decline 64% in each successive age (k = 0.44 year−1, S.E. = 0.06 year−1) such that individuals attain 67% and 90% of their maximum length at ages 1 and 4 respec-tively (Silva et al., 2008). Growth declines from north to south resulting in clinal varia-tion in maximum length and length-at-age (Andreu and Plaza, 1962; Silva et al., 2008). Geographical variations are generally smooth but result in substantial differences when distant areas are compared; for example, at young ages, sardines from north
ICES WKARAS REPORT 2011 | 7
France are larger than those from north Portugal by ca. 2 cm, and the latter are larger than those from the Gulf of Cadiz by ca. 1 cm. Male and female sardines have diverg-ing growth trajectories, however the difference in length is small up to age 6 (Silva et al., 2008).
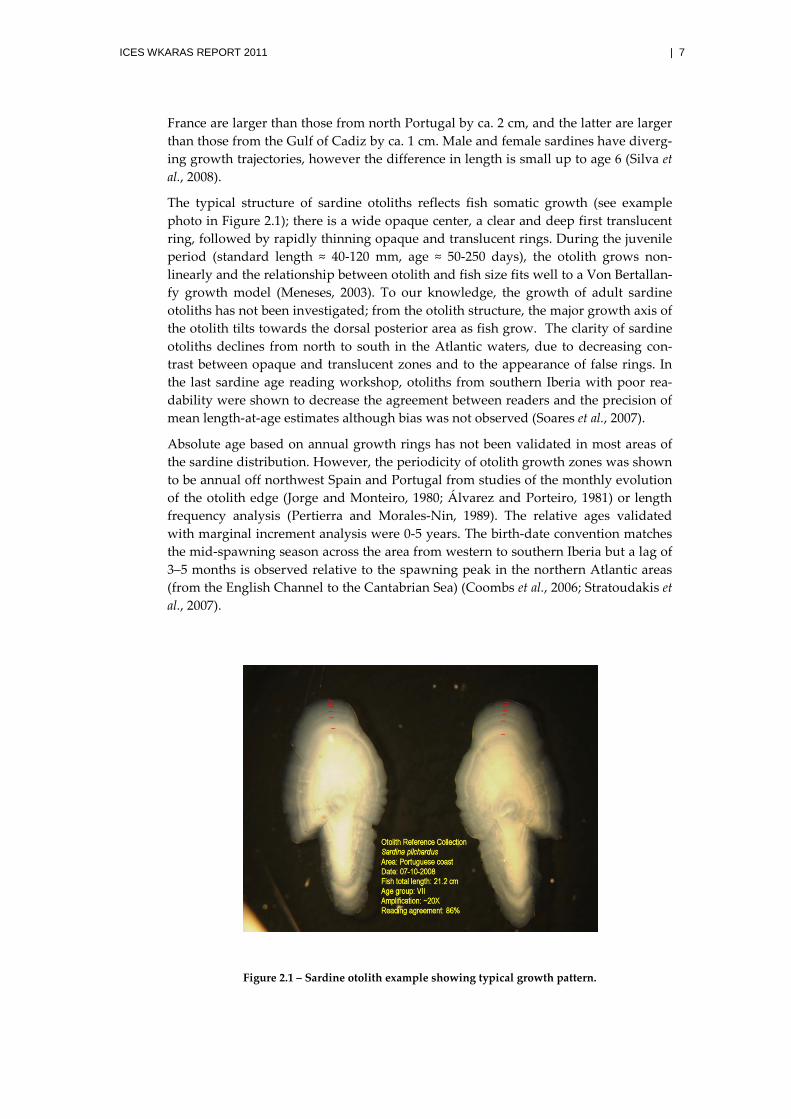
The typical structure of sardine otoliths reflects fish somatic growth (see example photo in Figure 2.1); there is a wide opaque center, a clear and deep first translucent ring, followed by rapidly thinning opaque and translucent rings. During the juvenile period (standard length ≈ 40-120 mm, age ≈ 50-250 days), the otolith grows non-linearly and the relationship between otolith and fish size fits well to a Von Bertallan-fy growth model (Meneses, 2003). To our knowledge, the growth of adult sardine otoliths has not been investigated; from the otolith structure, the major growth axis of the otolith tilts towards the dorsal posterior area as fish grow. The clarity of sardine otoliths declines from north to south in the Atlantic waters, due to decreasing con-trast between opaque and translucent zones and to the appearance of false rings. In the last sardine age reading workshop, otoliths from southern Iberia with poor rea-dability were shown to decrease the agreement between readers and the precision of mean length-at-age estimates although bias was not observed (Soares et al., 2007).
Absolute age based on annual growth rings has not been validated in most areas of the sardine distribution. However, the periodicity of otolith growth zones was shown to be annual off northwest Spain and Portugal from studies of the monthly evolution of the otolith edge (Jorge and Monteiro, 1980; Álvarez and Porteiro, 1981) or length frequency analysis (Pertierra and Morales-Nin, 1989). The relative ages validated with marginal increment analysis were 0-5 years. The birth-date convention matches the mid-spawning season across the area from western to southern Iberia but a lag of 3–5 months is observed relative to the spawning peak in the northern Atlantic areas (from the English Channel to the Cantabrian Sea) (Coombs et al., 2006; Stratoudakis et al., 2007).
Figure 2.1 – Sardine otolith example showing typical growth pattern.
8 | ICES WKARAS REPORT 2011
Age-length keys for the assessment of sardine in ICES Sub-Areas VIIIc and IXa are derived from catch and survey otolith samples (ICES, 2010: Sardine stock annex). In Spain, samples for age-length keys for catch data are pooled on a half year basis; in Portugal and France, age length keys are compiled on a quarterly basis. In all cases, age-length keys are compiled for each ICES Sub-Division (VIIIa+b, VIIIc-East, VIIIc-West, IXa-North, IXa-Central-North, IXa-Central-South, IXa-South-Algarve and IXa-South-Cadiz). The age-length keys for survey data are compiled by ICES Sub-Division.
ICES WKARAS REPORT 2011 | 9
3 Otolith sampling and preparation
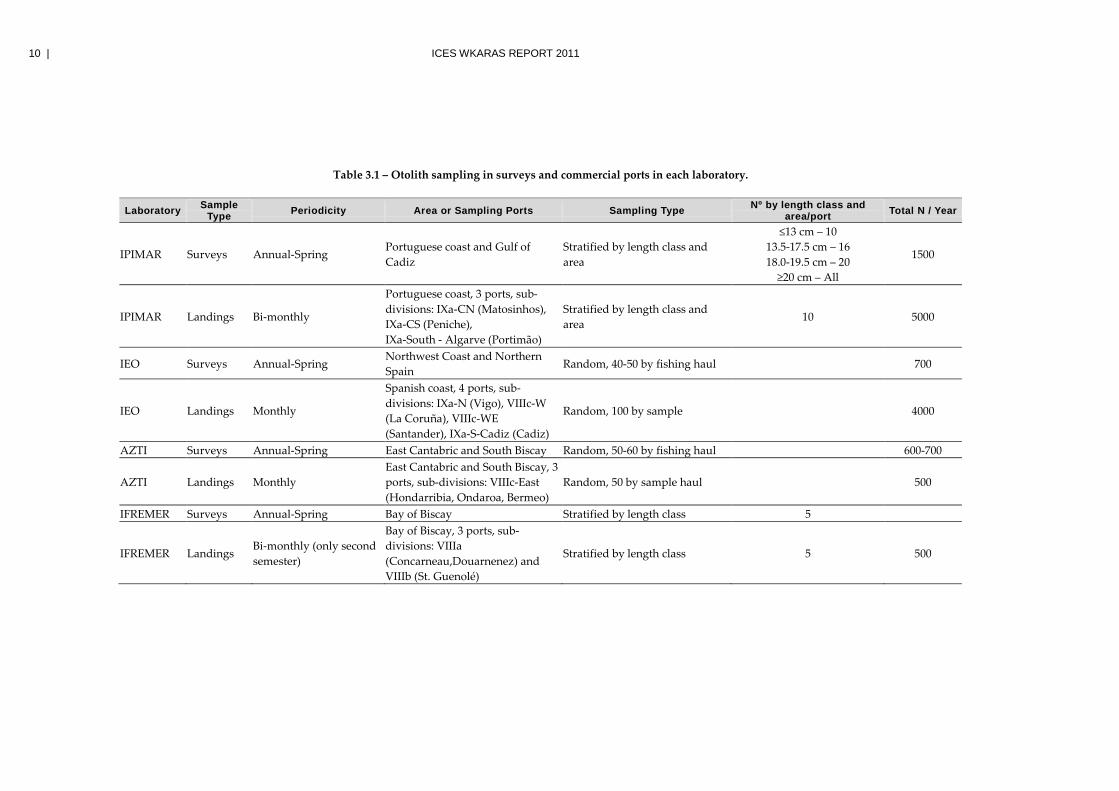
The methodology and procedures used by each laboratory for otolith sampling, preparation and reading in the different areas of sardine distribution were discussed at the workshop. The sampling design followed in surveys and commercial ports in each laboratory is summarized in Table 3.1.
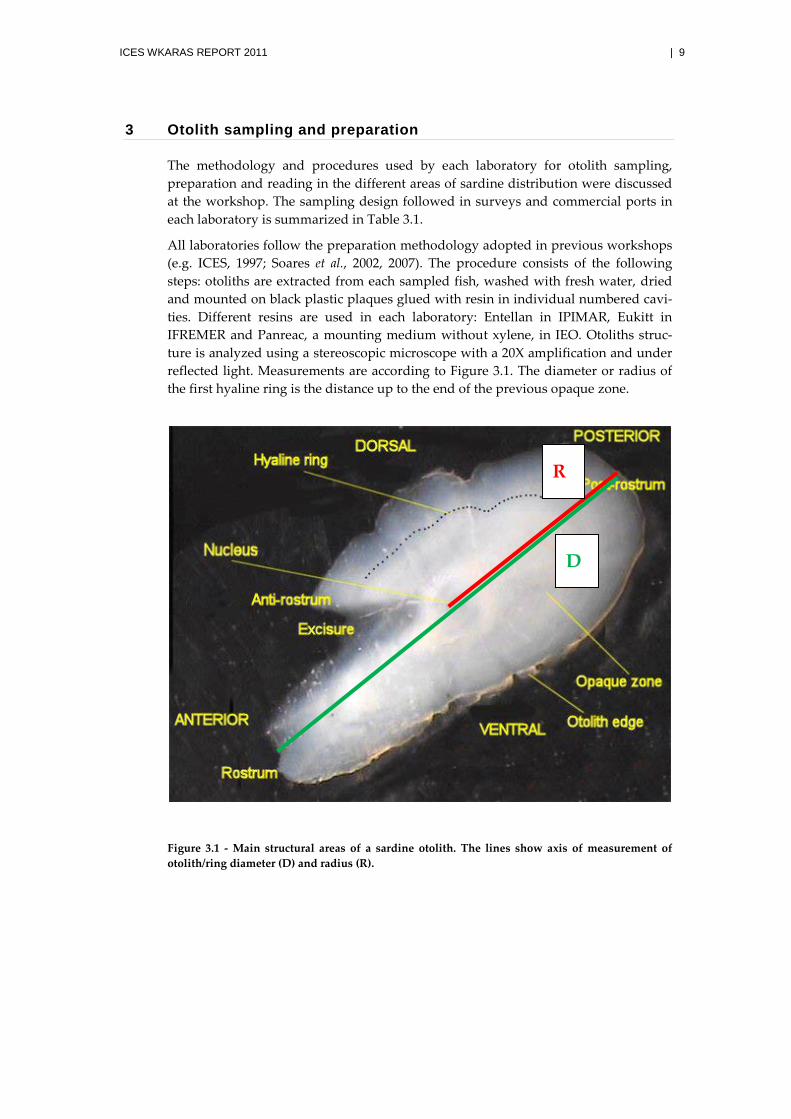
All laboratories follow the preparation methodology adopted in previous workshops (e.g. ICES, 1997; Soares et al., 2002, 2007). The procedure consists of the following steps: otoliths are extracted from each sampled fish, washed with fresh water, dried and mounted on black plastic plaques glued with resin in individual numbered cavi-ties. Different resins are used in each laboratory: Entellan in IPIMAR, Eukitt in IFREMER and Panreac, a mounting medium without xylene, in IEO. Otoliths struc-ture is analyzed using a stereoscopic microscope with a 20X amplification and under reflected light. Measurements are according to Figure 3.1. The diameter or radius of the first hyaline ring is the distance up to the end of the previous opaque zone.
Figure 3.1 - Main structural areas of a sardine otolith. The lines show axis of measurement of otolith/ring diameter (D) and radius (R).
R
D
10 | ICES WKARAS REPORT 2011
Table 3.1 – Otolith sampling in surveys and commercial ports in each laboratory.
Laboratory Sample Type Periodicity Area or Sampling Ports Sampling Type Nº by length class and
area/port Total N / Year
IPIMAR Surveys Annual-Spring Portuguese coast and Gulf of Cadiz
Stratified by length class and area
≤13 cm – 10 13.5-17.5 cm – 16 18.0-19.5 cm – 20
≥20 cm – All
1500
IPIMAR Landings Bi-monthly
Portuguese coast, 3 ports, sub-divisions: IXa-CN (Matosinhos), IXa-CS (Peniche), IXa-South - Algarve (Portimão)
Stratified by length class and area 10 5000
IEO Surveys Annual-Spring Northwest Coast and Northern Spain Random, 40-50 by fishing haul
700
IEO Landings Monthly
Spanish coast, 4 ports, sub-divisions: IXa-N (Vigo), VIIIc-W (La Coruña), VIIIc-WE (Santander), IXa-S-Cadiz (Cadiz)
Random, 100 by sample
4000
AZTI Surveys Annual-Spring East Cantabric and South Biscay Random, 50-60 by fishing haul
600-700
AZTI Landings Monthly East Cantabric and South Biscay, 3 ports, sub-divisions: VIIIc-East (Hondarribia, Ondaroa, Bermeo)
Random, 50 by sample haul
500
IFREMER Surveys Annual-Spring Bay of Biscay Stratified by length class 5
IFREMER Landings Bi-monthly (only second semester)
Bay of Biscay, 3 ports, sub-divisions: VIIIa (Concarneau,Douarnenez) and VIIIb (St. Guenolé)
Stratified by length class 5 500
ICES WKARAS REPORT 2011 | 11
4 Results of the sardine otolith exchange
4.1 Age readers experience
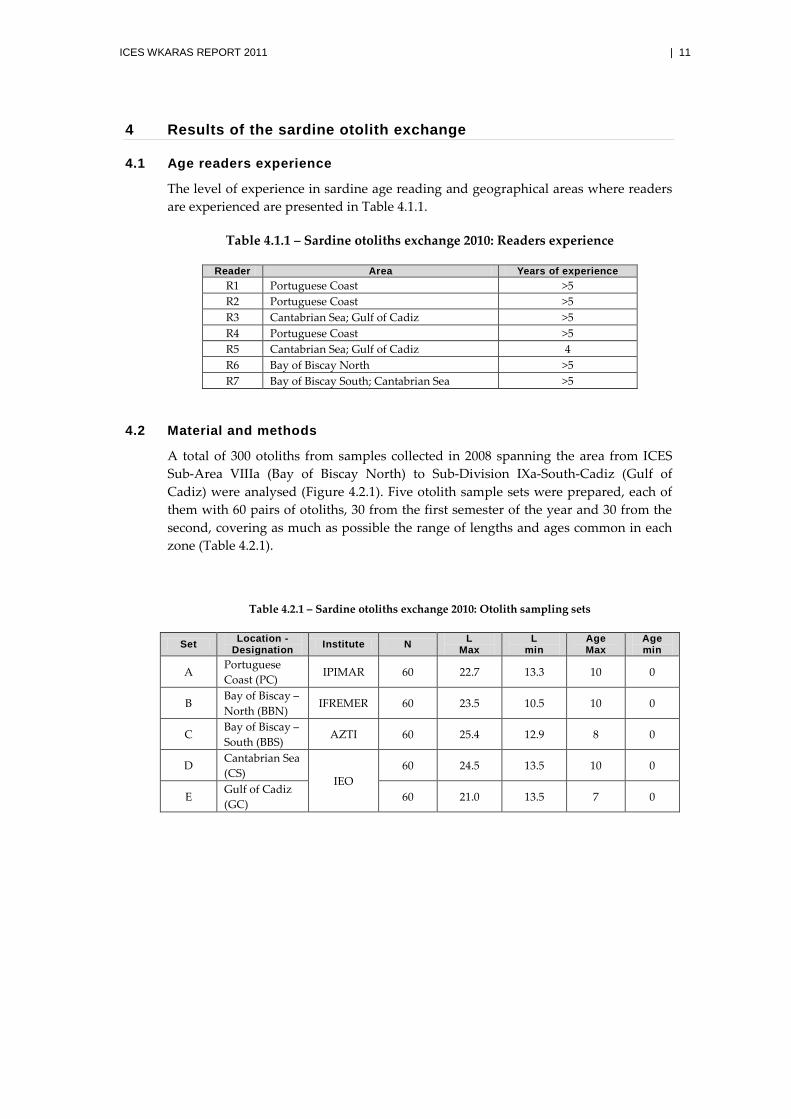
The level of experience in sardine age reading and geographical areas where readers are experienced are presented in Table 4.1.1.
Table 4.1.1 – Sardine otoliths exchange 2010: Readers experience
Reader Area Years of experience R1 Portuguese Coast >5 R2 Portuguese Coast >5 R3 Cantabrian Sea; Gulf of Cadiz >5 R4 Portuguese Coast >5 R5 Cantabrian Sea; Gulf of Cadiz 4 R6 Bay of Biscay North >5 R7 Bay of Biscay South; Cantabrian Sea >5
4.2 Material and methods
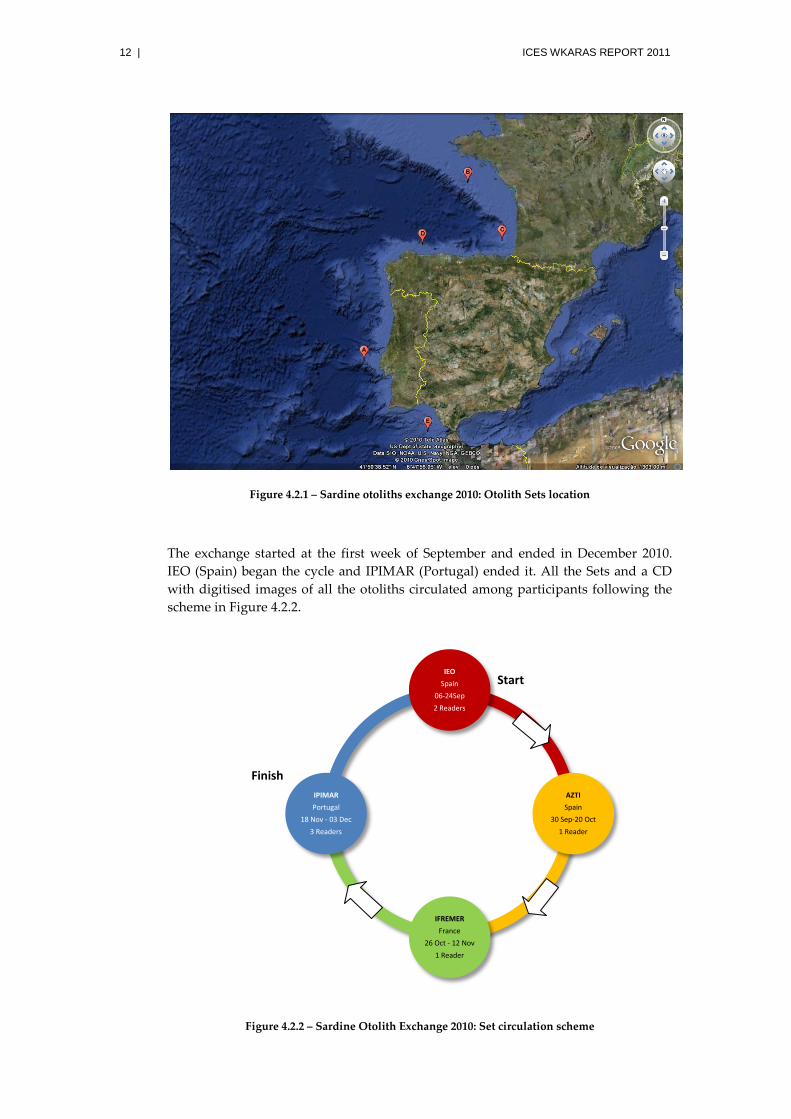
A total of 300 otoliths from samples collected in 2008 spanning the area from ICES Sub-Area VIIIa (Bay of Biscay North) to Sub-Division IXa-South-Cadiz (Gulf of Cadiz) were analysed (Figure 4.2.1). Five otolith sample sets were prepared, each of them with 60 pairs of otoliths, 30 from the first semester of the year and 30 from the second, covering as much as possible the range of lengths and ages common in each zone (Table 4.2.1).
Table 4.2.1 – Sardine otoliths exchange 2010: Otolith sampling sets
Set Location - Designation Institute N L
Max L
min Age Max
Age min
A Portuguese Coast (PC)
IPIMAR 60 22.7 13.3 10 0
B Bay of Biscay – North (BBN)
IFREMER 60 23.5 10.5 10 0
C Bay of Biscay – South (BBS)
AZTI 60 25.4 12.9 8 0
D Cantabrian Sea (CS)
IEO 60 24.5 13.5 10 0
E Gulf of Cadiz (GC) 60 21.0 13.5 7 0
12 | ICES WKARAS REPORT 2011
Figure 4.2.1 – Sardine otoliths exchange 2010: Otolith Sets location
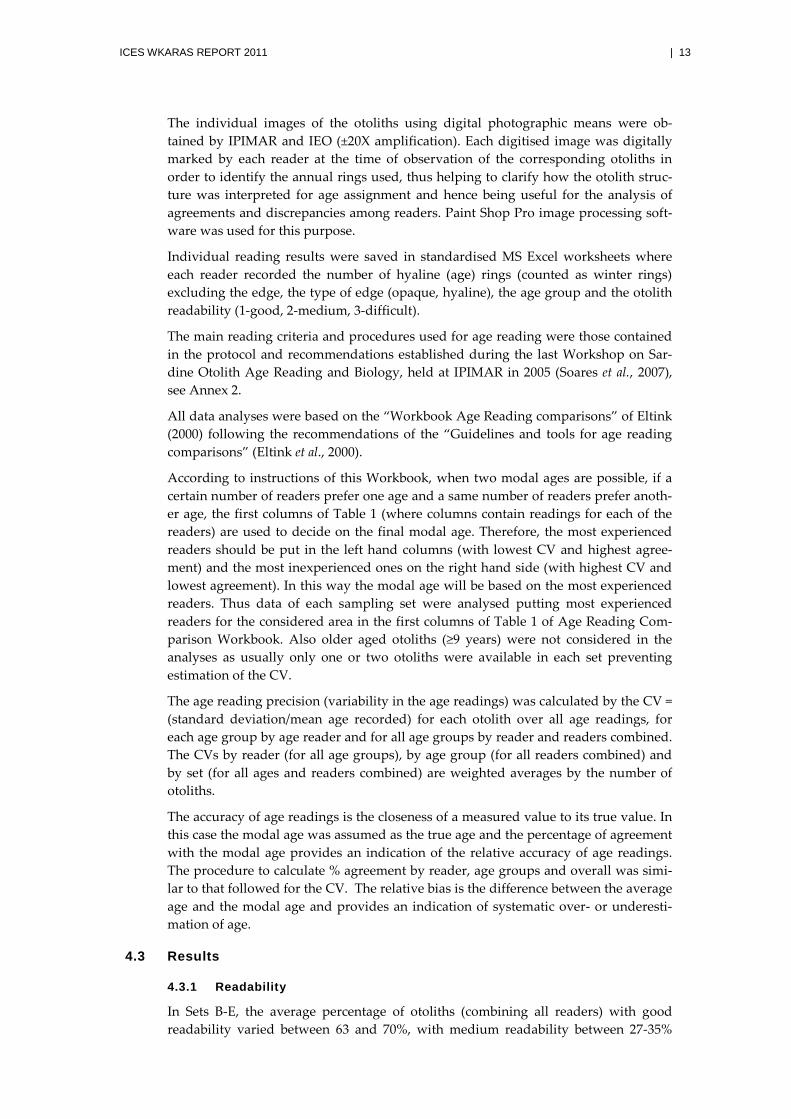
The exchange started at the first week of September and ended in December 2010. IEO (Spain) began the cycle and IPIMAR (Portugal) ended it. All the Sets and a CD with digitised images of all the otoliths circulated among participants following the scheme in Figure 4.2.2.
Figure 4.2.2 – Sardine Otolith Exchange 2010: Set circulation scheme
IEOSpain
06-24Sep2 Readers
AZTISpain
30 Sep-20 Oct1 Reader
IFREMERFrance
26 Oct - 12 Nov1 Reader
IPIMARPortugal
18 Nov - 03 Dec3 Readers
Start
Finish
ICES WKARAS REPORT 2011 | 13
The individual images of the otoliths using digital photographic means were ob-tained by IPIMAR and IEO (±20X amplification). Each digitised image was digitally marked by each reader at the time of observation of the corresponding otoliths in order to identify the annual rings used, thus helping to clarify how the otolith struc-ture was interpreted for age assignment and hence being useful for the analysis of agreements and discrepancies among readers. Paint Shop Pro image processing soft-ware was used for this purpose.
Individual reading results were saved in standardised MS Excel worksheets where each reader recorded the number of hyaline (age) rings (counted as winter rings) excluding the edge, the type of edge (opaque, hyaline), the age group and the otolith readability (1-good, 2-medium, 3-difficult).
The main reading criteria and procedures used for age reading were those contained in the protocol and recommendations established during the last Workshop on Sar-dine Otolith Age Reading and Biology, held at IPIMAR in 2005 (Soares et al., 2007), see Annex 2.
All data analyses were based on the “Workbook Age Reading comparisons” of Eltink (2000) following the recommendations of the “Guidelines and tools for age reading comparisons” (Eltink et al., 2000).
According to instructions of this Workbook, when two modal ages are possible, if a certain number of readers prefer one age and a same number of readers prefer anoth-er age, the first columns of Table 1 (where columns contain readings for each of the readers) are used to decide on the final modal age. Therefore, the most experienced readers should be put in the left hand columns (with lowest CV and highest agree-ment) and the most inexperienced ones on the right hand side (with highest CV and lowest agreement). In this way the modal age will be based on the most experienced readers. Thus data of each sampling set were analysed putting most experienced readers for the considered area in the first columns of Table 1 of Age Reading Com-parison Workbook. Also older aged otoliths (≥9 years) were not considered in the analyses as usually only one or two otoliths were available in each set preventing estimation of the CV.
The age reading precision (variability in the age readings) was calculated by the CV = (standard deviation/mean age recorded) for each otolith over all age readings, for each age group by age reader and for all age groups by reader and readers combined. The CVs by reader (for all age groups), by age group (for all readers combined) and by set (for all ages and readers combined) are weighted averages by the number of otoliths.
The accuracy of age readings is the closeness of a measured value to its true value. In this case the modal age was assumed as the true age and the percentage of agreement with the modal age provides an indication of the relative accuracy of age readings. The procedure to calculate % agreement by reader, age groups and overall was simi-lar to that followed for the CV. The relative bias is the difference between the average age and the modal age and provides an indication of systematic over- or underesti-mation of age.
4.3 Results
4.3.1 Readability
In Sets B-E, the average percentage of otoliths (combining all readers) with good readability varied between 63 and 70%, with medium readability between 27-35%
14 | ICES WKARAS REPORT 2011
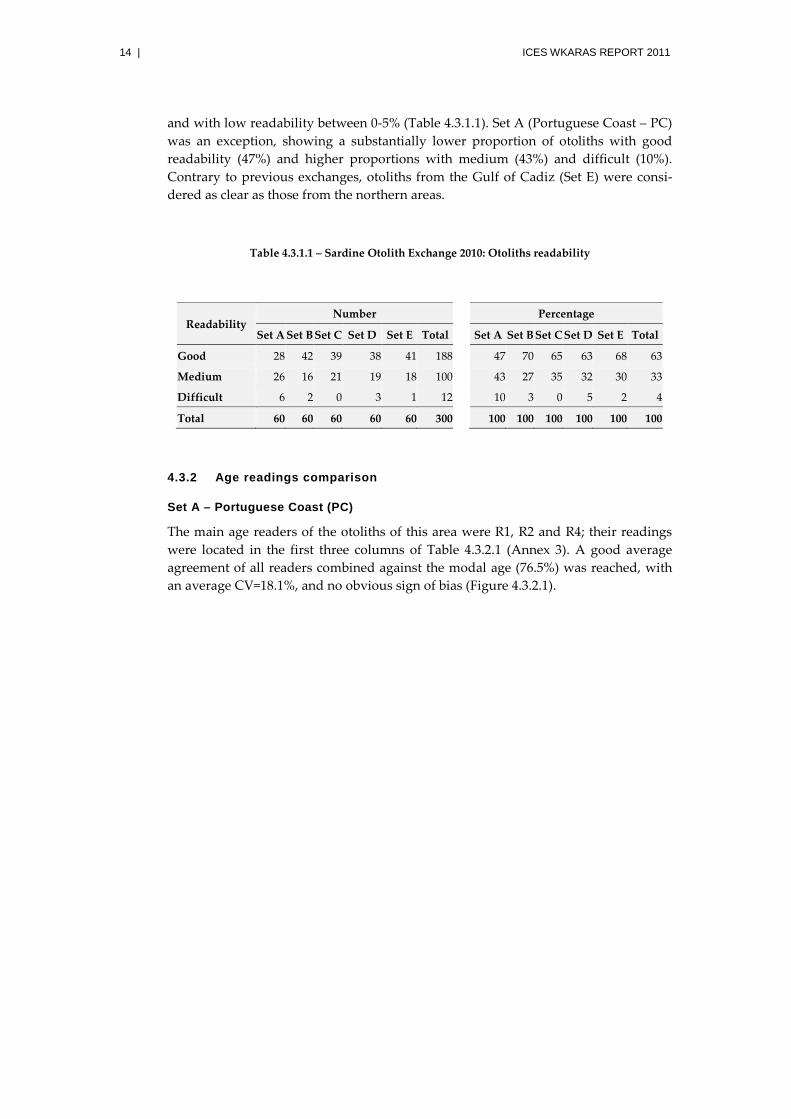
and with low readability between 0-5% (Table 4.3.1.1). Set A (Portuguese Coast – PC) was an exception, showing a substantially lower proportion of otoliths with good readability (47%) and higher proportions with medium (43%) and difficult (10%). Contrary to previous exchanges, otoliths from the Gulf of Cadiz (Set E) were consi-dered as clear as those from the northern areas.
Table 4.3.1.1 – Sardine Otolith Exchange 2010: Otoliths readability
Readability Number Percentage
Set A Set B Set C Set D Set E Total Set A Set B Set C Set D Set E Total
Good 28 42 39 38 41 188
47 70 65 63 68 63
Medium 26 16 21 19 18 100
43 27 35 32 30 33
Difficult 6 2 0 3 1 12
10 3 0 5 2 4
Total 60 60 60 60 60 300
100 100 100 100 100 100
4.3.2 Age readings comparison
Set A – Portuguese Coast (PC)
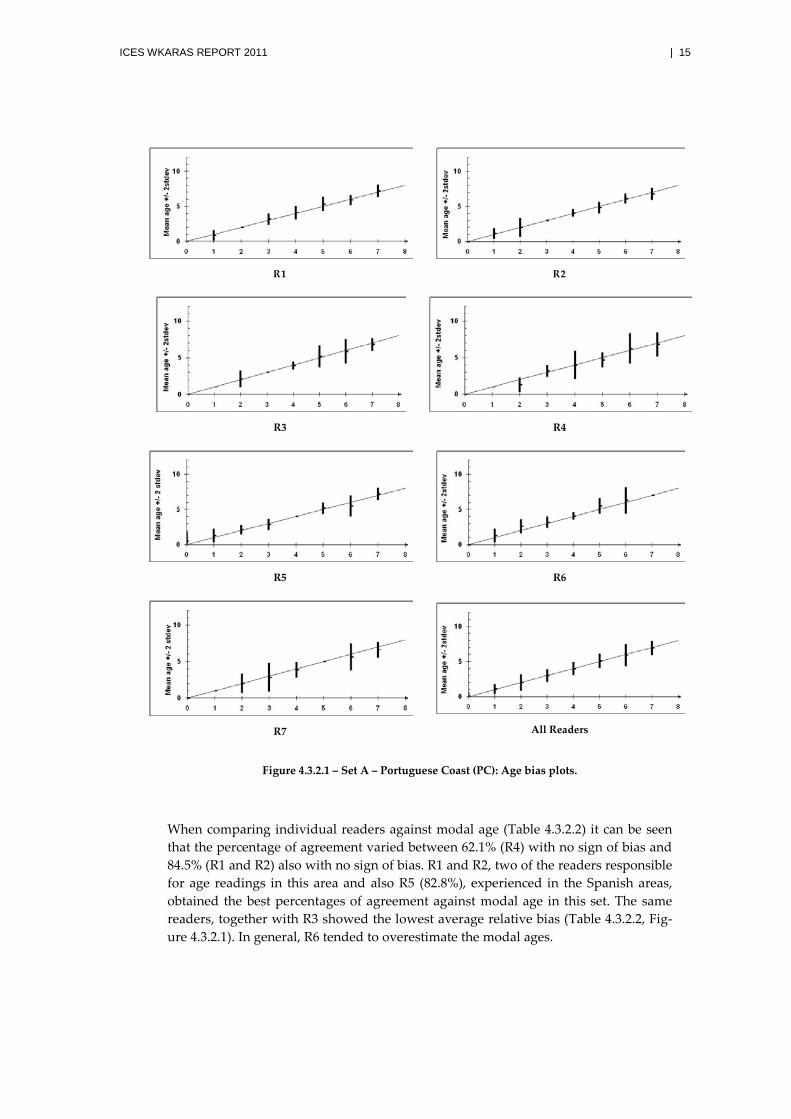
The main age readers of the otoliths of this area were R1, R2 and R4; their readings were located in the first three columns of Table 4.3.2.1 (Annex 3). A good average agreement of all readers combined against the modal age (76.5%) was reached, with an average CV=18.1%, and no obvious sign of bias (Figure 4.3.2.1).
ICES WKARAS REPORT 2011 | 15
R1
R2
R3
R4
R5
R6
R7
All Readers
Figure 4.3.2.1 – Set A – Portuguese Coast (PC): Age bias plots.
When comparing individual readers against modal age (Table 4.3.2.2) it can be seen that the percentage of agreement varied between 62.1% (R4) with no sign of bias and 84.5% (R1 and R2) also with no sign of bias. R1 and R2, two of the readers responsible for age readings in this area and also R5 (82.8%), experienced in the Spanish areas, obtained the best percentages of agreement against modal age in this set. The same readers, together with R3 showed the lowest average relative bias (Table 4.3.2.2, Fig-ure 4.3.2.1). In general, R6 tended to overestimate the modal ages.
16 | ICES WKARAS REPORT 2011
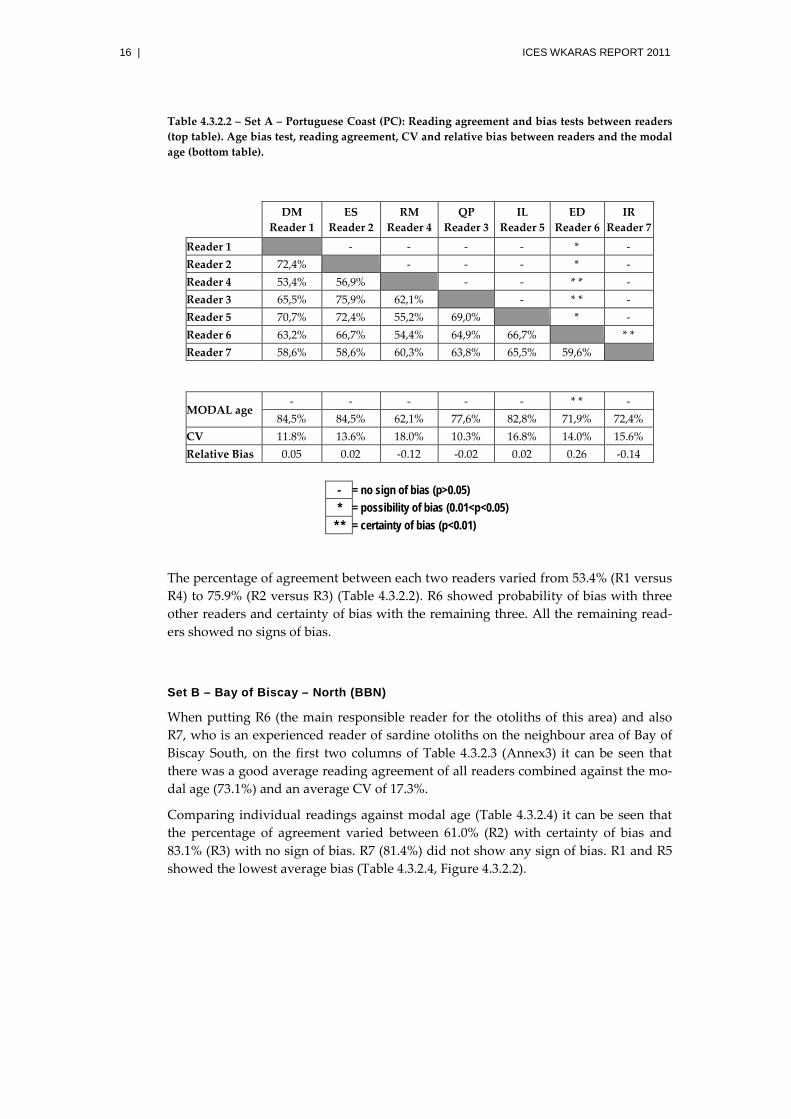
Table 4.3.2.2 – Set A – Portuguese Coast (PC): Reading agreement and bias tests between readers (top table). Age bias test, reading agreement, CV and relative bias between readers and the modal age (bottom table).
DM Reader 1
ES Reader 2
RM Reader 4
QP Reader 3
IL Reader 5
ED Reader 6
IR Reader 7
Reader 1 - - - - * - Reader 2 72,4%
- - - * -
Reader 4 53,4% 56,9% - - * * - Reader 3 65,5% 75,9% 62,1%
- * * -
Reader 5 70,7% 72,4% 55,2% 69,0%
* - Reader 6 63,2% 66,7% 54,4% 64,9% 66,7%
* *
Reader 7 58,6% 58,6% 60,3% 63,8% 65,5% 59,6%
MODAL age - - - - - * * -
84,5% 84,5% 62,1% 77,6% 82,8% 71,9% 72,4% CV 11.8% 13.6% 18.0% 10.3% 16.8% 14.0% 15.6% Relative Bias 0.05 0.02 -0.12 -0.02 0.02 0.26 -0.14
- = no sign of bias (p>0.05) * = possibility of bias (0.01<p<0.05)
* * = certainty of bias (p<0.01)
The percentage of agreement between each two readers varied from 53.4% (R1 versus R4) to 75.9% (R2 versus R3) (Table 4.3.2.2). R6 showed probability of bias with three other readers and certainty of bias with the remaining three. All the remaining read-ers showed no signs of bias.
Set B – Bay of Biscay – North (BBN)
When putting R6 (the main responsible reader for the otoliths of this area) and also R7, who is an experienced reader of sardine otoliths on the neighbour area of Bay of Biscay South, on the first two columns of Table 4.3.2.3 (Annex3) it can be seen that there was a good average reading agreement of all readers combined against the mo-dal age (73.1%) and an average CV of 17.3%.
Comparing individual readings against modal age (Table 4.3.2.4) it can be seen that the percentage of agreement varied between 61.0% (R2) with certainty of bias and 83.1% (R3) with no sign of bias. R7 (81.4%) did not show any sign of bias. R1 and R5 showed the lowest average bias (Table 4.3.2.4, Figure 4.3.2.2).
ICES WKARAS REPORT 2011 | 17
R1
R2
R3
R4
R5
R6
R7
All Readers
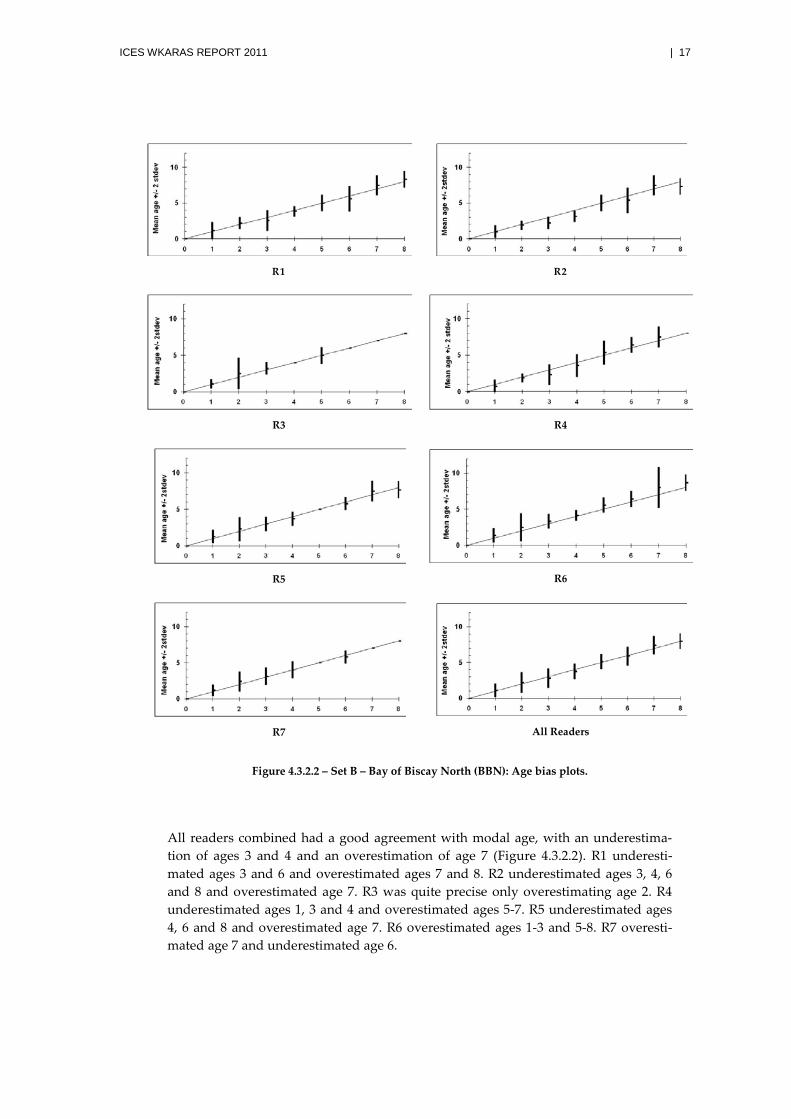
Figure 4.3.2.2 – Set B – Bay of Biscay North (BBN): Age bias plots.
All readers combined had a good agreement with modal age, with an underestima-tion of ages 3 and 4 and an overestimation of age 7 (Figure 4.3.2.2). R1 underesti-mated ages 3 and 6 and overestimated ages 7 and 8. R2 underestimated ages 3, 4, 6 and 8 and overestimated age 7. R3 was quite precise only overestimating age 2. R4 underestimated ages 1, 3 and 4 and overestimated ages 5-7. R5 underestimated ages 4, 6 and 8 and overestimated age 7. R6 overestimated ages 1-3 and 5-8. R7 overesti-mated age 7 and underestimated age 6.
18 | ICES WKARAS REPORT 2011
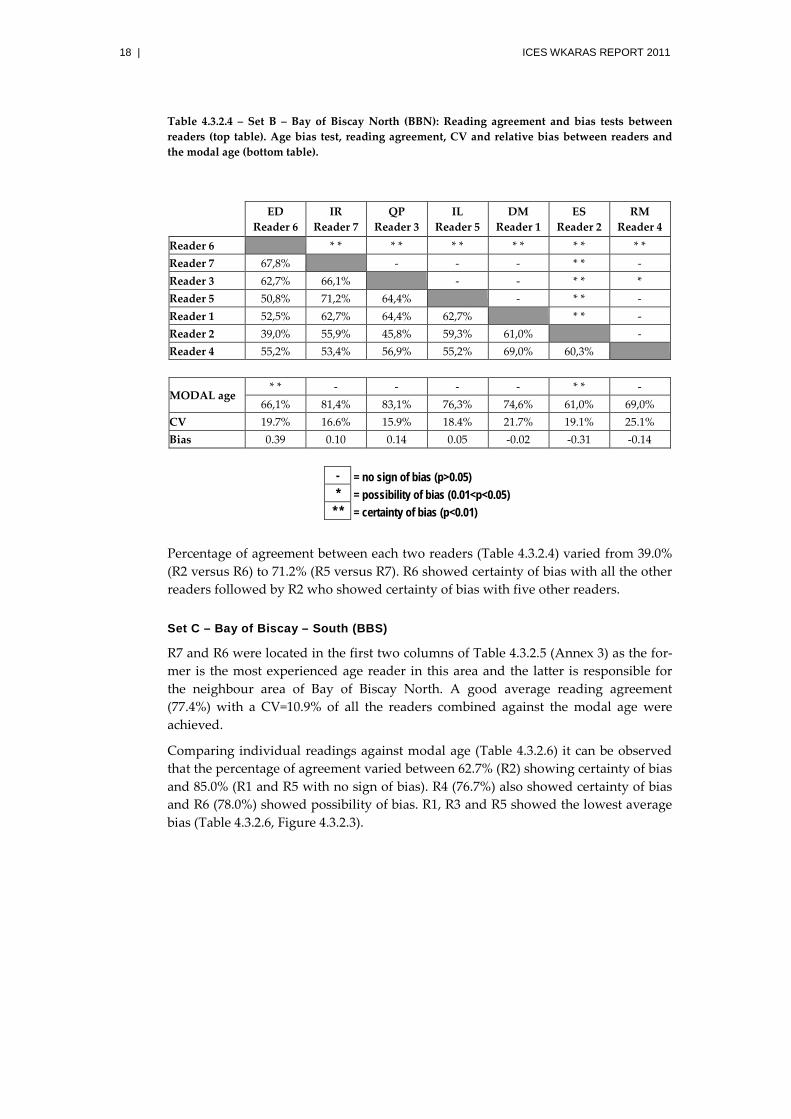
Table 4.3.2.4 – Set B – Bay of Biscay North (BBN): Reading agreement and bias tests between readers (top table). Age bias test, reading agreement, CV and relative bias between readers and the modal age (bottom table).
ED Reader 6
IR Reader 7
QP Reader 3
IL Reader 5
DM Reader 1
ES Reader 2
RM Reader 4
Reader 6
* * * * * * * * * * * * Reader 7 67,8%
- - - * * -
Reader 3 62,7% 66,1% - - * * * Reader 5 50,8% 71,2% 64,4%
- * * -
Reader 1 52,5% 62,7% 64,4% 62,7% * * - Reader 2 39,0% 55,9% 45,8% 59,3% 61,0%
-
Reader 4 55,2% 53,4% 56,9% 55,2% 69,0% 60,3%
MODAL age * * - - - - * * -
66,1% 81,4% 83,1% 76,3% 74,6% 61,0% 69,0% CV 19.7% 16.6% 15.9% 18.4% 21.7% 19.1% 25.1% Bias 0.39 0.10 0.14 0.05 -0.02 -0.31 -0.14
- = no sign of bias (p>0.05) * = possibility of bias (0.01<p<0.05)
* * = certainty of bias (p<0.01)
Percentage of agreement between each two readers (Table 4.3.2.4) varied from 39.0% (R2 versus R6) to 71.2% (R5 versus R7). R6 showed certainty of bias with all the other readers followed by R2 who showed certainty of bias with five other readers.
Set C – Bay of Biscay – South (BBS)
R7 and R6 were located in the first two columns of Table 4.3.2.5 (Annex 3) as the for-mer is the most experienced age reader in this area and the latter is responsible for the neighbour area of Bay of Biscay North. A good average reading agreement (77.4%) with a CV=10.9% of all the readers combined against the modal age were achieved.
Comparing individual readings against modal age (Table 4.3.2.6) it can be observed that the percentage of agreement varied between 62.7% (R2) showing certainty of bias and 85.0% (R1 and R5 with no sign of bias). R4 (76.7%) also showed certainty of bias and R6 (78.0%) showed possibility of bias. R1, R3 and R5 showed the lowest average bias (Table 4.3.2.6, Figure 4.3.2.3).
ICES WKARAS REPORT 2011 | 19
R1
R2
R3
R4
R5
R6
R7
All Readers
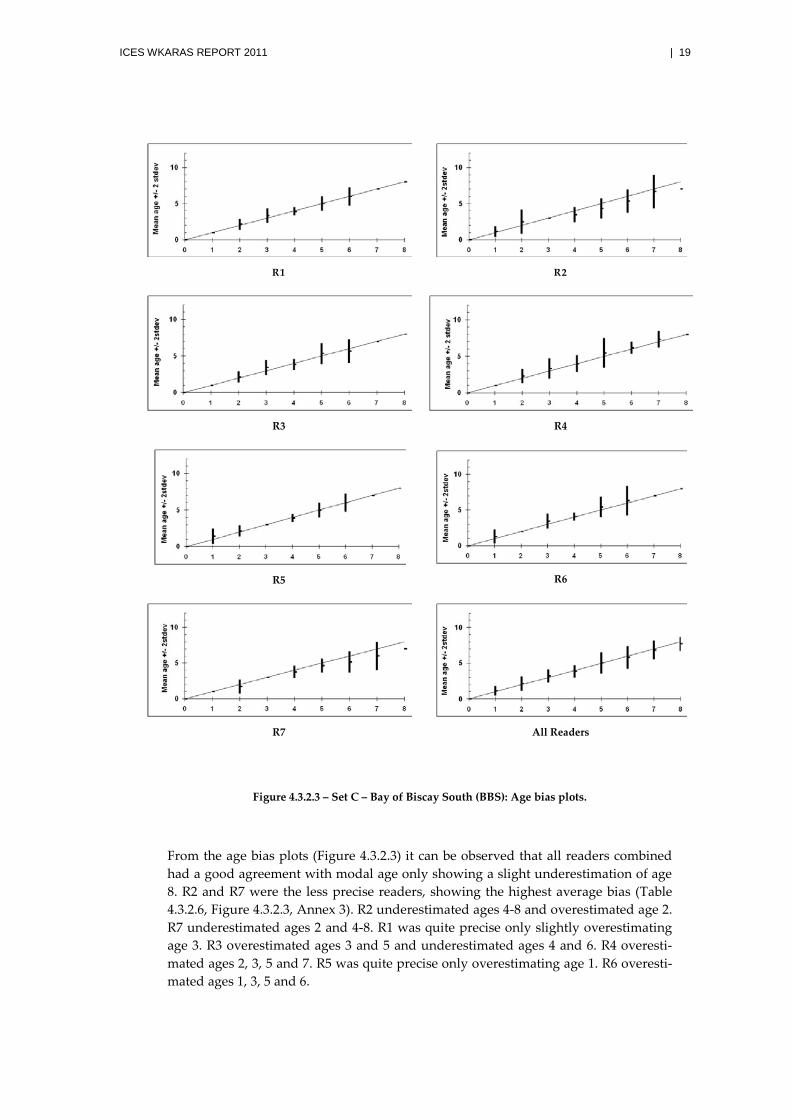
Figure 4.3.2.3 – Set C – Bay of Biscay South (BBS): Age bias plots.
From the age bias plots (Figure 4.3.2.3) it can be observed that all readers combined had a good agreement with modal age only showing a slight underestimation of age 8. R2 and R7 were the less precise readers, showing the highest average bias (Table 4.3.2.6, Figure 4.3.2.3, Annex 3). R2 underestimated ages 4-8 and overestimated age 2. R7 underestimated ages 2 and 4-8. R1 was quite precise only slightly overestimating age 3. R3 overestimated ages 3 and 5 and underestimated ages 4 and 6. R4 overesti-mated ages 2, 3, 5 and 7. R5 was quite precise only overestimating age 1. R6 overesti-mated ages 1, 3, 5 and 6.
20 | ICES WKARAS REPORT 2011
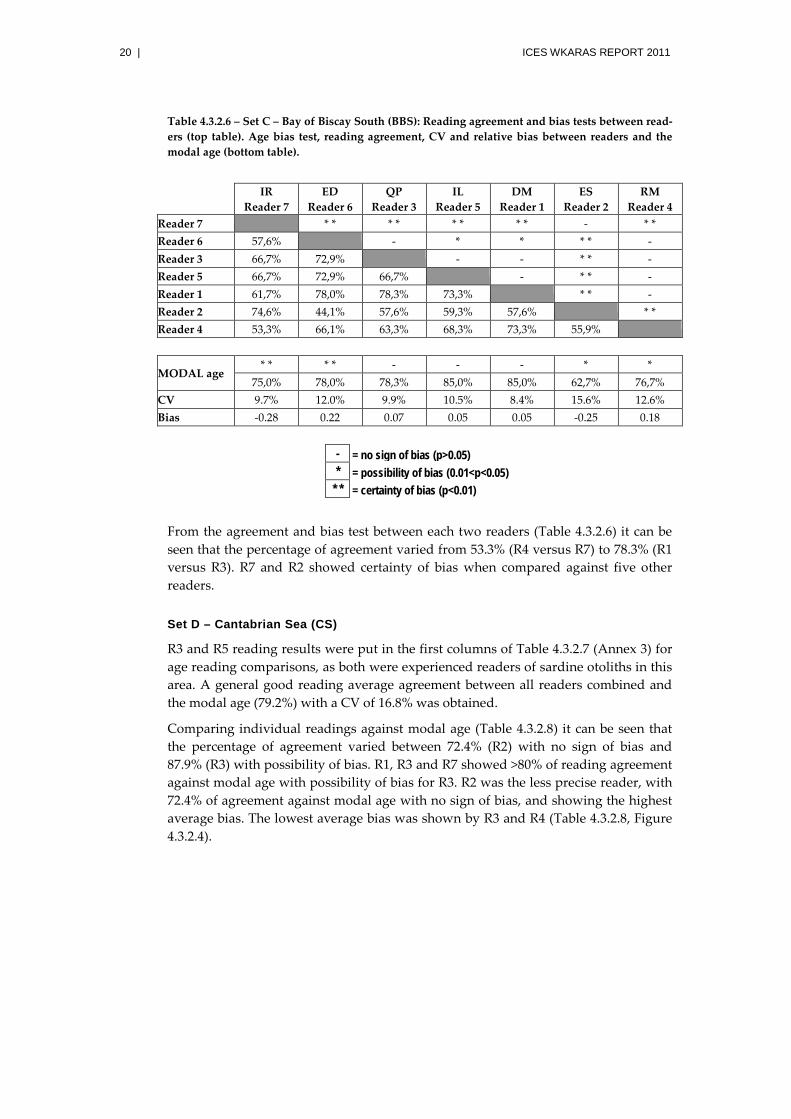
Table 4.3.2.6 – Set C – Bay of Biscay South (BBS): Reading agreement and bias tests between read-ers (top table). Age bias test, reading agreement, CV and relative bias between readers and the modal age (bottom table).
IR Reader 7
ED Reader 6
QP Reader 3
IL Reader 5
DM Reader 1
ES Reader 2
RM Reader 4
Reader 7
* * * * * * * * - * * Reader 6 57,6%
- * * * * -
Reader 3 66,7% 72,9%
- - * * - Reader 5 66,7% 72,9% 66,7%
- * * -
Reader 1 61,7% 78,0% 78,3% 73,3% * * - Reader 2 74,6% 44,1% 57,6% 59,3% 57,6%
* *
Reader 4 53,3% 66,1% 63,3% 68,3% 73,3% 55,9%
MODAL age * * * * - - - * *
75,0% 78,0% 78,3% 85,0% 85,0% 62,7% 76,7% CV 9.7% 12.0% 9.9% 10.5% 8.4% 15.6% 12.6% Bias -0.28 0.22 0.07 0.05 0.05 -0.25 0.18
- = no sign of bias (p>0.05) * = possibility of bias (0.01<p<0.05)
* * = certainty of bias (p<0.01)
From the agreement and bias test between each two readers (Table 4.3.2.6) it can be seen that the percentage of agreement varied from 53.3% (R4 versus R7) to 78.3% (R1 versus R3). R7 and R2 showed certainty of bias when compared against five other readers.
Set D – Cantabrian Sea (CS)
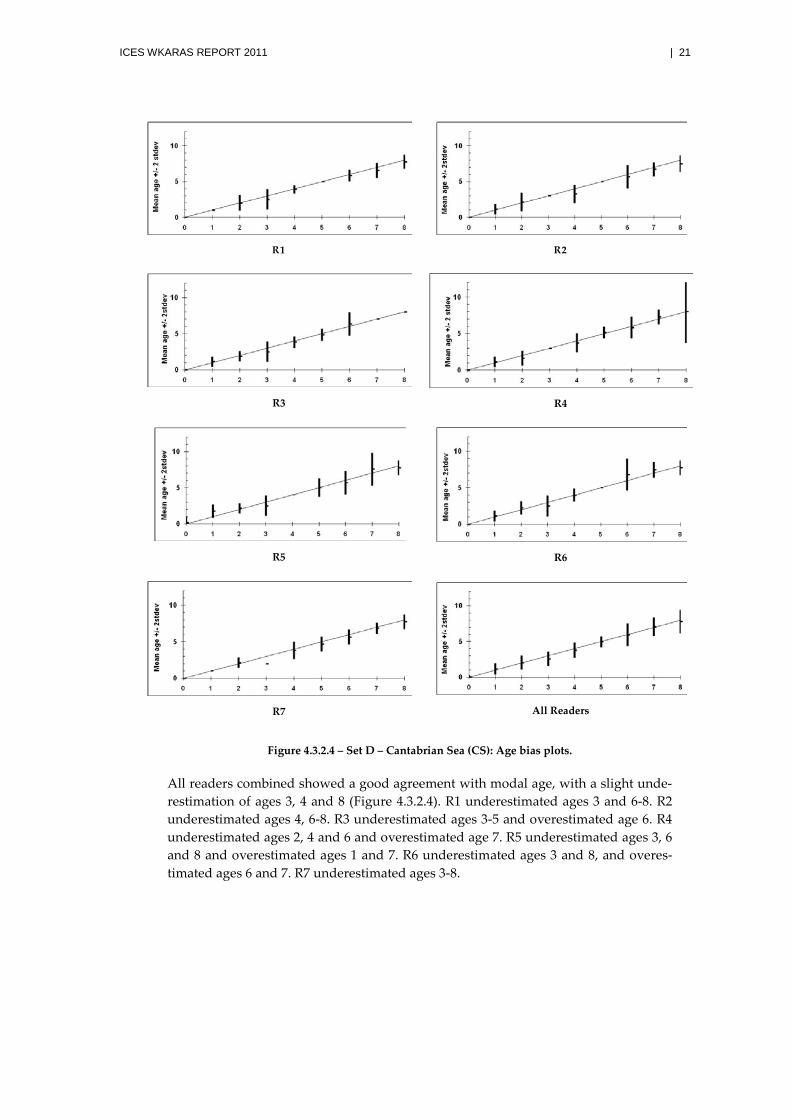
R3 and R5 reading results were put in the first columns of Table 4.3.2.7 (Annex 3) for age reading comparisons, as both were experienced readers of sardine otoliths in this area. A general good reading average agreement between all readers combined and the modal age (79.2%) with a CV of 16.8% was obtained.
Comparing individual readings against modal age (Table 4.3.2.8) it can be seen that the percentage of agreement varied between 72.4% (R2) with no sign of bias and 87.9% (R3) with possibility of bias. R1, R3 and R7 showed >80% of reading agreement against modal age with possibility of bias for R3. R2 was the less precise reader, with 72.4% of agreement against modal age with no sign of bias, and showing the highest average bias. The lowest average bias was shown by R3 and R4 (Table 4.3.2.8, Figure 4.3.2.4).
ICES WKARAS REPORT 2011 | 21
R1
R2
R3
R4
R5
R6
R7
All Readers
Figure 4.3.2.4 – Set D – Cantabrian Sea (CS): Age bias plots.
All readers combined showed a good agreement with modal age, with a slight unde-restimation of ages 3, 4 and 8 (Figure 4.3.2.4). R1 underestimated ages 3 and 6-8. R2 underestimated ages 4, 6-8. R3 underestimated ages 3-5 and overestimated age 6. R4 underestimated ages 2, 4 and 6 and overestimated age 7. R5 underestimated ages 3, 6 and 8 and overestimated ages 1 and 7. R6 underestimated ages 3 and 8, and overes-timated ages 6 and 7. R7 underestimated ages 3-8.
22 | ICES WKARAS REPORT 2011
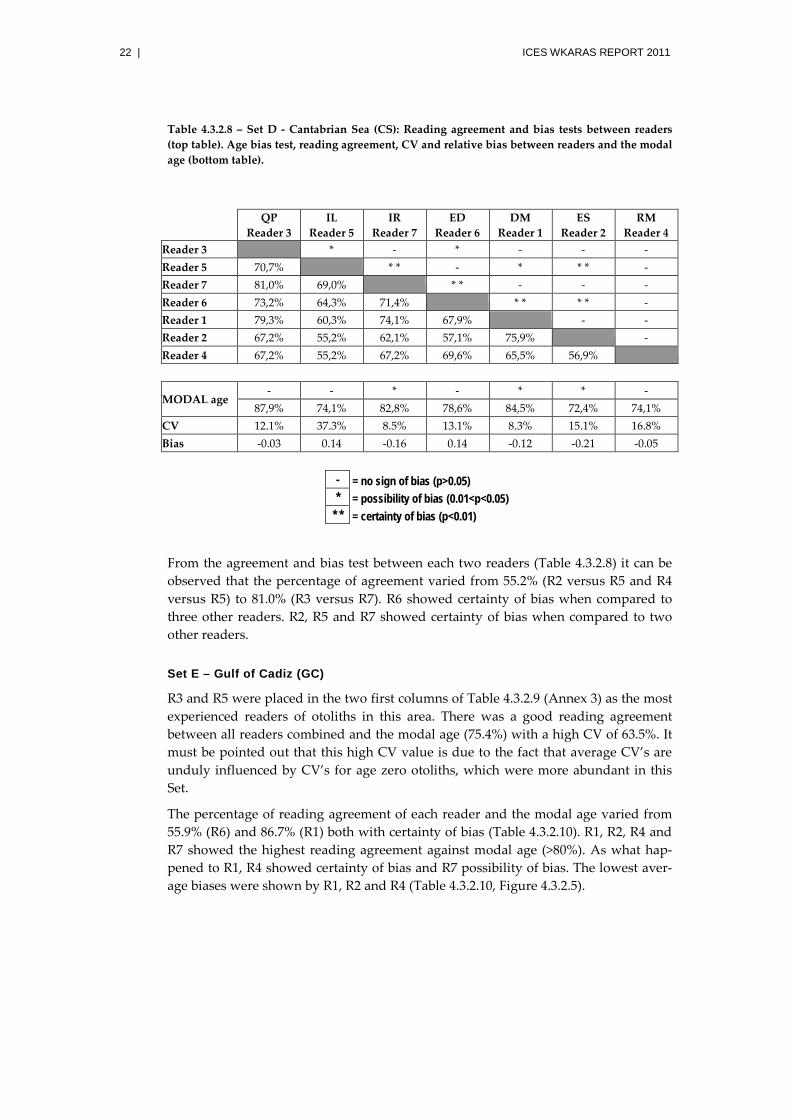
Table 4.3.2.8 – Set D - Cantabrian Sea (CS): Reading agreement and bias tests between readers (top table). Age bias test, reading agreement, CV and relative bias between readers and the modal age (bottom table).
QP Reader 3
IL Reader 5
IR Reader 7
ED Reader 6
DM Reader 1
ES Reader 2
RM Reader 4
Reader 3
* - * - - - Reader 5 70,7%
* * - * * * -
Reader 7 81,0% 69,0%
* * - - - Reader 6 73,2% 64,3% 71,4% * * * * - Reader 1 79,3% 60,3% 74,1% 67,9%
- -
Reader 2 67,2% 55,2% 62,1% 57,1% 75,9%
- Reader 4 67,2% 55,2% 67,2% 69,6% 65,5% 56,9%
MODAL age
- - * - * * - 87,9% 74,1% 82,8% 78,6% 84,5% 72,4% 74,1%
CV 12.1% 37.3% 8.5% 13.1% 8.3% 15.1% 16.8% Bias -0.03 0.14 -0.16 0.14 -0.12 -0.21 -0.05
- = no sign of bias (p>0.05) * = possibility of bias (0.01<p<0.05)
* * = certainty of bias (p<0.01)
From the agreement and bias test between each two readers (Table 4.3.2.8) it can be observed that the percentage of agreement varied from 55.2% (R2 versus R5 and R4 versus R5) to 81.0% (R3 versus R7). R6 showed certainty of bias when compared to three other readers. R2, R5 and R7 showed certainty of bias when compared to two other readers.
Set E – Gulf of Cadiz (GC)
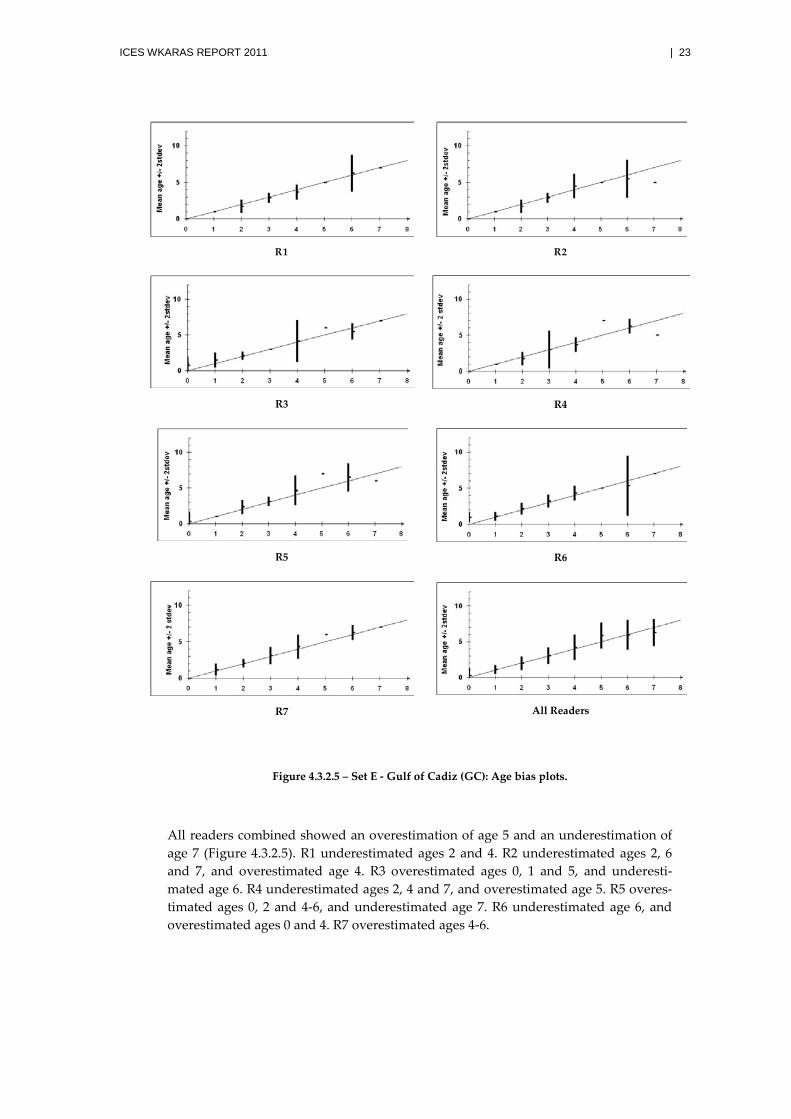
R3 and R5 were placed in the two first columns of Table 4.3.2.9 (Annex 3) as the most experienced readers of otoliths in this area. There was a good reading agreement between all readers combined and the modal age (75.4%) with a high CV of 63.5%. It must be pointed out that this high CV value is due to the fact that average CV’s are unduly influenced by CV’s for age zero otoliths, which were more abundant in this Set.
The percentage of reading agreement of each reader and the modal age varied from 55.9% (R6) and 86.7% (R1) both with certainty of bias (Table 4.3.2.10). R1, R2, R4 and R7 showed the highest reading agreement against modal age (>80%). As what hap-pened to R1, R4 showed certainty of bias and R7 possibility of bias. The lowest aver-age biases were shown by R1, R2 and R4 (Table 4.3.2.10, Figure 4.3.2.5).
ICES WKARAS REPORT 2011 | 23
R1
R2
R3
R4
R5
R6
R7
All Readers
Figure 4.3.2.5 – Set E - Gulf of Cadiz (GC): Age bias plots.
All readers combined showed an overestimation of age 5 and an underestimation of age 7 (Figure 4.3.2.5). R1 underestimated ages 2 and 4. R2 underestimated ages 2, 6 and 7, and overestimated age 4. R3 overestimated ages 0, 1 and 5, and underesti-mated age 6. R4 underestimated ages 2, 4 and 7, and overestimated age 5. R5 overes-timated ages 0, 2 and 4-6, and underestimated age 7. R6 underestimated age 6, and overestimated ages 0 and 4. R7 overestimated ages 4-6.
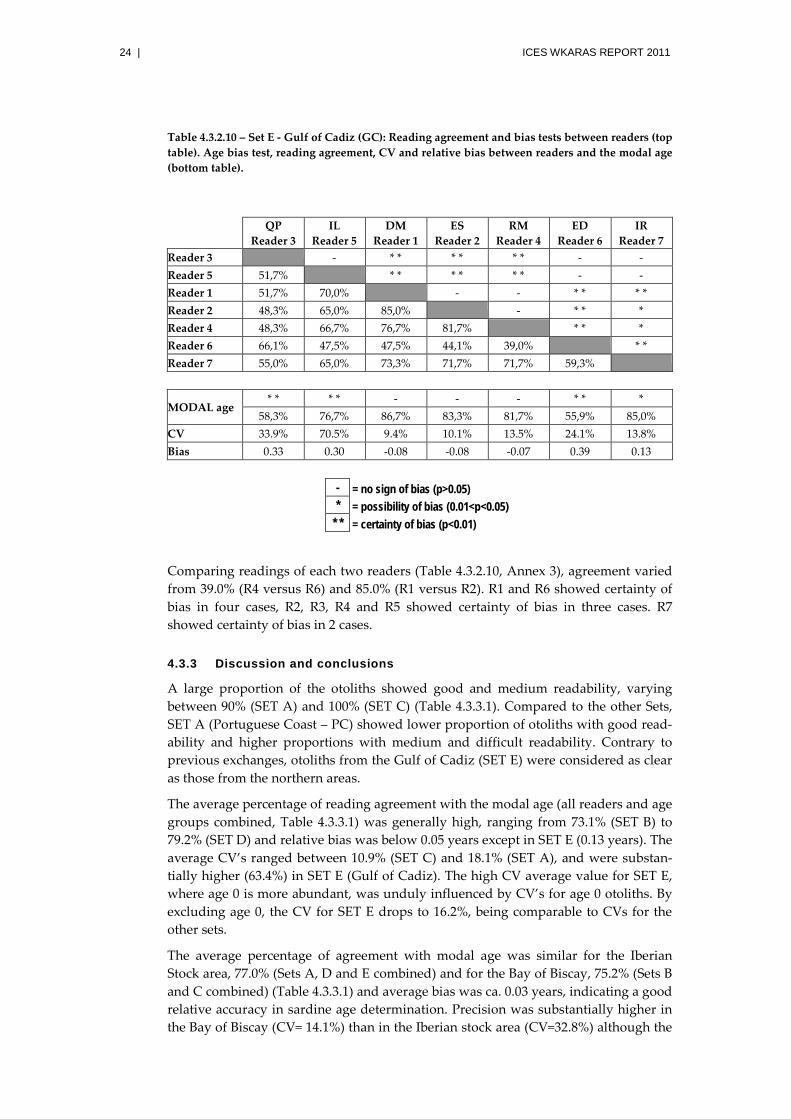
24 | ICES WKARAS REPORT 2011
Table 4.3.2.10 – Set E - Gulf of Cadiz (GC): Reading agreement and bias tests between readers (top table). Age bias test, reading agreement, CV and relative bias between readers and the modal age (bottom table).
QP Reader 3
IL Reader 5
DM Reader 1
ES Reader 2
RM Reader 4
ED Reader 6
IR Reader 7
Reader 3
- * * * * * * - - Reader 5 51,7%
* * * * * * - -
Reader 1 51,7% 70,0%
- - * * * * Reader 2 48,3% 65,0% 85,0% - * * * Reader 4 48,3% 66,7% 76,7% 81,7%
* * *
Reader 6 66,1% 47,5% 47,5% 44,1% 39,0%
* * Reader 7 55,0% 65,0% 73,3% 71,7% 71,7% 59,3%
MODAL age
* * * * - - - * * * 58,3% 76,7% 86,7% 83,3% 81,7% 55,9% 85,0%
CV 33.9% 70.5% 9.4% 10.1% 13.5% 24.1% 13.8% Bias 0.33 0.30 -0.08 -0.08 -0.07 0.39 0.13
- = no sign of bias (p>0.05) * = possibility of bias (0.01<p<0.05)
* * = certainty of bias (p<0.01)
Comparing readings of each two readers (Table 4.3.2.10, Annex 3), agreement varied from 39.0% (R4 versus R6) and 85.0% (R1 versus R2). R1 and R6 showed certainty of bias in four cases, R2, R3, R4 and R5 showed certainty of bias in three cases. R7 showed certainty of bias in 2 cases.
4.3.3 Discussion and conclusions
A large proportion of the otoliths showed good and medium readability, varying between 90% (SET A) and 100% (SET C) (Table 4.3.3.1). Compared to the other Sets, SET A (Portuguese Coast – PC) showed lower proportion of otoliths with good read-ability and higher proportions with medium and difficult readability. Contrary to previous exchanges, otoliths from the Gulf of Cadiz (SET E) were considered as clear as those from the northern areas.
The average percentage of reading agreement with the modal age (all readers and age groups combined, Table 4.3.3.1) was generally high, ranging from 73.1% (SET B) to 79.2% (SET D) and relative bias was below 0.05 years except in SET E (0.13 years). The average CV’s ranged between 10.9% (SET C) and 18.1% (SET A), and were substan-tially higher (63.4%) in SET E (Gulf of Cadiz). The high CV average value for SET E, where age 0 is more abundant, was unduly influenced by CV’s for age 0 otoliths. By excluding age 0, the CV for SET E drops to 16.2%, being comparable to CVs for the other sets.
The average percentage of agreement with modal age was similar for the Iberian Stock area, 77.0% (Sets A, D and E combined) and for the Bay of Biscay, 75.2% (Sets B and C combined) (Table 4.3.3.1) and average bias was ca. 0.03 years, indicating a good relative accuracy in sardine age determination. Precision was substantially higher in the Bay of Biscay (CV= 14.1%) than in the Iberian stock area (CV=32.8%) although the
ICES WKARAS REPORT 2011 | 25
latter is again strongly influenced by unrealistically high CVs at age 0 (e.g. 125-265%) mainly in the Gulf of Cadiz. These high values result from the CV formula tending rapidly to positive infinity as age (the denominator) tends to zero; thus, while an error of ± 1 year at Age 1 gives a meaningful CV of 100%, a similar error for a mean age close to 0 years gives a CV of 1000000% being therefore meaningless. By exclud-ing age 0, the precision in the Iberian Stock area becomes similar to the Bay of Biscay (14.7%), being still low compared to the 5% threshold recommended in the PGCCDBS Guidelines for Workshops on Age Calibration.
26 | ICES WKARAS REPORT 2011
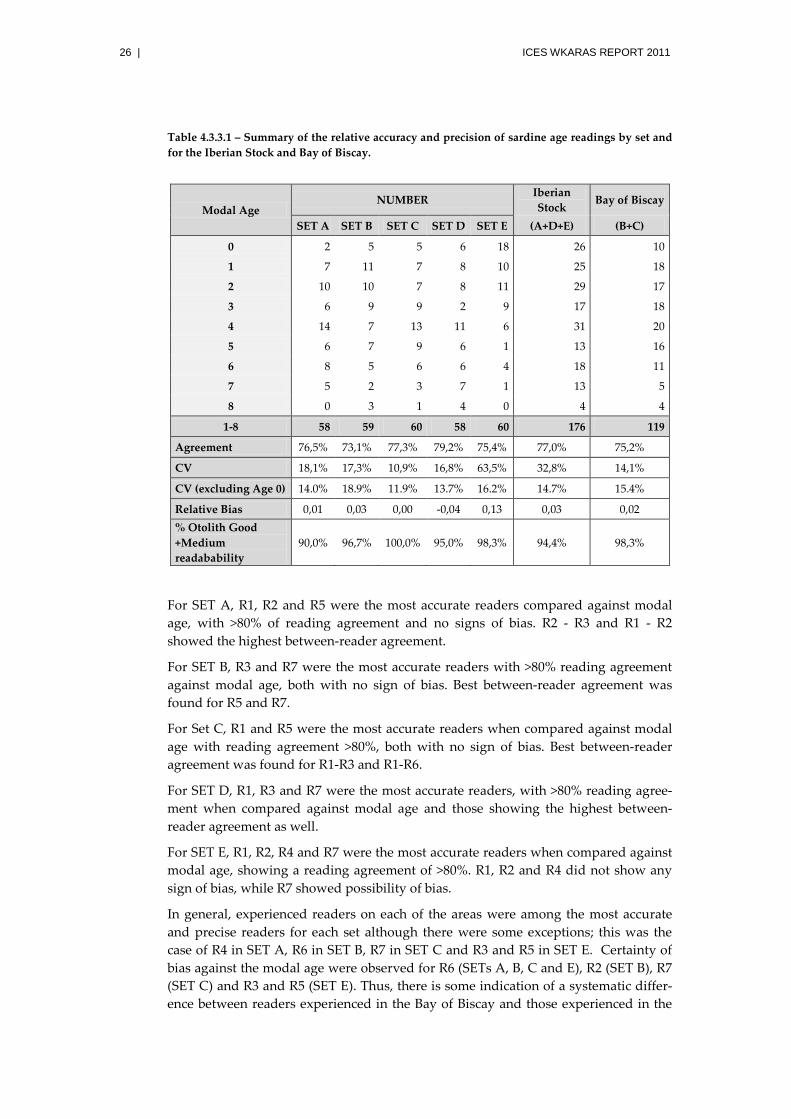
Table 4.3.3.1 – Summary of the relative accuracy and precision of sardine age readings by set and for the Iberian Stock and Bay of Biscay.
Modal Age NUMBER Iberian
Stock Bay of Biscay
SET A SET B SET C SET D SET E (A+D+E) (B+C)
0 2 5 5 6 18 26 10
1 7 11 7 8 10 25 18
2 10 10 7 8 11 29 17
3 6 9 9 2 9 17 18
4 14 7 13 11 6 31 20
5 6 7 9 6 1 13 16
6 8 5 6 6 4 18 11
7 5 2 3 7 1 13 5
8 0 3 1 4 0 4 4
1-8 58 59 60 58 60 176 119
Agreement 76,5% 73,1% 77,3% 79,2% 75,4% 77,0% 75,2%
CV 18,1% 17,3% 10,9% 16,8% 63,5% 32,8% 14,1%
CV (excluding Age 0) 14.0% 18.9% 11.9% 13.7% 16.2% 14.7% 15.4%
Relative Bias 0,01 0,03 0,00 -0,04 0,13 0,03 0,02 % Otolith Good +Medium readabability
90,0% 96,7% 100,0% 95,0% 98,3% 94,4% 98,3%
For SET A, R1, R2 and R5 were the most accurate readers compared against modal age, with >80% of reading agreement and no signs of bias. R2 - R3 and R1 - R2 showed the highest between-reader agreement.
For SET B, R3 and R7 were the most accurate readers with >80% reading agreement against modal age, both with no sign of bias. Best between-reader agreement was found for R5 and R7.
For Set C, R1 and R5 were the most accurate readers when compared against modal age with reading agreement >80%, both with no sign of bias. Best between-reader agreement was found for R1-R3 and R1-R6.
For SET D, R1, R3 and R7 were the most accurate readers, with >80% reading agree-ment when compared against modal age and those showing the highest between-reader agreement as well.
For SET E, R1, R2, R4 and R7 were the most accurate readers when compared against modal age, showing a reading agreement of >80%. R1, R2 and R4 did not show any sign of bias, while R7 showed possibility of bias.
In general, experienced readers on each of the areas were among the most accurate and precise readers for each set although there were some exceptions; this was the case of R4 in SET A, R6 in SET B, R7 in SET C and R3 and R5 in SET E. Certainty of bias against the modal age were observed for R6 (SETs A, B, C and E), R2 (SET B), R7 (SET C) and R3 and R5 (SET E). Thus, there is some indication of a systematic differ-ence between readers experienced in the Bay of Biscay and those experienced in the
ICES WKARAS REPORT 2011 | 27
Iberian Stock area. There is also evidence of a systematic difference between experi-enced and non-experienced readers in the Gulf of Cadiz.
Between-reader agreement showed high variability between Sets and between read-ers being always slightly lower than agreement with the modal age. Cases of <50% agreement occurred in all samples but more often in the Gulf of Cadiz (SET E).
Most of the otolith edges (85-100%) in the Sets were identified as hyaline.
28 | ICES WKARAS REPORT 2011
5 Differences in the interpretation of the otolith structure
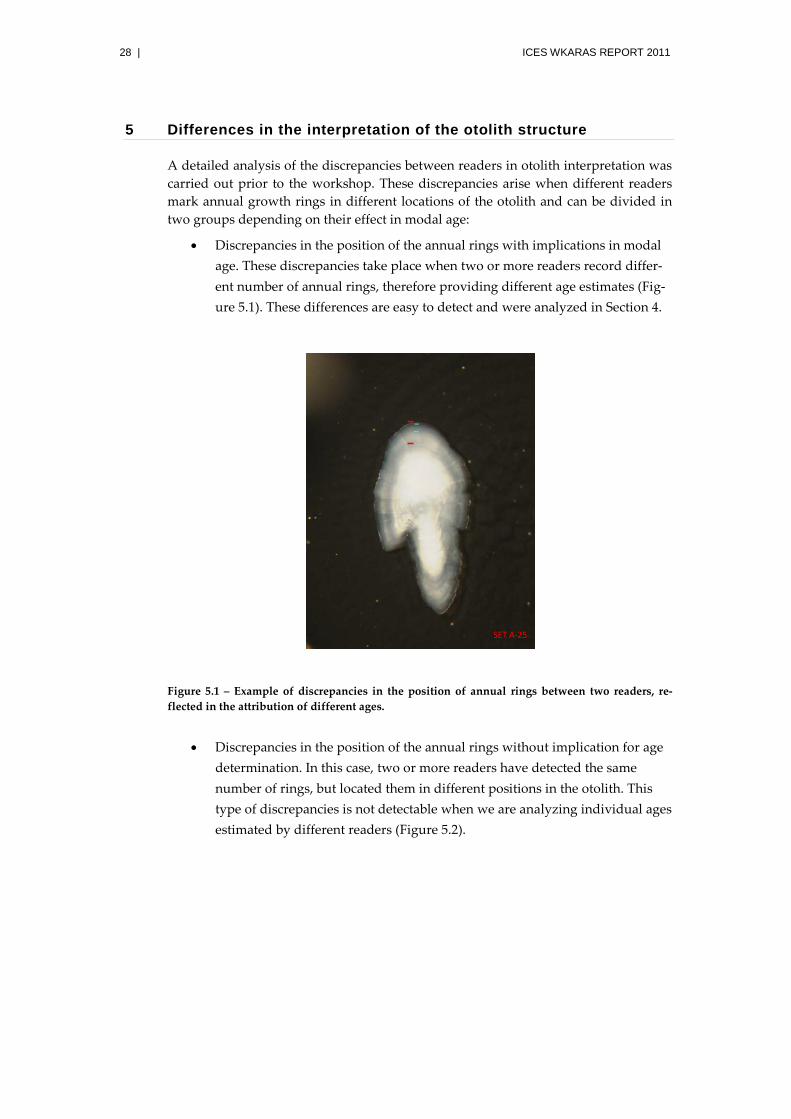
A detailed analysis of the discrepancies between readers in otolith interpretation was carried out prior to the workshop. These discrepancies arise when different readers mark annual growth rings in different locations of the otolith and can be divided in two groups depending on their effect in modal age:
• Discrepancies in the position of the annual rings with implications in modal age. These discrepancies take place when two or more readers record differ-ent number of annual rings, therefore providing different age estimates (Fig-ure 5.1). These differences are easy to detect and were analyzed in Section 4.
Figure 5.1 – Example of discrepancies in the position of annual rings between two readers, re-flected in the attribution of different ages.
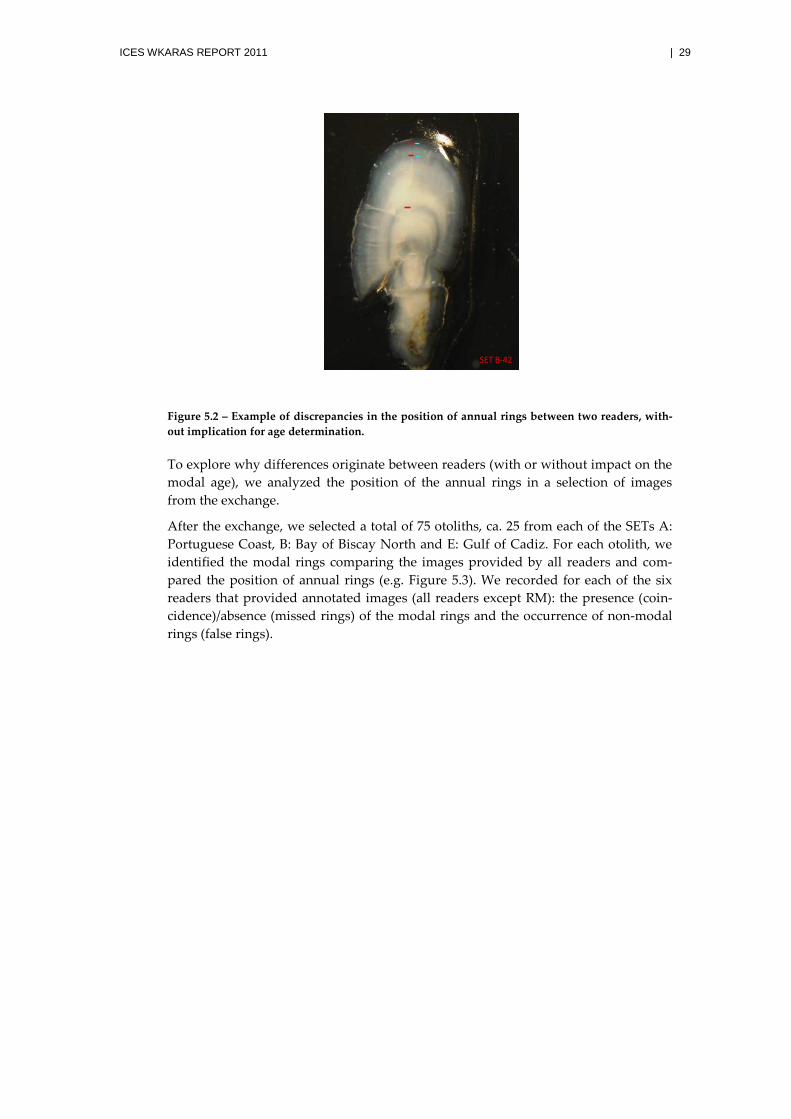
• Discrepancies in the position of the annual rings without implication for age determination. In this case, two or more readers have detected the same number of rings, but located them in different positions in the otolith. This type of discrepancies is not detectable when we are analyzing individual ages estimated by different readers (Figure 5.2).
SET A-25
ICES WKARAS REPORT 2011 | 29
Figure 5.2 – Example of discrepancies in the position of annual rings between two readers, with-out implication for age determination.
To explore why differences originate between readers (with or without impact on the modal age), we analyzed the position of the annual rings in a selection of images from the exchange.
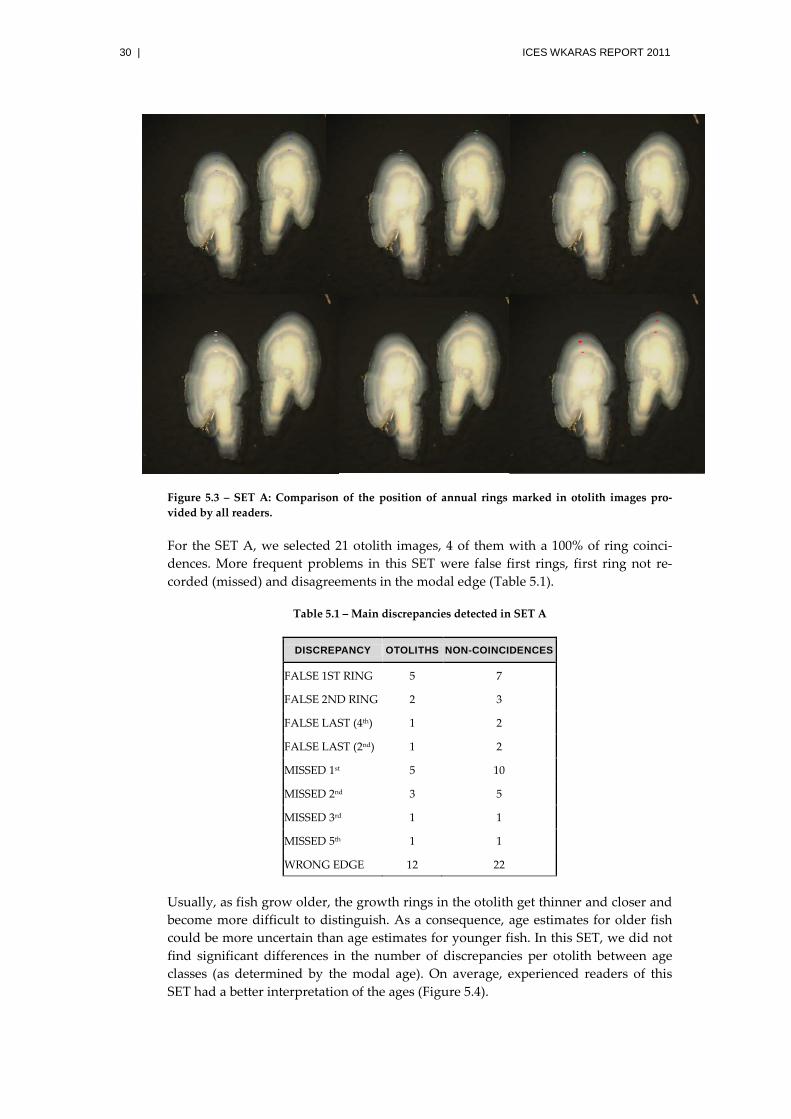
After the exchange, we selected a total of 75 otoliths, ca. 25 from each of the SETs A: Portuguese Coast, B: Bay of Biscay North and E: Gulf of Cadiz. For each otolith, we identified the modal rings comparing the images provided by all readers and com-pared the position of annual rings (e.g. Figure 5.3). We recorded for each of the six readers that provided annotated images (all readers except RM): the presence (coin-cidence)/absence (missed rings) of the modal rings and the occurrence of non-modal rings (false rings).
SET B-42
30 | ICES WKARAS REPORT 2011
Figure 5.3 – SET A: Comparison of the position of annual rings marked in otolith images pro-vided by all readers.
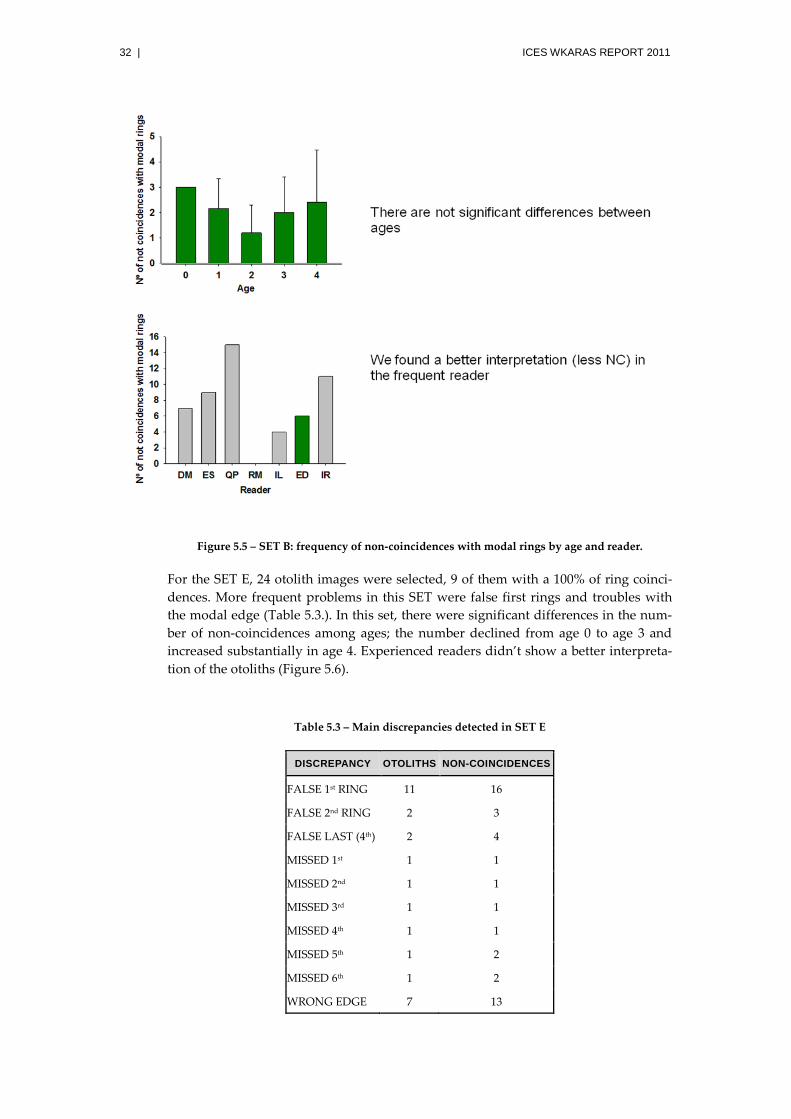
For the SET A, we selected 21 otolith images, 4 of them with a 100% of ring coinci-dences. More frequent problems in this SET were false first rings, first ring not re-corded (missed) and disagreements in the modal edge (Table 5.1).
Table 5.1 – Main discrepancies detected in SET A
DISCREPANCY OTOLITHS NON-COINCIDENCES
FALSE 1ST RING 5 7
FALSE 2ND RING 2 3
FALSE LAST (4th) 1 2
FALSE LAST (2nd) 1 2
MISSED 1st 5 10
MISSED 2nd 3 5
MISSED 3rd 1 1
MISSED 5th 1 1
WRONG EDGE 12 22
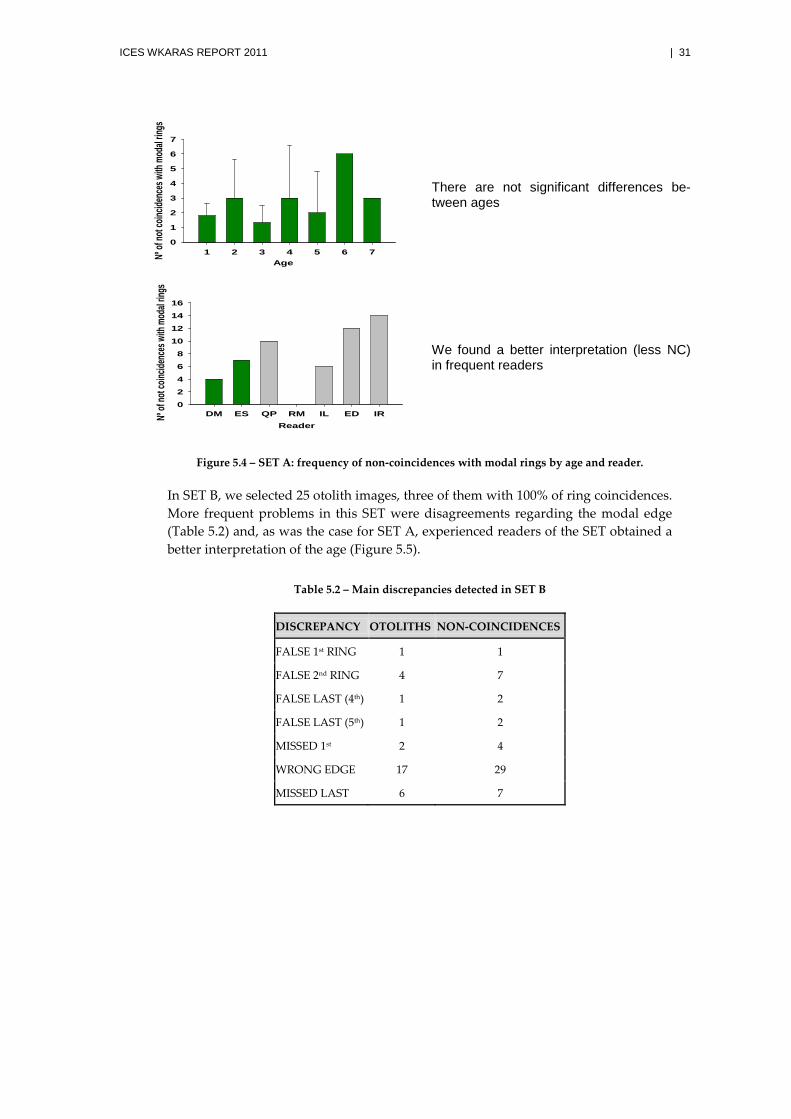
Usually, as fish grow older, the growth rings in the otolith get thinner and closer and become more difficult to distinguish. As a consequence, age estimates for older fish could be more uncertain than age estimates for younger fish. In this SET, we did not find significant differences in the number of discrepancies per otolith between age classes (as determined by the modal age). On average, experienced readers of this SET had a better interpretation of the ages (Figure 5.4).
ICES WKARAS REPORT 2011 | 31
There are not significant differences be-tween ages
We found a better interpretation (less NC) in frequent readers
Figure 5.4 – SET A: frequency of non-coincidences with modal rings by age and reader.
In SET B, we selected 25 otolith images, three of them with 100% of ring coincidences. More frequent problems in this SET were disagreements regarding the modal edge (Table 5.2) and, as was the case for SET A, experienced readers of the SET obtained a better interpretation of the age (Figure 5.5).
Table 5.2 – Main discrepancies detected in SET B
DISCREPANCY OTOLITHS NON-COINCIDENCES
FALSE 1st RING 1 1
FALSE 2nd RING 4 7
FALSE LAST (4th) 1 2
FALSE LAST (5th) 1 2
MISSED 1st 2 4
WRONG EDGE 17 29
MISSED LAST 6 7
Age1 2 3 4 5 6 7Nº
of no
t coin
ciden
ces w
ith m
odal
rings
0
1
2
3
4
5
6
7
ReaderDM ES QP RM IL ED IRNº
of no
t coin
ciden
ces w
ith m
odal
rings
0
2
4
6
8
10
12
14
16
32 | ICES WKARAS REPORT 2011
Figure 5.5 – SET B: frequency of non-coincidences with modal rings by age and reader.
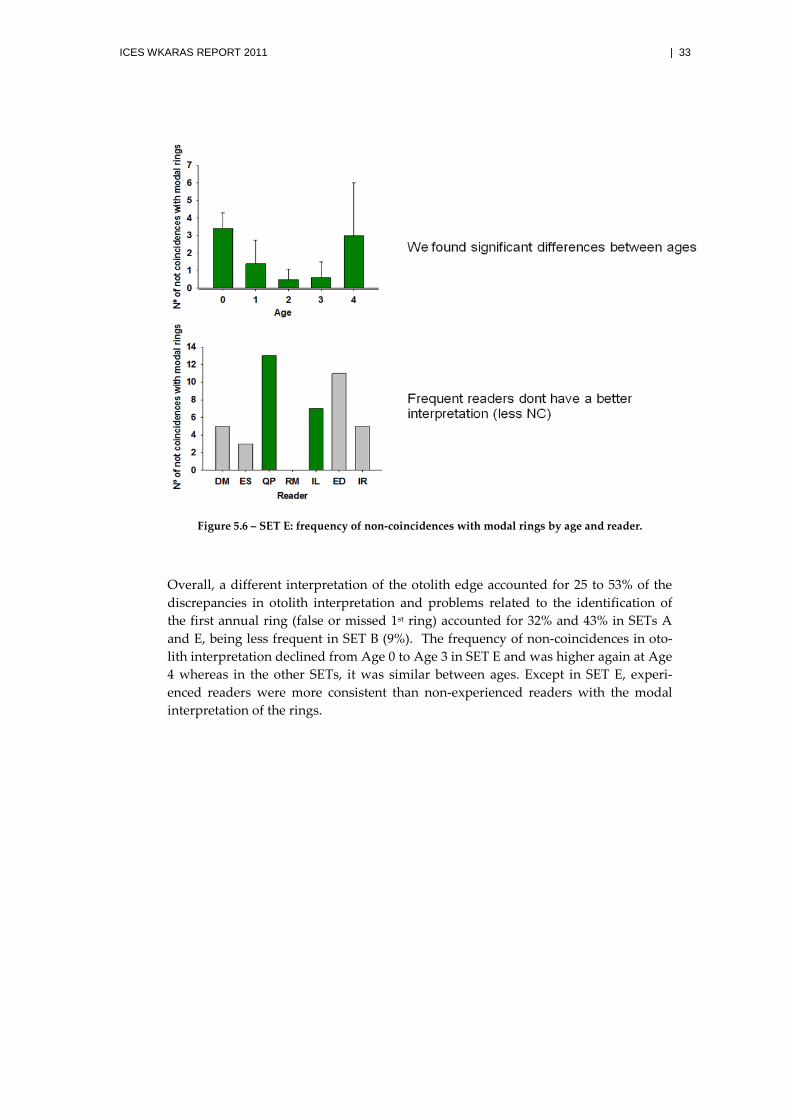
For the SET E, 24 otolith images were selected, 9 of them with a 100% of ring coinci-dences. More frequent problems in this SET were false first rings and troubles with the modal edge (Table 5.3.). In this set, there were significant differences in the num-ber of non-coincidences among ages; the number declined from age 0 to age 3 and increased substantially in age 4. Experienced readers didn’t show a better interpreta-tion of the otoliths (Figure 5.6).
Table 5.3 – Main discrepancies detected in SET E
DISCREPANCY OTOLITHS NON-COINCIDENCES
FALSE 1st RING 11 16
FALSE 2nd RING 2 3
FALSE LAST (4th) 2 4
MISSED 1st 1 1
MISSED 2nd 1 1
MISSED 3rd 1 1
MISSED 4th 1 1
MISSED 5th 1 2
MISSED 6th 1 2
WRONG EDGE 7 13
ICES WKARAS REPORT 2011 | 33
Figure 5.6 – SET E: frequency of non-coincidences with modal rings by age and reader.
Overall, a different interpretation of the otolith edge accounted for 25 to 53% of the discrepancies in otolith interpretation and problems related to the identification of the first annual ring (false or missed 1st ring) accounted for 32% and 43% in SETs A and E, being less frequent in SET B (9%). The frequency of non-coincidences in oto-lith interpretation declined from Age 0 to Age 3 in SET E and was higher again at Age 4 whereas in the other SETs, it was similar between ages. Except in SET E, experi-enced readers were more consistent than non-experienced readers with the modal interpretation of the rings.
34 | ICES WKARAS REPORT 2011
6 Studies addressing the main age reading problems
As described in the previous section, the main discrepancies between readers in sar-dine age determination were the identification of the otolith edge type and of the first annual ring. These are recurrent issues in sardine age determination (e.g. ICES, 1997; Soares et al., 2007). The results of on-going studies on otolith seasonal growth (WD Coelho and Duhamel, 2010) and daily growth of juvenile individuals (WD Silva and Silva, 2010) were discussed at the workshop to help to resolve them.
WD Coelho and Duhamel (2010) analyzed two main issues: the otoliths edge type identification and the differences on otolith growth according to fish age. From the results, there were recommendations to take into account the delay in opaque edge formation with age for the Portuguese coast (Section 6.1), to analyze the seasonality of the edge in other areas more thoroughly and to find out alternatives to the use of otolith edge type in age determination.
WD Silva and Silva (2010), deals with the problem of the first annual ring identifica-tion. It is concluded that the attribution of ages 0 and 1 to sardines was consistent with the birthdate when daily growth rings were analyzed. The results suggested that the first ring diameter was proportional to fish length. The estimated first annual ring diameter varied between 2.0-2.9 mm. The diameter average value of 2.4 mm is suggested as a reference for the identification of the first annual ring.
Another WD (Silva et al., 2010) was also presented at the Workshop. Sardine juveniles age determination based on the morphometric characteristics of the individuals and the otoliths was its subject. The main objective was to describe the relationship be-tween age (in days) of sardine juveniles and the respective otoliths weight. Relation-ships between age and otolith diameter, age and fish total length and age and fish total weight, were also explored. It is concluded that using otolith morphometric characteristics to age juvenile sardines (in days), shows advantages compared to oto-lith reading, as this is a faster process to which only measuring and calibration errors are associated. It also advises that the same methodology should be applied in differ-ent areas and years in order to verify if the relationships found are consistent with the ones established in this work.
6.1 Otolith seasonal growth and identification of the edge
Two problems related to the edge type were discussed at the workshop:
1 ) Difficulty in identifying the type of edge (hyaline or opaque) 2 ) Variation in the seasonality of the edge type over age.
According to the age reading protocol, a hyaline edge is counted as an annual ring in the first semester but not in the second semester, i.e., in the first semester, the hyaline growth visible at the edge is assumed to be deposited during the past winter, in the second semester it is assumed to correspond to the coming winter meaning that the opaque growth has already taken place.
If opaque edges are difficult to observe and the protocol is strictly followed, all fish decrease 1 year from June to July. In the case of younger fish (0-1 year olds, see be-low) this is not a problem since the rule fits reasonably well to their otolith growth pattern. However, if in older sardine the opaque edge is laid down latter in the year, as in several other clupeids (e.g. Baltic sprat and herring, ICES, 2008a, 2008b, Anc-hovy, ICES, 2009b) those will artificially decrease 1 year from June to July and in-
ICES WKARAS REPORT 2011 | 35
crease 1 year at some point between July and December after the formation of the opaque edge. As a consequence, the age structure might be biased; WKARAS recog-nized the impact of this problem on the estimation of sardine catch or abundance-at-age needs to be evaluated.
Regarding the first problem, the participants recognized that the clarity of the edge decreased with the age of sardine; it was relatively simple to identify the edge in 0-group and 1-year olds but the difficulty increased rapidly due to a drastic narrowing of the rings, mainly of the opaque bands reflecting the deceleration of growth. Fur-thermore, the clarity of the edge varied between years; otoliths from southern areas present larger difficulties than those from northern areas (e.g. Portuguese waters vs. Bay of Biscay) this being likely related to lower growth rates in the former areas.
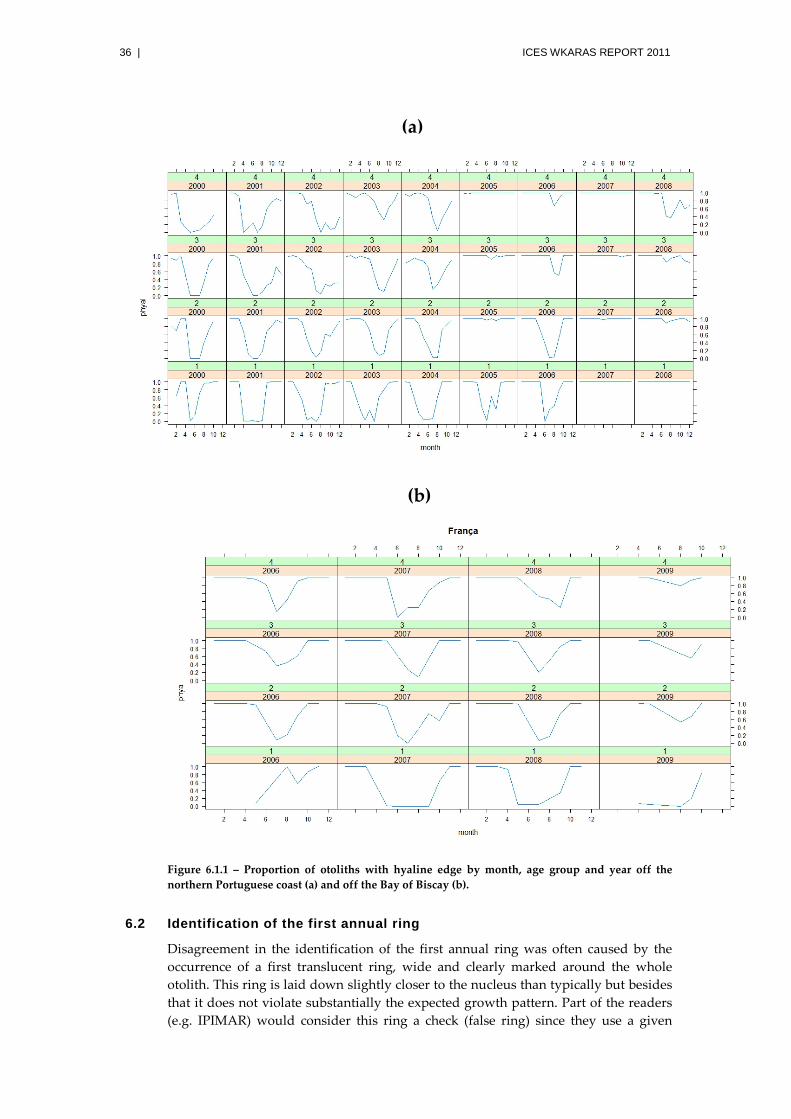
The seasonality of the otolith edge was studied using data from the Bay of Biscay (2006 – 2009) and from the northern and southern Portuguese waters (2000 – 2008) (WD Coelho and Duhamel, 2010). Data on the proportion of hyaline edges by month in each area for age groups 1 to 4 (for which more abundant data was available) was analyzed. The graphical analysis showed that almost no opaque edges were observed in 2007 and 2008 in the Portuguese coast (Figure 6.1.1a). In the Bay of Biscay, data for 2009 were incomplete and the proportion of opaque edges was much lower than in previous years as well (Figure 6.1.1b). Those years were excluded from subsequent analysis. Binomial Generalized Linear Models (logit link function) were fit to the proportion of hyaline edges using month, year and age as predictor factor variables. Since no major graphical differences were noticeable in the seasonality pattern be-tween years, the starting model considered two-way interactions between age and month only. Model selection was carried out using the AIC criterion.
The initial models were those that best fitted the data showing strong seasonality of the edge type and age effects in all areas. The interaction between age and month indicates different edge seasonality over age. However, patterns with age differed in the Portuguese areas and in the Bay of Biscay. In the Portuguese areas, the variation in the proportion of hyaline edges was gradual over months and so was the delay in the formation of the opaque edge with age; in general the minimum proportion of hyaline edges was observed around June at age 1, July at age 2 and August at ages 3 and 4. In the Bay of Biscay, the edge pattern changed substantially from age 1 to the remaining ages; at age 1, the hyaline proportion declines abruptly around May and remains close to zero until September while at ages 2-4 years it remains high most of the year and achieves minimum values in July-August.
The workshop participants considered that accuracy of sardine age reading could be improved by taking age-related differences in edge seasonality into account. It was also agreed that the width of the translucent margin should also be considered to decide about its formation, i.e. to decide whether it corresponds to the past or to the forthcoming winter. This implies a flexible application of the “edge” rule.
36 | ICES WKARAS REPORT 2011
(a)
(b)
Figure 6.1.1 – Proportion of otoliths with hyaline edge by month, age group and year off the northern Portuguese coast (a) and off the Bay of Biscay (b).
6.2 Identification of the first annual ring
Disagreement in the identification of the first annual ring was often caused by the occurrence of a first translucent ring, wide and clearly marked around the whole otolith. This ring is laid down slightly closer to the nucleus than typically but besides that it does not violate substantially the expected growth pattern. Part of the readers (e.g. IPIMAR) would consider this ring a check (false ring) since they use a given
ICES WKARAS REPORT 2011 | 37
diameter (2 mm, 20X amplification) as a gauge to help identify the first ring. Readers not using such gauge (or applying it in a flexible way, e.g. IFREMER and AZTI) would consider this the first annual ring. Some readers interpreted this as a true win-ter ring for sardine born in the autumn spawning season.
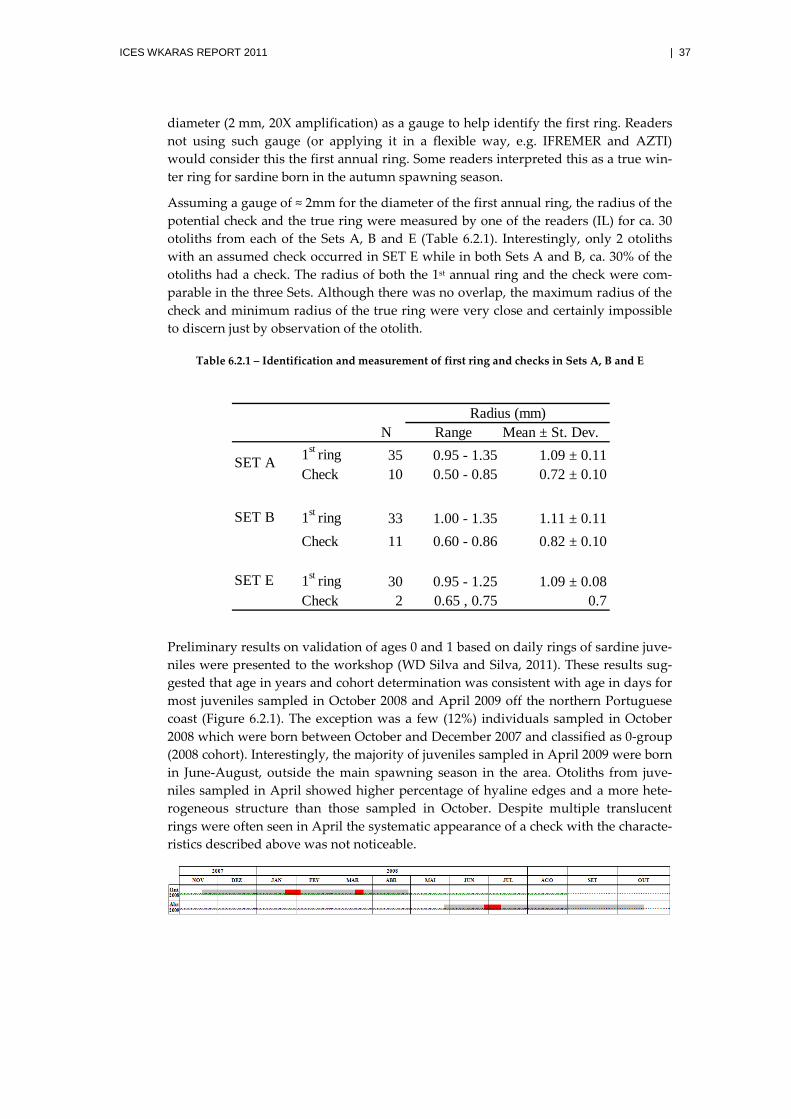
Assuming a gauge of ≈ 2mm for the diameter of the first annual ring, the radius of the potential check and the true ring were measured by one of the readers (IL) for ca. 30 otoliths from each of the Sets A, B and E (Table 6.2.1). Interestingly, only 2 otoliths with an assumed check occurred in SET E while in both Sets A and B, ca. 30% of the otoliths had a check. The radius of both the 1st annual ring and the check were com-parable in the three Sets. Although there was no overlap, the maximum radius of the check and minimum radius of the true ring were very close and certainly impossible to discern just by observation of the otolith.
Table 6.2.1 – Identification and measurement of first ring and checks in Sets A, B and E
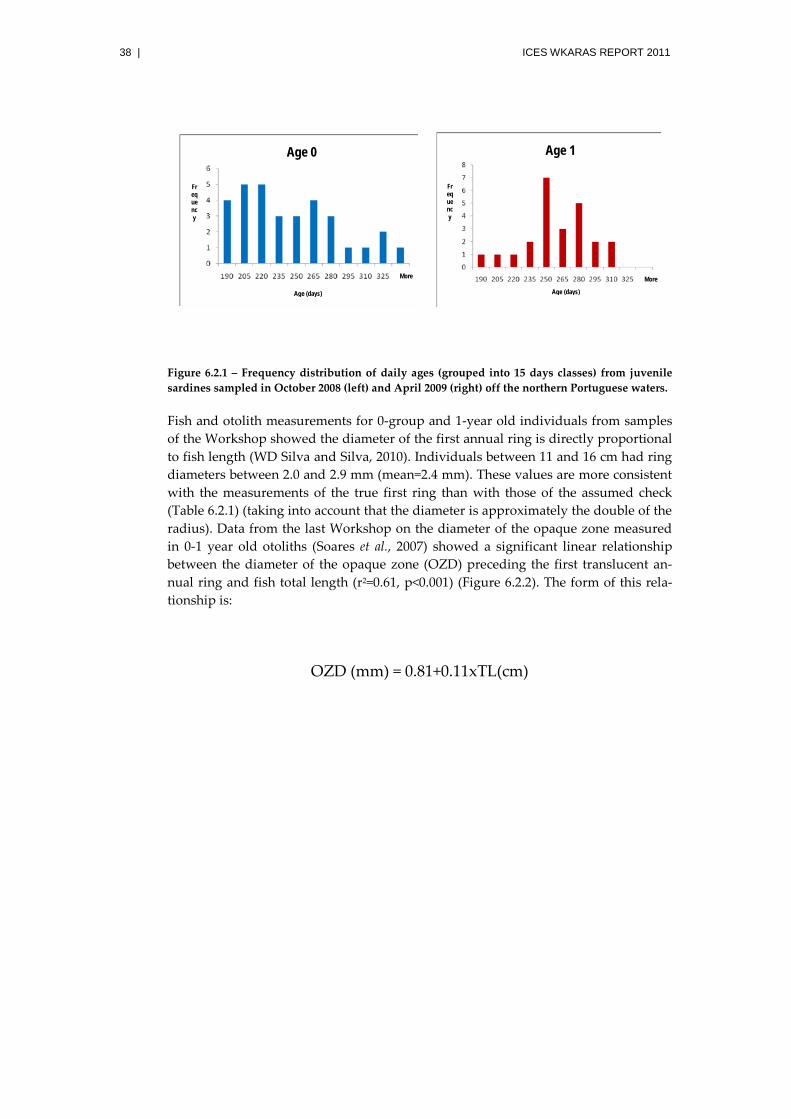
Preliminary results on validation of ages 0 and 1 based on daily rings of sardine juve-niles were presented to the workshop (WD Silva and Silva, 2011). These results sug-gested that age in years and cohort determination was consistent with age in days for most juveniles sampled in October 2008 and April 2009 off the northern Portuguese coast (Figure 6.2.1). The exception was a few (12%) individuals sampled in October 2008 which were born between October and December 2007 and classified as 0-group (2008 cohort). Interestingly, the majority of juveniles sampled in April 2009 were born in June-August, outside the main spawning season in the area. Otoliths from juve-niles sampled in April showed higher percentage of hyaline edges and a more hete-rogeneous structure than those sampled in October. Despite multiple translucent rings were often seen in April the systematic appearance of a check with the characte-ristics described above was not noticeable.
N Range Mean ± St. Dev.1st ring 35 0.95 - 1.35 1.09 ± 0.11Check 10 0.50 - 0.85 0.72 ± 0.10
1st ring 33 1.00 - 1.35 1.11 ± 0.11Check 11 0.60 - 0.86 0.82 ± 0.10
1st ring 30 0.95 - 1.25 1.09 ± 0.08Check 2 0.65 , 0.75 0.7
Radius (mm)
SET A
SET B
SET E
38 | ICES WKARAS REPORT 2011
Figure 6.2.1 – Frequency distribution of daily ages (grouped into 15 days classes) from juvenile sardines sampled in October 2008 (left) and April 2009 (right) off the northern Portuguese waters.
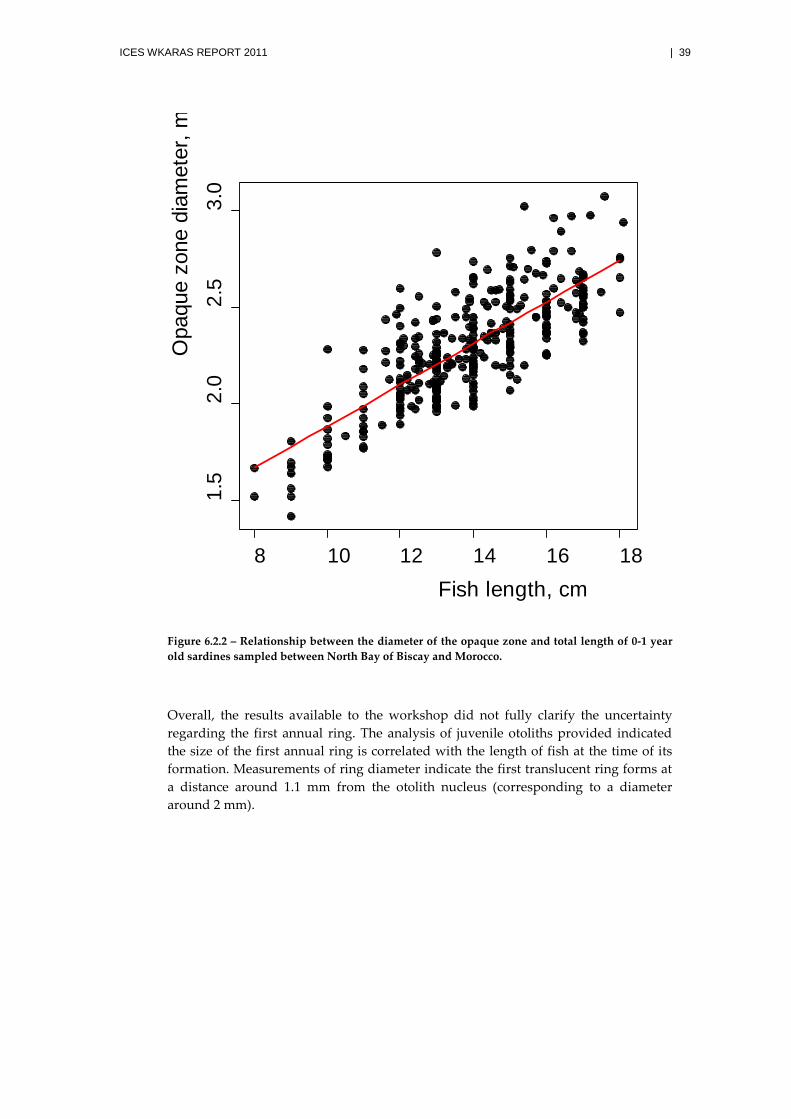
Fish and otolith measurements for 0-group and 1-year old individuals from samples of the Workshop showed the diameter of the first annual ring is directly proportional to fish length (WD Silva and Silva, 2010). Individuals between 11 and 16 cm had ring diameters between 2.0 and 2.9 mm (mean=2.4 mm). These values are more consistent with the measurements of the true first ring than with those of the assumed check (Table 6.2.1) (taking into account that the diameter is approximately the double of the radius). Data from the last Workshop on the diameter of the opaque zone measured in 0-1 year old otoliths (Soares et al., 2007) showed a significant linear relationship between the diameter of the opaque zone (OZD) preceding the first translucent an-nual ring and fish total length (r2=0.61, p<0.001) (Figure 6.2.2). The form of this rela-tionship is:
OZD (mm) = 0.81+0.11xTL(cm)
Age 0 Age 1
Age (days) Age (days)
Frequency
Frequency
More More
ICES WKARAS REPORT 2011 | 39
Figure 6.2.2 – Relationship between the diameter of the opaque zone and total length of 0-1 year old sardines sampled between North Bay of Biscay and Morocco.
Overall, the results available to the workshop did not fully clarify the uncertainty regarding the first annual ring. The analysis of juvenile otoliths provided indicated the size of the first annual ring is correlated with the length of fish at the time of its formation. Measurements of ring diameter indicate the first translucent ring forms at a distance around 1.1 mm from the otolith nucleus (corresponding to a diameter around 2 mm).
8 10 12 14 16 18
1.5
2.0
2.5
3.0
Fish length, cm
Opa
que
zone
dia
met
er, m
40 | ICES WKARAS REPORT 2011
7 Results of comparative age readings at the Workshop
Based on the results of the otolith exchange and the discussions which followed, the participants decided to introduce some modifications into the guidelines related to the otolith edge and identification of the first annual ring, as described below:
1 ) Different dates, according to presumable otolith age, should be used to guide the transition from the period of the year when a translucent edge is counted as an annual ring to the period of the year when a translucent edge is not counted as an annual ring:
a ) 1st June in 0-1 year old individuals b ) 1st July in 2 years old individuals c ) 1st August in ≥3 years old individuals
The dates above should be used in a flexible way taking also into account the area, the width of the translucent edge and the overall growth pattern of the otolith.
2 ) A reference diameter of ≈2 mm (radius ≈1 mm) should be used to guide the identification of the first annual ring. This reference should be used in a flexible way, since the diameter of the first annual ring is proportional to the fish growth up to its formation.
In order to test the influence of these guidelines on the precision of the age readings, a reading exercise was undertaken during the workshop. All readers individually re-read a sub-set of otoliths from Sets A, B and E of the exchange. It should be hig-hlighted that in their routine age readings, Readers 1, 2, and 4 already applied rule 2 in a strict way. Readers 3 and 5 took into account the position of the first translucent ring in a flexible way. Readers 6 and 7 already considered the delay in the formation of the opaque ring with age and considered the width of the edge as in rule 1. The results of these re-readings were then compared with the ones of the exchange for the same otolith sub-sets. The results are the following:
Sub-set A – Portuguese Coast
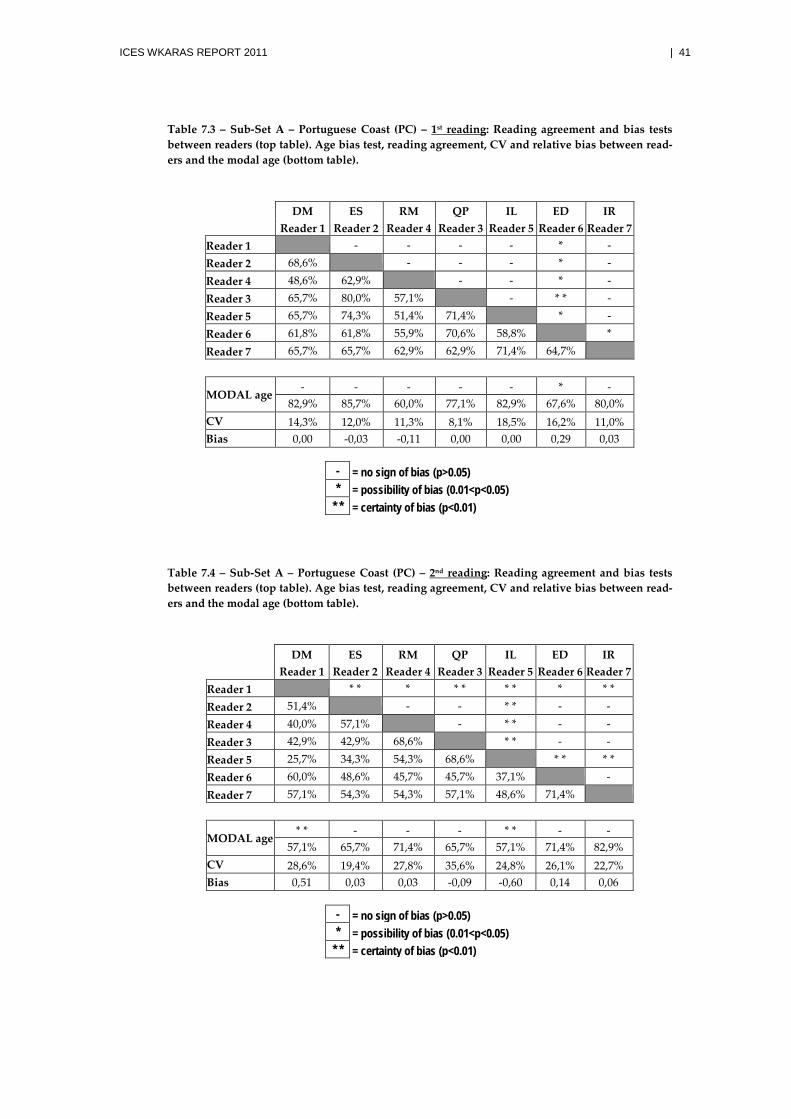
The average reading agreement of all readers combined against modal age was 67.3% with a CV of 28.7% in the 2nd reading (Table 7.2 in Annex 3). These results were worse than those obtained in the 1st reading (76.5% of reading agreement and a CV of 20.5%, Table 7.1 in Annex 3). Nevertheless, three of the readers, R4, R6 and R7 increased their agreement with the modal age in the 2nd reading (see Tables 7.3 and 7.4). All readers decreased precision in the 2nd reading, possibly due to the higher flexibility of the new rules. Between-reader agreement also showed a general decrease in the 2nd reading varying between 25.7% (R1 versus R5) and 71.4% (R6 versus R7) while in the 1st reading it varied between 48.6% (R1 versus R4) and 80.0% (R2 versus R3). While R6 showed in the 1st reading signs of bias, in the 2nd reading this was more evident for R1 and R5.
ICES WKARAS REPORT 2011 | 41
Table 7.3 – Sub-Set A – Portuguese Coast (PC) – 1st reading: Reading agreement and bias tests between readers (top table). Age bias test, reading agreement, CV and relative bias between read-ers and the modal age (bottom table).
DM ES RM QP IL ED IR
Reader 1 Reader 2 Reader 4 Reader 3 Reader 5 Reader 6 Reader 7
Reader 1 - - - - * - Reader 2 68,6%
- - - * -
Reader 4 48,6% 62,9% - - * - Reader 3 65,7% 80,0% 57,1%
- * * -
Reader 5 65,7% 74,3% 51,4% 71,4%
* - Reader 6 61,8% 61,8% 55,9% 70,6% 58,8%
*
Reader 7 65,7% 65,7% 62,9% 62,9% 71,4% 64,7%
MODAL age - - - - - * -
82,9% 85,7% 60,0% 77,1% 82,9% 67,6% 80,0% CV 14,3% 12,0% 11,3% 8,1% 18,5% 16,2% 11,0% Bias 0,00 -0,03 -0,11 0,00 0,00 0,29 0,03
- = no sign of bias (p>0.05) * = possibility of bias (0.01<p<0.05)
* * = certainty of bias (p<0.01)
Table 7.4 – Sub-Set A – Portuguese Coast (PC) – 2nd reading: Reading agreement and bias tests between readers (top table). Age bias test, reading agreement, CV and relative bias between read-ers and the modal age (bottom table).
DM ES RM QP IL ED IR
Reader 1 Reader 2 Reader 4 Reader 3 Reader 5 Reader 6 Reader 7
Reader 1 * * * * * * * * * *
Reader 2 51,4%
- - * * - - Reader 4 40,0% 57,1%
- * * - -
Reader 3 42,9% 42,9% 68,6%
* * - - Reader 5 25,7% 34,3% 54,3% 68,6% * * * * Reader 6 60,0% 48,6% 45,7% 45,7% 37,1%
-
Reader 7 57,1% 54,3% 54,3% 57,1% 48,6% 71,4%
MODAL age
* * - - - * * - - 57,1% 65,7% 71,4% 65,7% 57,1% 71,4% 82,9%
CV 28,6% 19,4% 27,8% 35,6% 24,8% 26,1% 22,7% Bias 0,51 0,03 0,03 -0,09 -0,60 0,14 0,06
- = no sign of bias (p>0.05) * = possibility of bias (0.01<p<0.05)
* * = certainty of bias (p<0.01)
42 | ICES WKARAS REPORT 2011
Sub-set B – Bay of Biscay North
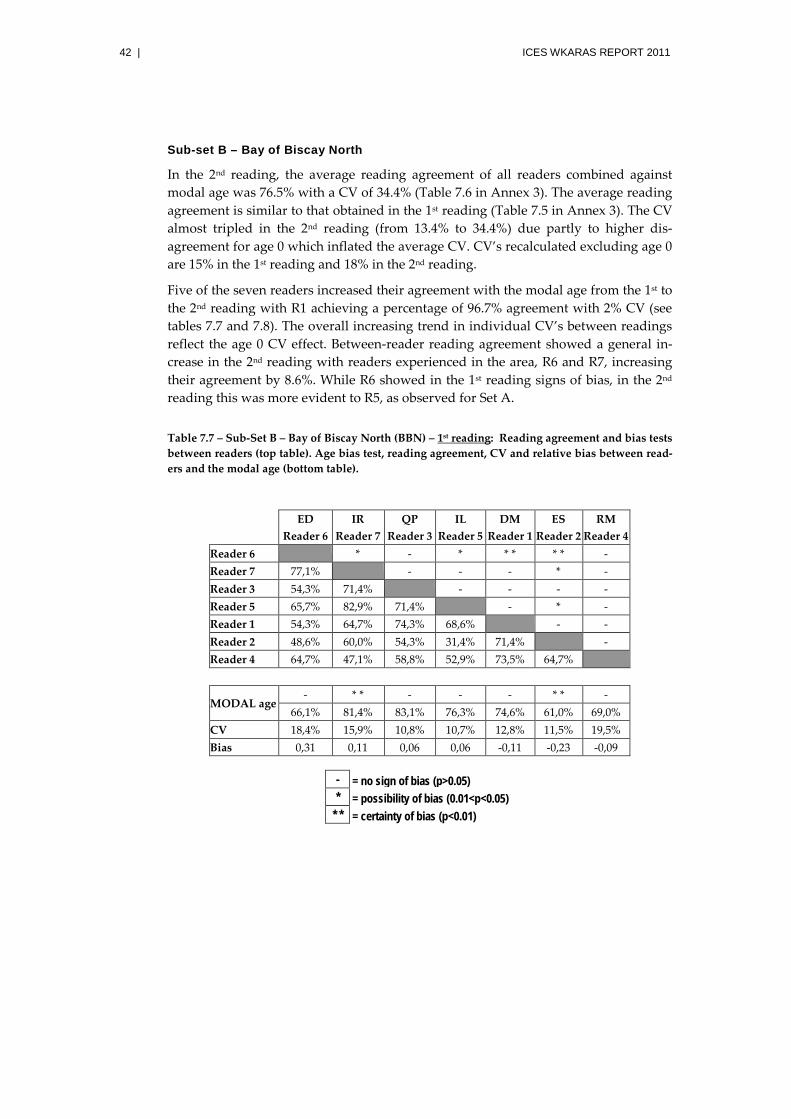
In the 2nd reading, the average reading agreement of all readers combined against modal age was 76.5% with a CV of 34.4% (Table 7.6 in Annex 3). The average reading agreement is similar to that obtained in the 1st reading (Table 7.5 in Annex 3). The CV almost tripled in the 2nd reading (from 13.4% to 34.4%) due partly to higher dis-agreement for age 0 which inflated the average CV. CV’s recalculated excluding age 0 are 15% in the 1st reading and 18% in the 2nd reading.
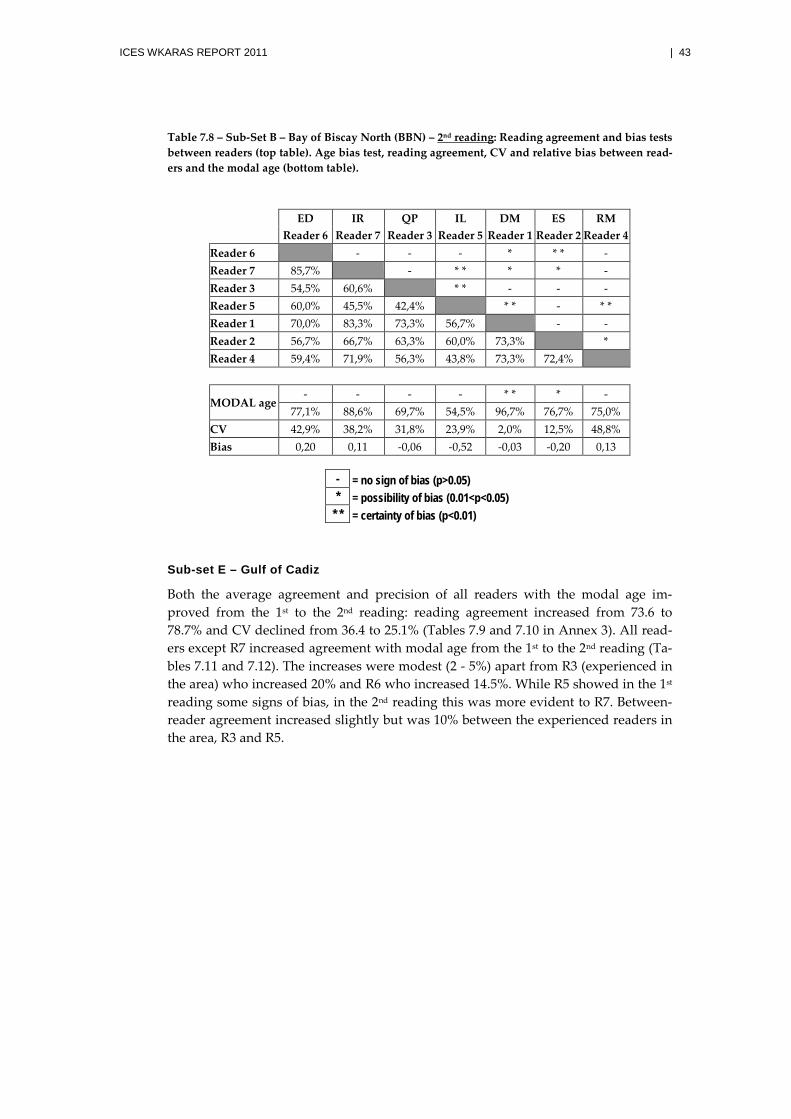
Five of the seven readers increased their agreement with the modal age from the 1st to the 2nd reading with R1 achieving a percentage of 96.7% agreement with 2% CV (see tables 7.7 and 7.8). The overall increasing trend in individual CV’s between readings reflect the age 0 CV effect. Between-reader reading agreement showed a general in-crease in the 2nd reading with readers experienced in the area, R6 and R7, increasing their agreement by 8.6%. While R6 showed in the 1st reading signs of bias, in the 2nd reading this was more evident to R5, as observed for Set A.
Table 7.7 – Sub-Set B – Bay of Biscay North (BBN) – 1st reading: Reading agreement and bias tests between readers (top table). Age bias test, reading agreement, CV and relative bias between read-ers and the modal age (bottom table).
ED IR QP IL DM ES RM
Reader 6 Reader 7 Reader 3 Reader 5 Reader 1 Reader 2 Reader 4
Reader 6
* - * * * * * - Reader 7 77,1%
- - - * -
Reader 3 54,3% 71,4% - - - - Reader 5 65,7% 82,9% 71,4%
- * -
Reader 1 54,3% 64,7% 74,3% 68,6%
- - Reader 2 48,6% 60,0% 54,3% 31,4% 71,4%
-
Reader 4 64,7% 47,1% 58,8% 52,9% 73,5% 64,7%
MODAL age
- * * - - - * * - 66,1% 81,4% 83,1% 76,3% 74,6% 61,0% 69,0%
CV 18,4% 15,9% 10,8% 10,7% 12,8% 11,5% 19,5% Bias 0,31 0,11 0,06 0,06 -0,11 -0,23 -0,09
- = no sign of bias (p>0.05) * = possibility of bias (0.01<p<0.05)
* * = certainty of bias (p<0.01)
ICES WKARAS REPORT 2011 | 43
Table 7.8 – Sub-Set B – Bay of Biscay North (BBN) – 2nd reading: Reading agreement and bias tests between readers (top table). Age bias test, reading agreement, CV and relative bias between read-ers and the modal age (bottom table).
ED IR QP IL DM ES RM
Reader 6 Reader 7 Reader 3 Reader 5 Reader 1 Reader 2 Reader 4
Reader 6 - - - * * * - Reader 7 85,7%
- * * * * -
Reader 3 54,5% 60,6% * * - - - Reader 5 60,0% 45,5% 42,4%
* * - * *
Reader 1 70,0% 83,3% 73,3% 56,7%
- - Reader 2 56,7% 66,7% 63,3% 60,0% 73,3%
*
Reader 4 59,4% 71,9% 56,3% 43,8% 73,3% 72,4%
MODAL age
- - - - * * * - 77,1% 88,6% 69,7% 54,5% 96,7% 76,7% 75,0%
CV 42,9% 38,2% 31,8% 23,9% 2,0% 12,5% 48,8% Bias 0,20 0,11 -0,06 -0,52 -0,03 -0,20 0,13
- = no sign of bias (p>0.05) * = possibility of bias (0.01<p<0.05)
* * = certainty of bias (p<0.01)
Sub-set E – Gulf of Cadiz
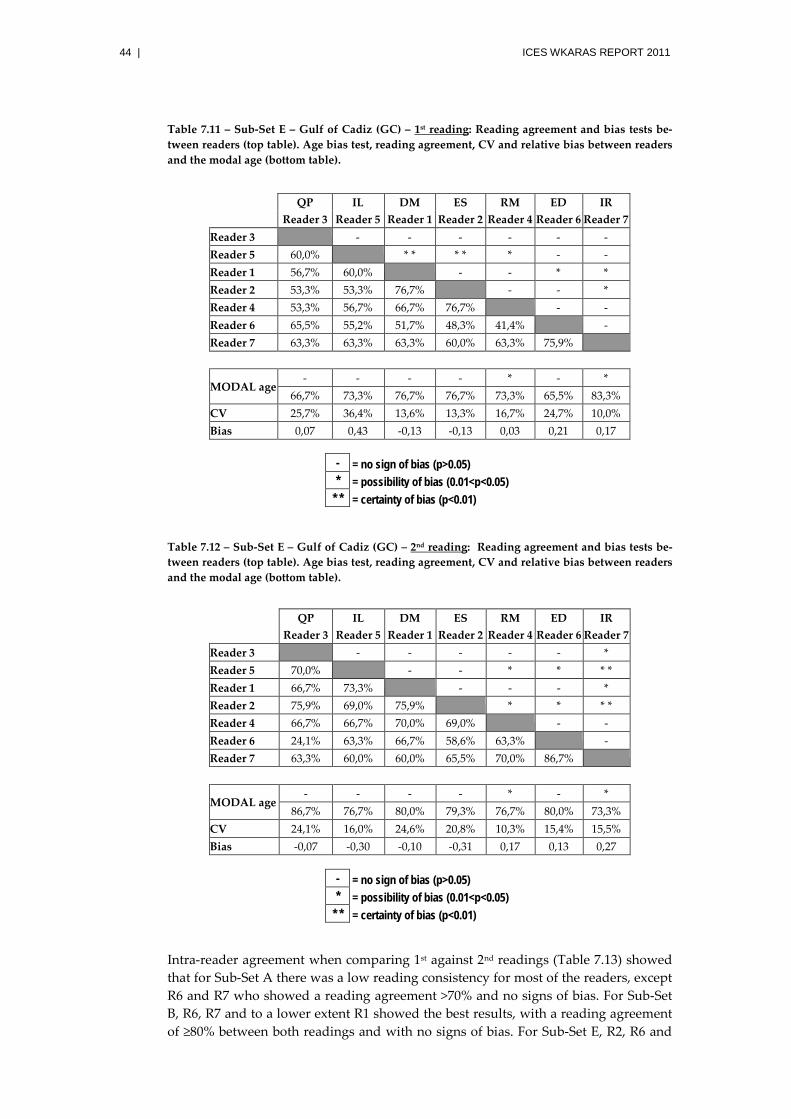
Both the average agreement and precision of all readers with the modal age im-proved from the 1st to the 2nd reading: reading agreement increased from 73.6 to 78.7% and CV declined from 36.4 to 25.1% (Tables 7.9 and 7.10 in Annex 3). All read-ers except R7 increased agreement with modal age from the 1st to the 2nd reading (Ta-bles 7.11 and 7.12). The increases were modest (2 - 5%) apart from R3 (experienced in the area) who increased 20% and R6 who increased 14.5%. While R5 showed in the 1st reading some signs of bias, in the 2nd reading this was more evident to R7. Between-reader agreement increased slightly but was 10% between the experienced readers in the area, R3 and R5.
44 | ICES WKARAS REPORT 2011
Table 7.11 – Sub-Set E – Gulf of Cadiz (GC) – 1st reading: Reading agreement and bias tests be-tween readers (top table). Age bias test, reading agreement, CV and relative bias between readers and the modal age (bottom table).
QP IL DM ES RM ED IR
Reader 3 Reader 5 Reader 1 Reader 2 Reader 4 Reader 6 Reader 7
Reader 3 - - - - - - Reader 5 60,0%
* * * * * - -
Reader 1 56,7% 60,0% - - * * Reader 2 53,3% 53,3% 76,7%
- - *
Reader 4 53,3% 56,7% 66,7% 76,7%
- - Reader 6 65,5% 55,2% 51,7% 48,3% 41,4%
-
Reader 7 63,3% 63,3% 63,3% 60,0% 63,3% 75,9%
MODAL age
- - - - * - * 66,7% 73,3% 76,7% 76,7% 73,3% 65,5% 83,3%
CV 25,7% 36,4% 13,6% 13,3% 16,7% 24,7% 10,0% Bias 0,07 0,43 -0,13 -0,13 0,03 0,21 0,17
- = no sign of bias (p>0.05) * = possibility of bias (0.01<p<0.05)
* * = certainty of bias (p<0.01)
Table 7.12 – Sub-Set E – Gulf of Cadiz (GC) – 2nd reading: Reading agreement and bias tests be-tween readers (top table). Age bias test, reading agreement, CV and relative bias between readers and the modal age (bottom table).
QP IL DM ES RM ED IR
Reader 3 Reader 5 Reader 1 Reader 2 Reader 4 Reader 6 Reader 7
Reader 3 - - - - - * Reader 5 70,0%
- - * * * *
Reader 1 66,7% 73,3% - - - * Reader 2 75,9% 69,0% 75,9%
* * * *
Reader 4 66,7% 66,7% 70,0% 69,0%
- - Reader 6 24,1% 63,3% 66,7% 58,6% 63,3%
-
Reader 7 63,3% 60,0% 60,0% 65,5% 70,0% 86,7%
MODAL age
- - - - * - * 86,7% 76,7% 80,0% 79,3% 76,7% 80,0% 73,3%
CV 24,1% 16,0% 24,6% 20,8% 10,3% 15,4% 15,5% Bias -0,07 -0,30 -0,10 -0,31 0,17 0,13 0,27
- = no sign of bias (p>0.05) * = possibility of bias (0.01<p<0.05)
* * = certainty of bias (p<0.01)
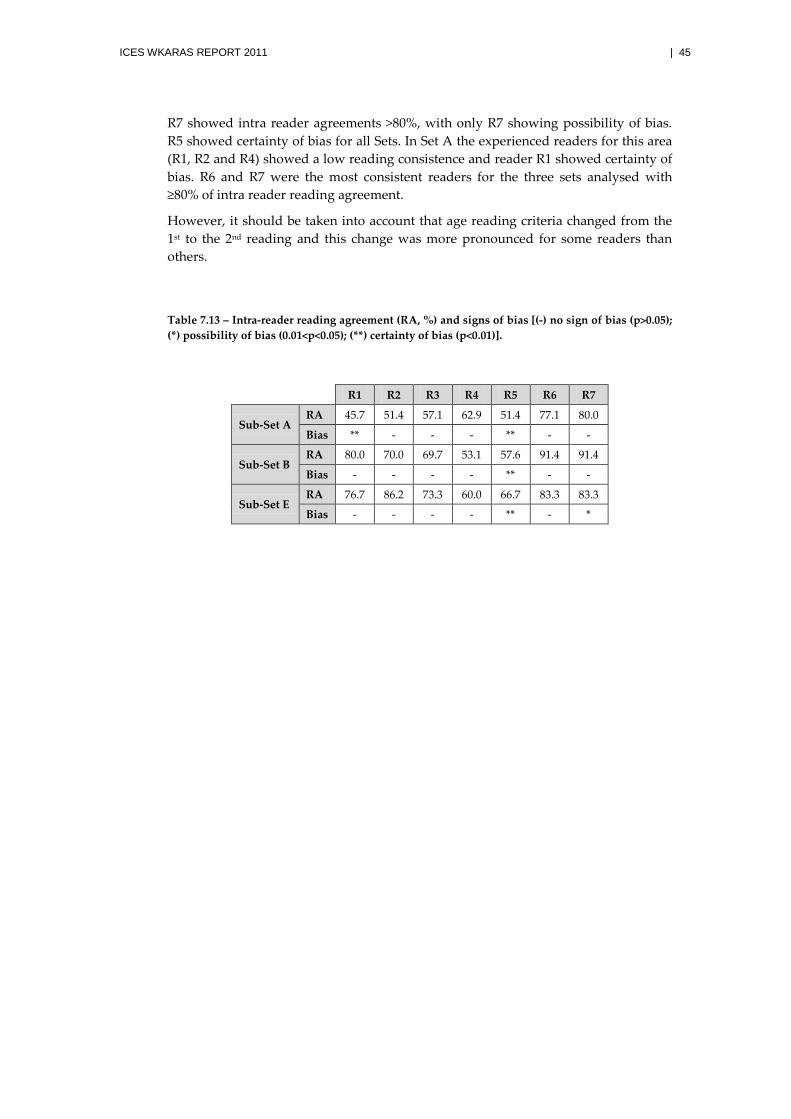
Intra-reader agreement when comparing 1st against 2nd readings (Table 7.13) showed that for Sub-Set A there was a low reading consistency for most of the readers, except R6 and R7 who showed a reading agreement >70% and no signs of bias. For Sub-Set B, R6, R7 and to a lower extent R1 showed the best results, with a reading agreement of ≥80% between both readings and with no signs of bias. For Sub-Set E, R2, R6 and
ICES WKARAS REPORT 2011 | 45
R7 showed intra reader agreements >80%, with only R7 showing possibility of bias. R5 showed certainty of bias for all Sets. In Set A the experienced readers for this area (R1, R2 and R4) showed a low reading consistence and reader R1 showed certainty of bias. R6 and R7 were the most consistent readers for the three sets analysed with ≥80% of intra reader reading agreement.
However, it should be taken into account that age reading criteria changed from the 1st to the 2nd reading and this change was more pronounced for some readers than others.
Table 7.13 – Intra-reader reading agreement (RA, %) and signs of bias [(-) no sign of bias (p>0.05); (*) possibility of bias (0.01<p<0.05); (**) certainty of bias (p<0.01)].
R1 R2 R3 R4 R5 R6 R7
Sub-Set A RA 45.7 51.4 57.1 62.9 51.4 77.1 80.0
Bias ** - - - ** - -
Sub-Set B RA 80.0 70.0 69.7 53.1 57.6 91.4 91.4
Bias - - - - ** - -
Sub-Set E RA 76.7 86.2 73.3 60.0 66.7 83.3 83.3
Bias - - - - ** - *
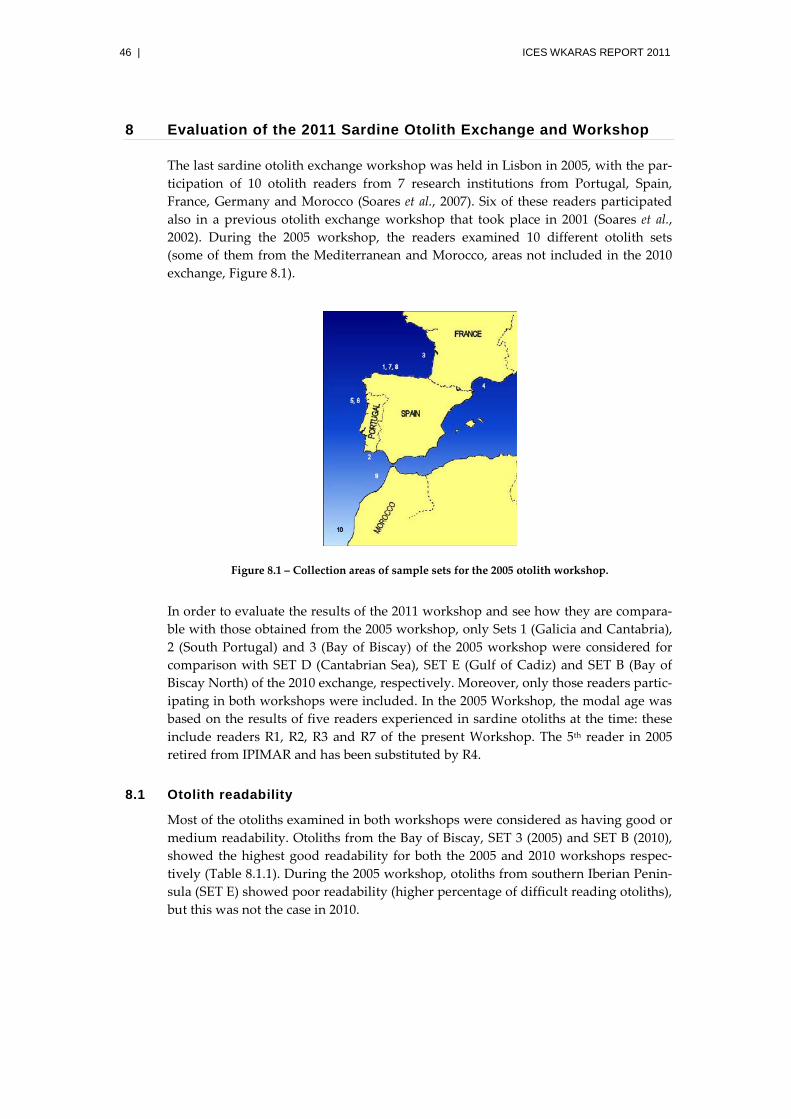
46 | ICES WKARAS REPORT 2011
8 Evaluation of the 2011 Sardine Otolith Exchange and Workshop
The last sardine otolith exchange workshop was held in Lisbon in 2005, with the par-ticipation of 10 otolith readers from 7 research institutions from Portugal, Spain, France, Germany and Morocco (Soares et al., 2007). Six of these readers participated also in a previous otolith exchange workshop that took place in 2001 (Soares et al., 2002). During the 2005 workshop, the readers examined 10 different otolith sets (some of them from the Mediterranean and Morocco, areas not included in the 2010 exchange, Figure 8.1).
Figure 8.1 – Collection areas of sample sets for the 2005 otolith workshop.
In order to evaluate the results of the 2011 workshop and see how they are compara-ble with those obtained from the 2005 workshop, only Sets 1 (Galicia and Cantabria), 2 (South Portugal) and 3 (Bay of Biscay) of the 2005 workshop were considered for comparison with SET D (Cantabrian Sea), SET E (Gulf of Cadiz) and SET B (Bay of Biscay North) of the 2010 exchange, respectively. Moreover, only those readers partic-ipating in both workshops were included. In the 2005 Workshop, the modal age was based on the results of five readers experienced in sardine otoliths at the time: these include readers R1, R2, R3 and R7 of the present Workshop. The 5th reader in 2005 retired from IPIMAR and has been substituted by R4.
8.1 Otolith readability
Most of the otoliths examined in both workshops were considered as having good or medium readability. Otoliths from the Bay of Biscay, SET 3 (2005) and SET B (2010), showed the highest good readability for both the 2005 and 2010 workshops respec-tively (Table 8.1.1). During the 2005 workshop, otoliths from southern Iberian Penin-sula (SET E) showed poor readability (higher percentage of difficult reading otoliths), but this was not the case in 2010.
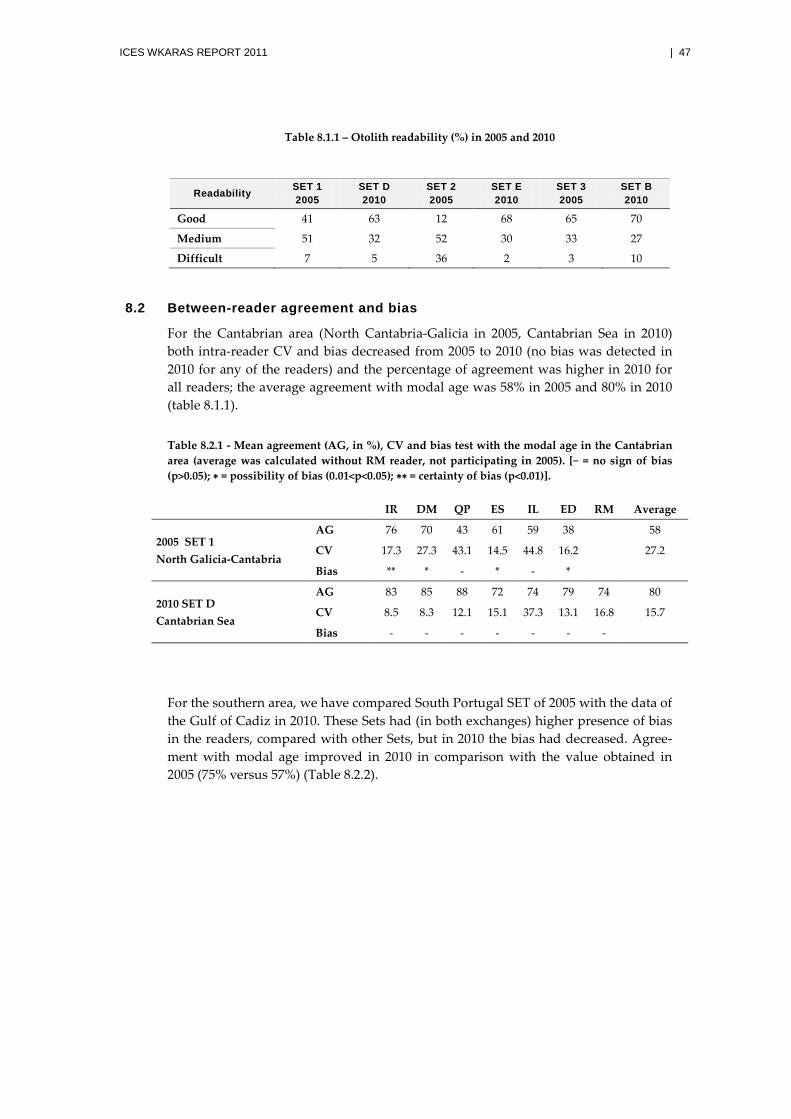
ICES WKARAS REPORT 2011 | 47
Table 8.1.1 – Otolith readability (%) in 2005 and 2010
Readability SET 1 2005
SET D 2010
SET 2 2005
SET E 2010
SET 3 2005
SET B 2010
Good 41 63 12 68 65 70
Medium 51 32 52 30 33 27
Difficult 7 5 36 2 3 10
8.2 Between-reader agreement and bias
For the Cantabrian area (North Cantabria-Galicia in 2005, Cantabrian Sea in 2010) both intra-reader CV and bias decreased from 2005 to 2010 (no bias was detected in 2010 for any of the readers) and the percentage of agreement was higher in 2010 for all readers; the average agreement with modal age was 58% in 2005 and 80% in 2010 (table 8.1.1).
Table 8.2.1 - Mean agreement (AG, in %), CV and bias test with the modal age in the Cantabrian area (average was calculated without RM reader, not participating in 2005). [− = no sign of bias (p>0.05); ∗ = possibility of bias (0.01<p<0.05); ∗∗ = certainty of bias (p<0.01)].
IR DM QP ES IL ED RM Average
2005 SET 1 North Galicia-Cantabria
AG 76 70 43 61 59 38 58
CV 17.3 27.3 43.1 14.5 44.8 16.2 27.2
Bias ** * - * - *
2010 SET D Cantabrian Sea
AG 83 85 88 72 74 79 74 80
CV 8.5 8.3 12.1 15.1 37.3 13.1 16.8 15.7
Bias - - - - - - -
For the southern area, we have compared South Portugal SET of 2005 with the data of the Gulf of Cadiz in 2010. These Sets had (in both exchanges) higher presence of bias in the readers, compared with other Sets, but in 2010 the bias had decreased. Agree-ment with modal age improved in 2010 in comparison with the value obtained in 2005 (75% versus 57%) (Table 8.2.2).
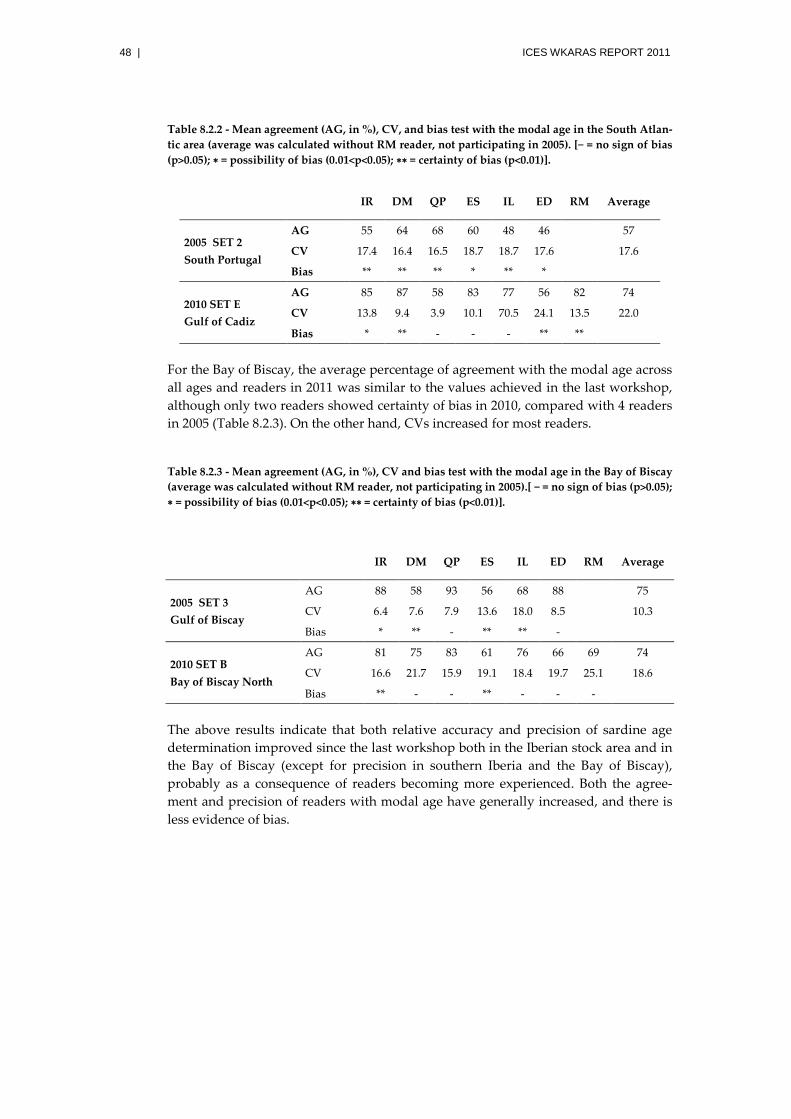
48 | ICES WKARAS REPORT 2011
Table 8.2.2 - Mean agreement (AG, in %), CV, and bias test with the modal age in the South Atlan-tic area (average was calculated without RM reader, not participating in 2005). [− = no sign of bias (p>0.05); ∗ = possibility of bias (0.01<p<0.05); ∗∗ = certainty of bias (p<0.01)].
IR DM QP ES IL ED RM Average
2005 SET 2 South Portugal
AG 55 64 68 60 48 46 57
CV 17.4 16.4 16.5 18.7 18.7 17.6 17.6
Bias ** ** ** * ** *
2010 SET E Gulf of Cadiz
AG 85 87 58 83 77 56 82 74
CV 13.8 9.4 3.9 10.1 70.5 24.1 13.5 22.0
Bias * ** - - - ** **
For the Bay of Biscay, the average percentage of agreement with the modal age across all ages and readers in 2011 was similar to the values achieved in the last workshop, although only two readers showed certainty of bias in 2010, compared with 4 readers in 2005 (Table 8.2.3). On the other hand, CVs increased for most readers.
Table 8.2.3 - Mean agreement (AG, in %), CV and bias test with the modal age in the Bay of Biscay (average was calculated without RM reader, not participating in 2005).[ − = no sign of bias (p>0.05); ∗ = possibility of bias (0.01<p<0.05); ∗∗ = certainty of bias (p<0.01)].
IR DM QP ES IL ED RM Average
2005 SET 3 Gulf of Biscay
AG 88 58 93 56 68 88 75
CV 6.4 7.6 7.9 13.6 18.0 8.5 10.3
Bias * ** - ** ** -
2010 SET B Bay of Biscay North
AG 81 75 83 61 76 66 69 74
CV 16.6 21.7 15.9 19.1 18.4 19.7 25.1 18.6
Bias ** - - ** - - -
The above results indicate that both relative accuracy and precision of sardine age determination improved since the last workshop both in the Iberian stock area and in the Bay of Biscay (except for precision in southern Iberia and the Bay of Biscay), probably as a consequence of readers becoming more experienced. Both the agree-ment and precision of readers with modal age have generally increased, and there is less evidence of bias.
ICES WKARAS REPORT 2011 | 49
9 The Otolith Reference Collection and development of a future database
Images of otoliths used in the 2010 exchange which attained ≥80% of agreement of all readers combined against modal age were saved in an image data base to build a reference collection for each area. This collection includes 28 otolith from SET A (Ages 0 to 7 years, Portuguese Coast), 22 otolith from SET B (Ages 0 to 7 years, north-ern Bay of Biscay), 30 otolith from SET C (Ages 0 to 7 years, southern Bay of Biscay), 33 otolith from SET D (Ages 0 to 8 years, Cantabrian Sea) and 26 otolith from SET E (Ages 0 to 4 years, Gulf of Cadiz). The exact positions of the modal annual rings were digitally marked in the image with colour dots. An excerpt of the reference collection is presented in Annex 4. A copy of the full reference collection was uploaded to the Workshop sharepoint (http://groupnet.ices.dk/WKARAS2011/default.aspx) and given to each participant.
50 | ICES WKARAS REPORT 2011
10 Manual for the age determination of sardine
This Workshop agreed that age readers should apply the following guidelines for preparation, observation and age determination of sardine:
1 ) Otoliths extracted from sampled fish are washed with fresh water, dried and mounted (with the sulcus down) on black plastic plaques glued with an inert resin in individual numbered cavities;
2 ) Otoliths are examined using a binocular microscope under reflected light with 20X magnification (opaque zones are then visible as white and hya-line zones dark). The magnification should be increased near the otolith edge to improve the discrimination of narrow rings in older individuals;
3 ) Sardine is aged by counting hyaline zones in the otolith; one year’s growth ring (annulus) consists of one opaque zone and one hyaline zone.
4 ) Ring counts and edge type classification should preferably be done on the posterior (post-rostrum) region of the otolith where annual rings are gen-erally clearer and otolith growth is larger;
5 ) In order to adopt a ring as an annulus it is recommended that the ring can be followed throughout the whole otolith contour. This rule must be ap-plied specially for the first three annuli, in older specimens rings are very close together and become more difficult to follow;
6 ) The first of January is adopted as the birthdate;
7 ) For a fish caught in the first part of the year (prior to the growing period, i.e. opaque zone formation), the age corresponds to the number of hyaline zones present in the otolith (including the edge). For a fish caught in the second part of the year (after the opaque zone formation) the age corres-ponds to number of hyaline zones completely formed (i.e. a hyaline edge is not counted). Different dates, according to fish age, should be used to guide the transition from the first to the second part of the year:
a ) 1st June for 0-1 year old individuals; b ) 1st July for 2 years old individuals; c ) 1st August for ≥3 years old individuals.
The dates above should be used in a flexible way, taking also into account the width of the translucent edge and the overall growth pattern of the oto-lith.
8 ) A reference diameter of ≈2 mm (radius ≈1 mm) should be used to guide the identification of the first annual ring. This reference should be used in a flexible way, since the diameter of the first annual ring is proportional to the fish growth up to its formation;
9 ) For each otolith, the number of hyaline rings (excluding the edge), edge type, age and readability (1 - good, 2 - medium, 3 - difficult) should be rec-orded; false rings and other relevant characteristics of the otolith (e.g. crys-tallized otoliths) should be noted as well;
10 ) The percentage of opaque/hyaline edges should be calculated for each sample collected over the year to help determine the period of opaque edge deposition.
ICES WKARAS REPORT 2011 | 51
11 Recommendations and follow up actions
1 ) To increase the frequency of small scale otolith exchanges between labora-tories responsible for age readings in neighbor areas, e.g. every two and half years;
2 ) Age reading Workshops to take place regularly at 4-5 years intervals, with participants experienced in the Iberian Stock area, in the Bay of Biscay and in ICES Div. VIIe;
3 ) Each reader in each area should regularly calibrate his age readings with the reference collection produced during this workshop;
4 ) Age reading work should be carried out twice a year, with samples or-dered by dates of capture, to facilitate the interpretation of the otolith growth along the year. This way, the progressive formation of the edge can be followed and the recognition of major recruiting and year classes be-comes more consistent;
5 ) Encourages the development of comprehensive studies on the seasonality of the otolith edge in each area;
6 ) Encourages the development of comprehensive studies to clarify the iden-tification of the first annual ring;
7 ) The Workshop supports the recommendation of WKARA 2009 to set up of a Workshop on micro-increments analysis and methodology and suggests this is extended to sardine and eventually, to other small pelagic fish (e.g. herring, sprat);
8 ) The Workshop recommends that the procedures to calculate CV’s by age group are reviewed, taking into account the problem of inflation observed for age group 0.
52 | ICES WKARAS REPORT 2011
12 General conclusions
The Workshop on Age reading of European Atlantic Sardine (WKARAS) was held in Lisbon, Portugal, from 14 to 18 February 2011. An otolith exchange was undertaken from September to December 2010 in order to prepare material and data for the workshop. There were 11 participants on the Workshop from five institutes located in France, Spain and Portugal and one from the UK who participated only in the otolith exchange. Seven age readers participated in the workshop; all readers had more than 4 years of experience in sardine age reading and are responsible of providing age determinations for the assessment of the Iberian sardine stock (Sardine in VIIIc and IXa) and for the description of the catch and survey age structure of sardine from the Bay of Biscay within the ICES Working Group on Anchovy and Sardine (WGANSA).
The otolith exchange included a total of 300 otoliths from samples collected in 2008 spanning the area from ICES Sub-Area VIIIa (Bay of Biscay North) to Sub-Division IXa-South-Cadiz (Gulf of Cadiz). These otoliths were grouped into five regional sets, each containing 60 pairs of otoliths (ca. 30 from each semester), covering the range of lengths and ages (0-8 years) common in each area. Otoliths were prepared and inter-preted according to guidelines in Soares et al. (2007).
Overall, the relative accuracy of sardine age determination was good: the average percentage of agreement with modal age was 77.0% and 75.2% for the Iberian Stock and the Bay of Biscay respectively and average bias was ca. 0.03 years. Precision was substantially higher in the Bay of Biscay (CV= 14.1%) than in the Iberian stock area (CV=32.8%) although the latter is strongly influenced by high CVs at age 0 in the Gulf of Cadiz. By excluding age 0, the precision in the Iberian Stock area becomes similar to that in the Bay of Biscay (14.7%), being still above the 5% threshold recommended in the PGCCDBS Guidelines for Workshops on Age Calibration.
Compared to the previous Workshop (Cantabrian Sea and South Iberian peninsula areas), relative accuracy of sardine age determination within the Iberian Stock area have improved substantially and there is less evidence of bias (% agreement in-creased ca. 20%) while precision increased in the Cantabrian Sea (CV declined from 17.2 to 15.7%) but decreased in south Iberia (CV increased from 17.6 to 22.0%). In the Bay of Biscay, the relative accuracy was maintained but the precision declined (CV increased from 10.3 to 18.6%).
The main discrepancies between readers in sardine age determination were the iden-tification of the otolith edge and of the first annual ring, which accounted for 25-53% and 32-43% of the total number of discrepancies in otolith interpretation, respectively. These are recurrent issues in sardine age determination (e.g. ICES, 1997; Soares et al., 2007).
Disagreement in the identification of the first annual ring was often caused by the occurrence of a first translucent ring, wide and clearly marked around the whole otolith formed slightly closer to the nucleus than typically. Part of the readers consid-ers this ring a check (false ring) and part consider this the first annual ring.
The results of an on-going study of otolith seasonal growth showed that the seasonal-ity of the otolith edge varies with fish age, with older individuals forming an opaque edge later in the year for a shorter period as observed in several other clupeids (e.g. anchovy, ICES, 2009b). Marginal growth was also different between the Bay of Biscay and the Portuguese waters, with a longer period of opaque growth in Age 1 individ-uals and more similar patterns for Ages 2-4 years in the former area.
ICES WKARAS REPORT 2011 | 53
Preliminary results from the analysis of daily growth rings of sardine juveniles in northern Portugal corroborated the attribution of age in years. The diameter of the first annual ring was positively correlated with the length of fish at the time of forma-tion. Measurements of ring diameter indicate that the first translucent ring forms at a distance around 1.1 mm from the otolith nucleus, corresponding to a diameter around 2 mm. The radius of the potential check did not overlap with the radius of the true ring (as considered by some readers) but measurements were very close and certainly impossible to discern just by observation of the otolith.
Guidelines related to the age reading problems were modified and their impact on age reading was evaluated by a second reading of a sub-set of the exchange otoliths. Changes in relative accuracy and precision were not consistent among areas: agree-ment was similar while precision declined substantially in the Gulf of Biscay, general-ly worse results were obtained for western Portugal and generally better results were obtained for the Gulf of Cadiz.
Although the results available to the workshop did not fully clarify the major age reading uncertainties, the participants considered that sardine age reading would be improved by taking into account age-related differences in edge seasonality and by using a flexible gauge to guide the identification of the first annual ring. These changes were accommodated in the age reading protocol. Conversely, the present birthdate assumption, 1st of January, was considered to be well adapted to the spawn-ing seasonality and growth pattern of sardine across the area.
A reference collection of annotated (catch area and date, fish length and location of modal rings) otolith digital images was assembled. The collection contains 139 oto-liths covering the area from northern Gulf of Biscay to the Gulf of Cadiz and Age groups 0-8 years.
54 | ICES WKARAS REPORT 2011
13 Contributions to the Workshop (Working Documents and Presentations)
Coelho, P., Duhamel, E., 2010. Dia 3 - Identificação do bordo e sazonalidade. Presentation to the Workshop on Age Reading of European Atlantic Sardine (WKARAS), Lisbon, Portug-al, 14–18 February 2011.
Riveiro, I., Silva, A., Soares, E., 2011. Problems in Age Reading. Presentation to the Workshop on Age Reading of European Atlantic Sardine (WKARAS), Lisbon, Portugal, 14–18 Febru-ary 2011.
Silva, A.V., Silva, A., 2010. Dia 3 - Validação das idades 0 e 1 de Sardinha usando anéis diários e identificação do 1º anel anual. Presentation to the Workshop on Age Reading of Euro-pean Atlantic Sardine (WKARAS), Lisbon, Portugal, 14–18 February 2011.
Silva, A.V., Meneses, I., Silva, A., 2010. Determinação de idade de juvenis de sardinha, Sardina pilchardus (Walbaum, 1792) a partir de características morfométricas dos indivíduos e dos otólitos. Presentation to the Workshop on Age Reading of European Atlantic Sardine (WKARAS), Lisbon, Portugal, 14–18 February 2011.
Soares, E., Riveiro, I., Silva, 2011. Results of the Sardine Otolith Exchange 2010 Programme. WD presented to the Workshop on Age Reading of European Atlantic Sardine (WKA-RAS), Lisbon, Portugal, 14–18 February 2011.
ICES WKARAS REPORT 2011 | 55
14 Acknowledgements
The Sardine Otolith Exchange 2010 and this Workshop were held wi-thin the EU Data Collection Framework (DCF).
Acknowledgments are due to our colleague Andrés Uriarte of Fundación AZTI (Insti-tuto Tecnológico Pesquero y Alimentario) Gipuzkoa, Spain, for his critical review of the 2010 exchange results and for his comments to improve the guidelines for sardine age reading, which were useful contributions to the successful achievement of the workshop goals. We would like to express our wishes of a quick recovery from his knee injuries that prevented him to participate in our meeting.
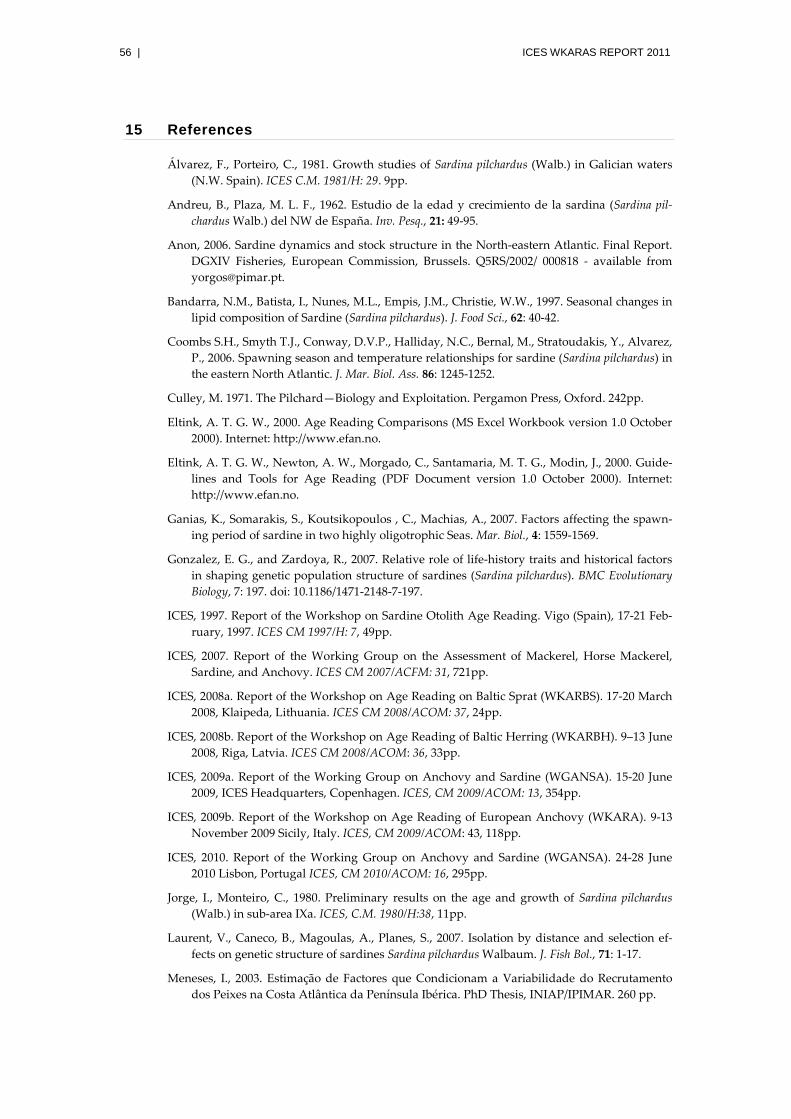
56 | ICES WKARAS REPORT 2011
15 References
Álvarez, F., Porteiro, C., 1981. Growth studies of Sardina pilchardus (Walb.) in Galician waters (N.W. Spain). ICES C.M. 1981/H: 29. 9pp.
Andreu, B., Plaza, M. L. F., 1962. Estudio de la edad y crecimiento de la sardina (Sardina pil-chardus Walb.) del NW de España. Inv. Pesq., 21: 49-95.
Anon, 2006. Sardine dynamics and stock structure in the North-eastern Atlantic. Final Report. DGXIV Fisheries, European Commission, Brussels. Q5RS/2002/ 000818 - available from [email protected].
Bandarra, N.M., Batista, I., Nunes, M.L., Empis, J.M., Christie, W.W., 1997. Seasonal changes in lipid composition of Sardine (Sardina pilchardus). J. Food Sci., 62: 40-42.
Coombs S.H., Smyth T.J., Conway, D.V.P., Halliday, N.C., Bernal, M., Stratoudakis, Y., Alvarez, P., 2006. Spawning season and temperature relationships for sardine (Sardina pilchardus) in the eastern North Atlantic. J. Mar. Biol. Ass. 86: 1245-1252.
Culley, M. 1971. The Pilchard—Biology and Exploitation. Pergamon Press, Oxford. 242pp.
Eltink, A. T. G. W., 2000. Age Reading Comparisons (MS Excel Workbook version 1.0 October 2000). Internet: http://www.efan.no.
Eltink, A. T. G. W., Newton, A. W., Morgado, C., Santamaria, M. T. G., Modin, J., 2000. Guide-lines and Tools for Age Reading (PDF Document version 1.0 October 2000). Internet: http://www.efan.no.
Ganias, K., Somarakis, S., Koutsikopoulos , C., Machias, A., 2007. Factors affecting the spawn-ing period of sardine in two highly oligotrophic Seas. Mar. Biol., 4: 1559-1569.
Gonzalez, E. G., and Zardoya, R., 2007. Relative role of life-history traits and historical factors in shaping genetic population structure of sardines (Sardina pilchardus). BMC Evolutionary Biology, 7: 197. doi: 10.1186/1471-2148-7-197.
ICES, 1997. Report of the Workshop on Sardine Otolith Age Reading. Vigo (Spain), 17-21 Feb-ruary, 1997. ICES CM 1997/H: 7, 49pp.
ICES, 2007. Report of the Working Group on the Assessment of Mackerel, Horse Mackerel, Sardine, and Anchovy. ICES CM 2007/ACFM: 31, 721pp.
ICES, 2008a. Report of the Workshop on Age Reading on Baltic Sprat (WKARBS). 17-20 March 2008, Klaipeda, Lithuania. ICES CM 2008/ACOM: 37, 24pp.
ICES, 2008b. Report of the Workshop on Age Reading of Baltic Herring (WKARBH). 9–13 June 2008, Riga, Latvia. ICES CM 2008/ACOM: 36, 33pp.
ICES, 2009a. Report of the Working Group on Anchovy and Sardine (WGANSA). 15-20 June 2009, ICES Headquarters, Copenhagen. ICES, CM 2009/ACOM: 13, 354pp.
ICES, 2009b. Report of the Workshop on Age Reading of European Anchovy (WKARA). 9-13 November 2009 Sicily, Italy. ICES, CM 2009/ACOM: 43, 118pp.
ICES, 2010. Report of the Working Group on Anchovy and Sardine (WGANSA). 24-28 June 2010 Lisbon, Portugal ICES, CM 2010/ACOM: 16, 295pp.
Jorge, I., Monteiro, C., 1980. Preliminary results on the age and growth of Sardina pilchardus (Walb.) in sub-area IXa. ICES, C.M. 1980/H:38, 11pp.
Laurent, V., Caneco, B., Magoulas, A., Planes, S., 2007. Isolation by distance and selection ef-fects on genetic structure of sardines Sardina pilchardus Walbaum. J. Fish Bol., 71: 1-17.
Meneses, I., 2003. Estimação de Factores que Condicionam a Variabilidade do Recrutamento dos Peixes na Costa Atlântica da Península Ibérica. PhD Thesis, INIAP/IPIMAR. 260 pp.
ICES WKARAS REPORT 2011 | 57
Nunes, C., Silva, A., Soares, E., Ganias, K., 2011. The use of hepatic and somatic indices and histological information to characterize the reproductive dynamics of sardine from the Portuguese coast. Marine and Coastal Fisheries: Dynamics, Management, and Ecosystem Science 3: 127–144.
Parrish, R. H., Serra, R., Grant, W. S., 1989. The monotypic sardines, Sardina and Sardinops: their taxonomy, distribution, stock structure, and zoogeography. Can. J. Fish. Aquat. Sci., 46: 2019-2036.
Pertierra, J. P., Morales-Nin, B., 1989. Sardine growth in the Catalan Sea (NW Mediterranean) determined by means of otolith interpretation and length frequency data. Sci. Mar., 53: 821-826.
Silva, A., Carrera, P., Massé, J., Uriarte, A. D., Santos, M. B., Oliveira, P. B., Soares, E., et al., 2008. Geographic variability of sardine growth across the northeastern Atlantic and the Mediterranean Sea. Fish. Res., 90: 56–69.
Soares, E., Morais, A., Silva, A., Carrera, P., Jorge, A., Rico, I., Peleteiro, Q., Evano, H., 2002. Report of the Workshop on Sardine Otolith Age Reading (Lisbon, 28 January – 1 February, 2002). Relat. Cient. Téc. IPIMAR, Série digital (http://ipimar-iniap.ipimar.pt) nº14, 16pp.
Soares, E., Silva, A., Morais, A., 2007. Workshop on Sardine Otolith Age Reading and Biology. Relat. Cient. Téc. Inst. Invest. Pescas Mar, Série Digital (http://www.inrb.pt/ipimar) nº42, 57pp. + Anexos.
Solá, A., Franco, C., Lago de Lanzós, A., Motos, L., 1992. Temporal evolution of Sardina pilchar-dus (Walb.) spawning in the N-NW coast of the Iberian Peninsula. Bol. Inst. Esp. Oceanogr. 8(1): 97-114.
Southward, A.J., Boalch, G.T., Maddock, L., 1988. Fluctuations in the herring and pilchard fisheries of Devon and Cornwall linked to change in climate since the 16th century. J. Mar. Biol. Ass. 68: 423-445.
Stratoudakis, Y., Coombs, S., Lago de Lanzós, A., Halliday, N., Costas, G., Caneco, B., Franco, C., Conway, D., Santos, M. B., Silva, A., Bernal, M., 2007. Sardine (Sardina pilchardus) spawning seasonality in European waters of the northeast Atlantic. Mar. Biol., 152: 201-212.
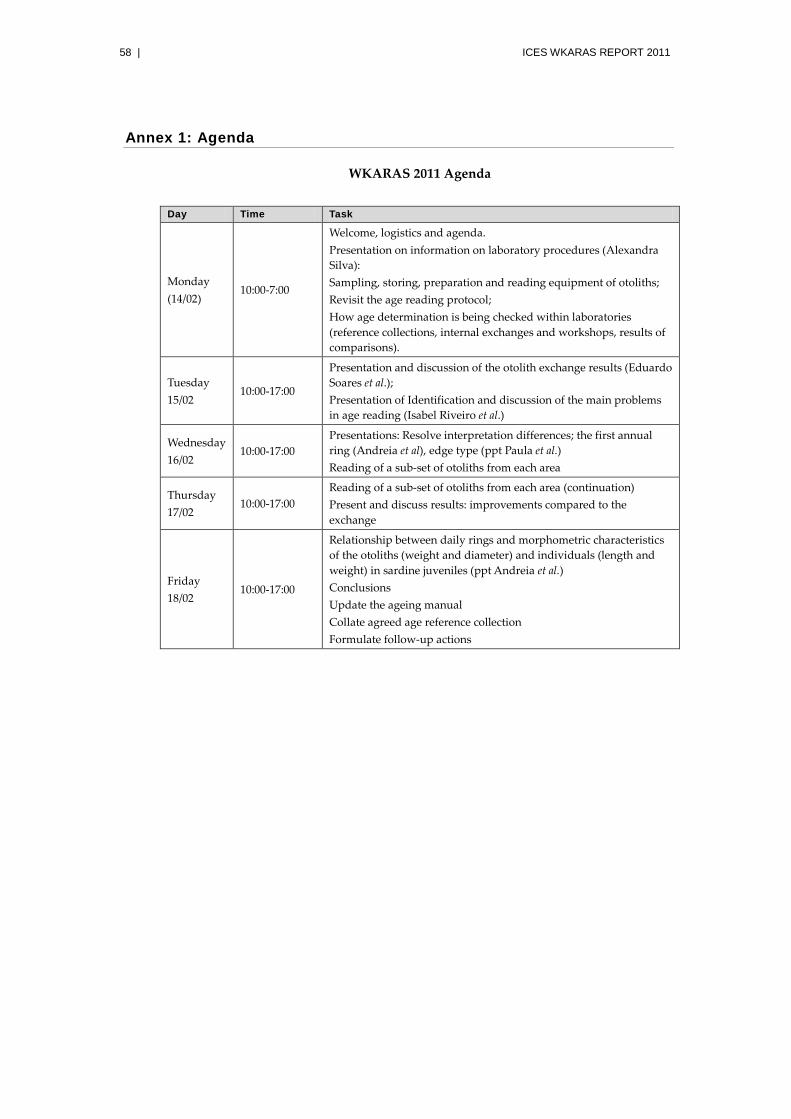
58 | ICES WKARAS REPORT 2011
Annex 1: Agenda
WKARAS 2011 Agenda
Day Time Task
Monday (14/02)
10:00-7:00
Welcome, logistics and agenda. Presentation on information on laboratory procedures (Alexandra Silva): Sampling, storing, preparation and reading equipment of otoliths; Revisit the age reading protocol; How age determination is being checked within laboratories (reference collections, internal exchanges and workshops, results of comparisons).
Tuesday 15/02
10:00-17:00
Presentation and discussion of the otolith exchange results (Eduardo Soares et al.); Presentation of Identification and discussion of the main problems in age reading (Isabel Riveiro et al.)
Wednesday 16/02
10:00-17:00 Presentations: Resolve interpretation differences; the first annual ring (Andreia et al), edge type (ppt Paula et al.) Reading of a sub-set of otoliths from each area
Thursday 17/02
10:00-17:00 Reading of a sub-set of otoliths from each area (continuation) Present and discuss results: improvements compared to the exchange
Friday 18/02
10:00-17:00
Relationship between daily rings and morphometric characteristics of the otoliths (weight and diameter) and individuals (length and weight) in sardine juveniles (ppt Andreia et al.) Conclusions Update the ageing manual Collate agreed age reference collection Formulate follow-up actions
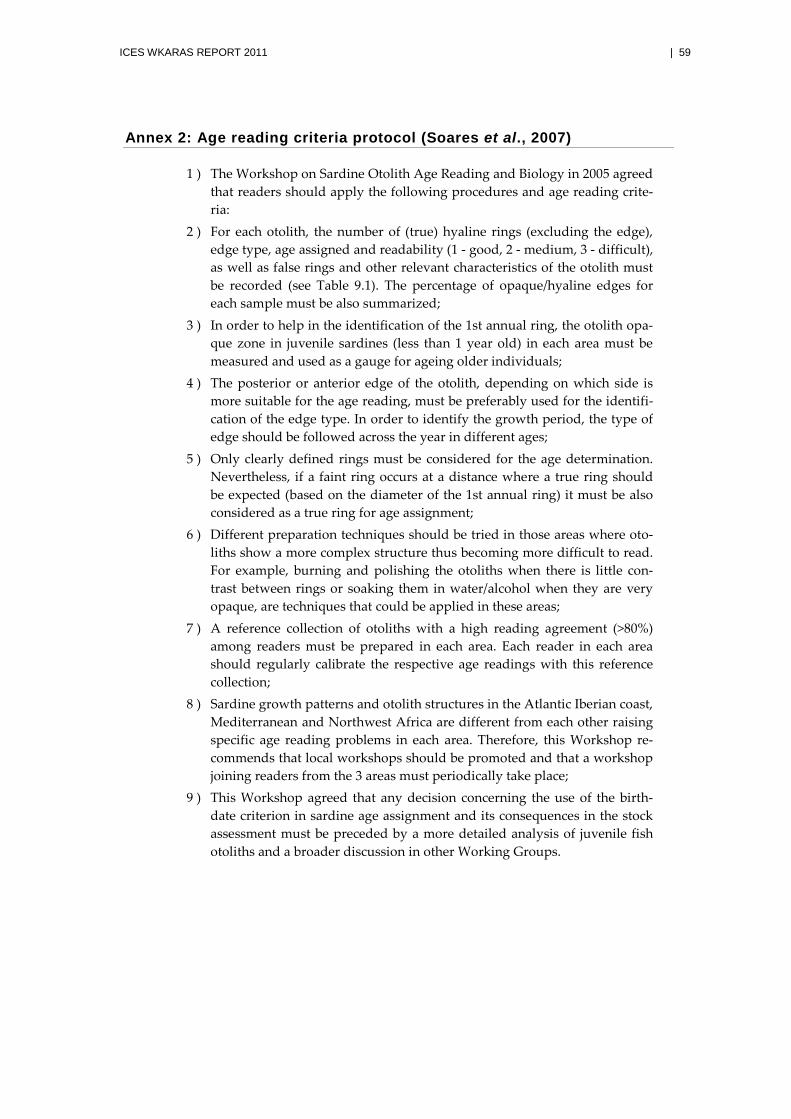
ICES WKARAS REPORT 2011 | 59
Annex 2: Age reading criteria protocol (Soares et al., 2007)
1 ) The Workshop on Sardine Otolith Age Reading and Biology in 2005 agreed that readers should apply the following procedures and age reading crite-ria:
2 ) For each otolith, the number of (true) hyaline rings (excluding the edge), edge type, age assigned and readability (1 - good, 2 - medium, 3 - difficult), as well as false rings and other relevant characteristics of the otolith must be recorded (see Table 9.1). The percentage of opaque/hyaline edges for each sample must be also summarized;
3 ) In order to help in the identification of the 1st annual ring, the otolith opa-que zone in juvenile sardines (less than 1 year old) in each area must be measured and used as a gauge for ageing older individuals;
4 ) The posterior or anterior edge of the otolith, depending on which side is more suitable for the age reading, must be preferably used for the identifi-cation of the edge type. In order to identify the growth period, the type of edge should be followed across the year in different ages;
5 ) Only clearly defined rings must be considered for the age determination. Nevertheless, if a faint ring occurs at a distance where a true ring should be expected (based on the diameter of the 1st annual ring) it must be also considered as a true ring for age assignment;
6 ) Different preparation techniques should be tried in those areas where oto-liths show a more complex structure thus becoming more difficult to read. For example, burning and polishing the otoliths when there is little con-trast between rings or soaking them in water/alcohol when they are very opaque, are techniques that could be applied in these areas;
7 ) A reference collection of otoliths with a high reading agreement (>80%) among readers must be prepared in each area. Each reader in each area should regularly calibrate the respective age readings with this reference collection;
8 ) Sardine growth patterns and otolith structures in the Atlantic Iberian coast, Mediterranean and Northwest Africa are different from each other raising specific age reading problems in each area. Therefore, this Workshop re-commends that local workshops should be promoted and that a workshop joining readers from the 3 areas must periodically take place;
9 ) This Workshop agreed that any decision concerning the use of the birth-date criterion in sardine age assignment and its consequences in the stock assessment must be preceded by a more detailed analysis of juvenile fish otoliths and a broader discussion in other Working Groups.
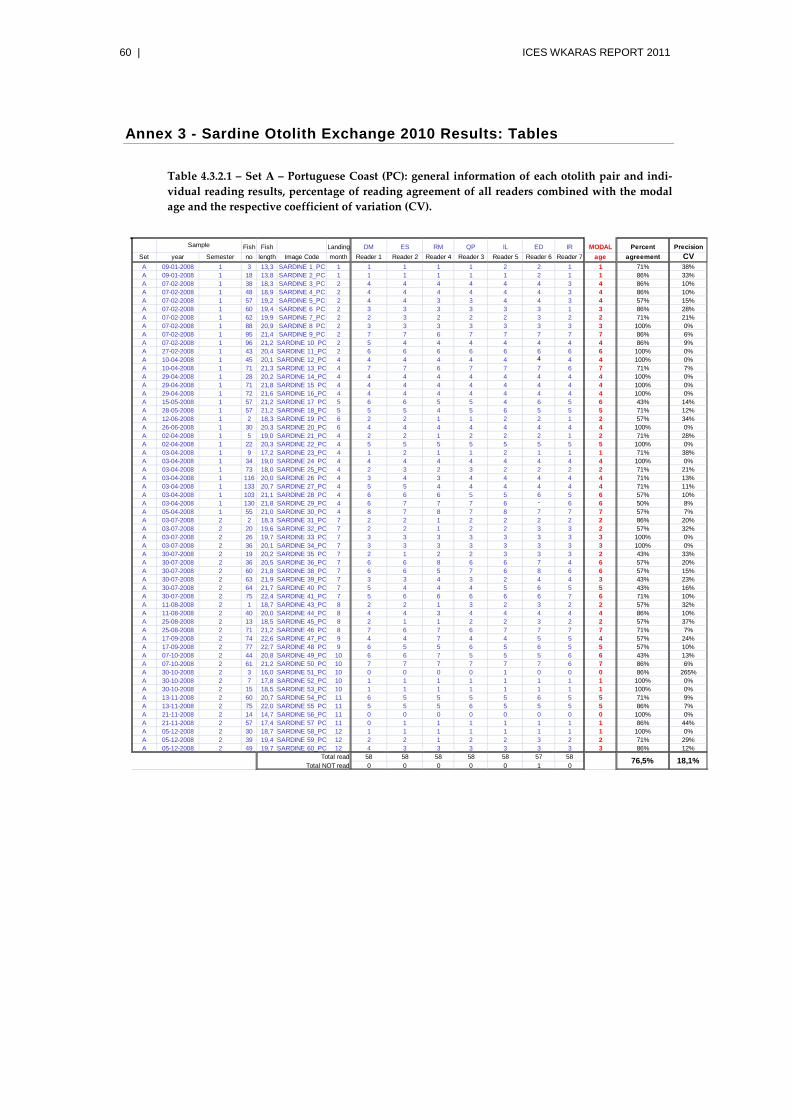
60 | ICES WKARAS REPORT 2011
Annex 3 - Sardine Otolith Exchange 2010 Results: Tables
Table 4.3.2.1 – Set A – Portuguese Coast (PC): general information of each otolith pair and indi-vidual reading results, percentage of reading agreement of all readers combined with the modal age and the respective coefficient of variation (CV).
Fish Fish Landing DM ES RM QP IL ED IR MODAL Percent PrecisionSet year Semester no length Image Code month Reader 1 Reader 2 Reader 4 Reader 3 Reader 5 Reader 6 Reader 7 age agreement CVA 09-01-2008 1 3 13,3 SARDINE 1_PC 1 1 1 1 1 2 2 1 1 71% 38%A 09-01-2008 1 18 13,8 SARDINE 2_PC 1 1 1 1 1 1 2 1 1 86% 33%A 07-02-2008 1 38 18,3 SARDINE 3_PC 2 4 4 4 4 4 4 3 4 86% 10%A 07-02-2008 1 48 18,9 SARDINE 4_PC 2 4 4 4 4 4 4 3 4 86% 10%A 07-02-2008 1 57 19,2 SARDINE 5_PC 2 4 4 3 3 4 4 3 4 57% 15%A 07-02-2008 1 60 19,4 SARDINE 6_PC 2 3 3 3 3 3 3 1 3 86% 28%A 07-02-2008 1 62 19,9 SARDINE 7_PC 2 2 3 2 2 2 3 2 2 71% 21%A 07-02-2008 1 88 20,9 SARDINE 8_PC 2 3 3 3 3 3 3 3 3 100% 0%A 07-02-2008 1 95 21,4 SARDINE 9_PC 2 7 7 6 7 7 7 7 7 86% 6%A 07-02-2008 1 96 21,2 SARDINE 10_PC 2 5 4 4 4 4 4 4 4 86% 9%A 27-02-2008 1 43 20,4 SARDINE 11_PC 2 6 6 6 6 6 6 6 6 100% 0%A 10-04-2008 1 45 20,1 SARDINE 12_PC 4 4 4 4 4 4 4 4 4 100% 0%A 10-04-2008 1 71 21,3 SARDINE 13_PC 4 7 7 6 7 7 7 6 7 71% 7%A 29-04-2008 1 28 20,2 SARDINE 14_PC 4 4 4 4 4 4 4 4 4 100% 0%A 29-04-2008 1 71 21,8 SARDINE 15_PC 4 4 4 4 4 4 4 4 4 100% 0%A 29-04-2008 1 72 21,6 SARDINE 16_PC 4 4 4 4 4 4 4 4 4 100% 0%A 15-05-2008 1 57 21,2 SARDINE 17_PC 5 6 6 5 5 4 6 5 6 43% 14%A 28-05-2008 1 57 21,2 SARDINE 18_PC 5 5 5 4 5 6 5 5 5 71% 12%A 12-06-2008 1 2 18,3 SARDINE 19_PC 6 2 2 1 1 2 2 1 2 57% 34%A 26-06-2008 1 30 20,3 SARDINE 20_PC 6 4 4 4 4 4 4 4 4 100% 0%A 02-04-2008 1 5 19,0 SARDINE 21_PC 4 2 2 1 2 2 2 1 2 71% 28%A 02-04-2008 1 22 20,3 SARDINE 22_PC 4 5 5 5 5 5 5 5 5 100% 0%A 03-04-2008 1 9 17,2 SARDINE 23_PC 4 1 2 1 1 2 1 1 1 71% 38%A 03-04-2008 1 34 19,0 SARDINE 24_PC 4 4 4 4 4 4 4 4 4 100% 0%A 03-04-2008 1 73 18,0 SARDINE 25_PC 4 2 3 2 3 2 2 2 2 71% 21%A 03-04-2008 1 116 20,0 SARDINE 26_PC 4 3 4 3 4 4 4 4 4 71% 13%A 03-04-2008 1 133 20,7 SARDINE 27_PC 4 5 5 4 4 4 4 4 4 71% 11%A 03-04-2008 1 103 21,1 SARDINE 28_PC 4 6 6 6 5 5 6 5 6 57% 10%A 03-04-2008 1 130 21,8 SARDINE 29_PC 4 6 7 7 7 6 - 6 6 50% 8%A 05-04-2008 1 55 21,0 SARDINE 30_PC 4 8 7 8 7 8 7 7 7 57% 7%A 03-07-2008 2 2 18,3 SARDINE 31_PC 7 2 2 1 2 2 2 2 2 86% 20%A 03-07-2008 2 20 19,6 SARDINE 32_PC 7 2 2 1 2 2 3 3 2 57% 32%A 03-07-2008 2 26 19,7 SARDINE 33_PC 7 3 3 3 3 3 3 3 3 100% 0%A 03-07-2008 2 36 20,1 SARDINE 34_PC 7 3 3 3 3 3 3 3 3 100% 0%A 30-07-2008 2 19 20,2 SARDINE 35_PC 7 2 1 2 2 3 3 3 2 43% 33%A 30-07-2008 2 36 20,5 SARDINE 36_PC 7 6 6 8 6 6 7 4 6 57% 20%A 30-07-2008 2 60 21,8 SARDINE 38_PC 7 6 6 5 7 6 8 6 6 57% 15%A 30-07-2008 2 63 21,9 SARDINE 39_PC 7 3 3 4 3 2 4 4 3 43% 23%A 30-07-2008 2 64 21,7 SARDINE 40_PC 7 5 4 4 4 5 6 5 5 43% 16%A 30-07-2008 2 75 22,4 SARDINE 41_PC 7 5 6 6 6 6 6 7 6 71% 10%A 11-08-2008 2 1 18,7 SARDINE 43_PC 8 2 2 1 3 2 3 2 2 57% 32%A 11-08-2008 2 40 20,0 SARDINE 44_PC 8 4 4 3 4 4 4 4 4 86% 10%A 25-08-2008 2 13 18,5 SARDINE 45_PC 8 2 1 1 2 2 3 2 2 57% 37%A 25-08-2008 2 71 21,2 SARDINE 46_PC 8 7 6 7 6 7 7 7 7 71% 7%A 17-09-2008 2 74 22,6 SARDINE 47_PC 9 4 4 7 4 4 5 5 4 57% 24%A 17-09-2008 2 77 22,7 SARDINE 48_PC 9 6 5 5 6 5 6 5 5 57% 10%A 07-10-2008 2 44 20,8 SARDINE 49_PC 10 6 6 7 5 5 5 6 6 43% 13%A 07-10-2008 2 61 21,2 SARDINE 50_PC 10 7 7 7 7 7 7 6 7 86% 6%A 30-10-2008 2 3 16,0 SARDINE 51_PC 10 0 0 0 0 1 0 0 0 86% 265%A 30-10-2008 2 7 17,8 SARDINE 52_PC 10 1 1 1 1 1 1 1 1 100% 0%A 30-10-2008 2 15 18,5 SARDINE 53_PC 10 1 1 1 1 1 1 1 1 100% 0%A 13-11-2008 2 60 20,7 SARDINE 54_PC 11 6 5 5 5 5 6 5 5 71% 9%A 13-11-2008 2 75 22,0 SARDINE 55_PC 11 5 5 5 6 5 5 5 5 86% 7%A 21-11-2008 2 14 14,7 SARDINE 56_PC 11 0 0 0 0 0 0 0 0 100% 0%A 21-11-2008 2 57 17,4 SARDINE 57_PC 11 0 1 1 1 1 1 1 1 86% 44%A 05-12-2008 2 30 18,7 SARDINE 58_PC 12 1 1 1 1 1 1 1 1 100% 0%A 05-12-2008 2 39 19,4 SARDINE 59_PC 12 2 2 1 2 2 3 2 2 71% 29%A 05-12-2008 2 49 19,7 SARDINE 60_PC 12 4 3 3 3 3 3 3 3 86% 12%
Total read 58 58 58 58 58 57 58Total NOT read 0 0 0 0 0 1 0
76,5% 18,1%
Sample
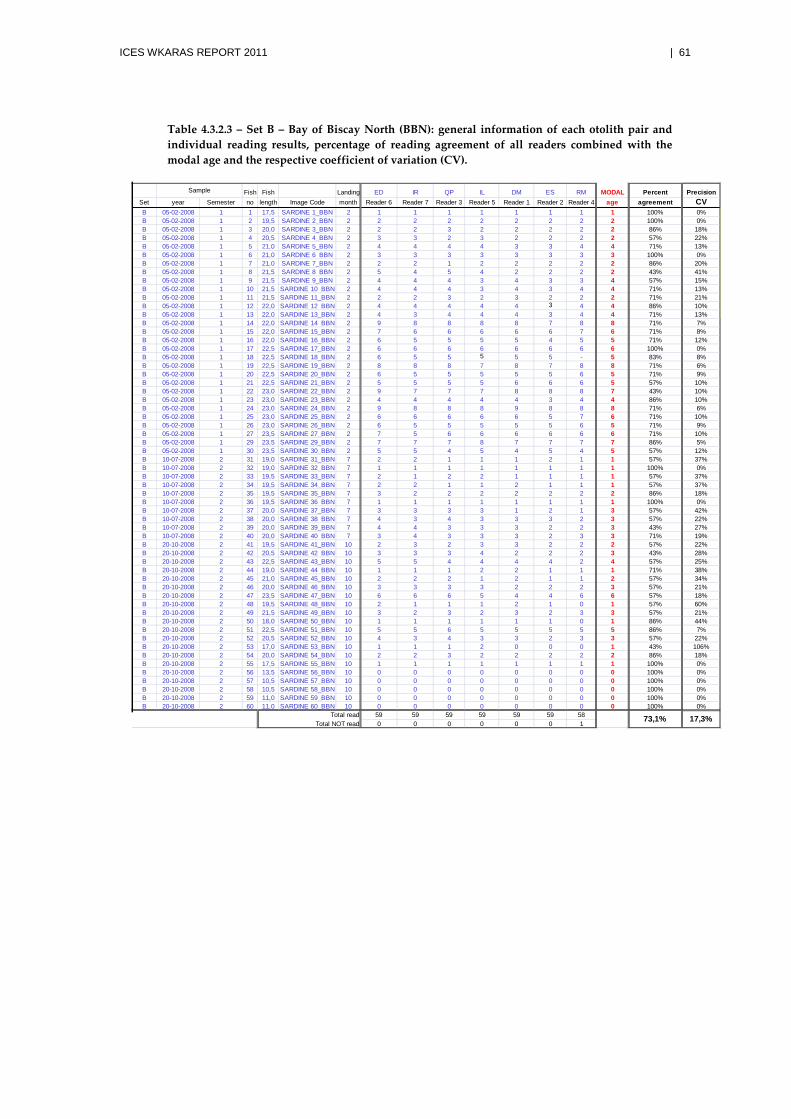
ICES WKARAS REPORT 2011 | 61
Table 4.3.2.3 – Set B – Bay of Biscay North (BBN): general information of each otolith pair and individual reading results, percentage of reading agreement of all readers combined with the modal age and the respective coefficient of variation (CV).
Fish Fish Landing ED IR QP IL DM ES RM MODAL Percent PrecisionSet year Semester no length Image Code month Reader 6 Reader 7 Reader 3 Reader 5 Reader 1 Reader 2 Reader 4 age agreement CVB 05-02-2008 1 1 17,5 SARDINE 1_BBN 2 1 1 1 1 1 1 1 1 100% 0%B 05-02-2008 1 2 19,5 SARDINE 2_BBN 2 2 2 2 2 2 2 2 2 100% 0%B 05-02-2008 1 3 20,0 SARDINE 3_BBN 2 2 2 3 2 2 2 2 2 86% 18%B 05-02-2008 1 4 20,5 SARDINE 4_BBN 2 3 3 2 3 2 2 2 2 57% 22%B 05-02-2008 1 5 21,0 SARDINE 5_BBN 2 4 4 4 4 3 3 4 4 71% 13%B 05-02-2008 1 6 21,0 SARDINE 6_BBN 2 3 3 3 3 3 3 3 3 100% 0%B 05-02-2008 1 7 21,0 SARDINE 7_BBN 2 2 2 1 2 2 2 2 2 86% 20%B 05-02-2008 1 8 21,5 SARDINE 8_BBN 2 5 4 5 4 2 2 2 2 43% 41%B 05-02-2008 1 9 21,5 SARDINE 9_BBN 2 4 4 4 3 4 3 3 4 57% 15%B 05-02-2008 1 10 21,5 SARDINE 10_BBN 2 4 4 4 3 4 3 4 4 71% 13%B 05-02-2008 1 11 21,5 SARDINE 11_BBN 2 2 2 3 2 3 2 2 2 71% 21%B 05-02-2008 1 12 22,0 SARDINE 12_BBN 2 4 4 4 4 4 3 4 4 86% 10%B 05-02-2008 1 13 22,0 SARDINE 13_BBN 2 4 3 4 4 4 3 4 4 71% 13%B 05-02-2008 1 14 22,0 SARDINE 14_BBN 2 9 8 8 8 8 7 8 8 71% 7%B 05-02-2008 1 15 22,0 SARDINE 15_BBN 2 7 6 6 6 6 6 7 6 71% 8%B 05-02-2008 1 16 22,0 SARDINE 16_BBN 2 6 5 5 5 5 4 5 5 71% 12%B 05-02-2008 1 17 22,5 SARDINE 17_BBN 2 6 6 6 6 6 6 6 6 100% 0%B 05-02-2008 1 18 22,5 SARDINE 18_BBN 2 6 5 5 5 5 5 - 5 83% 8%B 05-02-2008 1 19 22,5 SARDINE 19_BBN 2 8 8 8 7 8 7 8 8 71% 6%B 05-02-2008 1 20 22,5 SARDINE 20_BBN 2 6 5 5 5 5 5 6 5 71% 9%B 05-02-2008 1 21 22,5 SARDINE 21_BBN 2 5 5 5 5 6 6 6 5 57% 10%B 05-02-2008 1 22 23,0 SARDINE 22_BBN 2 9 7 7 7 8 8 8 7 43% 10%B 05-02-2008 1 23 23,0 SARDINE 23_BBN 2 4 4 4 4 4 3 4 4 86% 10%B 05-02-2008 1 24 23,0 SARDINE 24_BBN 2 9 8 8 8 9 8 8 8 71% 6%B 05-02-2008 1 25 23,0 SARDINE 25_BBN 2 6 6 6 6 6 5 7 6 71% 10%B 05-02-2008 1 26 23,0 SARDINE 26_BBN 2 6 5 5 5 5 5 6 5 71% 9%B 05-02-2008 1 27 23,5 SARDINE 27_BBN 2 7 5 6 6 6 6 6 6 71% 10%B 05-02-2008 1 29 23,5 SARDINE 29_BBN 2 7 7 7 8 7 7 7 7 86% 5%B 05-02-2008 1 30 23,5 SARDINE 30_BBN 2 5 5 4 5 4 5 4 5 57% 12%B 10-07-2008 2 31 19,0 SARDINE 31_BBN 7 2 2 1 1 1 2 1 1 57% 37%B 10-07-2008 2 32 19,0 SARDINE 32_BBN 7 1 1 1 1 1 1 1 1 100% 0%B 10-07-2008 2 33 19,5 SARDINE 33_BBN 7 2 1 2 2 1 1 1 1 57% 37%B 10-07-2008 2 34 19,5 SARDINE 34_BBN 7 2 2 1 1 2 1 1 1 57% 37%B 10-07-2008 2 35 19,5 SARDINE 35_BBN 7 3 2 2 2 2 2 2 2 86% 18%B 10-07-2008 2 36 19,5 SARDINE 36_BBN 7 1 1 1 1 1 1 1 1 100% 0%B 10-07-2008 2 37 20,0 SARDINE 37_BBN 7 3 3 3 3 1 2 1 3 57% 42%B 10-07-2008 2 38 20,0 SARDINE 38_BBN 7 4 3 4 3 3 3 2 3 57% 22%B 10-07-2008 2 39 20,0 SARDINE 39_BBN 7 4 4 3 3 3 2 2 3 43% 27%B 10-07-2008 2 40 20,0 SARDINE 40_BBN 7 3 4 3 3 3 2 3 3 71% 19%B 20-10-2008 2 41 19,5 SARDINE 41_BBN 10 2 3 2 3 3 2 2 2 57% 22%B 20-10-2008 2 42 20,5 SARDINE 42_BBN 10 3 3 3 4 2 2 2 3 43% 28%B 20-10-2008 2 43 22,5 SARDINE 43_BBN 10 5 5 4 4 4 4 2 4 57% 25%B 20-10-2008 2 44 19,0 SARDINE 44_BBN 10 1 1 1 2 2 1 1 1 71% 38%B 20-10-2008 2 45 21,0 SARDINE 45_BBN 10 2 2 2 1 2 1 1 2 57% 34%B 20-10-2008 2 46 20,0 SARDINE 46_BBN 10 3 3 3 3 2 2 2 3 57% 21%B 20-10-2008 2 47 23,5 SARDINE 47_BBN 10 6 6 6 5 4 4 6 6 57% 18%B 20-10-2008 2 48 19,5 SARDINE 48_BBN 10 2 1 1 1 2 1 0 1 57% 60%B 20-10-2008 2 49 21,5 SARDINE 49_BBN 10 3 2 3 2 3 2 3 3 57% 21%B 20-10-2008 2 50 18,0 SARDINE 50_BBN 10 1 1 1 1 1 1 0 1 86% 44%B 20-10-2008 2 51 22,5 SARDINE 51_BBN 10 5 5 6 5 5 5 5 5 86% 7%B 20-10-2008 2 52 20,5 SARDINE 52_BBN 10 4 3 4 3 3 2 3 3 57% 22%B 20-10-2008 2 53 17,0 SARDINE 53_BBN 10 1 1 1 2 0 0 0 1 43% 106%B 20-10-2008 2 54 20,0 SARDINE 54_BBN 10 2 2 3 2 2 2 2 2 86% 18%B 20-10-2008 2 55 17,5 SARDINE 55_BBN 10 1 1 1 1 1 1 1 1 100% 0%B 20-10-2008 2 56 13,5 SARDINE 56_BBN 10 0 0 0 0 0 0 0 0 100% 0%B 20-10-2008 2 57 10,5 SARDINE 57_BBN 10 0 0 0 0 0 0 0 0 100% 0%B 20-10-2008 2 58 10,5 SARDINE 58_BBN 10 0 0 0 0 0 0 0 0 100% 0%B 20-10-2008 2 59 11,0 SARDINE 59_BBN 10 0 0 0 0 0 0 0 0 100% 0%B 20-10-2008 2 60 11,0 SARDINE 60_BBN 10 0 0 0 0 0 0 0 0 100% 0%
Total read 59 59 59 59 59 59 58Total NOT read 0 0 0 0 0 0 1
Sample
73,1% 17,3%
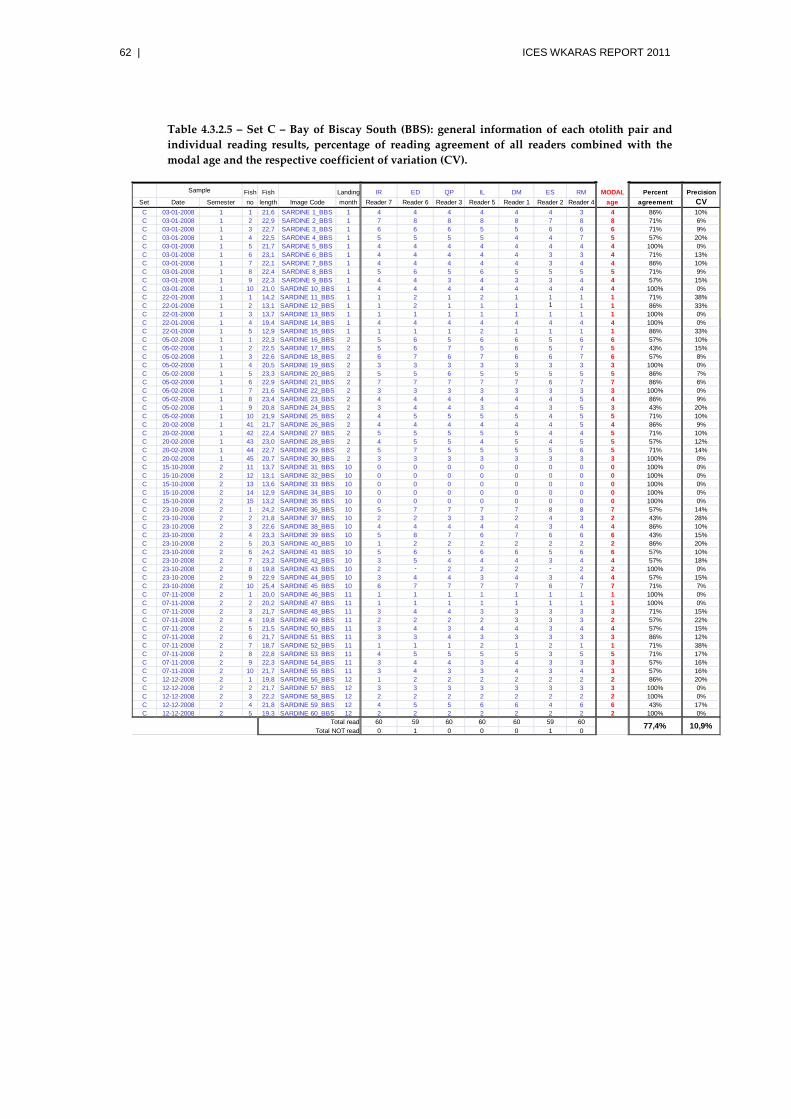
62 | ICES WKARAS REPORT 2011
Table 4.3.2.5 – Set C – Bay of Biscay South (BBS): general information of each otolith pair and individual reading results, percentage of reading agreement of all readers combined with the modal age and the respective coefficient of variation (CV).
Fish Fish Landing IR ED QP IL DM ES RM MODAL Percent PrecisionSet Date Semester no length Image Code month Reader 7 Reader 6 Reader 3 Reader 5 Reader 1 Reader 2 Reader 4 age agreement CVC 03-01-2008 1 1 21,6 SARDINE 1_BBS 1 4 4 4 4 4 4 3 4 86% 10%C 03-01-2008 1 2 22,9 SARDINE 2_BBS 1 7 8 8 8 8 7 8 8 71% 6%C 03-01-2008 1 3 22,7 SARDINE 3_BBS 1 6 6 6 5 5 6 6 6 71% 9%C 03-01-2008 1 4 22,5 SARDINE 4_BBS 1 5 5 5 5 4 4 7 5 57% 20%C 03-01-2008 1 5 21,7 SARDINE 5_BBS 1 4 4 4 4 4 4 4 4 100% 0%C 03-01-2008 1 6 23,1 SARDINE 6_BBS 1 4 4 4 4 4 3 3 4 71% 13%C 03-01-2008 1 7 22,1 SARDINE 7_BBS 1 4 4 4 4 4 3 4 4 86% 10%C 03-01-2008 1 8 22,4 SARDINE 8_BBS 1 5 6 5 6 5 5 5 5 71% 9%C 03-01-2008 1 9 22,3 SARDINE 9_BBS 1 4 4 3 4 3 3 4 4 57% 15%C 03-01-2008 1 10 21,0 SARDINE 10_BBS 1 4 4 4 4 4 4 4 4 100% 0%C 22-01-2008 1 1 14,2 SARDINE 11_BBS 1 1 2 1 2 1 1 1 1 71% 38%C 22-01-2008 1 2 13,1 SARDINE 12_BBS 1 1 2 1 1 1 1 1 1 86% 33%C 22-01-2008 1 3 13,7 SARDINE 13_BBS 1 1 1 1 1 1 1 1 1 100% 0%C 22-01-2008 1 4 19,4 SARDINE 14_BBS 1 4 4 4 4 4 4 4 4 100% 0%C 22-01-2008 1 5 12,9 SARDINE 15_BBS 1 1 1 1 2 1 1 1 1 86% 33%C 05-02-2008 1 1 22,3 SARDINE 16_BBS 2 5 6 5 6 6 5 6 6 57% 10%C 05-02-2008 1 2 22,5 SARDINE 17_BBS 2 5 6 7 5 6 5 7 5 43% 15%C 05-02-2008 1 3 22,6 SARDINE 18_BBS 2 6 7 6 7 6 6 7 6 57% 8%C 05-02-2008 1 4 20,5 SARDINE 19_BBS 2 3 3 3 3 3 3 3 3 100% 0%C 05-02-2008 1 5 23,3 SARDINE 20_BBS 2 5 5 6 5 5 5 5 5 86% 7%C 05-02-2008 1 6 22,9 SARDINE 21_BBS 2 7 7 7 7 7 6 7 7 86% 6%C 05-02-2008 1 7 21,6 SARDINE 22_BBS 2 3 3 3 3 3 3 3 3 100% 0%C 05-02-2008 1 8 23,4 SARDINE 23_BBS 2 4 4 4 4 4 4 5 4 86% 9%C 05-02-2008 1 9 20,8 SARDINE 24_BBS 2 3 4 4 3 4 3 5 3 43% 20%C 05-02-2008 1 10 21,9 SARDINE 25_BBS 2 4 5 5 5 5 4 5 5 71% 10%C 20-02-2008 1 41 21,7 SARDINE 26_BBS 2 4 4 4 4 4 4 5 4 86% 9%C 20-02-2008 1 42 22,4 SARDINE 27_BBS 2 5 5 5 5 5 4 4 5 71% 10%C 20-02-2008 1 43 23,0 SARDINE 28_BBS 2 4 5 5 4 5 4 5 5 57% 12%C 20-02-2008 1 44 22,7 SARDINE 29_BBS 2 5 7 5 5 5 5 6 5 71% 14%C 20-02-2008 1 45 20,7 SARDINE 30_BBS 2 3 3 3 3 3 3 3 3 100% 0%C 15-10-2008 2 11 13,7 SARDINE 31_BBS 10 0 0 0 0 0 0 0 0 100% 0%C 15-10-2008 2 12 13,1 SARDINE 32_BBS 10 0 0 0 0 0 0 0 0 100% 0%C 15-10-2008 2 13 13,6 SARDINE 33_BBS 10 0 0 0 0 0 0 0 0 100% 0%C 15-10-2008 2 14 12,9 SARDINE 34_BBS 10 0 0 0 0 0 0 0 0 100% 0%C 15-10-2008 2 15 13,2 SARDINE 35_BBS 10 0 0 0 0 0 0 0 0 100% 0%C 23-10-2008 2 1 24,2 SARDINE 36_BBS 10 5 7 7 7 7 8 8 7 57% 14%C 23-10-2008 2 2 21,8 SARDINE 37_BBS 10 2 2 3 3 2 4 3 2 43% 28%C 23-10-2008 2 3 22,6 SARDINE 38_BBS 10 4 4 4 4 4 3 4 4 86% 10%C 23-10-2008 2 4 23,3 SARDINE 39_BBS 10 5 8 7 6 7 6 6 6 43% 15%C 23-10-2008 2 5 20,3 SARDINE 40_BBS 10 1 2 2 2 2 2 2 2 86% 20%C 23-10-2008 2 6 24,2 SARDINE 41_BBS 10 5 6 5 6 6 5 6 6 57% 10%C 23-10-2008 2 7 23,2 SARDINE 42_BBS 10 3 5 4 4 4 3 4 4 57% 18%C 23-10-2008 2 8 19,8 SARDINE 43_BBS 10 2 - 2 2 2 - 2 2 100% 0%C 23-10-2008 2 9 22,9 SARDINE 44_BBS 10 3 4 4 3 4 3 4 4 57% 15%C 23-10-2008 2 10 25,4 SARDINE 45_BBS 10 6 7 7 7 7 6 7 7 71% 7%C 07-11-2008 2 1 20,0 SARDINE 46_BBS 11 1 1 1 1 1 1 1 1 100% 0%C 07-11-2008 2 2 20,2 SARDINE 47_BBS 11 1 1 1 1 1 1 1 1 100% 0%C 07-11-2008 2 3 21,7 SARDINE 48_BBS 11 3 4 4 3 3 3 3 3 71% 15%C 07-11-2008 2 4 19,8 SARDINE 49_BBS 11 2 2 2 2 3 3 3 2 57% 22%C 07-11-2008 2 5 21,5 SARDINE 50_BBS 11 3 4 3 4 4 3 4 4 57% 15%C 07-11-2008 2 6 21,7 SARDINE 51_BBS 11 3 3 4 3 3 3 3 3 86% 12%C 07-11-2008 2 7 18,7 SARDINE 52_BBS 11 1 1 1 2 1 2 1 1 71% 38%C 07-11-2008 2 8 22,8 SARDINE 53_BBS 11 4 5 5 5 5 3 5 5 71% 17%C 07-11-2008 2 9 22,3 SARDINE 54_BBS 11 3 4 4 3 4 3 3 3 57% 16%C 07-11-2008 2 10 21,7 SARDINE 55_BBS 11 3 4 3 3 4 3 4 3 57% 16%C 12-12-2008 2 1 19,8 SARDINE 56_BBS 12 1 2 2 2 2 2 2 2 86% 20%C 12-12-2008 2 2 21,7 SARDINE 57_BBS 12 3 3 3 3 3 3 3 3 100% 0%C 12-12-2008 2 3 22,2 SARDINE 58_BBS 12 2 2 2 2 2 2 2 2 100% 0%C 12-12-2008 2 4 21,8 SARDINE 59_BBS 12 4 5 5 6 6 4 6 6 43% 17%C 12-12-2008 2 5 19,3 SARDINE 60_BBS 12 2 2 2 2 2 2 2 2 100% 0%
Total read 60 59 60 60 60 59 60Total NOT read 0 1 0 0 0 1 0
Sample
77,4% 10,9%
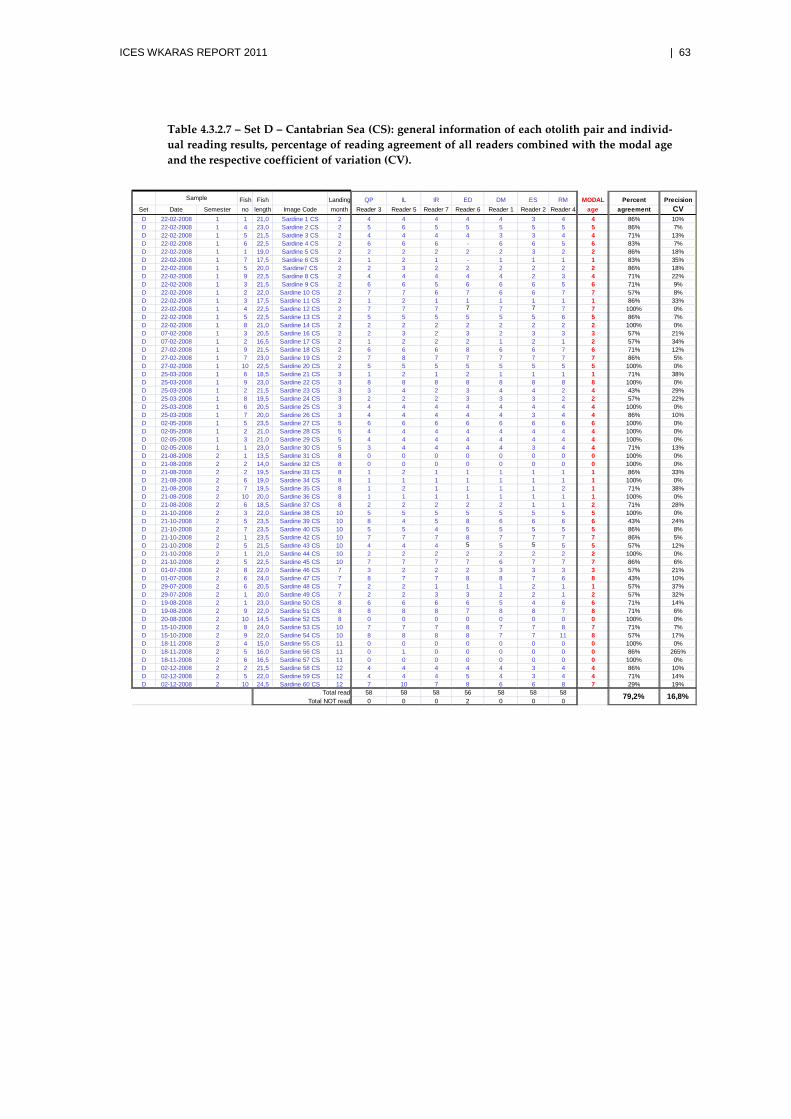
ICES WKARAS REPORT 2011 | 63
Table 4.3.2.7 – Set D – Cantabrian Sea (CS): general information of each otolith pair and individ-ual reading results, percentage of reading agreement of all readers combined with the modal age and the respective coefficient of variation (CV).
Fish Fish Landing QP IL IR ED DM ES RM MODAL Percent PrecisionSet Date Semester no length Image Code month Reader 3 Reader 5 Reader 7 Reader 6 Reader 1 Reader 2 Reader 4 age agreement CVD 22-02-2008 1 1 21,0 Sardine 1 CS 2 4 4 4 4 4 3 4 4 86% 10%D 22-02-2008 1 4 23,0 Sardine 2 CS 2 5 6 5 5 5 5 5 5 86% 7%D 22-02-2008 1 5 21,5 Sardine 3 CS 2 4 4 4 4 3 3 4 4 71% 13%D 22-02-2008 1 6 22,5 Sardine 4 CS 2 6 6 6 - 6 6 5 6 83% 7%D 22-02-2008 1 1 19,0 Sardine 5 CS 2 2 2 2 2 2 3 2 2 86% 18%D 22-02-2008 1 7 17,5 Sardine 6 CS 2 1 2 1 - 1 1 1 1 83% 35%D 22-02-2008 1 5 20,0 Sardine7 CS 2 2 3 2 2 2 2 2 2 86% 18%D 22-02-2008 1 9 22,5 Sardine 8 CS 2 4 4 4 4 4 2 3 4 71% 22%D 22-02-2008 1 3 21,5 Sardine 9 CS 2 6 6 5 6 6 6 5 6 71% 9%D 22-02-2008 1 2 22,0 Sardine 10 CS 2 7 7 6 7 6 6 7 7 57% 8%D 22-02-2008 1 3 17,5 Sardine 11 CS 2 1 2 1 1 1 1 1 1 86% 33%D 22-02-2008 1 4 22,5 Sardine 12 CS 2 7 7 7 7 7 7 7 7 100% 0%D 22-02-2008 1 5 22,5 Sardine 13 CS 2 5 5 5 5 5 5 6 5 86% 7%D 22-02-2008 1 8 21,0 Sardine 14 CS 2 2 2 2 2 2 2 2 2 100% 0%D 07-02-2008 1 3 20,5 Sardine 16 CS 2 2 3 2 3 2 3 3 3 57% 21%D 07-02-2008 1 2 16,5 Sardine 17 CS 2 1 2 2 2 1 2 1 2 57% 34%D 27-02-2008 1 9 21,5 Sardine 18 CS 2 6 6 6 8 6 6 7 6 71% 12%D 27-02-2008 1 7 23,0 Sardine 19 CS 2 7 8 7 7 7 7 7 7 86% 5%D 27-02-2008 1 10 22,5 Sardine 20 CS 2 5 5 5 5 5 5 5 5 100% 0%D 25-03-2008 1 6 18,5 Sardine 21 CS 3 1 2 1 2 1 1 1 1 71% 38%D 25-03-2008 1 9 23,0 Sardine 22 CS 3 8 8 8 8 8 8 8 8 100% 0%D 25-03-2008 1 2 21,5 Sardine 23 CS 3 3 4 2 3 4 4 2 4 43% 29%D 25-03-2008 1 8 19,5 Sardine 24 CS 3 2 2 2 3 3 3 2 2 57% 22%D 25-03-2008 1 6 20,5 Sardine 25 CS 3 4 4 4 4 4 4 4 4 100% 0%D 25-03-2008 1 7 20,0 Sardine 26 CS 3 4 4 4 4 4 3 4 4 86% 10%D 02-05-2008 1 5 23,5 Sardine 27 CS 5 6 6 6 6 6 6 6 6 100% 0%D 02-05-2008 1 2 21,0 Sardine 28 CS 5 4 4 4 4 4 4 4 4 100% 0%D 02-05-2008 1 3 21,0 Sardine 29 CS 5 4 4 4 4 4 4 4 4 100% 0%D 02-05-2008 1 1 23,0 Sardine 30 CS 5 3 4 4 4 4 3 4 4 71% 13%D 21-08-2008 2 1 13,5 Sardine 31 CS 8 0 0 0 0 0 0 0 0 100% 0%D 21-08-2008 2 2 14,0 Sardine 32 CS 8 0 0 0 0 0 0 0 0 100% 0%D 21-08-2008 2 2 19,5 Sardine 33 CS 8 1 2 1 1 1 1 1 1 86% 33%D 21-08-2008 2 6 19,0 Sardine 34 CS 8 1 1 1 1 1 1 1 1 100% 0%D 21-08-2008 2 7 19,5 Sardine 35 CS 8 1 2 1 1 1 1 2 1 71% 38%D 21-08-2008 2 10 20,0 Sardine 36 CS 8 1 1 1 1 1 1 1 1 100% 0%D 21-08-2008 2 6 18,5 Sardine 37 CS 8 2 2 2 2 2 1 1 2 71% 28%D 21-10-2008 2 3 22,0 Sardine 38 CS 10 5 5 5 5 5 5 5 5 100% 0%D 21-10-2008 2 5 23,5 Sardine 39 CS 10 8 4 5 8 6 6 6 6 43% 24%D 21-10-2008 2 7 23,5 Sardine 40 CS 10 5 5 4 5 5 5 5 5 86% 8%D 21-10-2008 2 1 23,5 Sardine 42 CS 10 7 7 7 8 7 7 7 7 86% 5%D 21-10-2008 2 5 21,5 Sardine 43 CS 10 4 4 4 5 5 5 5 5 57% 12%D 21-10-2008 2 1 21,0 Sardine 44 CS 10 2 2 2 2 2 2 2 2 100% 0%D 21-10-2008 2 5 22,5 Sardine 45 CS 10 7 7 7 7 6 7 7 7 86% 6%D 01-07-2008 2 8 22,0 Sardine 46 CS 7 3 2 2 2 3 3 3 3 57% 21%D 01-07-2008 2 6 24,0 Sardine 47 CS 7 8 7 7 8 8 7 6 8 43% 10%D 29-07-2008 2 6 20,5 Sardine 48 CS 7 2 2 1 1 1 2 1 1 57% 37%D 29-07-2008 2 1 20,0 Sardine 49 CS 7 2 2 3 3 2 2 1 2 57% 32%D 19-08-2008 2 1 23,0 Sardine 50 CS 8 6 6 6 6 5 4 6 6 71% 14%D 19-08-2008 2 9 22,0 Sardine 51 CS 8 8 8 8 7 8 8 7 8 71% 6%D 20-08-2008 2 10 14,5 Sardine 52 CS 8 0 0 0 0 0 0 0 0 100% 0%D 15-10-2008 2 8 24,0 Sardine 53 CS 10 7 7 7 8 7 7 8 7 71% 7%D 15-10-2008 2 9 22,0 Sardine 54 CS 10 8 8 8 8 7 7 11 8 57% 17%D 18-11-2008 2 4 15,0 Sardine 55 CS 11 0 0 0 0 0 0 0 0 100% 0%D 18-11-2008 2 5 16,0 Sardine 56 CS 11 0 1 0 0 0 0 0 0 86% 265%D 18-11-2008 2 6 16,5 Sardine 57 CS 11 0 0 0 0 0 0 0 0 100% 0%D 02-12-2008 2 2 21,5 Sardine 58 CS 12 4 4 4 4 4 3 4 4 86% 10%D 02-12-2008 2 5 22,0 Sardine 59 CS 12 4 4 4 5 4 3 4 4 71% 14%D 02-12-2008 2 10 24,5 Sardine 60 CS 12 7 10 7 8 6 6 8 7 29% 19%
Total read 58 58 58 56 58 58 58Total NOT read 0 0 0 2 0 0 0
Sample
79,2% 16,8%
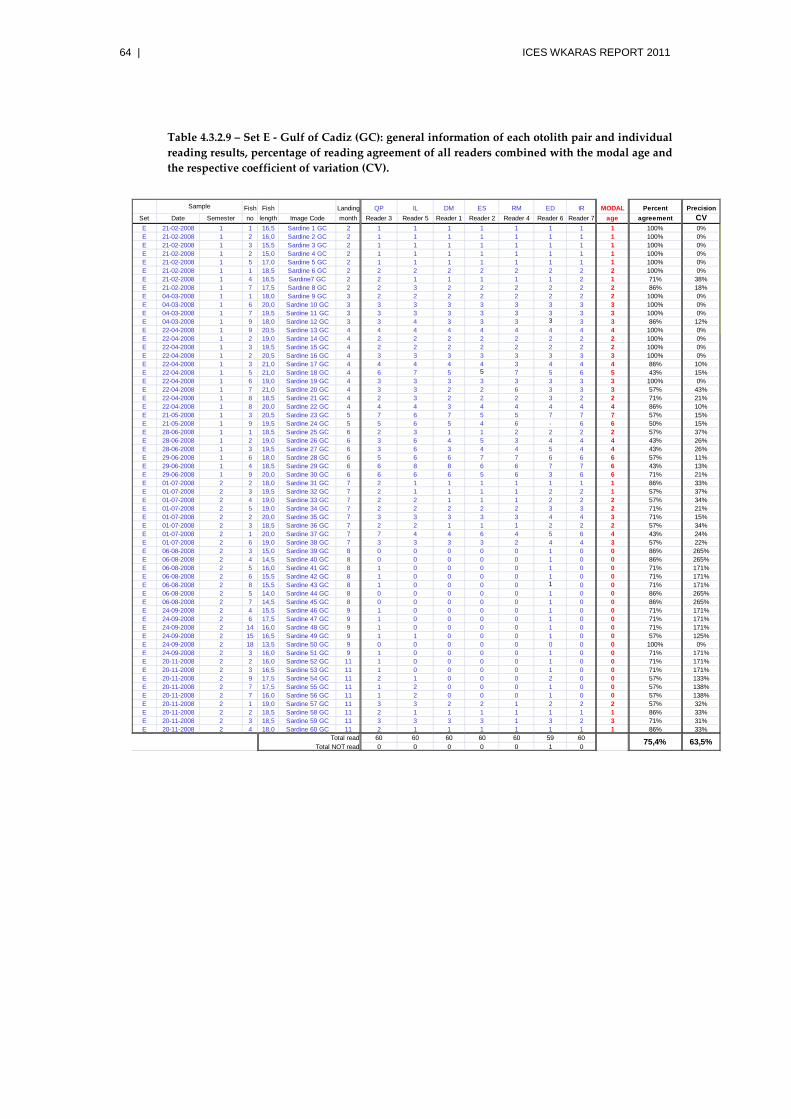
64 | ICES WKARAS REPORT 2011
Table 4.3.2.9 – Set E - Gulf of Cadiz (GC): general information of each otolith pair and individual reading results, percentage of reading agreement of all readers combined with the modal age and the respective coefficient of variation (CV).
Fish Fish Landing QP IL DM ES RM ED IR MODAL Percent PrecisionSet Date Semester no length Image Code month Reader 3 Reader 5 Reader 1 Reader 2 Reader 4 Reader 6 Reader 7 age agreement CVE 21-02-2008 1 1 16,5 Sardine 1 GC 2 1 1 1 1 1 1 1 1 100% 0%E 21-02-2008 1 2 16,0 Sardine 2 GC 2 1 1 1 1 1 1 1 1 100% 0%E 21-02-2008 1 3 15,5 Sardine 3 GC 2 1 1 1 1 1 1 1 1 100% 0%E 21-02-2008 1 2 15,0 Sardine 4 GC 2 1 1 1 1 1 1 1 1 100% 0%E 21-02-2008 1 5 17,0 Sardine 5 GC 2 1 1 1 1 1 1 1 1 100% 0%E 21-02-2008 1 1 18,5 Sardine 6 GC 2 2 2 2 2 2 2 2 2 100% 0%E 21-02-2008 1 4 16,5 Sardine7 GC 2 2 1 1 1 1 1 2 1 71% 38%E 21-02-2008 1 7 17,5 Sardine 8 GC 2 2 3 2 2 2 2 2 2 86% 18%E 04-03-2008 1 1 18,0 Sardine 9 GC 3 2 2 2 2 2 2 2 2 100% 0%E 04-03-2008 1 6 20,0 Sardine 10 GC 3 3 3 3 3 3 3 3 3 100% 0%E 04-03-2008 1 7 19,5 Sardine 11 GC 3 3 3 3 3 3 3 3 3 100% 0%E 04-03-2008 1 9 18,0 Sardine 12 GC 3 3 4 3 3 3 3 3 3 86% 12%E 22-04-2008 1 9 20,5 Sardine 13 GC 4 4 4 4 4 4 4 4 4 100% 0%E 22-04-2008 1 2 19,0 Sardine 14 GC 4 2 2 2 2 2 2 2 2 100% 0%E 22-04-2008 1 3 19,5 Sardine 15 GC 4 2 2 2 2 2 2 2 2 100% 0%E 22-04-2008 1 2 20,5 Sardine 16 GC 4 3 3 3 3 3 3 3 3 100% 0%E 22-04-2008 1 3 21,0 Sardine 17 GC 4 4 4 4 4 3 4 4 4 86% 10%E 22-04-2008 1 5 21,0 Sardine 18 GC 4 6 7 5 5 7 5 6 5 43% 15%E 22-04-2008 1 6 19,0 Sardine 19 GC 4 3 3 3 3 3 3 3 3 100% 0%E 22-04-2008 1 7 21,0 Sardine 20 GC 4 3 3 2 2 6 3 3 3 57% 43%E 22-04-2008 1 8 18,5 Sardine 21 GC 4 2 3 2 2 2 3 2 2 71% 21%E 22-04-2008 1 8 20,0 Sardine 22 GC 4 4 4 3 4 4 4 4 4 86% 10%E 21-05-2008 1 3 20,5 Sardine 23 GC 5 7 6 7 5 5 7 7 7 57% 15%E 21-05-2008 1 9 19,5 Sardine 24 GC 5 5 6 5 4 6 - 6 6 50% 15%E 28-06-2008 1 1 18,5 Sardine 25 GC 6 2 3 1 1 2 2 2 2 57% 37%E 28-06-2008 1 2 19,0 Sardine 26 GC 6 3 6 4 5 3 4 4 4 43% 26%E 28-06-2008 1 3 19,5 Sardine 27 GC 6 3 6 3 4 4 5 4 4 43% 26%E 29-06-2008 1 6 18,0 Sardine 28 GC 6 5 6 6 7 7 6 6 6 57% 11%E 29-06-2008 1 4 18,5 Sardine 29 GC 6 6 8 8 6 6 7 7 6 43% 13%E 29-06-2008 1 9 20,0 Sardine 30 GC 6 6 6 6 5 6 3 6 6 71% 21%E 01-07-2008 2 2 18,0 Sardine 31 GC 7 2 1 1 1 1 1 1 1 86% 33%E 01-07-2008 2 3 19,5 Sardine 32 GC 7 2 1 1 1 1 2 2 1 57% 37%E 01-07-2008 2 4 19,0 Sardine 33 GC 7 2 2 1 1 1 2 2 2 57% 34%E 01-07-2008 2 5 19,0 Sardine 34 GC 7 2 2 2 2 2 3 3 2 71% 21%E 01-07-2008 2 2 20,0 Sardine 35 GC 7 3 3 3 3 3 4 4 3 71% 15%E 01-07-2008 2 3 18,5 Sardine 36 GC 7 2 2 1 1 1 2 2 2 57% 34%E 01-07-2008 2 1 20,0 Sardine 37 GC 7 7 4 4 6 4 5 6 4 43% 24%E 01-07-2008 2 6 19,0 Sardine 38 GC 7 3 3 3 3 2 4 4 3 57% 22%E 06-08-2008 2 3 15,0 Sardine 39 GC 8 0 0 0 0 0 1 0 0 86% 265%E 06-08-2008 2 4 14,5 Sardine 40 GC 8 0 0 0 0 0 1 0 0 86% 265%E 06-08-2008 2 5 16,0 Sardine 41 GC 8 1 0 0 0 0 1 0 0 71% 171%E 06-08-2008 2 6 15,5 Sardine 42 GC 8 1 0 0 0 0 1 0 0 71% 171%E 06-08-2008 2 8 15,5 Sardine 43 GC 8 1 0 0 0 0 1 0 0 71% 171%E 06-08-2008 2 5 14,0 Sardine 44 GC 8 0 0 0 0 0 1 0 0 86% 265%E 06-08-2008 2 7 14,5 Sardine 45 GC 8 0 0 0 0 0 1 0 0 86% 265%E 24-09-2008 2 4 15,5 Sardine 46 GC 9 1 0 0 0 0 1 0 0 71% 171%E 24-09-2008 2 6 17,5 Sardine 47 GC 9 1 0 0 0 0 1 0 0 71% 171%E 24-09-2008 2 14 16,0 Sardine 48 GC 9 1 0 0 0 0 1 0 0 71% 171%E 24-09-2008 2 15 16,5 Sardine 49 GC 9 1 1 0 0 0 1 0 0 57% 125%E 24-09-2008 2 18 13,5 Sardine 50 GC 9 0 0 0 0 0 0 0 0 100% 0%E 24-09-2008 2 3 16,0 Sardine 51 GC 9 1 0 0 0 0 1 0 0 71% 171%E 20-11-2008 2 2 16,0 Sardine 52 GC 11 1 0 0 0 0 1 0 0 71% 171%E 20-11-2008 2 3 16,5 Sardine 53 GC 11 1 0 0 0 0 1 0 0 71% 171%E 20-11-2008 2 9 17,5 Sardine 54 GC 11 2 1 0 0 0 2 0 0 57% 133%E 20-11-2008 2 7 17,5 Sardine 55 GC 11 1 2 0 0 0 1 0 0 57% 138%E 20-11-2008 2 7 16,0 Sardine 56 GC 11 1 2 0 0 0 1 0 0 57% 138%E 20-11-2008 2 1 19,0 Sardine 57 GC 11 3 3 2 2 1 2 2 2 57% 32%E 20-11-2008 2 2 18,5 Sardine 58 GC 11 2 1 1 1 1 1 1 1 86% 33%E 20-11-2008 2 3 18,5 Sardine 59 GC 11 3 3 3 3 1 3 2 3 71% 31%E 20-11-2008 2 4 18,0 Sardine 60 GC 11 2 1 1 1 1 1 1 1 86% 33%
Total read 60 60 60 60 60 59 60Total NOT read 0 0 0 0 0 1 0
Sample
75,4% 63,5%
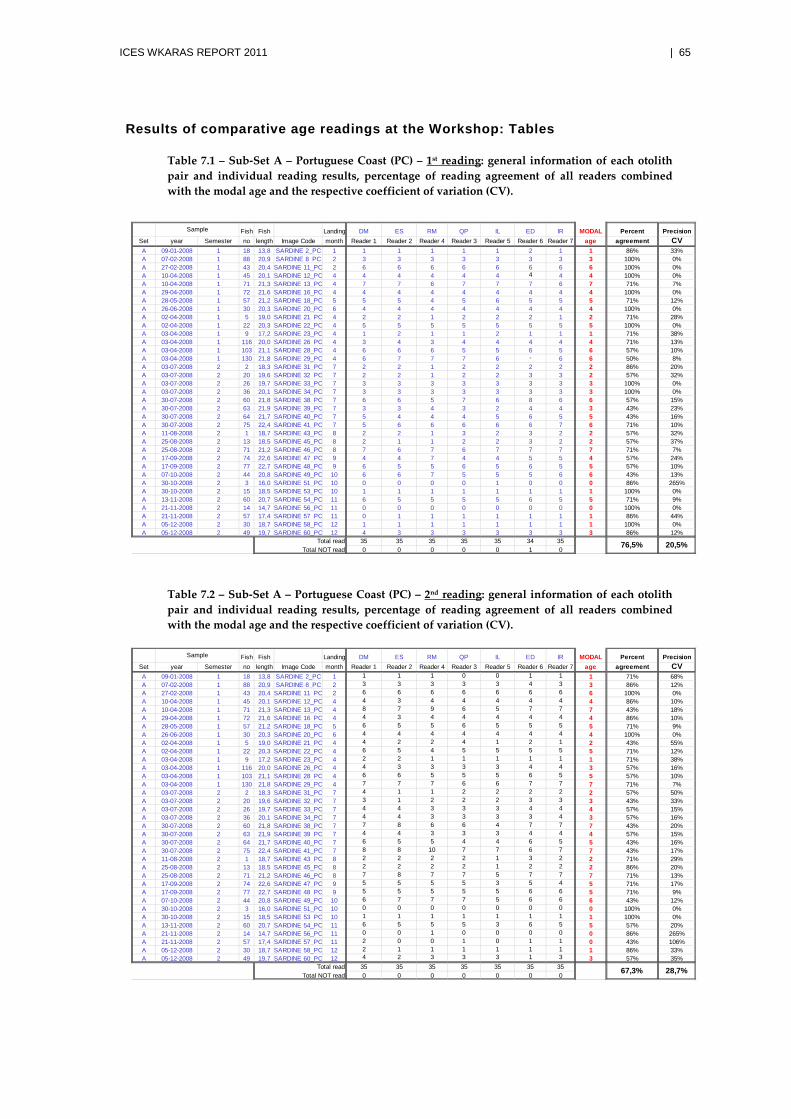
ICES WKARAS REPORT 2011 | 65
Results of comparative age readings at the Workshop: Tables
Table 7.1 – Sub-Set A – Portuguese Coast (PC) – 1st reading: general information of each otolith pair and individual reading results, percentage of reading agreement of all readers combined with the modal age and the respective coefficient of variation (CV).
Table 7.2 – Sub-Set A – Portuguese Coast (PC) – 2nd reading: general information of each otolith pair and individual reading results, percentage of reading agreement of all readers combined with the modal age and the respective coefficient of variation (CV).
Fish Fish Landing DM ES RM QP IL ED IR MODAL Percent PrecisionSet year Semester no length Image Code month Reader 1 Reader 2 Reader 4 Reader 3 Reader 5 Reader 6 Reader 7 age agreement CVA 09-01-2008 1 18 13,8 SARDINE 2_PC 1 1 1 1 1 1 2 1 1 86% 33%A 07-02-2008 1 88 20,9 SARDINE 8_PC 2 3 3 3 3 3 3 3 3 100% 0%A 27-02-2008 1 43 20,4 SARDINE 11_PC 2 6 6 6 6 6 6 6 6 100% 0%A 10-04-2008 1 45 20,1 SARDINE 12_PC 4 4 4 4 4 4 4 4 4 100% 0%A 10-04-2008 1 71 21,3 SARDINE 13_PC 4 7 7 6 7 7 7 6 7 71% 7%A 29-04-2008 1 72 21,6 SARDINE 16_PC 4 4 4 4 4 4 4 4 4 100% 0%A 28-05-2008 1 57 21,2 SARDINE 18_PC 5 5 5 4 5 6 5 5 5 71% 12%A 26-06-2008 1 30 20,3 SARDINE 20_PC 6 4 4 4 4 4 4 4 4 100% 0%A 02-04-2008 1 5 19,0 SARDINE 21_PC 4 2 2 1 2 2 2 1 2 71% 28%A 02-04-2008 1 22 20,3 SARDINE 22_PC 4 5 5 5 5 5 5 5 5 100% 0%A 03-04-2008 1 9 17,2 SARDINE 23_PC 4 1 2 1 1 2 1 1 1 71% 38%A 03-04-2008 1 116 20,0 SARDINE 26_PC 4 3 4 3 4 4 4 4 4 71% 13%A 03-04-2008 1 103 21,1 SARDINE 28_PC 4 6 6 6 5 5 6 5 6 57% 10%A 03-04-2008 1 130 21,8 SARDINE 29_PC 4 6 7 7 7 6 - 6 6 50% 8%A 03-07-2008 2 2 18,3 SARDINE 31_PC 7 2 2 1 2 2 2 2 2 86% 20%A 03-07-2008 2 20 19,6 SARDINE 32_PC 7 2 2 1 2 2 3 3 2 57% 32%A 03-07-2008 2 26 19,7 SARDINE 33_PC 7 3 3 3 3 3 3 3 3 100% 0%A 03-07-2008 2 36 20,1 SARDINE 34_PC 7 3 3 3 3 3 3 3 3 100% 0%A 30-07-2008 2 60 21,8 SARDINE 38_PC 7 6 6 5 7 6 8 6 6 57% 15%A 30-07-2008 2 63 21,9 SARDINE 39_PC 7 3 3 4 3 2 4 4 3 43% 23%A 30-07-2008 2 64 21,7 SARDINE 40_PC 7 5 4 4 4 5 6 5 5 43% 16%A 30-07-2008 2 75 22,4 SARDINE 41_PC 7 5 6 6 6 6 6 7 6 71% 10%A 11-08-2008 2 1 18,7 SARDINE 43_PC 8 2 2 1 3 2 3 2 2 57% 32%A 25-08-2008 2 13 18,5 SARDINE 45_PC 8 2 1 1 2 2 3 2 2 57% 37%A 25-08-2008 2 71 21,2 SARDINE 46_PC 8 7 6 7 6 7 7 7 7 71% 7%A 17-09-2008 2 74 22,6 SARDINE 47_PC 9 4 4 7 4 4 5 5 4 57% 24%A 17-09-2008 2 77 22,7 SARDINE 48_PC 9 6 5 5 6 5 6 5 5 57% 10%A 07-10-2008 2 44 20,8 SARDINE 49_PC 10 6 6 7 5 5 5 6 6 43% 13%A 30-10-2008 2 3 16,0 SARDINE 51_PC 10 0 0 0 0 1 0 0 0 86% 265%A 30-10-2008 2 15 18,5 SARDINE 53_PC 10 1 1 1 1 1 1 1 1 100% 0%A 13-11-2008 2 60 20,7 SARDINE 54_PC 11 6 5 5 5 5 6 5 5 71% 9%A 21-11-2008 2 14 14,7 SARDINE 56_PC 11 0 0 0 0 0 0 0 0 100% 0%A 21-11-2008 2 57 17,4 SARDINE 57_PC 11 0 1 1 1 1 1 1 1 86% 44%A 05-12-2008 2 30 18,7 SARDINE 58_PC 12 1 1 1 1 1 1 1 1 100% 0%A 05-12-2008 2 49 19,7 SARDINE 60_PC 12 4 3 3 3 3 3 3 3 86% 12%
Total read 35 35 35 35 35 34 35Total NOT read 0 0 0 0 0 1 0
Sample
76,5% 20,5%
Fish Fish Landing DM ES RM QP IL ED IR MODAL Percent PrecisionSet year Semester no length Image Code month Reader 1 Reader 2 Reader 4 Reader 3 Reader 5 Reader 6 Reader 7 age agreement CVA 09-01-2008 1 18 13,8 SARDINE 2_PC 1 1 1 1 0 0 1 1 1 71% 68%A 07-02-2008 1 88 20,9 SARDINE 8_PC 2 3 3 3 3 3 4 3 3 86% 12%A 27-02-2008 1 43 20,4 SARDINE 11_PC 2 6 6 6 6 6 6 6 6 100% 0%A 10-04-2008 1 45 20,1 SARDINE 12_PC 4 4 3 4 4 4 4 4 4 86% 10%A 10-04-2008 1 71 21,3 SARDINE 13_PC 4 8 7 9 6 5 7 7 7 43% 18%A 29-04-2008 1 72 21,6 SARDINE 16_PC 4 4 3 4 4 4 4 4 4 86% 10%A 28-05-2008 1 57 21,2 SARDINE 18_PC 5 6 5 5 6 5 5 5 5 71% 9%A 26-06-2008 1 30 20,3 SARDINE 20_PC 6 4 4 4 4 4 4 4 4 100% 0%A 02-04-2008 1 5 19,0 SARDINE 21_PC 4 4 2 2 4 1 2 1 2 43% 55%A 02-04-2008 1 22 20,3 SARDINE 22_PC 4 6 5 4 5 5 5 5 5 71% 12%A 03-04-2008 1 9 17,2 SARDINE 23_PC 4 2 2 1 1 1 1 1 1 71% 38%A 03-04-2008 1 116 20,0 SARDINE 26_PC 4 4 3 3 3 3 4 4 3 57% 16%A 03-04-2008 1 103 21,1 SARDINE 28_PC 4 6 6 5 5 5 6 5 5 57% 10%A 03-04-2008 1 130 21,8 SARDINE 29_PC 4 7 7 7 6 6 7 7 7 71% 7%A 03-07-2008 2 2 18,3 SARDINE 31_PC 7 4 1 1 2 2 2 2 2 57% 50%A 03-07-2008 2 20 19,6 SARDINE 32_PC 7 3 1 2 2 2 3 3 3 43% 33%A 03-07-2008 2 26 19,7 SARDINE 33_PC 7 4 4 3 3 3 4 4 4 57% 15%A 03-07-2008 2 36 20,1 SARDINE 34_PC 7 4 4 3 3 3 3 4 3 57% 16%A 30-07-2008 2 60 21,8 SARDINE 38_PC 7 7 8 6 6 4 7 7 7 43% 20%A 30-07-2008 2 63 21,9 SARDINE 39_PC 7 4 4 3 3 3 4 4 4 57% 15%A 30-07-2008 2 64 21,7 SARDINE 40_PC 7 6 5 5 4 4 6 5 5 43% 16%A 30-07-2008 2 75 22,4 SARDINE 41_PC 7 8 8 10 7 7 6 7 7 43% 17%A 11-08-2008 2 1 18,7 SARDINE 43_PC 8 2 2 2 2 1 3 2 2 71% 29%A 25-08-2008 2 13 18,5 SARDINE 45_PC 8 2 2 2 2 1 2 2 2 86% 20%A 25-08-2008 2 71 21,2 SARDINE 46_PC 8 7 8 7 7 5 7 7 7 71% 13%A 17-09-2008 2 74 22,6 SARDINE 47_PC 9 5 5 5 5 3 5 4 5 71% 17%A 17-09-2008 2 77 22,7 SARDINE 48_PC 9 5 5 5 5 5 6 6 5 71% 9%A 07-10-2008 2 44 20,8 SARDINE 49_PC 10 6 7 7 7 5 6 6 6 43% 12%A 30-10-2008 2 3 16,0 SARDINE 51_PC 10 0 0 0 0 0 0 0 0 100% 0%A 30-10-2008 2 15 18,5 SARDINE 53_PC 10 1 1 1 1 1 1 1 1 100% 0%A 13-11-2008 2 60 20,7 SARDINE 54_PC 11 6 5 5 5 3 6 5 5 57% 20%A 21-11-2008 2 14 14,7 SARDINE 56_PC 11 0 0 1 0 0 0 0 0 86% 265%A 21-11-2008 2 57 17,4 SARDINE 57_PC 11 2 0 0 1 0 1 1 0 43% 106%A 05-12-2008 2 30 18,7 SARDINE 58_PC 12 2 1 1 1 1 1 1 1 86% 33%A 05-12-2008 2 49 19,7 SARDINE 60_PC 12 4 2 3 3 3 1 3 3 57% 35%
Total read 35 35 35 35 35 35 35Total NOT read 0 0 0 0 0 0 0
67,3% 28,7%
Sample
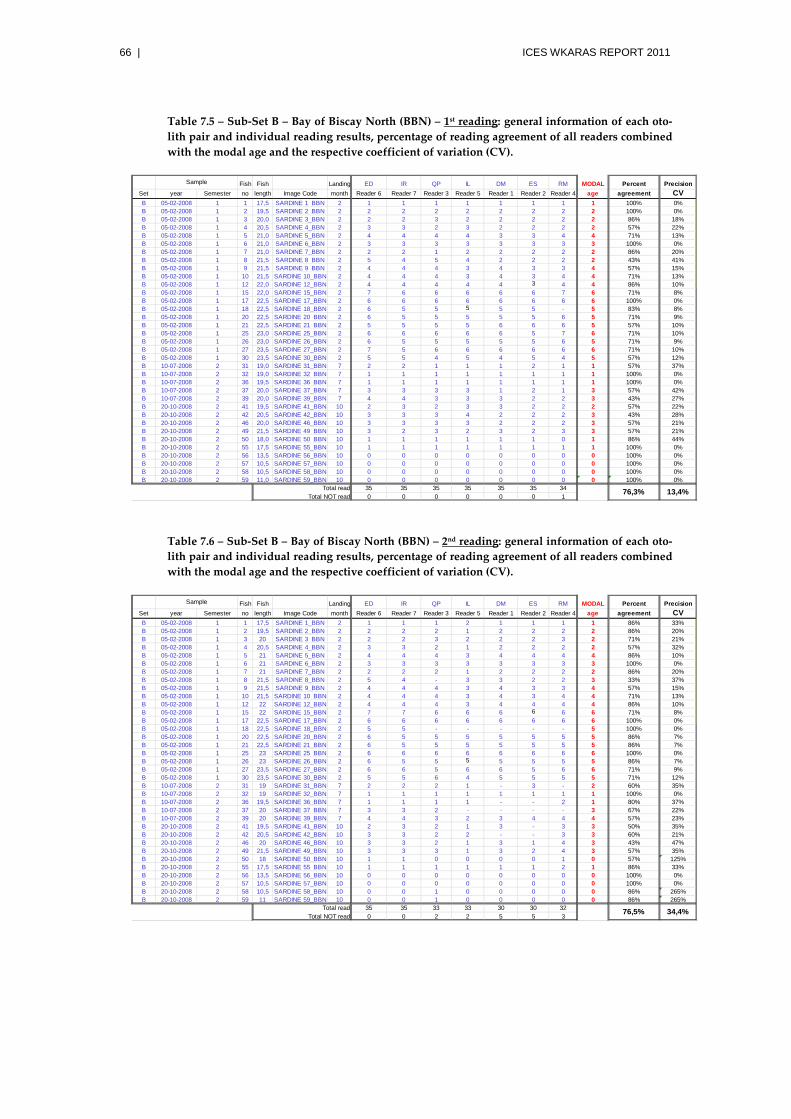
66 | ICES WKARAS REPORT 2011
Table 7.5 – Sub-Set B – Bay of Biscay North (BBN) – 1st reading: general information of each oto-lith pair and individual reading results, percentage of reading agreement of all readers combined with the modal age and the respective coefficient of variation (CV).
Table 7.6 – Sub-Set B – Bay of Biscay North (BBN) – 2nd reading: general information of each oto-lith pair and individual reading results, percentage of reading agreement of all readers combined with the modal age and the respective coefficient of variation (CV).
Fish Fish Landing ED IR QP IL DM ES RM MODAL Percent PrecisionSet year Semester no length Image Code month Reader 6 Reader 7 Reader 3 Reader 5 Reader 1 Reader 2 Reader 4 age agreement CVB 05-02-2008 1 1 17,5 SARDINE 1_BBN 2 1 1 1 1 1 1 1 1 100% 0%B 05-02-2008 1 2 19,5 SARDINE 2_BBN 2 2 2 2 2 2 2 2 2 100% 0%B 05-02-2008 1 3 20,0 SARDINE 3_BBN 2 2 2 3 2 2 2 2 2 86% 18%B 05-02-2008 1 4 20,5 SARDINE 4_BBN 2 3 3 2 3 2 2 2 2 57% 22%B 05-02-2008 1 5 21,0 SARDINE 5_BBN 2 4 4 4 4 3 3 4 4 71% 13%B 05-02-2008 1 6 21,0 SARDINE 6_BBN 2 3 3 3 3 3 3 3 3 100% 0%B 05-02-2008 1 7 21,0 SARDINE 7_BBN 2 2 2 1 2 2 2 2 2 86% 20%B 05-02-2008 1 8 21,5 SARDINE 8_BBN 2 5 4 5 4 2 2 2 2 43% 41%B 05-02-2008 1 9 21,5 SARDINE 9_BBN 2 4 4 4 3 4 3 3 4 57% 15%B 05-02-2008 1 10 21,5 SARDINE 10_BBN 2 4 4 4 3 4 3 4 4 71% 13%B 05-02-2008 1 12 22,0 SARDINE 12_BBN 2 4 4 4 4 4 3 4 4 86% 10%B 05-02-2008 1 15 22,0 SARDINE 15_BBN 2 7 6 6 6 6 6 7 6 71% 8%B 05-02-2008 1 17 22,5 SARDINE 17_BBN 2 6 6 6 6 6 6 6 6 100% 0%B 05-02-2008 1 18 22,5 SARDINE 18_BBN 2 6 5 5 5 5 5 - 5 83% 8%B 05-02-2008 1 20 22,5 SARDINE 20_BBN 2 6 5 5 5 5 5 6 5 71% 9%B 05-02-2008 1 21 22,5 SARDINE 21_BBN 2 5 5 5 5 6 6 6 5 57% 10%B 05-02-2008 1 25 23,0 SARDINE 25_BBN 2 6 6 6 6 6 5 7 6 71% 10%B 05-02-2008 1 26 23,0 SARDINE 26_BBN 2 6 5 5 5 5 5 6 5 71% 9%B 05-02-2008 1 27 23,5 SARDINE 27_BBN 2 7 5 6 6 6 6 6 6 71% 10%B 05-02-2008 1 30 23,5 SARDINE 30_BBN 2 5 5 4 5 4 5 4 5 57% 12%B 10-07-2008 2 31 19,0 SARDINE 31_BBN 7 2 2 1 1 1 2 1 1 57% 37%B 10-07-2008 2 32 19,0 SARDINE 32_BBN 7 1 1 1 1 1 1 1 1 100% 0%B 10-07-2008 2 36 19,5 SARDINE 36_BBN 7 1 1 1 1 1 1 1 1 100% 0%B 10-07-2008 2 37 20,0 SARDINE 37_BBN 7 3 3 3 3 1 2 1 3 57% 42%B 10-07-2008 2 39 20,0 SARDINE 39_BBN 7 4 4 3 3 3 2 2 3 43% 27%B 20-10-2008 2 41 19,5 SARDINE 41_BBN 10 2 3 2 3 3 2 2 2 57% 22%B 20-10-2008 2 42 20,5 SARDINE 42_BBN 10 3 3 3 4 2 2 2 3 43% 28%B 20-10-2008 2 46 20,0 SARDINE 46_BBN 10 3 3 3 3 2 2 2 3 57% 21%B 20-10-2008 2 49 21,5 SARDINE 49_BBN 10 3 2 3 2 3 2 3 3 57% 21%B 20-10-2008 2 50 18,0 SARDINE 50_BBN 10 1 1 1 1 1 1 0 1 86% 44%B 20-10-2008 2 55 17,5 SARDINE 55_BBN 10 1 1 1 1 1 1 1 1 100% 0%B 20-10-2008 2 56 13,5 SARDINE 56_BBN 10 0 0 0 0 0 0 0 0 100% 0%B 20-10-2008 2 57 10,5 SARDINE 57_BBN 10 0 0 0 0 0 0 0 0 100% 0%B 20-10-2008 2 58 10,5 SARDINE 58_BBN 10 0 0 0 0 0 0 0 0 100% 0%B 20-10-2008 2 59 11,0 SARDINE 59_BBN 10 0 0 0 0 0 0 0 0 100% 0%
Total read 35 35 35 35 35 35 34Total NOT read 0 0 0 0 0 0 1
76,3% 13,4%
Sample
Fish Fish Landing ED IR QP IL DM ES RM MODAL Percent PrecisionSet year Semester no length Image Code month Reader 6 Reader 7 Reader 3 Reader 5 Reader 1 Reader 2 Reader 4 age agreement CVB 05-02-2008 1 1 17,5 SARDINE 1_BBN 2 1 1 1 2 1 1 1 1 86% 33%B 05-02-2008 1 2 19,5 SARDINE 2_BBN 2 2 2 2 1 2 2 2 2 86% 20%B 05-02-2008 1 3 20 SARDINE 3_BBN 2 2 2 3 2 2 2 3 2 71% 21%B 05-02-2008 1 4 20,5 SARDINE 4_BBN 2 3 3 2 1 2 2 2 2 57% 32%B 05-02-2008 1 5 21 SARDINE 5_BBN 2 4 4 4 3 4 4 4 4 86% 10%B 05-02-2008 1 6 21 SARDINE 6_BBN 2 3 3 3 3 3 3 3 3 100% 0%B 05-02-2008 1 7 21 SARDINE 7_BBN 2 2 2 2 1 2 2 2 2 86% 20%B 05-02-2008 1 8 21,5 SARDINE 8_BBN 2 5 4 - 3 3 2 2 3 33% 37%B 05-02-2008 1 9 21,5 SARDINE 9_BBN 2 4 4 4 3 4 3 3 4 57% 15%B 05-02-2008 1 10 21,5 SARDINE 10_BBN 2 4 4 4 3 4 3 4 4 71% 13%B 05-02-2008 1 12 22 SARDINE 12_BBN 2 4 4 4 3 4 4 4 4 86% 10%B 05-02-2008 1 15 22 SARDINE 15_BBN 2 7 7 6 6 6 6 6 6 71% 8%B 05-02-2008 1 17 22,5 SARDINE 17_BBN 2 6 6 6 6 6 6 6 6 100% 0%B 05-02-2008 1 18 22,5 SARDINE 18_BBN 2 5 5 - - - - - 5 100% 0%B 05-02-2008 1 20 22,5 SARDINE 20_BBN 2 6 5 5 5 5 5 5 5 86% 7%B 05-02-2008 1 21 22,5 SARDINE 21_BBN 2 6 5 5 5 5 5 5 5 86% 7%B 05-02-2008 1 25 23 SARDINE 25_BBN 2 6 6 6 6 6 6 6 6 100% 0%B 05-02-2008 1 26 23 SARDINE 26_BBN 2 6 5 5 5 5 5 5 5 86% 7%B 05-02-2008 1 27 23,5 SARDINE 27_BBN 2 6 6 5 6 6 5 6 6 71% 9%B 05-02-2008 1 30 23,5 SARDINE 30_BBN 2 5 5 6 4 5 5 5 5 71% 12%B 10-07-2008 2 31 19 SARDINE 31_BBN 7 2 2 2 1 - 3 - 2 60% 35%B 10-07-2008 2 32 19 SARDINE 32_BBN 7 1 1 1 1 1 1 1 1 100% 0%B 10-07-2008 2 36 19,5 SARDINE 36_BBN 7 1 1 1 1 - - 2 1 80% 37%B 10-07-2008 2 37 20 SARDINE 37_BBN 7 3 3 2 - - - - 3 67% 22%B 10-07-2008 2 39 20 SARDINE 39_BBN 7 4 4 3 2 3 4 4 4 57% 23%B 20-10-2008 2 41 19,5 SARDINE 41_BBN 10 2 3 2 1 3 - 3 3 50% 35%B 20-10-2008 2 42 20,5 SARDINE 42_BBN 10 3 3 2 2 - - 3 3 60% 21%B 20-10-2008 2 46 20 SARDINE 46_BBN 10 3 3 2 1 3 1 4 3 43% 47%B 20-10-2008 2 49 21,5 SARDINE 49_BBN 10 3 3 3 1 3 2 4 3 57% 35%B 20-10-2008 2 50 18 SARDINE 50_BBN 10 1 1 0 0 0 0 1 0 57% 125%B 20-10-2008 2 55 17,5 SARDINE 55_BBN 10 1 1 1 1 1 1 2 1 86% 33%B 20-10-2008 2 56 13,5 SARDINE 56_BBN 10 0 0 0 0 0 0 0 0 100% 0%B 20-10-2008 2 57 10,5 SARDINE 57_BBN 10 0 0 0 0 0 0 0 0 100% 0%B 20-10-2008 2 58 10,5 SARDINE 58_BBN 10 0 0 1 0 0 0 0 0 86% 265%B 20-10-2008 2 59 11 SARDINE 59_BBN 10 0 0 1 0 0 0 0 0 86% 265%
Total read 35 35 33 33 30 30 32Total NOT read 0 0 2 2 5 5 3
Sample
76,5% 34,4%
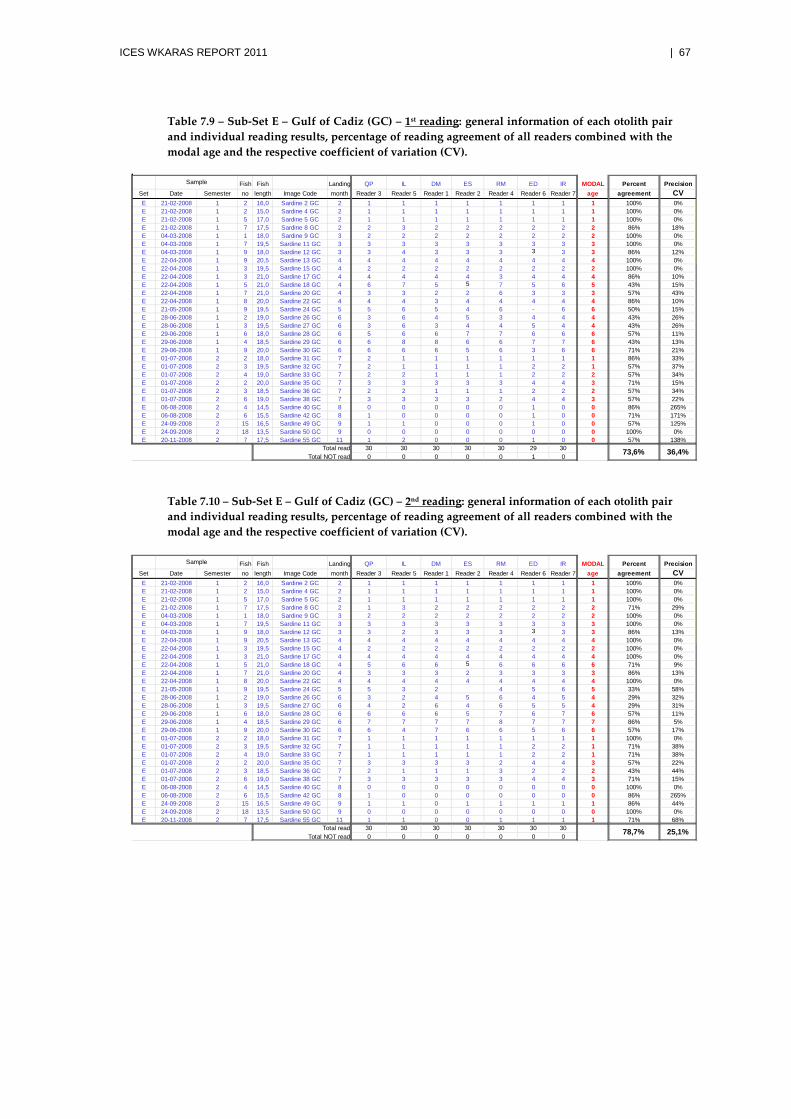
ICES WKARAS REPORT 2011 | 67
Table 7.9 – Sub-Set E – Gulf of Cadiz (GC) – 1st reading: general information of each otolith pair and individual reading results, percentage of reading agreement of all readers combined with the modal age and the respective coefficient of variation (CV).
Table 7.10 – Sub-Set E – Gulf of Cadiz (GC) – 2nd reading: general information of each otolith pair and individual reading results, percentage of reading agreement of all readers combined with the modal age and the respective coefficient of variation (CV).
Fish Fish Landing QP IL DM ES RM ED IR MODAL Percent PrecisionSet Date Semester no length Image Code month Reader 3 Reader 5 Reader 1 Reader 2 Reader 4 Reader 6 Reader 7 age agreement CVE 21-02-2008 1 2 16,0 Sardine 2 GC 2 1 1 1 1 1 1 1 1 100% 0%E 21-02-2008 1 2 15,0 Sardine 4 GC 2 1 1 1 1 1 1 1 1 100% 0%E 21-02-2008 1 5 17,0 Sardine 5 GC 2 1 1 1 1 1 1 1 1 100% 0%E 21-02-2008 1 7 17,5 Sardine 8 GC 2 2 3 2 2 2 2 2 2 86% 18%E 04-03-2008 1 1 18,0 Sardine 9 GC 3 2 2 2 2 2 2 2 2 100% 0%E 04-03-2008 1 7 19,5 Sardine 11 GC 3 3 3 3 3 3 3 3 3 100% 0%E 04-03-2008 1 9 18,0 Sardine 12 GC 3 3 4 3 3 3 3 3 3 86% 12%E 22-04-2008 1 9 20,5 Sardine 13 GC 4 4 4 4 4 4 4 4 4 100% 0%E 22-04-2008 1 3 19,5 Sardine 15 GC 4 2 2 2 2 2 2 2 2 100% 0%E 22-04-2008 1 3 21,0 Sardine 17 GC 4 4 4 4 4 3 4 4 4 86% 10%E 22-04-2008 1 5 21,0 Sardine 18 GC 4 6 7 5 5 7 5 6 5 43% 15%E 22-04-2008 1 7 21,0 Sardine 20 GC 4 3 3 2 2 6 3 3 3 57% 43%E 22-04-2008 1 8 20,0 Sardine 22 GC 4 4 4 3 4 4 4 4 4 86% 10%E 21-05-2008 1 9 19,5 Sardine 24 GC 5 5 6 5 4 6 - 6 6 50% 15%E 28-06-2008 1 2 19,0 Sardine 26 GC 6 3 6 4 5 3 4 4 4 43% 26%E 28-06-2008 1 3 19,5 Sardine 27 GC 6 3 6 3 4 4 5 4 4 43% 26%E 29-06-2008 1 6 18,0 Sardine 28 GC 6 5 6 6 7 7 6 6 6 57% 11%E 29-06-2008 1 4 18,5 Sardine 29 GC 6 6 8 8 6 6 7 7 6 43% 13%E 29-06-2008 1 9 20,0 Sardine 30 GC 6 6 6 6 5 6 3 6 6 71% 21%E 01-07-2008 2 2 18,0 Sardine 31 GC 7 2 1 1 1 1 1 1 1 86% 33%E 01-07-2008 2 3 19,5 Sardine 32 GC 7 2 1 1 1 1 2 2 1 57% 37%E 01-07-2008 2 4 19,0 Sardine 33 GC 7 2 2 1 1 1 2 2 2 57% 34%E 01-07-2008 2 2 20,0 Sardine 35 GC 7 3 3 3 3 3 4 4 3 71% 15%E 01-07-2008 2 3 18,5 Sardine 36 GC 7 2 2 1 1 1 2 2 2 57% 34%E 01-07-2008 2 6 19,0 Sardine 38 GC 7 3 3 3 3 2 4 4 3 57% 22%E 06-08-2008 2 4 14,5 Sardine 40 GC 8 0 0 0 0 0 1 0 0 86% 265%E 06-08-2008 2 6 15,5 Sardine 42 GC 8 1 0 0 0 0 1 0 0 71% 171%E 24-09-2008 2 15 16,5 Sardine 49 GC 9 1 1 0 0 0 1 0 0 57% 125%E 24-09-2008 2 18 13,5 Sardine 50 GC 9 0 0 0 0 0 0 0 0 100% 0%E 20-11-2008 2 7 17,5 Sardine 55 GC 11 1 2 0 0 0 1 0 0 57% 138%
Total read 30 30 30 30 30 29 30Total NOT read 0 0 0 0 0 1 0
Sample
73,6% 36,4%
Fish Fish Landing QP IL DM ES RM ED IR MODAL Percent PrecisionSet Date Semester no length Image Code month Reader 3 Reader 5 Reader 1 Reader 2 Reader 4 Reader 6 Reader 7 age agreement CVE 21-02-2008 1 2 16,0 Sardine 2 GC 2 1 1 1 1 1 1 1 1 100% 0%E 21-02-2008 1 2 15,0 Sardine 4 GC 2 1 1 1 1 1 1 1 1 100% 0%E 21-02-2008 1 5 17,0 Sardine 5 GC 2 1 1 1 1 1 1 1 1 100% 0%E 21-02-2008 1 7 17,5 Sardine 8 GC 2 1 3 2 2 2 2 2 2 71% 29%E 04-03-2008 1 1 18,0 Sardine 9 GC 3 2 2 2 2 2 2 2 2 100% 0%E 04-03-2008 1 7 19,5 Sardine 11 GC 3 3 3 3 3 3 3 3 3 100% 0%E 04-03-2008 1 9 18,0 Sardine 12 GC 3 3 2 3 3 3 3 3 3 86% 13%E 22-04-2008 1 9 20,5 Sardine 13 GC 4 4 4 4 4 4 4 4 4 100% 0%E 22-04-2008 1 3 19,5 Sardine 15 GC 4 2 2 2 2 2 2 2 2 100% 0%E 22-04-2008 1 3 21,0 Sardine 17 GC 4 4 4 4 4 4 4 4 4 100% 0%E 22-04-2008 1 5 21,0 Sardine 18 GC 4 5 6 6 5 6 6 6 6 71% 9%E 22-04-2008 1 7 21,0 Sardine 20 GC 4 3 3 3 2 3 3 3 3 86% 13%E 22-04-2008 1 8 20,0 Sardine 22 GC 4 4 4 4 4 4 4 4 4 100% 0%E 21-05-2008 1 9 19,5 Sardine 24 GC 5 5 3 2 4 5 6 5 33% 58%E 28-06-2008 1 2 19,0 Sardine 26 GC 6 3 2 4 5 6 4 5 4 29% 32%E 28-06-2008 1 3 19,5 Sardine 27 GC 6 4 2 6 4 6 5 5 4 29% 31%E 29-06-2008 1 6 18,0 Sardine 28 GC 6 6 6 6 5 7 6 7 6 57% 11%E 29-06-2008 1 4 18,5 Sardine 29 GC 6 7 7 7 7 8 7 7 7 86% 5%E 29-06-2008 1 9 20,0 Sardine 30 GC 6 6 4 7 6 6 5 6 6 57% 17%E 01-07-2008 2 2 18,0 Sardine 31 GC 7 1 1 1 1 1 1 1 1 100% 0%E 01-07-2008 2 3 19,5 Sardine 32 GC 7 1 1 1 1 1 2 2 1 71% 38%E 01-07-2008 2 4 19,0 Sardine 33 GC 7 1 1 1 1 1 2 2 1 71% 38%E 01-07-2008 2 2 20,0 Sardine 35 GC 7 3 3 3 3 2 4 4 3 57% 22%E 01-07-2008 2 3 18,5 Sardine 36 GC 7 2 1 1 1 3 2 2 2 43% 44%E 01-07-2008 2 6 19,0 Sardine 38 GC 7 3 3 3 3 3 4 4 3 71% 15%E 06-08-2008 2 4 14,5 Sardine 40 GC 8 0 0 0 0 0 0 0 0 100% 0%E 06-08-2008 2 6 15,5 Sardine 42 GC 8 1 0 0 0 0 0 0 0 86% 265%E 24-09-2008 2 15 16,5 Sardine 49 GC 9 1 1 0 1 1 1 1 1 86% 44%E 24-09-2008 2 18 13,5 Sardine 50 GC 9 0 0 0 0 0 0 0 0 100% 0%E 20-11-2008 2 7 17,5 Sardine 55 GC 11 1 1 0 0 1 1 1 1 71% 68%
Total read 30 30 30 30 30 30 30Total NOT read 0 0 0 0 0 0 0
Sample
78,7% 25,1%
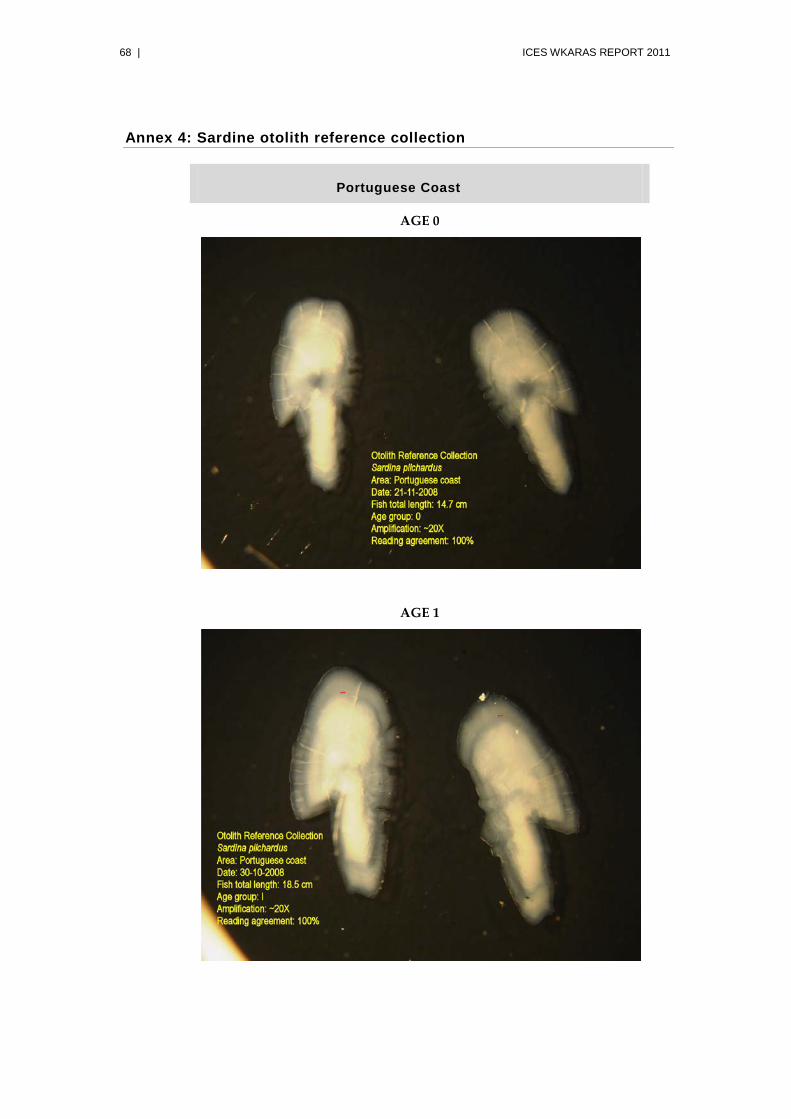
68 | ICES WKARAS REPORT 2011
Annex 4: Sardine otolith reference collection
Portuguese Coast
AGE 0
AGE 1
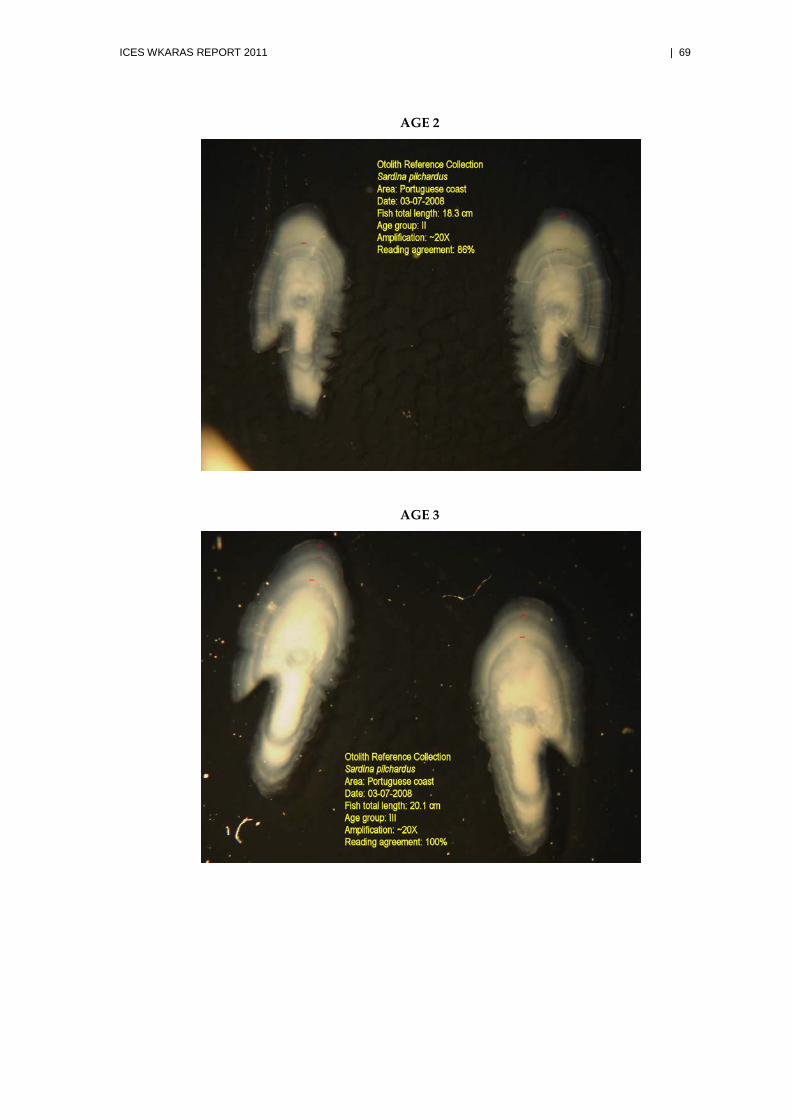
ICES WKARAS REPORT 2011 | 69
AGE 2
AGE 3
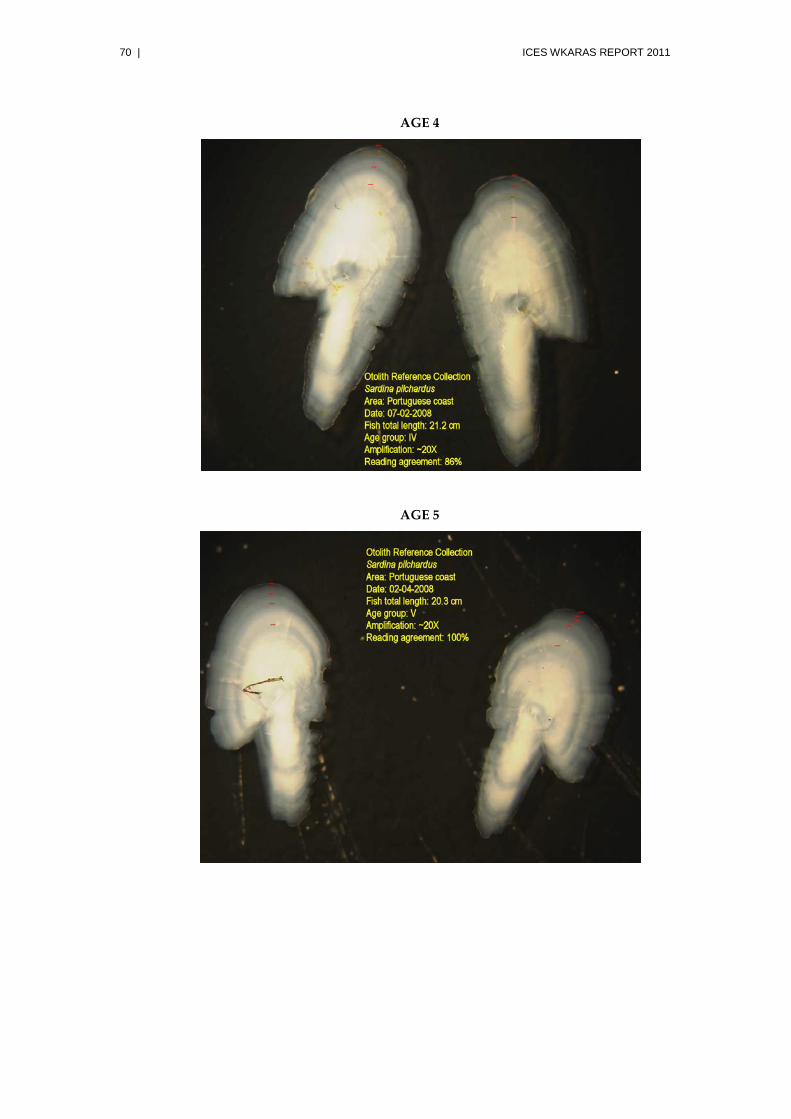
70 | ICES WKARAS REPORT 2011
AGE 4
AGE 5
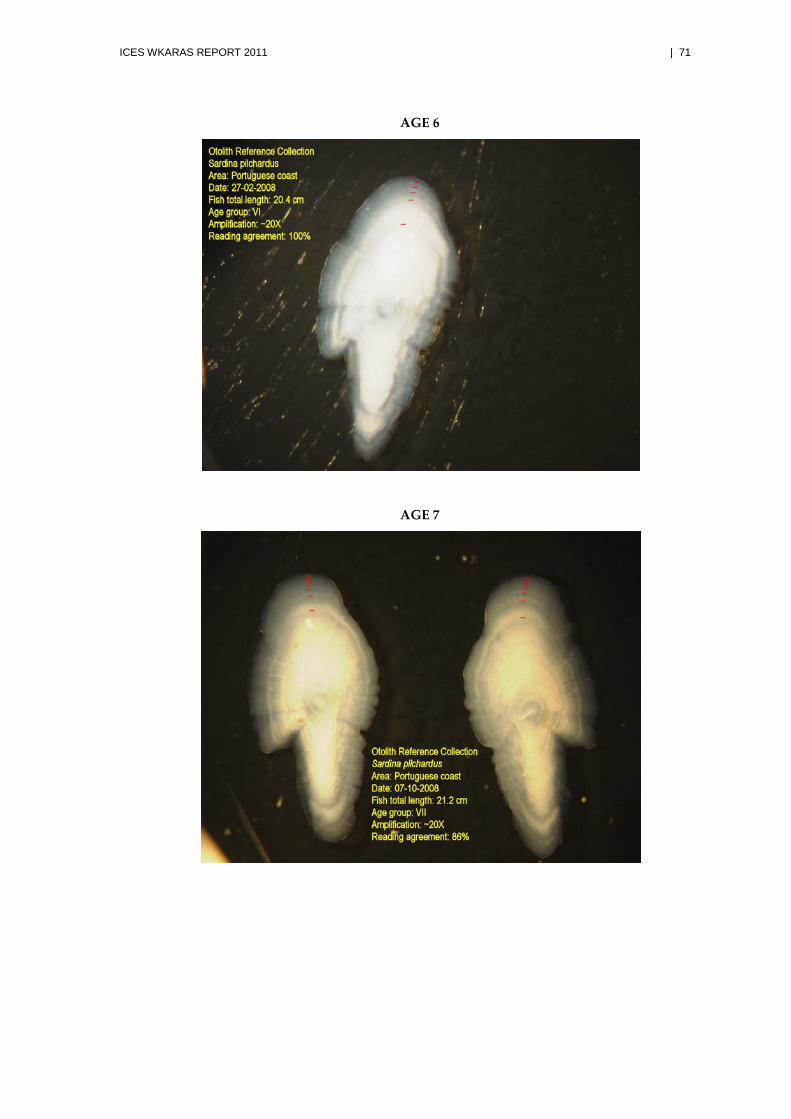
ICES WKARAS REPORT 2011 | 71
AGE 6
AGE 7
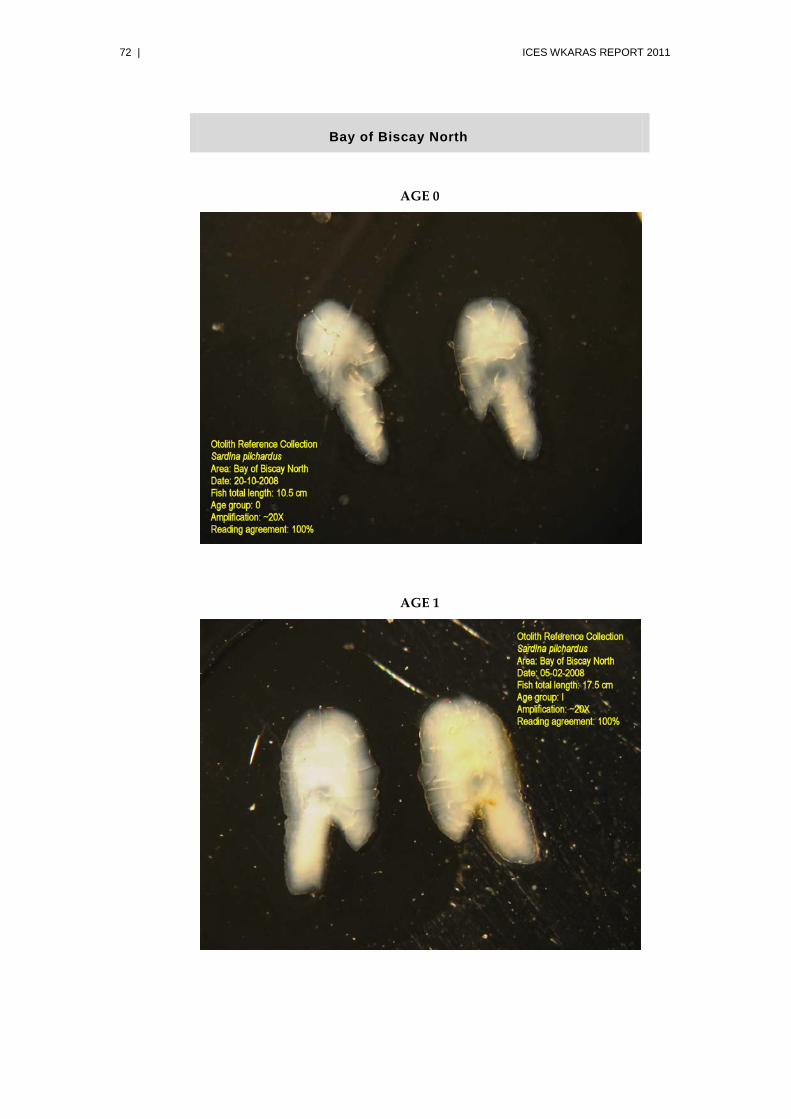
72 | ICES WKARAS REPORT 2011
Bay of Biscay North
AGE 0
AGE 1
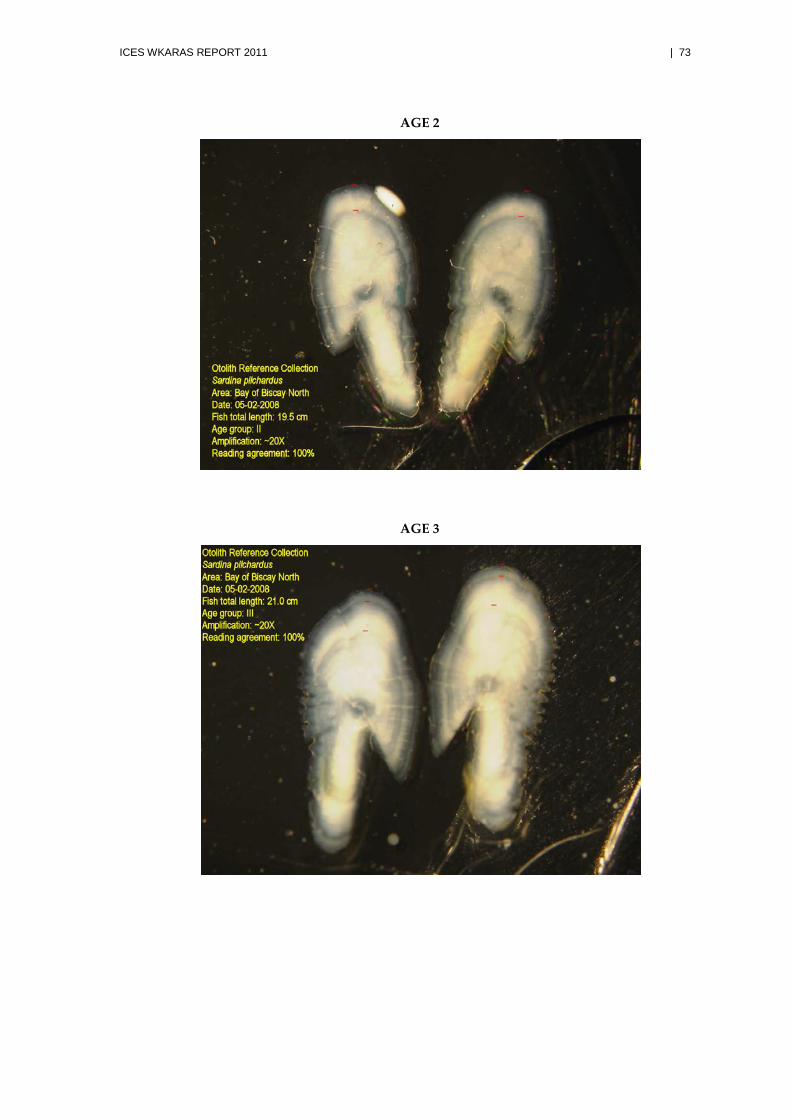
ICES WKARAS REPORT 2011 | 73
AGE 2
AGE 3
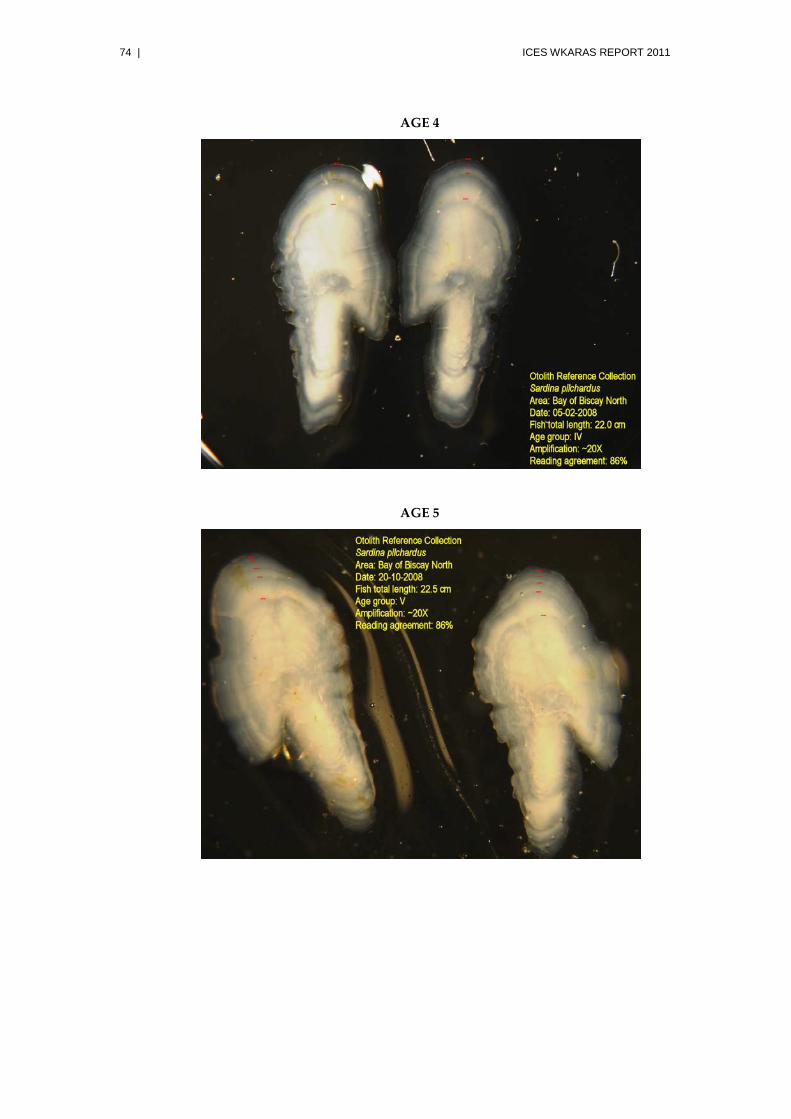
74 | ICES WKARAS REPORT 2011
AGE 4
AGE 5
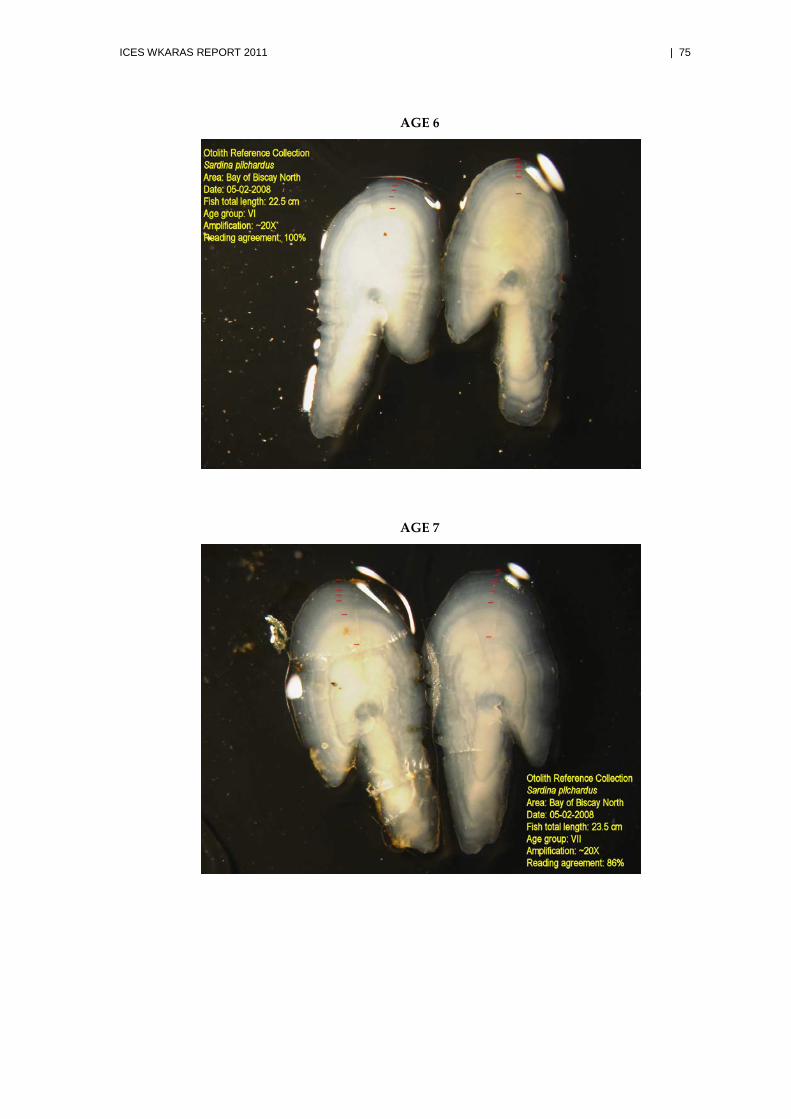
ICES WKARAS REPORT 2011 | 75
AGE 6
AGE 7
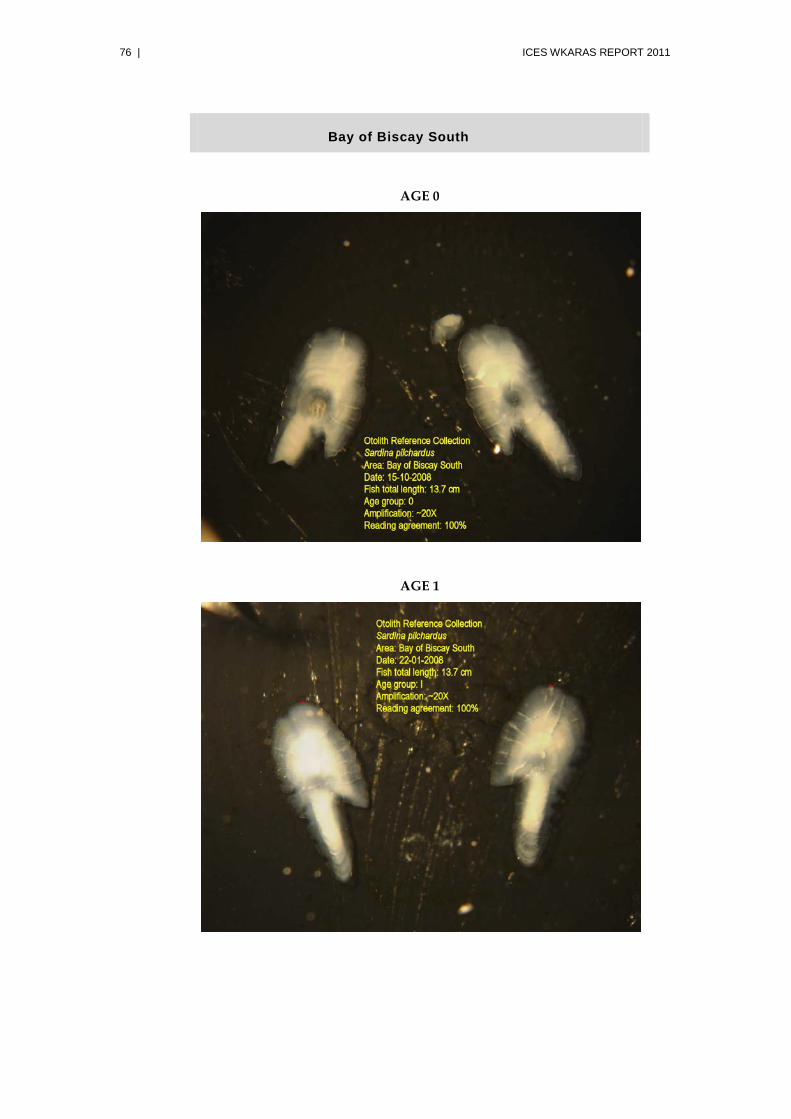
76 | ICES WKARAS REPORT 2011
Bay of Biscay South
AGE 0
AGE 1
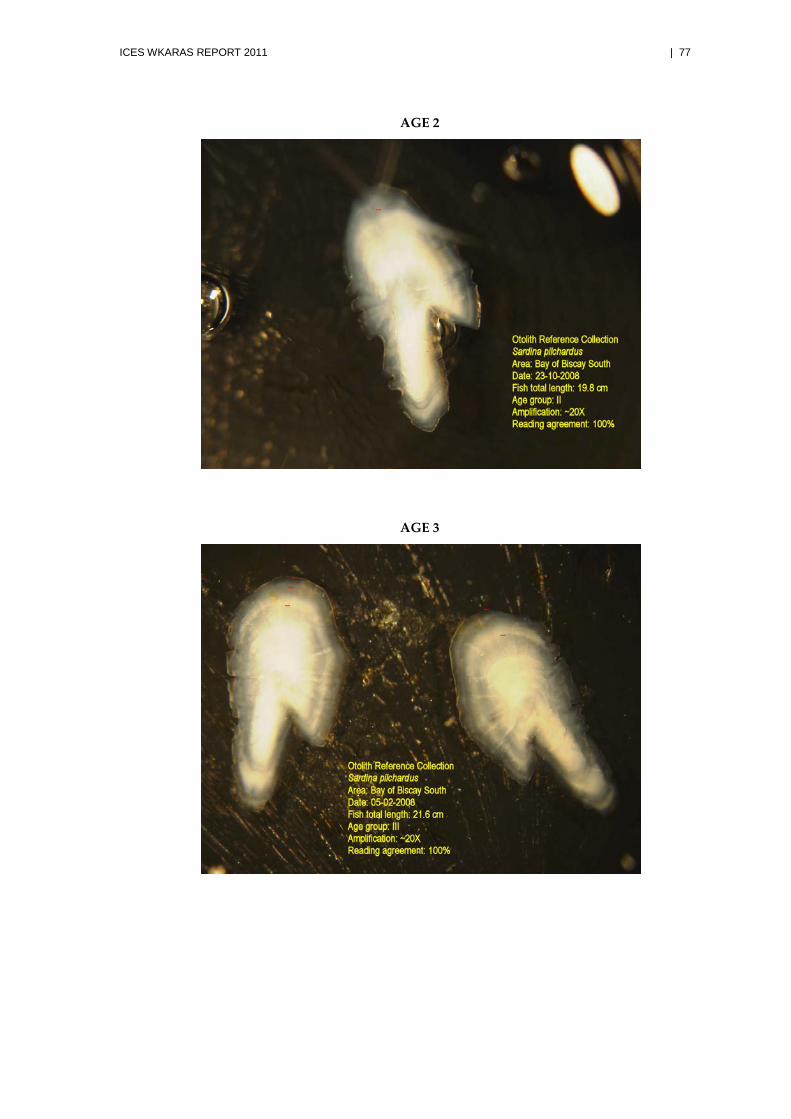
ICES WKARAS REPORT 2011 | 77
AGE 2
AGE 3
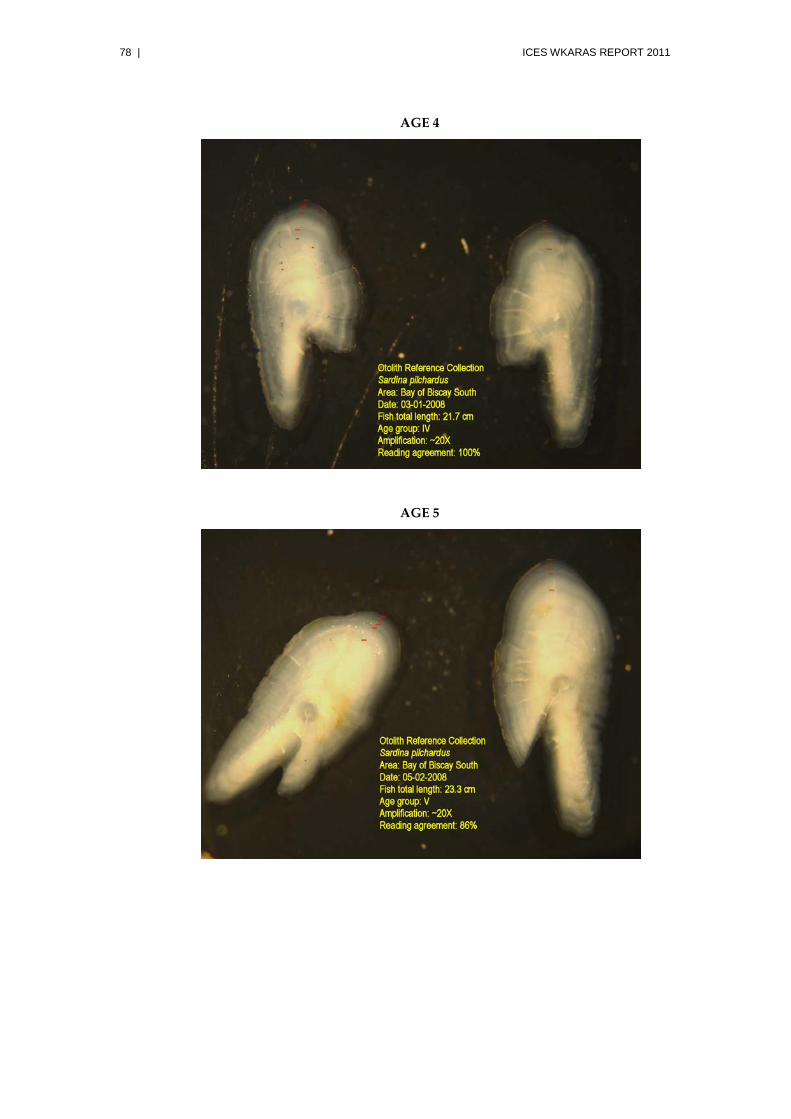
78 | ICES WKARAS REPORT 2011
AGE 4
AGE 5
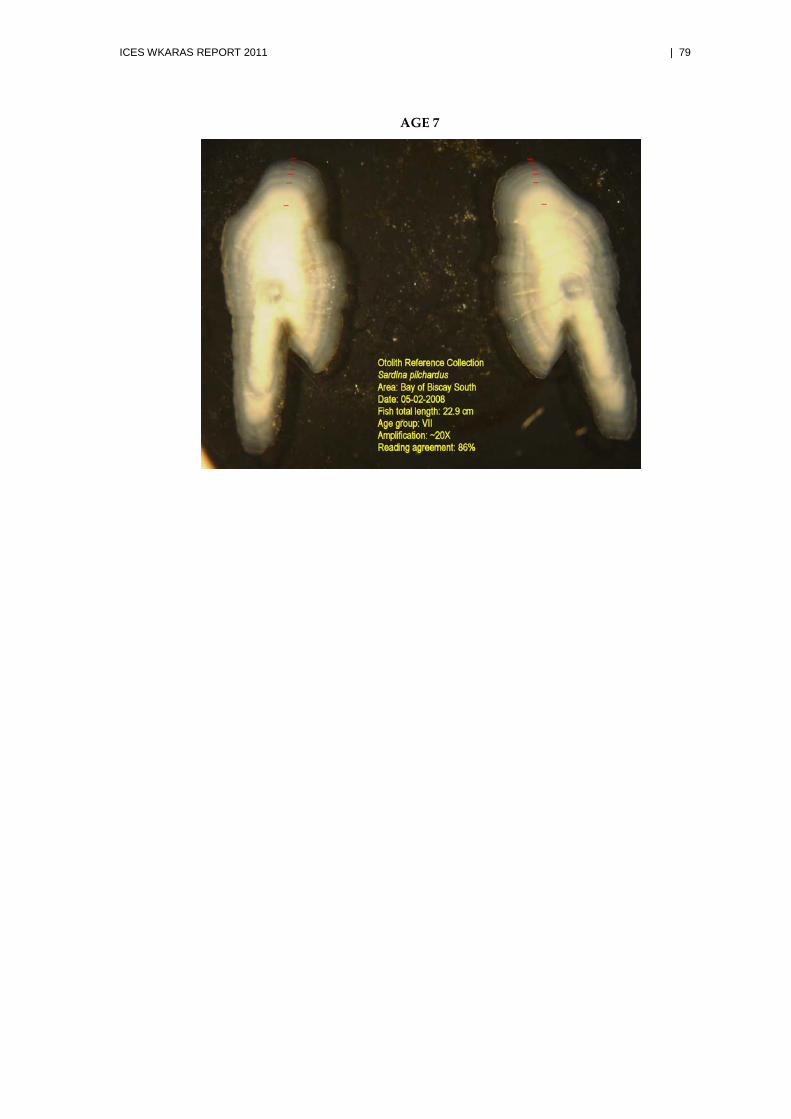
ICES WKARAS REPORT 2011 | 79
AGE 7
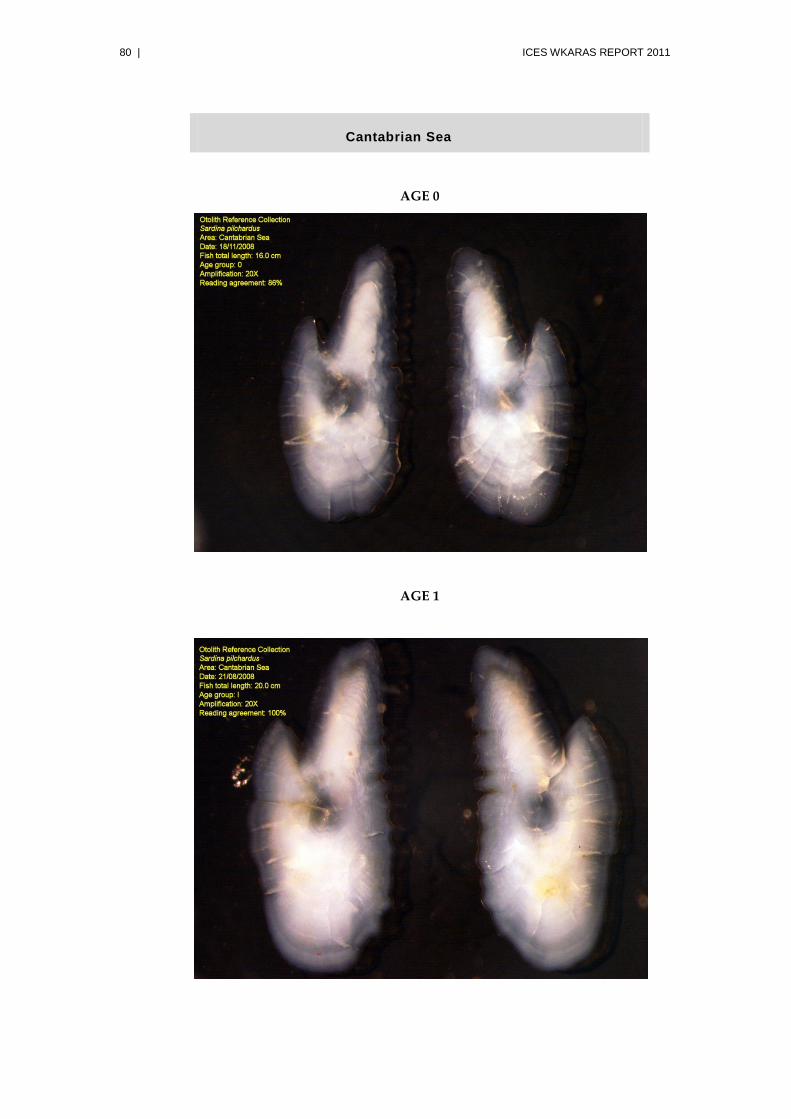
80 | ICES WKARAS REPORT 2011
Cantabrian Sea
AGE 0
AGE 1
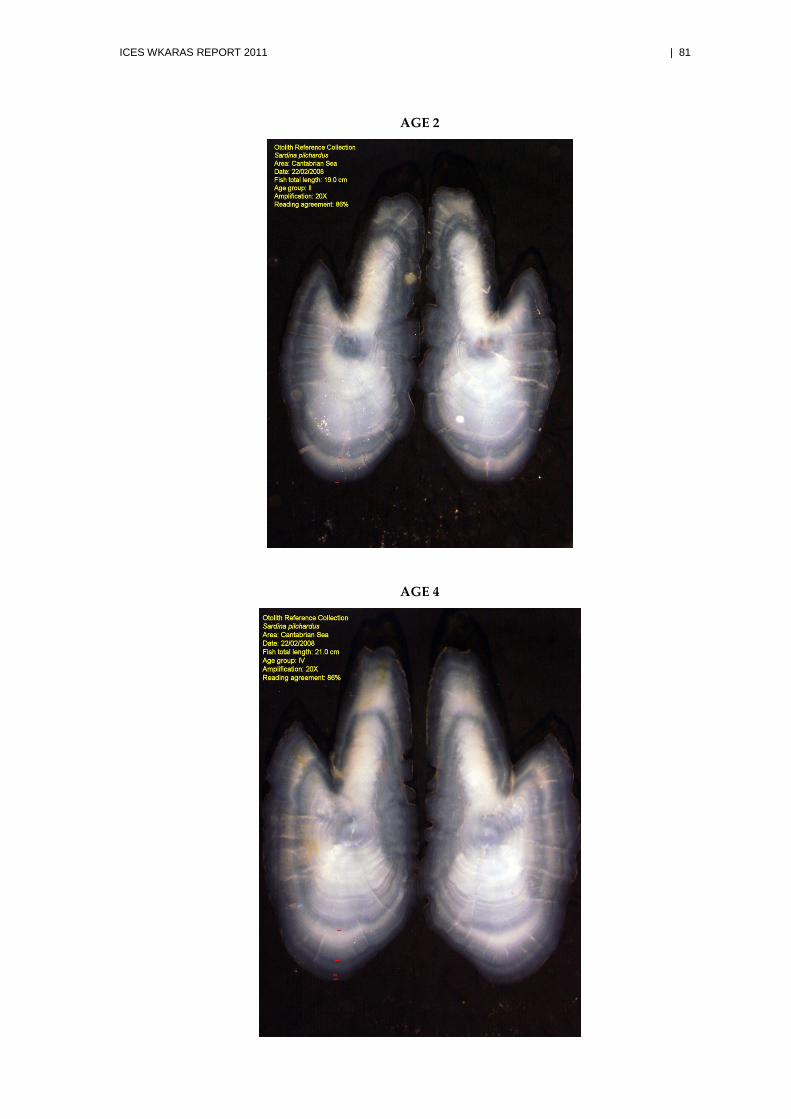
ICES WKARAS REPORT 2011 | 81
AGE 2
AGE 4
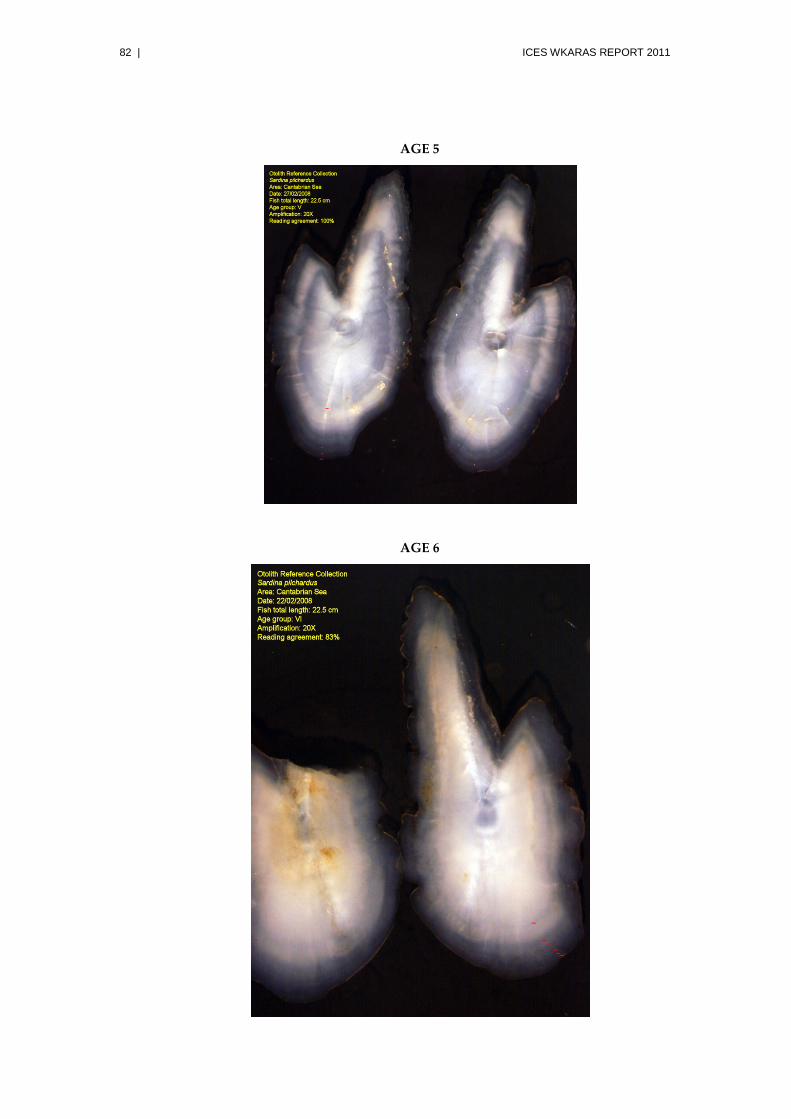
82 | ICES WKARAS REPORT 2011
AGE 5
AGE 6
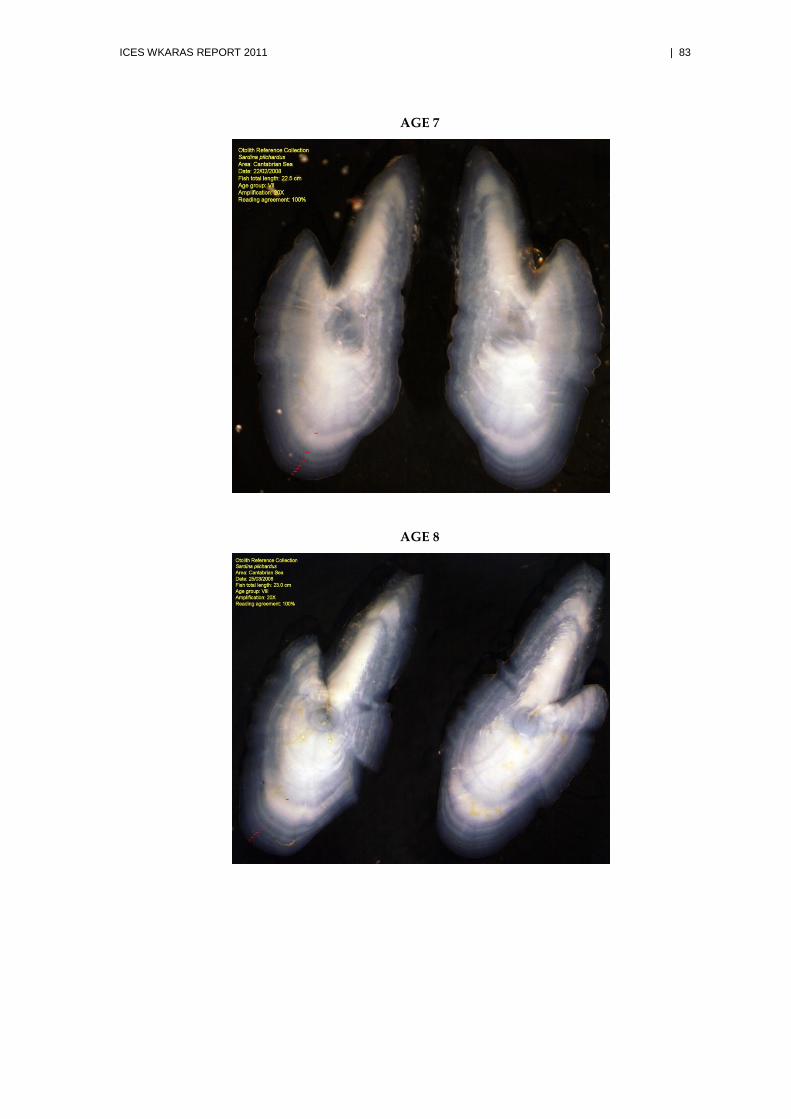
ICES WKARAS REPORT 2011 | 83
AGE 7
AGE 8
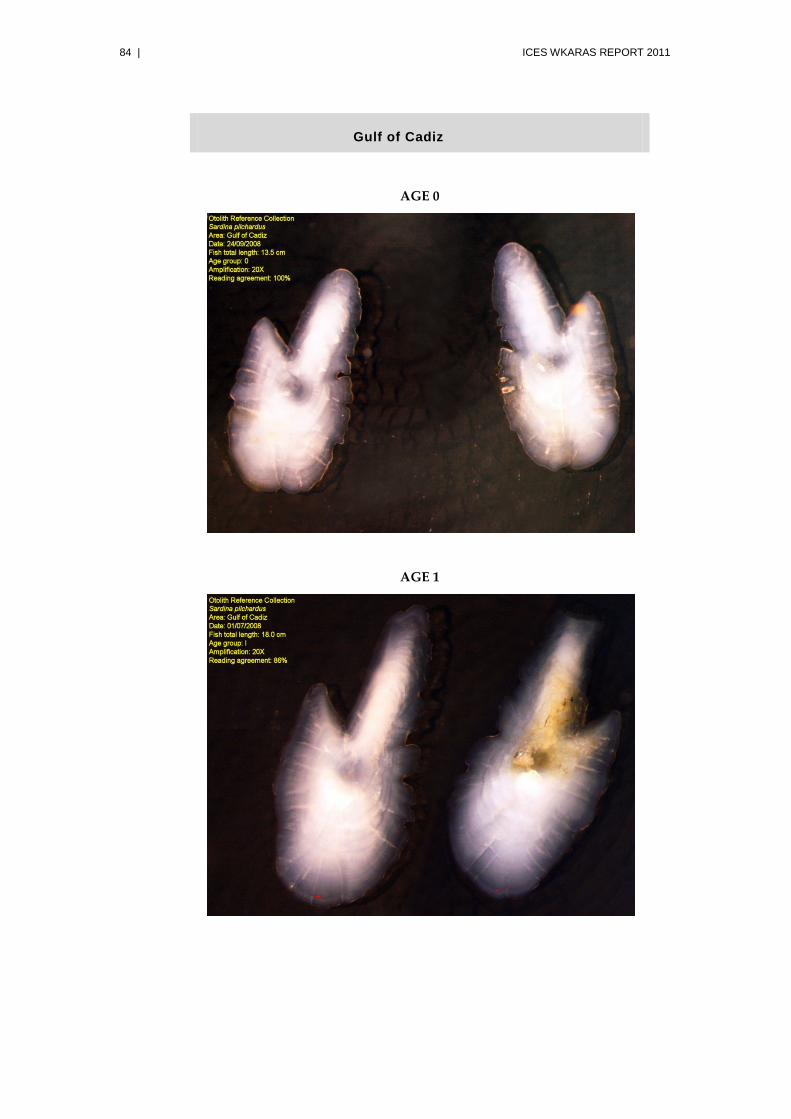
84 | ICES WKARAS REPORT 2011
Gulf of Cadiz
AGE 0
AGE 1
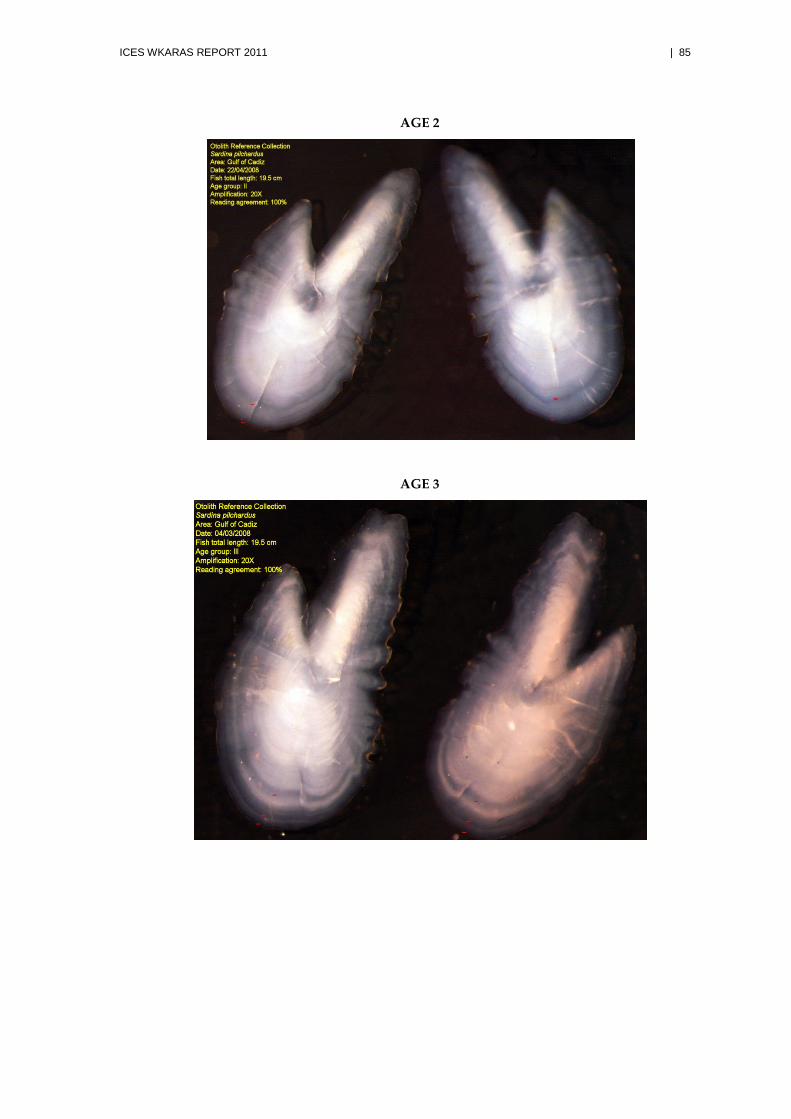
ICES WKARAS REPORT 2011 | 85
AGE 2
AGE 3
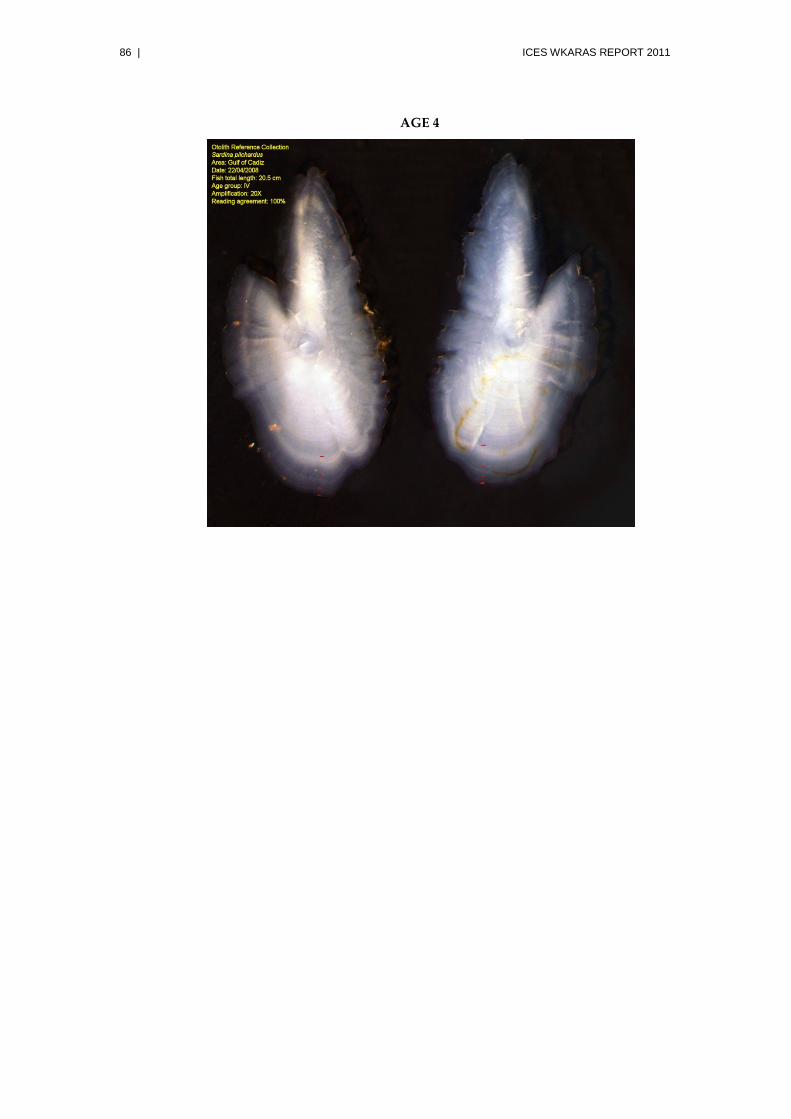
86 | ICES WKARAS REPORT 2011
AGE 4
ICES WKARAS REPORT 2011 | 87
Annex 6: Recommendations
Recommendation For follow up by: 1. Age reading Workshops to take place regularly at 4-5 years intervals, with participants experienced in the Iberian Stock area, in the Bay of Biscay and in ICES Div. VIIe.
PGCCDBS
2. The Workshop supports the recommendation of WKARA 2009 to set up of a Workshop on micro-increments analysis and methodology and suggests this is extended to sardine and eventually, to other small pelagic fish (e.g. herring, sprat).
PGCCDBS
3. The Workshop recommends that the procedures to calculate CV’s by age group are reviewed, taking into account the problem of inflation observed for age group 0.
PGCCDBS