Embed Size (px)
Citation preview
January 25, 2016
ICICI Securities Ltd | Retail Equity Research
Result Update
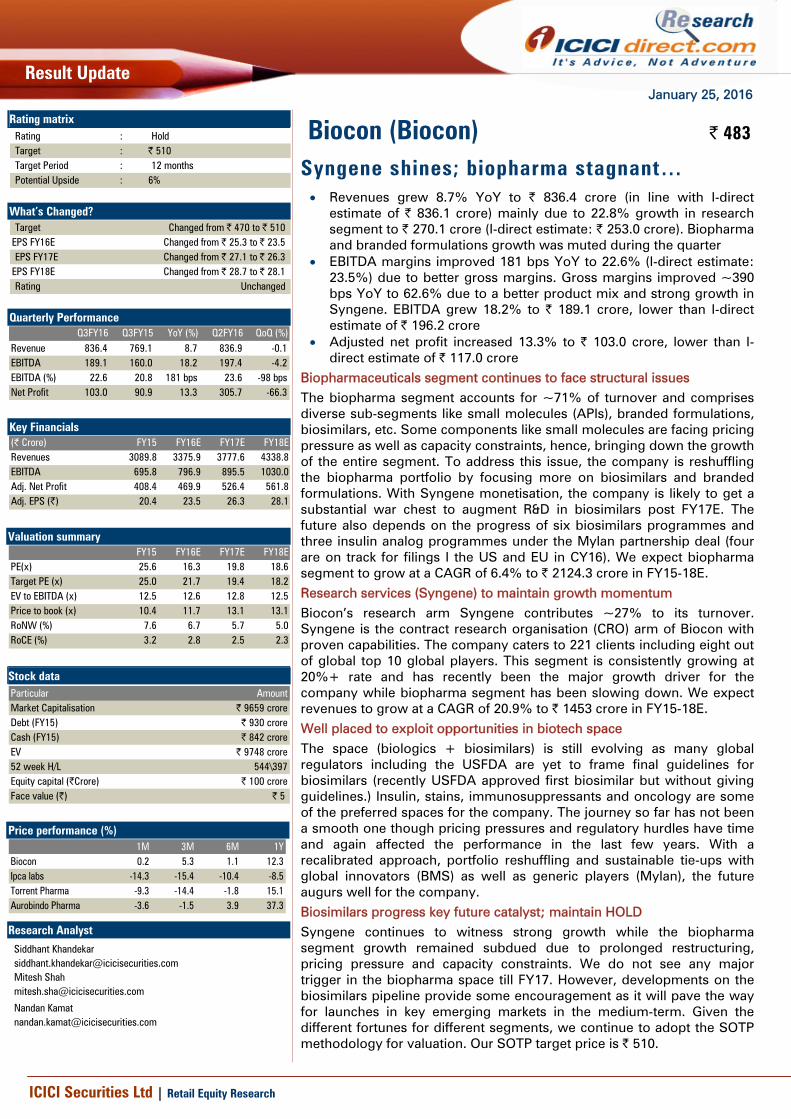
Syngene shines; biopharma stagnant… • Revenues grew 8.7% YoY to | 836.4 crore (in line with I-direct
estimate of | 836.1 crore) mainly due to 22.8% growth in research segment to | 270.1 crore (I-direct estimate: | 253.0 crore). Biopharma and branded formulations growth was muted during the quarter
• EBITDA margins improved 181 bps YoY to 22.6% (I-direct estimate: 23.5%) due to better gross margins. Gross margins improved ~390 bps YoY to 62.6% due to a better product mix and strong growth in Syngene. EBITDA grew 18.2% to | 189.1 crore, lower than I-direct estimate of | 196.2 crore
• Adjusted net profit increased 13.3% to | 103.0 crore, lower than I-direct estimate of | 117.0 crore
Biopharmaceuticals segment continues to face structural issues The biopharma segment accounts for ~71% of turnover and comprises diverse sub-segments like small molecules (APIs), branded formulations, biosimilars, etc. Some components like small molecules are facing pricing pressure as well as capacity constraints, hence, bringing down the growth of the entire segment. To address this issue, the company is reshuffling the biopharma portfolio by focusing more on biosimilars and branded formulations. With Syngene monetisation, the company is likely to get a substantial war chest to augment R&D in biosimilars post FY17E. The future also depends on the progress of six biosimilars programmes and three insulin analog programmes under the Mylan partnership deal (four are on track for filings I the US and EU in CY16). We expect biopharma segment to grow at a CAGR of 6.4% to | 2124.3 crore in FY15-18E. Research services (Syngene) to maintain growth momentum Biocon’s research arm Syngene contributes ~27% to its turnover. Syngene is the contract research organisation (CRO) arm of Biocon with proven capabilities. The company caters to 221 clients including eight out of global top 10 global players. This segment is consistently growing at 20%+ rate and has recently been the major growth driver for the company while biopharma segment has been slowing down. We expect revenues to grow at a CAGR of 20.9% to | 1453 crore in FY15-18E. Well placed to exploit opportunities in biotech space The space (biologics + biosimilars) is still evolving as many global regulators including the USFDA are yet to frame final guidelines for biosimilars (recently USFDA approved first biosimilar but without giving guidelines.) Insulin, stains, immunosuppressants and oncology are some of the preferred spaces for the company. The journey so far has not been a smooth one though pricing pressures and regulatory hurdles have time and again affected the performance in the last few years. With a recalibrated approach, portfolio reshuffling and sustainable tie-ups with global innovators (BMS) as well as generic players (Mylan), the future augurs well for the company. Biosimilars progress key future catalyst; maintain HOLD Syngene continues to witness strong growth while the biopharma segment growth remained subdued due to prolonged restructuring, pricing pressure and capacity constraints. We do not see any major trigger in the biopharma space till FY17. However, developments on the biosimilars pipeline provide some encouragement as it will pave the way for launches in key emerging markets in the medium-term. Given the different fortunes for different segments, we continue to adopt the SOTP methodology for valuation. Our SOTP target price is | 510.
Rating matrix Rating : HoldTarget : | 510Target Period : 12 monthsPotential Upside : 6%
What’s Changed?
Target Changed from | 470 to | 510EPS FY16E Changed from | 25.3 to | 23.5EPS FY17E Changed from | 27.1 to | 26.3
EPS FY18E Changed from | 28.7 to | 28.1Rating Unchanged
Quarterly Performance
Q3FY16 Q3FY15 YoY (%) Q2FY16 QoQ (%)Revenue 836.4 769.1 8.7 836.9 -0.1EBITDA 189.1 160.0 18.2 197.4 -4.2EBITDA (%) 22.6 20.8 181 bps 23.6 -98 bpsNet Profit 103.0 90.9 13.3 305.7 -66.3
Key Financials (| Crore) FY15 FY16E FY17E FY18ERevenues 3089.8 3375.9 3777.6 4338.8EBITDA 695.8 796.9 895.5 1030.0Adj. Net Profit 408.4 469.9 526.4 561.8Adj. EPS (|) 20.4 23.5 26.3 28.1
Valuation summary
FY15 FY16E FY17E FY18EPE(x) 25.6 16.3 19.8 18.6Target PE (x) 25.0 21.7 19.4 18.2EV to EBITDA (x) 12.5 12.6 12.8 12.5Price to book (x) 10.4 11.7 13.1 13.1RoNW (%) 7.6 6.7 5.7 5.0RoCE (%) 3.2 2.8 2.5 2.3
Stock data ParticularMarket Capitalisation Debt (FY15)Cash (FY15)EV 52 week H/L 544\397Equity capital (|Crore)Face value (|) | 5
| 100 crore
| 9748 crore
Amount| 9659 crore
| 930 crore| 842 crore
Price performance (%)
1M 3M 6M 1YBiocon 0.2 5.3 1.1 12.3Ipca labs -14.3 -15.4 -10.4 -8.5Torrent Pharma -9.3 -14.4 -1.8 15.1Aurobindo Pharma -3.6 -1.5 3.9 37.3
Biocon (Biocon) | 483
Research Analyst
Siddhant Khandekar [email protected] Mitesh Shah [email protected]
Nandan Kamat [email protected]
ICICI Securities Ltd | Retail Equity Research Page 2
Variance analysis
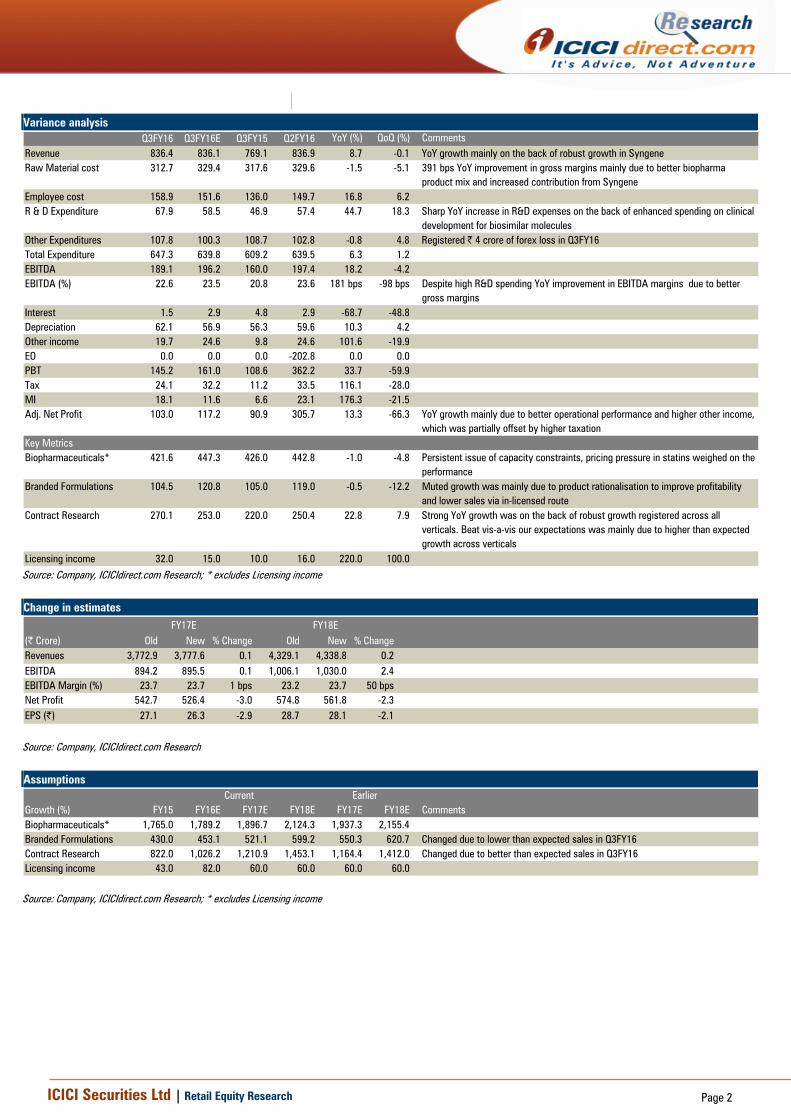
Q3FY16 Q3FY16E Q3FY15 Q2FY16 YoY (%) QoQ (%) CommentsRevenue 836.4 836.1 769.1 836.9 8.7 -0.1 YoY growth mainly on the back of robust growth in SyngeneRaw Material cost 312.7 329.4 317.6 329.6 -1.5 -5.1 391 bps YoY improvement in gross margins mainly due to better biopharma
product mix and increased contribution from SyngeneEmployee cost 158.9 151.6 136.0 149.7 16.8 6.2R & D Expenditure 67.9 58.5 46.9 57.4 44.7 18.3 Sharp YoY increase in R&D expenses on the back of enhanced spending on clinical
development for biosimilar moleculesOther Expenditures 107.8 100.3 108.7 102.8 -0.8 4.8 Registered | 4 crore of forex loss in Q3FY16Total Expenditure 647.3 639.8 609.2 639.5 6.3 1.2EBITDA 189.1 196.2 160.0 197.4 18.2 -4.2EBITDA (%) 22.6 23.5 20.8 23.6 181 bps -98 bps Despite high R&D spending YoY improvement in EBITDA margins due to better
gross margins Interest 1.5 2.9 4.8 2.9 -68.7 -48.8Depreciation 62.1 56.9 56.3 59.6 10.3 4.2Other income 19.7 24.6 9.8 24.6 101.6 -19.9EO 0.0 0.0 0.0 -202.8 0.0 0.0PBT 145.2 161.0 108.6 362.2 33.7 -59.9Tax 24.1 32.2 11.2 33.5 116.1 -28.0MI 18.1 11.6 6.6 23.1 176.3 -21.5Adj. Net Profit 103.0 117.2 90.9 305.7 13.3 -66.3 YoY growth mainly due to better operational performance and higher other income,
which was partially offset by higher taxation Key MetricsBiopharmaceuticals* 421.6 447.3 426.0 442.8 -1.0 -4.8 Persistent issue of capacity constraints, pricing pressure in statins weighed on the
performanceBranded Formulations 104.5 120.8 105.0 119.0 -0.5 -12.2 Muted growth was mainly due to product rationalisation to improve profitability
and lower sales via in-licensed routeContract Research 270.1 253.0 220.0 250.4 22.8 7.9 Strong YoY growth was on the back of robust growth registered across all
verticals. Beat vis-a-vis our expectations was mainly due to higher than expected growth across verticals
Licensing income 32.0 15.0 10.0 16.0 220.0 100.0
Source: Company, ICICIdirect.com Research; * excludes Licensing income Change in estimates
(| Crore) Old New % Change Old New % ChangeRevenues 3,772.9 3,777.6 0.1 4,329.1 4,338.8 0.2EBITDA 894.2 895.5 0.1 1,006.1 1,030.0 2.4EBITDA Margin (%) 23.7 23.7 1 bps 23.2 23.7 50 bpsNet Profit 542.7 526.4 -3.0 574.8 561.8 -2.3EPS (|) 27.1 26.3 -2.9 28.7 28.1 -2.1
FY17E FY18E
Source: Company, ICICIdirect.com Research Assumptions
CurrentGrowth (%) FY15 FY16E FY17E FY18E FY17E FY18E CommentsBiopharmaceuticals* 1,765.0 1,789.2 1,896.7 2,124.3 1,937.3 2,155.4Branded Formulations 430.0 453.1 521.1 599.2 550.3 620.7 Changed due to lower than expected sales in Q3FY16Contract Research 822.0 1,026.2 1,210.9 1,453.1 1,164.4 1,412.0 Changed due to better than expected sales in Q3FY16Licensing income 43.0 82.0 60.0 60.0 60.0 60.0
Earlier
Source: Company, ICICIdirect.com Research; * excludes Licensing income

ICICI Securities Ltd | Retail Equity Research Page 3
Company Analysis Biocon was established in 1978 by first generation entrepreneur Dr Kiran Mazumdar-Shaw. Unlike most pharma companies which are chemical based, Biocon has carved out its niche in the more complex biotechnology field. Over the decades, Biocon has successfully evolved into an emerging global biopharma enterprise, serving its partners and customers in over 75 countries. As a fully integrated biopharma company, it delivers innovative biopharmaceutical solutions, ranging from discovery to development and commercialisation. In 2004, it came out with its maiden IPO. Over the last 10 years, sales, EBITDA and PAT have grown by 3.7x, 2.7x and 2.3x, respectively. However, the market cap has failed to keep pace, growing at just 1.5x during the same period. This was mainly due to the initial expectations build-up by the company but failing to deliver the same. This was also due to a break-up of the Pfizer deal (at Pfizer’s behest), which was crafted to develop four biosimilar anti-diabetic products. However, with a recalibrated approach by reshuffling the biopharma portfolio and consistency in the services segment, we expect steadiness in the performance, going ahead. Exhibit 1: Revenues to grow at CAGR of 12% in FY15-18E
2770.7
2086.52485.3
2877.33089.8
3375.93777.6
4338.8
0.0
1000.0
2000.0
3000.0
4000.0
5000.0
FY11 FY12 FY13 FY14 FY15 FY16E FY17E FY18E
Revenues
(| c
rore
)
Source: Company, ICICIdirect.com Research
Biocon operates through five broad business verticals - 1) small molecules, 2) research services, 3) branded formulations, 4) biosimilars and 5) novel molecules. However, for reporting purpose, Biocon classifies its operations into two segments i.e. biopharma and research services. While Biopharma constitutes ~71% of overall sales, services account for the rest of the pie. Except for research services, all other business verticals have been grouped under the biopharma category. Small molecules- It comprises a portfolio of active pharmaceutical ingredients (APIs), including generics like statins, immunosuppressants, peptides, ophthalmics and other therapeutic products. It also includes proprietary Products like Fidaxomicin (anti-infectives). This vertical is due for major reshuffling due to persistent pricing pressure in some products, especially statins. The company is now exploring fewer opportunities but with higher profitability in this segment such as moving into formulations and filing own ANDAs, 505 (b)(2) filings etc. This segment constitutes 50-55% of the overall sales. Biosimilars - This segment has specifically been carved out to tap numerous biosimilar opportunities especially in the next three to five
ICICI Securities Ltd | Retail Equity Research Page 4
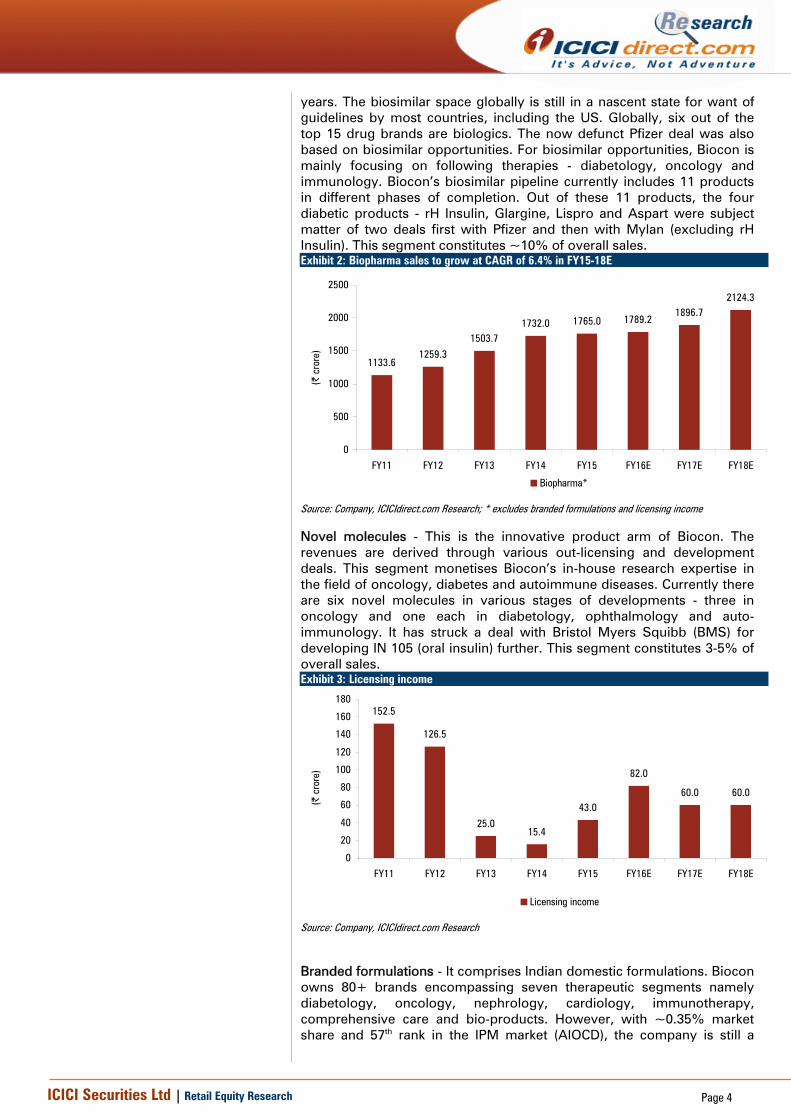
years. The biosimilar space globally is still in a nascent state for want of guidelines by most countries, including the US. Globally, six out of the top 15 drug brands are biologics. The now defunct Pfizer deal was also based on biosimilar opportunities. For biosimilar opportunities, Biocon is mainly focusing on following therapies - diabetology, oncology and immunology. Biocon’s biosimilar pipeline currently includes 11 products in different phases of completion. Out of these 11 products, the four diabetic products - rH Insulin, Glargine, Lispro and Aspart were subject matter of two deals first with Pfizer and then with Mylan (excluding rH Insulin). This segment constitutes ~10% of overall sales. Exhibit 2: Biopharma sales to grow at CAGR of 6.4% in FY15-18E
1133.61259.3
1503.71732.0 1765.0 1789.2
1896.72124.3
0
500
1000
1500
2000
2500
FY11 FY12 FY13 FY14 FY15 FY16E FY17E FY18E
(| c
rore
)
Biopharma*
Source: Company, ICICIdirect.com Research; * excludes branded formulations and licensing income
Novel molecules - This is the innovative product arm of Biocon. The revenues are derived through various out-licensing and development deals. This segment monetises Biocon’s in-house research expertise in the field of oncology, diabetes and autoimmune diseases. Currently there are six novel molecules in various stages of developments - three in oncology and one each in diabetology, ophthalmology and auto-immunology. It has struck a deal with Bristol Myers Squibb (BMS) for developing IN 105 (oral insulin) further. This segment constitutes 3-5% of overall sales. Exhibit 3: Licensing income
152.5
126.5
25.015.4
43.0
82.0
60.0 60.0
0
20
40
60
80
100
120
140
160
180
FY11 FY12 FY13 FY14 FY15 FY16E FY17E FY18E
(| c
rore
)
Licensing income
Source: Company, ICICIdirect.com Research
Branded formulations - It comprises Indian domestic formulations. Biocon owns 80+ brands encompassing seven therapeutic segments namely diabetology, oncology, nephrology, cardiology, immunotherapy, comprehensive care and bio-products. However, with ~0.35% market share and 57th rank in the IPM market (AIOCD), the company is still a
ICICI Securities Ltd | Retail Equity Research Page 5
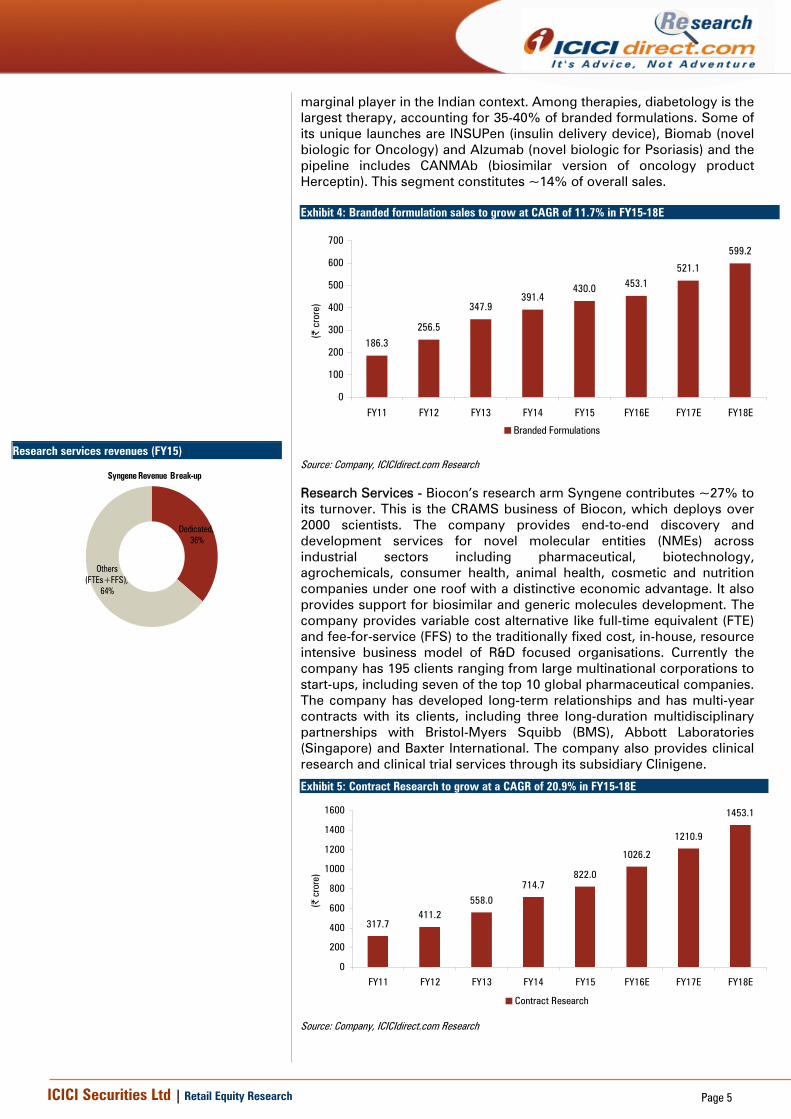
marginal player in the Indian context. Among therapies, diabetology is the largest therapy, accounting for 35-40% of branded formulations. Some of its unique launches are INSUPen (insulin delivery device), Biomab (novel biologic for Oncology) and Alzumab (novel biologic for Psoriasis) and the pipeline includes CANMAb (biosimilar version of oncology product Herceptin). This segment constitutes ~14% of overall sales. Exhibit 4: Branded formulation sales to grow at CAGR of 11.7% in FY15-18E
186.3
256.5
347.9391.4
430.0 453.1521.1
599.2
0
100
200
300
400
500
600
700
FY11 FY12 FY13 FY14 FY15 FY16E FY17E FY18E
(| c
rore
)
Branded Formulations
Source: Company, ICICIdirect.com Research
Research Services - Biocon’s research arm Syngene contributes ~27% to its turnover. This is the CRAMS business of Biocon, which deploys over 2000 scientists. The company provides end-to-end discovery and development services for novel molecular entities (NMEs) across industrial sectors including pharmaceutical, biotechnology, agrochemicals, consumer health, animal health, cosmetic and nutrition companies under one roof with a distinctive economic advantage. It also provides support for biosimilar and generic molecules development. The company provides variable cost alternative like full-time equivalent (FTE) and fee-for-service (FFS) to the traditionally fixed cost, in-house, resource intensive business model of R&D focused organisations. Currently the company has 195 clients ranging from large multinational corporations to start-ups, including seven of the top 10 global pharmaceutical companies. The company has developed long-term relationships and has multi-year contracts with its clients, including three long-duration multidisciplinary partnerships with Bristol-Myers Squibb (BMS), Abbott Laboratories (Singapore) and Baxter International. The company also provides clinical research and clinical trial services through its subsidiary Clinigene.
Research services revenues (FY15)
Dedicated, 36%
Others (FTEs+FFS),
64%
Syngene Revenue Break-up
Exhibit 5: Contract Research to grow at a CAGR of 20.9% in FY15-18E
317.7411.2
558.0
714.7822.0
1026.2
1210.9
1453.1
0
200
400
600
800
1000
1200
1400
1600
FY11 FY12 FY13 FY14 FY15 FY16E FY17E FY18E
(| c
rore
)
Contract Research
Source: Company, ICICIdirect.com Research
ICICI Securities Ltd | Retail Equity Research Page 6
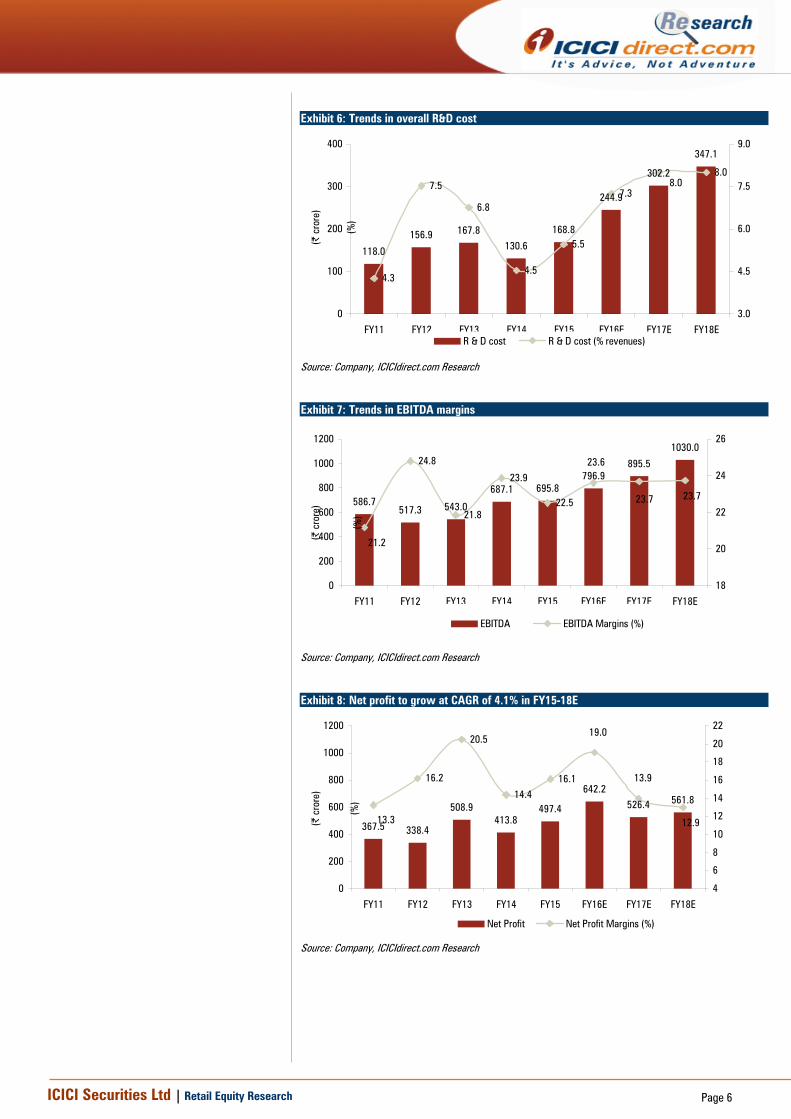
Exhibit 6: Trends in overall R&D cost
118.0
156.9 167.8130.6
168.8
244.9
302.2
347.1
4.3
7.5
6.8
4.5
5.5
7.3
8.08.0
0
100
200
300
400
FY11 FY12 FY13 FY14 FY15 FY16E FY17E FY18E(|
cro
re)
3.0
4.5
6.0
7.5
9.0
(%)
R & D cost R & D cost (% revenues)
Source: Company, ICICIdirect.com Research
Exhibit 7: Trends in EBITDA margins
586.7517.3 543.0
687.1 695.8796.9
895.5
1030.024.8
21.8
23.9
22.5
21.2
23.6
23.7 23.7
0
200
400
600
800
1000
1200
FY11 FY12 FY13 FY14 FY15 FY16E FY17E FY18E
(| c
rore
)
18
20
22
24
26
(%)
EBITDA EBITDA Margins (%)
Source: Company, ICICIdirect.com Research
Exhibit 8: Net profit to grow at CAGR of 4.1% in FY15-18E
367.5 338.4
508.9413.8
497.4
642.2526.4 561.8
16.2
20.5
14.416.1
13.3
19.0
13.9
12.9
0
200
400
600
800
1000
1200
FY11 FY12 FY13 FY14 FY15 FY16E FY17E FY18E
(| c
rore
)
4
6
8
10
12
14
16
18
20
22
(%)
Net Profit Net Profit Margins (%)
Source: Company, ICICIdirect.com Research
ICICI Securities Ltd | Retail Equity Research Page 7
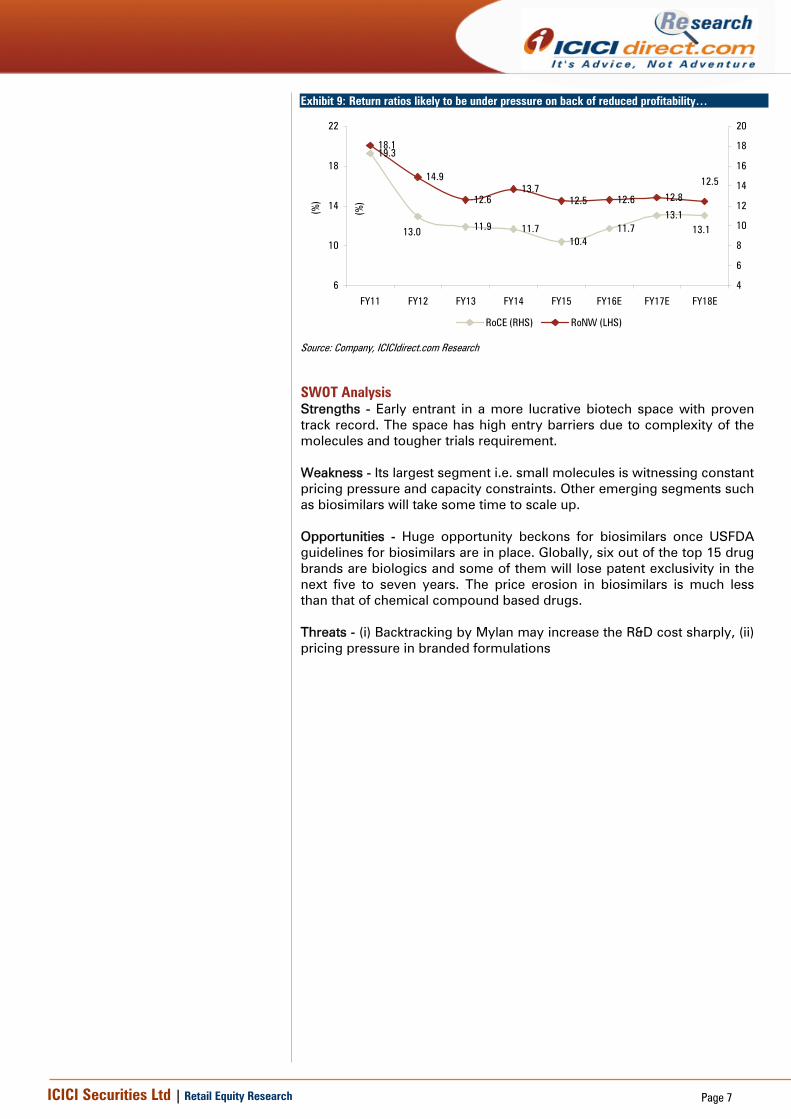
Exhibit 9: Return ratios likely to be under pressure on back of reduced profitability…
19.3
11.9 11.710.4
11.713.1
13.0 13.1
18.1
14.9
12.613.7
12.5 12.6 12.8
12.5
6
10
14
18
22
FY11 FY12 FY13 FY14 FY15 FY16E FY17E FY18E(%
)
4
6
8
10
12
14
16
18
20
(%)
RoCE (RHS) RoNW (LHS)
Source: Company, ICICIdirect.com Research
SWOT Analysis Strengths - Early entrant in a more lucrative biotech space with proven track record. The space has high entry barriers due to complexity of the molecules and tougher trials requirement. Weakness - Its largest segment i.e. small molecules is witnessing constant pricing pressure and capacity constraints. Other emerging segments such as biosimilars will take some time to scale up. Opportunities - Huge opportunity beckons for biosimilars once USFDA guidelines for biosimilars are in place. Globally, six out of the top 15 drug brands are biologics and some of them will lose patent exclusivity in the next five to seven years. The price erosion in biosimilars is much less than that of chemical compound based drugs. Threats - (i) Backtracking by Mylan may increase the R&D cost sharply, (ii) pricing pressure in branded formulations
ICICI Securities Ltd | Retail Equity Research Page 8
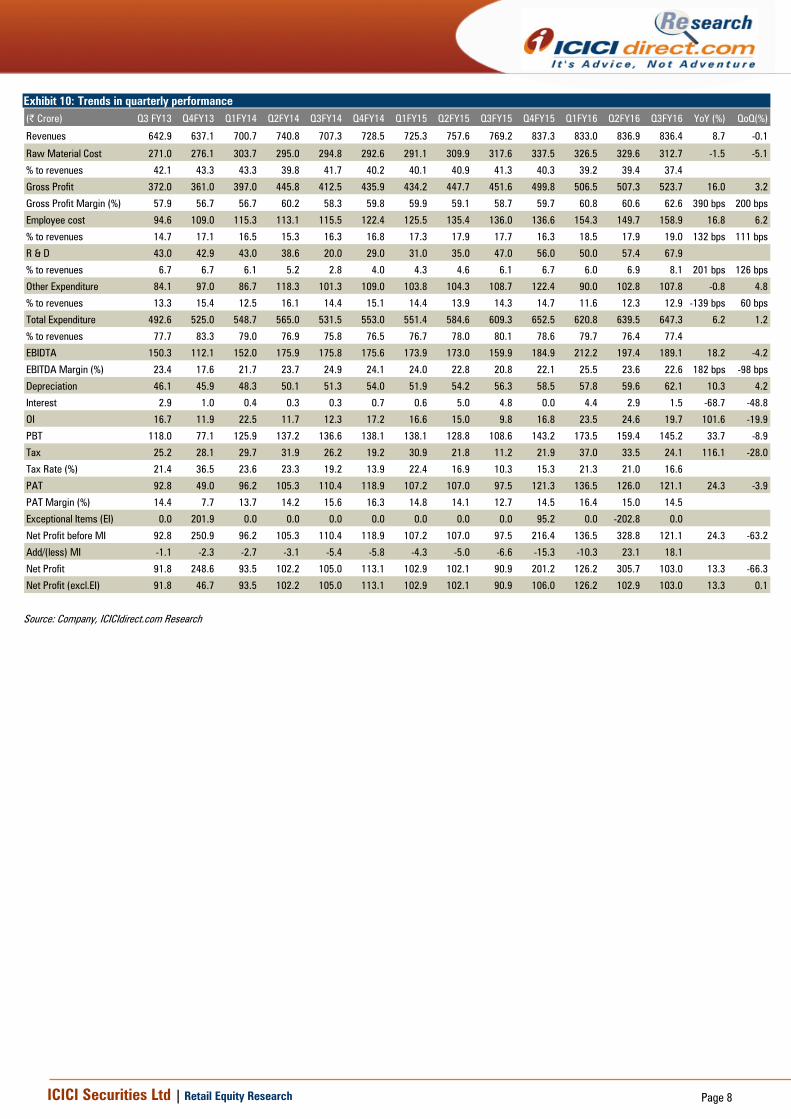
Exhibit 10: Trends in quarterly performance (| Crore) Q3 FY13 Q4FY13 Q1FY14 Q2FY14 Q3FY14 Q4FY14 Q1FY15 Q2FY15 Q3FY15 Q4FY15 Q1FY16 Q2FY16 Q3FY16 YoY (%) QoQ(%)
Revenues 642.9 637.1 700.7 740.8 707.3 728.5 725.3 757.6 769.2 837.3 833.0 836.9 836.4 8.7 -0.1
Raw Material Cost 271.0 276.1 303.7 295.0 294.8 292.6 291.1 309.9 317.6 337.5 326.5 329.6 312.7 -1.5 -5.1
% to revenues 42.1 43.3 43.3 39.8 41.7 40.2 40.1 40.9 41.3 40.3 39.2 39.4 37.4
Gross Profit 372.0 361.0 397.0 445.8 412.5 435.9 434.2 447.7 451.6 499.8 506.5 507.3 523.7 16.0 3.2
Gross Profit Margin (%) 57.9 56.7 56.7 60.2 58.3 59.8 59.9 59.1 58.7 59.7 60.8 60.6 62.6 390 bps 200 bps
Employee cost 94.6 109.0 115.3 113.1 115.5 122.4 125.5 135.4 136.0 136.6 154.3 149.7 158.9 16.8 6.2
% to revenues 14.7 17.1 16.5 15.3 16.3 16.8 17.3 17.9 17.7 16.3 18.5 17.9 19.0 132 bps 111 bps
R & D 43.0 42.9 43.0 38.6 20.0 29.0 31.0 35.0 47.0 56.0 50.0 57.4 67.9
% to revenues 6.7 6.7 6.1 5.2 2.8 4.0 4.3 4.6 6.1 6.7 6.0 6.9 8.1 201 bps 126 bps
Other Expenditure 84.1 97.0 86.7 118.3 101.3 109.0 103.8 104.3 108.7 122.4 90.0 102.8 107.8 -0.8 4.8
% to revenues 13.3 15.4 12.5 16.1 14.4 15.1 14.4 13.9 14.3 14.7 11.6 12.3 12.9 -139 bps 60 bps
Total Expenditure 492.6 525.0 548.7 565.0 531.5 553.0 551.4 584.6 609.3 652.5 620.8 639.5 647.3 6.2 1.2
% to revenues 77.7 83.3 79.0 76.9 75.8 76.5 76.7 78.0 80.1 78.6 79.7 76.4 77.4
EBIDTA 150.3 112.1 152.0 175.9 175.8 175.6 173.9 173.0 159.9 184.9 212.2 197.4 189.1 18.2 -4.2
EBITDA Margin (%) 23.4 17.6 21.7 23.7 24.9 24.1 24.0 22.8 20.8 22.1 25.5 23.6 22.6 182 bps -98 bps
Depreciation 46.1 45.9 48.3 50.1 51.3 54.0 51.9 54.2 56.3 58.5 57.8 59.6 62.1 10.3 4.2
Interest 2.9 1.0 0.4 0.3 0.3 0.7 0.6 5.0 4.8 0.0 4.4 2.9 1.5 -68.7 -48.8
OI 16.7 11.9 22.5 11.7 12.3 17.2 16.6 15.0 9.8 16.8 23.5 24.6 19.7 101.6 -19.9
PBT 118.0 77.1 125.9 137.2 136.6 138.1 138.1 128.8 108.6 143.2 173.5 159.4 145.2 33.7 -8.9
Tax 25.2 28.1 29.7 31.9 26.2 19.2 30.9 21.8 11.2 21.9 37.0 33.5 24.1 116.1 -28.0
Tax Rate (%) 21.4 36.5 23.6 23.3 19.2 13.9 22.4 16.9 10.3 15.3 21.3 21.0 16.6
PAT 92.8 49.0 96.2 105.3 110.4 118.9 107.2 107.0 97.5 121.3 136.5 126.0 121.1 24.3 -3.9
PAT Margin (%) 14.4 7.7 13.7 14.2 15.6 16.3 14.8 14.1 12.7 14.5 16.4 15.0 14.5
Exceptional Items (EI) 0.0 201.9 0.0 0.0 0.0 0.0 0.0 0.0 0.0 95.2 0.0 -202.8 0.0
Net Profit before MI 92.8 250.9 96.2 105.3 110.4 118.9 107.2 107.0 97.5 216.4 136.5 328.8 121.1 24.3 -63.2
Add/(less) MI -1.1 -2.3 -2.7 -3.1 -5.4 -5.8 -4.3 -5.0 -6.6 -15.3 -10.3 23.1 18.1
Net Profit 91.8 248.6 93.5 102.2 105.0 113.1 102.9 102.1 90.9 201.2 126.2 305.7 103.0 13.3 -66.3
Net Profit (excl.EI) 91.8 46.7 93.5 102.2 105.0 113.1 102.9 102.1 90.9 106.0 126.2 102.9 103.0 13.3 0.1
Source: Company, ICICIdirect.com Research
ICICI Securities Ltd | Retail Equity Research Page 9
Conference call highlights
• The company plans to file 20-25 ANDAs in the next few years. It expects to receive ANDA approvals from H2FY17
• It plans to file four biosimilars Insulin Glargine, Trastuzumab, Pegfilgrastim and Adalimumab with the USFDA in CY16
• As per the management, US clinical trials for biosimilar products will account for US$50-100 million of expenses in developed markets
• The company plans Insulin supply to emerging markets from Malaysia plant in H2FY17.
• NeoBiocon launched Jalra (Vildagliptin) and Jalra M (Vildagliptin+ Metformin) for diabetes in UAE, in collaboration with Novartis Middle East FZE
• The company expects R&D spend to be 10-12% of biopharma sales
• Branded formulations business strengthened its virology portfolio with the launch of Cimivir-L, a once-a-day oral therapy for Hepatitis C, in India. The company plans to launch two more combinations from the virology portfolio.
• The company plans to launch Transtuzumab in three of the top fifteen emerging markets in the start of FY17. According to the management, top 15 emerging markets account for 90-95% of emerging market pharmaceutical sales.
• The company has spent | 520 crore in capex till Q3FY16 (YTD) on account of Phase I of Malaysia facility and Syngene / Biocon expansion. The company has guided for maintenance capex of | 100-115 crore for FY17E.
• It is also developing one oral solid dosage facility in Bangalore for a capex of ~| 150 crore. The company also plans to develop monoclonal anti-body plant in Bangalore
• The total capex incurred on Malaysia plant was ~US$200 million on plant and machinery and US$30-40 million on maintenance
• The company witnessed eight successful USFDA inspections in the past two years at all its USFDA approved plants. Two API facilities in Bangalore were inspected during the quarter. One of the facilities received EIR while the other is still awaiting an EIR
• CANMAb (Trastuzumab) has a market share of more than 30% in domestic market.
• The company has completed Phase I study for Insulin Tregopil in the US with BMS as its partner. However, due to divestment of BMS diabetes franchise to AstraZeneca the company is currently pursuing trials on its own and looking for a new partner.
Syngene conference call Highlights
• Syngene saw growth of 23% in Q3FY16 revenues to | 280.4 crore on the back of a sustained performance by all of its three business verticals – dedicated centres, discovery services as well as development & manufacturing services.
• EBITDA margins for Q3FY16 were seen at 33.5%. Net profit grew 31.3% YoY to | 58.8 crore
• During the quarter, the company had one USFDA inspection of its clinical development facility, which was successfully cleared with no 483s or major observations. Syngene has now successfully cleared five USFDA audits within the last three years.
• The phase I of Syngene Research Centre, comprising 50,000 sq ft lab space, is scheduled to be commissioned in Q1FY17. When fully commissioned, this centre will be a 200,000 sq ft research
ICICI Securities Ltd | Retail Equity Research Page 10
facility and will support integrated discovery programmes in chemistry and biology
• The company has maintained its revenue guidance of US$250 million in FY18
• Constant currency growth was ~17% in Q3FY16 and ~21% in 9MFY16
• Dedicated centre contribution was 34% in 9MFY16 • The company planned a US$50 million capex for the research
centre that will be commissioned over FY17 and FY18 in phases. • The capex for Mangalore facility is planned to be ~US$100 million
over the next three years • Two out of the three late stage molecules for its clients have
received commercialisation approval from USFDA. The company started supply of intermediaries for these products. The third product stands terminated
• The company has guided for | 50 crore for Q4FY16. It has already spent | 250 crore YTD
• Incremental gross block of | 250 crore was on account of capex allotment for Mangalore facility (bought land for US$10 million), research centre, chemical and biological plants and expansion of Bangalore facility
• The forex hedging loss of | 7 crore in Q3FY16 was registered in other expenses. The hedge rate in 3QFY16 was | 63/$. The company has fully hedged its FY17 revenues at | 66-67/$
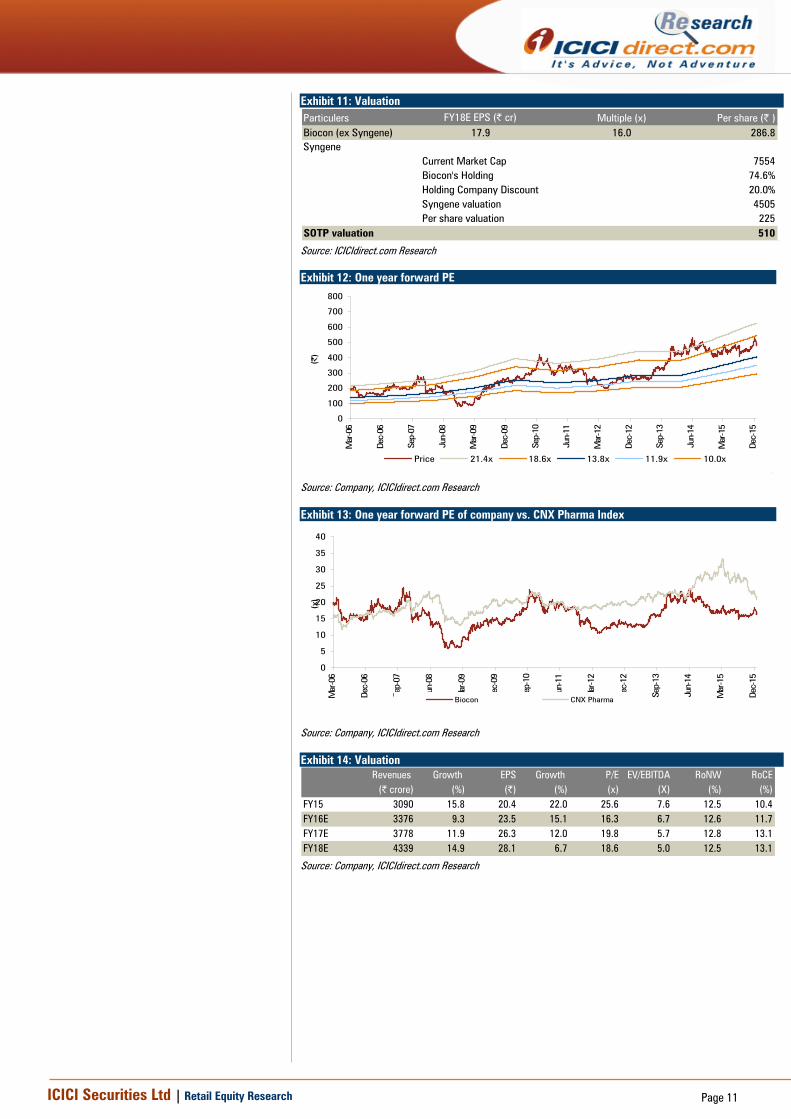
Valuation Syngene continues to witness strong growth while the biopharma segment growth remained subdued due to prolonged restructuring, pricing pressure and capacity constraints. We do not see any major trigger in the biopharma space till FY17. However, developments on the biosimilars pipeline provide some encouragement as it will pave way for the launches in key emerging markets in the medium term. Given the different fortunes for different segments, we continue to adopt SOTP methodology for valuation. Our SOTP target price is | 510.
ICICI Securities Ltd | Retail Equity Research Page 11
Exhibit 11: Valuation Particulers FY18E EPS (| cr) Multiple (x) Per share (| )Biocon (ex Syngene) 17.9 16.0 286.8Syngene
Current Market Cap 7554Biocon's Holding 74.6%Holding Company Discount 20.0%Syngene valuation 4505Per share valuation 225
SOTP valuation 510 [
Source: ICICIdirect.com Research
Exhibit 12: One year forward PE
0
100
200
300
400
500
600
700
800
Mar
-06
Dec-
06
Sep-
07
Jun-
08
Mar
-09
Dec-
09
Sep-
10
Jun-
11
Mar
-12
Dec-
12
Sep-
13
Jun-
14
Mar
-15
Dec-
15
(|)
Price 21.4x 18.6x 13.8x 11.9x 10.0x[
Source: Company, ICICIdirect.com Research
Exhibit 13: One year forward PE of company vs. CNX Pharma Index
0
5
10
15
20
25
30
35
40
Mar
-06
Dec-
06
Sep-
07
Jun-
08
Mar
-09
Dec-
09
Sep-
10
Jun-
11
Mar
-12
Dec-
12
Sep-
13
Jun-
14
Mar
-15
Dec-
15
(x)
Biocon CNX Pharma
Source: Company, ICICIdirect.com Research
Exhibit 14: Valuation Revenues Growth EPS Growth P/E EV/EBITDA RoNW RoCE
(| crore) (%) (|) (%) (x) (X) (%) (%)FY15 3090 15.8 20.4 22.0 25.6 7.6 12.5 10.4FY16E 3376 9.3 23.5 15.1 16.3 6.7 12.6 11.7FY17E 3778 11.9 26.3 12.0 19.8 5.7 12.8 13.1FY18E 4339 14.9 28.1 6.7 18.6 5.0 12.5 13.1
Source: Company, ICICIdirect.com Research
ICICI Securities Ltd | Retail Equity Research Page 12
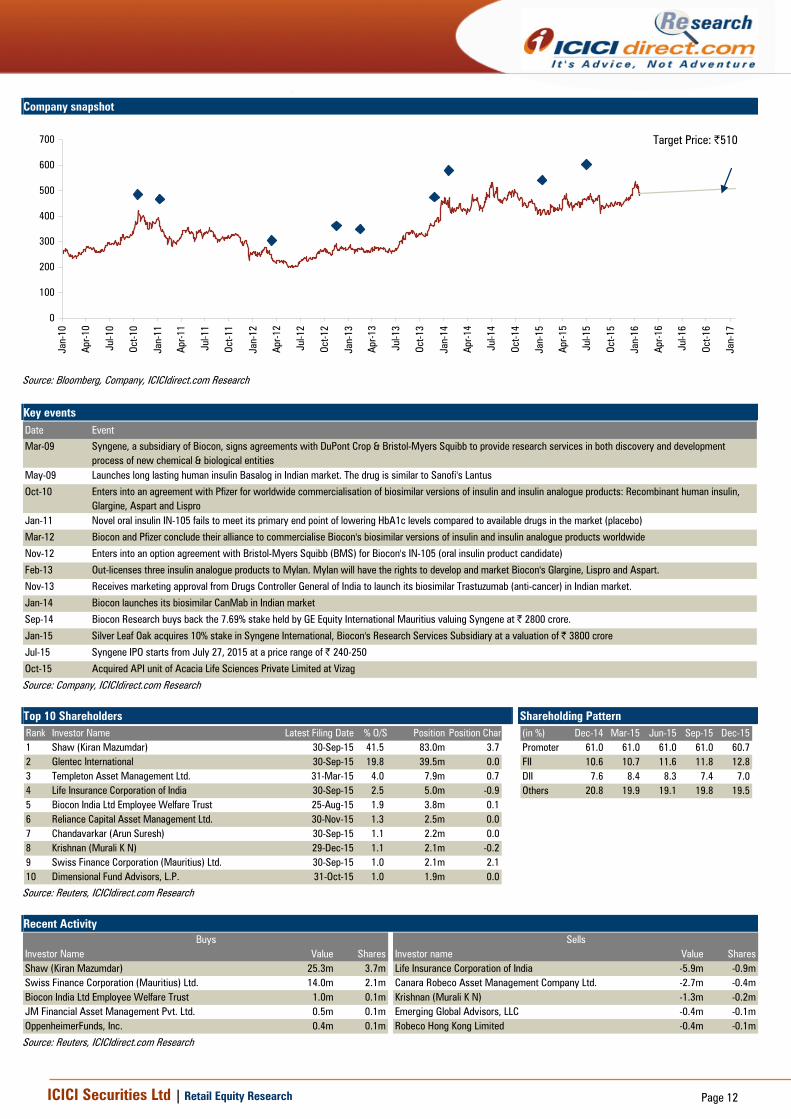
Company snapshot
0
100
200
300
400
500
600
700
Jan-
10
Apr-1
0
Jul-1
0
Oct-1
0
Jan-
11
Apr-1
1
Jul-1
1
Oct-1
1
Jan-
12
Apr-1
2
Jul-1
2
Oct-1
2
Jan-
13
Apr-1
3
Jul-1
3
Oct-1
3
Jan-
14
Apr-1
4
Jul-1
4
Oct-1
4
Jan-
15
Apr-1
5
Jul-1
5
Oct-1
5
Jan-
16
Apr-1
6
Jul-1
6
Oct-1
6
Jan-
17
Target Price: |510
Source: Bloomberg, Company, ICICIdirect.com Research Key events Date Event
Mar-09 Syngene, a subsidiary of Biocon, signs agreements with DuPont Crop & Bristol-Myers Squibb to provide research services in both discovery and development process of new chemical & biological entities
May-09 Launches long lasting human insulin Basalog in Indian market. The drug is similar to Sanofi's Lantus
Oct-10 Enters into an agreement with Pfizer for worldwide commercialisation of biosimilar versions of insulin and insulin analogue products: Recombinant human insulin, Glargine, Aspart and Lispro
Jan-11 Novel oral insulin IN-105 fails to meet its primary end point of lowering HbA1c levels compared to available drugs in the market (placebo)
Mar-12 Biocon and Pfizer conclude their alliance to commercialise Biocon's biosimilar versions of insulin and insulin analogue products worldwide
Nov-12 Enters into an option agreement with Bristol-Myers Squibb (BMS) for Biocon's IN-105 (oral insulin product candidate)
Feb-13 Out-licenses three insulin analogue products to Mylan. Mylan will have the rights to develop and market Biocon's Glargine, Lispro and Aspart.
Nov-13 Receives marketing approval from Drugs Controller General of India to launch its biosimilar Trastuzumab (anti-cancer) in Indian market.
Jan-14 Biocon launches its biosimilar CanMab in Indian market
Sep-14 Biocon Research buys back the 7.69% stake held by GE Equity International Mauritius valuing Syngene at | 2800 crore.
Jan-15 Silver Leaf Oak acquires 10% stake in Syngene International, Biocon's Research Services Subsidiary at a valuation of | 3800 crore
Jul-15 Syngene IPO starts from July 27, 2015 at a price range of | 240-250
Oct-15 Acquired API unit of Acacia Life Sciences Private Limited at Vizag
Source: Company, ICICIdirect.com Research Top 10 Shareholders Shareholding Pattern Rank Investor Name Latest Filing Date % O/S Position Position Chan1 Shaw (Kiran Mazumdar) 30-Sep-15 41.5 83.0m 3.72 Glentec International 30-Sep-15 19.8 39.5m 0.03 Templeton Asset Management Ltd. 31-Mar-15 4.0 7.9m 0.74 Life Insurance Corporation of India 30-Sep-15 2.5 5.0m -0.95 Biocon India Ltd Employee Welfare Trust 25-Aug-15 1.9 3.8m 0.16 Reliance Capital Asset Management Ltd. 30-Nov-15 1.3 2.5m 0.07 Chandavarkar (Arun Suresh) 30-Sep-15 1.1 2.2m 0.08 Krishnan (Murali K N) 29-Dec-15 1.1 2.1m -0.29 Swiss Finance Corporation (Mauritius) Ltd. 30-Sep-15 1.0 2.1m 2.110 Dimensional Fund Advisors, L.P. 31-Oct-15 1.0 1.9m 0.0
(in %) Dec-14 Mar-15 Jun-15 Sep-15 Dec-15Promoter 61.0 61.0 61.0 61.0 60.7FII 10.6 10.7 11.6 11.8 12.8DII 7.6 8.4 8.3 7.4 7.0Others 20.8 19.9 19.1 19.8 19.5
Source: Reuters, ICICIdirect.com Research Recent Activity
Investor Name Value Shares Investor name Value SharesShaw (Kiran Mazumdar) 25.3m 3.7m Life Insurance Corporation of India -5.9m -0.9mSwiss Finance Corporation (Mauritius) Ltd. 14.0m 2.1m Canara Robeco Asset Management Company Ltd. -2.7m -0.4mBiocon India Ltd Employee Welfare Trust 1.0m 0.1m Krishnan (Murali K N) -1.3m -0.2mJM Financial Asset Management Pvt. Ltd. 0.5m 0.1m Emerging Global Advisors, LLC -0.4m -0.1mOppenheimerFunds, Inc. 0.4m 0.1m Robeco Hong Kong Limited -0.4m -0.1m
Buys Sells
Source: Reuters, ICICIdirect.com Research
ICICI Securities Ltd | Retail Equity Research Page 13
.
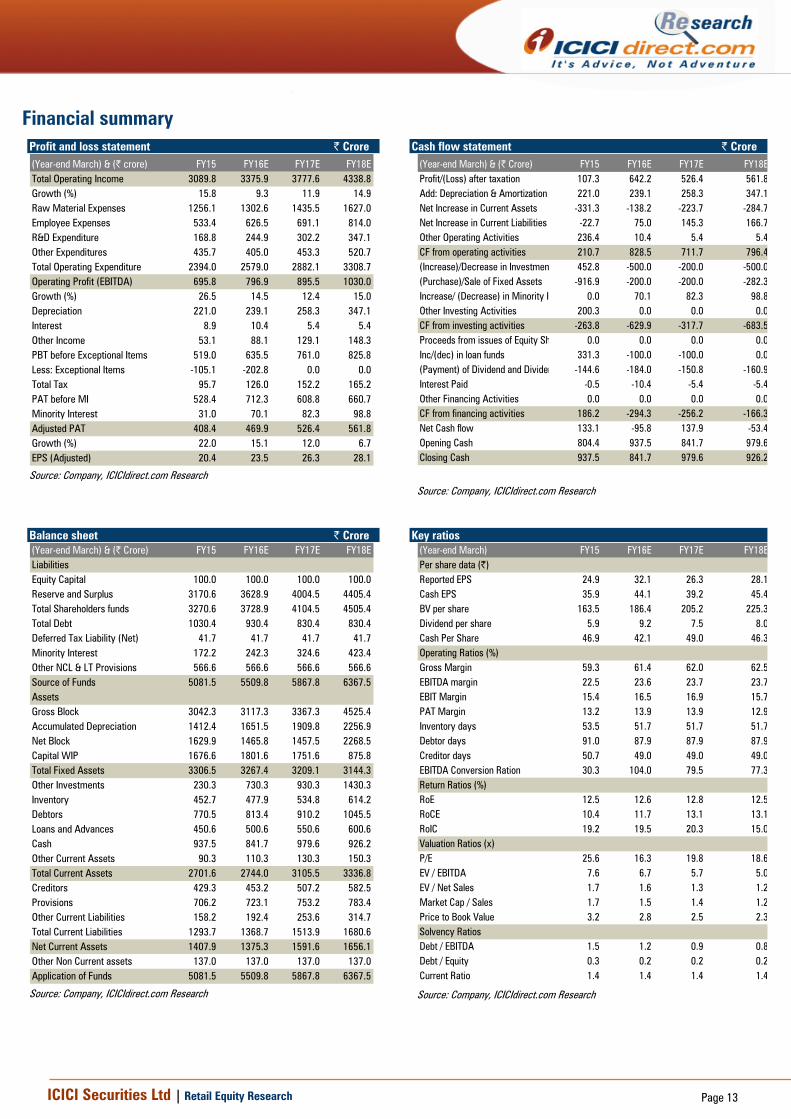
Financial summary
Profit and loss statement | Crore (Year-end March) & (| crore) FY15 FY16E FY17E FY18ETotal Operating Income 3089.8 3375.9 3777.6 4338.8Growth (%) 15.8 9.3 11.9 14.9Raw Material Expenses 1256.1 1302.6 1435.5 1627.0Employee Expenses 533.4 626.5 691.1 814.0R&D Expenditure 168.8 244.9 302.2 347.1Other Expenditures 435.7 405.0 453.3 520.7Total Operating Expenditure 2394.0 2579.0 2882.1 3308.7Operating Profit (EBITDA) 695.8 796.9 895.5 1030.0Growth (%) 26.5 14.5 12.4 15.0Depreciation 221.0 239.1 258.3 347.1Interest 8.9 10.4 5.4 5.4Other Income 53.1 88.1 129.1 148.3PBT before Exceptional Items 519.0 635.5 761.0 825.8Less: Exceptional Items -105.1 -202.8 0.0 0.0Total Tax 95.7 126.0 152.2 165.2PAT before MI 528.4 712.3 608.8 660.7Minority Interest 31.0 70.1 82.3 98.8Adjusted PAT 408.4 469.9 526.4 561.8Growth (%) 22.0 15.1 12.0 6.7EPS (Adjusted) 20.4 23.5 26.3 28.1
Source: Company, ICICIdirect.com Research
Cash flow statement | Crore (Year-end March) & (| Crore) FY15 FY16E FY17E FY18EProfit/(Loss) after taxation 107.3 642.2 526.4 561.8Add: Depreciation & Amortization 221.0 239.1 258.3 347.1Net Increase in Current Assets -331.3 -138.2 -223.7 -284.7Net Increase in Current Liabilities -22.7 75.0 145.3 166.7Other Operating Activities 236.4 10.4 5.4 5.4CF from operating activities 210.7 828.5 711.7 796.4(Increase)/Decrease in Investmen 452.8 -500.0 -200.0 -500.0(Purchase)/Sale of Fixed Assets -916.9 -200.0 -200.0 -282.3Increase/ (Decrease) in Minority I 0.0 70.1 82.3 98.8Other Investing Activities 200.3 0.0 0.0 0.0CF from investing activities -263.8 -629.9 -317.7 -683.5Proceeds from issues of Equity Sh 0.0 0.0 0.0 0.0Inc/(dec) in loan funds 331.3 -100.0 -100.0 0.0(Payment) of Dividend and Dividen -144.6 -184.0 -150.8 -160.9Interest Paid -0.5 -10.4 -5.4 -5.4Other Financing Activities 0.0 0.0 0.0 0.0CF from financing activities 186.2 -294.3 -256.2 -166.3Net Cash flow 133.1 -95.8 137.9 -53.4Opening Cash 804.4 937.5 841.7 979.6Closing Cash 937.5 841.7 979.6 926.2
Source: Company, ICICIdirect.com Research
Balance sheet | Crore (Year-end March) & (| Crore) FY15 FY16E FY17E FY18ELiabilitiesEquity Capital 100.0 100.0 100.0 100.0Reserve and Surplus 3170.6 3628.9 4004.5 4405.4Total Shareholders funds 3270.6 3728.9 4104.5 4505.4Total Debt 1030.4 930.4 830.4 830.4Deferred Tax Liability (Net) 41.7 41.7 41.7 41.7Minority Interest 172.2 242.3 324.6 423.4Other NCL & LT Provisions 566.6 566.6 566.6 566.6Source of Funds 5081.5 5509.8 5867.8 6367.5AssetsGross Block 3042.3 3117.3 3367.3 4525.4Accumulated Depreciation 1412.4 1651.5 1909.8 2256.9Net Block 1629.9 1465.8 1457.5 2268.5Capital WIP 1676.6 1801.6 1751.6 875.8Total Fixed Assets 3306.5 3267.4 3209.1 3144.3Other Investments 230.3 730.3 930.3 1430.3Inventory 452.7 477.9 534.8 614.2Debtors 770.5 813.4 910.2 1045.5Loans and Advances 450.6 500.6 550.6 600.6Cash 937.5 841.7 979.6 926.2Other Current Assets 90.3 110.3 130.3 150.3Total Current Assets 2701.6 2744.0 3105.5 3336.8Creditors 429.3 453.2 507.2 582.5Provisions 706.2 723.1 753.2 783.4Other Current Liabilities 158.2 192.4 253.6 314.7Total Current Liabilities 1293.7 1368.7 1513.9 1680.6Net Current Assets 1407.9 1375.3 1591.6 1656.1Other Non Current assets 137.0 137.0 137.0 137.0Application of Funds 5081.5 5509.8 5867.8 6367.5
Source: Company, ICICIdirect.com Research
Key ratios (Year-end March) FY15 FY16E FY17E FY18EPer share data (|)Reported EPS 24.9 32.1 26.3 28.1Cash EPS 35.9 44.1 39.2 45.4BV per share 163.5 186.4 205.2 225.3Dividend per share 5.9 9.2 7.5 8.0Cash Per Share 46.9 42.1 49.0 46.3Operating Ratios (%)Gross Margin 59.3 61.4 62.0 62.5EBITDA margin 22.5 23.6 23.7 23.7EBIT Margin 15.4 16.5 16.9 15.7PAT Margin 13.2 13.9 13.9 12.9Inventory days 53.5 51.7 51.7 51.7Debtor days 91.0 87.9 87.9 87.9Creditor days 50.7 49.0 49.0 49.0EBITDA Conversion Ration 30.3 104.0 79.5 77.3Return Ratios (%)RoE 12.5 12.6 12.8 12.5RoCE 10.4 11.7 13.1 13.1RoIC 19.2 19.5 20.3 15.0Valuation Ratios (x)P/E 25.6 16.3 19.8 18.6EV / EBITDA 7.6 6.7 5.7 5.0EV / Net Sales 1.7 1.6 1.3 1.2Market Cap / Sales 1.7 1.5 1.4 1.2Price to Book Value 3.2 2.8 2.5 2.3Solvency RatiosDebt / EBITDA 1.5 1.2 0.9 0.8Debt / Equity 0.3 0.2 0.2 0.2Current Ratio 1.4 1.4 1.4 1.4
Source: Company, ICICIdirect.com Research
ICICI Securities Ltd | Retail Equity Research Page 14
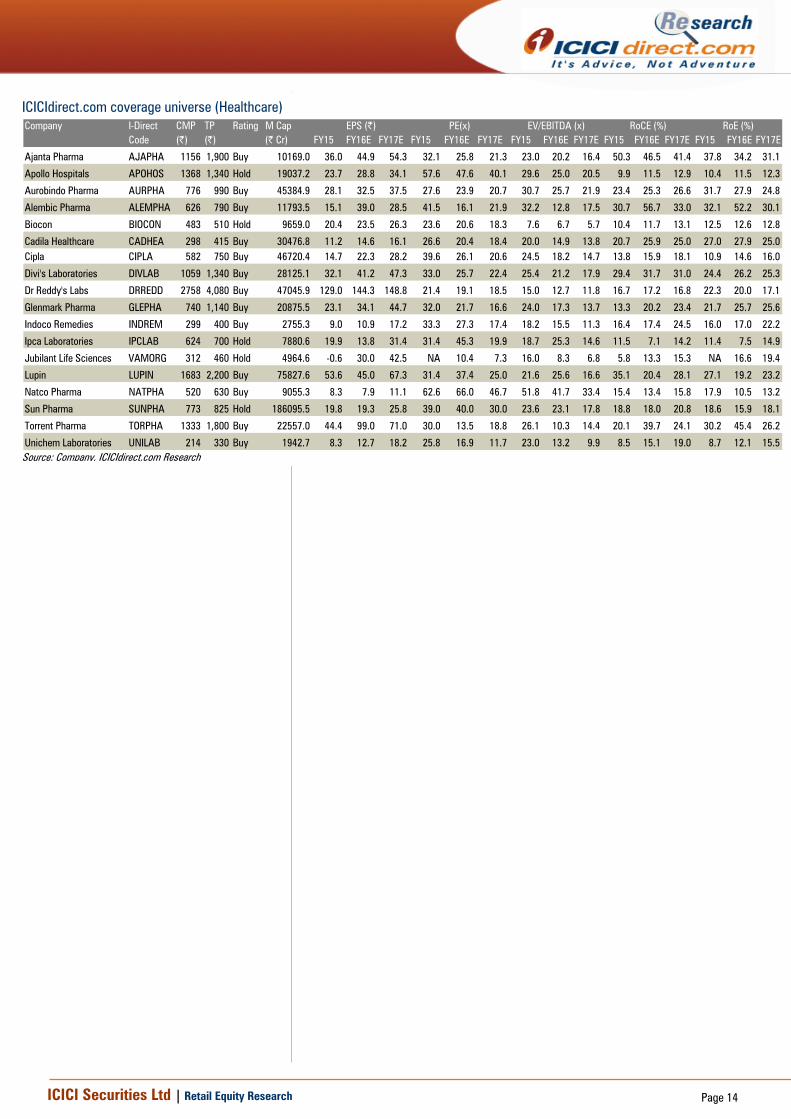
ICICIdirect.com coverage universe (Healthcare) Company I-Direct CMP TP Rating M Cap
Code (|) (|) (| Cr) FY15 FY16E FY17E FY15 FY16E FY17E FY15 FY16E FY17E FY15 FY16E FY17E FY15 FY16E FY17E
Ajanta Pharma AJAPHA 1156 1,900 Buy 10169.0 36.0 44.9 54.3 32.1 25.8 21.3 23.0 20.2 16.4 50.3 46.5 41.4 37.8 34.2 31.1
Apollo Hospitals APOHOS 1368 1,340 Hold 19037.2 23.7 28.8 34.1 57.6 47.6 40.1 29.6 25.0 20.5 9.9 11.5 12.9 10.4 11.5 12.3
Aurobindo Pharma AURPHA 776 990 Buy 45384.9 28.1 32.5 37.5 27.6 23.9 20.7 30.7 25.7 21.9 23.4 25.3 26.6 31.7 27.9 24.8
Alembic Pharma ALEMPHA 626 790 Buy 11793.5 15.1 39.0 28.5 41.5 16.1 21.9 32.2 12.8 17.5 30.7 56.7 33.0 32.1 52.2 30.1
Biocon BIOCON 483 510 Hold 9659.0 20.4 23.5 26.3 23.6 20.6 18.3 7.6 6.7 5.7 10.4 11.7 13.1 12.5 12.6 12.8
Cadila Healthcare CADHEA 298 415 Buy 30476.8 11.2 14.6 16.1 26.6 20.4 18.4 20.0 14.9 13.8 20.7 25.9 25.0 27.0 27.9 25.0Cipla CIPLA 582 750 Buy 46720.4 14.7 22.3 28.2 39.6 26.1 20.6 24.5 18.2 14.7 13.8 15.9 18.1 10.9 14.6 16.0
Divi's Laboratories DIVLAB 1059 1,340 Buy 28125.1 32.1 41.2 47.3 33.0 25.7 22.4 25.4 21.2 17.9 29.4 31.7 31.0 24.4 26.2 25.3
Dr Reddy's Labs DRREDD 2758 4,080 Buy 47045.9 129.0 144.3 148.8 21.4 19.1 18.5 15.0 12.7 11.8 16.7 17.2 16.8 22.3 20.0 17.1
Glenmark Pharma GLEPHA 740 1,140 Buy 20875.5 23.1 34.1 44.7 32.0 21.7 16.6 24.0 17.3 13.7 13.3 20.2 23.4 21.7 25.7 25.6
Indoco Remedies INDREM 299 400 Buy 2755.3 9.0 10.9 17.2 33.3 27.3 17.4 18.2 15.5 11.3 16.4 17.4 24.5 16.0 17.0 22.2
Ipca Laboratories IPCLAB 624 700 Hold 7880.6 19.9 13.8 31.4 31.4 45.3 19.9 18.7 25.3 14.6 11.5 7.1 14.2 11.4 7.5 14.9
Jubilant Life Sciences VAMORG 312 460 Hold 4964.6 -0.6 30.0 42.5 NA 10.4 7.3 16.0 8.3 6.8 5.8 13.3 15.3 NA 16.6 19.4
Lupin LUPIN 1683 2,200 Buy 75827.6 53.6 45.0 67.3 31.4 37.4 25.0 21.6 25.6 16.6 35.1 20.4 28.1 27.1 19.2 23.2
Natco Pharma NATPHA 520 630 Buy 9055.3 8.3 7.9 11.1 62.6 66.0 46.7 51.8 41.7 33.4 15.4 13.4 15.8 17.9 10.5 13.2
Sun Pharma SUNPHA 773 825 Hold 186095.5 19.8 19.3 25.8 39.0 40.0 30.0 23.6 23.1 17.8 18.8 18.0 20.8 18.6 15.9 18.1
Torrent Pharma TORPHA 1333 1,800 Buy 22557.0 44.4 99.0 71.0 30.0 13.5 18.8 26.1 10.3 14.4 20.1 39.7 24.1 30.2 45.4 26.2
Unichem Laboratories UNILAB 214 330 Buy 1942.7 8.3 12.7 18.2 25.8 16.9 11.7 23.0 13.2 9.9 8.5 15.1 19.0 8.7 12.1 15.5
RoE (%)EPS (|) PE(x) EV/EBITDA (x) RoCE (%)
Source: Company, ICICIdirect.com Research
ICICI Securities Ltd | Retail Equity Research Page 15
RATING RATIONALE ICICIdirect.com endeavours to provide objective opinions and recommendations. ICICIdirect.com assigns ratings to its stocks according to their notional target price vs. current market price and then categorises them as Strong Buy, Buy, Hold and Sell. The performance horizon is two years unless specified and the notional target price is defined as the analysts' valuation for a stock. Strong Buy: >15%/20% for large caps/midcaps, respectively, with high conviction; Buy: >10%/15% for large caps/midcaps, respectively; Hold: Up to +/-10%; Sell: -10% or more;
Pankaj Pandey Head – Research [email protected]
ICICIdirect.com Research Desk, ICICI Securities Limited, 1st Floor, Akruti Trade Centre, Road No 7, MIDC, Andheri (East) Mumbai – 400 093
ICICI Securities Ltd | Retail Equity Research Page 16
ANALYST CERTIFICATION
We /I, Siddhant Khandekar, CA INTER and Mitesh Shah, MS (finance), Nandan Kamat MBA Research Analysts, authors and the names subscribed to this report, hereby certify that all of the views expressed in this research report accurately reflect our views about the subject issuer(s) or securities. We also certify that no part of our compensation was, is, or will be directly or indirectly related to the specific recommendation(s) or view(s) in this report.
Terms & conditions and other disclosures: ICICI Securities Limited is a SEBI registered Research Analyst having registration no. INH000000990. ICICI Securities Limited (ICICI Securities) is a full-service, integrated investment banking and is, inter alia, engaged in the business of stock brokering and distribution of financial products. ICICI Securities is a wholly-owned subsidiary of ICICI Bank which is India’s largest private sector bank and has its various subsidiaries engaged in businesses of housing finance, asset management, life insurance, general insurance, venture capital fund management, etc. (“associates”), the details in respect of which are available on www.icicibank.com. ICICI Securities is one of the leading merchant bankers/ underwriters of securities and participate in virtually all securities trading markets in India. We and our associates might have investment banking and other business relationship with a significant percentage of companies covered by our Investment Research Department. ICICI Securities generally prohibits its analysts, persons reporting to analysts and their relatives from maintaining a financial interest in the securities or derivatives of any companies that the analysts cover. The information and opinions in this report have been prepared by ICICI Securities and are subject to change without any notice. The report and information contained herein is strictly confidential and meant solely for the selected recipient and may not be altered in any way, transmitted to, copied or distributed, in part or in whole, to any other person or to the media or reproduced in any form, without prior written consent of ICICI Securities. While we would endeavour to update the information herein on a reasonable basis, ICICI Securities is under no obligation to update or keep the information current. Also, there may be regulatory, compliance or other reasons that may prevent ICICI Securities from doing so. Non-rated securities indicate that rating on a particular security has been suspended temporarily and such suspension is in compliance with applicable regulations and/or ICICI Securities policies, in circumstances where ICICI Securities might be acting in an advisory capacity to this company, or in certain other circumstances. This report is based on information obtained from public sources and sources believed to be reliable, but no independent verification has been made nor is its accuracy or completeness guaranteed. This report and information herein is solely for informational purpose and shall not be used or considered as an offer document or solicitation of offer to buy or sell or subscribe for securities or other financial instruments. Though disseminated to all the customers simultaneously, not all customers may receive this report at the same time. ICICI Securities will not treat recipients as customers by virtue of their receiving this report. Nothing in this report constitutes investment, legal, accounting and tax advice or a representation that any investment or strategy is suitable or appropriate to your specific circumstances. The securities discussed and opinions expressed in this report may not be suitable for all investors, who must make their own investment decisions, based on their own investment objectives, financial positions and needs of specific recipient. This may not be taken in substitution for the exercise of independent judgment by any recipient. The recipient should independently evaluate the investment risks. The value and return on investment may vary because of changes in interest rates, foreign exchange rates or any other reason. ICICI Securities accepts no liabilities whatsoever for any loss or damage of any kind arising out of the use of this report. Past performance is not necessarily a guide to future performance. Investors are advised to see Risk Disclosure Document to understand the risks associated before investing in the securities markets. Actual results may differ materially from those set forth in projections. Forward-looking statements are not predictions and may be subject to change without notice. ICICI Securities or its associates might have managed or co-managed public offering of securities for the subject company or might have been mandated by the subject company for any other assignment in the past twelve months. ICICI Securities or its associates might have received any compensation from the companies mentioned in the report during the period preceding twelve months from the date of this report for services in respect of managing or co-managing public offerings, corporate finance, investment banking or merchant banking, brokerage services or other advisory service in a merger or specific transaction. ICICI Securities or its associates might have received any compensation for products or services other than investment banking or merchant banking or brokerage services from the companies mentioned in the report in the past twelve months. ICICI Securities encourages independence in research report preparation and strives to minimize conflict in preparation of research report. ICICI Securities or its analysts did not receive any compensation or other benefits from the companies mentioned in the report or third party in connection with preparation of the research report. Accordingly, neither ICICI Securities nor Research Analysts have any material conflict of interest at the time of publication of this report. It is confirmed that Siddhant Khandekar, CA INTER and Mitesh Shah, MS (finance), Nandan Kamat MBA, Research Analysts of this report have not received any compensation from the companies mentioned in the report in the preceding twelve months. Compensation of our Research Analysts is not based on any specific merchant banking, investment banking or brokerage service transactions. ICICI Securities or its subsidiaries collectively or Research Analysts do not own 1% or more of the equity securities of the Company mentioned in the report as of the last day of the month preceding the publication of the research report. Since associates of ICICI Securities are engaged in various financial service businesses, they might have financial interests or beneficial ownership in various companies including the subject company/companies mentioned in this report. It is confirmed that Siddhant Khandekar, CA INTER and Mitesh Shah, MS (finance), Nandan Kamat MBA, Research Analysts do not serve as an officer, director or employee of the companies mentioned in the report. ICICI Securities may have issued other reports that are inconsistent with and reach different conclusion from the information presented in this report. Neither the Research Analysts nor ICICI Securities have been engaged in market making activity for the companies mentioned in the report. We submit that no material disciplinary action has been taken on ICICI Securities by any Regulatory Authority impacting Equity Research Analysis activities. This report is not directed or intended for distribution to, or use by, any person or entity who is a citizen or resident of or located in any locality, state, country or other jurisdiction, where such distribution, publication, availability or use would be contrary to law, regulation or which would subject ICICI Securities and affiliates to any registration or licensing requirement within such jurisdiction. The securities described herein may or may not be eligible for sale in all jurisdictions or to certain category of investors. Persons in whose possession this document may come are required to inform themselves of and to observe such restriction.