Embed Size (px)
Citation preview

Mary Zutter, M.D.
Professor of Pathology, Microbiology and Immunology
Vanderbilt University School of Medicine
Improving Cancer Diagnosis and Care: Patient Access to Oncologic Imaging and Pathology Expertise and
Technologies: A Workshop
Diagnostic Management Teams (DMT)The Vanderbilt University Medical School Experience
• Where we are today
• Vanderbilt “end-to-end” process engineering examples
• Diagnostic Management Teams for cancer
• The future: Where we want to go
• Lessons and recommendations
Cancer Diagnosis and Management

Different Views of Cancer


The Traditional Model of Pathology:Limitations for Modern Medicine
Clinician Lab(s) Clinician
Clinician orders individual tests
Lab(s) perform ordered tests and
return simple results
Clinician collates and interprets results alone

Patient referred from outside clinician
Re: abnormal CBC/smear, suspect AML
Patient seen in clinic
18% blasts confirmed
Biopsy Aspirate
CytogeneticsMolecular
Pathology
Clinician orders bone marrow biopsy with:
Flow cytometry
Karyotype
FISH (MDS and AML Panels)
Molecular tests (FLT3 and NPM1)
Bone Marrow Biopsy
FISH x8Karyotype
Hematopathology Immunopathology
Morphologic
exam
Flow
CytometryNPM1FLT3
AML, with
MDS featuresNormal Negative x8 Negative Positive
Clinician receives and
interprets reports
Induction Chemotherapy
Initiated
Unclear
HistoryLarge Test
Menu
Multiple
Laboratories
No Evidence-
Based Testing
Guidelines
Multiple,
Asynchronous
Reports
No
Comprehensive
Interpretation
Diagnostic Complexity Example – Hemato-Malignancy

The Traditional Model of Pathology:Limitations for Modern Medicine
Challenges Consequences
• Large, complex, rapidly expanding test menus
• Few if any evidence-based guidelines for test selection
• Unnecessary tests = increased costs
• Multiple laboratories• Multiple asynchronous reports
• Inefficient work-flow = wasted time
• Complex diagnostic outcomes. • Difficult to correlate and interpret results
Clinician Lab(s) Clinician
Clinician orders individual tests
Lab(s) perform ordered tests and
return simple results
Clinician collates and interprets results alone
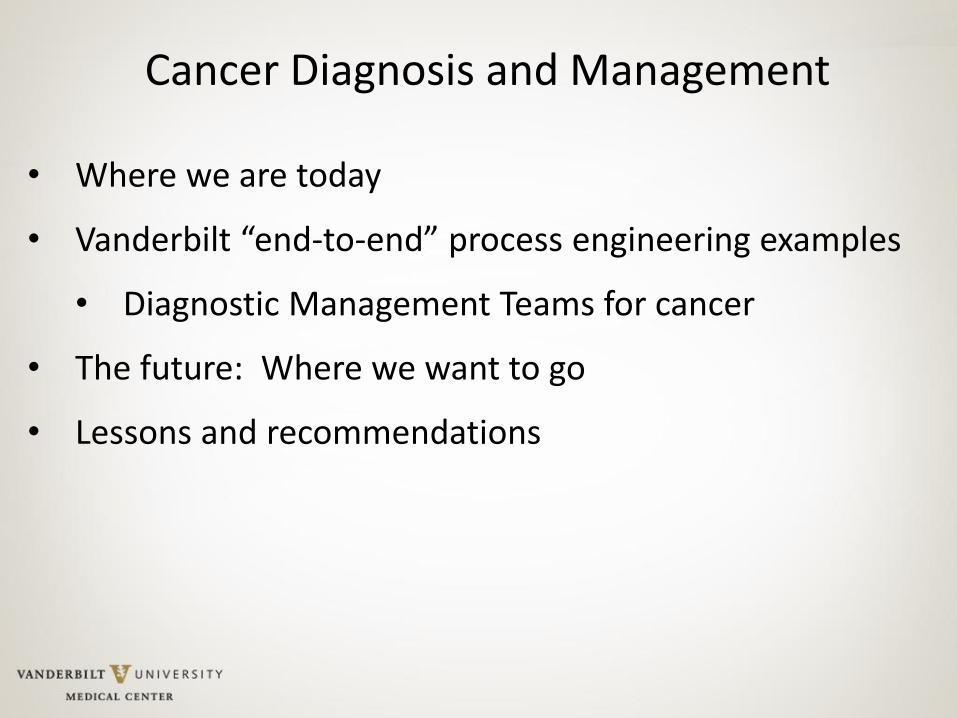
A collaborative effort amongst pathologists, clinicians, and biomedical informatics.
1. To develop the right pattern of diagnostic testing for the patient, using standard test ordering algorithms.
2. To create a single, evidence-based, comprehensive report of integrated diagnostic data to guide therapy and disease monitoring.
3. To iteratively improve the algorithms as evidence based practices evolve and change.
The Diagnostic Management Team (DMT)

The Diagnostic Management Team (DMT)
LabClinician DMT DMT Clinician
Unnecessary tests deleted
Essential tests added
Standard Ordering
Protocols (SOPs)Comprehensive
Reports

Secondary Testing Standards: MDS/AML
Diagnosis or MorphologicallyOvert Disease
No Overt Disease (multiple encounters)
Pre-SCT Post-SCT
Flow Cytometry
Karyotype
FISH
Molecular
**A
ML
or
MD
S**
AM
L
**AML includes MDS in evolution to AML
SOPs Developed for:• Acute Myeloid Leukemia• Myelodysplastic Syndrome• Acute Lymphoblastic Leukemia• Myeloproliferative Disorders, including CML• B cell, Acute lymphoblastic leukemia• T cell, Acute lymphoblastic leukemia• Non-Hodgkin and Hodgkin Lymphoma• Multiple Myeloma• Bone Marrow Failure Syndrome
The hematologist retains the option to order tests “a la carte.”
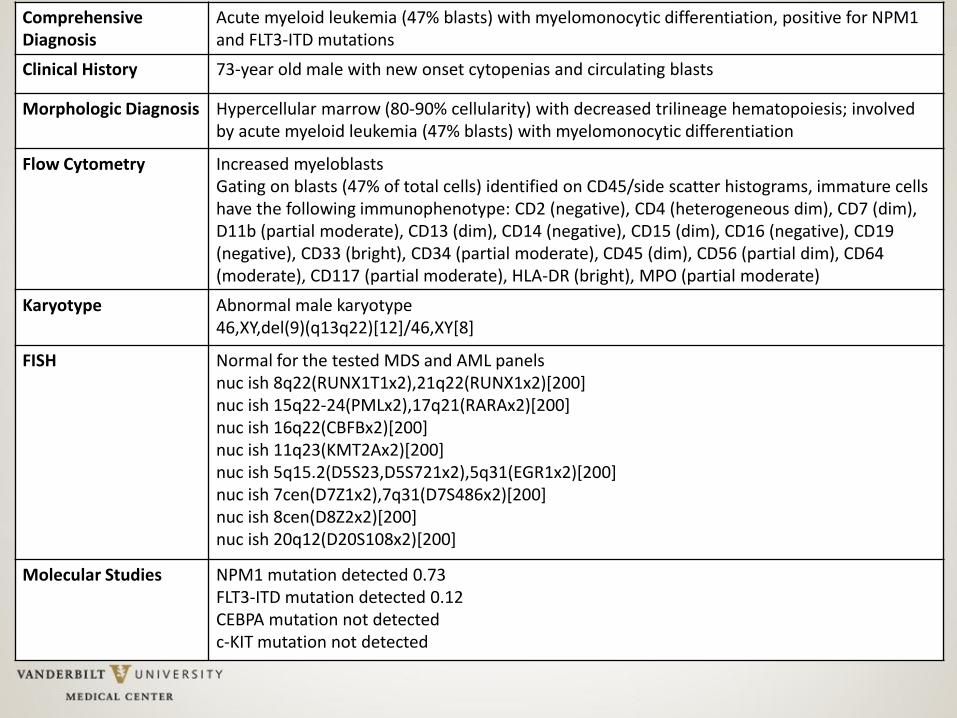
Comprehensive Diagnosis
Acute myeloid leukemia (47% blasts) with myelomonocytic differentiation, positive for NPM1 and FLT3-ITD mutations
Clinical History 73-year old male with new onset cytopenias and circulating blasts
Morphologic Diagnosis Hypercellular marrow (80-90% cellularity) with decreased trilineage hematopoiesis; involved by acute myeloid leukemia (47% blasts) with myelomonocytic differentiation
Flow Cytometry Increased myeloblastsGating on blasts (47% of total cells) identified on CD45/side scatter histograms, immature cells have the following immunophenotype: CD2 (negative), CD4 (heterogeneous dim), CD7 (dim),D11b (partial moderate), CD13 (dim), CD14 (negative), CD15 (dim), CD16 (negative), CD19 (negative), CD33 (bright), CD34 (partial moderate), CD45 (dim), CD56 (partial dim), CD64(moderate), CD117 (partial moderate), HLA-DR (bright), MPO (partial moderate)
Karyotype Abnormal male karyotype46,XY,del(9)(q13q22)[12]/46,XY[8]
FISH Normal for the tested MDS and AML panelsnuc ish 8q22(RUNX1T1x2),21q22(RUNX1x2)[200]nuc ish 15q22-24(PMLx2),17q21(RARAx2)[200]nuc ish 16q22(CBFBx2)[200]nuc ish 11q23(KMT2Ax2)[200]nuc ish 5q15.2(D5S23,D5S721x2),5q31(EGR1x2)[200]nuc ish 7cen(D7Z1x2),7q31(D7S486x2)[200]nuc ish 8cen(D8Z2x2)[200]nuc ish 20q12(D20S108x2)[200]
Molecular Studies NPM1 mutation detected 0.73FLT3-ITD mutation detected 0.12CEBPA mutation not detectedc-KIT mutation not detected

Hemato-malignancy DMT was accepted by users and “a la carte” ordering fell significantly
0 10 20 30 40 500.0
0.2
0.4
0.6
0.8
1.0
Week
Fra
cti
on
of
Bo
ne M
arr
ow
s Bone Marrow
Testing Panel
Clinician
“a la carte”
Fractional weekly utilization of the bone marrow testing panel vs. a la carte ordering after DMT implementation.
Seegmiller AC, Kim AS, Mosse CA, et al. Optimizing personalized bone marrow testing using an evidence-based, interdisciplinary team approach. Am J Clin Pathol 2013;140:643-650.
The DMT saves 10 minutes per patient for the clinician
The providers trust that the right tests will be ordered

A retrospective analysis predicted that DMT guidance of laboratory testing improves concordance and reduces testing
3.7
2.8
0.4 1.3
0
1
2
3
4
5
Baseline Missing Tests Unnecessary Tests Optimal
Tests per bone marrow sample
Based on a retrospective review of 601 patients
Saves ~1 test per bone marrow sample using real-
time decision guidance integrated into clinical
practice
Seegmiller AC, Kim AS, Mosse CA, et al. Optimizing personalized bone marrow testing using an evidence-based, interdisciplinary team approach. Am J Clin Pathol 2013;140:643-650.
140,000 Americans will be newly diagnosed with leukemia, lymphoma or myeloma this year, while 1,000,000 are in remission/actively treated
Scaling nationally, this represents a $0.5B/year savings opportunity

Ordered by Clinicians
Ordered by DMT
0.0
1.0
2.0
3.0
4.0
5.0
Year 1 Year 2
Total Tests / Marrow
***,††***
0.00.51.01.52.02.53.03.5
Year 1 Year 2
Test Charge / Marrow (x$1,000)
***,†††***
0.0
0.5
1.0
1.5
Year 1 Year 2
Unnecessary Tests / Marrow
††† †††
0.0
0.1
0.2
0.3
0.4
Year 1 Year 2
Missing Tests / Marrow
*
Seegmiller AC, Kim AS, Mosse CA, et al., Data-driven iterative refinement of bone marrow testing protocols leads to progressive improvement in cytogenetic and molecular test utilization. Am J Clin Pathol2016;146:585-593.
Using the DMT to guide testing continues to improve test concordance and reduces testing year after year

Evolution of the SOPs:An Example of a Learning Health Care System
Added SNaPshotmolecular testing
Added NGS

0
100
200
300
400
500
600
700
Concordant with DMT (86%) Discordant with DMT (14%)
Results of NGS Testing by Concordance with DMT
(673 tests / 6,223 marrows)
Positive Negative
81% positive
18% positive
Mutation testing for 36 genes by NGS was incorporated into the DMT algorithms in 2014:
Only cases with suspected myeloid malignancies
Seegmiller AC (Unpublished results)

• Scale to Vanderbilt Health Affiliated Network Partners
First partner: Jackson Madison Hospital in Jackson, TN
Implemented Hematopathology DMT in 2014
Ongoing Work:
Vanderbilt Affiliated Systems
VHAN Advisory Clients
• >50 Hospitals
• ~4800 Physicians (VHAN)
• 12 Health Systems
• 4 Health Systems with 13
hospitals across Mississippi

• Develop similar processes in solid tumors
Currently developing: GI DMT
On deck: lung and breast cancer DMTs
• Challenges of solid tumors
Imaging is critical
Metastatic and non-metastatic disease
Multiple time points of entry into system
Multiple different tumor sites with different characteristics:Colorectal, Stomach, Small intestine, Pancreas, Liver
Multiple providers involved:
Gastroenterologists, Surgeons, Radiologists, Oncologists,
Multiple different sample types:
Biopsies of primary or metastatic lesions, Full or partial resections,
Next Steps and Challenges:
• Introduction
• Discussed traditional pathology practice.
• Developed the use case for innovation in practice.
• Description of the Hematopathology Diagnostic Management Team (DMT)
• Defined the requirements for a DMT
• Highlighted the team approach
• Reviewed a “learning health care” system approach
• Presented on-going work and next steps
In Summary

Acknowledgements
PathologySamuel SantoroAdam SeegmillerClaudio MosseMary Ann Thompson-ArildsenDavid HeadAaron ShaverBruce GreigHolly PinderFellows and Residents
VICTRGordon BernardJulie FieldCaroline TaylorDikshya Bastakoty
Adult HematologyMadan Jagasia, MBBSNishitha Reddy, MDStephen Strickland, MD, MSCIDavid Morgan, MD
Strategy and InnovationWilliam SteadKristy SinkfieldHerschel PollardEd MarxMegan Youngblood
InformaticsMia Levy, MD, PhDShannon RichPerry AdamsKevin ColeMatthew MontgomeryJameson PorterNaqi Khan, MDDario Giuse, Dr.Ing.Jonathan Grande
BiostatisticsWilliam DupontDale Plummer