Embed Size (px)
Citation preview
FACULDADE DE ENGENHARIA DA UNIVERSIDADE DO PORTO
Improving pedestrian navigation forolder adults with mild cognitive
impairments through landmarks
Diogo Filipe Azevedo de Castro
Master in Informatics and Computing Engineering
Supervisor: Nuno Honório Rodrigues Flores
February 13, 2013

Improving pedestrian navigation for older adults withmild cognitive impairments through landmarks
Diogo Filipe Azevedo de Castro
Master in Informatics and Computing Engineering
Approved in oral examination by the committee:
Chair: Jorge Manuel Gomes Barbosa
External Examiner: Daniel Augusto Gama Castro Silva
Supervisor: Nuno Honório Rodrigues Flores
February 13, 2013

Abstract
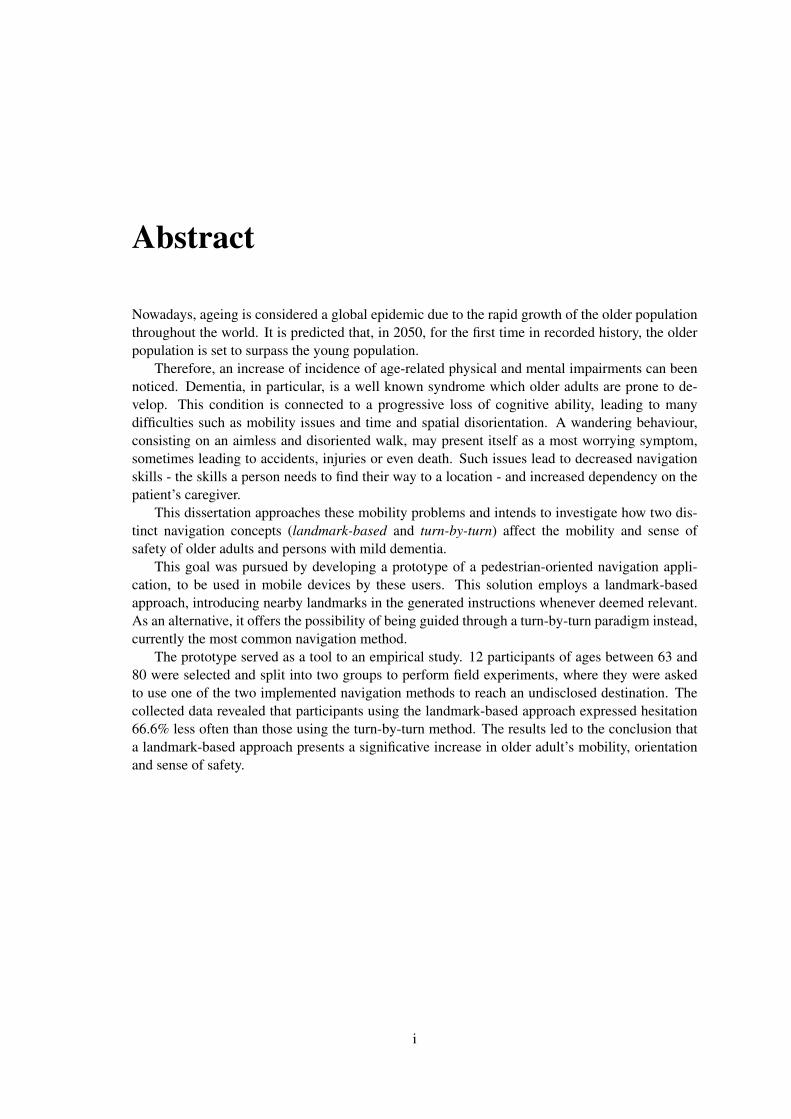
Nowadays, ageing is considered a global epidemic due to the rapid growth of the older populationthroughout the world. It is predicted that, in 2050, for the first time in recorded history, the olderpopulation is set to surpass the young population.
Therefore, an increase of incidence of age-related physical and mental impairments can beennoticed. Dementia, in particular, is a well known syndrome which older adults are prone to de-velop. This condition is connected to a progressive loss of cognitive ability, leading to manydifficulties such as mobility issues and time and spatial disorientation. A wandering behaviour,consisting on an aimless and disoriented walk, may present itself as a most worrying symptom,sometimes leading to accidents, injuries or even death. Such issues lead to decreased navigationskills - the skills a person needs to find their way to a location - and increased dependency on thepatient’s caregiver.
This dissertation approaches these mobility problems and intends to investigate how two dis-tinct navigation concepts (landmark-based and turn-by-turn) affect the mobility and sense ofsafety of older adults and persons with mild dementia.
This goal was pursued by developing a prototype of a pedestrian-oriented navigation appli-cation, to be used in mobile devices by these users. This solution employs a landmark-basedapproach, introducing nearby landmarks in the generated instructions whenever deemed relevant.As an alternative, it offers the possibility of being guided through a turn-by-turn paradigm instead,currently the most common navigation method.
The prototype served as a tool to an empirical study. 12 participants of ages between 63 and80 were selected and split into two groups to perform field experiments, where they were askedto use one of the two implemented navigation methods to reach an undisclosed destination. Thecollected data revealed that participants using the landmark-based approach expressed hesitation66.6% less often than those using the turn-by-turn method. The results led to the conclusion thata landmark-based approach presents a significative increase in older adult’s mobility, orientationand sense of safety.
i

ii
Resumo
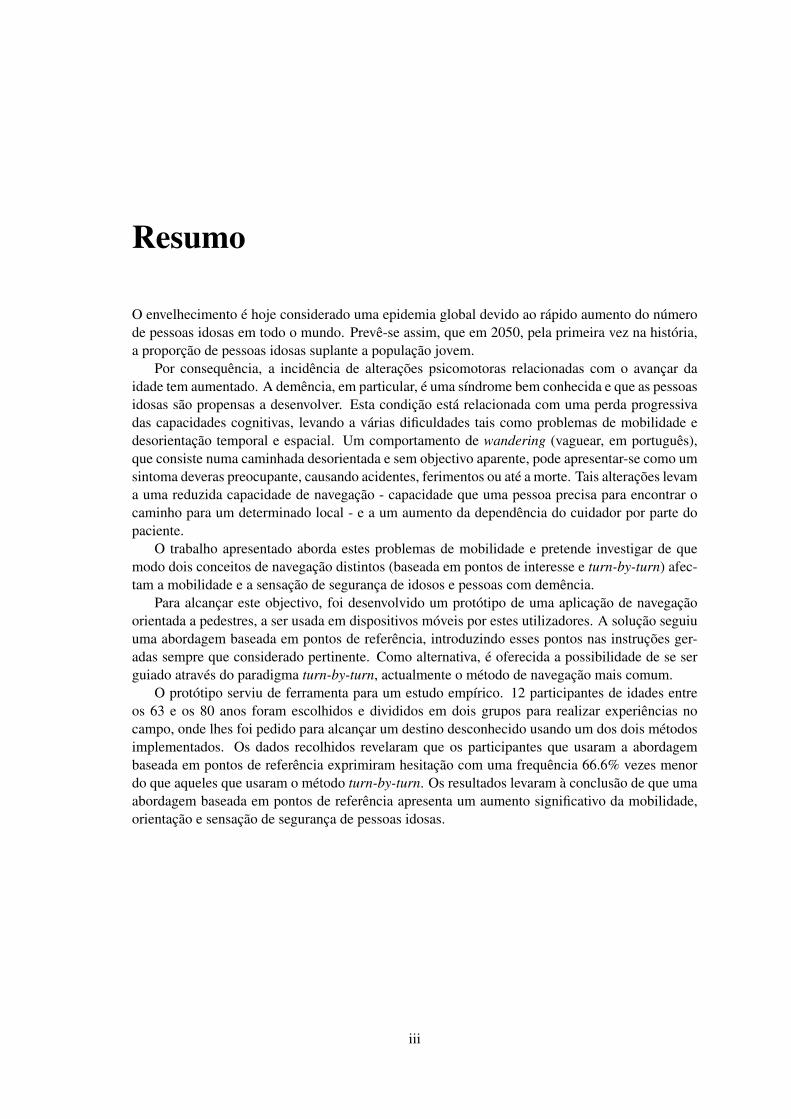
O envelhecimento é hoje considerado uma epidemia global devido ao rápido aumento do númerode pessoas idosas em todo o mundo. Prevê-se assim, que em 2050, pela primeira vez na história,a proporção de pessoas idosas suplante a população jovem.
Por consequência, a incidência de alterações psicomotoras relacionadas com o avançar daidade tem aumentado. A demência, em particular, é uma síndrome bem conhecida e que as pessoasidosas são propensas a desenvolver. Esta condição está relacionada com uma perda progressivadas capacidades cognitivas, levando a várias dificuldades tais como problemas de mobilidade edesorientação temporal e espacial. Um comportamento de wandering (vaguear, em português),que consiste numa caminhada desorientada e sem objectivo aparente, pode apresentar-se como umsintoma deveras preocupante, causando acidentes, ferimentos ou até a morte. Tais alterações levama uma reduzida capacidade de navegação - capacidade que uma pessoa precisa para encontrar ocaminho para um determinado local - e a um aumento da dependência do cuidador por parte dopaciente.
O trabalho apresentado aborda estes problemas de mobilidade e pretende investigar de quemodo dois conceitos de navegação distintos (baseada em pontos de interesse e turn-by-turn) afec-tam a mobilidade e a sensação de segurança de idosos e pessoas com demência.
Para alcançar este objectivo, foi desenvolvido um protótipo de uma aplicação de navegaçãoorientada a pedestres, a ser usada em dispositivos móveis por estes utilizadores. A solução seguiuuma abordagem baseada em pontos de referência, introduzindo esses pontos nas instruções ger-adas sempre que considerado pertinente. Como alternativa, é oferecida a possibilidade de se serguiado através do paradigma turn-by-turn, actualmente o método de navegação mais comum.
O protótipo serviu de ferramenta para um estudo empírico. 12 participantes de idades entreos 63 e os 80 anos foram escolhidos e divididos em dois grupos para realizar experiências nocampo, onde lhes foi pedido para alcançar um destino desconhecido usando um dos dois métodosimplementados. Os dados recolhidos revelaram que os participantes que usaram a abordagembaseada em pontos de referência exprimiram hesitação com uma frequência 66.6% vezes menordo que aqueles que usaram o método turn-by-turn. Os resultados levaram à conclusão de que umaabordagem baseada em pontos de referência apresenta um aumento significativo da mobilidade,orientação e sensação de segurança de pessoas idosas.
iii

iv
Contents
1 Introduction 11.1 Motivation and Goals . . . . . . . . . . . . . . . . . . . . . . . . . . . . . . . . 21.2 Document Structure . . . . . . . . . . . . . . . . . . . . . . . . . . . . . . . . . 2
2 State of the Art 52.1 Turn-by-turn Navigation . . . . . . . . . . . . . . . . . . . . . . . . . . . . . . 52.2 Landmark-based Navigation . . . . . . . . . . . . . . . . . . . . . . . . . . . . 8
2.2.1 Driver-centred Navigation . . . . . . . . . . . . . . . . . . . . . . . . . 92.2.2 Pedestrian-centred Navigation . . . . . . . . . . . . . . . . . . . . . . . 92.2.3 Adapting to Pedestrians . . . . . . . . . . . . . . . . . . . . . . . . . . 112.2.4 Challenges . . . . . . . . . . . . . . . . . . . . . . . . . . . . . . . . . 122.2.5 Supporting Older Adults . . . . . . . . . . . . . . . . . . . . . . . . . . 152.2.6 Pratical Applications . . . . . . . . . . . . . . . . . . . . . . . . . . . . 17
2.3 APIs . . . . . . . . . . . . . . . . . . . . . . . . . . . . . . . . . . . . . . . . . 192.4 Summary . . . . . . . . . . . . . . . . . . . . . . . . . . . . . . . . . . . . . . 23
3 The Elderly: Landmarks or Turn-by-turn? 253.1 Problem Formalisation . . . . . . . . . . . . . . . . . . . . . . . . . . . . . . . 253.2 Methodological Approach . . . . . . . . . . . . . . . . . . . . . . . . . . . . . 26
4 AlzNav with Landmarks: a Prototype 274.1 Overview . . . . . . . . . . . . . . . . . . . . . . . . . . . . . . . . . . . . . . 274.2 Initial Setting . . . . . . . . . . . . . . . . . . . . . . . . . . . . . . . . . . . . 284.3 Specification . . . . . . . . . . . . . . . . . . . . . . . . . . . . . . . . . . . . 29
4.3.1 Non-functional Requirements . . . . . . . . . . . . . . . . . . . . . . . 304.3.2 Functional Requirements . . . . . . . . . . . . . . . . . . . . . . . . . . 304.3.3 Class Model . . . . . . . . . . . . . . . . . . . . . . . . . . . . . . . . 314.3.4 Methodology . . . . . . . . . . . . . . . . . . . . . . . . . . . . . . . . 34
4.4 Landmark Processing Cycle . . . . . . . . . . . . . . . . . . . . . . . . . . . . 354.4.1 Data Processing . . . . . . . . . . . . . . . . . . . . . . . . . . . . . . . 354.4.2 Screening . . . . . . . . . . . . . . . . . . . . . . . . . . . . . . . . . . 404.4.3 Generation of Instructions . . . . . . . . . . . . . . . . . . . . . . . . . 494.4.4 Delivery of Instructions . . . . . . . . . . . . . . . . . . . . . . . . . . 52
4.5 Application Settings . . . . . . . . . . . . . . . . . . . . . . . . . . . . . . . . . 544.6 Summary . . . . . . . . . . . . . . . . . . . . . . . . . . . . . . . . . . . . . . 55
v
CONTENTS
5 Evaluation 575.1 Participants . . . . . . . . . . . . . . . . . . . . . . . . . . . . . . . . . . . . . 575.2 Groups . . . . . . . . . . . . . . . . . . . . . . . . . . . . . . . . . . . . . . . . 585.3 Routes . . . . . . . . . . . . . . . . . . . . . . . . . . . . . . . . . . . . . . . . 585.4 Measures . . . . . . . . . . . . . . . . . . . . . . . . . . . . . . . . . . . . . . 585.5 Test Procedure . . . . . . . . . . . . . . . . . . . . . . . . . . . . . . . . . . . 605.6 Results . . . . . . . . . . . . . . . . . . . . . . . . . . . . . . . . . . . . . . . . 62
5.6.1 Landmark-based Group . . . . . . . . . . . . . . . . . . . . . . . . . . 625.6.2 Turn-by-turn Group . . . . . . . . . . . . . . . . . . . . . . . . . . . . . 63
5.7 Discussion . . . . . . . . . . . . . . . . . . . . . . . . . . . . . . . . . . . . . . 63
6 Conclusions 676.1 Future Work . . . . . . . . . . . . . . . . . . . . . . . . . . . . . . . . . . . . . 68
A Test Sessions Script 69
B Satisfaction Questionnaire 71B.1 Questions presented to all participants . . . . . . . . . . . . . . . . . . . . . . . 71B.2 Questions for the landmark-based group . . . . . . . . . . . . . . . . . . . . . . 72
C Satisfaction Questionnaire Responses 73
References 75
vi
List of Figures
2.1 Garmin (on the left) and TomTom’s (on the right) navigation interfaces. . . . . . 62.2 NDrive’s navigation interface. . . . . . . . . . . . . . . . . . . . . . . . . . . . 72.3 AlzNav’s navigation module. . . . . . . . . . . . . . . . . . . . . . . . . . . . . 82.4 The use of general information categories such as primary (required) or secondary
(redundant) information [MRBT03] . . . . . . . . . . . . . . . . . . . . . . . . 112.5 The use of information for preview, identify or confirm purposes [MRBT03] . . . 122.6 Example screen from the navigation aid developed in [GGKB04]. . . . . . . . . 152.7 Perceived relative usefulness of the map and the navigation aid in [GGKB04]. . . 162.8 Mean time taken to navigate test routes in [GGKB04]. . . . . . . . . . . . . . . 162.9 Google Maps directions in India, 2008. . . . . . . . . . . . . . . . . . . . . . . . 172.10 Google Maps landmark-based directions in India, 2009. . . . . . . . . . . . . . . 182.11 Lumatic’s concept of a route. . . . . . . . . . . . . . . . . . . . . . . . . . . . . 19
4.1 AlzNav’s navigation module interface . . . . . . . . . . . . . . . . . . . . . . . 294.2 Class Model - Facade design pattern . . . . . . . . . . . . . . . . . . . . . . . . 324.3 Class Model - Landmarks hierarchy . . . . . . . . . . . . . . . . . . . . . . . . 334.4 Class Model - Instructions . . . . . . . . . . . . . . . . . . . . . . . . . . . . . 344.5 Activity diagram of the developed subsystem . . . . . . . . . . . . . . . . . . . 364.6 The vectors needed to calculate the orientation of a landmark . . . . . . . . . . . 384.7 The data calculated for a node landmark . . . . . . . . . . . . . . . . . . . . . . 394.8 Projection of an area landmark . . . . . . . . . . . . . . . . . . . . . . . . . . . 394.9 Steps taken to project an area landmark onto its step . . . . . . . . . . . . . . . . 414.10 How to detect whether landmarks stretch beyond the decision point . . . . . . . . 414.11 The recognisability function for landmarks 10 and 40 metres wide . . . . . . . . 444.12 The pinpointing precision function . . . . . . . . . . . . . . . . . . . . . . . . . 464.13 Situation where an area landmark cannot identify a decision point unambiguously 474.14 Work data of the optimal set algorithm and how to obtain the set . . . . . . . . . 494.15 Situation where the user might not pass by the landmark . . . . . . . . . . . . . 514.16 Delivery of the first instruction . . . . . . . . . . . . . . . . . . . . . . . . . . . 534.17 Delivery of identification instructions . . . . . . . . . . . . . . . . . . . . . . . 534.18 Delivery of the last message . . . . . . . . . . . . . . . . . . . . . . . . . . . . 544.19 Settings menu - option to enable/disable landmark-based navigation . . . . . . . 54
5.1 The three selected routes and nearby landmarks . . . . . . . . . . . . . . . . . . 595.2 The smartphone used for the field tests with the destination address hidden . . . . 615.3 The actual course taken near the first decision point at the route for Care Centre 2 62
C.1 Distribution of responses from the landmark-based group to the satisfaction ques-tionnaire . . . . . . . . . . . . . . . . . . . . . . . . . . . . . . . . . . . . . . . 73
vii

LIST OF FIGURES
C.2 Distribution of responses from the turn-by-turn group to the satisfaction question-naire . . . . . . . . . . . . . . . . . . . . . . . . . . . . . . . . . . . . . . . . . 74
viii
List of Tables
2.1 References to the most frequent landmark categories [MRBT03]. . . . . . . . . . 132.2 Comparison of the Google Places API and the Overpass API using OSM data. . . 21
5.1 Distribution of the participants by group, centre and age . . . . . . . . . . . . . . 585.2 Landmarks near the routes selected for the test sessions . . . . . . . . . . . . . . 605.3 Count of errors, hesitations and times the participants got lost and time taken to
complete the task (landmark-based group) . . . . . . . . . . . . . . . . . . . . . 635.4 Count of errors, hesitations and times the participants got lost and time taken to
complete the task (turn-by-turn group) . . . . . . . . . . . . . . . . . . . . . . . 635.5 Summarized results of the landmark-based and turn-by-turn groups . . . . . . . . 64
ix

LIST OF TABLES
x

Abbreviations
API Application Programming InterfaceGPS Global Positioning SystemHCI Human-Computer InteractionHTML HyperText Markup LanguageJSON JavaScript Object NotationOSM OpenStreetMapPND Personal Navigation DeviceSPMSQ Short Portable Mental Status QuestionnaireTTS Text-To-SpeechUML Unified Modeling Language
xi

Chapter 1
Introduction
As the worldwide average life expectancy increases, so does the ageing of the worldwide popu-
lation. Projections show that the number of older people (aged 65 or older) will outnumber the
young population (aged 5 or younger) for the first time in history. [Wor11]. While in the middle
of the 20th century there were 14 million people aged 80 years or older, this number is expected
to grow to 400 million by 2050 [Wor12b], which means an increase of the older population of
approximately 2800% in such a short period of time.
The rapid formation of an older society leads to an increased incidence of age-related im-
pairments, such as dementia1. It is estimated that 35.6 million people worldwide have dementia,
with a new case occurring every 7 seconds. This syndrome is characterised by a progressive loss
of cognitive ability, including memory and, at later stages, it may exhibit a decline in the ability
to execute motor activities. Furthermore, patients are likely to display a wandering behaviour, a
symptom where the patient moves in a “seemingly aimless or disoriented fashion or in pursuit of
an undefinable or unobtainable goal” [VPS+08].
Thus, navigation, the process of defining the direction towards a familiar goal, is an essential
subject in order to maintain independence and mobility. For that reason, this is an area where
technology can reveal great advantages. Undoubtedly, the scientific community has taken interest
in exploring this subject and research has been made in order to continuously improve navigation
methods.
The solution presented in this dissertation, seeks to increase the efficiency of the current navi-
gational solutions for older adults and, therefore, increase their mobility and sense of safety.
1“Dementia is a syndrome, usually of a chronic or progressive nature, caused by a variety of brain illnesses thataffect memory, thinking, behaviour and ability to perform everyday activities” [Wor12a].
1
Introduction
1.1 Motivation and Goals
Dementia is a well established reality of the older population that leads to many sensorial and
spatial awareness difficulties. Part of the solution is to continuously provide better ways to increase
their mobility and sense of safety when going outdoors, thus improving their interaction with the
environment and their quality of life. On the other hand, this can also help put the patient’s
caregiver at ease and lessen the inflicted stress. In short, it is essential to fill in the gaps in older
adult’s capabilities, to facilitate caregiving and to contribute to the state of the art of the related
technical field, namely, pedestrian navigation.
The proposed solution comprehends the study of how current navigational approaches provide
their services, targeting an older population.
In this context, the main goal of this dissertation is to investigate possible ways to improve
navigation aids targeting an older population. In particular, two distinct techniques to guide a user
along a path towards his destination were identified and studied. One, present in most current
navigation systems, is entitled turn-by-turn navigation and instructs the user by providing infor-
mation regarding street names and distances. Alternatively, a landmark-based approach, rarely
observed in current systems, offers the user enhanced cues about their surroundings as a means of
orientation.
These studies prompted a need to ascertain the effects that these techniques have on the mo-
bility and spatial orientation of an older population - the second major goal of this dissertation.
Towards this goal, through an empirical approach, experiments were performed on the field with
the target audience, from which data was collected and analysed. In order to be able to perform
this study, a prototype of a pedestrian navigation subsystem capable of using either technique
was developed and embedded into AlzNav [Mou11], a pedestrian navigation system for Android
smartphones, focused on older adults.
Ultimately, the aim is to get a better understanding of the needs of this kind of population,
regarding navigational aids. Extending knowledge on this field could make way for increasingly
better navigation systems in the area of assistive technologies, and consequently a better and safer
lifestyle for the elderly.
1.2 Document Structure
Apart from this introduction, this document has five more chapters. Chapter 2 presents a review
of the state of the art of the fields related to the scope of this dissertation. Existing navigational
methods, how they are applied and research on the subject are presented and described, leaving
the last section for conclusions.
Chapter 3 formalises the problem and describes the chosen scientific approach to address it.
Chapter 4 details the developed prototype. It shows a brief overview of the subsystem and
of the existing application in which the prototype was inserted. It goes on to explain the project
2

Introduction
specifications and architecture, followed by a detailed description of the main implementation
decisions.
Chapter 5 describes the validation process and how the prototype was used to study the perfor-
mance of both navigation techniques. Tests were performed on the field with the target audience,
and the collected data was studied and analysed for conclusions.
Lastly, Chapter 6 discusses some conclusions about the presented work, as well as envisioned
suggestions for future work.
3

Introduction
4
Chapter 2
State of the Art
As described by R. Baker [Bak81], navigation is the method of determining the direction of a
familiar goal across unfamiliar terrain. This term comprises two others: route-based and location-
based mechanisms. Route-based mechanisms are related to the direction of travel and the rela-
tive distances throughout the journey, whereas location-based mechanisms concern the orientation
linked to distant, recognisable landmarks.
In this section, two large concepts that describe how to best navigate humans will be discussed:
turn-by-turn navigation and landmark-based navigation. These are strongly coupled with the
route-based and location-based mechanisms described by Baker, respectively. Furthermore, the
state of the art of each of these concepts will be presented in two different contexts: driver-centred
and pedestrian-centred navigation. In the last section of this chapter, existing APIs that support
the development of such applications will be presented.
2.1 Turn-by-turn Navigation
Turn-by-turn navigation systems guide pedestrians/drivers to their destiny providing them with
information such as distance to the next decision point1, the name of the street to turn onto and
turn direction [WHW09]. This information is presented to the user in a turn-by-turn format, hence
the name for this kind of navigation. In order to avoid distracting the user’s attention from the road,
the instructions are usually presented not only textually or visually through monitor displays, but
also audibly.
Personal Navigation Devices
These systems began to emerge in the form of Personal Navigation Devices (PNDs) which, as
the name suggests, are portable electronic devices that combine positioning capability and nav-
1“Intersection where a driving maneuver such as turning left or right is required” [DK12]
5
State of the Art
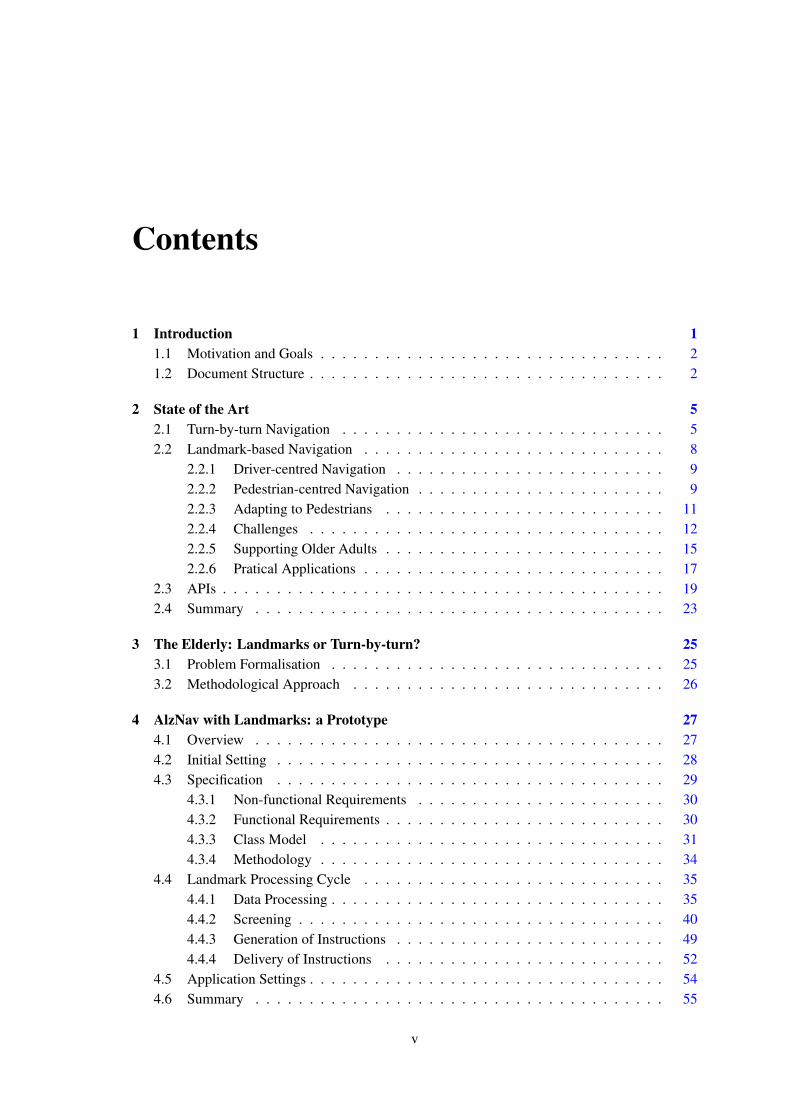
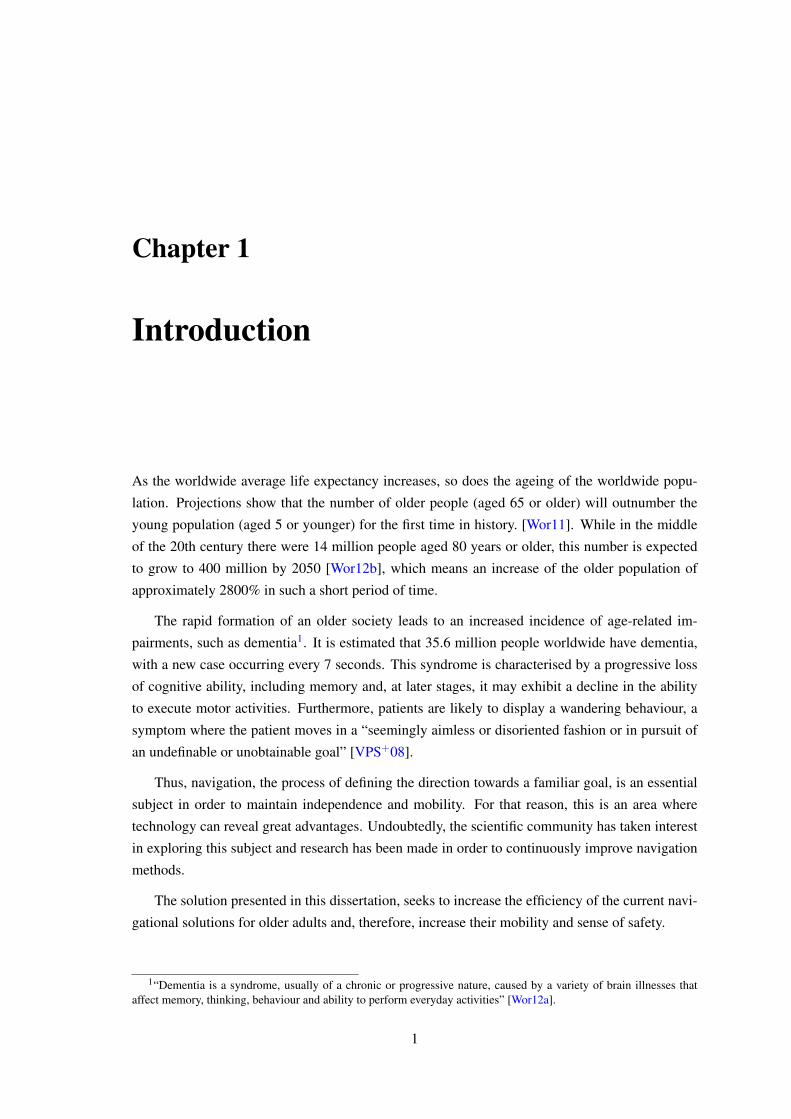
Figure 2.1: Garmin (on the left) and TomTom’s (on the right) navigation interfaces.
igation functions, primarily intended for drivers. Currently, two brands stand out: Garmin2 and
TomTom3 [Kim11].
Both solutions provide the driver with an overview map of their current location, as shown
in Figure 2.1, as well as information such as distance to the next turn and arrows illustrating the
next turn. They also include a Text-To-Speech (TTS) feature which instructs the driver of what
they should do next in a turn-by-turn format. Other useful driver-centred information like traffic
conditions and visual highway lane assistants are also supplied.
However, with the decline of the PND market [ABI11] and predictions of an overtake of
the navigation market by smartphones in 2014 [Kim09], navigation systems taking the form of
smartphone applications have been gaining popularity. As such, PND manufacturers have moved
onto mobile platforms and began shifting their focus.
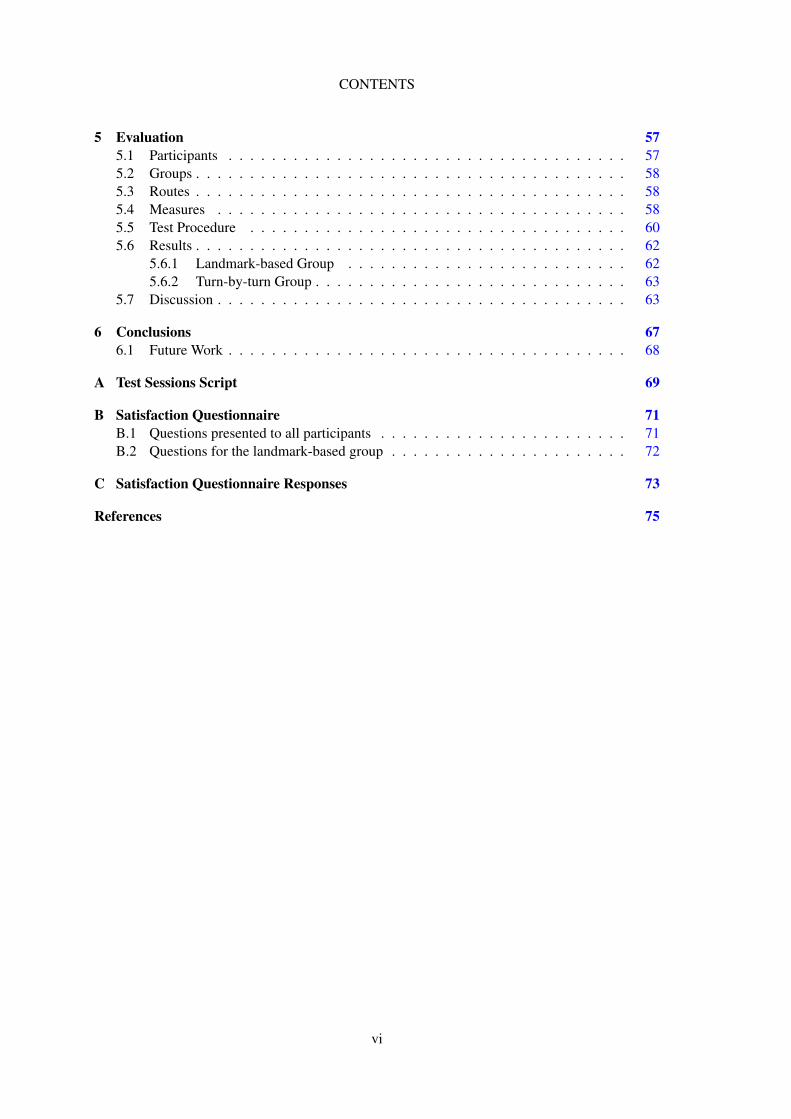
NDrive
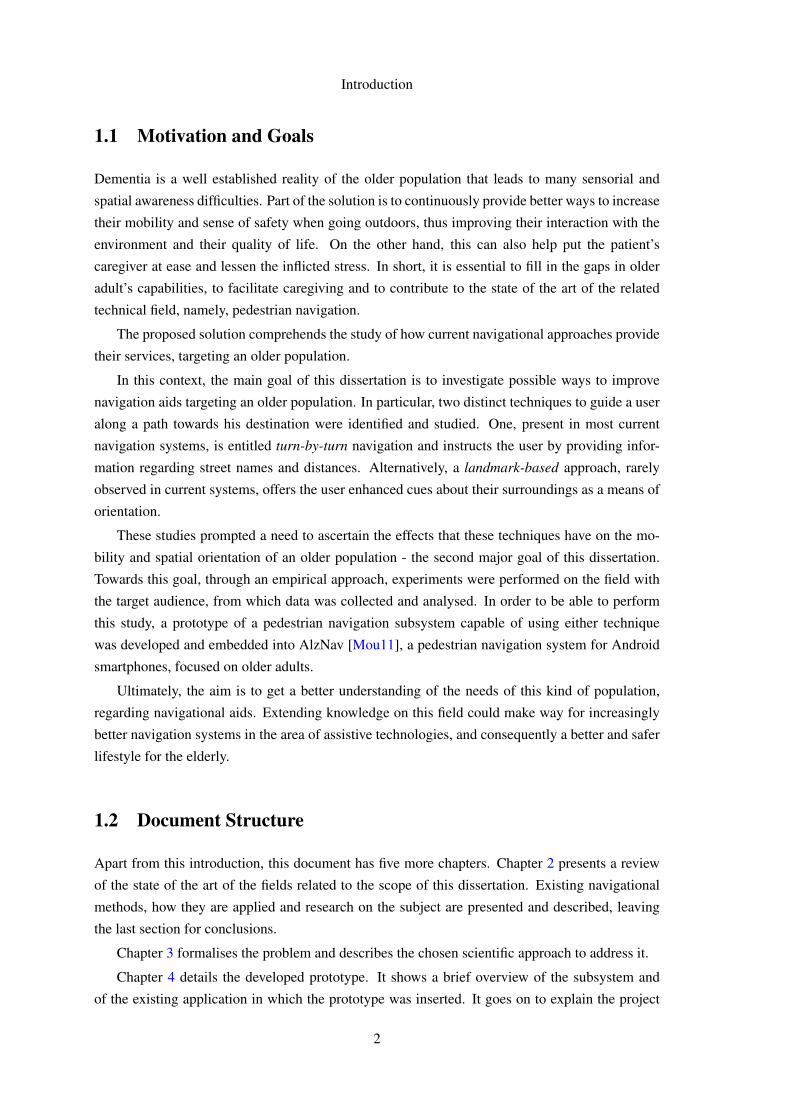
NDrive4, for instance, currently offers mobile solutions for most mobile operating systems, such as
Android, iOS and Windows Mobile. Although NDrive’s navigation style is very similar to Garmin
and TomTom’s, some 3D models of important landmarks (such as city halls, football stadiums
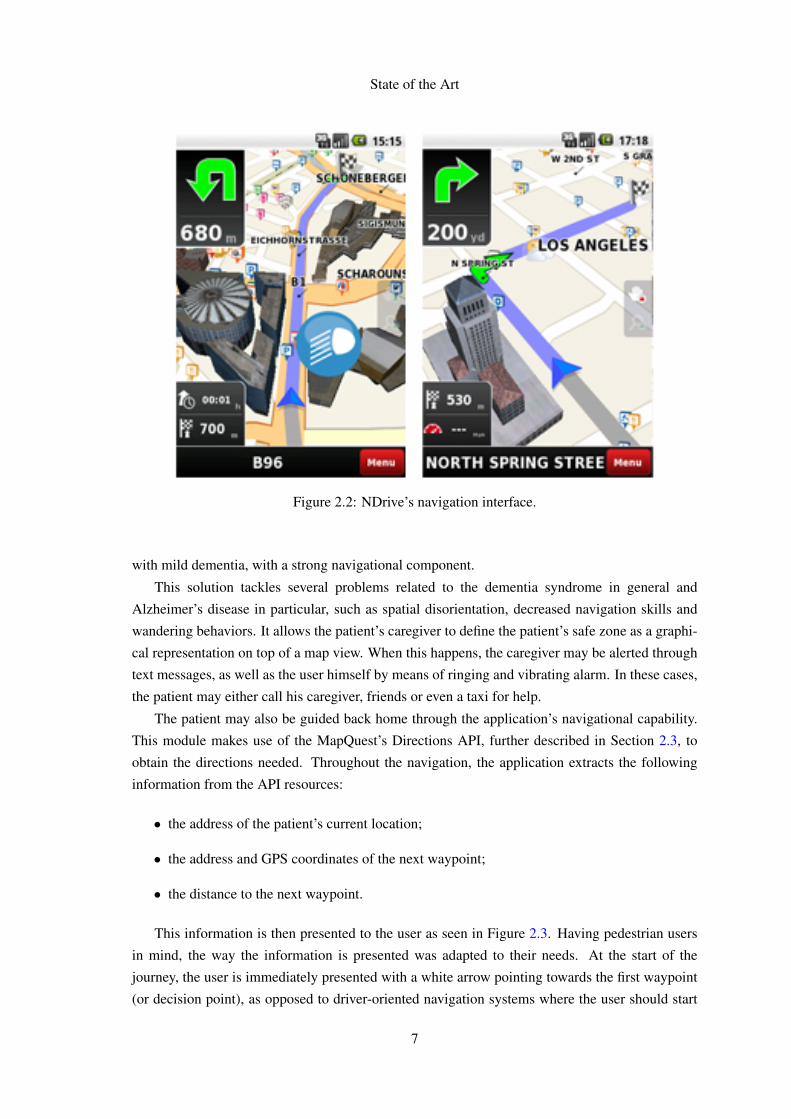
and monuments) are displayed in the overview map, as illustrated in Figure 2.2. However, these
landmarks are not in any way accounted for in the instructions given to the driver.
AlzNav
AlzNav5 is a turn-by-turn solution focused on pedestrian navigation. Developed by Fraunhofer
Portugal6, AlzNav is a monitoring smartphone application focused on older adults and persons
2http://www.garmin.com/3http://www.tomtom.com/4http://www.ndrive.com/5http://alznav.projects.fraunhofer.pt/6http://www.fraunhofer.pt/
6
State of the Art
Figure 2.2: NDrive’s navigation interface.
with mild dementia, with a strong navigational component.
This solution tackles several problems related to the dementia syndrome in general and
Alzheimer’s disease in particular, such as spatial disorientation, decreased navigation skills and
wandering behaviors. It allows the patient’s caregiver to define the patient’s safe zone as a graphi-
cal representation on top of a map view. When this happens, the caregiver may be alerted through
text messages, as well as the user himself by means of ringing and vibrating alarm. In these cases,
the patient may either call his caregiver, friends or even a taxi for help.
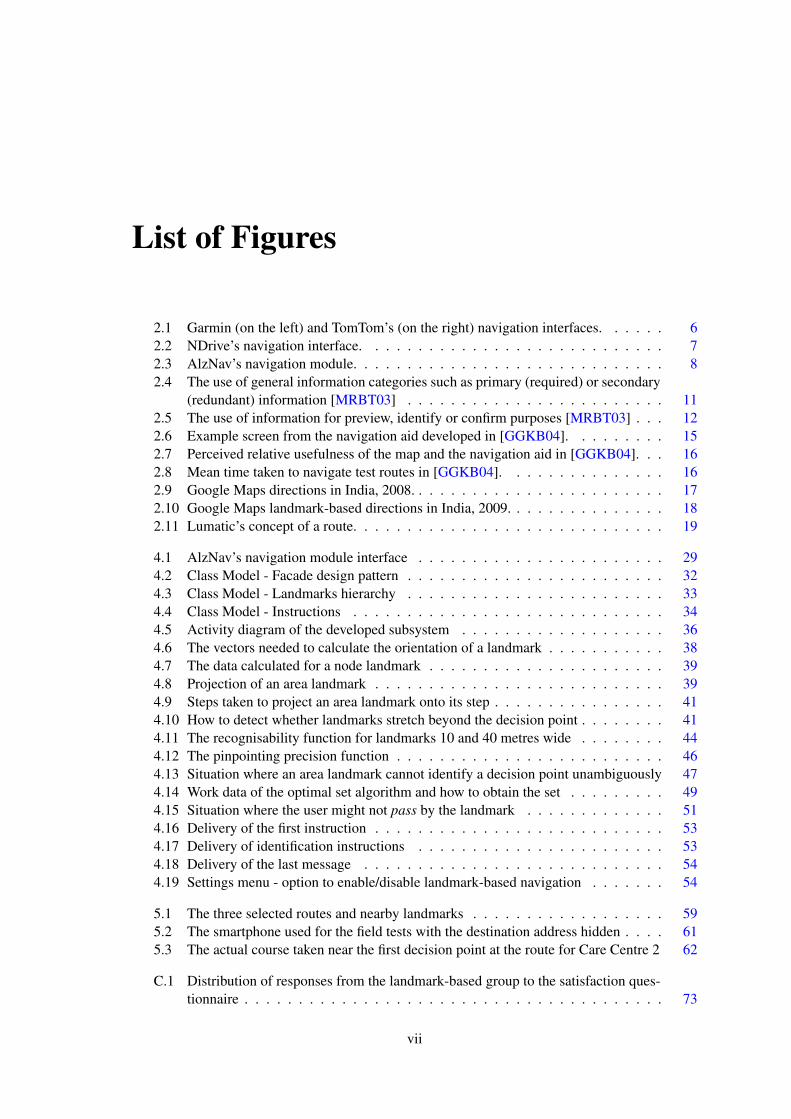
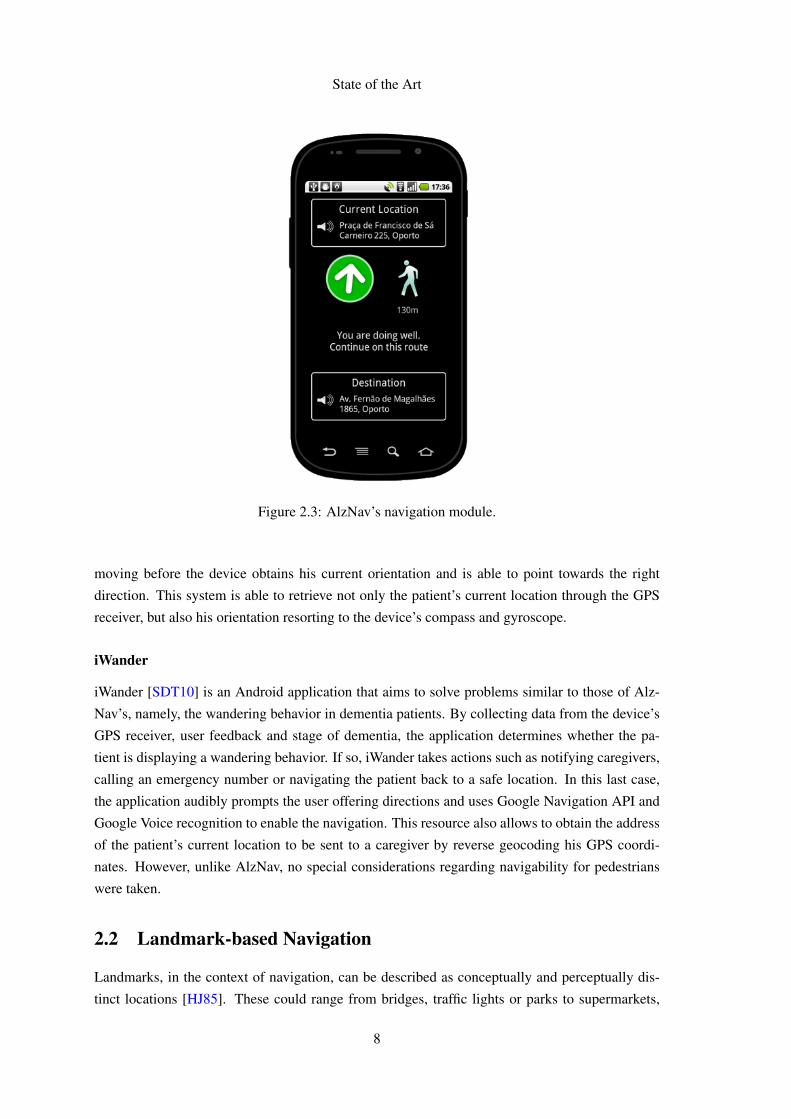
The patient may also be guided back home through the application’s navigational capability.
This module makes use of the MapQuest’s Directions API, further described in Section 2.3, to
obtain the directions needed. Throughout the navigation, the application extracts the following
information from the API resources:
• the address of the patient’s current location;
• the address and GPS coordinates of the next waypoint;
• the distance to the next waypoint.
This information is then presented to the user as seen in Figure 2.3. Having pedestrian users
in mind, the way the information is presented was adapted to their needs. At the start of the
journey, the user is immediately presented with a white arrow pointing towards the first waypoint
(or decision point), as opposed to driver-oriented navigation systems where the user should start
7
State of the Art
Figure 2.3: AlzNav’s navigation module.
moving before the device obtains his current orientation and is able to point towards the right
direction. This system is able to retrieve not only the patient’s current location through the GPS
receiver, but also his orientation resorting to the device’s compass and gyroscope.
iWander
iWander [SDT10] is an Android application that aims to solve problems similar to those of Alz-
Nav’s, namely, the wandering behavior in dementia patients. By collecting data from the device’s
GPS receiver, user feedback and stage of dementia, the application determines whether the pa-
tient is displaying a wandering behavior. If so, iWander takes actions such as notifying caregivers,
calling an emergency number or navigating the patient back to a safe location. In this last case,
the application audibly prompts the user offering directions and uses Google Navigation API and
Google Voice recognition to enable the navigation. This resource also allows to obtain the address
of the patient’s current location to be sent to a caregiver by reverse geocoding his GPS coordi-
nates. However, unlike AlzNav, no special considerations regarding navigability for pedestrians
were taken.
2.2 Landmark-based Navigation
Landmarks, in the context of navigation, can be described as conceptually and perceptually dis-
tinct locations [HJ85]. These could range from bridges, traffic lights or parks to supermarkets,
8
State of the Art
restaurants or city halls.
This section begins by presenting studies regarding information requirements for both drivers
and pedestrians in wayfinding, making evident the relevancy of landmarks in navigation.
Considerations that need to be borne in mind in order to adapt navigation systems to pedestri-
ans are then presented, followed by a description of the challenges inherent to a landmark-based
approach.
Converging towards the problem domain, studies concerning the applicability of such systems
to support older adults in navigation are reviewed.
Lastly, practical applications that adopt this concept are studied and presented.
2.2.1 Driver-centred Navigation
Gary E. Burnett [Bur98] studied driver’s preferences for different navigation information. Through
surveys, it was observed that, although formal road signs are considered to be the most useful in
motorways, 88% of the subjects consider landmarks useful when driving in roads within towns or
cities. As Burnett states:
“...in more complex environments (e.g. cities), it is evident that drivers perceive the
need for increased use of informal, context-based cues to enable successful naviga-
tion.” [Bur98]
Some of the most mentioned reasons for this preference were that landmarks have high visi-
bility (in general), are known by others (e.g., pedestrians), are prominent and easy to remember.
Another positive aspect is that landmarks are able to reassure drivers that they are making correct
decisions and hence following the right route, increasing their confidence.
Negative comments related to difficulties in identifying unnamed landmarks (e.g., identifying
“a hotel”, rather than “the Plaza hotel”), establishing the location of the landmark (i.e., right or
left side of the road), or when there were likely to be other landmarks of the same type nearby
(e.g., there can be more than one café in the vicinity).
In his field experiments, Burnett reported that less than a third as many glances were made
towards the route guidance display by drivers using a landmark-based system, compared to drivers
using an approach centred on distances. Furthermore, glance durations and perceived workload
(e.g., mental demand, street levels) were also lower when this type of information was being used.
2.2.2 Pedestrian-centred Navigation
Andrew J. May et al. [MRBT03] demonstrated that landmarks also play an essential role in this
pedestrian navigation. The authors led a requirement study with the purpose of gathering infor-
mation requirements for pedestrian navigation or, in other words, “what information they [the
pedestrians] need and how it is used”.
9
State of the Art
In this experimental study, after being shown/walked through a series of routes, participants
were asked to pinpoint the information they felt were crucial in order to achieve a successful
navigation.
Based on the premise that a good environmental cue should be pertinent in the pedestrian’s
cognitive map7 and/or visually prominent, two groups were formed: the cognitive map group and
the walkthrough group. Both groups were given the task of recording instructions to enable a
pedestrian unfamiliar with the area to navigate through a given route. The cognitive map group
were given a schematic map (with just the information needed to understand the route) of a com-
plex route and had 30 minutes to take notes and record the instructions. The same map was given
to the walkthrough group who physically walked the route. Additionally, all participants filled in
a questionnaire regarding pedestrian navigational habits among other details.
In order to identify the most useful information to be used in a pedestrian navigation context,
this information was divided into the following five categories: distance, junction, road type, street
name/number and landmarks. In order to understand how this information was used, its context
was categorised as follows:
• preview information — or preparatory information, that was used to inform the pedestrian
that he is approaching a decision point;
• identify information — its purpose is to pinpoint an exact decision point;
• confirm information — is used to assure the pedestrian that he had successfully performed
the instructed action.
Furthermore, information was also classified as either primary - extremely necessary in order
to enable the pedestrian to reach his destination - or secondary - redundant information that is not
strictly necessary, although it may help the pedestrian.
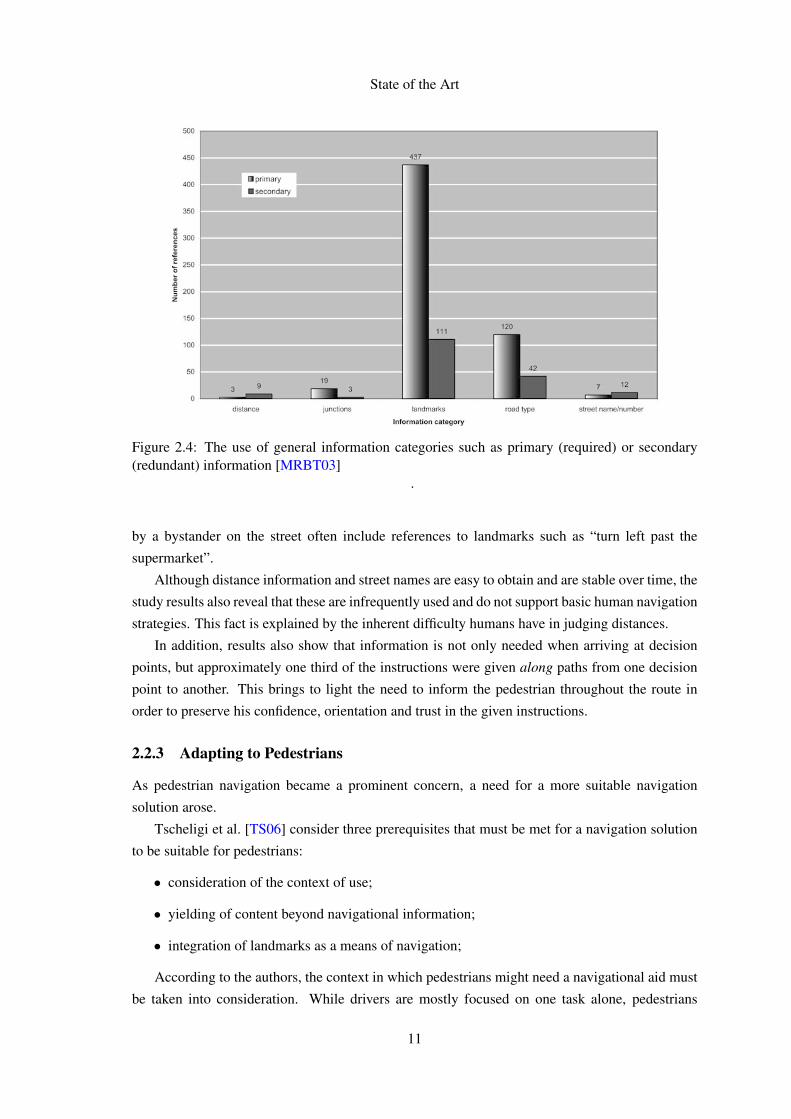
The study results, shown in Figure 2.4, demonstrated a high reliability on landmarks for guid-
ing pedestrians to their destination, being the most used as both a primary source of information,
with a 75% frequency rate, as well as secondary, with a 63% frequency rate.
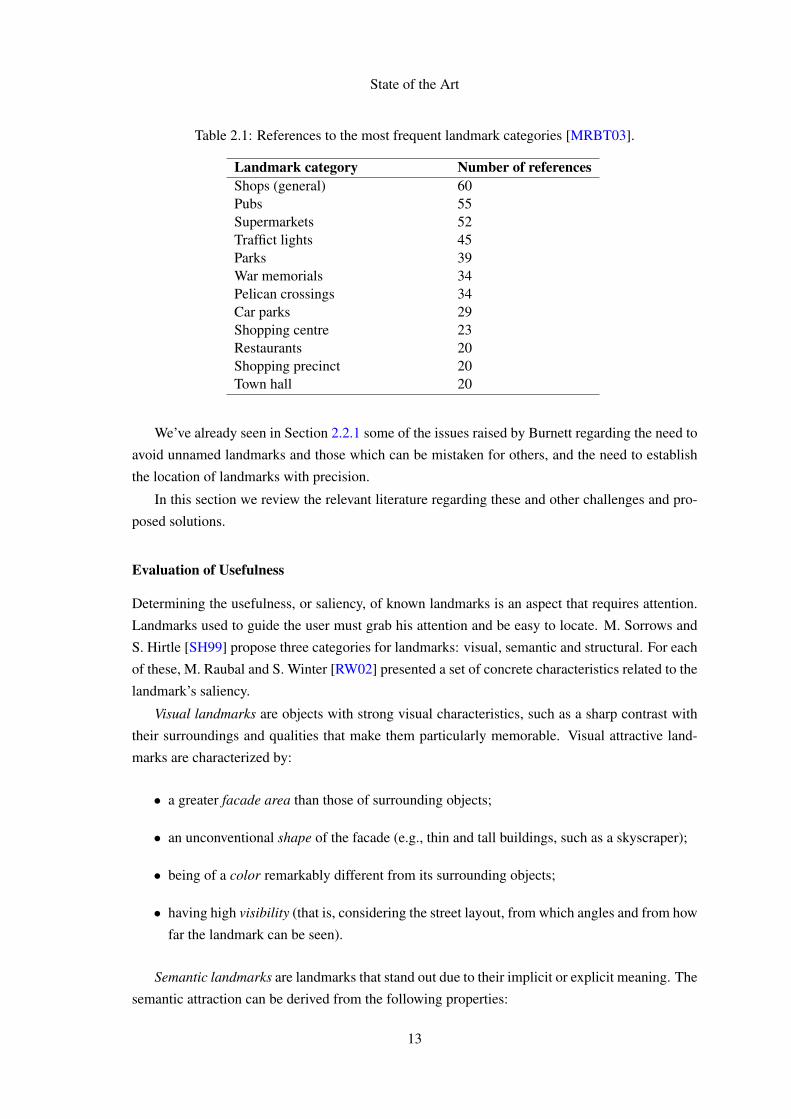
Among these landmarks, it can be seen in Table 2.1 that shops, pubs and supermarkets are the
most referenced landmarks, having been described as visually prominent and with recognisable
logos. The fact that these are located on the pedestrian route also favours their usefulness, as
opposed to Shopping precincts, for example.
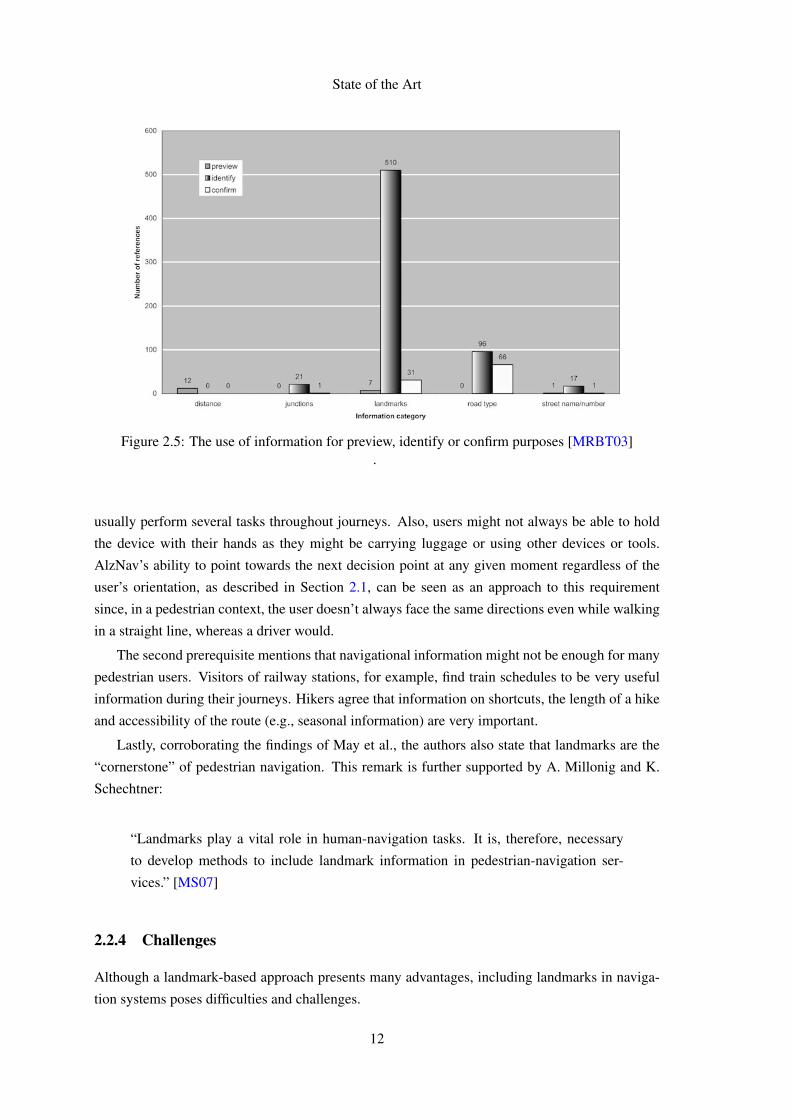
Moreover, Figure 2.5 shows that landmarks are most important for identifying purposes - e.g.,
“turn left at Sainsburys” -, although they still carry significant meaning for confirmation purposes
- e.g., “turn left, the Lunn Poly is then on your right hand side”.
These findings concluded that the frequent use of this kind of information is due in part to
the traditional usage of landmarks to help provide navigation directions, i.e., directions given
7A cognitive map is an acquired spatial representation of the environment, upon which wayfinding decisions aremade [MRBT03].
10
State of the Art
Figure 2.4: The use of general information categories such as primary (required) or secondary(redundant) information [MRBT03]
.
by a bystander on the street often include references to landmarks such as “turn left past the
supermarket”.
Although distance information and street names are easy to obtain and are stable over time, the
study results also reveal that these are infrequently used and do not support basic human navigation
strategies. This fact is explained by the inherent difficulty humans have in judging distances.
In addition, results also show that information is not only needed when arriving at decision
points, but approximately one third of the instructions were given along paths from one decision
point to another. This brings to light the need to inform the pedestrian throughout the route in
order to preserve his confidence, orientation and trust in the given instructions.
2.2.3 Adapting to Pedestrians
As pedestrian navigation became a prominent concern, a need for a more suitable navigation
solution arose.
Tscheligi et al. [TS06] consider three prerequisites that must be met for a navigation solution
to be suitable for pedestrians:
• consideration of the context of use;
• yielding of content beyond navigational information;
• integration of landmarks as a means of navigation;
According to the authors, the context in which pedestrians might need a navigational aid must
be taken into consideration. While drivers are mostly focused on one task alone, pedestrians
11
State of the Art
Figure 2.5: The use of information for preview, identify or confirm purposes [MRBT03].
usually perform several tasks throughout journeys. Also, users might not always be able to hold
the device with their hands as they might be carrying luggage or using other devices or tools.
AlzNav’s ability to point towards the next decision point at any given moment regardless of the
user’s orientation, as described in Section 2.1, can be seen as an approach to this requirement
since, in a pedestrian context, the user doesn’t always face the same directions even while walking
in a straight line, whereas a driver would.
The second prerequisite mentions that navigational information might not be enough for many
pedestrian users. Visitors of railway stations, for example, find train schedules to be very useful
information during their journeys. Hikers agree that information on shortcuts, the length of a hike
and accessibility of the route (e.g., seasonal information) are very important.
Lastly, corroborating the findings of May et al., the authors also state that landmarks are the
“cornerstone” of pedestrian navigation. This remark is further supported by A. Millonig and K.
Schechtner:
“Landmarks play a vital role in human-navigation tasks. It is, therefore, necessary
to develop methods to include landmark information in pedestrian-navigation ser-
vices.” [MS07]
2.2.4 Challenges
Although a landmark-based approach presents many advantages, including landmarks in naviga-
tion systems poses difficulties and challenges.
12
State of the Art
Table 2.1: References to the most frequent landmark categories [MRBT03].
Landmark category Number of referencesShops (general) 60Pubs 55Supermarkets 52Traffict lights 45Parks 39War memorials 34Pelican crossings 34Car parks 29Shopping centre 23Restaurants 20Shopping precinct 20Town hall 20
We’ve already seen in Section 2.2.1 some of the issues raised by Burnett regarding the need to
avoid unnamed landmarks and those which can be mistaken for others, and the need to establish
the location of landmarks with precision.
In this section we review the relevant literature regarding these and other challenges and pro-
posed solutions.
Evaluation of Usefulness
Determining the usefulness, or saliency, of known landmarks is an aspect that requires attention.
Landmarks used to guide the user must grab his attention and be easy to locate. M. Sorrows and
S. Hirtle [SH99] propose three categories for landmarks: visual, semantic and structural. For each
of these, M. Raubal and S. Winter [RW02] presented a set of concrete characteristics related to the
landmark’s saliency.
Visual landmarks are objects with strong visual characteristics, such as a sharp contrast with
their surroundings and qualities that make them particularly memorable. Visual attractive land-
marks are characterized by:
• a greater facade area than those of surrounding objects;
• an unconventional shape of the facade (e.g., thin and tall buildings, such as a skyscraper);
• being of a color remarkably different from its surrounding objects;
• having high visibility (that is, considering the street layout, from which angles and from how
far the landmark can be seen).
Semantic landmarks are landmarks that stand out due to their implicit or explicit meaning. The
semantic attraction can be derived from the following properties:
13
State of the Art
• cultural and historical importance: cathedrals and museums, for instance, carry implicit
meaning;
• explicit marks: signs in front of a building usually provide information that can’t be inferred
from the landmark’s visual properties.
A Structural landmark plays a major role in the structure of the spatial environment, such as
prominent intersections and down-town plazas. Specifically, intersections where a high number of
streets meet are considered to be structurally attractive. This can be augmented by the “quality”
of the outgoing streets, where highways carry a larger weight than footpaths. The authors also
consider boundaries, or barriers, that separate dense networks in two to be structurally attractive.
Examples include train lines, rivers or channels that form significant shapes in city maps.
Description of Landmarks
Accurately describing a landmark is not a trivial task either. R. Sefelin et al. [SBM+05] explain
that users tend to refer to the same landmarks by different names, with a few exceptions where
“only bigger chains seem to have a commonly agreed name” (e.g., Starbucks). In some cases,
describing a sign above a shop, such as “Snack bar with the illuminated green sign”, may be
more useful than the shop’s name. The authors concluded that a combination of shop-type and a
description of its sign is the optimal solution.
Data Sources
Landmarks are not static and suffer frequent changes over time, as opposed to street names which
tend to stay reliable. These objects need to be accurately located, correctly named and updated
thoroughly [DK12]. Creation and maintenance of such databases is an expensive task and requires
considerable effort.
One proposed method to obtain this kind of data is to investigate existing digital topographic
datasets [Eli02]. However, this method only gives information about objects and buildings, with
no semantic meaning.
B. Elias [Eli03] studied another technique that employs data mining methods to automatically
extract landmarks from digital cadastral maps. These computerised maps are object oriented vec-
tor databases which, in additional to property boundaries, contain information related to proper-
ties descriptions (e.g., building names), that allow the extraction of semantic knowledge regarding
landmarks. This technique also derives other information needed for evaluating the usefulness of
a landmark, such as the density of buildings in a particular area and how close a landmark is to the
road.
C. Brenner and B. Elias [BE03] went further by combining data retrieved from cadastral maps
with laser scanning data. Airborne laser scanners can be used for obtaining digital surface models
of urban areas, creating a 3D representation of the terrain. By analysing this data, it is possible
to accurately determine the visibility of a landmark. For example, in a 2D environment, buildings
14
State of the Art
Figure 2.6: Example screen from the navigation aid developed in [GGKB04].
located behind other buildings are assumed to be of low visibility. However, a 3D model may
reveal a tall church behind other small buildings which has, in fact, high visibility. This approach
grants the possibility of selecting the landmarks with the highest visibility from a user’s viewpoint
to be integrated in navigation instructions.
These approaches, however, are limited to the environments for which they were created and,
therefore, impractical for a broader usage [DK12]. Another solution to this problem that aims to
enable worldwide coverage is to develop a collaborative tool where individuals part of an active
and large community can contribute with their knowledge of landmarks in their own area. Current
approaches will be described in detail in Section 2.3.
2.2.5 Supporting Older Adults
Although the aforementioned studies had in mind a general audience without targeting any specific
demographic group, certain audiences do, however, demand further study.
Such an example is the older population, who often find their mobility obstructed by the de-
crease in cognitive abilities and aptitude for performing motor activities.
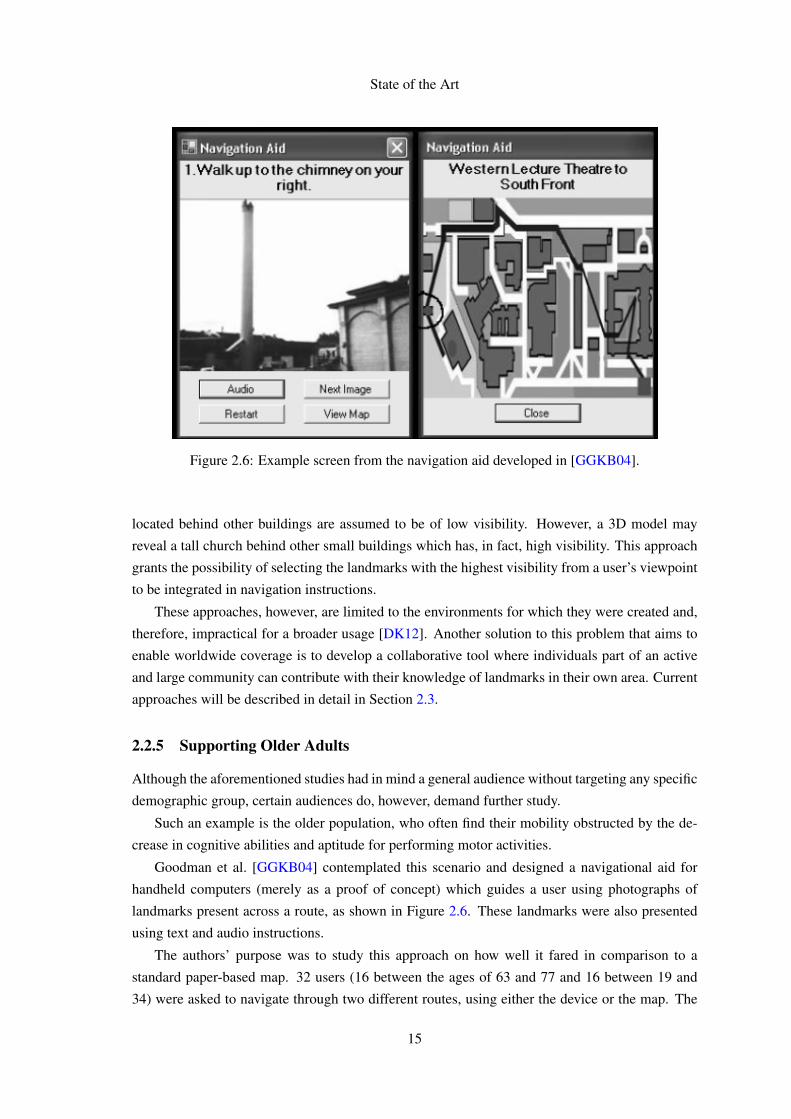
Goodman et al. [GGKB04] contemplated this scenario and designed a navigational aid for
handheld computers (merely as a proof of concept) which guides a user using photographs of
landmarks present across a route, as shown in Figure 2.6. These landmarks were also presented
using text and audio instructions.
The authors’ purpose was to study this approach on how well it fared in comparison to a
standard paper-based map. 32 users (16 between the ages of 63 and 77 and 16 between 19 and
34) were asked to navigate through two different routes, using either the device or the map. The
15
State of the Art
Figure 2.7: Perceived relative usefulness of the map and the navigation aid in [GGKB04].
experimenter, following the subject a few steps behind, took written notes on navigation behavior
and measured the time taken to travel the route and the number of times that participants got lost.
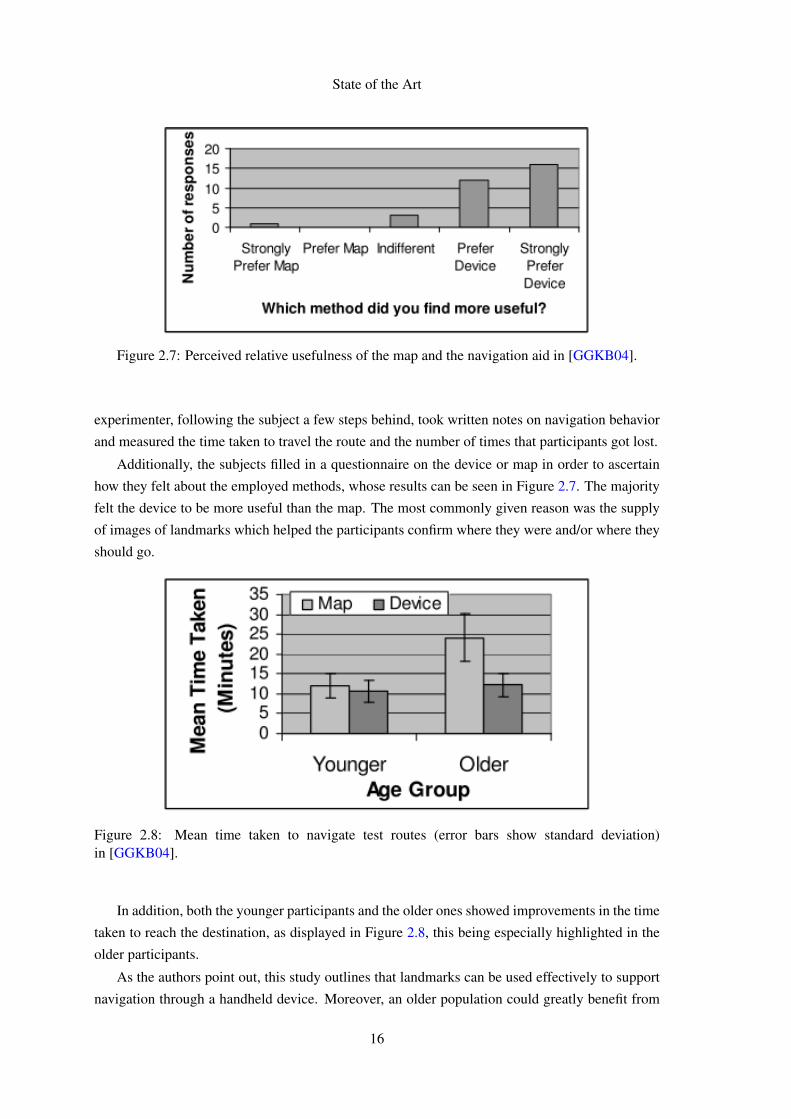
Additionally, the subjects filled in a questionnaire on the device or map in order to ascertain
how they felt about the employed methods, whose results can be seen in Figure 2.7. The majority
felt the device to be more useful than the map. The most commonly given reason was the supply
of images of landmarks which helped the participants confirm where they were and/or where they
should go.
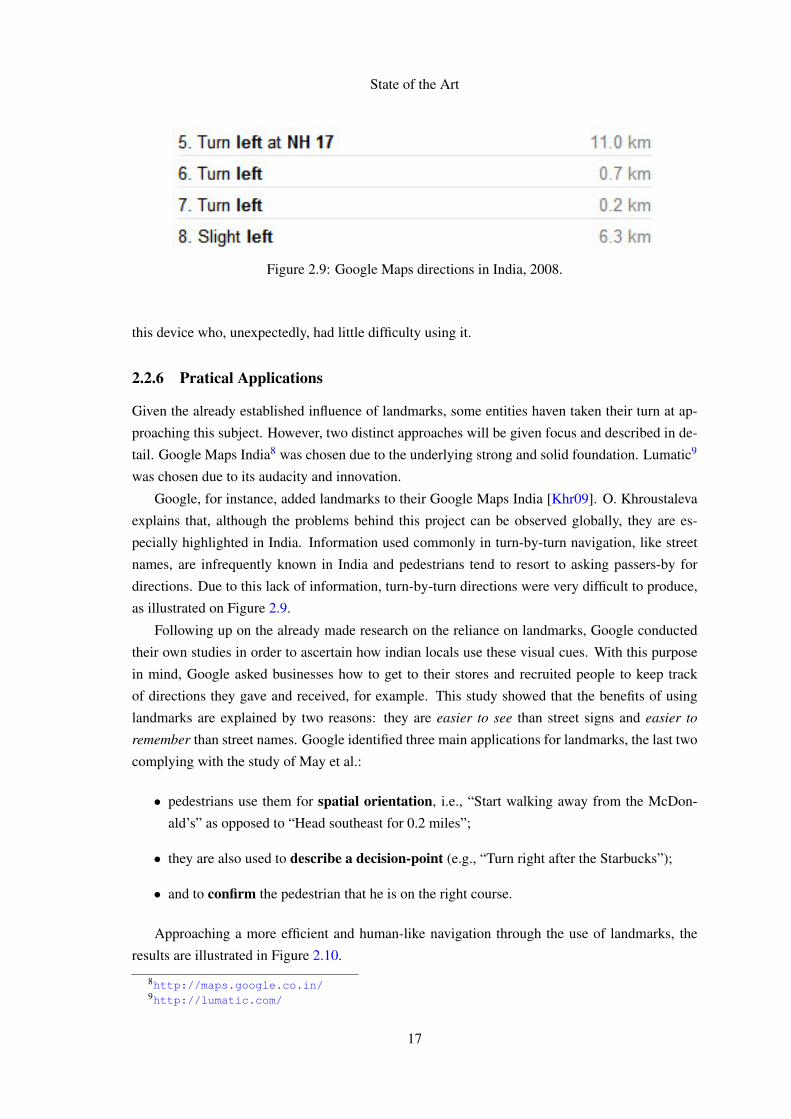
Figure 2.8: Mean time taken to navigate test routes (error bars show standard deviation)in [GGKB04].
In addition, both the younger participants and the older ones showed improvements in the time
taken to reach the destination, as displayed in Figure 2.8, this being especially highlighted in the
older participants.
As the authors point out, this study outlines that landmarks can be used effectively to support
navigation through a handheld device. Moreover, an older population could greatly benefit from
16
State of the Art
Figure 2.9: Google Maps directions in India, 2008.
this device who, unexpectedly, had little difficulty using it.
2.2.6 Pratical Applications
Given the already established influence of landmarks, some entities haven taken their turn at ap-
proaching this subject. However, two distinct approaches will be given focus and described in de-
tail. Google Maps India8 was chosen due to the underlying strong and solid foundation. Lumatic9
was chosen due to its audacity and innovation.
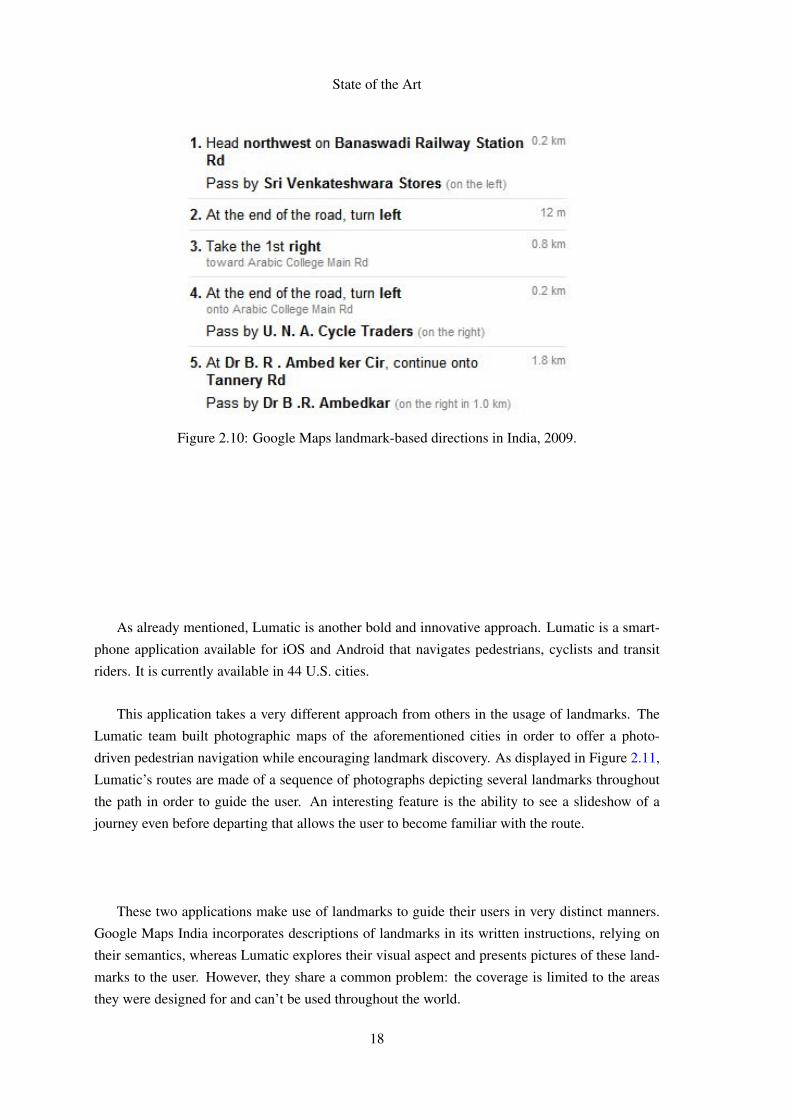
Google, for instance, added landmarks to their Google Maps India [Khr09]. O. Khroustaleva
explains that, although the problems behind this project can be observed globally, they are es-
pecially highlighted in India. Information used commonly in turn-by-turn navigation, like street
names, are infrequently known in India and pedestrians tend to resort to asking passers-by for
directions. Due to this lack of information, turn-by-turn directions were very difficult to produce,
as illustrated on Figure 2.9.
Following up on the already made research on the reliance on landmarks, Google conducted
their own studies in order to ascertain how indian locals use these visual cues. With this purpose
in mind, Google asked businesses how to get to their stores and recruited people to keep track
of directions they gave and received, for example. This study showed that the benefits of using
landmarks are explained by two reasons: they are easier to see than street signs and easier to
remember than street names. Google identified three main applications for landmarks, the last two
complying with the study of May et al.:
• pedestrians use them for spatial orientation, i.e., “Start walking away from the McDon-
ald’s” as opposed to “Head southeast for 0.2 miles”;
• they are also used to describe a decision-point (e.g., “Turn right after the Starbucks”);
• and to confirm the pedestrian that he is on the right course.
Approaching a more efficient and human-like navigation through the use of landmarks, the
results are illustrated in Figure 2.10.
8http://maps.google.co.in/9http://lumatic.com/
17
State of the Art
Figure 2.10: Google Maps landmark-based directions in India, 2009.
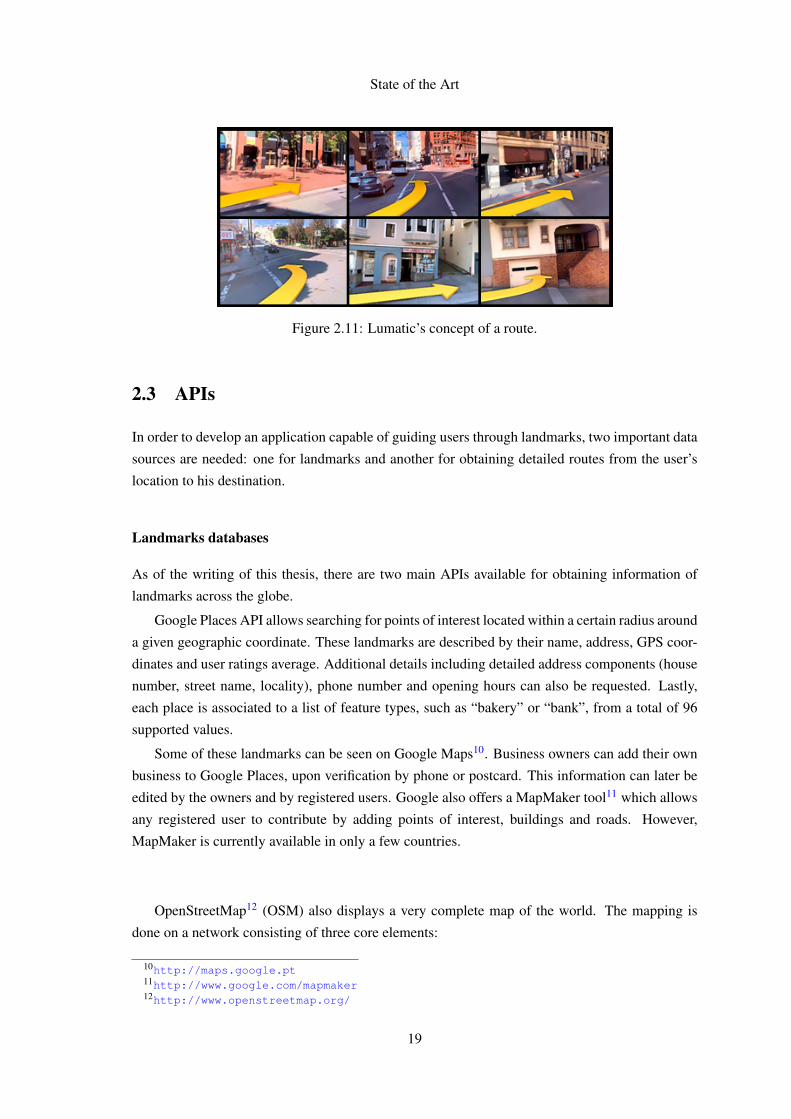
As already mentioned, Lumatic is another bold and innovative approach. Lumatic is a smart-
phone application available for iOS and Android that navigates pedestrians, cyclists and transit
riders. It is currently available in 44 U.S. cities.
This application takes a very different approach from others in the usage of landmarks. The
Lumatic team built photographic maps of the aforementioned cities in order to offer a photo-
driven pedestrian navigation while encouraging landmark discovery. As displayed in Figure 2.11,
Lumatic’s routes are made of a sequence of photographs depicting several landmarks throughout
the path in order to guide the user. An interesting feature is the ability to see a slideshow of a
journey even before departing that allows the user to become familiar with the route.
These two applications make use of landmarks to guide their users in very distinct manners.
Google Maps India incorporates descriptions of landmarks in its written instructions, relying on
their semantics, whereas Lumatic explores their visual aspect and presents pictures of these land-
marks to the user. However, they share a common problem: the coverage is limited to the areas
they were designed for and can’t be used throughout the world.
18
State of the Art
Figure 2.11: Lumatic’s concept of a route.
2.3 APIs
In order to develop an application capable of guiding users through landmarks, two important data
sources are needed: one for landmarks and another for obtaining detailed routes from the user’s
location to his destination.
Landmarks databases
As of the writing of this thesis, there are two main APIs available for obtaining information of
landmarks across the globe.
Google Places API allows searching for points of interest located within a certain radius around
a given geographic coordinate. These landmarks are described by their name, address, GPS coor-
dinates and user ratings average. Additional details including detailed address components (house
number, street name, locality), phone number and opening hours can also be requested. Lastly,
each place is associated to a list of feature types, such as “bakery” or “bank”, from a total of 96
supported values.
Some of these landmarks can be seen on Google Maps10. Business owners can add their own
business to Google Places, upon verification by phone or postcard. This information can later be
edited by the owners and by registered users. Google also offers a MapMaker tool11 which allows
any registered user to contribute by adding points of interest, buildings and roads. However,
MapMaker is currently available in only a few countries.
OpenStreetMap12 (OSM) also displays a very complete map of the world. The mapping is
done on a network consisting of three core elements:
10http://maps.google.pt11http://www.google.com/mapmaker12http://www.openstreetmap.org/
19
State of the Art
• Nodes (defined by its latitude, longitude and, optionally, altitude) can be used to represent
an intersection, a point where a street curves or a point of interest.
• Ways are ordered lists of at least 2 nodes and are visually expressed by a polyline uniting
its nodes. Ways where the first node is the same as the last (i.e., form a polygon) are said to
be closed and usually define roundabouts, barriers that go around a property or boundaries
of big places like hospitals. On the other hand, open ways are commonly used to represent
roads, highways, streams and railway lines.
• Relations define relationships between objects, may they be nodes and/or ways, and don’t
have a visual representation. A common use of relations is to group together a number of
ways (streets) where a certain bus travels, forming a bus route.
In order to give elements a meaning, all elements can contain metadata in the form of one
or more key-value tags. Although it is a free tagging system, i.e., both key and value are free
format text fields, the community agrees on a set of standard tags13. For example, a restau-
rant would contain the tag amenity=restaurant and a church would be tagged with both
amenity=place_of_worship and building=church.
Aside from mapping the usual points of interest found in Google Places (i.e., buildings, busi-
nesses, monuments), OSM supports many other objects that aren’t necessarily points of interest,
like traffic lights or public telephones, but can be proven useful for other ends, like helping a
person navigate.
OSM counts on over 500,000 users [Fre11] who are free to contribute by adding, editing or
removing data through the available APIs or through the in-browser editor Potlatch 2. Although
the service provides an API of its own, there’s an extensive list of other third-party services that
allow querying and editing this database for many specific purposes. The MapQuest API, for
instance, makes use of OSM data to provide users with turn-by-turn directions and the Taginfo
API provides users with ways to retrieve statistics about which tags are being used, how often,
where they are used the most and so on.
The Overpass API14 is another example. It’s a read-only API optimised for data consumers that
enables retrieval of OSM elements. Furthermore, it introduces the Overpass QL query language
enabling users to search for elements inside a given bounding box, by name, by tag contents, by
hierarchical relationship between elements and other more complex operations. This service can,
therefore, be very useful for obtaining detailed information about nearby landmarks.
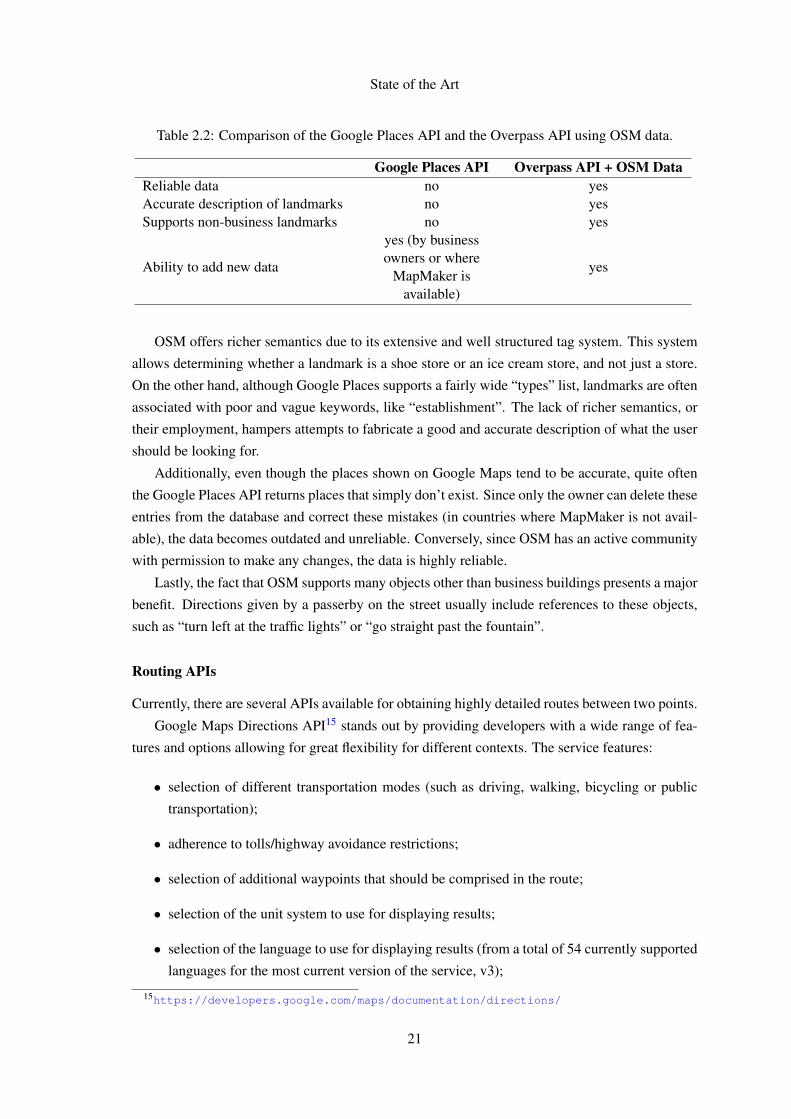
Comparing these services in the context of landmark-based navigation systems, the Overpass
API takes the lead by presenting key advantages over the Google Places API, critical to the success
of such systems. These advantages are summarised in Table 2.2.
13http://wiki.openstreetmap.org/wiki/Map_Features14http://wiki.openstreetmap.org/wiki/Overpass_API
20
State of the Art
Table 2.2: Comparison of the Google Places API and the Overpass API using OSM data.
Google Places API Overpass API + OSM DataReliable data no yesAccurate description of landmarks no yesSupports non-business landmarks no yes
Ability to add new data
yes (by businessowners or where
MapMaker isavailable)
yes
OSM offers richer semantics due to its extensive and well structured tag system. This system
allows determining whether a landmark is a shoe store or an ice cream store, and not just a store.
On the other hand, although Google Places supports a fairly wide “types” list, landmarks are often
associated with poor and vague keywords, like “establishment”. The lack of richer semantics, or
their employment, hampers attempts to fabricate a good and accurate description of what the user
should be looking for.
Additionally, even though the places shown on Google Maps tend to be accurate, quite often
the Google Places API returns places that simply don’t exist. Since only the owner can delete these
entries from the database and correct these mistakes (in countries where MapMaker is not avail-
able), the data becomes outdated and unreliable. Conversely, since OSM has an active community
with permission to make any changes, the data is highly reliable.
Lastly, the fact that OSM supports many objects other than business buildings presents a major
benefit. Directions given by a passerby on the street usually include references to these objects,
such as “turn left at the traffic lights” or “go straight past the fountain”.
Routing APIs
Currently, there are several APIs available for obtaining highly detailed routes between two points.
Google Maps Directions API15 stands out by providing developers with a wide range of fea-
tures and options allowing for great flexibility for different contexts. The service features:
• selection of different transportation modes (such as driving, walking, bicycling or public
transportation);
• adherence to tolls/highway avoidance restrictions;
• selection of additional waypoints that should be comprised in the route;
• selection of the unit system to use for displaying results;
• selection of the language to use for displaying results (from a total of 54 currently supported
languages for the most current version of the service, v3);
15https://developers.google.com/maps/documentation/directions/
21
State of the Art
• request of alternative routes;
• reliance on several means of transportation like subways, trams, buses, ferries or funiculars
(for the public transportation mode).
The routes are represented as a sequence of waypoints - or decision points - through which the
user must pass in the given order to reach his destination. In order to enable a finer representation
of a route, Google recently included encoded polylines in their API responses. These are made of
a sequence of points that represent with a higher definition a smoothed path of the corresponding
set of directions.
MapQuest also offers a Directions Web Service16. Although its features are very similar to
Google Map Directions’, some distinctions can be made:
• it allows two different modes for drivers: fastest (quickest driving time) and shortest (short-
est driving distance);
• may take timed conditions like Timed Turn Restrictions (e.g. “No right turns 7am-9am”) or
Seasonal Closures into consideration;
• estimates fuel usage for the driving modes based on the vehicle’s fuel efficiency and the
user’s driving style (cautious, normal or aggressive).
Additionally, MapQuest provides two data sets: Licensed Data and Open Data. The former is
a business-oriented solution that is built upon commercially updated and reliable data. It includes
traffic data and accurate geocoding17.The latter, as the name implies, is based on open data from
open-source communities, being OpenStreetMap18 the primary source. This option offers a larger
database of footpaths and bike paths as well as elevation data.
Regarding mapping quality, a growing number of services embracing OpenStreetMap has been
recorded recently. In fact, some of these had been using Google Maps before switching to OSM as
a primary data source. As reported by the OSM Foundation in March 2012 [Ben12], Apple is now
using OSM data in its iPhoto application. Foursquare19, following the footsteps of Nestoria20, also
dropped support of Google Maps in favor of OSM [Fou12]. Nestoria stated that “OSM maps are
of equal or better quality than any other widely available mapping service” thanks to the work of
its many volunteers [Fre11].
16http://www.mapquestapi.com/directions/17“Geocoding is an uncertain process that associates an address or a place name with geographic coordinates” [RK10]18http://www.openstreetmap.org/19https://foursquare.com/20http://www.nestoria.co.uk/
22
State of the Art
2.4 Summary
In this chapter, two major concepts of how humans should be navigated were explored.
Turn-by-turn navigation is a well established notion and played an important role throughout
the history of navigational applications. It is by far the most popular mean of giving directions to
a user, may it be a pedestrian or a driver, and relies on easily obtainable information. As such, it
can be perceived as a simple way to integrate guidance in a navigation system.
Nonetheless, we saw in Section 2.2 that turn-by-turn navigation is not the most efficient form
of user guidance. A landmark-based approach has proven to produce better results, in both driver
and pedestrian-centred contexts.
Various topics - such as what a landmark is, how and when they are useful and how pedestrians
benefit from their usage - were clarified. The research of May et al. [MRBT03] shows that these
can be used for 3 distinct purposes, most notably to identify a decision point where a navigation
manoeuvre should be made. Challenges in integrating this kind of data in navigation instructions
were also identified, such as the need to accurately describe landmarks (which demands a good
data source), to locate them with precision to ease the perception of the user, and also to evaluate
their usefulness. This thesis will address these problems.
Closing in on the problem domain, preliminary research regarding the applicability of a
landmark-based approach to navigability targeting an older population was presented. This re-
search shows that a handheld device with a simple design and making use of visually prominent
landmarks to guide its users brings forward great results, when compared to a paper-based map.
Still, much work needs to be done regarding these topics.
Some of the studies only account for human-human interaction, i.e., how useful landmarks are
when a persons instructs another on how to get to his destination. Although this can be seen as
a good indicator that, for instance, a smartphone landmark-based navigation system would show
similar results, this has not been yet fully explored.
The older population, in particular, has not been given sufficient attention. Although Goodman
et al.’s findings suggest that a mobile landmark-based navigational aid may be useful, this approach
still needs to be compared with other modern navigational means, other than paper-based maps.
23

State of the Art
24
Chapter 3
The Elderly: Landmarks orTurn-by-turn?
The present chapter aims to lay out a clear definition of the problem that the author aims to solve
and the methodology used to achieve this goal.
3.1 Problem Formalisation
As made clear in Chapter 2, there is a need to aid and investigate increasingly better solutions
to solve several common problems in an older population, especially in dementia patients. This
work focuses on their mobility difficulties and adjacent problems, such as lack of confidence when
going outdoors, dependency on their caregivers and the stress inflicted on both parties.
In the previous chapter, existing work has been reviewed. It was observed that, although most
current navigation systems usually guide the user to his destination using turn-by-turn directions,
this is not the most efficient approach to the problem; landmark-based approaches have revealed
greater results in guiding pedestrians. Landmarks have been proven to play a key role in naviga-
tion regarding a general audience and studies indicate that they are also meaningful for an older
population [GGKB04]. Furthermore, previous studies indicate that, even though Alzheimer’s Dis-
ease (the most common form of dementia) patients have their spatial cognition ability compro-
mised, patients are still able to retain and process information from objects relevant to navigabil-
ity [KvDJ11].
Although several important discoveries have been made, there are still plenty of questions in
need of answers. The true impact of a landmark-based navigation system on an older population
with cognitive impairments, when compared to modern turn-by-turn systems, remains illusive.
This is a gap that, if bridged, may open way to further development of full-fledged navigation
systems more suitable for the older population.
25
The Elderly: Landmarks or Turn-by-turn?
The present work aims to fulfil this need by developing a prototype of a pedestrian-centred
navigational application focused on older adults and persons with mild cognitive impairments was
developed on top of AlzNav. This application is capable of adopting either a landmark-based or a
turn-by-turn navigation style and is described in detail in Chapter 4.
3.2 Methodological Approach
An empirical method of experimentation [ZW97] was used to validate the developed prototype
and to achieve an answer to the posed question.
A set of methods and measures were proposed to evaluate the impact of both hypotheses on the
navigation performance of the elderly. These were put into practice, and data was collected from
controlled field experiments with the target audience, according to the field study observational
method. By working in a real world environment, it is possible to obtain realistic and trustworthy
data, leading to realistic conclusions. In these experiments, attention was given to two aspects:
• Replication: the experiments must be able to be replicated by other researchers. To this
effect, we make sure the unanticipated variables are not affecting the results.
• Local control: the treatment (running of an experiment) applied to each subject should
have little degree of variation; the experiments should be as similar as possible to ensure
consistency.
26
Chapter 4
AlzNav with Landmarks: a Prototype
This chapter describes the developed prototype. An overview of the application is followed by
the description of relevant previous work. A detailed specification of the developed system is then
described. Finally, implementation decisions and details are presented.
4.1 Overview
With the intent to approach and solve the problem at hand, a prototype of a pedestrian-centred
navigation system that implements both landmark-based and turn-by-turn navigation styles was
built.
As such, this prototype had AlzNav as its starting point. As previously mentioned in Sec-
tion 2.1, AlzNav is an application for Android smartphones, focused on older adults. Its wide
range of features aims to solve several problems, such as spatial disorientation and decreased
navigation skills.
More importantly, AlzNav implements a navigation module aimed at elderly pedestrians, mak-
ing use of MapQuest’s1 directions service to supply the user with turn-by-turn instructions. This
module was partially re-written, making room for a new subsystem. By default, the developed sub-
system generates landmark-based instructions, whenever possible, by (1) fetching landmark data
from the OSM2 database through the Overpass API3 and (2) blending it with route data retrieved
from MapQuest.
When the landmark-based mode is turned off or when landmark data is either insufficient,
non-existent or unavailable, turn-by-turn messages are produced from MapQuest’s data; these
are sometimes combined with situational data retrieved from the device’s sensors, such as the
distance between the user and the next decision point. If, on the other hand, the available data is
1http://open.mapquestapi.com/directions/2http://www.openstreetmap.org/3http://wiki.openstreetmap.org/wiki/Overpass_API
27
AlzNav with Landmarks: a Prototype
more than meets the needs, landmarks are evaluated according to their characteristics (e.g., width,
uniqueness, location) and the most useful ones are selected.
The instructions conform to a typology similar to the one proposed by May et al. [MRBT03],
and so, take one of the following forms:
• Preview instructions, supplied after a manoeuvre, give advance warning of the next manoeu-
vre to be made - “In 100 metres, turn right after passing a restaurant”;
• Confirmation instructions, relayed periodically while the user is walking from one decision
point to another, give information of his surroundings so as to assure him that he is on the
right track and decisions made so far were correct - “Continue on this route. You should see
a church to your left”;
• Identification instructions, delivered when approaching a decision point, pinpoint the loca-
tion where the user should take an action - “Turn left at the traffic light”.
The instructions are delivered to the user in a timely manner, in the same fashion as the one
previously developed: the message appears written on the device’s screen and is dictated to the
user, using the device’s Text-To-Speech (TTS) system.
It should also be noted that AlzNav has support for both the english and portuguese languages,
and so does the developed subsystem.
4.2 Initial Setting
As already mentioned, AlzNav uses MapQuest’s directions API as a data source for its navigation
module, meant to guide the user back home. This information comes as a sequence of waypoints
(or decision points), and their coordinates, through which the user should pass before reaching his
goal (i.e., his home) and turn-by-turn instructions that describe the actions the user should take at
those points. These instructions are parsed as simple text strings, without further processing.
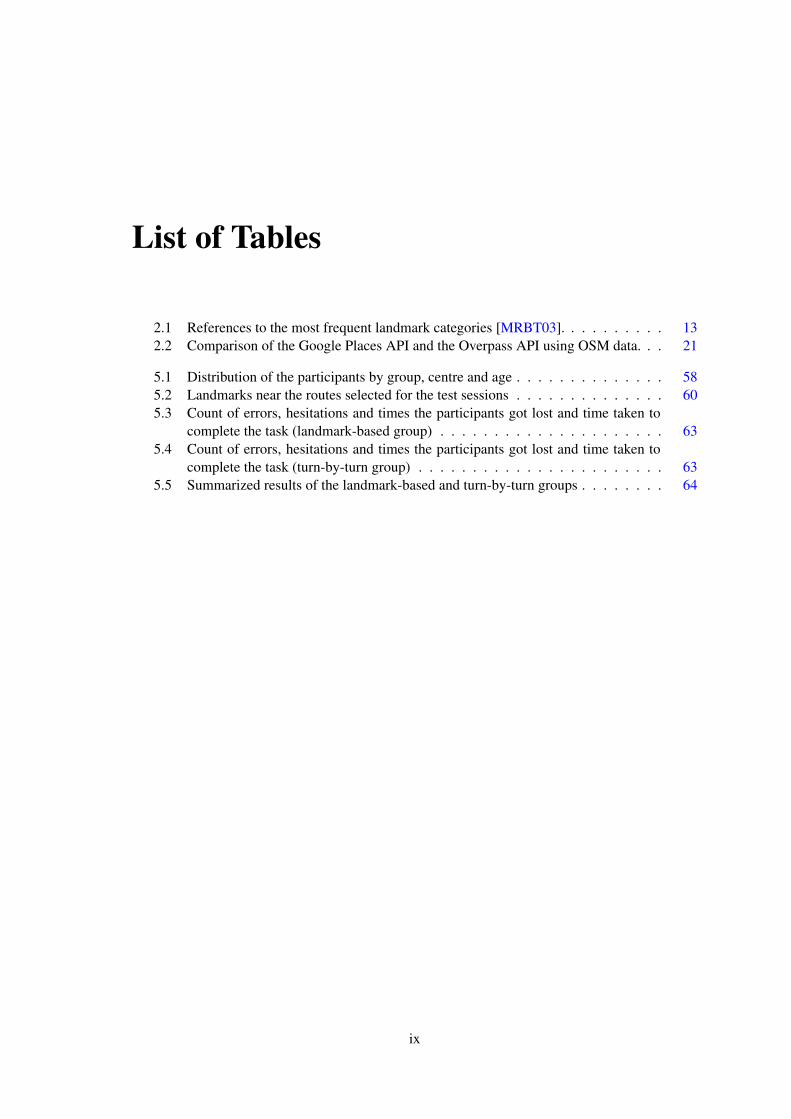
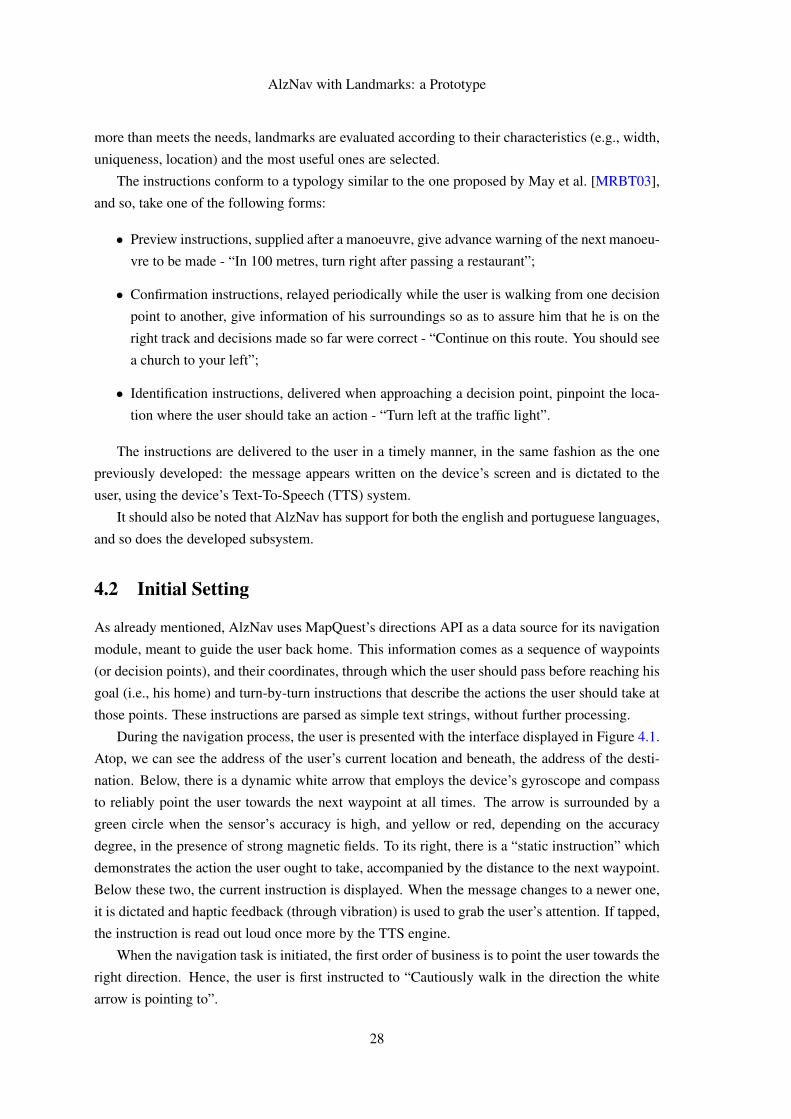
During the navigation process, the user is presented with the interface displayed in Figure 4.1.
Atop, we can see the address of the user’s current location and beneath, the address of the desti-
nation. Below, there is a dynamic white arrow that employs the device’s gyroscope and compass
to reliably point the user towards the next waypoint at all times. The arrow is surrounded by a
green circle when the sensor’s accuracy is high, and yellow or red, depending on the accuracy
degree, in the presence of strong magnetic fields. To its right, there is a “static instruction” which
demonstrates the action the user ought to take, accompanied by the distance to the next waypoint.
Below these two, the current instruction is displayed. When the message changes to a newer one,
it is dictated and haptic feedback (through vibration) is used to grab the user’s attention. If tapped,
the instruction is read out loud once more by the TTS engine.
When the navigation task is initiated, the first order of business is to point the user towards the
right direction. Hence, the user is first instructed to “Cautiously walk in the direction the white
arrow is pointing to”.
28
AlzNav with Landmarks: a Prototype
Figure 4.1: AlzNav’s navigation module interface
From there on, upon entering a predetermined radius around a waypoint, the user is shown the
respective instruction supplied by MapQuest - the actual radius depends on the current GPS accu-
racy. The system assumes the user has successfully completed the manoeuvre when he exits this
radius and starts walking towards the next waypoint. At this point, the user is shown a reassurance
message (“You are doing well. Continue on this route.”), repeated every 50 metres.
If at any moment the user starts walking away from the next waypoint up to a distance of
20 metres, the system infers that he took the wrong path and activates the rerouting mechanism,
generating a new route and set of instructions.
Reaching the last waypoint, the user is presented with one final message, “Welcome home”,
and, if available, a picture of his house taken from Google Map’s Street View.
During this dissertation, the parsing of the instructions received from the MapQuest API was
improved, in order to accommodate the new functionalities.
4.3 Specification
This section details the intended behaviour and architecture of the developed subsystem. This is
accomplished by listing both non-functional and functional requirements and a detailed view of
the subsystem’s class model using UML. At the end of this section, the methodology used during
the development phase is explained.
Although it is usual to specify the use cases of the system, in conversation with the entities
involved, it was agreed that such specification was not warranted. The reason for this decision is
that, from the user’s perspective, his only use case is to be navigated back home.
29
AlzNav with Landmarks: a Prototype
4.3.1 Non-functional Requirements
Four non-functional requirements critical to the success of the developed prototype were identified
and are described below.
Reliability
First and foremost, the subsystem should, within its possibilities, provide reliable information.
The effects of unreliable or wrong instructions could range from confusing the user, to sending
him in a wrong direction, defeating the application’s goal and losing the user’s trust in the system.
If the most valuable data is not accurate enough, the subsystem should fall back on other reliable
information. For example, if a landmark’s address cannot be determined with certainty, other
more reliable landmarks should be used and, as a last resort, turn-by-turn instructions should be
generated.
Lightweight
The subsystem should be as lightweight as possible, since it will run on mobile devices with
limited resources. The existing application already takes advantage of numerous and intensive
resources, such as the phone’s GPS, geomagnetic field and gyroscope sensors, making AlzNav
a hardware intensive software. Therefore, the developed subsystem should avoid escalating this
factor.
Extensiveness
The subsystem should be easily extendable to accommodate other data sources. If the need to in-
corporate a more useful source of landmarks data arises, the architecture should display a suitable
level of abstraction to simplify this task.
Internationalisation
The subsystem should support internationalisation, that is, the support of multiple languages. This
implies providing multiple translations of landmarks and other hard coded data, being able to
request and process data from the APIs in multiple languages, and translating the data shown
on the interface (including instructions) to the user’s native language. It should be made easy to
implement support for other languages in the future.
4.3.2 Functional Requirements
In under to understand the main expected functionalities, the functional requirements of the sub-
system were gathered. The subsystem must be able to:
• obtain landmarks data from OpenStreetMap using the Overpass API;
30
AlzNav with Landmarks: a Prototype
• evaluate the available landmarks’ usefulness and select the most valuable for generating
instructions;
• generate preview, confirmation and identification instructions;
• incorporate landmarks data into the given instructions when available;
• fall back to other available information (such as street addresses) when landmarks data is
not available;
• deliver the generated instructions to the user in a timely manner, both visually and audibly;
• avoid overlapping instructions;
• allow the user to disable landmark-based instructions, making all generated instructions
adopt a turn-by-turn format;
• support both english and portuguese idioms.
4.3.3 Class Model
AlzNav’s previous architecture links to the subsystem through a Route object, handled by the
Navigation Android Activity.
A route is composed of a sequence of Steps, here defined as paths that link two consecutive
decision points. This class acts as a higher-level interface and single entry point for the subsystem,
exhibiting a structure and behaviour alike the Facade design pattern (Figure 4.2). This facade
allows the subsystem’s clients to easily determine where the user should head and which messages
to show him. A step is instantiated with a pair of geographic coordinates (branded by the Android
class GeoPoint), a set of addresses, and an instruction as received from the web service. Steps
are usually a line segment, but they may also be an approximation of a curve, made up of several
smaller line segments - SubSteps.
Each Step is in charge of handling its own landmark data, making use of an abstract Land-
marksProvider that obtains it from a web service. Naturally, the concrete class OverpassLand-
marksProvider implements this behaviour using the Overpass API. This, in turn, uses a Overpass-
LandmarksParser that parses the received JSON object and returns a set of Landmark objects,
owned by the Step that invoked this chain of events.
A Landmark has a name, an orientation (left or right side of the street, or neither if on the
street), two scores, and the distances to the step and the next decision point (in metres). The
scores are set by the eval() method, implemented by subclasses, that determines the landmark’s
usefulness. It is subclassed by OSMLandmark, which has an address and is, in turn, subclassed by
two other classes:
31
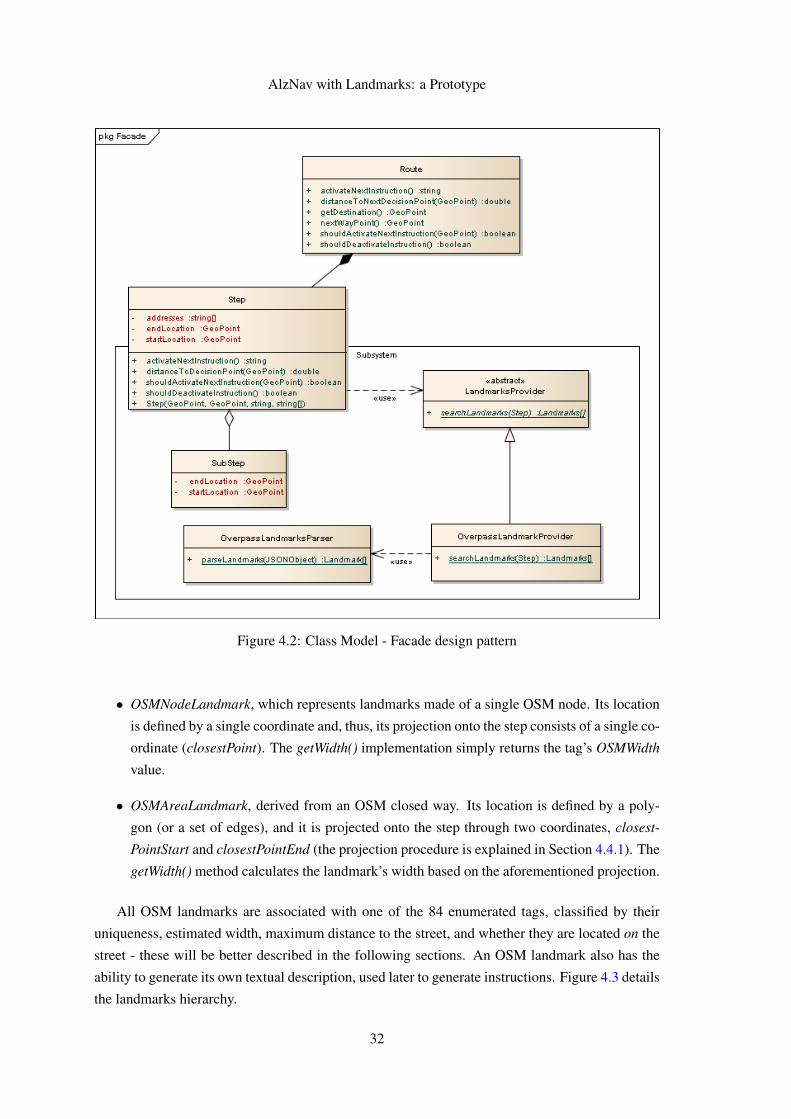
AlzNav with Landmarks: a Prototype
Figure 4.2: Class Model - Facade design pattern
• OSMNodeLandmark, which represents landmarks made of a single OSM node. Its location
is defined by a single coordinate and, thus, its projection onto the step consists of a single co-
ordinate (closestPoint). The getWidth() implementation simply returns the tag’s OSMWidth
value.
• OSMAreaLandmark, derived from an OSM closed way. Its location is defined by a poly-
gon (or a set of edges), and it is projected onto the step through two coordinates, closest-
PointStart and closestPointEnd (the projection procedure is explained in Section 4.4.1). The
getWidth() method calculates the landmark’s width based on the aforementioned projection.
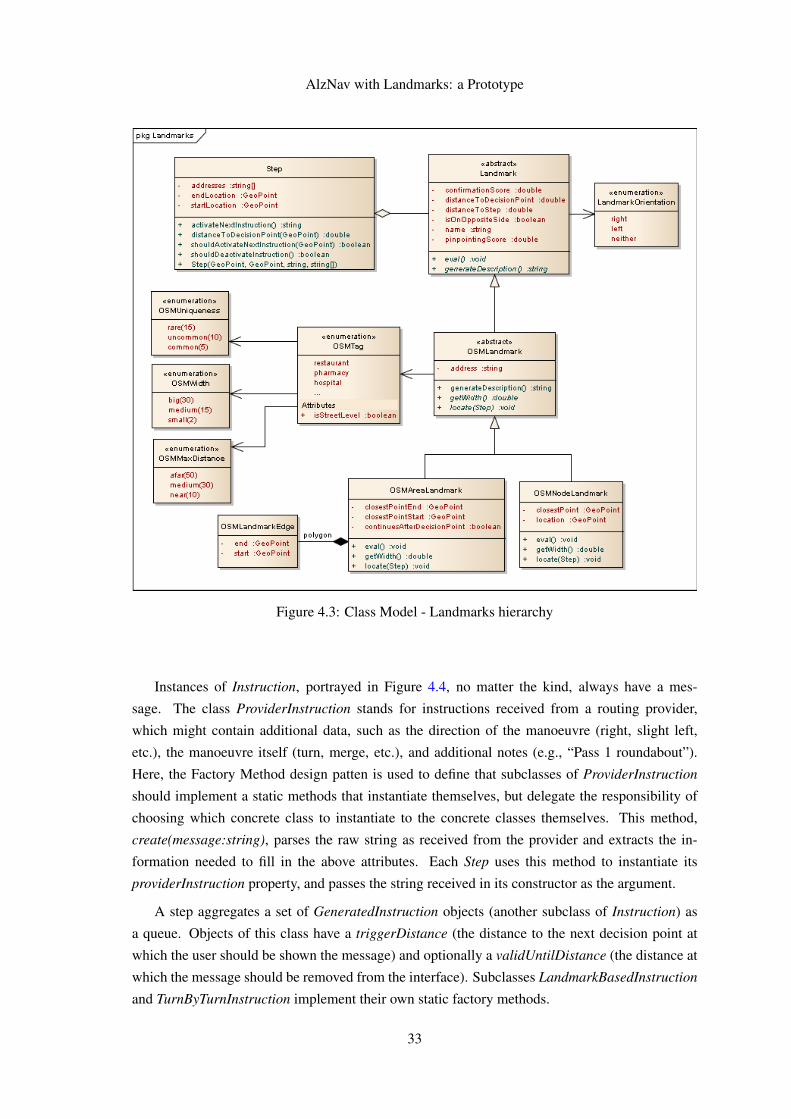
All OSM landmarks are associated with one of the 84 enumerated tags, classified by their
uniqueness, estimated width, maximum distance to the street, and whether they are located on the
street - these will be better described in the following sections. An OSM landmark also has the
ability to generate its own textual description, used later to generate instructions. Figure 4.3 details
the landmarks hierarchy.
32
AlzNav with Landmarks: a Prototype
Figure 4.3: Class Model - Landmarks hierarchy
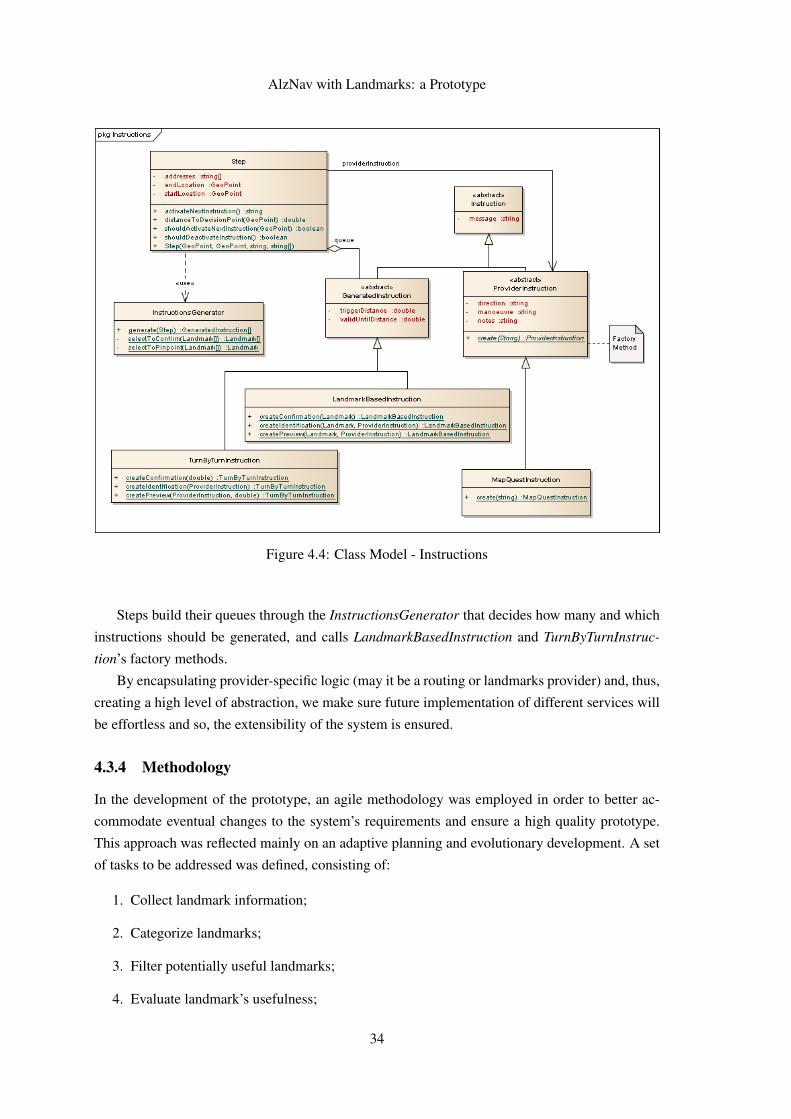
Instances of Instruction, portrayed in Figure 4.4, no matter the kind, always have a mes-
sage. The class ProviderInstruction stands for instructions received from a routing provider,
which might contain additional data, such as the direction of the manoeuvre (right, slight left,
etc.), the manoeuvre itself (turn, merge, etc.), and additional notes (e.g., “Pass 1 roundabout”).
Here, the Factory Method design patten is used to define that subclasses of ProviderInstruction
should implement a static methods that instantiate themselves, but delegate the responsibility of
choosing which concrete class to instantiate to the concrete classes themselves. This method,
create(message:string), parses the raw string as received from the provider and extracts the in-
formation needed to fill in the above attributes. Each Step uses this method to instantiate its
providerInstruction property, and passes the string received in its constructor as the argument.
A step aggregates a set of GeneratedInstruction objects (another subclass of Instruction) as
a queue. Objects of this class have a triggerDistance (the distance to the next decision point at
which the user should be shown the message) and optionally a validUntilDistance (the distance at
which the message should be removed from the interface). Subclasses LandmarkBasedInstruction
and TurnByTurnInstruction implement their own static factory methods.
33
AlzNav with Landmarks: a Prototype
Figure 4.4: Class Model - Instructions
Steps build their queues through the InstructionsGenerator that decides how many and which
instructions should be generated, and calls LandmarkBasedInstruction and TurnByTurnInstruc-
tion’s factory methods.
By encapsulating provider-specific logic (may it be a routing or landmarks provider) and, thus,
creating a high level of abstraction, we make sure future implementation of different services will
be effortless and so, the extensibility of the system is ensured.
4.3.4 Methodology
In the development of the prototype, an agile methodology was employed in order to better ac-
commodate eventual changes to the system’s requirements and ensure a high quality prototype.
This approach was reflected mainly on an adaptive planning and evolutionary development. A set
of tasks to be addressed was defined, consisting of:
1. Collect landmark information;
2. Categorize landmarks;
3. Filter potentially useful landmarks;
4. Evaluate landmark’s usefulness;
34
AlzNav with Landmarks: a Prototype
5. Select the best landmarks;
6. Generate and schedule instructions;
7. Deliver instructions;
8. Disable/enable landmark-based navigation mode.
These tasks were assigned an initial estimate of the required time to be developed. At the
end of each iteration, a retrospective process was necessary in order to improve the iterations that
followed. So, by taking into account the disparity between the expected required time and the
actual time taken to fulfil a task, the estimates were reviewed and adjusted accordingly.
The source code was maintained in a SVN version control system. This enabled an easy and
systematic code review process, prior to each commit. Furthermore, having an history of the
developed work allowed to easily find the source of recently introduced bugs.
4.4 Landmark Processing Cycle
In this section the processing cycle of landmarks data is presented, along with the main imple-
mentation decisions. For each step of the route, the Overpass API is used to extract OSM data
about the surrounding landmarks. Section 4.4.1 describes how the data is processed and the cal-
culations used to obtain additional information needed for the following stages of the cycle. Next,
the obtained landmarks undergo a screening process, where irrelevant data is discarded - reported
in Section 4.4.2. Armed with all the needed information, the systems then generates a set of in-
structions (Section 4.4.3) for a given step. This cycle is repeated for every step of the route. If
the user has disabled the landmark-based navigation mode, then the prototype goes directly to the
third step and generates turn-by-turn instructions.
The output of this cycle is then delivered to the user throughout the journey, as described in
Section 4.4.4.
The activity diagram in Figure 4.5 illustrates these actions performed by the subsystem in
order to fulfil its goal.
4.4.1 Data Processing
Data Querying
When the user requests to be navigated back home, the application first asks MapQuest for di-
rections. The MapQuest API allows the developer to ask for the instructions to be delivered in
microformat. With this, segments of the sentence are enveloped in HTML span tags with classes
such as street-name and relative-dir, permitting an automated extraction of important
pieces of information (e.g., extracting “Rua Alfredo Allen” and “right” from “Turn right onto Rua
Alfredo Allen.”). Instructions might also contain additional notes, such as “Pass 1 roundabout”.
35
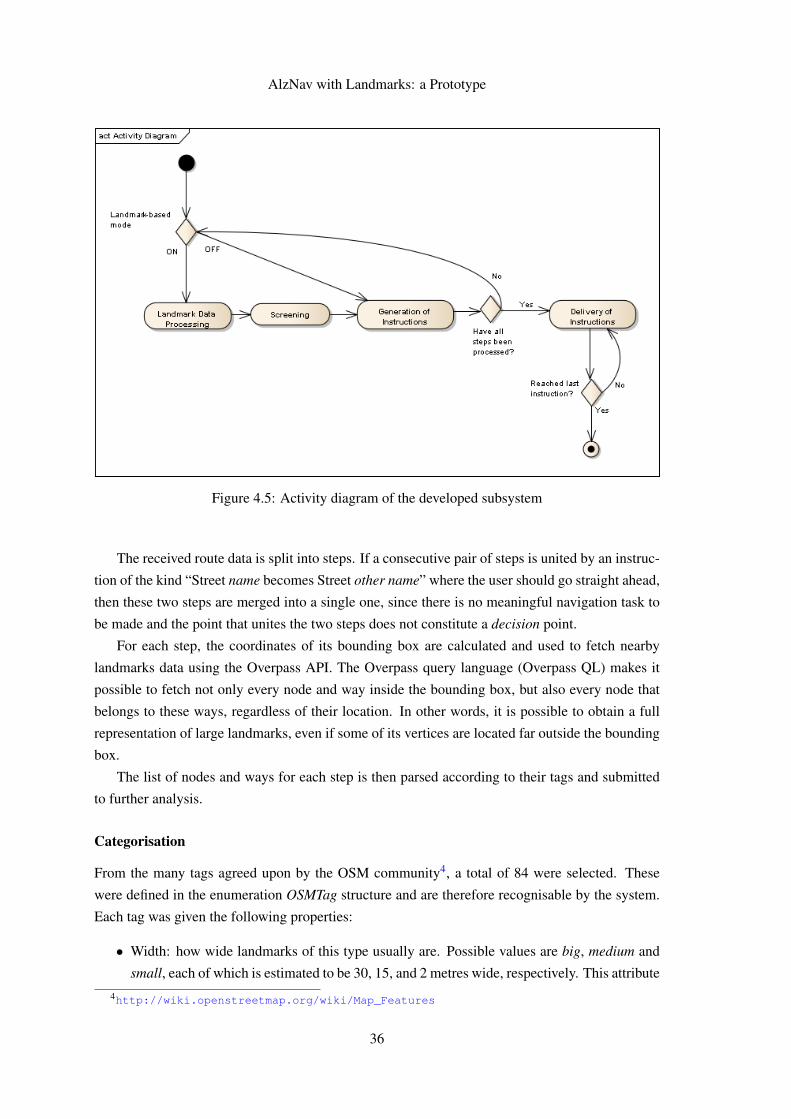
AlzNav with Landmarks: a Prototype
Figure 4.5: Activity diagram of the developed subsystem
The received route data is split into steps. If a consecutive pair of steps is united by an instruc-
tion of the kind “Street name becomes Street other name” where the user should go straight ahead,
then these two steps are merged into a single one, since there is no meaningful navigation task to
be made and the point that unites the two steps does not constitute a decision point.
For each step, the coordinates of its bounding box are calculated and used to fetch nearby
landmarks data using the Overpass API. The Overpass query language (Overpass QL) makes it
possible to fetch not only every node and way inside the bounding box, but also every node that
belongs to these ways, regardless of their location. In other words, it is possible to obtain a full
representation of large landmarks, even if some of its vertices are located far outside the bounding
box.
The list of nodes and ways for each step is then parsed according to their tags and submitted
to further analysis.
Categorisation
From the many tags agreed upon by the OSM community4, a total of 84 were selected. These
were defined in the enumeration OSMTag structure and are therefore recognisable by the system.
Each tag was given the following properties:
• Width: how wide landmarks of this type usually are. Possible values are big, medium and
small, each of which is estimated to be 30, 15, and 2 metres wide, respectively. This attribute4http://wiki.openstreetmap.org/wiki/Map_Features
36
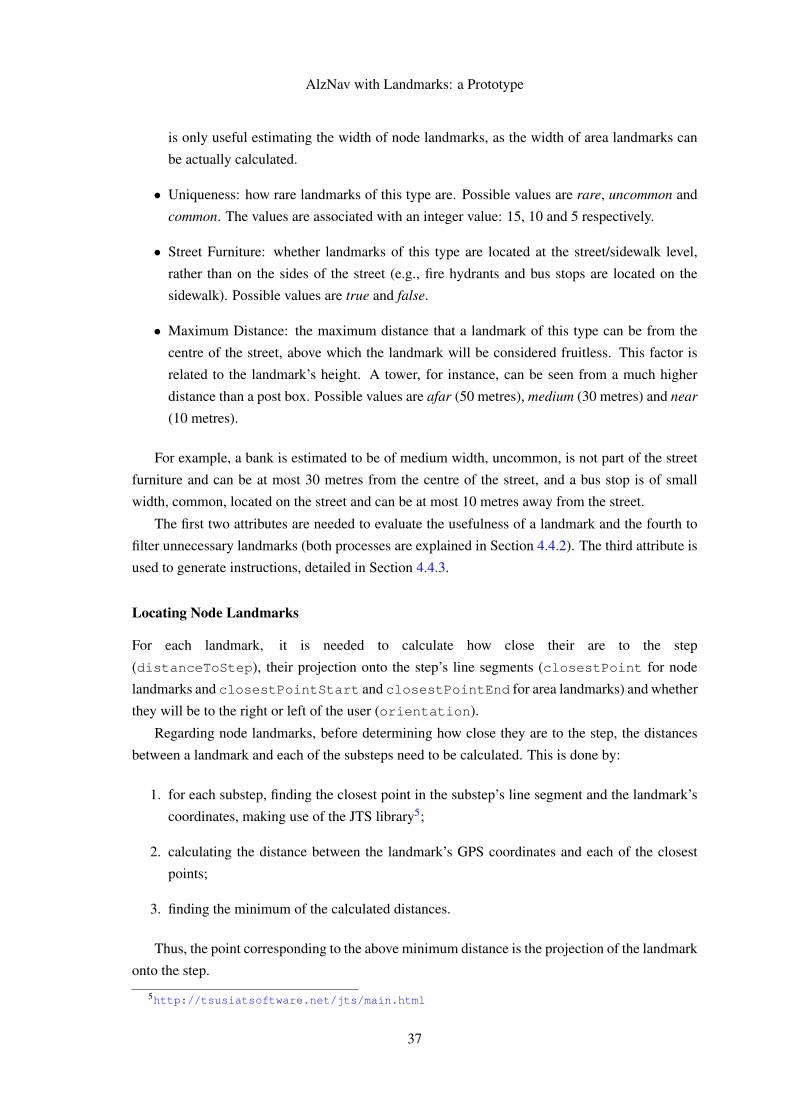
AlzNav with Landmarks: a Prototype
is only useful estimating the width of node landmarks, as the width of area landmarks can
be actually calculated.
• Uniqueness: how rare landmarks of this type are. Possible values are rare, uncommon and
common. The values are associated with an integer value: 15, 10 and 5 respectively.
• Street Furniture: whether landmarks of this type are located at the street/sidewalk level,
rather than on the sides of the street (e.g., fire hydrants and bus stops are located on the
sidewalk). Possible values are true and false.
• Maximum Distance: the maximum distance that a landmark of this type can be from the
centre of the street, above which the landmark will be considered fruitless. This factor is
related to the landmark’s height. A tower, for instance, can be seen from a much higher
distance than a post box. Possible values are afar (50 metres), medium (30 metres) and near
(10 metres).
For example, a bank is estimated to be of medium width, uncommon, is not part of the street
furniture and can be at most 30 metres from the centre of the street, and a bus stop is of small
width, common, located on the street and can be at most 10 metres away from the street.
The first two attributes are needed to evaluate the usefulness of a landmark and the fourth to
filter unnecessary landmarks (both processes are explained in Section 4.4.2). The third attribute is
used to generate instructions, detailed in Section 4.4.3.
Locating Node Landmarks
For each landmark, it is needed to calculate how close their are to the step
(distanceToStep), their projection onto the step’s line segments (closestPoint for node
landmarks and closestPointStart and closestPointEnd for area landmarks) and whether
they will be to the right or left of the user (orientation).
Regarding node landmarks, before determining how close they are to the step, the distances
between a landmark and each of the substeps need to be calculated. This is done by:
1. for each substep, finding the closest point in the substep’s line segment and the landmark’s
coordinates, making use of the JTS library5;
2. calculating the distance between the landmark’s GPS coordinates and each of the closest
points;
3. finding the minimum of the calculated distances.
Thus, the point corresponding to the above minimum distance is the projection of the landmark
onto the step.
5http://tsusiatsoftware.net/jts/main.html
37
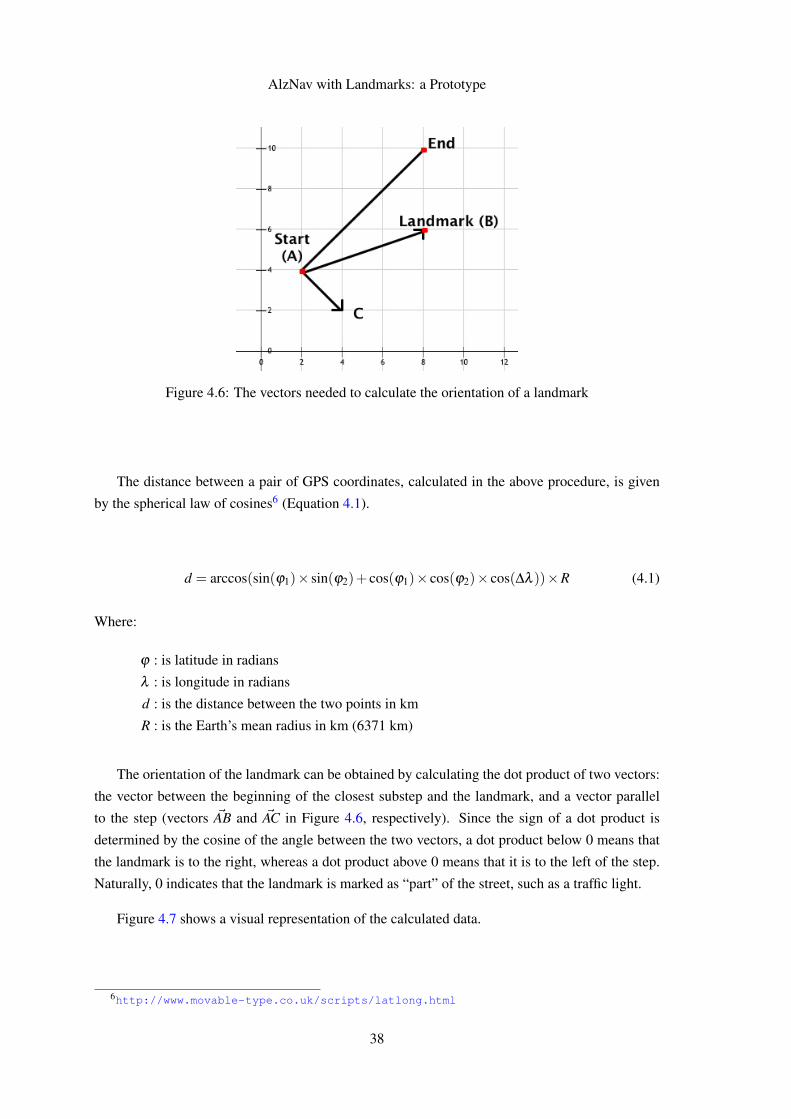
AlzNav with Landmarks: a Prototype
Figure 4.6: The vectors needed to calculate the orientation of a landmark
The distance between a pair of GPS coordinates, calculated in the above procedure, is given
by the spherical law of cosines6 (Equation 4.1).
d = arccos(sin(ϕ1)× sin(ϕ2)+ cos(ϕ1)× cos(ϕ2)× cos(∆λ ))×R (4.1)
Where:
ϕ : is latitude in radians
λ : is longitude in radians
d : is the distance between the two points in km
R : is the Earth’s mean radius in km (6371 km)
The orientation of the landmark can be obtained by calculating the dot product of two vectors:
the vector between the beginning of the closest substep and the landmark, and a vector parallel
to the step (vectors ~AB and ~AC in Figure 4.6, respectively). Since the sign of a dot product is
determined by the cosine of the angle between the two vectors, a dot product below 0 means that
the landmark is to the right, whereas a dot product above 0 means that it is to the left of the step.
Naturally, 0 indicates that the landmark is marked as “part” of the street, such as a traffic light.
Figure 4.7 shows a visual representation of the calculated data.
6http://www.movable-type.co.uk/scripts/latlong.html
38
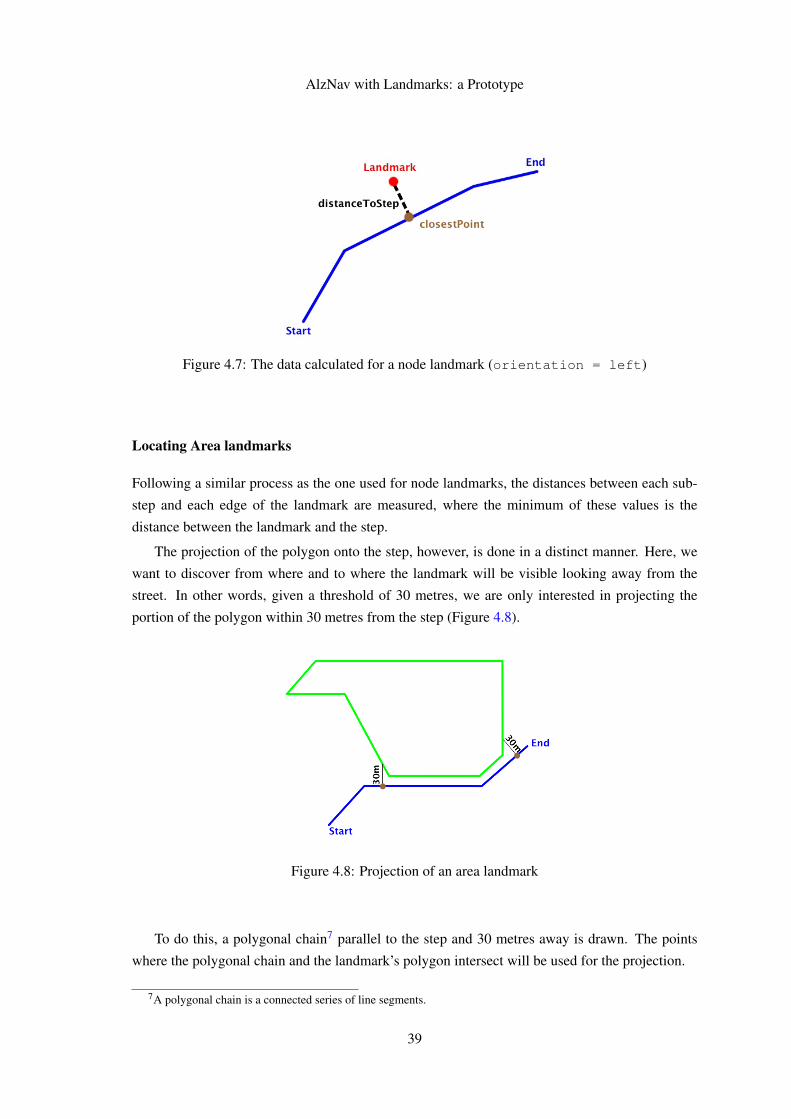
AlzNav with Landmarks: a Prototype
Figure 4.7: The data calculated for a node landmark (orientation = left)
Locating Area landmarks
Following a similar process as the one used for node landmarks, the distances between each sub-
step and each edge of the landmark are measured, where the minimum of these values is the
distance between the landmark and the step.
The projection of the polygon onto the step, however, is done in a distinct manner. Here, we
want to discover from where and to where the landmark will be visible looking away from the
street. In other words, given a threshold of 30 metres, we are only interested in projecting the
portion of the polygon within 30 metres from the step (Figure 4.8).
Figure 4.8: Projection of an area landmark
To do this, a polygonal chain7 parallel to the step and 30 metres away is drawn. The points
where the polygonal chain and the landmark’s polygon intersect will be used for the projection.
7A polygonal chain is a connected series of line segments.
39
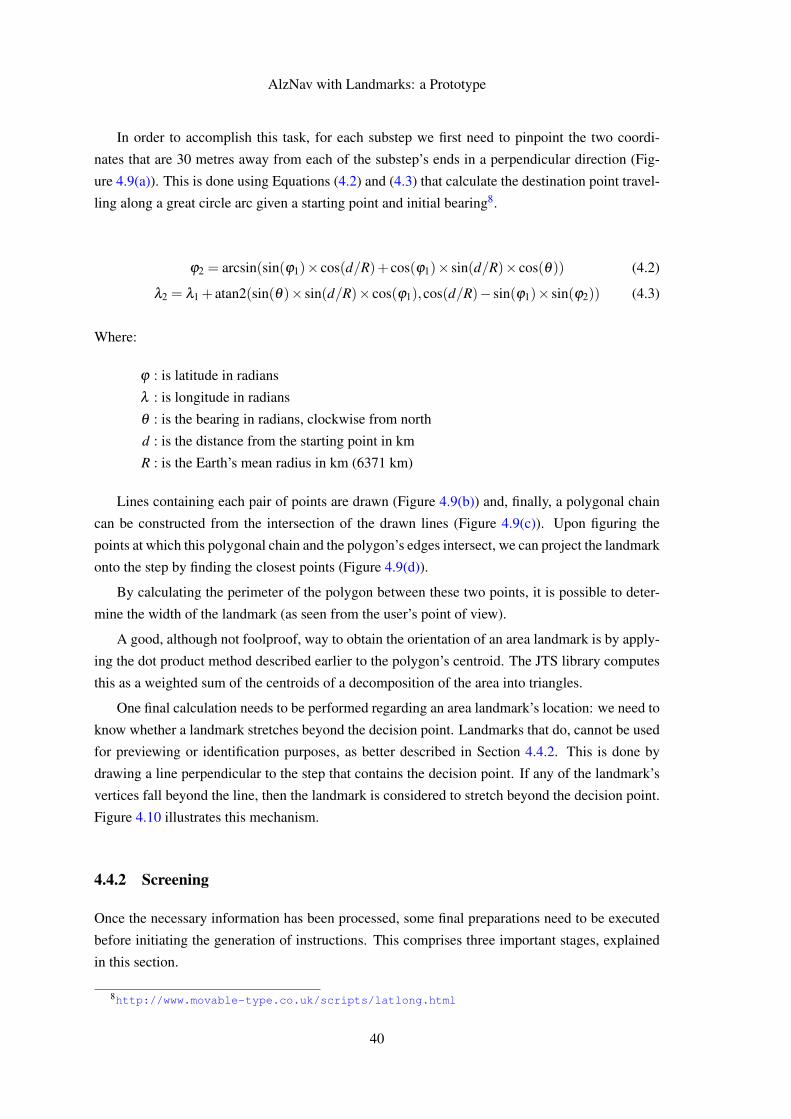
AlzNav with Landmarks: a Prototype
In order to accomplish this task, for each substep we first need to pinpoint the two coordi-
nates that are 30 metres away from each of the substep’s ends in a perpendicular direction (Fig-
ure 4.9(a)). This is done using Equations (4.2) and (4.3) that calculate the destination point travel-
ling along a great circle arc given a starting point and initial bearing8.
ϕ2 = arcsin(sin(ϕ1)× cos(d/R)+ cos(ϕ1)× sin(d/R)× cos(θ)) (4.2)
λ2 = λ1 + atan2(sin(θ)× sin(d/R)× cos(ϕ1),cos(d/R)− sin(ϕ1)× sin(ϕ2)) (4.3)
Where:
ϕ : is latitude in radians
λ : is longitude in radians
θ : is the bearing in radians, clockwise from north
d : is the distance from the starting point in km
R : is the Earth’s mean radius in km (6371 km)
Lines containing each pair of points are drawn (Figure 4.9(b)) and, finally, a polygonal chain
can be constructed from the intersection of the drawn lines (Figure 4.9(c)). Upon figuring the
points at which this polygonal chain and the polygon’s edges intersect, we can project the landmark
onto the step by finding the closest points (Figure 4.9(d)).
By calculating the perimeter of the polygon between these two points, it is possible to deter-
mine the width of the landmark (as seen from the user’s point of view).
A good, although not foolproof, way to obtain the orientation of an area landmark is by apply-
ing the dot product method described earlier to the polygon’s centroid. The JTS library computes
this as a weighted sum of the centroids of a decomposition of the area into triangles.
One final calculation needs to be performed regarding an area landmark’s location: we need to
know whether a landmark stretches beyond the decision point. Landmarks that do, cannot be used
for previewing or identification purposes, as better described in Section 4.4.2. This is done by
drawing a line perpendicular to the step that contains the decision point. If any of the landmark’s
vertices fall beyond the line, then the landmark is considered to stretch beyond the decision point.
Figure 4.10 illustrates this mechanism.
4.4.2 Screening
Once the necessary information has been processed, some final preparations need to be executed
before initiating the generation of instructions. This comprises three important stages, explained
in this section.
8http://www.movable-type.co.uk/scripts/latlong.html
40
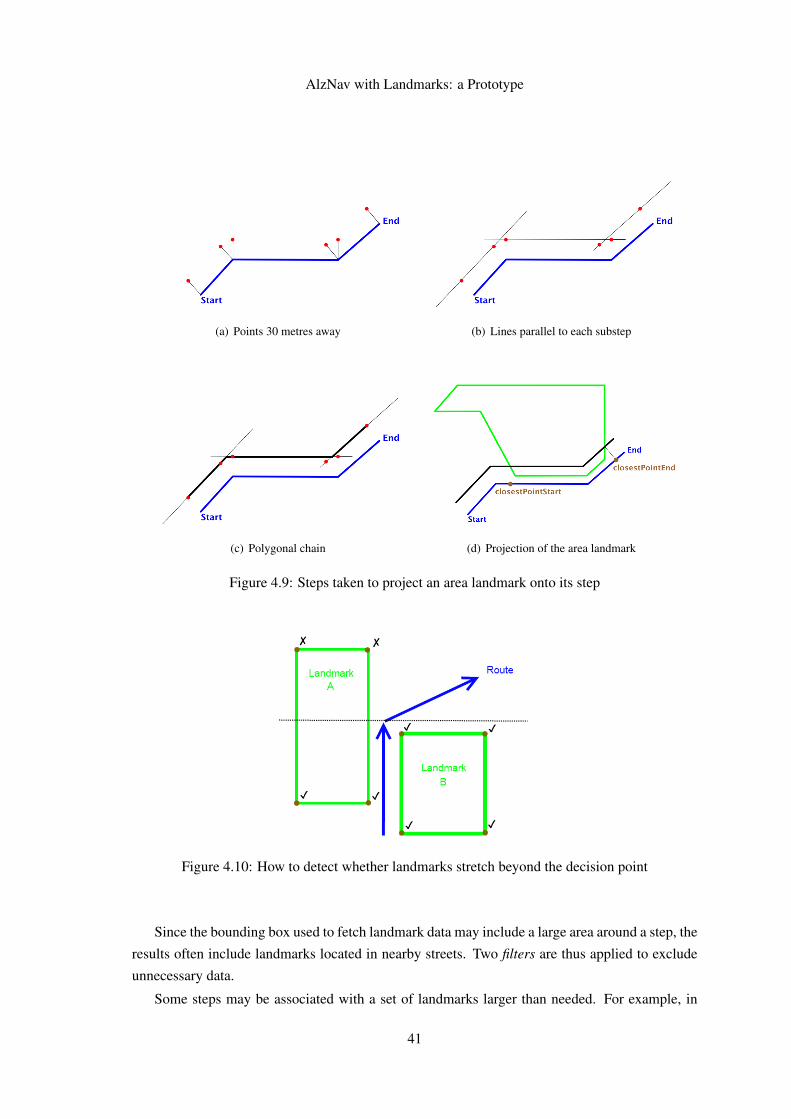
AlzNav with Landmarks: a Prototype
(a) Points 30 metres away (b) Lines parallel to each substep
(c) Polygonal chain (d) Projection of the area landmark
Figure 4.9: Steps taken to project an area landmark onto its step
Figure 4.10: How to detect whether landmarks stretch beyond the decision point
Since the bounding box used to fetch landmark data may include a large area around a step, the
results often include landmarks located in nearby streets. Two filters are thus applied to exclude
unnecessary data.
Some steps may be associated with a set of landmarks larger than needed. For example, in
41
AlzNav with Landmarks: a Prototype
a 80 metres step the system might generate 4 instructions: 1 to identify, 1 to preview and 2 to
confirm. Since the preview and identification instructions should refer the same landmark, a total
of 3 landmarks are needed to generate these instructions. However, if 10 landmarks are available,
we need to select the optimal set that suits our needs. As follows, landmarks have to be evaluated
and given a score regarding their usefulness.
Finally, the algorithm used to select the optimal set of landmarks for each step is presented in
the last part of this section.
Filters
In a first attempt to filter unnecessary landmarks, two initial screenings are applied. Landmarks
located further than the distance indicated by the respective tag’s maximum distance are automat-
ically filtered, as they are not likely to be located in the street corresponding to the step and/or not
visible to the user.
Secondly, landmarks whose address doesn’t match the address of the step are filtered as well.
Although these are located near the step, an address mismatch means that the landmark is actually
located in another nearby street, and thus are not likely to be visible from the user’s point of
view. The matching, however, cannot be done with a simple comparison of strings, since two
different strings do not always represent two different addresses. For example, “Shawmut Ave”
should match “Shawmut Avenue”. The matching is done using the Levenshtein distance algorithm,
which measures the difference between two strings as the number of operations (insertion, deletion
or substitution of a single character) needed to transform one string into the other. Beyond a pre-
defined threshold, it’s assumed that the two strings are distinct addresses and the landmark is
excluded.
Evaluation of Usefulness
The evaluation procedure aims to measure a landmark’s usefulness concerning two purposes: con-
firmation and pinpointing a decision point. That is to say, how useful they are to generate either
confirmation or identification/preview instructions.
Regarding confirmation purposes, 2 important factors to consider were identified: the land-
mark’s recognisability and identifiability, explained below. The evaluation results in the sum of
these two factors, as in Equation (4.4).
CS(l) = R(l)+ I(l), (4.4)
42
AlzNav with Landmarks: a Prototype
Where:
CS(l) : is the landmark’s confirmation score
R(l) : is the recognisability of the landmark
I(l) : is the identifiability of the landmark
One more decisive factor to evaluate a landmark’s ability to pinpoint a decision point was
identified: pinpointing precision. This score is calculated using Equation (4.5). Only landmarks
within a 20 metres radius from the decision point are evaluated and hence can be selected for
generating identification/preview instructions.
PS(l) = P(l)× (R(l)+ I(l)), (4.5)
Where:
PS(l) : is the landmark’s pinpointing score
P(l) : is the pinpointing precision of the landmark
R(l) : is the recognisability of the landmark
I(l) : is the identifiability of the landmark
These factors (recognisability, identifiability and pinpointing precision) and their functions are
explained below. All functions carry the same weight and are therefore constrained to the same
codomain of [0,15].
When a user is told about a landmark and thereafter tries to find it, it is important for it to be
prominent and easily recognisable, i.e., the user must be able to locate it quickly and with little
effort. The recognisability of a landmark is directly related to its visual attraction and can be
affected by:
• their width, i.e., how wide they appear to be looking away from the street: wide landmarks,
like an hospital, are easier to recognise than narrow ones, like a kiosk. As reviewed in
Section 2.2.4, the facade area is an important visual property. However, since OSM does
not provide data relative to buildings’ height, only their width can be taken into account.
• the distance to the street: landmarks closer to the street, like a traffic light, are easier to
recognise than those further away, like a building with a garden between the sidewalk and
its facade.
The recognisability of a landmark is evaluated using Equation (4.6).
43
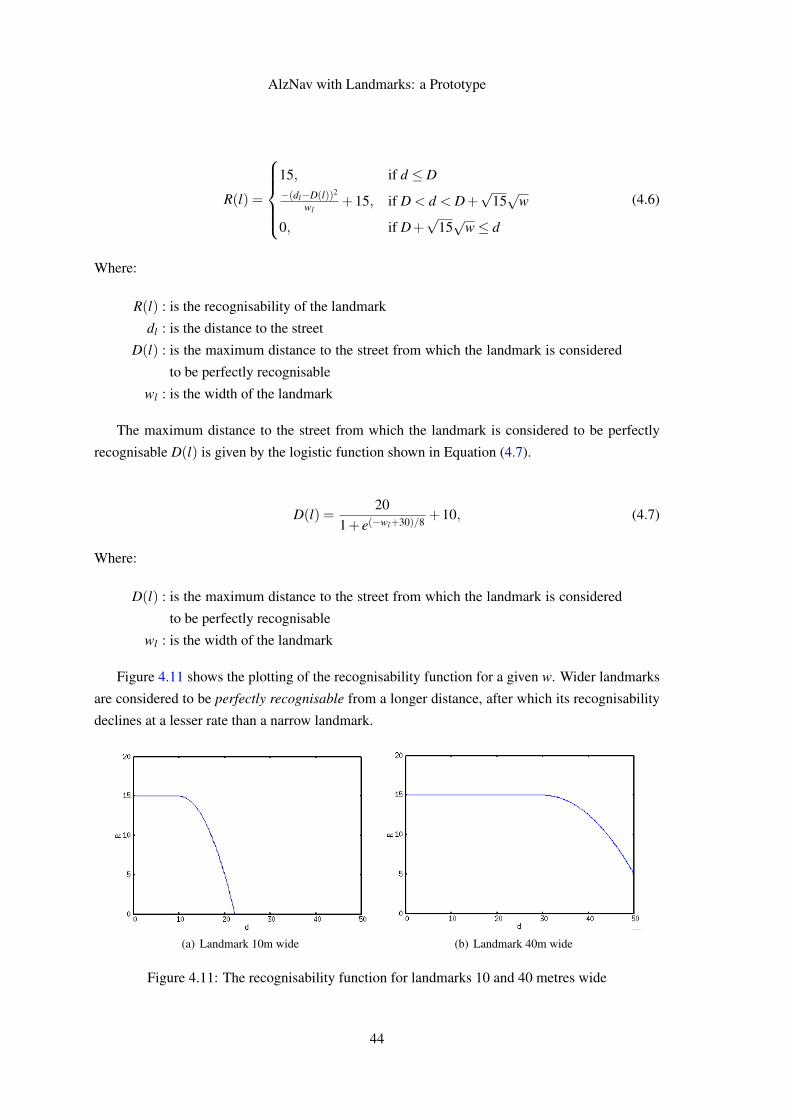
AlzNav with Landmarks: a Prototype
R(l) =
15, if d ≤ D−(dl−D(l))2
wl+15, if D < d < D+
√15√
w
0, if D+√
15√
w≤ d
(4.6)
Where:
R(l) : is the recognisability of the landmark
dl : is the distance to the street
D(l) : is the maximum distance to the street from which the landmark is considered
to be perfectly recognisable
wl : is the width of the landmark
The maximum distance to the street from which the landmark is considered to be perfectly
recognisable D(l) is given by the logistic function shown in Equation (4.7).
D(l) =20
1+ e(−wl+30)/8 +10, (4.7)
Where:
D(l) : is the maximum distance to the street from which the landmark is considered
to be perfectly recognisable
wl : is the width of the landmark
Figure 4.11 shows the plotting of the recognisability function for a given w. Wider landmarks
are considered to be perfectly recognisable from a longer distance, after which its recognisability
declines at a lesser rate than a narrow landmark.
(a) Landmark 10m wide (b) Landmark 40m wide
Figure 4.11: The recognisability function for landmarks 10 and 40 metres wide
44
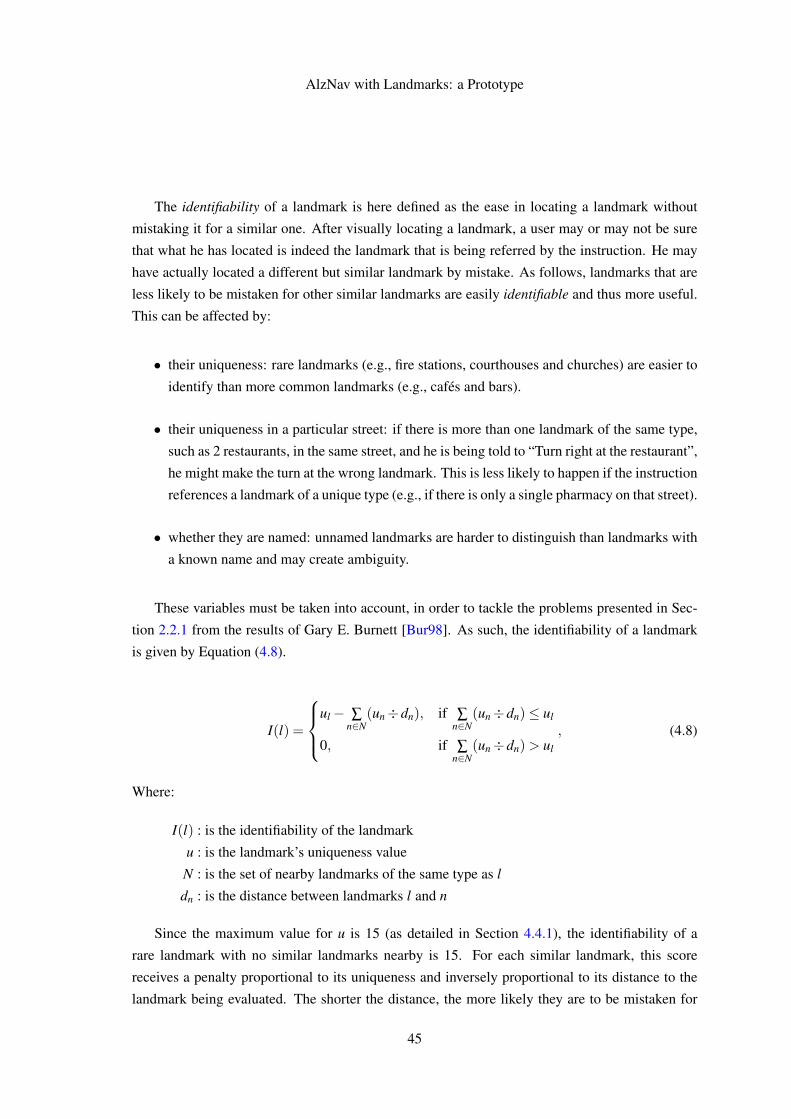
AlzNav with Landmarks: a Prototype
The identifiability of a landmark is here defined as the ease in locating a landmark without
mistaking it for a similar one. After visually locating a landmark, a user may or may not be sure
that what he has located is indeed the landmark that is being referred by the instruction. He may
have actually located a different but similar landmark by mistake. As follows, landmarks that are
less likely to be mistaken for other similar landmarks are easily identifiable and thus more useful.
This can be affected by:
• their uniqueness: rare landmarks (e.g., fire stations, courthouses and churches) are easier to
identify than more common landmarks (e.g., cafés and bars).
• their uniqueness in a particular street: if there is more than one landmark of the same type,
such as 2 restaurants, in the same street, and he is being told to “Turn right at the restaurant”,
he might make the turn at the wrong landmark. This is less likely to happen if the instruction
references a landmark of a unique type (e.g., if there is only a single pharmacy on that street).
• whether they are named: unnamed landmarks are harder to distinguish than landmarks with
a known name and may create ambiguity.
These variables must be taken into account, in order to tackle the problems presented in Sec-
tion 2.2.1 from the results of Gary E. Burnett [Bur98]. As such, the identifiability of a landmark
is given by Equation (4.8).
I(l) =
ul− ∑
n∈N(un÷dn), if ∑
n∈N(un÷dn)≤ ul
0, if ∑n∈N
(un÷dn)> ul
, (4.8)
Where:
I(l) : is the identifiability of the landmark
u : is the landmark’s uniqueness value
N : is the set of nearby landmarks of the same type as l
dn : is the distance between landmarks l and n
Since the maximum value for u is 15 (as detailed in Section 4.4.1), the identifiability of a
rare landmark with no similar landmarks nearby is 15. For each similar landmark, this score
receives a penalty proportional to its uniqueness and inversely proportional to its distance to the
landmark being evaluated. The shorter the distance, the more likely they are to be mistaken for
45
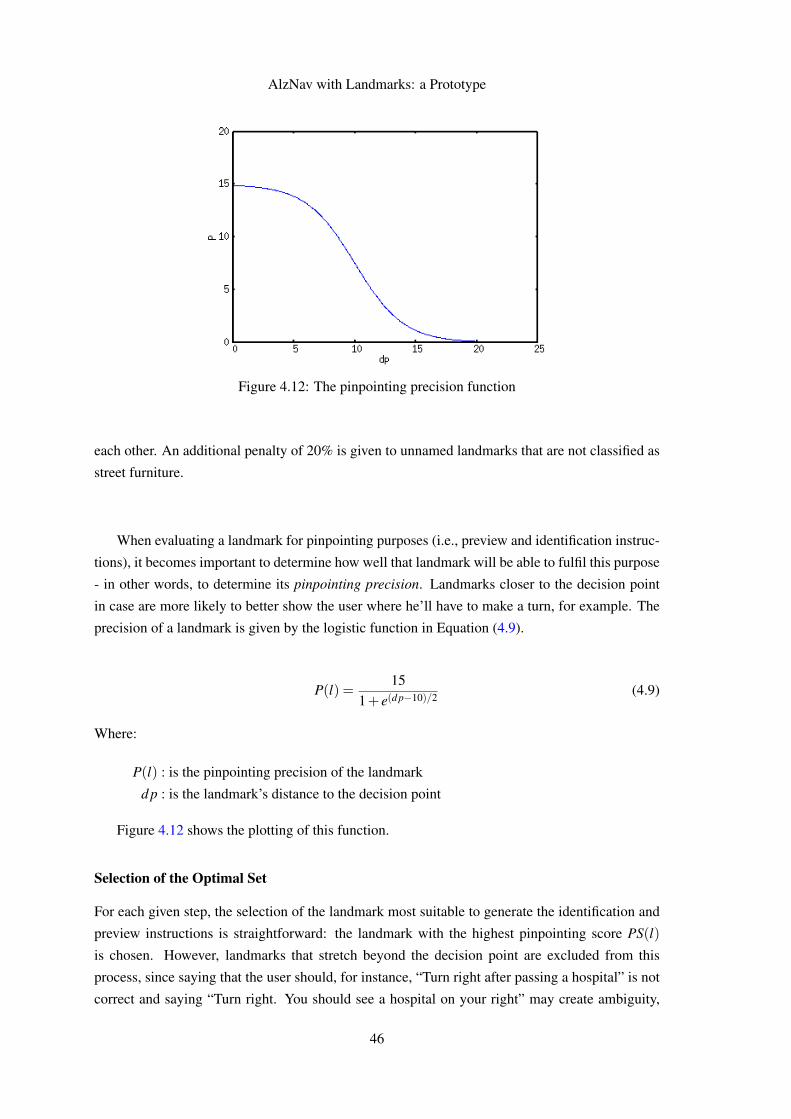
AlzNav with Landmarks: a Prototype
Figure 4.12: The pinpointing precision function
each other. An additional penalty of 20% is given to unnamed landmarks that are not classified as
street furniture.
When evaluating a landmark for pinpointing purposes (i.e., preview and identification instruc-
tions), it becomes important to determine how well that landmark will be able to fulfil this purpose
- in other words, to determine its pinpointing precision. Landmarks closer to the decision point
in case are more likely to better show the user where he’ll have to make a turn, for example. The
precision of a landmark is given by the logistic function in Equation (4.9).
P(l) =15
1+ e(d p−10)/2 (4.9)
Where:
P(l) : is the pinpointing precision of the landmark
d p : is the landmark’s distance to the decision point
Figure 4.12 shows the plotting of this function.
Selection of the Optimal Set
For each given step, the selection of the landmark most suitable to generate the identification and
preview instructions is straightforward: the landmark with the highest pinpointing score PS(l)
is chosen. However, landmarks that stretch beyond the decision point are excluded from this
process, since saying that the user should, for instance, “Turn right after passing a hospital” is not
correct and saying “Turn right. You should see a hospital on your right” may create ambiguity,
46
AlzNav with Landmarks: a Prototype
as illustrated in Figure 4.13. For this reason, these landmarks cannot correctly define a decision
point.
Figure 4.13: Situation where an area landmark cannot identify a decision point unambiguously
The selection of the optimal set of landmarks to generate confirmation instructions takes one
restriction into account. As detailed in the following sections, all instructions should be at least 25
metres apart from each other in order to avoid information overload and allow the TTS system a
reasonable pause between speeches. Ergo, no pair of landmarks in the optimal set can be less than
25 metres apart from each other. Such a case is considered to be a collision.
Using a dynamic programming approach, an algorithm was designed to solve this problem.
This algorithm, detailed in Listing 4.1, computes the best possible combination of landmarks
maximizing the total sum of confirmation scores CS(l) and obeying the aforementioned restriction,
while avoiding repeated calculations.
1 //the minimum distance between two landmarks
2 const minDistance = 25
3
4 def computeOptimalSet(
5 int n, //number of landmarks
6 int score[], //landmark’s scores, 1 ≥ i ≥ n
7 int distance[] ) { //landmark’s distances to the decision point, sorted in
ascendant order, 1 ≥ i ≥ n
8
9 //Work Data
10 int bestScore[n] //where bestScore[i] is the best score
11 // possible using landmarks up to i
12 int bestLandmark[n] //where bestLandmark[i] is the index of last landmark
13 // selected for obtaining the score bestScore[i]
14 int lastValidLandmark[n] //where lastValidLandmark[i] is the index of the
15 // landmark closest to i that doesn’t collide with it
16 //sentinel values
17 bestScore[0] = 0
47
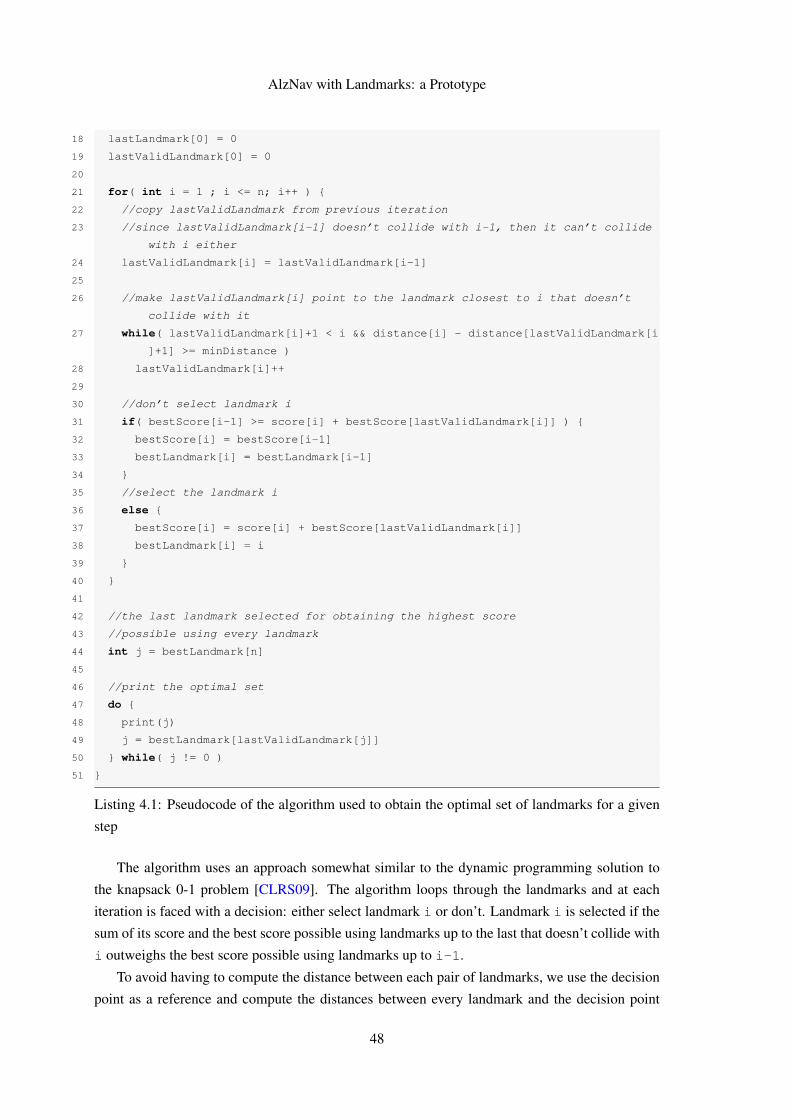
AlzNav with Landmarks: a Prototype
18 lastLandmark[0] = 0
19 lastValidLandmark[0] = 0
20
21 for( int i = 1 ; i <= n; i++ ) {
22 //copy lastValidLandmark from previous iteration
23 //since lastValidLandmark[i-1] doesn’t collide with i-1, then it can’t collide
with i either
24 lastValidLandmark[i] = lastValidLandmark[i-1]
25
26 //make lastValidLandmark[i] point to the landmark closest to i that doesn’t
collide with it
27 while( lastValidLandmark[i]+1 < i && distance[i] - distance[lastValidLandmark[i
]+1] >= minDistance )
28 lastValidLandmark[i]++
29
30 //don’t select landmark i
31 if( bestScore[i-1] >= score[i] + bestScore[lastValidLandmark[i]] ) {
32 bestScore[i] = bestScore[i-1]
33 bestLandmark[i] = bestLandmark[i-1]
34 }
35 //select the landmark i
36 else {
37 bestScore[i] = score[i] + bestScore[lastValidLandmark[i]]
38 bestLandmark[i] = i
39 }
40 }
41
42 //the last landmark selected for obtaining the highest score
43 //possible using every landmark
44 int j = bestLandmark[n]
45
46 //print the optimal set
47 do {
48 print(j)
49 j = bestLandmark[lastValidLandmark[j]]
50 } while( j != 0 )
51 }
Listing 4.1: Pseudocode of the algorithm used to obtain the optimal set of landmarks for a given
step
The algorithm uses an approach somewhat similar to the dynamic programming solution to
the knapsack 0-1 problem [CLRS09]. The algorithm loops through the landmarks and at each
iteration is faced with a decision: either select landmark i or don’t. Landmark i is selected if the
sum of its score and the best score possible using landmarks up to the last that doesn’t collide with
i outweighs the best score possible using landmarks up to i-1.
To avoid having to compute the distance between each pair of landmarks, we use the decision
point as a reference and compute the distances between every landmark and the decision point
48
AlzNav with Landmarks: a Prototype
Figure 4.14: Work data of the optimal set algorithm and how to obtain the set (selected landmarksare marked with a blue circle)
instead. In this fashion, the distance between a pair of landmarks is given by the difference between
their distances to the decision point.
The selected landmarks can be obtained by traversing the bestLandmark and
lastValidLandmark arrays backwards, starting with the last landmark selected for obtaining
the best score possible using landmarks up to n. Figure 4.14 illustrates the work data at the end
of each iteration and how to obtain the optimal set.
The for loop that computes of the optimal set has a worst-case running time of θ(n), as does
the loop that collects the results. Consequently, the algorithm runs in θ(n) time.
4.4.3 Generation of Instructions
This section begins by detailing how a description of a given landmark is produced, before being
embedded into an instruction. Then it goes on to explain the process of generating landmark-based
instructions for each step of the route and how the system falls back to a turn-by-turn approach
when insufficient data is available or the landmark-based mode is turned off.
Description of a Landmark
Accurately describing a landmark is crucial to enable the user to quickly perceive and understand
the given instructions. A textual description of a landmark to be presented to the user can take
many forms.
For example, if the name of a hotel is known, we can tell the user that “the Plaza hotel” is to
his right, otherwise we might say “a hotel” instead.
Furthermore, if the type itself is contained within the name, like “Talacha Bike Shop”, saying
“the Talacha Bike Shop bicyle shop” introduces redundancy, so the type has to be omitted: “the
Talacha Bike Shop”. In this example, a key aspect is exposed: there are many ways to describe
the type of a landmark - bike shop vs. bicycle shop. Additionally, some OSM tags are often
misused due to similar meanings (e.g., universities are often tagged as faculties and vice-versa).
To solve this issue, each landmark type is associated with a set of strings that convey identical
ideas, exemplified on line 2 of Listing 4.2. If the name of the landmark contains any of these
strings, then the type will be omitted and the string on line 5 will be used to generate a description.
Otherwise, either line 3 or 4 will be used, depending on whether the landmark’s name is available.
49
AlzNav with Landmarks: a Prototype
1 <string-array name="college">
2 <item name="keywords">university/faculty/college/school</item>
3 <item name="indefinite">a college</item>
4 <item name="definite">the %1$s college</item>
5 <item name="definite-without-type">the %1$s</item>
6 </string-array>
Listing 4.2: Data used to generate the description of a college in english (%1$s is replaced by the
name)
Preview and Identification Instructions
As a general rule, identification instructions abide by the following configuration:
“<manoeuvre> <direction> after passing <description> to your <orientation>”,
and preview instructions are prefixed by:
“In <distance> metres, ...”,
where:
• <distance> is replaced in real time by the current distance to the decision point;
• <manoeuvre> by the manoeuvre type (e.g., “turn”);
• <direction> by the manoeuvre direction (e.g., “slight right” or “left”);
• <description> by the landmark description previously generated;
• and <orientation> by the landmark orientation (either “left” or “right”).
Optionally, extra notes parsed in Section 4.4.1 can be prefixed to preview instructions.
If the landmark is part of the street furniture, like fire hydrants, then the orientation is omitted,
since it’s impossible to tell to which side of the user the landmark will be. Even if the orientation
of the landmark relative to the user’s position was to be calculated in real time, the result would
not be precise due to mappings errors and imperfect GPS accuracy.
If the landmark and the turn are in opposite directions, then there is a chance that the user will
never pass by the landmark, and instead make a turn in front of or near the landmark - such a sit-
uation is illustrated in Figure 4.15. In these cases, a different template is used to avoid misleading
the user:
“<manoeuvre> <direction>. You should see <description> on your <orientation>”.
50
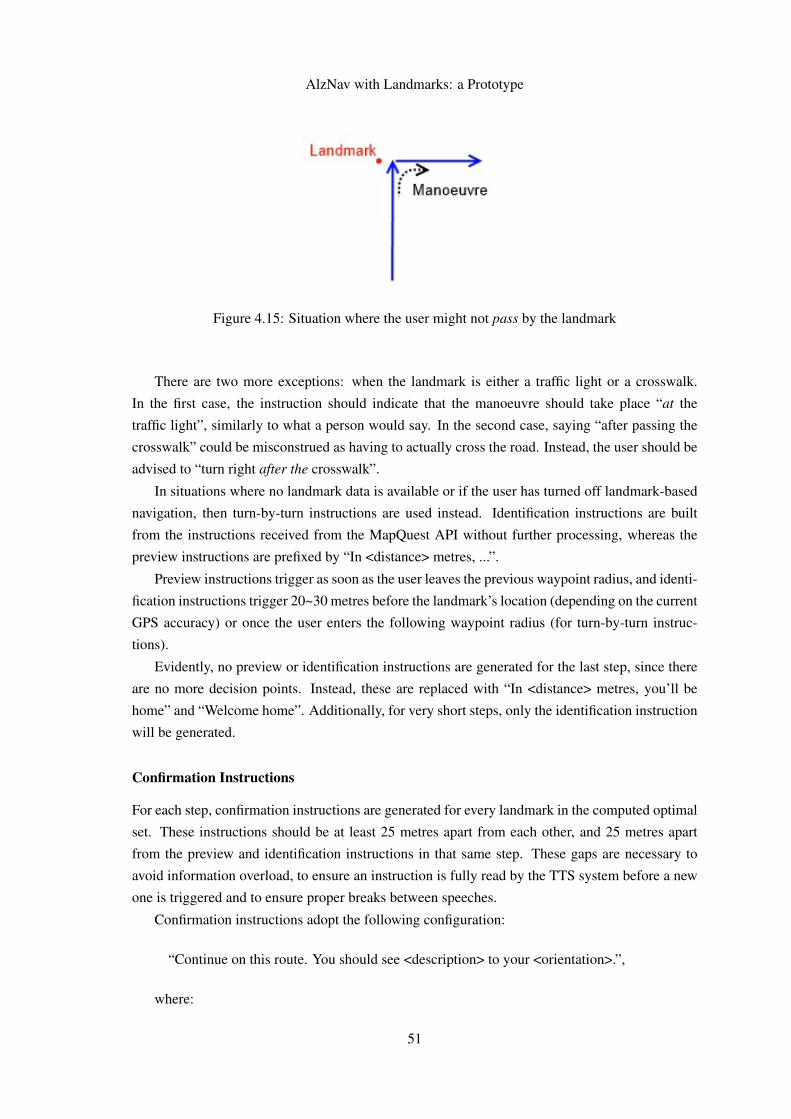
AlzNav with Landmarks: a Prototype
Figure 4.15: Situation where the user might not pass by the landmark
There are two more exceptions: when the landmark is either a traffic light or a crosswalk.
In the first case, the instruction should indicate that the manoeuvre should take place “at the
traffic light”, similarly to what a person would say. In the second case, saying “after passing the
crosswalk” could be misconstrued as having to actually cross the road. Instead, the user should be
advised to “turn right after the crosswalk”.
In situations where no landmark data is available or if the user has turned off landmark-based
navigation, then turn-by-turn instructions are used instead. Identification instructions are built
from the instructions received from the MapQuest API without further processing, whereas the
preview instructions are prefixed by “In <distance> metres, ...”.
Preview instructions trigger as soon as the user leaves the previous waypoint radius, and identi-
fication instructions trigger 20~30 metres before the landmark’s location (depending on the current
GPS accuracy) or once the user enters the following waypoint radius (for turn-by-turn instruc-
tions).
Evidently, no preview or identification instructions are generated for the last step, since there
are no more decision points. Instead, these are replaced with “In <distance> metres, you’ll be
home” and “Welcome home”. Additionally, for very short steps, only the identification instruction
will be generated.
Confirmation Instructions
For each step, confirmation instructions are generated for every landmark in the computed optimal
set. These instructions should be at least 25 metres apart from each other, and 25 metres apart
from the preview and identification instructions in that same step. These gaps are necessary to
avoid information overload, to ensure an instruction is fully read by the TTS system before a new
one is triggered and to ensure proper breaks between speeches.
Confirmation instructions adopt the following configuration:
“Continue on this route. You should see <description> to your <orientation>.”,
where:
51
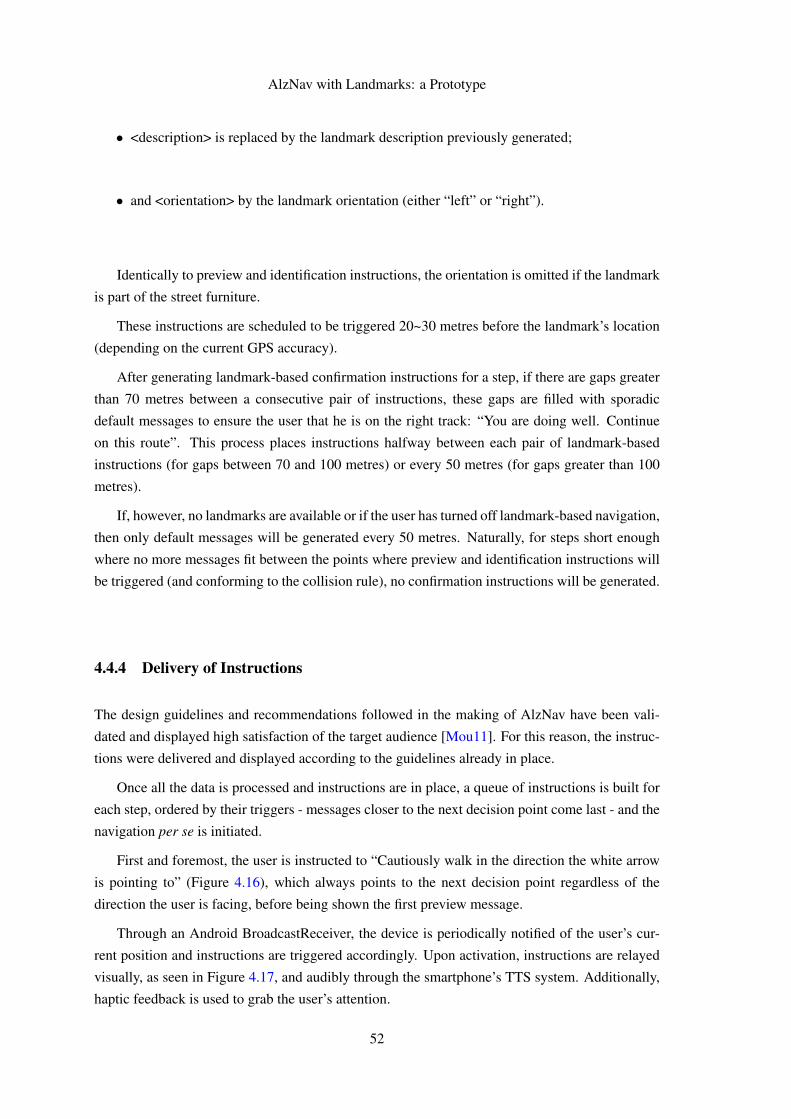
AlzNav with Landmarks: a Prototype
• <description> is replaced by the landmark description previously generated;
• and <orientation> by the landmark orientation (either “left” or “right”).
Identically to preview and identification instructions, the orientation is omitted if the landmark
is part of the street furniture.
These instructions are scheduled to be triggered 20~30 metres before the landmark’s location
(depending on the current GPS accuracy).
After generating landmark-based confirmation instructions for a step, if there are gaps greater
than 70 metres between a consecutive pair of instructions, these gaps are filled with sporadic
default messages to ensure the user that he is on the right track: “You are doing well. Continue
on this route”. This process places instructions halfway between each pair of landmark-based
instructions (for gaps between 70 and 100 metres) or every 50 metres (for gaps greater than 100
metres).
If, however, no landmarks are available or if the user has turned off landmark-based navigation,
then only default messages will be generated every 50 metres. Naturally, for steps short enough
where no more messages fit between the points where preview and identification instructions will
be triggered (and conforming to the collision rule), no confirmation instructions will be generated.
4.4.4 Delivery of Instructions
The design guidelines and recommendations followed in the making of AlzNav have been vali-
dated and displayed high satisfaction of the target audience [Mou11]. For this reason, the instruc-
tions were delivered and displayed according to the guidelines already in place.
Once all the data is processed and instructions are in place, a queue of instructions is built for
each step, ordered by their triggers - messages closer to the next decision point come last - and the
navigation per se is initiated.
First and foremost, the user is instructed to “Cautiously walk in the direction the white arrow
is pointing to” (Figure 4.16), which always points to the next decision point regardless of the
direction the user is facing, before being shown the first preview message.
Through an Android BroadcastReceiver, the device is periodically notified of the user’s cur-
rent position and instructions are triggered accordingly. Upon activation, instructions are relayed
visually, as seen in Figure 4.17, and audibly through the smartphone’s TTS system. Additionally,
haptic feedback is used to grab the user’s attention.
52
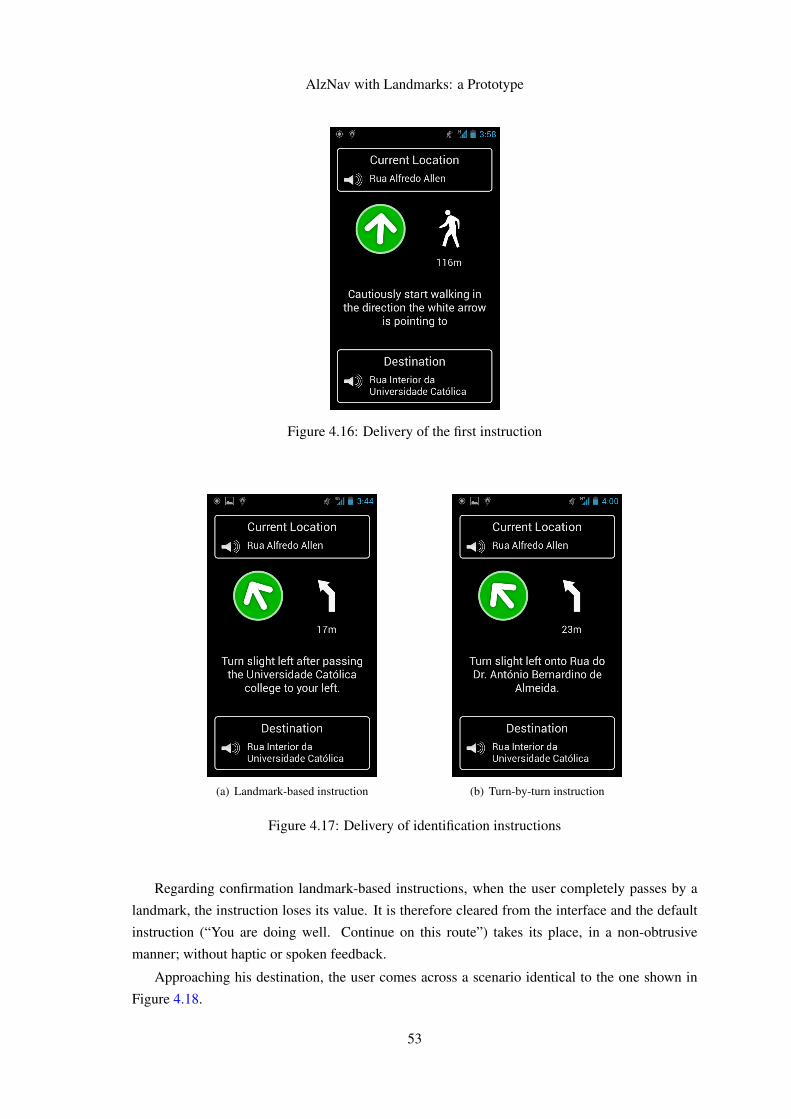
AlzNav with Landmarks: a Prototype
Figure 4.16: Delivery of the first instruction
(a) Landmark-based instruction (b) Turn-by-turn instruction
Figure 4.17: Delivery of identification instructions
Regarding confirmation landmark-based instructions, when the user completely passes by a
landmark, the instruction loses its value. It is therefore cleared from the interface and the default
instruction (“You are doing well. Continue on this route”) takes its place, in a non-obtrusive
manner; without haptic or spoken feedback.
Approaching his destination, the user comes across a scenario identical to the one shown in
Figure 4.18.
53
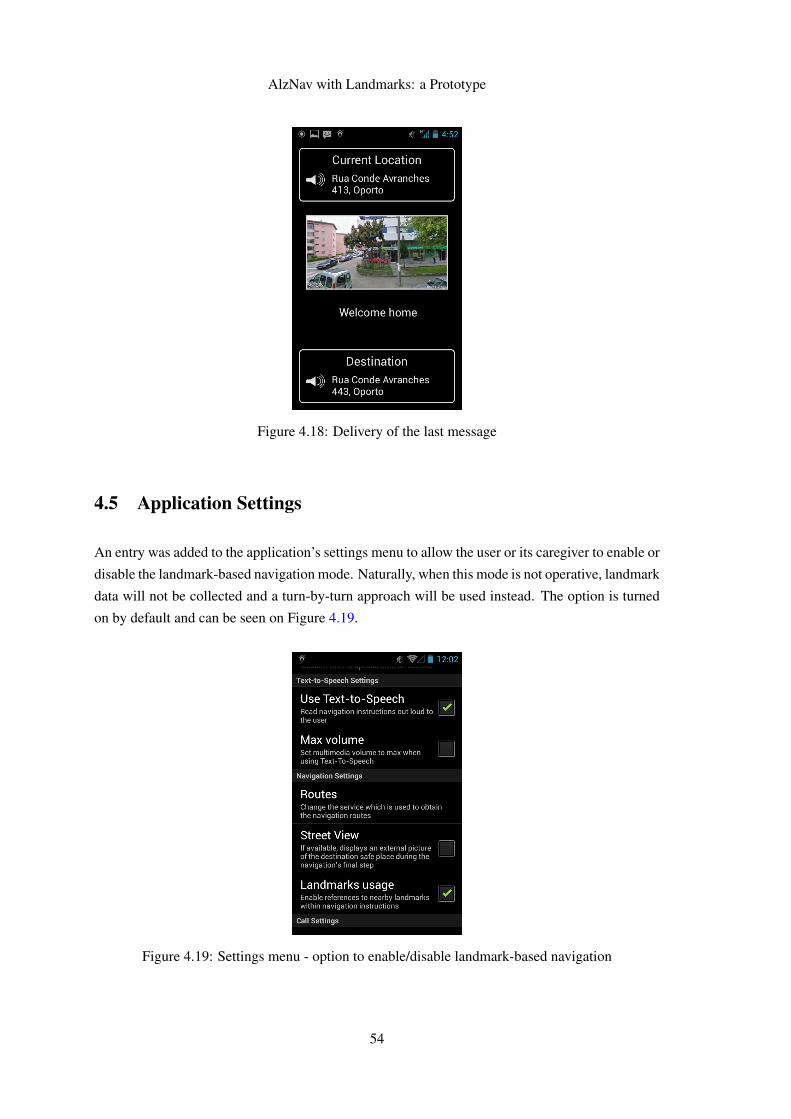
AlzNav with Landmarks: a Prototype
Figure 4.18: Delivery of the last message
4.5 Application Settings
An entry was added to the application’s settings menu to allow the user or its caregiver to enable or
disable the landmark-based navigation mode. Naturally, when this mode is not operative, landmark
data will not be collected and a turn-by-turn approach will be used instead. The option is turned
on by default and can be seen on Figure 4.19.
Figure 4.19: Settings menu - option to enable/disable landmark-based navigation
54
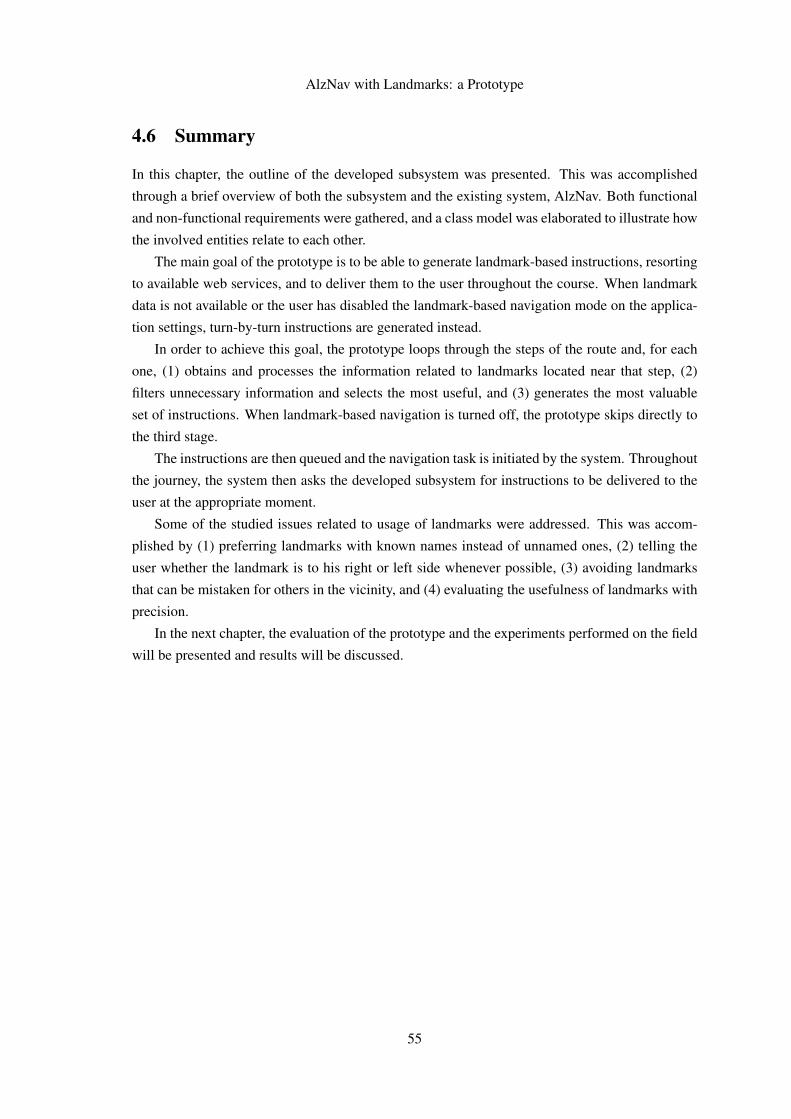
AlzNav with Landmarks: a Prototype
4.6 Summary
In this chapter, the outline of the developed subsystem was presented. This was accomplished
through a brief overview of both the subsystem and the existing system, AlzNav. Both functional
and non-functional requirements were gathered, and a class model was elaborated to illustrate how
the involved entities relate to each other.
The main goal of the prototype is to be able to generate landmark-based instructions, resorting
to available web services, and to deliver them to the user throughout the course. When landmark
data is not available or the user has disabled the landmark-based navigation mode on the applica-
tion settings, turn-by-turn instructions are generated instead.
In order to achieve this goal, the prototype loops through the steps of the route and, for each
one, (1) obtains and processes the information related to landmarks located near that step, (2)
filters unnecessary information and selects the most useful, and (3) generates the most valuable
set of instructions. When landmark-based navigation is turned off, the prototype skips directly to
the third stage.
The instructions are then queued and the navigation task is initiated by the system. Throughout
the journey, the system then asks the developed subsystem for instructions to be delivered to the
user at the appropriate moment.
Some of the studied issues related to usage of landmarks were addressed. This was accom-
plished by (1) preferring landmarks with known names instead of unnamed ones, (2) telling the
user whether the landmark is to his right or left side whenever possible, (3) avoiding landmarks
that can be mistaken for others in the vicinity, and (4) evaluating the usefulness of landmarks with
precision.
In the next chapter, the evaluation of the prototype and the experiments performed on the field
will be presented and results will be discussed.
55

AlzNav with Landmarks: a Prototype
56
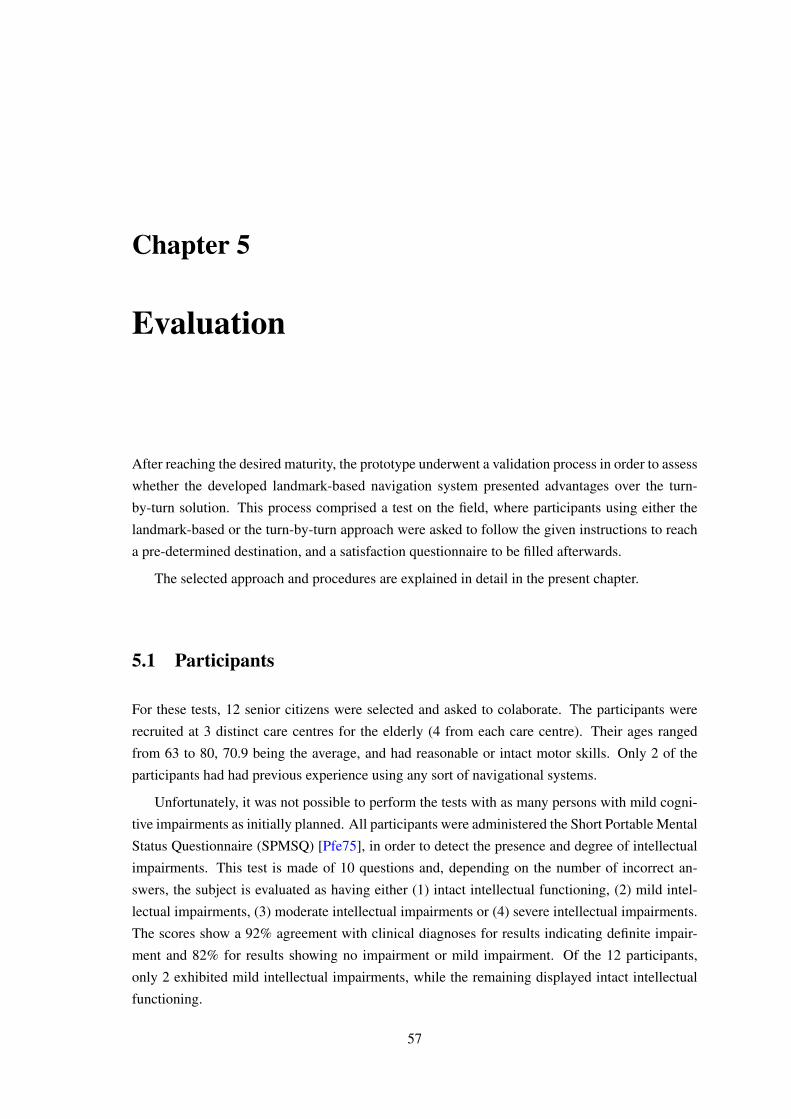
Chapter 5
Evaluation
After reaching the desired maturity, the prototype underwent a validation process in order to assess
whether the developed landmark-based navigation system presented advantages over the turn-
by-turn solution. This process comprised a test on the field, where participants using either the
landmark-based or the turn-by-turn approach were asked to follow the given instructions to reach
a pre-determined destination, and a satisfaction questionnaire to be filled afterwards.
The selected approach and procedures are explained in detail in the present chapter.
5.1 Participants
For these tests, 12 senior citizens were selected and asked to colaborate. The participants were
recruited at 3 distinct care centres for the elderly (4 from each care centre). Their ages ranged
from 63 to 80, 70.9 being the average, and had reasonable or intact motor skills. Only 2 of the
participants had had previous experience using any sort of navigational systems.
Unfortunately, it was not possible to perform the tests with as many persons with mild cogni-
tive impairments as initially planned. All participants were administered the Short Portable Mental
Status Questionnaire (SPMSQ) [Pfe75], in order to detect the presence and degree of intellectual
impairments. This test is made of 10 questions and, depending on the number of incorrect an-
swers, the subject is evaluated as having either (1) intact intellectual functioning, (2) mild intel-
lectual impairments, (3) moderate intellectual impairments or (4) severe intellectual impairments.
The scores show a 92% agreement with clinical diagnoses for results indicating definite impair-
ment and 82% for results showing no impairment or mild impairment. Of the 12 participants,
only 2 exhibited mild intellectual impairments, while the remaining displayed intact intellectual
functioning.
57
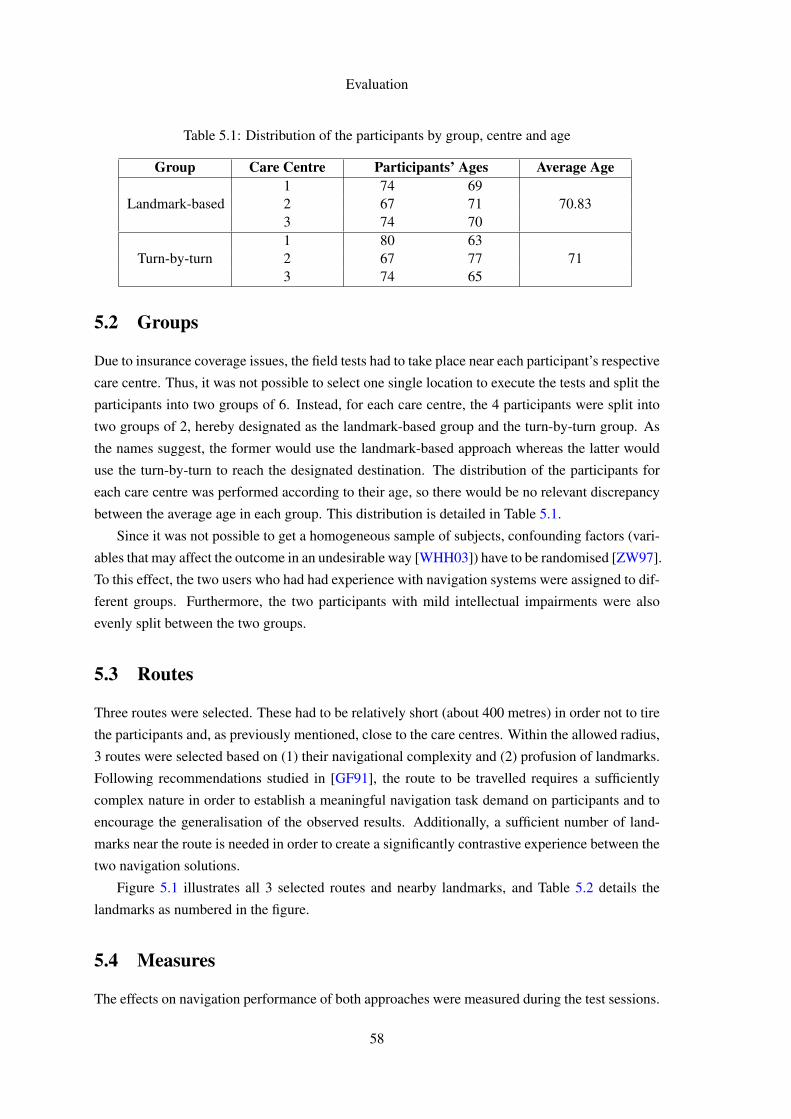
Evaluation
Table 5.1: Distribution of the participants by group, centre and age
Group Care Centre Participants’ Ages Average Age
Landmark-based1 74 69
70.832 67 713 74 70
Turn-by-turn1 80 63
712 67 773 74 65
5.2 Groups
Due to insurance coverage issues, the field tests had to take place near each participant’s respective
care centre. Thus, it was not possible to select one single location to execute the tests and split the
participants into two groups of 6. Instead, for each care centre, the 4 participants were split into
two groups of 2, hereby designated as the landmark-based group and the turn-by-turn group. As
the names suggest, the former would use the landmark-based approach whereas the latter would
use the turn-by-turn to reach the designated destination. The distribution of the participants for
each care centre was performed according to their age, so there would be no relevant discrepancy
between the average age in each group. This distribution is detailed in Table 5.1.
Since it was not possible to get a homogeneous sample of subjects, confounding factors (vari-
ables that may affect the outcome in an undesirable way [WHH03]) have to be randomised [ZW97].
To this effect, the two users who had had experience with navigation systems were assigned to dif-
ferent groups. Furthermore, the two participants with mild intellectual impairments were also
evenly split between the two groups.
5.3 Routes
Three routes were selected. These had to be relatively short (about 400 metres) in order not to tire
the participants and, as previously mentioned, close to the care centres. Within the allowed radius,
3 routes were selected based on (1) their navigational complexity and (2) profusion of landmarks.
Following recommendations studied in [GF91], the route to be travelled requires a sufficiently
complex nature in order to establish a meaningful navigation task demand on participants and to
encourage the generalisation of the observed results. Additionally, a sufficient number of land-
marks near the route is needed in order to create a significantly contrastive experience between the
two navigation solutions.
Figure 5.1 illustrates all 3 selected routes and nearby landmarks, and Table 5.2 details the
landmarks as numbered in the figure.
5.4 Measures
The effects on navigation performance of both approaches were measured during the test sessions.
58
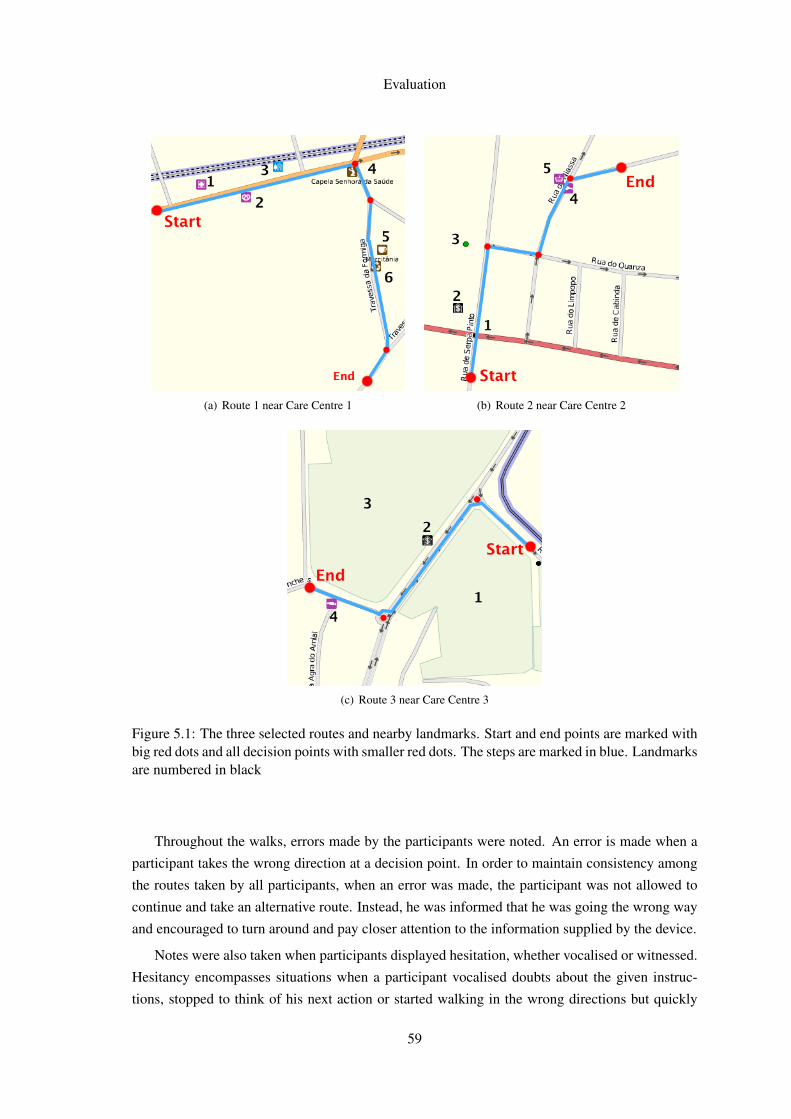
Evaluation
(a) Route 1 near Care Centre 1 (b) Route 2 near Care Centre 2
(c) Route 3 near Care Centre 3
Figure 5.1: The three selected routes and nearby landmarks. Start and end points are marked withbig red dots and all decision points with smaller red dots. The steps are marked in blue. Landmarksare numbered in black
Throughout the walks, errors made by the participants were noted. An error is made when a
participant takes the wrong direction at a decision point. In order to maintain consistency among
the routes taken by all participants, when an error was made, the participant was not allowed to
continue and take an alternative route. Instead, he was informed that he was going the wrong way
and encouraged to turn around and pay closer attention to the information supplied by the device.
Notes were also taken when participants displayed hesitation, whether vocalised or witnessed.
Hesitancy encompasses situations when a participant vocalised doubts about the given instruc-
tions, stopped to think of his next action or started walking in the wrong directions but quickly
59
Evaluation
Table 5.2: Landmarks near the routes selected for the test sessions
Route LandmarkNumber Name Type
1
1 Farmácia Cameira Pharmacy2 Padaria do Heroísmo Bakery3 Residencial Veneza Hostel4 Capela Senhora da Saúde Chapel5 Marcitânia Café6 N/A Recycling container
2
1 N/A Traffic light2 Millenium BCP Bank3 TGV Interior decoration store4 N/A Fishmonger5 N/A Convenience store
3
1 Universidade Católica University2 Santander Totta Bank3 Instituto Superior de Engenharia do Porto College4 Pérola Jovem Confectionary
corrected his path before making an error.
A third measure was used for situations where participants got lost. This situation is the result
of not understanding or being confused by the given instructions and not being able to make a
decision.
These measures help to assess whether a landmark-based solution reduces hesitation frequency
and thus if it increases the sense of safety of older adults. They were also used to evaluate which
kind of instructions is better perceived by the user and is less prone to errors.
Lastly, in order to find out if any of the two hypothesis improves the time taken to navigate
a route, the duration of each journey was recorded. The stopwatch was paused while waiting in
crosswalks.
5.5 Test Procedure
Prior to the tests execution, some guidelines were outlined.
The destination address should not be disclosed to the participants. Otherwise, it would be
possible for a participant to navigate to the destination while disregarding the given instructions.
Furthermore, the address had to be hidden from the interface, as seen in Figure 5.2.
At the beginning of each test session, the participant was asked to try to reach the destination
solely by following the given instructions, either audibly or visually, and, if needed, to use addi-
tional information on the smartphone screen. In order to reduce interference from traffic noise, the
participant wore an earphone connected to the smartphone. They were also asked to vocalise their
thoughts as much as possible. The researcher followed the participant two steps behind, taking
60
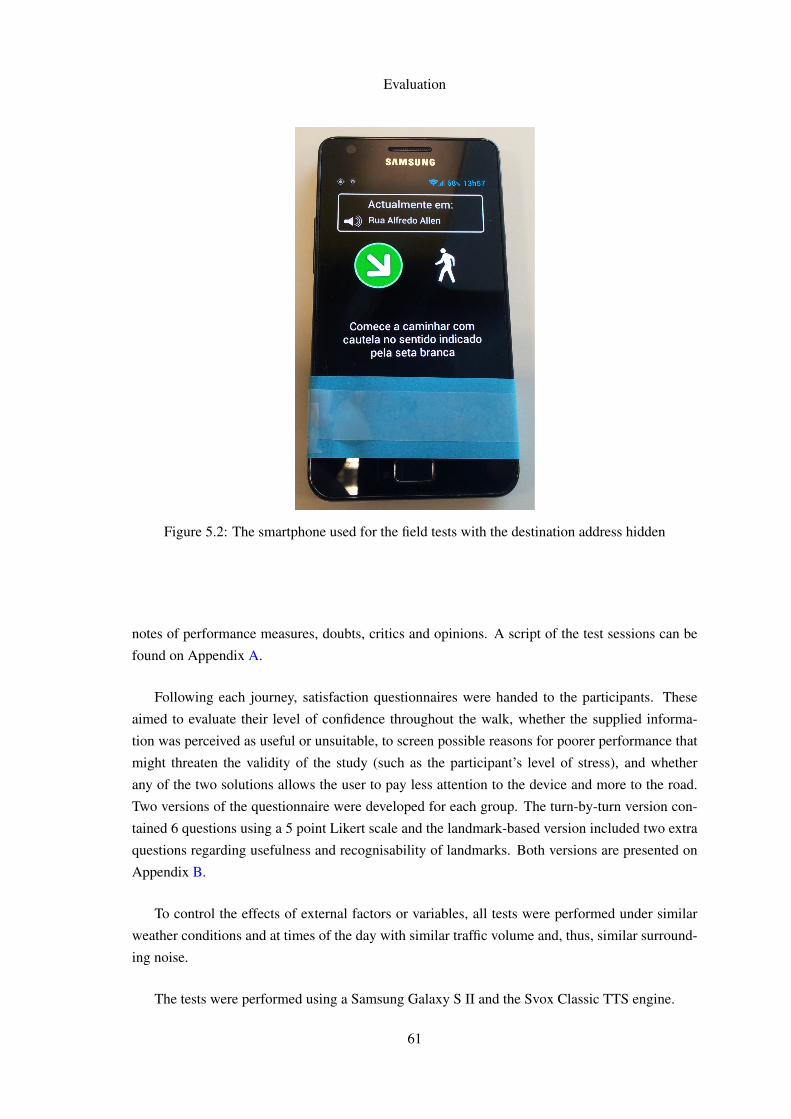
Evaluation
Figure 5.2: The smartphone used for the field tests with the destination address hidden
notes of performance measures, doubts, critics and opinions. A script of the test sessions can be
found on Appendix A.
Following each journey, satisfaction questionnaires were handed to the participants. These
aimed to evaluate their level of confidence throughout the walk, whether the supplied informa-
tion was perceived as useful or unsuitable, to screen possible reasons for poorer performance that
might threaten the validity of the study (such as the participant’s level of stress), and whether
any of the two solutions allows the user to pay less attention to the device and more to the road.
Two versions of the questionnaire were developed for each group. The turn-by-turn version con-
tained 6 questions using a 5 point Likert scale and the landmark-based version included two extra
questions regarding usefulness and recognisability of landmarks. Both versions are presented on
Appendix B.
To control the effects of external factors or variables, all tests were performed under similar
weather conditions and at times of the day with similar traffic volume and, thus, similar surround-
ing noise.
The tests were performed using a Samsung Galaxy S II and the Svox Classic TTS engine.
61
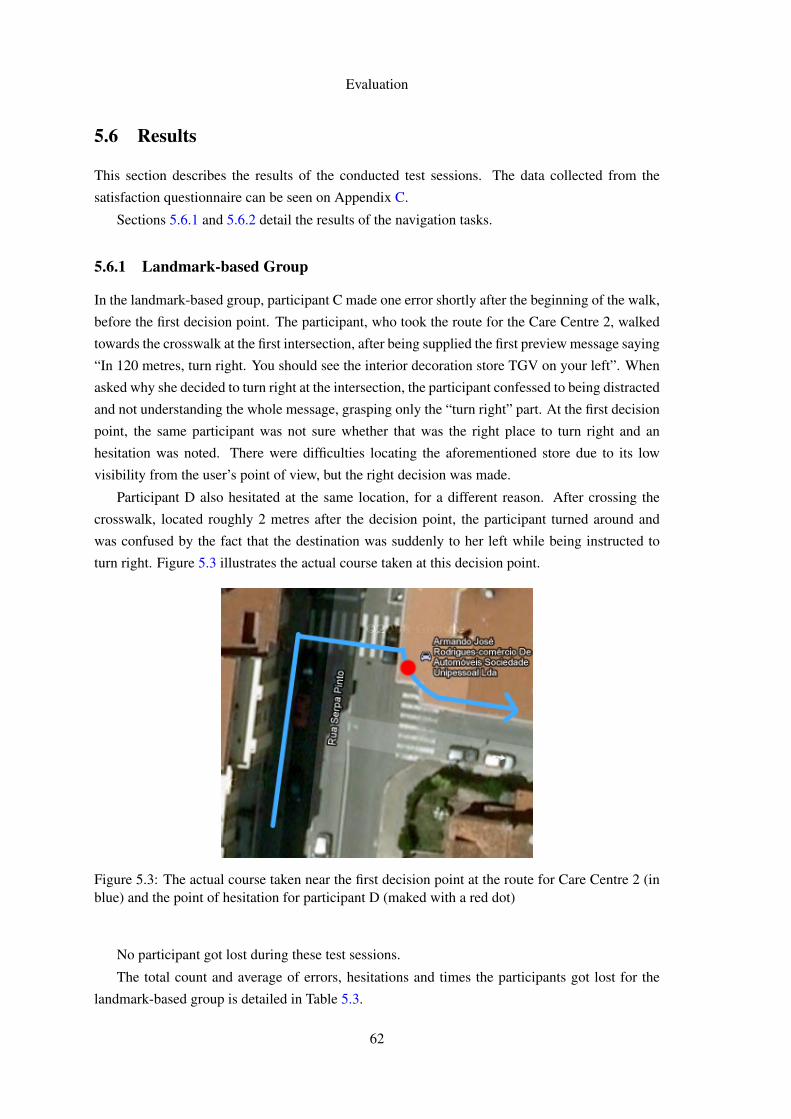
Evaluation
5.6 Results
This section describes the results of the conducted test sessions. The data collected from the
satisfaction questionnaire can be seen on Appendix C.
Sections 5.6.1 and 5.6.2 detail the results of the navigation tasks.
5.6.1 Landmark-based Group
In the landmark-based group, participant C made one error shortly after the beginning of the walk,
before the first decision point. The participant, who took the route for the Care Centre 2, walked
towards the crosswalk at the first intersection, after being supplied the first preview message saying
“In 120 metres, turn right. You should see the interior decoration store TGV on your left”. When
asked why she decided to turn right at the intersection, the participant confessed to being distracted
and not understanding the whole message, grasping only the “turn right” part. At the first decision
point, the same participant was not sure whether that was the right place to turn right and an
hesitation was noted. There were difficulties locating the aforementioned store due to its low
visibility from the user’s point of view, but the right decision was made.
Participant D also hesitated at the same location, for a different reason. After crossing the
crosswalk, located roughly 2 metres after the decision point, the participant turned around and
was confused by the fact that the destination was suddenly to her left while being instructed to
turn right. Figure 5.3 illustrates the actual course taken at this decision point.
Figure 5.3: The actual course taken near the first decision point at the route for Care Centre 2 (inblue) and the point of hesitation for participant D (maked with a red dot)
No participant got lost during these test sessions.
The total count and average of errors, hesitations and times the participants got lost for the
landmark-based group is detailed in Table 5.3.
62
Evaluation
Table 5.3: Count of errors, hesitations and times the participants got lost and time taken to com-plete the task (landmark-based group)
Care Centre 1 Care Centre 2 Care Centre 3 Total AverageA B C D E FErrors 0 0 1 0 0 0 1 0.17Hesitations 0 0 1 1 0 0 2 0.33Lost 0 0 0 0 0 0 0 0Time (minutes) 5:55 6:02 4:30 4:37 6:24 5:50 - 5:33
5.6.2 Turn-by-turn Group
On the route for the care centre 2, Participant J made one error at the second decision point. In spite
of being instructed to “Turn left onto Rua do Niassa” the participant continued walking forward.
When asked why, she stated that she was confused by the fact that the device showed she was
still 10 metres away from the next decision point. This disparity is explained by the intrinsic GPS
accuracy (which usually has a margin of error of 10 metres, 3 at best) and mapping errors. The
same participant also displayed clear hesitation twice: (1) at the first decision point, also as a result
of the previously mentioned reason, and (2) at the first intersection, stating “Should I cross here?”.
Both hesitations were brief and did not result in errors.
Participant I also displayed signs of hesitation twice while walking towards the first decision
point.
Reaching the first and second decision points, participant K expressed some doubts. After
being told to “Turn right onto Rua da Formiga” and then to “Turn slight right onto Travessa da
Formiga”, the participant stated she wasn’t sure which street she should turn onto, but made the
right decision because of the supplied orientation (i.e., “Turn right” and “Turn slight right”).
No participant got lost during these test sessions.
The total count and average of errors, hesitations and times the participants got lost for the
landmark-based group is detailed in Table 5.4.
Table 5.4: Count of errors, hesitations and times the participants got lost and time taken to com-plete the task (turn-by-turn group)
Care Centre 1 Care Centre 2 Care Centre 3 Total AverageG H I J K LErrors 0 0 0 1 0 0 1 0.17Hesitations 0 0 2 2 2 0 6 1Lost 0 0 0 0 0 0 0 0Time (minutes) 6:45 6:20 5:03 5:56 5:51 5:09 - 5:50
5.7 Discussion
Table 5.5 summarizes the results of both landmark-based and turn-by-turn groups.
63
Evaluation
Table 5.5: Summarized results of the landmark-based and turn-by-turn groups
Group Errors Hesitations Lost Mean TimeLandmak-based 1 2 0 5:33Turn-by-turn 1 6 0 5:50
Participants using the landmark-based approach expressed hesitation 66.6% less often than
those using the turn-by-turn solution. This indicates that older adults tend to make faster decisions
with little doubt and, thus, feel more secure about them. The satisfaction questionnaire showed
that 5 out of 6 participants had no trouble locating the referenced landmarks and that they found
these references more useful than street addresses, which further supports this conclusion.
Although the same number of errors were registered for both groups, the facts that there was
less hesitation and that the instructions were better and more quickly perceived by the users indi-
cate that a landmark-based solution might be less error-prone.
The data collected from the satisfaction questionnaire regarding question 3 showed no signi-
ficative difference, which means that neither solution allowed the user to abstract from the inter-
face and focus on the road more than the other. It was expected that the landmark-based approach
would display improvements regarding this matter.
The records regarding the time participants took to reach the destination show a slightly better
performance toward the landmark-based group (who took 4.9% less time), although the difference
is not significative. This issue remains inconclusive and requires further testing.
It should be noted that among the two participants who displayed mild intellectual impair-
ments, participant E who was guided though landmarks showed no signs of hesitation or made
any mistakes, as opposed to participant J who hesitated twice and made one mistake. Despite the
low number of participants from this population, this may mean that persons with mild cognitive
impairments may benefit from this approach.
Not all of the doubts and errors that were made were directly related to the given instructions,
but they helped identify new requirements for pedestrian navigation systems.
Participant D’s doubt, mentioned in Section 5.6, highlighted the fact that pedestrians, as op-
posed to drivers, often need to walk past the decision point (e.g., to cross the street) before actually
making a turn. Pedestrian navigation aids need to be aware of these situations and react accord-
ingly. In this case, a new instruction would have to be generated illustrating the change of scenery.
The static arrow would have to be updated as well. Furthermore, the triggering of the (previously
implemented) re-routing mechanism needs to be more lenient to account for these situations, and
allow the user to walk further away from the decision point before deciding that a re-route is
needed.
The error made by participant J also revealed that distance data is not always helpful and can
indeed be damaging at times, due to its margin of error. In this instance, the distance would have
to be removed from the device’s screen when approaching a decision point. As this distance gets
shorter, the more likely it is to mislead the user.
64

Evaluation
These tests also uncovered the fact that preview messages might be more harmful than helpful
in the context of senior citizens. Some participants were not able to understand that the turn they
were being instructed to make was still distant, and some, although having understood, stated that
it may indeed cause confusion. The fact that these instructions contain references to distances,
manoeuvre type and either landmarks or street addresses may be the cause of an information
overload.
Some of the results may have been influenced by the fact that most participants were familiar
with the area where the tests took place. Further testing in routes unknown to the participants is
needed, where performance differences should be highlighted.
65

Evaluation
66
Chapter 6
Conclusions
Given the worldwide rapid growth of the older population, there has been an increased incidence
of age-related physical and mental impairment. People affected by these impairments, from which
dementia is the most common, often display a decreased cognitive ability and mobility. This leads
to a fear of getting lost when going outdoors and so to a declining sense of safety. Thus, navigation
is a vital topic that needs to be addressed.
In order to overcome these problems, a prototype of a pedestrian navigation system focused on
older adults using both a landmark-based and a turn-by-turn approaches was developed. During
this process, many of the issues identified by previous studies regarding the usage of landmarks in
navigation systems were addressed. Although there is still room for improvement, the prototype
effectively makes use of the user’s surroundings to present him enhanced cues and guide him
towards his goal.
Employing an empirical methodology, tests were performed on the field with 12 participants
from 63 to 80 years of age. Two groups (the turn-by-turn and landmark-based groups) were
formed, and participants were asked to navigate to an undisclosed destination using either ap-
proach. From the collected data, it was concluded that users using a landmark-based navigation
system make faster decisions with little doubt or hesitancy. Older adults using this method have
more confidence in their decisions and the system itself.
The tests also led to important findings regarding pedestrian navigation systems in general,
and for older adults in particular. Preview instructions (i.e., instructions that give advance warning
about distant manoeuvres, such as “In 100 metres, turn right after passing a restaurant”) may
contain more information than that which older adults can perceive and consequently lead to wrong
decisions. Distances have to be handled carefully, particularly near decision points, when the
inherent margin of error gains significance and may confuse the user. The fact that pedestrians
often walk past the decision point in order to cross the street in a crosswalk, as opposed to drivers,
also has to be accounted for.
67
Conclusions
As stated by M. Drager and A. Koller [DK12], a proper landmarks database is hard to main-
tain. Throughout the world, businesses open and close every day, even “street furniture” is not
static. This creates a very dynamic environment, and so a landmarks network has to be thoroughly
updated. In this sense, OSM has a very active community, but there are still many areas where no
landmarks are documented and a landmark-based navigation system is not advantageous. Worse,
informing users of landmarks that don’t exist anymore may lead to confusion and disorientation.
Overall, despite the aforementioned challenge, guidance through landmarks located along the
route presents a significative increase in older adult’s mobility, orientation and sense of safety.
6.1 Future Work
Regarding the developed prototype, there is still room for improvement. The algorithm used to
select which landmarks should be used to generate confirmation instructions does not account
for the fact that instruction referring to area landmarks do not need to be triggered before the
landmark’s location. In these cases, the instruction can be delivered to the user while he is passing
by the landmark. Considering this, more combinations of confirmation instructions (perhaps more
valuable ones) could be brought into the equation.
On OSM, area landmarks can be represented by its perimeter, but may also contain information
about the perimeter of its main buildings. Faculties, for instance, often comprise several other
buildings. By taking these into account (the way these buildings are organised, their distance to
the street, how wide they are, etc.), a better judgement of the landmark’s usefulness could be made.
A valuable improvement would also be to merge instructions for very short steps. For two
decision point close to each other, the two identification instructions could be merged into one,
such as “Turn right after passing by a church, and then turn left”. Landmarks could also be used
near decision points, not to identify, but to confirm a well-made manoeuvre, such as “Turn right.
The courthouse should then be to your left”.
As observed in the studies of Goodman et al. [GGKB04], presented in Section 2.2.5, the in-
clusion of pictures of the embedded landmarks on the device’s interface, perhaps through Google
Map’s Street View, might also be beneficial to the user’s understanding of the presented instruc-
tions.
Further experiments are required to complement the study here presented. More valuable
conclusions could be drawn from tests performed with persons with mild cognitive impairments,
since it was not possible at the present time. Tests carried out on longer and more complex routes
could bring performance differences between the two approaches to light. More importantly,
routes unknown to the participants could be perceived as a more meaningful navigation task and
produce useful results.
Finally, two aspects remain inconclusive and need further studying: whether either approach
allows the user to abstract more from the device’s interface and focus more on the road, relying
solely on dictated instructions, and whether participants using either approach reach the destina-
tion faster than the other.
68

Appendix A
Test Sessions Script
1. Contextualise this session by explaining to the participant the concept and purpose of this
project.
2. Explain the need for this test session.
3. Stress out that it is the application that is being tested, not the participant.
4. Conduct the SPMSQ test.
5. Inform the participant on how the test will be conducted:
(a) He/she should navigate to a certain destination.
(b) Instructions regarding how he/she should proceed will be given, both visually and
audibly.
(c) Instruct the participant to try to rely primarily on the spoken/written instructions and,
when needed, to resort to additional information on the device’s screen.
(d) Instruct the participant to vocalise his/her every doubt, opinion or critic.
(e) Ask the participant to act as if he/she was unaccompanied.
6. Explain the meaning of the information displayed on the application interface.
69

Test Sessions Script
70

Appendix B
Satisfaction Questionnaire
B.1 Questions presented to all participants
Please check the response that most closely describes your level of agreement with the following
statements:
1. Throughout the walk, I felt confident and secure about the decisions I was making.
Completelydisagree Disagree
Neitheragree nordisagree
Agree Completelyagree
2 2 2 2 2
2. I know the streets through which I passed, since I was familiar with the area.
Completelydisagree Disagree
Neitheragree nordisagree
Agree Completelyagree
2 2 2 2 2
3. I found the voice instructions sufficient to reach the destination without needing to resort to
additional information on the device screen.
Completelydisagree Disagree
Neitheragree nordisagree
Agree Completelyagree
2 2 2 2 2
4. I felt uneasy by the presence of the researchers.
Completelydisagree Disagree
Neitheragree nordisagree
Agree Completelyagree
2 2 2 2 2
71
Satisfaction Questionnaire
5. I thought that the instructions were clear and understood them without difficulty.
Completelydisagree Disagree
Neitheragree nordisagree
Agree Completelyagree
2 2 2 2 2
6. I thought that references to street names and distances were useful to guide me.
Completelydisagree Disagree
Neitheragree nordisagree
Agree Completelyagree
2 2 2 2 2
B.2 Questions for the landmark-based group
7. I thought that references to landmarks were useful to guide me.
Completelydisagree Disagree
Neitheragree nordisagree
Agree Completelyagree
2 2 2 2 2
8. I recognised the mentioned landmarks without difficulty.
Completelydisagree Disagree
Neitheragree nordisagree
Agree Completelyagree
2 2 2 2 2
72
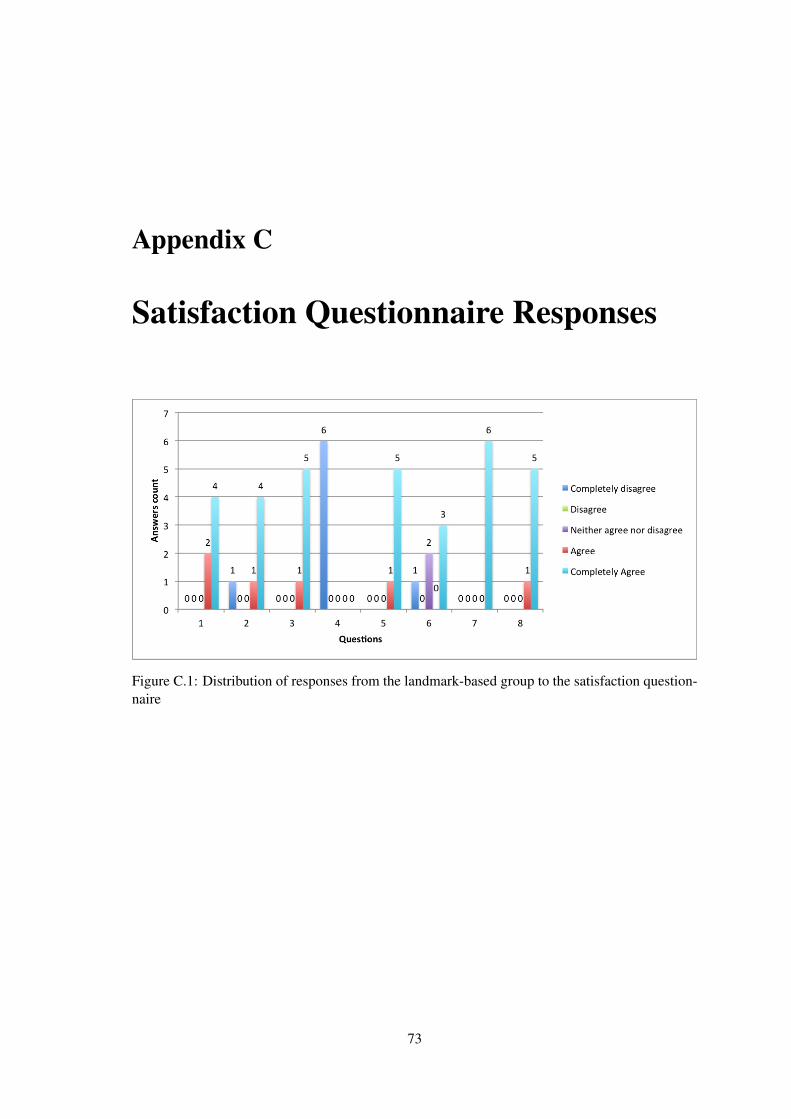
Appendix C
Satisfaction Questionnaire Responses
Figure C.1: Distribution of responses from the landmark-based group to the satisfaction question-naire
73
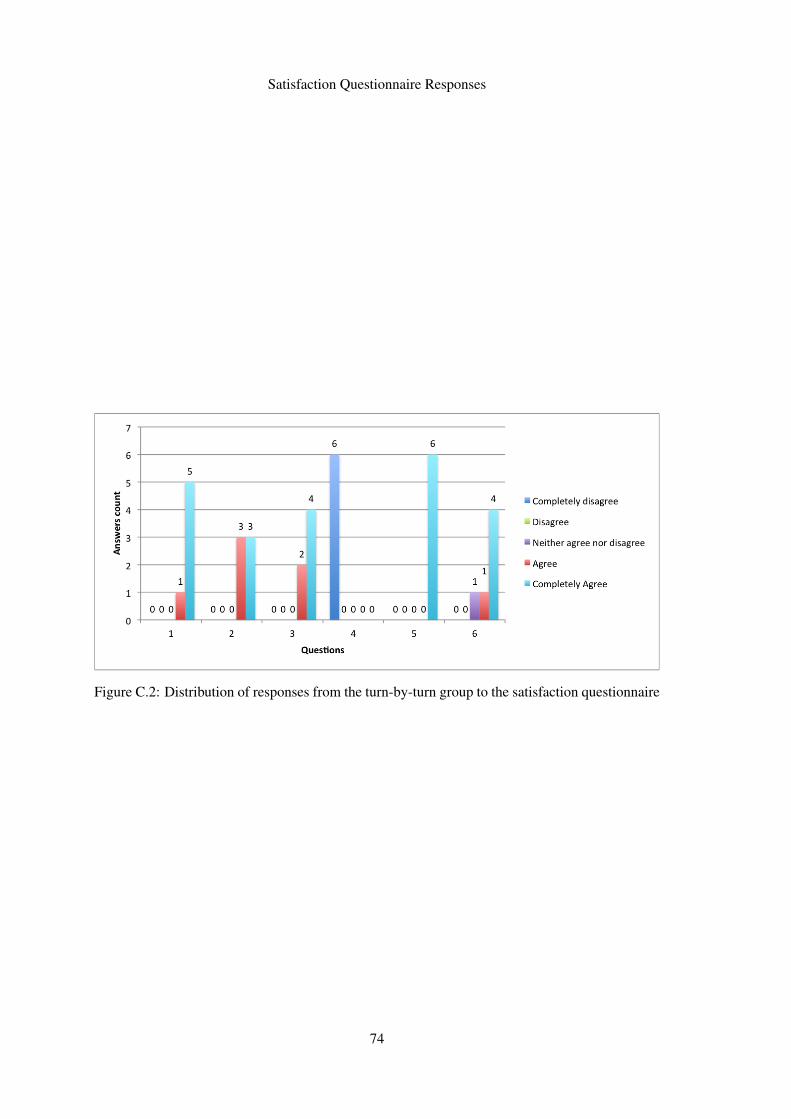
Satisfaction Questionnaire Responses
Figure C.2: Distribution of responses from the turn-by-turn group to the satisfaction questionnaire
74
References
[ABI11] ABI Research. Why the PND Market Faces a 50% Decline, and What Needsto Change. http://www.abiresearch.com/press/why-the-pnd-market-faces-a-50-decline-and-what-nee [Online; accessed on February 2013],2011. Cited on page 6.
[Bak81] R Baker. Human navigation and the sixth sense. Simon and Schuster, 1981. Cited on
page 5.
[BE03] C Brenner and B Elias. Extracting Landmarks for Car Navigation Systems Using Ex-isting GIS Databases and Laser Scanning. In ISPRS Archives, volume XXXIV, pages78–87, 2003. Cited on page 14.
[Ben12] Jonathan Bennett. Welcome, Apple! http://blog.osmfoundation.org/2012/03/08/welcome-apple/ [Online; accessed on Decembre 2012], 2012. Cited on page
22.
[Bur98] Gary E. Burnett. "Turn right at the King’s Head" Drivers’ requirements for routeguidance information. PhD thesis, Loughborough University, 1998. Cited on pages 9
and 45.
[CLRS09] Thomas H Cormen, Charles E Leiserson, Ronald L Rivest, and Clifford Stein. Intro-duction to Algorithms. The MIT Press, 3rd edition, 2009. Cited on page 48.
[DK12] Markus Drager and Alexander Koller. Generation of landmark-based navigation in-structions from open-source data. In Walter Daelemans, Mirella Lapata, and LluísMàrquez, editors, EACL, pages 757–766. The Association for Computer Linguistics,2012. Cited on pages 5, 14, 15, and 68.
[Eli02] Birgit Elias. Automatic Derivation Of Location Maps. In GeoSpatial Theory, Process-ing and Applications, 2002. Cited on page 14.
[Eli03] Birgit Elias. Extracting Landmarks with Data Mining Methods. In Walter Kuhn,Michael Worboys, and Sabine Timpf, editors, Spatial Information Theory. Founda-tions of Geographic Information Science, volume 2825 of Lecture Notes in ComputerScience, pages 375–389. Springer Berlin Heidelberg, 2003. Cited on page 14.
[Fou12] Foursquare. foursquare is joining the OpenStreetMap movement! Say hi to prettynew maps! http://blog.foursquare.com/2012/02/29/foursquare-is-joining-the-openstreetmap-movement-say-hi-to-pretty-new-maps/ [Online; accessed on Decembre 2012], 2012. Cited on page 22.
75
REFERENCES
[Fre11] Ed Freyfogle. Why (and how) we’ve switched away from Google Maps.http://blog.nestoria.co.uk/why-and-how-weve-switched-away-from-google-ma [Online; accessed on Novembre 2012], 2011. Cited on pages 20
and 22.
[GF91] H. Gstalter and W. Fastenmeier. Components of Test Routes for the Evaluation ofIn-Car Navigation Systems. V1017: BERTIE, 1991. Cited on page 58.
[GGKB04] Joy Goodman, Phil Gray, Kartik Khammampad, and Stephen Brewster. Using Land-marks to Support Older People in Navigation. In In Proceedings of Mobile HCI 2004,Springer-Verlag, LNCS series, pages 38–48. Springer, 2004. Cited on pages vii, 15, 16, 25,
and 68.
[HJ85] Stephen C. Hirtle and John Jonides. Evidence of hierarchies in cognitive maps. Memory& Cognition, 13(3):208–217, 1985. Cited on page 8.
[Khr09] Olga Khroustaleva. Go thataway: Google Maps India learns to navigate like a lo-cal. http://googleblog.blogspot.pt/2009/12/go-thataway-google-maps-india-learns-to.html [Online; accessed on July 2012], 2009. Cited on
page 17.
[Kim09] Danny Kim. Smart Phones to Surpass PNDs in Navigation Market in2014. http://www.isuppli.com/automotive-infotainment-and-telematics/news/pages/smart-phones-to-surpass-pnds-in-navigation-market-in-2014.aspx [Online; accessed on July 2012], 2009.Cited on page 6.
[Kim11] Danny Kim. Portable Navigation Market to Peak in 2011. http://www.isuppli.com/automotive-infotainment-and-telematics/marketwatch/pages/portable-navigation-market-to-peak-in-2011.aspx [On-line; accessed on July 2012], 2011. Cited on page 6.
[KvDJ11] Roy P C Kessels, Amy van Doormaal, and Gabriele Janzen. Landmark Recognition inAlzheimer’s Dementia: Spared Implicit Memory for Objects Relevant for Navigation.PLoS ONE, 6(4):e18611, 2011. Cited on page 25.
[Mou11] Ricardo Jorge Azevedo Moutinho. A Mobile Phone Navigator For Older Adults andPersons with Dementia. Master’s thesis, Faculdade de Engenharia da Universidade doPorto, 2011. Cited on pages 2 and 52.
[MRBT03] Andrew J. May, Tracy Ross, Steven H. Bayer, and Mikko J. Tarkiainen. Pedestriannavigation aids: information requirements and design implications. Personal and Ubiq-uitous Computing, 7(6):331–338, December 2003. Cited on pages vii, ix, 9, 10, 11, 12, 13, 23,
and 28.
[MS07] Alexandra Millonig and Katja Schechtner. Developing Landmark-Based Pedestrian-Navigation Systems. Intelligent Transportation Systems, IEEE Transactions on,8(1):43–49, 2007. Cited on page 12.
[Pfe75] E Pfeiffer. A short portable mental status questionnaire for the assessment of or-ganic brain deficit in elderly patients. Journal of the American Geriatrics Society,23(10):433–441, 1975. Cited on page 57.
76

REFERENCES
[RK10] Duangduen Roongpiboonsopit and Hassan A Karimi. Comparative evaluation and anal-ysis of online geocoding services. International Journal of Geographical InformationScience, 24(7):1081–1100, 2010. Cited on page 22.
[RW02] Martin Raubal and Stephan Winter. Enriching Wayfinding Instructions with LocalLandmarks. In Proceedings of the Second International Conference on GeographicInformation Science, GIScience ’02, pages 243–259, London, UK, 2002. Springer-Verlag. Cited on page 13.
[SBM+05] Reinhard Sefelin, Michael Bechinie, Regine Müller, Verena Seibert-Giller, PeterMessner, and Manfred Tscheligi. Landmarks: yes; but which? Five methods to selectoptimal landmarks for a landmark- and speech-based guiding system. In Proceedingsof the 7th international conference on Human computer interaction with mobile devices& services, MobileHCI ’05, pages 287–290, New York, NY, USA, 2005. ACM.Cited on page 14.
[SDT10] F Sposaro, J Danielson, and G Tyson. iWander: An Android application for demen-tia patients. In Engineering in Medicine and Biology Society (EMBC), 2010 AnnualInternational Conference of the IEEE, pages 3875–3878, 2010. Cited on page 8.
[SH99] Molly E Sorrows and Stephen C Hirtle. The Nature of Landmarks for Real and Elec-tronic Spaces. In Proceedings of the International Conference on Spatial InformationTheory: Cognitive and Computational Foundations of Geographic Information Sci-ence, COSIT ’99, pages 37–50, London, UK, 1999. Springer-Verlag. Cited on page 13.
[TS06] Manfred Tscheligi and Reinhard Sefelin. Mobile navigation support for pedestrians:can it work and does it pay off? interactions, 13(4):31–33, 2006. Cited on page 11.
[VPS+08] Michael Vassallo, Lynn Poynter, Jagdish C Sharma, Joseph Kwan, and Stephen CAllen. Fall risk-assessment tools compared with clinical judgment: an evaluation in arehabilitation ward. Age and ageing, 37(3):277–81, May 2008. Cited on page 1.
[WHH03] Claes Wohlin, Martin Höst, and Kennet Henningsson. Empirical research methods insoftware engineering. In ESERNET, pages 7–23, 2003. Cited on page 58.
[WHW09] Chih-Fu Wu, Wan-Fu Huang, and Tung-Chen Wu. A Study on the Design of VoiceNavigation of Car Navigation System. In Proceedings of the 13th International Confer-ence on Human-Computer Interaction. Part III: Ubiquitous and Intelligent Interaction,pages 141–150, Berlin, Heidelberg, 2009. Springer-Verlag. Cited on page 5.
[Wor11] World Health Organization. Global Health and Aging Report. Technical report, 2011.Cited on page 1.
[Wor12a] World Health Organization. Dementia: a public health priority. Technical report, 2012.Cited on page 1.
[Wor12b] World Health Organization. Good health adds life to years: Global brief for WorldHealth Day 2012. page 28, 2012. Cited on page 1.
[ZW97] Marvin V Zelkowitz and Dolores Wallace. Experimental Models for Validating Com-puter Technology, 1997. Cited on pages 26 and 58.
77