Embed Size (px)
Citation preview

Improving polymer flood performance in high salinity reservoirs
M. Algharaib n, A. Alajmi, R. GharbiPetroleum Engineering Department, Kuwait University, Kuwait
a r t i c l e i n f o
Article history:Received 22 May 2013Accepted 3 February 2014Available online 14 February 2014
Keywords:enhanced oil recoverychemical floodingpolymer floodinghigh salinity oil reservoirs
a b s t r a c t
The application of Enhanced Oil Recovery (EOR) techniques is encouraged by the current oil price and thegrowing global demand for oil. Optimizing oil production from current resources becomes a mainstrategy target for many oil producing companies around the world. Among EOR processes, polymerflooding is an attractive option in many reservoirs. The objective of polymer flooding is to control watermobility inside oil reservoirs to ensure high oil recovery factors. Several design parameters are critical forthe success of polymer flooding applications. In many reservoirs, high salinity of formation's waterimposes a challenge on polymer flood applicability. Therefore, improving polymer flood performance inhigh salinity conditions may unlock these resources which in turn will have enormous positive impact onoil reserves. Injection of a water slug (preflush) ahead of polymer, to condition the high salinity reservoir,is a promising technique to minimize the effect of salinity on polymer slug. In this work, a series of labexperiments were conducted to explore the performance of sequential injection of preflush-polymer-water on oil recovery factor. The effects of several design parameters are investigated including polymerconcentration and polymer slug size, preflush salinity, and preflush slug size. The results indicate thatpreflush and polymer characteristics have various degrees of influence on oil recovery factor.
& 2014 Elsevier B.V. All rights reserved.
1. Introduction
Polymer flooding is one of the most promising EOR processes inmany reservoirs because of its relative lower capital cost (Da Silvaet al., 2007). In order to ensure favorable oil displacement front,polymers are used to reduce mobility ratio between water and oil.Polymers basically increase the viscosity of the injected water whichallows for an increase in the vertical and areal sweep efficiency andconsequently an increase in oil recovery factor. Generally, there aretwo types of polymers which are used in EOR applications: syntheticmaterial polyacrylamide in its partially hydrolyzed form (HPAM) andthe biopolymer Xanthan (Sorbie, 1991).
Polymer flooding technique has been used for more than 30 yrwith an ultimate recovery expectation of 50% and incremental oilrecovery of 10–15% over water flooding technique. There areseveral examples of field implementations of polymer floodingin the literatures (Seright 2010; Thakuria et al., 2013). In China forexample, Liu et al. (2007) conducted a simulation study for an oilreservoir in Daqing field which indicates that polymer floodingmight reach an oil recovery factor of 61% OOIP. In another work,Fulin et al. (2006) presented a case study for two pilot projects inDaqing oil field which indicates that an incremental oil recovery,over water flood, of 19.8–22.9% can be achieved for the first pilot
and around 19.4% for the second pilot. Fulin et al. (2006) showedthat before implementing these pilots, the results from core floodexperiments resulted in an incremental recovery factor over waterflooding of more than 20% OOIP which can be achieved by earlytime injection of high molecular weight, high concentrationpolymers. Moreover, Tielong et al. (1998) investigated the feasi-bility of polymer flooding in a pilot test conducted in Shuanghereservoir located in the southeast Henan oil field which is knownto be an elevated-temperature reservoir. At the end of the pilot, atotal of 9.8% incremental oil recovery was achieved. They con-cluded that polymer with extra-high molecular weight can suc-cessfully control the mobility ratio and modify the permeabilityprofile. Furthermore, Chang et al. (2006) presented an overview ofpolymer flood applications in Daqing and Shengli oil fields whichstated that up to 14% of incremental oil recovery factor wasobtained by implementing chemical EOR processes. Besides poly-mer floods in China, Da Silva et al. (2007) presented an economicanalysis of PETROBRAS's experience with polymer flooding pro-jects. They concluded that polymer flooding can be justifiedeconomically and environmentally under the current oil marketconditions. Littmann et al. (1991) showed a case study where areservoir with a salinity of 220,000 ppm was flooded with poly-mer. They stated that the performance of the polymer floodingcould reach an oil recovery of 8% OOIP over waterflood. A study byWyatt et al. (2004), which shows other examples of polymerflooding implementations, compares the performance of core
Contents lists available at ScienceDirect
journal homepage: www.elsevier.com/locate/petrol
Journal of Petroleum Science and Engineering
http://dx.doi.org/10.1016/j.petrol.2014.02.0030920-4105 & 2014 Elsevier B.V. All rights reserved.
n Corresponding author.E-mail address: [email protected] (M. Algharaib).
Journal of Petroleum Science and Engineering 115 (2014) 17–23
flood experiments with the performance of field implementationsof four polymer flooding pilots: 2 in Canada, 1 in USA and 1 inChina. They concluded that core flooding experiments can be usedto predict the performance of polymer flooding.
Conducting lab investigations is a crucial task toward a success-ful implementation of EOR projects. Lab studies narrow the risksassociated with the application of EOR techniques on oil reser-voirs. Before polymer flooding implementation, several lab experi-ments are advised such as polymer injectivity, polymer thermaland chemical stability, polymer retention in porous media, andeffective viscosity measurements. Furthermore, a number of keyparameters which play crucial roles in polymer flooding perfor-mance should be determined such as inaccessible pore volume,screen factor, and resistance factor (Jennings et al., 1971). Castagnoet al. (1987) shows a case study in which discouraging outcomesfrom lab results prevent the implementation of polymer floodingproject. They found that the viscosity of the proposed polymersolution was low and lack microbial control in near wellboreregion. Moreover, Kleinitz and Littmann (1996) showed four casesof polymer flooding in Germany in which two of four pilots faileddue to the loss of controlled displacement front.
The performance of polymer flooding is a function of severalparameters that can be studied in the lab. Szabo (1975) studied theeffect of polymer concentration on the performance of polymer floodin unconsolidated sand packs. He found that there are lower andupper limiting values for polymer concentration beyond which theperformance of polymer flooding decreases. He also studied the effectof polymer slug size on oil recovery factor under various polymerconcentrations fromwhich he determined the optimum slug size andpolymer concentration for different sands. Furthermore, Szabo (1975)studied the effect of salinity on the performance of polymer floodingand found that the salinity reduces oil recovery factor at low polymerconcentrations and has a little effect at high polymer concentrations.Ryles (1988) studied the effect of temperature and divalent ion on thechemical stability of some water-soluble polymers used in EOR andshowed the degree at which these polymer start to degrade underanaerobic conditions. These polymers were polyacrylamide, xanthan,scleroglucan, cellulose sulfate, and a heteropolysaccharide. Moreover,Doe et al. (1987) evaluated several copolymers of vinylpyrrolidone(VP) and acrylamide (AM) for EOR applications in hostile environ-ments. They found that a range of VP/AM copolymer compositionswas found to tolerate the harsh environment of 250 1F. The perfor-mance of these copolymers was evaluated by extensive corefloodingexperiments. The results show that these copolymers can be easilyinjected into porous media and can be used for EOR applications inhostile environments. Kulicke et al. (1990) conducted a detailinvestigation about various Xanthan samples in term of viscosity,molecular weight, flow behavior, NMR and enzymatic analysis. Theyfound that the various Xanthan solutions differ from one anotherwith respect to their viscosity and injectability. In another work,Kleinitz et al. (1989) conducted a screening study of eight commer-cially available Xanthan solutions for a reservoir with a salinity of220,000 ppm and they found that only four Xanthan solutionspassed the injectivity test under saline conditions.
The two main concerns associated with polymer floodingapplications are the effects of salinity and temperature of forma-tion's water on the stability of polymer solutions and hence oilrecovery factor. Stability of polymer solutions in high salinity andhigh temperature reservoirs is challenged; therefore, implement-ing polymer flood requires critical evaluations (Levitt et al., 2013).The recent advancements in polymer flood technology indicatethat new families of polymers can sustain harsh environment,however, they are still in the development phase and no knownfield application have been documented.
Despite the lab experiments mentioned previously, investiga-tions are still needed to improve the performance of polymer
flooding in high salinity reservoirs. In the Middle East, many oilreservoirs are characterized with high salinity of 200,000 ppm andmore. Thus, improving the performance of polymer flooding underhigh water salinity conditions may unlock these resources andhence dramatically increase oil reserves. One possible way toimprove polymer flooding performance is to condition the reser-voir by injecting a slug of water (preflush), with specific char-acteristics, ahead of polymer. In this work, a series of labexperiments were conducted to investigate the effects of severaldesign parameters on the performance of preflush-polymer-waterflood under high salinity conditions. The investigated parametersinclude polymer concentration, polymer slug size, preflush sali-nity, and preflush slug size. The objective of the work is to evaluatethe functional relationships between these parameters and oilrecovery factor.
2. Methodology
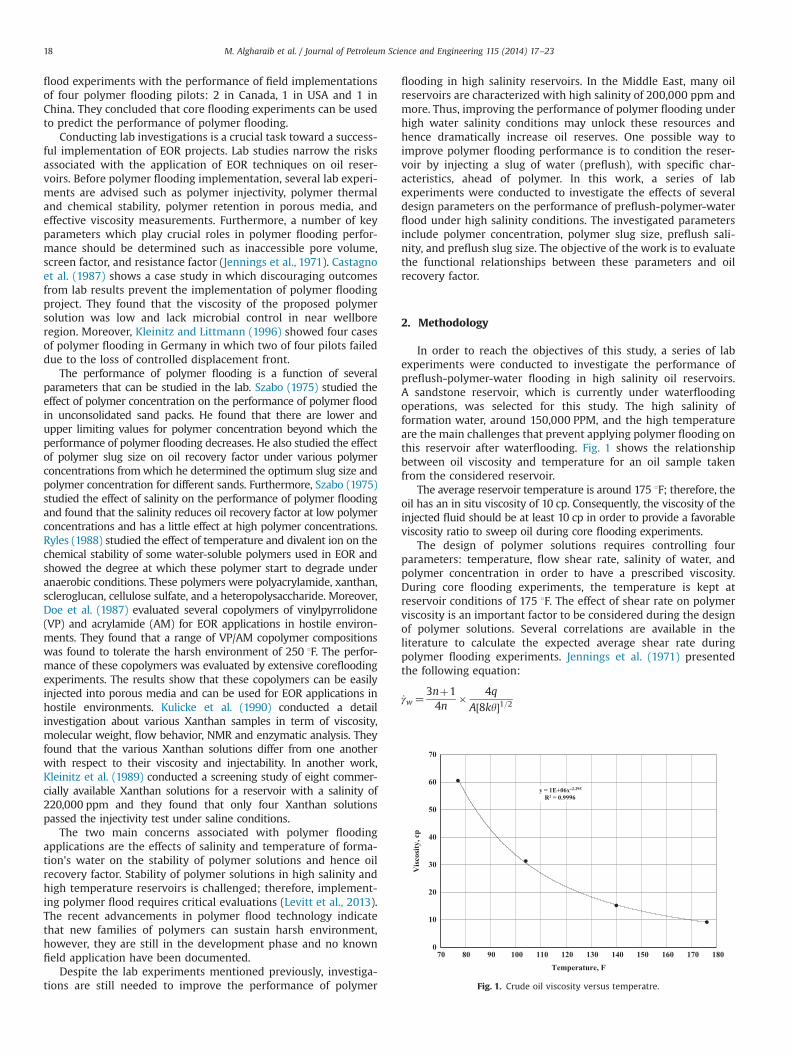
In order to reach the objectives of this study, a series of labexperiments were conducted to investigate the performance ofpreflush-polymer-water flooding in high salinity oil reservoirs.A sandstone reservoir, which is currently under waterfloodingoperations, was selected for this study. The high salinity offormation water, around 150,000 PPM, and the high temperatureare the main challenges that prevent applying polymer flooding onthis reservoir after waterflooding. Fig. 1 shows the relationshipbetween oil viscosity and temperature for an oil sample takenfrom the considered reservoir.
The average reservoir temperature is around 175 1F; therefore, theoil has an in situ viscosity of 10 cp. Consequently, the viscosity of theinjected fluid should be at least 10 cp in order to provide a favorableviscosity ratio to sweep oil during core flooding experiments.
The design of polymer solutions requires controlling fourparameters: temperature, flow shear rate, salinity of water, andpolymer concentration in order to have a prescribed viscosity.During core flooding experiments, the temperature is kept atreservoir conditions of 175 1F. The effect of shear rate on polymerviscosity is an important factor to be considered during the designof polymer solutions. Several correlations are available in theliterature to calculate the expected average shear rate duringpolymer flooding experiments. Jennings et al. (1971) presentedthe following equation:
_γw ¼ 3nþ14n
� 4qA½8ky�1=2
0
10
20
30
40
50
60
70
70 80 90 100 110 120 130 140 150 160 170 180
Vis
cosi
ty, c
p
Temperature, F
Fig. 1. Crude oil viscosity versus temperatre.
M. Algharaib et al. / Journal of Petroleum Science and Engineering 115 (2014) 17–2318

where _γw is shear rate, s�1; q is polymer flow rate, cc/min; A iscross sectional area of core sample, cm2; k is permeability, Darcy;θ is porosity, fraction; 3nþ1=4n is Rabinowitsch correction factor.
For polyacrylamides in strong brine, the Rabinowitsch correc-tion factor can be omitted without series loss of accuracy (Jenningset al., 1971). The expected range of shear rate, as a function ofpermeability, is calculated and shown in Fig. 2 for a flow rate of0.3 cc/min in a 1.5 in. diameter core with an average porosityof 20%.
The reservoir under consideration has an average permeabilityof 400 md; therefore, the expected shear rate of the flow is around20 s�1 as shown in Fig. 2.
Water salinity is the third parameter to be controlled duringthe design of polymer solutions. The charges in saline water tendto degrade the viscosity of polymer solutions. In this work, seawater is considered as the economical source to make up polymersolutions. Therefore, the polymer solutions were prepared with asalinity of approximately 30,000 PPM.
Polymer concentration is the design parameter that is used tocontrol the viscosity of the polymer solution after fixing the otherthree parameters. Three polymer solutions were prepared withdifferent polymer concentrations of 2000, 3000, and 4000 PPM. Theviscosities of the three solutions were tested at 175 1F, shear rate of20 s�1 and salinity of 30,000 PPM. The proper polymer solutionshould have a viscosity of 10 cp and more at these prescribedconditions. The procedure to prepare the polymer solutions fol-lowed the recommended practices for evaluation of polymers usedin enhanced oil recovery operations which is published by AmericanPetroleum Institute (API, 1990). Fig. 3 shows the relationshipbetween polymer viscosity and shear rate for the three solutions.
Fig. 3 shows that polymer solutions with concentrations of3000 and 4000 PPM provide a viscosity of 10 cp and higher atshear rate of 20 s�1. Therefore, the concentration of polymer isselected as 3000 and 4000 PPM for the solutions to be used in thecore flooding experiments.
A series of core flooding experiments were conducted in orderto investigate the effects of polymer concentration, polymer slugsize, preflush salinity, and preflush slug size on the performance ofpreflush-polymer-water flood under high salinity conditions. Theexperiments start with injection of preflush slug followed bypolymer solution and then drive water. Table 1 shows thecharacteristics of preflush slug, polymer solution slug, and drivewater for each experiment.
Experiment # 1 was conducted as regular water flooding forcomparison purposes. Experiment # 2 was conducted in a con-tinuous polymer flooding mode. Experiment # 3 is considered asthe base case. In experiments 4–12, the investigated parameterswere changed and their effects on oil recovery were observed.
3. Results and discussion
The results of the conducted experiments indicate that theinvestigated parameters have various degrees of influence on oilrecovery factor. The following sections illustrate the outcomesfrom the experimental work.
0
10
20
30
40
50
60
70
80
90
100
0 0.1 0.2 0.3 0.4 0.5 0.6 0.7 0.8 0.9 1
SR (1
/s)
Permeability, Darcy
Expected Range ofReservoir Permeability
Fig. 2. Shear rate versus flow rate for different permeabilities.
1
10
100
1000
1 10 100 1000
Visc
osity
, cp
Shear Rate, Sec-1
Polymer Concentration = 2000 PPM
Polymer Concentration = 3000 PPM
Polymer Concentration = 4000 PPM
Fig. 3. Viscosity versus shear rate for polymer solutions.
Table 1Conducted core flood experiments.
Experiment # Preflush characteristics Polymer slug characteristics Drive water characteristics
Salinity Slug size Viscosity Salinity Slug size Concentration Salinity(PPM) (PV) (cp) (PPM) (PV) (PPM) (PPM)
1 N/A N/A N/A N/A N/A N/A 30,0002 N/A N/A N/A 30,000 N/A 4000 N/A3 (B.C.) 30,000 0.05 1 30,000 0.2 4000 50,0004 30,000 0.05 1 30,000 0.2 3000 50,0005 30,000 0.05 1 30,000 0.2 2000 50,0006 30,000 0.05 1 30,000 0.1 4000 50,0007 30,000 0.05 1 30,000 0.3 4000 50,0008 5000 0.05 1 30,000 0.2 4000 50,0009 100,000 0.05 1 30,000 0.2 4000 50,00010 30,000 0.1 1 30,000 0.2 4000 50,00011 30,000 0.25 1 30,000 0.2 4000 50,00012 30,000 0.3 1 30,000 0.2 4000 50,000
M. Algharaib et al. / Journal of Petroleum Science and Engineering 115 (2014) 17–23 19

3.1. Effect of high salinity on polymer flooding performance
The first two experiments, Experiment # 1 and Experiment # 2,were conducted for illustration purposes to highlight the effect of highsalinity formation water on the performance of polymer flooding. It isbelieved that the high saline water chemically degrade the viscosity ofpolymer solution. In both experiments, the core was initially saturatedwith 150,000 PPM saline water. In Experiment # 1, the core samplewas flooded with 3 pore volumes of 30,000 PPM salinity water then 3pore volumes of polymer solution with a concentration of 4000 PPMand salinity 30,000 PPM. Next, the core was flooded with 30,000 PPMsalinity drive water. In Experiment # 2, however, the core was flooded,initially, with polymer solution of 4000 PPM concentration and30,000 PPM salinity. In both experiments, the polymer flood wasstopped when no more oil recovery is observed. Fig. 4 shows thepressure drop along the core sample versus pore volume injected forExperiment # 1 and Experiment # 2.
In Experiment #1, the pressure drop during the water floodingwas �25 psia which increased to �525 psia during the polymerflooding. The pressure then decreased to �320 psia during thefinal water flooding. The final pressure drop in Experiment #2 stabilized at �450 psia. Fig. 5 shows the oil recovery factor, interms of hydrocarbon pore volume HCPV, versus pore volumeinjected for Experiments #1 and 2.
The figure shows that oil recovery after water flooding, inExperiment # 1, was �70% which increased to 83% after polymerflooding. This is corresponds to an increase of 18.6% in oil recoveryfactor. The oil recovery factor after polymer flooding for Experi-ment # 2 was �70%. In experiment #1, the core was conditioned
to receive the polymer slug after reducing in situ water salinityfrom 150,000 PPM to 30,000 PPM; while in Experiment # 2; thepolymer slug was allowed to interact with the high salinity in situwater (150,000 PPM). Therefore, lower oil recovery factor wasobserved in Experiment # 2 due to chemical degradationof polymer slug. These experiments show that the continuouspolymer flooding performs similar to the regular water floodingdue to chemical degradation of polymer slug in high salinityenvironments. In the subsequent experiments, the interactionbetween the polymer slug and the high salinity formation waterwas minimized by injecting a preflush slug prior to polymersolution.
3.2. Improving recovery by preflush injection
In Experiment # 3, a preflush slug was introduced to the coresample before the injection of polymer solution. The purpose ofExperiment # 3 is to show the effect of minimizing the interactionbetween polymer slug and formation water on oil recovery factor.In Experiment # 3, a preflush slug of 0.05 PV was injected followedby 0.2 PV of polymer solution and then these slugs were driven by30,000 PPM salinity water. A comparison of oil recovery factorversus pore volume injected for Experiments # 1, 2, and 3 is shownin Fig. 6. The figure shows that the introduction of preflush slugincreases the ultimate oil recovery factor to 86% compared to 70%for Experiment # 2 (continues polymer flooding mode). The figureshows that the introduction of preflush slug prior to polymerinjection saves the characteristics of polymer slug and henceimproved oil recovery factor. Although more polymer was injectedin Experiment # 2 compared to Experiment # 3, oil recovery factorwas higher for Experiment # 3. This is attributed to minimizingthe interaction between polymer slug and high salinity formationwater. Experiment # 3 is considered as the base case where theperformances of the subsequent experiments are compared to.
3.3. The effect of polymer concentration
The effect of polymer concentration, in the polymer slug, on theperformance of preflush-polymer-water flooding mode is investi-gated in this section. Besides the base case, where the polymerconcentration equals 4000 PPM, two additional experiments wereconducted, Experiment # 4 with a polymer concentration of3000 PPM and Experiment # 5 with a polymer concentration of2000 PPM. Fig. 7 shows the oil recovery factor versus pore volumeinjected for Experiments # 1, 3, 4, and 5. The figure shows that theoil recoveries obtained using preflush-polymer-water injectionsequences outperform the regular water flooding for the various
100
200
300
400
500
600
700
Pres
sure
Dro
p, p
sia
Experiment # 2
01086420
Pore Volume Injected (PVI)
Experiment # 1
Fig. 4. Pressure drop versus pore volume injected for Experiments # 1 and 2.
0
0.2
0.4
0.6
0.8
1
0 2 4 6 8 10
Rec
over
y Fa
ctor
, HC
PV
Pore Volume Injected (PVI)
Experiment # 1
Experiment # 2
Fig. 5. Comparison of oil recovery factor versus pore volume injected for Experi-ments # 1 and 2.
0
0.2
0.4
0.6
0.8
1
0 2 4 6 8 10
Rec
over
y Fa
ctor
, HC
PV
Pore Volume Injected (PVI)
Experiment # 1Experiment # 2Experiment # 3
Improvment in RF
Fig. 6. Comparison of oil recovery factor versus pore volume injected for Experi-ments 1, 2, and 3.
M. Algharaib et al. / Journal of Petroleum Science and Engineering 115 (2014) 17–2320
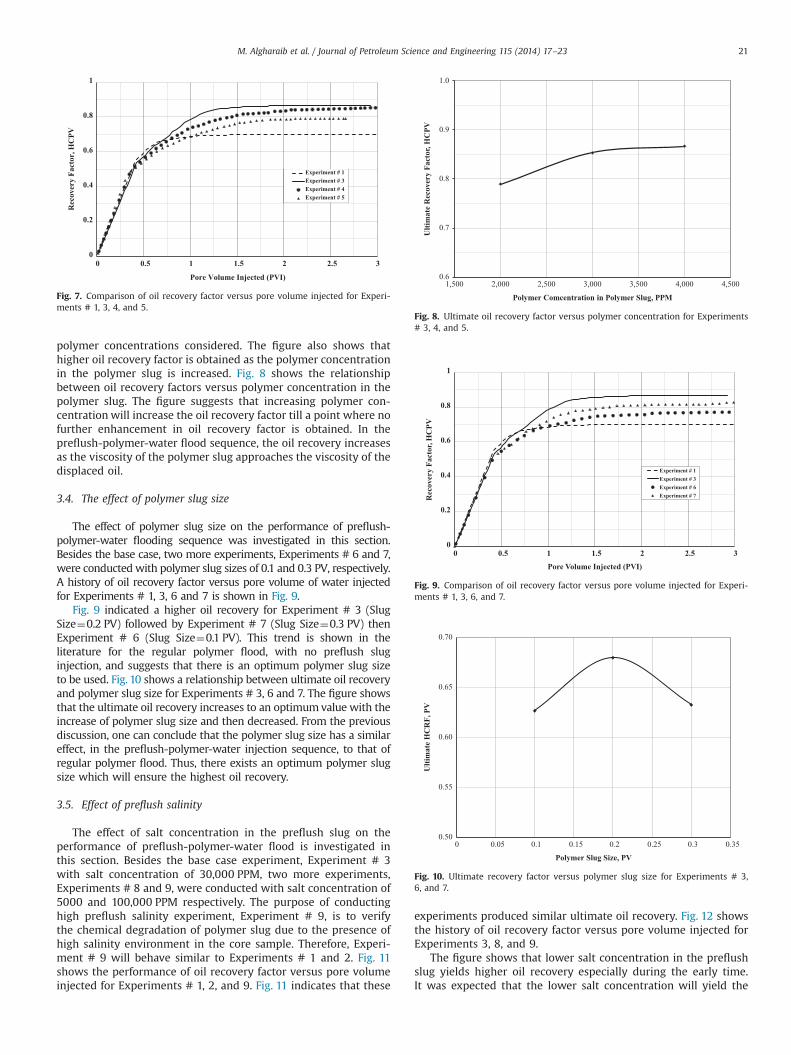
polymer concentrations considered. The figure also shows thathigher oil recovery factor is obtained as the polymer concentrationin the polymer slug is increased. Fig. 8 shows the relationshipbetween oil recovery factors versus polymer concentration in thepolymer slug. The figure suggests that increasing polymer con-centration will increase the oil recovery factor till a point where nofurther enhancement in oil recovery factor is obtained. In thepreflush-polymer-water flood sequence, the oil recovery increasesas the viscosity of the polymer slug approaches the viscosity of thedisplaced oil.
3.4. The effect of polymer slug size
The effect of polymer slug size on the performance of preflush-polymer-water flooding sequence was investigated in this section.Besides the base case, two more experiments, Experiments # 6 and 7,were conductedwith polymer slug sizes of 0.1 and 0.3 PV, respectively.A history of oil recovery factor versus pore volume of water injectedfor Experiments # 1, 3, 6 and 7 is shown in Fig. 9.
Fig. 9 indicated a higher oil recovery for Experiment # 3 (SlugSize¼0.2 PV) followed by Experiment # 7 (Slug Size¼0.3 PV) thenExperiment # 6 (Slug Size¼0.1 PV). This trend is shown in theliterature for the regular polymer flood, with no preflush sluginjection, and suggests that there is an optimum polymer slug sizeto be used. Fig. 10 shows a relationship between ultimate oil recoveryand polymer slug size for Experiments # 3, 6 and 7. The figure showsthat the ultimate oil recovery increases to an optimumvalue with theincrease of polymer slug size and then decreased. From the previousdiscussion, one can conclude that the polymer slug size has a similareffect, in the preflush-polymer-water injection sequence, to that ofregular polymer flood. Thus, there exists an optimum polymer slugsize which will ensure the highest oil recovery.
3.5. Effect of preflush salinity
The effect of salt concentration in the preflush slug on theperformance of preflush-polymer-water flood is investigated inthis section. Besides the base case experiment, Experiment # 3with salt concentration of 30,000 PPM, two more experiments,Experiments # 8 and 9, were conducted with salt concentration of5000 and 100,000 PPM respectively. The purpose of conductinghigh preflush salinity experiment, Experiment # 9, is to verifythe chemical degradation of polymer slug due to the presence ofhigh salinity environment in the core sample. Therefore, Experi-ment # 9 will behave similar to Experiments # 1 and 2. Fig. 11shows the performance of oil recovery factor versus pore volumeinjected for Experiments # 1, 2, and 9. Fig. 11 indicates that these
experiments produced similar ultimate oil recovery. Fig. 12 showsthe history of oil recovery factor versus pore volume injected forExperiments 3, 8, and 9.
The figure shows that lower salt concentration in the preflushslug yields higher oil recovery especially during the early time.It was expected that the lower salt concentration will yield the
0
0.2
0.4
0.6
0.8
1
0 0.5 1 1.5 2 2.5 3
Rec
over
y Fa
ctor
, HC
PV
Pore Volume Injected (PVI)
Experiment # 1Experiment # 3Experiment # 4Experiment # 5
Fig. 7. Comparison of oil recovery factor versus pore volume injected for Experi-ments # 1, 3, 4, and 5.
0.6
0.7
0.8
0.9
1.0
1,500 2,000 2,500 3,000 3,500 4,000 4,500
Ulti
mat
e R
ecov
ery
Fact
or, H
CPV
Polymer Comcentration in Polymer Slug, PPM
Fig. 8. Ultimate oil recovery factor versus polymer concentration for Experiments# 3, 4, and 5.
0
0.2
0.4
0.6
0.8
1
0 0.5 1 1.5 2 2.5 3
Rec
over
y Fa
ctor
, HC
PV
Pore Volume Injected (PVI)
Experiment # 1Experiment # 3Experiment # 6Experiment # 7
Fig. 9. Comparison of oil recovery factor versus pore volume injected for Experi-ments # 1, 3, 6, and 7.
0.50
0.55
0.60
0.65
0.70
0 0.05 0.1 0.15 0.2 0.25 0.3 0.35
Ulti
mat
e H
CR
F, P
V
Polymer Slug Size, PV
Fig. 10. Ultimate recovery factor versus polymer slug size for Experiments # 3,6, and 7.
M. Algharaib et al. / Journal of Petroleum Science and Engineering 115 (2014) 17–23 21

higher ultimate oil recovery (Experiment # 8); however, the figuresuggests that there is an optimum salt concentration needed in thepreflush slug to have the highest oil recovery factor. This might beattributed to the presence of a high difference, gradient, betweenthe injected salt concentration in the preflush slug and saltconcentration of the polymer slug. Fig. 13 shows a relationshipbetween salinity gradient (between preflush slug and polymerslug) versus oil recovery factor.
The figure suggests that the oil recovery factor decreased asthe salinity gradient is increased. Therefore, the maximum oilrecovery factor was obtained when the salinity difference waszero (Experiment # 3), i.e. when the preflush salinity andpolymer solution salinity were equal. The difference in salinitiestriggers salt movement into and from polymer solution which inturn affect the stability of polymer slug. Therefore, one canconclude that it is recommended to precondition oil reservoirswith a preflush slug that has similar water salinity to the polymersolution. Extended investigations of the results from theseexperiments show that lower preflush salinity was advantageousduring the early time only. Fig. 14 shows a relationship betweenoil recovery factor at breakthrough and preflush salinity. Thefigure shows that higher oil recovery factor was obtained atwater breakthrough for lower preflush salinity. In light of theprevious discussion, one can conclude that lower preflush sali-nity results in higher oil recovery at breakthrough; while lowersalinity gradient results in higher ultimate oil recovery. In all,preflush salinity shows a pronounced effect on oil recovery factorduring preflush-polymer-water flood.
3.6. The effect of preflush slug size
The effect of preflush slug size is investigated in this section.In addition to Experiment # 3, three additional experiments wereconducted with different preflush slug size, namely Experiments #10, 11, and 12 with preflush slug size of 0.1, 0.25 and 0.3 PV. Fig. 15shows a history of oil recovery factors for Experiments 3, 10, 11,and 12. Fig. 15 shows that Experiment # 3 and 10 outperformExperiments 11, and 12. The figure shows that lower preflush slugsize yielded the highest ultimate oil recovery factor. Moreover,Fig. 16 shows the relationships between the oil recovery factors(Ultimate and at Breakthrough) versus preflush slug size. Lowerrecovery factors at breakthrough were observed for larger preflushsizes and vice versa. Additionally, Fig. 16 suggests that higheradditional oil recovery was obtained after breakthrough forexperiments with small preflush slug sizes. In light of the previousdiscussion, one can conclude that utilizing smaller preflush slugsize enhances the performance of preflush-polymer-water flood.For larger size of preflush slug, less viscous, compared to in situ oil,is introduced to the core. Therefore, fuscous fingering is becomingmore pronounced and less oil recovery is observed.
4. Summary and conclusions
Huge quantities of oil can be produced after primary drivemechanisms in mature oil reservoirs. Chemical EOR is an attractiveoption to unlock these quantities and increase oil recovery factor.
0
0.2
0.4
0.6
0.8
1
0 0.5 1 1.5 2 2.5 3
Rec
over
y Fa
ctor
, HC
PV
Pore Volume Injected (PVI)
Experiment # 1Experiment # 2Experiment # 9
Fig. 11. Ultimate recovery factor versus polymer slug size for Experiments # 1,2, and 9.
0
0.2
0.4
0.6
0.8
1
0 0.5 1 1.5 2 2.5 3
Rec
over
y Fa
ctor
, HC
PV
Pore Volume Injected (PVI)
Experiment # 3
Experiment # 8
Experiment # 9
Fig. 12. Oil recovery factor versus pore volume injected for Experiments # 3, 8, and 9.
0
0.2
0.4
0.6
0.8
1
0 10000 20000 30000 40000 50000 60000 70000 80000
Oil
Rec
over
y Fa
ctor
, PV
Salinity, Gradient PPM
Fig. 13. Oil recovery factor versus salinity gradient for Experiments # 3, 8, and 9.
y = -7E-07x + 0.5589R² = 0.9956
0
0.2
0.4
0.6
0.8
1
0 20000 40000 60000 80000 100000 120000
Oil
Rec
over
y Fa
ctor
@ B
reak
thro
ugh,
PV
Preflush Salinity, PPM
Oil Recovery Factor at Breakthrogh
Linear (Oil Recovery Factor at Breakthrogh)
Fig. 14. Oil recovery factor at breakthrogh versus preflush salinity for Experiments# 3, 8, and 9.
M. Algharaib et al. / Journal of Petroleum Science and Engineering 115 (2014) 17–2322

The main challenge in these reservoirs is high formation salinity.Polymer flooding can overcome the challenge by preconditioningoil reservoirs. This work investigated the performance of preflush-polymer-water flood in high salinity oil reservoirs. The resultsindicate that preflush and polymer characteristics have a greatinfluence on the oil recovery factor. In light of the conductedexperimental work, the following conclusions can be stated:
(1) High salinity formation water has a great effect on the perfor-mance of polymer flooding due to chemical degradation effect.
(2) Polymer flooding produces similar oil recovery factors toregular water flood in high salinity reservoirs.
(3) Utilizing preflush slug, with low salinity, might enhance theperformance of chemical EOR processes in high salinity oilreservoirs.
(4) In preflush-polymer-water flood processes, polymer concen-tration in the polymer affects the ultimate oil recovery. Highpolymer concentration yields higher oil recovery.
(5) In preflush-polymer-water flood, the effect of the size ofpolymer slug shows a trend similar to that of processeswithout preflush slugs.
(6) The difference in salinities between preflush slug and inpolymer slug should be maintained at a minimum to ensurehigher oil recovery.
(7) The size of preflush slug shows an inverse effect on oilrecovery. Thus minimum preflush slug sizes produced higheroil recovery.
(8) Preflush-polymer-water flood process outperformed regularwater flood performance by as much as 18%.
Acknowledgment
This work was supported by Kuwait University, Research Grantno. [EP02/07].
References
API, 1990. API Recommended Practice 63 (RP63). Recommended Practices forEvaluation of Polymers Used in Enhanced Oil Recovery Operations.
Castagno, R.E., Shupe, R.D., Gregory, M.D., Lescarboura, J.A., 1987. Method forlaboratory and field evaluation of a proposed polymer flood. J. SPE Reserv. Eng.2 (4), 452–460.
Chang, H.L., Zhang, Z.Q., Wang, Q.M., Xu, Z.S., Gue, Z.D., Sun, H.Q., Cao, X.L., Qiao, Q.,2006. Advances in polymer flooding and alkaline/surfactant/polymer processesas developed and applied in the People's Republic of China. J. Pet. Technol. 58(2), 84–89.
Da Silva, I.P., De Melo, M.A., Luvizotto, J.M., 2007. Polymer flooding: a sustainableenhanced oil recovery in the current scenario, Paper SPE 107727 presented atthe 2007 SPE Latin American Caribbean Petroleum Engineering Conference.Buenos Aires, Argentina, 15–18 April, 2007.
Doe, P.H., Moradi-Araghi, A., Shaw, J.E., Stahl, G.A., 1987. Development and evaluationof EOR polymers suitable for hostile environments – Part 1: copolymers ofvinylpyrrolidone and acrylamide. J. SPE Reserv. Eng. 2 (4), 461–467.
Fulin, Y., Demin, W., Gang, W., Xinguang, S., Weijie, L., Chunling K., 2006. Study onhigh-concentration polymer flooding to further enhance oil recovery, Paper SPE101202 presented at the 2006 SPE Annual Technical Conference and Exhibition.San Antonio, Texas, 24–27 September, 2006.
Kleinitz, W. Littmann, W., 1996. Polymer Flooding: Appraisal of Four Different FieldProjects in Germany. Sonderdruck aus Forschung, Planung, und Betrieb 21,pp. S97–S104.
Kleinitz, W., Littmann, W., Herbst, H., 1989. Screening of xanthan-biopolymer for ahigh salinity oil reservoir, Paper presented at the 5th European Symposium onImproved Oil Recovery. Budapest, Hungary, 25–27 April 1989.
Kulicke, W.M., Oertel, R., Otto, M., Kleinitz, W., Littmann, W., 1990. Characterizationof xanthan solutions for application in EOR. Erdöl Kohle Erdgas-Petrochem. 43(12), 471–476.
Jennings, R.R., Rogers, J.H., West, T.j, 1971. Factors influencing mobility control bypolymer solutions. J. Pet. Technol. 23 (3), 391–401.
Levitt, D., Klimenko, A., Jouenne, S., Chamerois, M., Bourrel, M., 2013. Overcomingdesign challenges of chemical EOR in high-temperature, high salinity carbo-nates. Paper SPE 164241 presented at the SPE Middle East Oil and Gas Showand Conference. Manama, Bahrain, 10–13 March 2013.
Littmann, W., Kleinitz, W., Kleppe, G., Lund, T., 1991. A commercial scale xanthanpolymer flood project in a high salinity, low viscosity oil reservoir in NorthGermany, Paper presented at the Sixth European Symposium on Improved OilRecovery. Stavanger, Norway, 21–23 May 1991.
Liu, B., Sun, X., Wang, K., Xu, H., Liu, Q., Liu, X., Song, S.,2007. Flooding by highconcentration polymer doubled oil recovery of common polymer on field testwith 20% closed to the result of lab test in Daqing, Paper SPE 108684 presentedat the 2007 International Oil Conference and Exhibition. Veracruz, Mexico,27–30 June 2007.
Ryles, R.G., 1988. Chemical stability limits of water-soluble polymers used in oilrecovery processes. J. SPE Reserv. Eng. 3 (1), 23–34.
Seright, R.S., 2010. Potential for polymer flooding reservoirs with viscous oils. SPEReserv. Eval. Eng. 13 (4), 730–740.
Sorbie, K.S., 1991. Polymer – Improved Oil Recovery. CRC Press Inc., Boca Raton,Florida, USA.
Szabo, M.T., 1975. Laboratory investigations of factors influencing polymer flood.Soc. Pet. Eng. J. 15 (4), 238–346.
Thakuria, C., Amri, M., Saqri, K., Jaspers, H., Hashmi, K., Zuhaimi, K., 2013.Performance review of polymer flooding in a major brown oil field of Sultanateof Oman, Paper SPE 165262 presented at the SPE Enhanced Oil RecoveryConference. Kuala Lumpur, Malaysia, 2–4 July 2013.
Tielong, C., Zhengyu, S., Fan, Y., Changzhong, H., Ling, Q., Jinxing, T., 1998. A Pilottest of polymer flooding in an elevated-temperature reservoir. J. SPE Reserv.Eval. Eng. 1 (1), 24–29.
Wyatt, K., Pitts, M.J., Surkalo, H., 2004. Field chemical flood performance compar-ison with laboratory displacement in reservoir core, Paper SPE 89385 presentedat the 2004 SPE/DOE Fourteenth Symposium on Improved Oil Recovery. Tulsa,Oklahoma, 17–21 April 2004.
0
0.2
0.4
0.6
0.8
1
0 0.5 1 1.5 2 2.5 3
Rec
over
y Fa
ctor
, HC
PV
Pore Volume Injected (PVI)
Experiment # 3
Experiment # 10
Experiment # 11
Experiment # 12
Fig. 15. Oil recovery factor versus pore volume injected for Experiments # 3, 10, 11,and 12.
0
0.2
0.4
0.6
0.8
1
0 0.1 0.2 0.3 0.4 0.5
Oil
Rec
over
y Fa
ctor
, PV
Preflush Slug Size, PV
Recovery Factor at Breakthrough
Ultimate Oil Revovery Factor
Fig. 16. Oil recovery factor (Ultimate and at Breakthrough) versus preflush slug sizefor Experiments # 3, 10, 11, and 12.
M. Algharaib et al. / Journal of Petroleum Science and Engineering 115 (2014) 17–23 23


![Synthesis and Performance Evaluation of High-Temperature ... · Jin 45 block reservoirs of the North China Oilfield have medium high-temperature and salinity reservoirs [5]. The Qinghai](https://img.pdfslide.net/doc/110x75/6069f8dded89af4e6d72ad93/synthesis-and-performance-evaluation-of-high-temperature-jin-45-block-reservoirs.jpg)