Embed Size (px)
Citation preview
1
Abstract Nr. 011-0621
Improving SMED in the Automotive Industry: A case study
Ana Sofia Alves, [email protected]
Faculdade de Ciências e Tecnologia da Universidade Nova de Lisboa
Campus Universitário, 2829-516 Caparica, Portugal
Alexandra Tenera*, [email protected]
* UNIDEMI, Department of Mechanical and Industrial Engineering
Faculdade de Ciências e Tecnologia da Universidade Nova de Lisboa
Campus Universitário, 2829-516 Caparica, Portugal
Phone: + 351212948542
POMS 20th Annual conference
Orlando, Florida U.S.A
May 1 to May 4, 2009
2
Improving SMED in the Automotive Industry: A case study
Abstract
The Single Minute Exchange of Die (SMED) is one important lean tool to reduce waste and
improve flexibility in manufacturing processes allowing lot size reduction and manufacturing
flow improvements. SMED reduces the non-productive time by streamlining and standardizing
the operations for exchange tools, using simple techniques and easy applications. However the
process doesn’t give the specific actions to implement which can result in overlooking
improvements. To overcome this, common statistical and industrial engineering tools can be
integrated in the SMED approach to improve SMED implementation results. The applicability of
the proposed SMED approach was tested for injection machines changeovers in the automotive
industry. The implementation has enabled reduction in setup time, through company's internal
resources reorganizations without the need for significant investment.
Keywords
Lean manufacturing systems, Lean tools, Single Minute Exchange of Die, Quick ChangeOver
3
1. Introduction
Globalization has created the need to produce small lots, causing a significant increase in the
frequency of setups, causing the reduction of times production for each lot. For this reason it’s
important that changeovers are quick, so that the flexibility of respond to demand is not affected
(Mcintosh et al, 2007). Time spent in the setups is considered waste, because they are tasks that
do not add value, causing increases in costs associated with the product and time spent that could
be used in activities that add value. The need of shorter setups isn’t new; the time spent between
in the production of the last product of a series and producing the first product of the new series,
has always been considered as waste or added cost (Goubergen and Landeghem, 2002). These
authors categorize the different reasons for short setup times into three main groups:
• Flexibility: Because of the large number of existing products and the decrease in
quantity, the companies must be able to react quickly to customer needs. So if you need
to produce in small batches, it is essential that these tools make the exchange as soon as
possible.
• Bottleneck capacities: especially in these machines, every minute lost is wasted. The
tools of trade must be minimized, providing an increase in capacity for production.
• Cost minimization: the production costs are directly related to the performance of
equipment.
Several authors have been proposed different approaches to reduce the time spent in the
exchange of tools: Mondem (1983) proposed a model that supports the mechanization as a major
strategy for reducing the time of setup. Fogliatto, Fagundes (2003) study several proposed
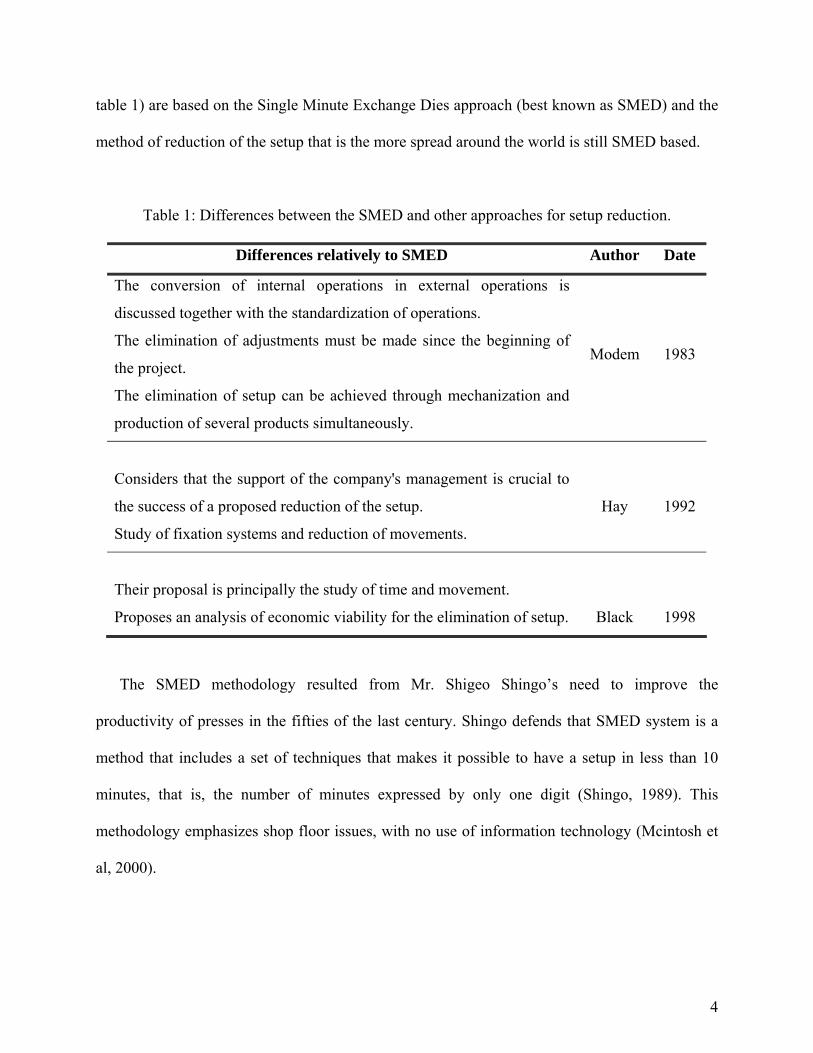
approaches indicating that although some little differences exists all methods proposed (see
4
table 1) are based on the Single Minute Exchange Dies approach (best known as SMED) and the
method of reduction of the setup that is the more spread around the world is still SMED based.
Table 1: Differences between the SMED and other approaches for setup reduction.
Differences relatively to SMED Author Date
The conversion of internal operations in external operations is
discussed together with the standardization of operations.
The elimination of adjustments must be made since the beginning of
the project. Modem 1983
The elimination of setup can be achieved through mechanization and
production of several products simultaneously.
Considers that the support of the company's management is crucial to
the success of a proposed reduction of the setup.
Hay
1992
Study of fixation systems and reduction of movements.
Their proposal is principally the study of time and movement.
Proposes an analysis of economic viability for the elimination of setup. Black 1998
The SMED methodology resulted from Mr. Shigeo Shingo’s need to improve the
productivity of presses in the fifties of the last century. Shingo defends that SMED system is a
method that includes a set of techniques that makes it possible to have a setup in less than 10
minutes, that is, the number of minutes expressed by only one digit (Shingo, 1989). This
methodology emphasizes shop floor issues, with no use of information technology (Mcintosh et
al, 2000).
5
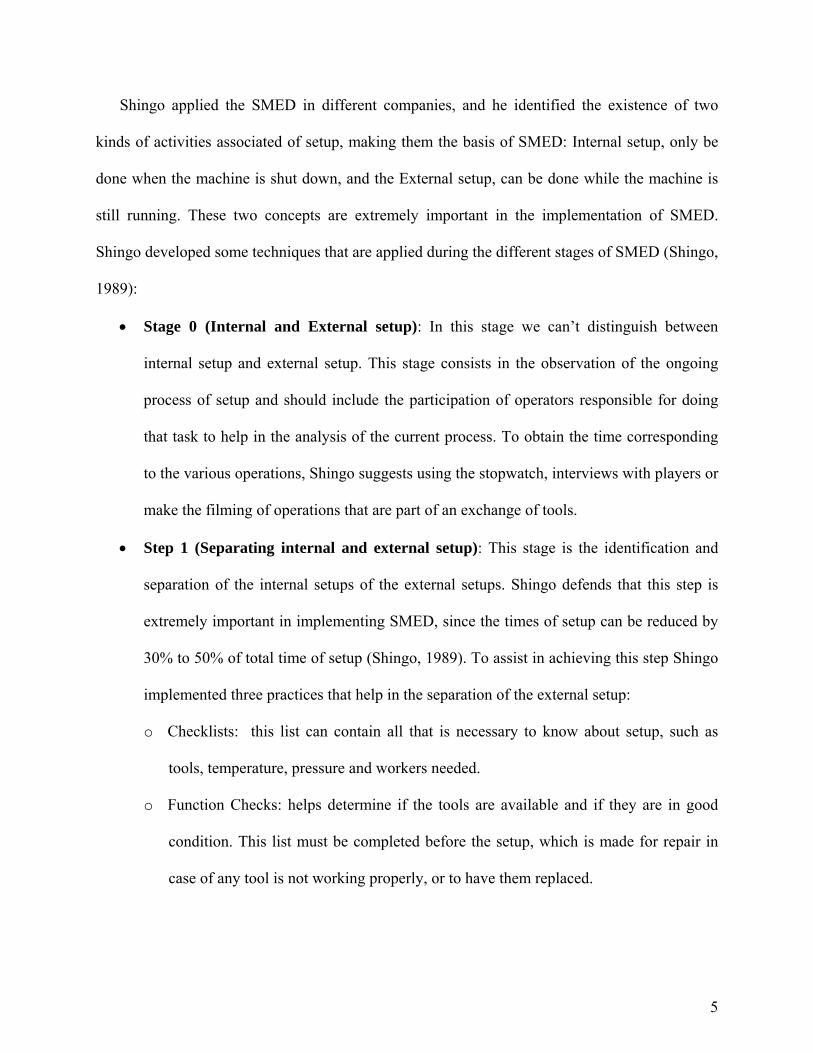
Shingo applied the SMED in different companies, and he identified the existence of two
kinds of activities associated of setup, making them the basis of SMED: Internal setup, only be
done when the machine is shut down, and the External setup, can be done while the machine is
still running. These two concepts are extremely important in the implementation of SMED.
Shingo developed some techniques that are applied during the different stages of SMED (Shingo,
1989):
• Stage 0 (Internal and External setup): In this stage we can’t distinguish between
internal setup and external setup. This stage consists in the observation of the ongoing
process of setup and should include the participation of operators responsible for doing
that task to help in the analysis of the current process. To obtain the time corresponding
to the various operations, Shingo suggests using the stopwatch, interviews with players or
make the filming of operations that are part of an exchange of tools.
• Step 1 (Separating internal and external setup): This stage is the identification and
separation of the internal setups of the external setups. Shingo defends that this step is
extremely important in implementing SMED, since the times of setup can be reduced by
30% to 50% of total time of setup (Shingo, 1989). To assist in achieving this step Shingo
implemented three practices that help in the separation of the external setup:
o Checklists: this list can contain all that is necessary to know about setup, such as
tools, temperature, pressure and workers needed.
o Function Checks: helps determine if the tools are available and if they are in good
condition. This list must be completed before the setup, which is made for repair in
case of any tool is not working properly, or to have them replaced.
6
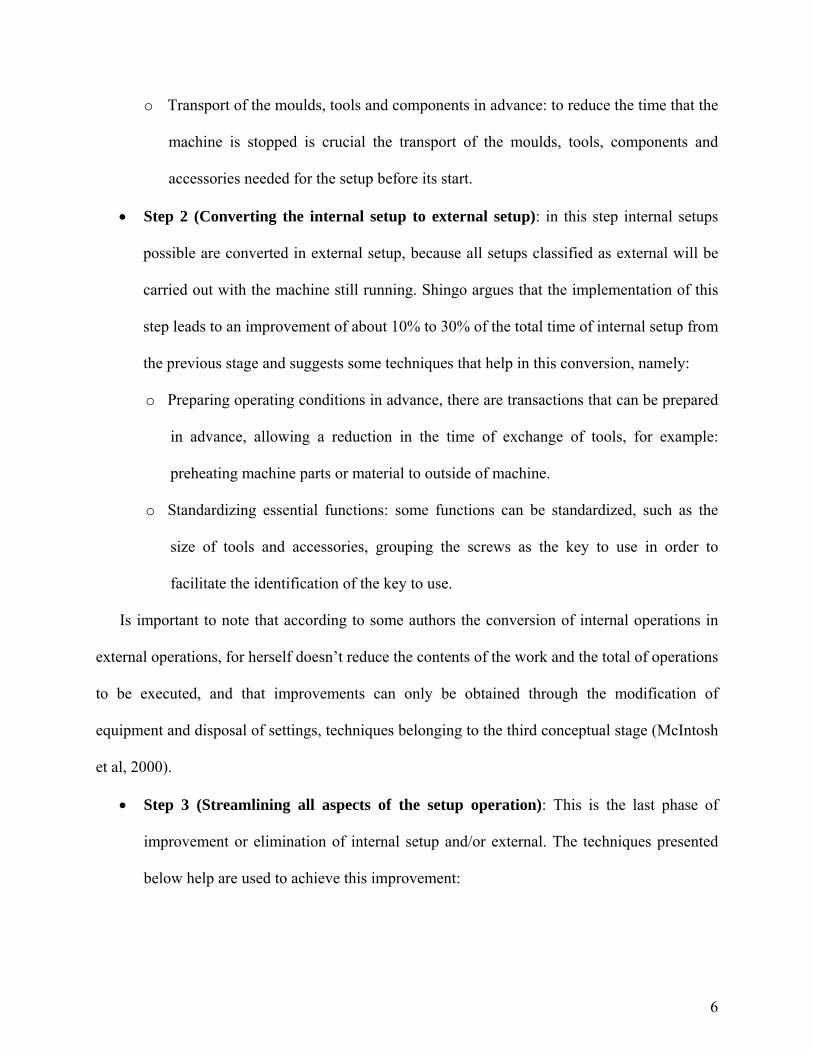
o Transport of the moulds, tools and components in advance: to reduce the time that the
machine is stopped is crucial the transport of the moulds, tools, components and
accessories needed for the setup before its start.
• Step 2 (Converting the internal setup to external setup): in this step internal setups
possible are converted in external setup, because all setups classified as external will be
carried out with the machine still running. Shingo argues that the implementation of this
step leads to an improvement of about 10% to 30% of the total time of internal setup from
the previous stage and suggests some techniques that help in this conversion, namely:
o Preparing operating conditions in advance, there are transactions that can be prepared
in advance, allowing a reduction in the time of exchange of tools, for example:
preheating machine parts or material to outside of machine.
o Standardizing essential functions: some functions can be standardized, such as the
size of tools and accessories, grouping the screws as the key to use in order to
facilitate the identification of the key to use.
Is important to note that according to some authors the conversion of internal operations in
external operations, for herself doesn’t reduce the contents of the work and the total of operations
to be executed, and that improvements can only be obtained through the modification of
equipment and disposal of settings, techniques belonging to the third conceptual stage (McIntosh
et al, 2000).
• Step 3 (Streamlining all aspects of the setup operation): This is the last phase of
improvement or elimination of internal setup and/or external. The techniques presented
below help are used to achieve this improvement:
7
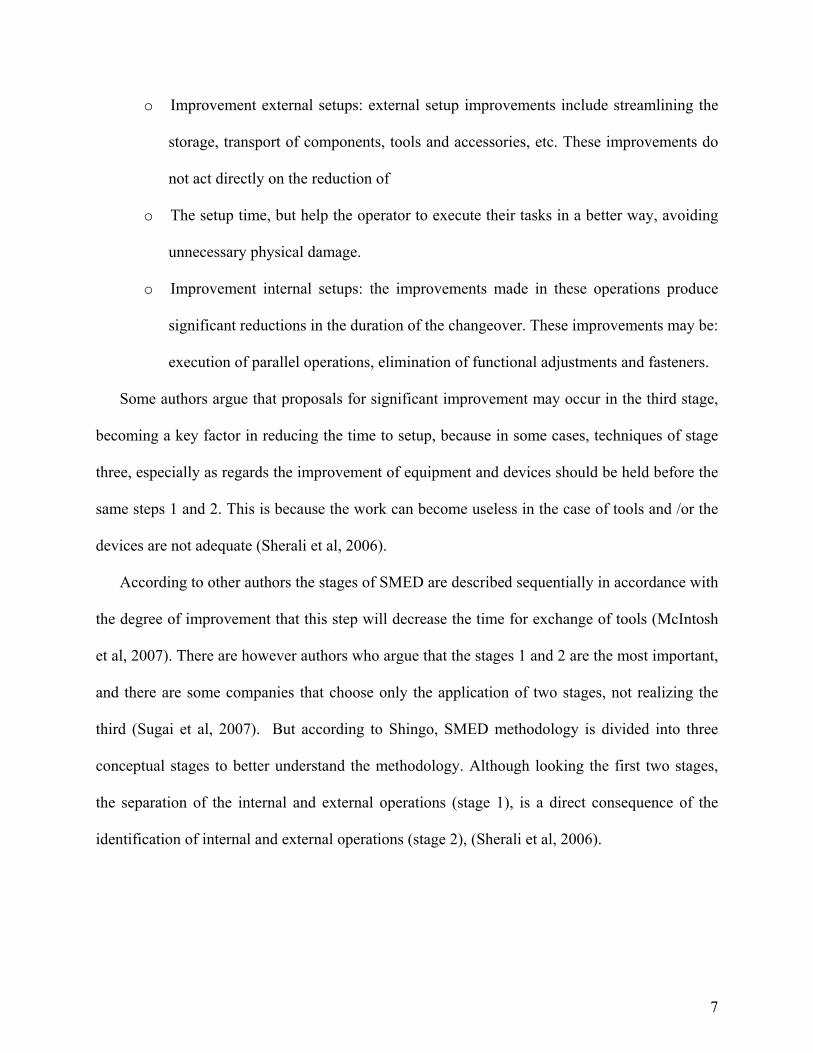
o Improvement external setups: external setup improvements include streamlining the
storage, transport of components, tools and accessories, etc. These improvements do
not act directly on the reduction of
o The setup time, but help the operator to execute their tasks in a better way, avoiding
unnecessary physical damage.
o Improvement internal setups: the improvements made in these operations produce
significant reductions in the duration of the changeover. These improvements may be:
execution of parallel operations, elimination of functional adjustments and fasteners.
Some authors argue that proposals for significant improvement may occur in the third stage,
becoming a key factor in reducing the time to setup, because in some cases, techniques of stage
three, especially as regards the improvement of equipment and devices should be held before the
same steps 1 and 2. This is because the work can become useless in the case of tools and /or the
devices are not adequate (Sherali et al, 2006).
According to other authors the stages of SMED are described sequentially in accordance with
the degree of improvement that this step will decrease the time for exchange of tools (McIntosh
et al, 2007). There are however authors who argue that the stages 1 and 2 are the most important,
and there are some companies that choose only the application of two stages, not realizing the
third (Sugai et al, 2007). But according to Shingo, SMED methodology is divided into three
conceptual stages to better understand the methodology. Although looking the first two stages,
the separation of the internal and external operations (stage 1), is a direct consequence of the
identification of internal and external operations (stage 2), (Sherali et al, 2006).
8
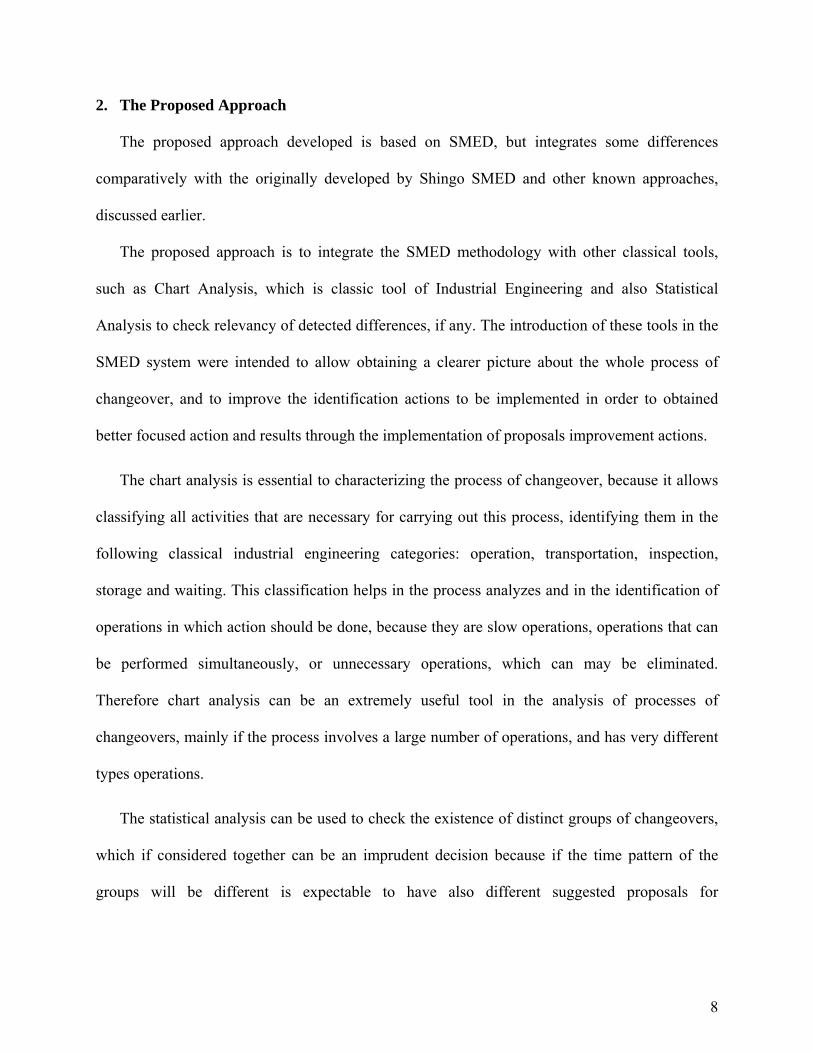
2. The Proposed Approach
The proposed approach developed is based on SMED, but integrates some differences
comparatively with the originally developed by Shingo SMED and other known approaches,
discussed earlier.
The proposed approach is to integrate the SMED methodology with other classical tools,
such as Chart Analysis, which is classic tool of Industrial Engineering and also Statistical
Analysis to check relevancy of detected differences, if any. The introduction of these tools in the
SMED system were intended to allow obtaining a clearer picture about the whole process of
changeover, and to improve the identification actions to be implemented in order to obtained
better focused action and results through the implementation of proposals improvement actions.
The chart analysis is essential to characterizing the process of changeover, because it allows
classifying all activities that are necessary for carrying out this process, identifying them in the
following classical industrial engineering categories: operation, transportation, inspection,
storage and waiting. This classification helps in the process analyzes and in the identification of
operations in which action should be done, because they are slow operations, operations that can
be performed simultaneously, or unnecessary operations, which can may be eliminated.
Therefore chart analysis can be an extremely useful tool in the analysis of processes of
changeovers, mainly if the process involves a large number of operations, and has very different
types operations.
The statistical analysis can be used to check the existence of distinct groups of changeovers,
which if considered together can be an imprudent decision because if the time pattern of the
groups will be different is expectable to have also different suggested proposals for
9
improvement, or in how they are implemented, due to the impact that each proposal may provide
for in each group.
3. The Proposed Approach Implementation
The implementation of the proposed approach was undertaken in a supplier of components
for the automotive industry. The case study was based on the need to obtained time reduction of
changeovers in horizontal machines of plastic injection, through the implementation of the
modified SMED approach. The SMED based approach used during the study was implemented
as next presented.
Initially was observed of a significant number of changeovers occurred in horizontal
machines in order to make the collection of time spent on tasks performed during this activity,
allowing to obtain a deeper knowledge about the procedure used in changeovers.
Due to the absence of the possibility of recording the changeovers observed, it was only
possible to know the current process of changeovers made in horizontal machines by observing
and recording each of the operations carried out during the exchange of templates, making the
measurement of time spent in each of the operations. The initial observation found that the
achievement of a changeover is an extremely complex, since it involves many operations which
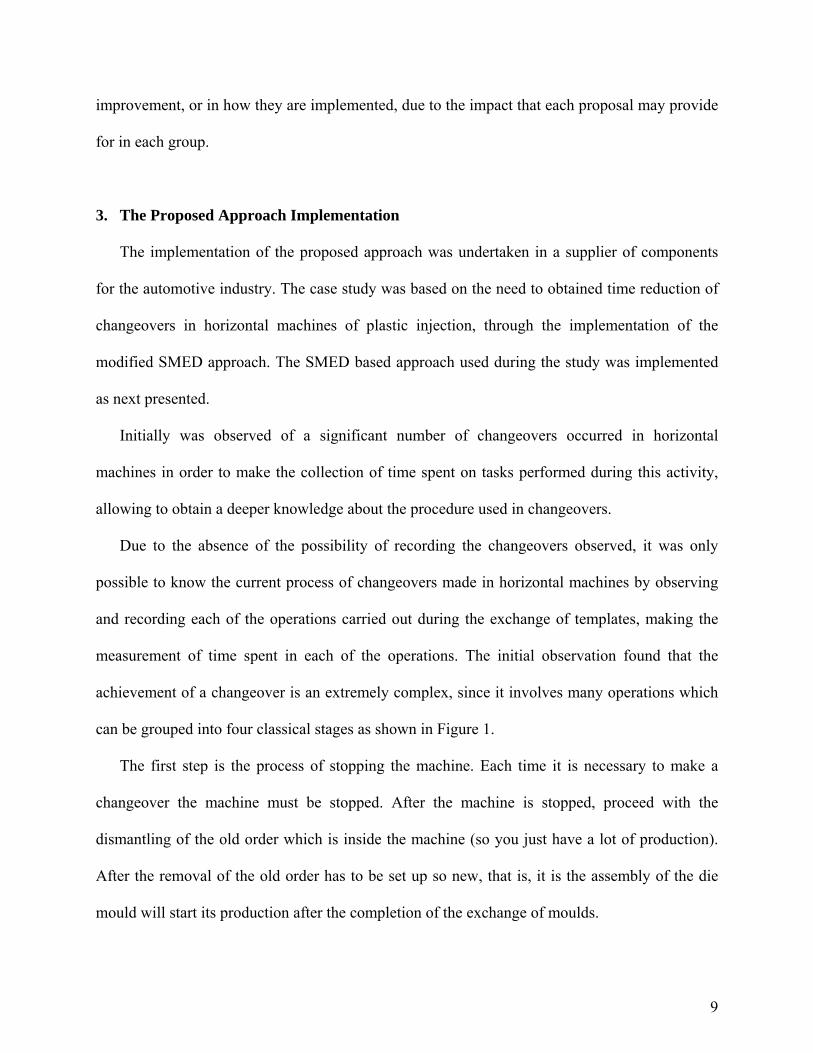
can be grouped into four classical stages as shown in Figure 1.
The first step is the process of stopping the machine. Each time it is necessary to make a
changeover the machine must be stopped. After the machine is stopped, proceed with the
dismantling of the old order which is inside the machine (so you just have a lot of production).
After the removal of the old order has to be set up so new, that is, it is the assembly of the die
mould will start its production after the completion of the exchange of moulds.
10
Figure 1: Stages of the changeover.
Finally, it is necessary to make the exchange of material. This is only made for the product
that has just been produced (old mould) and the product will start its production (new mould)
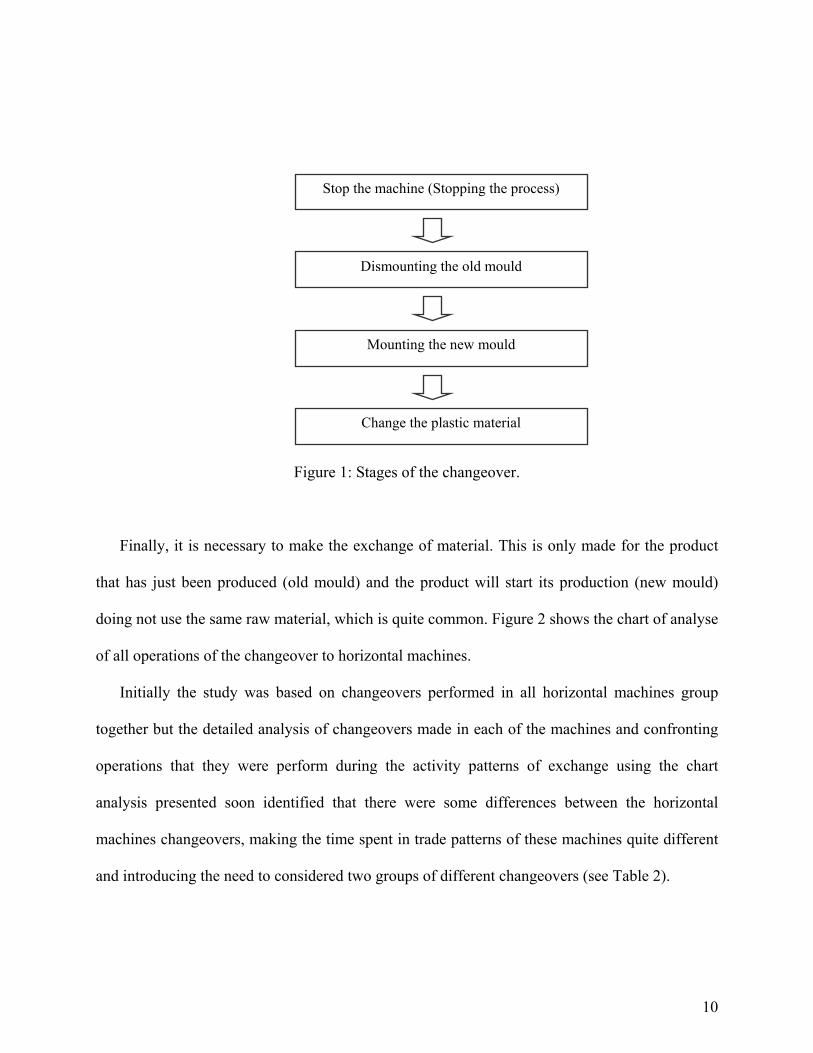
doing not use the same raw material, which is quite common. Figure 2 shows the chart of analyse
of all operations of the changeover to horizontal machines.
Initially the study was based on changeovers performed in all horizontal machines group
together but the detailed analysis of changeovers made in each of the machines and confronting
operations that they were perform during the activity patterns of exchange using the chart
analysis presented soon identified that there were some differences between the horizontal
machines changeovers, making the time spent in trade patterns of these machines quite different
and introducing the need to considered two groups of different changeovers (see Table 2).
Dismounting the old mould
Mounting the new mould
Change the plastic material
Stop the machine (Stopping the process)
11
Figure 2: Chart Analysis of Changeover operations.
12
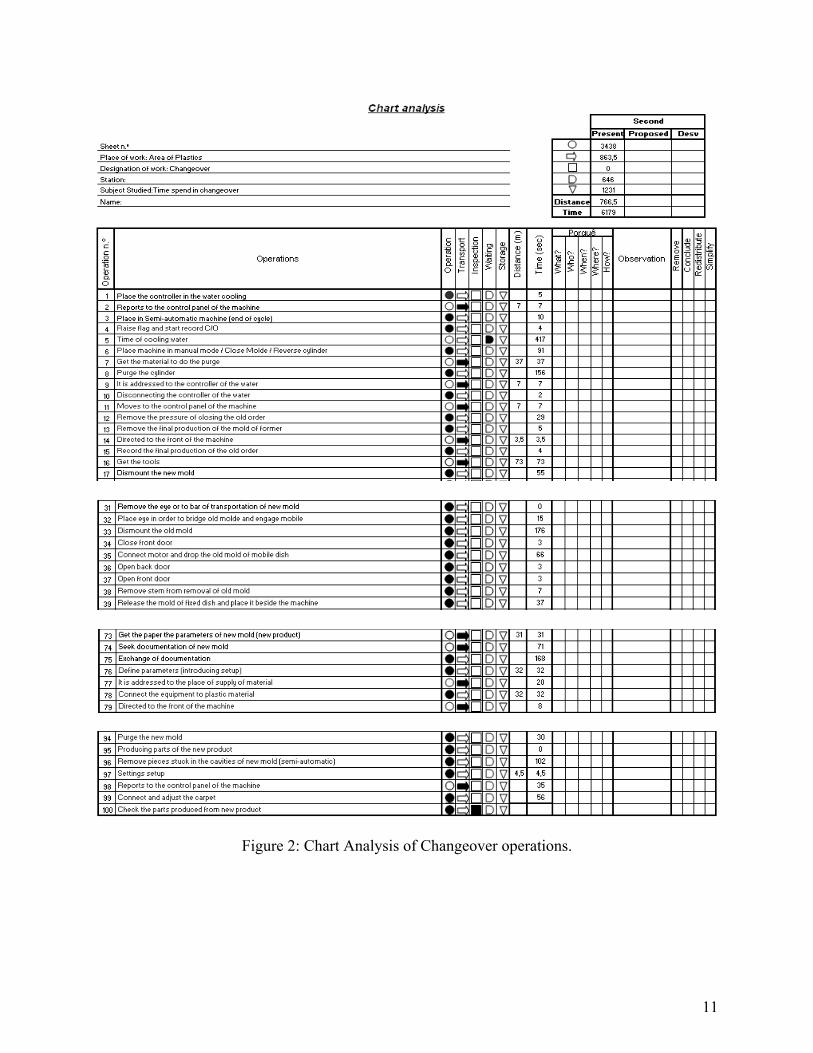
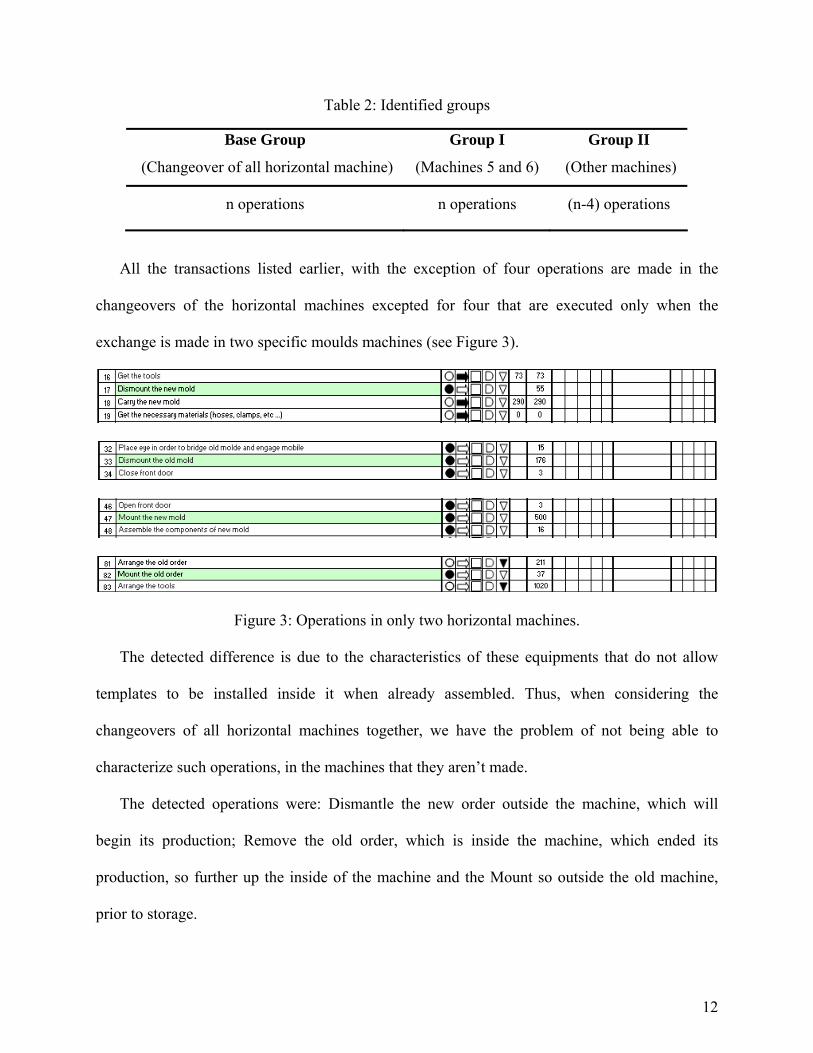
Table 2: Identified groups
All the transactions listed earlier, with the exception of four operations are made in the
changeovers of the horizontal machines excepted for four that are executed only when the
exchange is made in two specific moulds machines (see Figure 3).
Figure 3: Operations in only two horizontal machines.
The detected difference is due to the characteristics of these equipments that do not allow
templates to be installed inside it when already assembled. Thus, when considering the
changeovers of all horizontal machines together, we have the problem of not being able to
characterize such operations, in the machines that they aren’t made.
The detected operations were: Dismantle the new order outside the machine, which will
begin its production; Remove the old order, which is inside the machine, which ended its
production, so further up the inside of the machine and the Mount so outside the old machine,
prior to storage.
Base Group
(Changeover of all horizontal machine)
Group I
(Machines 5 and 6)
Group II
(Other machines)
n operations n operations (n-4) operations
13
The detected differences are an important factor in the proposals of improvement, as well
how they are applied because they are directly related to the changeover standard time
characterisation. So, in this case study two separate groups should be considered, but in order to
known if the detected differences in the changeovers times of these two groups were significant,
statistical analysis of the results were used as presented in next section.
3.1 Analyze of Changeover procedure and data collection
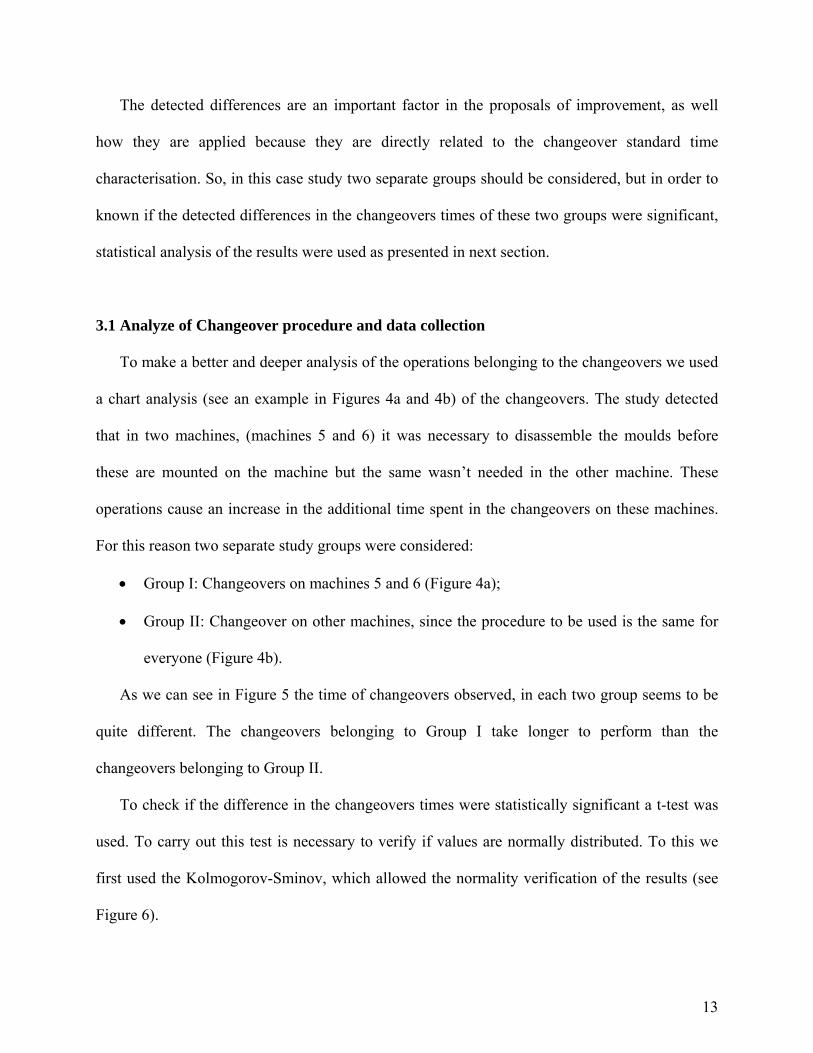
To make a better and deeper analysis of the operations belonging to the changeovers we used
a chart analysis (see an example in Figures 4a and 4b) of the changeovers. The study detected
that in two machines, (machines 5 and 6) it was necessary to disassemble the moulds before
these are mounted on the machine but the same wasn’t needed in the other machine. These
operations cause an increase in the additional time spent in the changeovers on these machines.
For this reason two separate study groups were considered:
• Group I: Changeovers on machines 5 and 6 (Figure 4a);
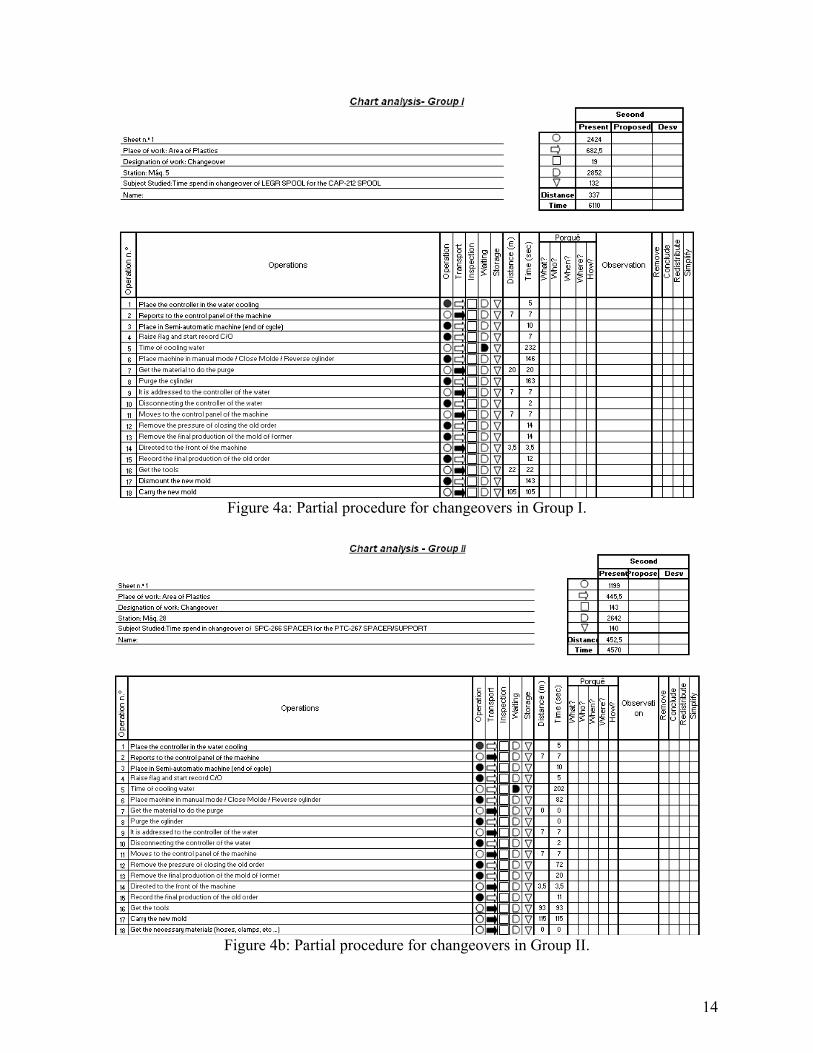
• Group II: Changeover on other machines, since the procedure to be used is the same for
everyone (Figure 4b).
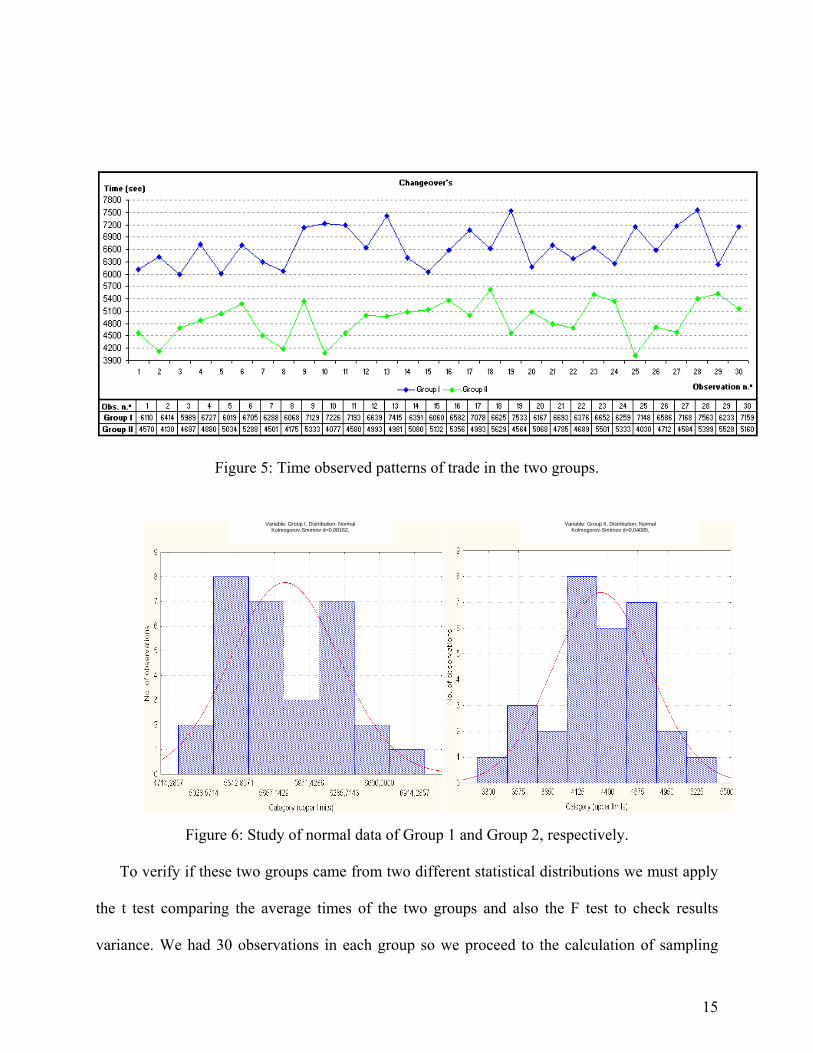
As we can see in Figure 5 the time of changeovers observed, in each two group seems to be
quite different. The changeovers belonging to Group I take longer to perform than the
changeovers belonging to Group II.
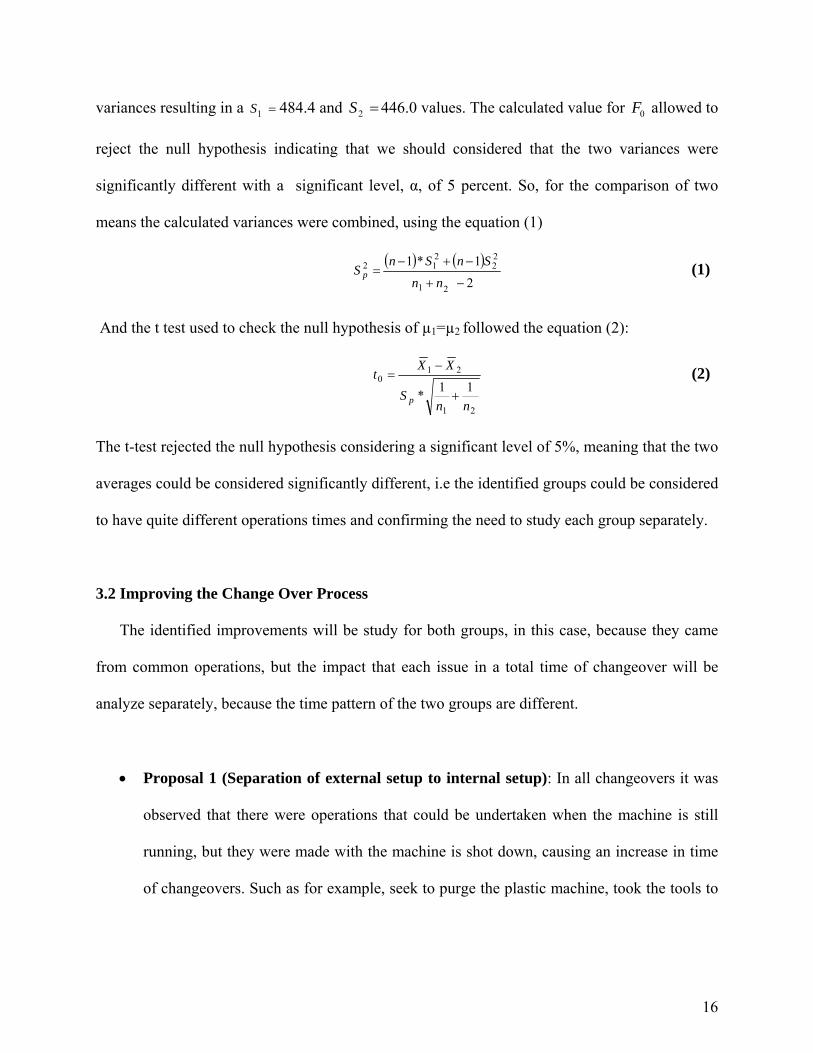
To check if the difference in the changeovers times were statistically significant a t-test was
used. To carry out this test is necessary to verify if values are normally distributed. To this we
first used the Kolmogorov-Sminov, which allowed the normality verification of the results (see
Figure 6).
14
Figure 4a: Partial procedure for changeovers in Group I.
Figure 4b: Partial procedure for changeovers in Group II.
15
Figure 5: Time observed patterns of trade in the two groups.
(a) (b)
Figure 6: Study of normal data of Group 1 and Group 2, respectively.
To verify if these two groups came from two different statistical distributions we must apply
the t test comparing the average times of the two groups and also the F test to check results
variance. We had 30 observations in each group so we proceed to the calculation of sampling
Variable: Group I, Distribution: Normal Kolmogorov-Smirnov d=0,08162,
Variable: Group II, Distribution: Normal Kolmogorov-Smirnov d=0,04085,
16
variances resulting in a =1S 484.4 and =2S 446.0 values. The calculated value for 0F allowed to
reject the null hypothesis indicating that we should considered that the two variances were
significantly different with a significant level, α, of 5 percent. So, for the comparison of two
means the calculated variances were combined, using the equation (1)
( ) ( )2
1*1
21
22
212
−+
−+−=
nn
SnSnS p (1)
And the t test used to check the null hypothesis of µ1=µ2 followed the equation (2):
21
210
11*nn
S
XXt
p +
−= (2)
The t-test rejected the null hypothesis considering a significant level of 5%, meaning that the two
averages could be considered significantly different, i.e the identified groups could be considered
to have quite different operations times and confirming the need to study each group separately.
3.2 Improving the Change Over Process
The identified improvements will be study for both groups, in this case, because they came
from common operations, but the impact that each issue in a total time of changeover will be
analyze separately, because the time pattern of the two groups are different.
• Proposal 1 (Separation of external setup to internal setup): In all changeovers it was
observed that there were operations that could be undertaken when the machine is still
running, but they were made with the machine is shot down, causing an increase in time
of changeovers. Such as for example, seek to purge the plastic machine, took the tools to

17
outside of the machine, making the exchange of documentation and fix the mould after
the exchange of tools is completed.
After the identification of external operations it was made to their separation, as can be see in
Figure 7 and 8. The figure 7 shows the external operations of the group I, while figure 8 shows
the external operations of the group II.
Figure 7: External operations – group I.
Figure 8: External operations – group II.
18
To separate the operations of external transactions, we obtained different results in both
groups, because some operations that, were classified as external in Group I, are different from
foreign operations as in Group II. Since the Group I have nine operations to be executed before
the changeover, including the operation to disassemble the mould again, and four external
operations to be executed after the end of the changeover. Group II presents a set of external
operations relatively minor, should be held before the exchange of only the mould preparation of
documentation, and transport of tools and utensils. And external operations to perform after the
end of the changeover are operations, repair tools and the mould that ended its production and
was removed from the machine.
The implementation of this proposed improvement will provide better results analyzing each
group separately and applying it to each individual because one of the groups (Group II) have a
smaller number of operations, leading to external operations are also in smaller numbers in this
group than in Group I.
• Proposal 2 (parallel operations): The use of parallel operations caused a decrease of
time in implementing the changeovers unnecessarily, because when the changeover is
performed only by a single operator, this has to go to both sides the machine.
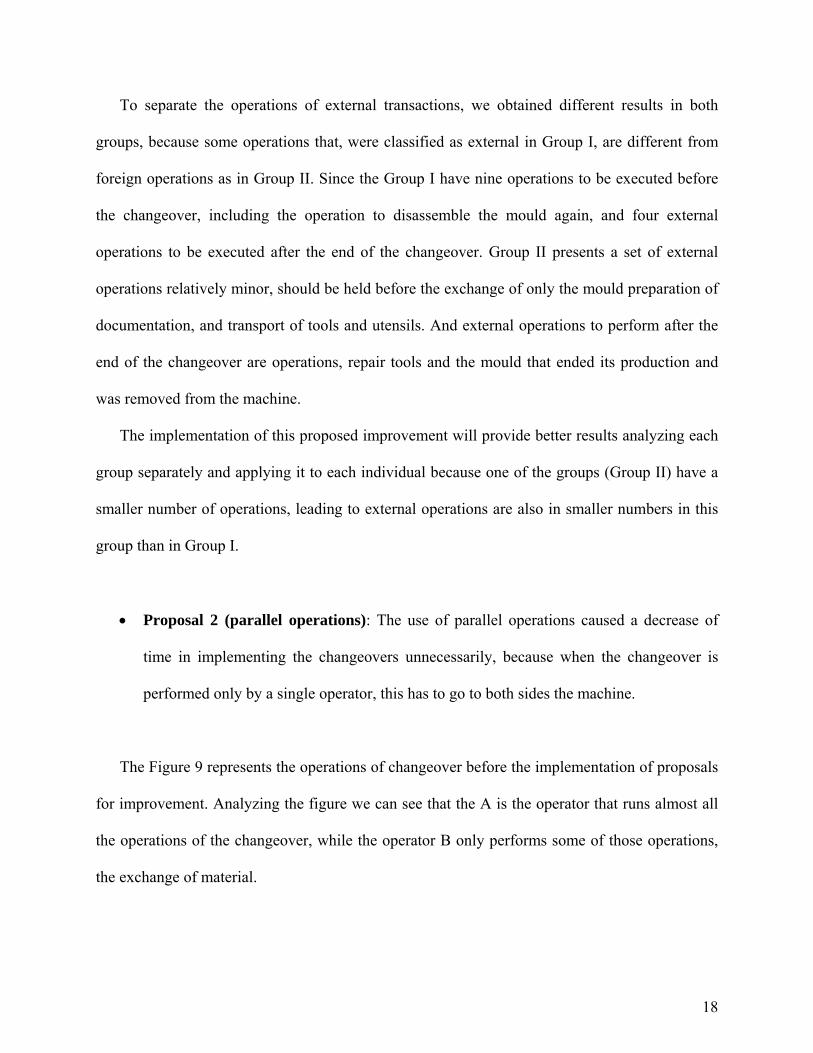
The Figure 9 represents the operations of changeover before the implementation of proposals
for improvement. Analyzing the figure we can see that the A is the operator that runs almost all
the operations of the changeover, while the operator B only performs some of those operations,
the exchange of material.
19
Figure 9: Operations of Changeover – Before.
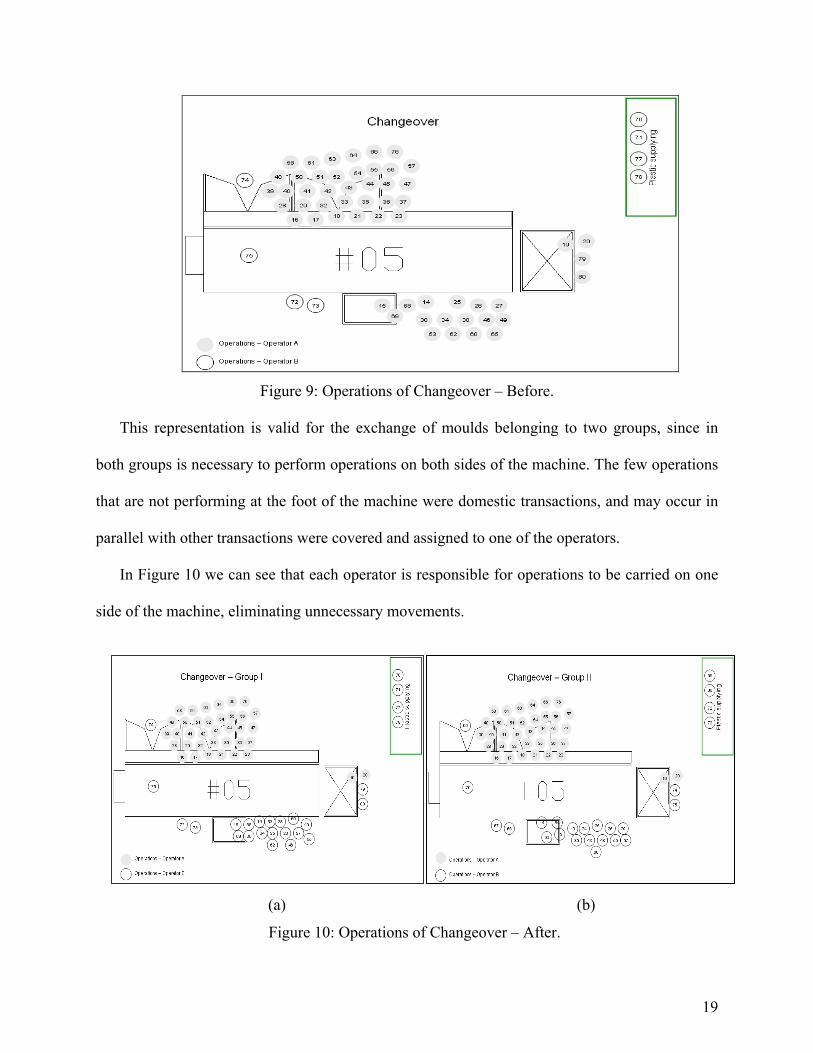
This representation is valid for the exchange of moulds belonging to two groups, since in
both groups is necessary to perform operations on both sides of the machine. The few operations
that are not performing at the foot of the machine were domestic transactions, and may occur in
parallel with other transactions were covered and assigned to one of the operators.
In Figure 10 we can see that each operator is responsible for operations to be carried on one
side of the machine, eliminating unnecessary movements.
(a) (b)
Figure 10: Operations of Changeover – After.
20
Although the implementation of this proposal was made in both groups presents some
differences between than, due to inequalities in the operations to be performed on each group. It
was necessary to do a thoroughly examination of the operations that belong to each group and
that may be performed simultaneously in order to divide them by two operators. Thereby, better
optimization of the changeover, since the choice of operations to be performed by each operator,
is in accordance with the operations being carried out in changeovers from each group. This does
not happen if we considered the changeovers of horizontal machines all together, since the
approach that would be closer to the optimum place for the Group I, but would be far below the
optimum place for the Group II.
This separation has not yet put the operators at risk ergonomic level, as occurring on average
only 5 or 6 exchanges of daily patterns (during the 3 shifts) in the horizontal machines. These
operators also perform other functions that have nothing do with the exchange of moulds, such as
the supply of material.
• Proposal 3 (Start of machine done by the operators): In all the observed changeover,
the start were performed by technicians resulting in the existence of periods of time, to
wait for the start of machines, because the people responsible for the machine start were
busy with other activities, leaving the machine waiting. The occurrence of these
situations could be reduced or even resolved, if the operators that do the changeover
would be also responsible for the start of all horizontal machines.
21
• Proposal 4 (Heat the mould during the heat of the cylinder): Heating the mould could
be made during the heating of the cylinder of the machine when the cylinder was not shot
down during the changeover. Since the time it takes to heat the mould in these conditions,
is almost equal to the time for heating the cylinder. The implementation of this proposal
makes it implicit that the cylinder is not disconnected during the operations of an
exchange of mould and that when the machine is ready to boot, this is done immediately.
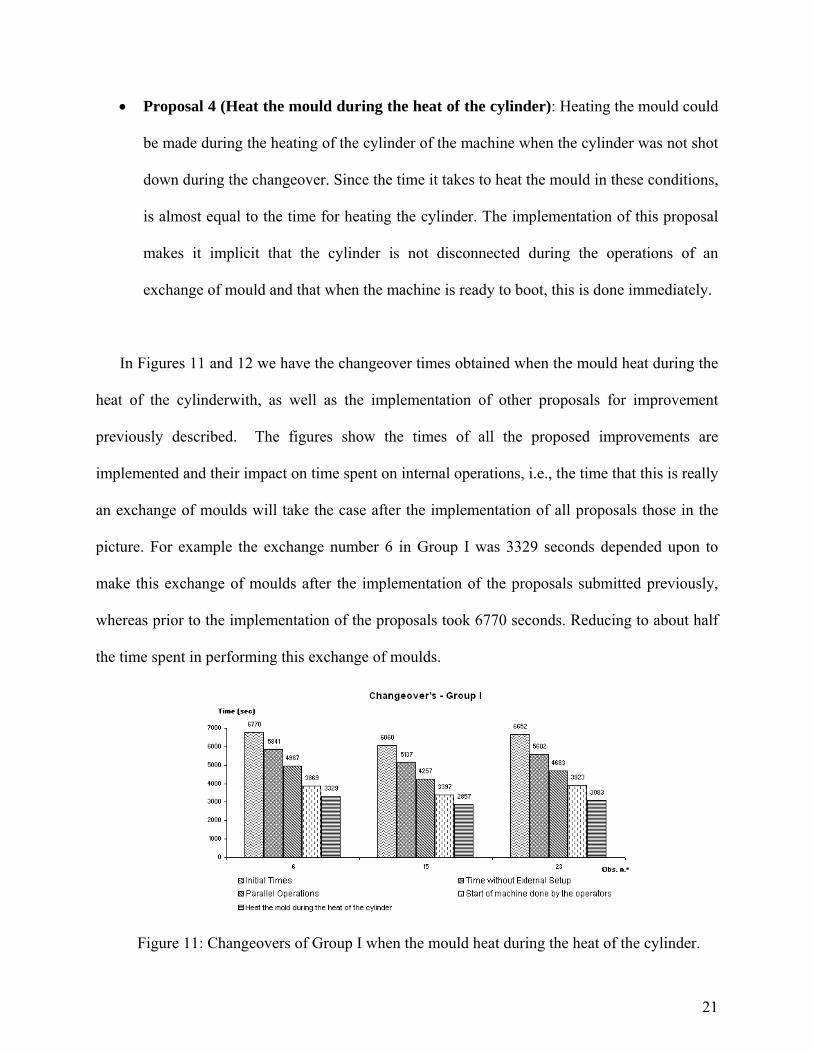
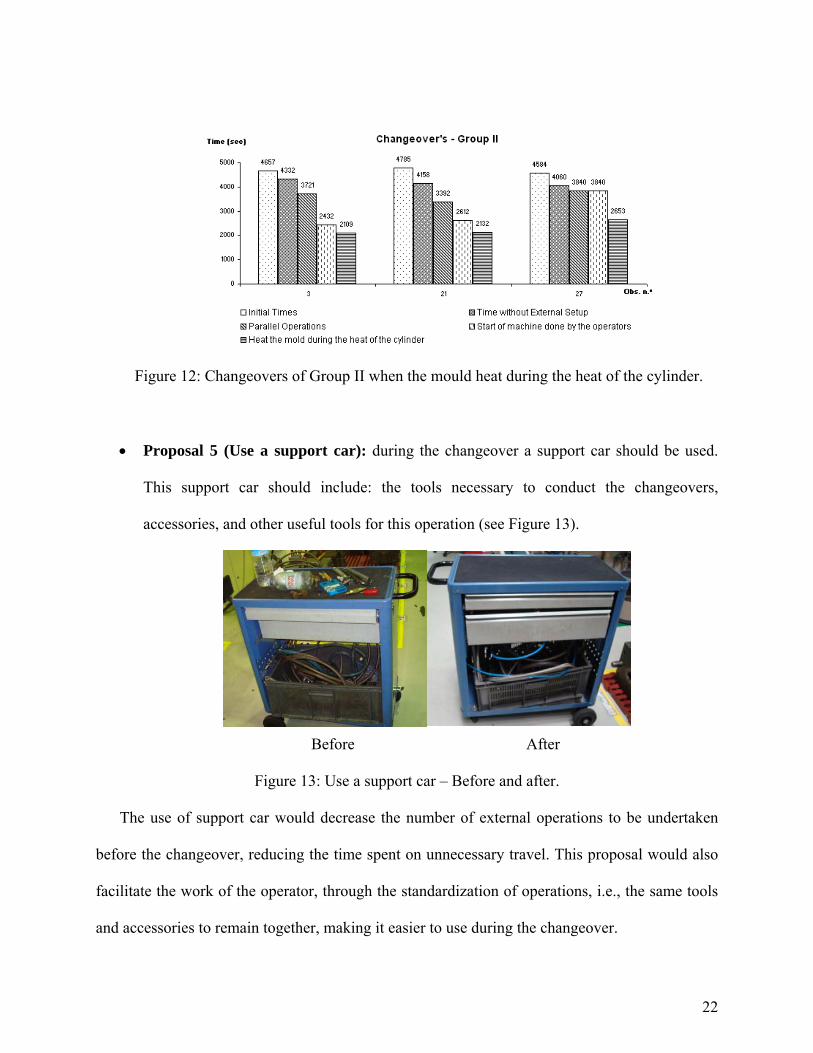
In Figures 11 and 12 we have the changeover times obtained when the mould heat during the
heat of the cylinderwith, as well as the implementation of other proposals for improvement
previously described. The figures show the times of all the proposed improvements are
implemented and their impact on time spent on internal operations, i.e., the time that this is really
an exchange of moulds will take the case after the implementation of all proposals those in the
picture. For example the exchange number 6 in Group I was 3329 seconds depended upon to
make this exchange of moulds after the implementation of the proposals submitted previously,
whereas prior to the implementation of the proposals took 6770 seconds. Reducing to about half
the time spent in performing this exchange of moulds.
Figure 11: Changeovers of Group I when the mould heat during the heat of the cylinder.
22
Figure 12: Changeovers of Group II when the mould heat during the heat of the cylinder.
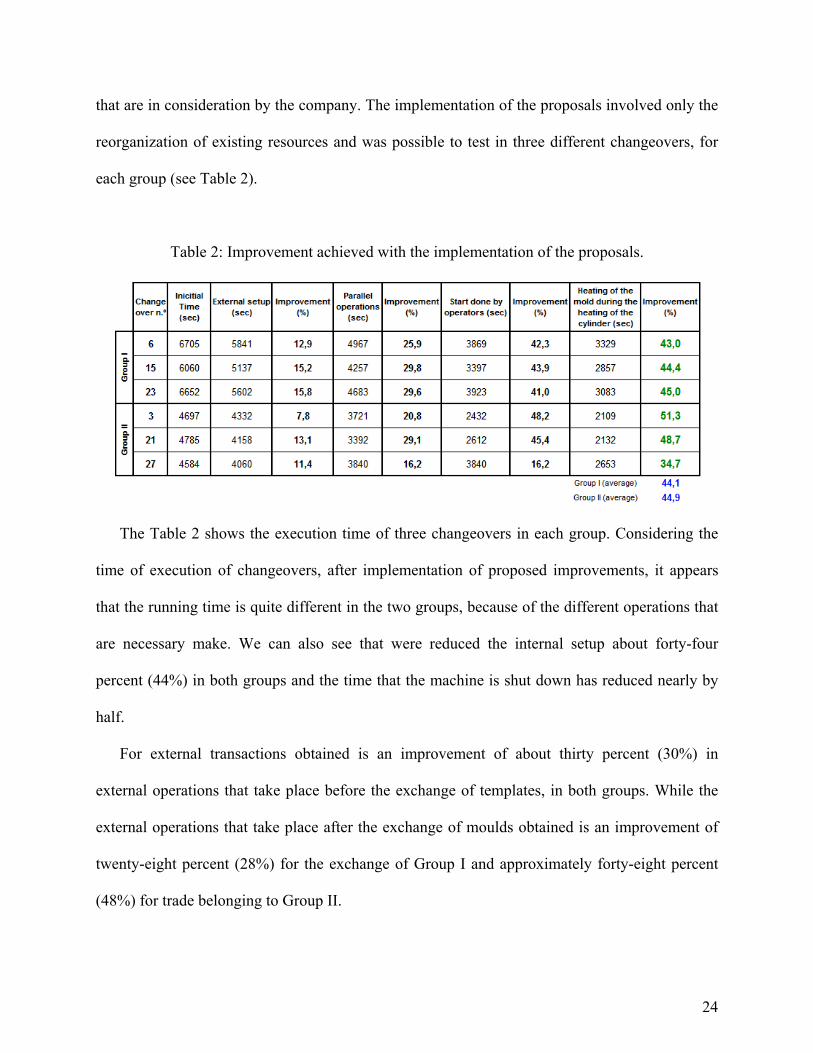
• Proposal 5 (Use a support car): during the changeover a support car should be used.
This support car should include: the tools necessary to conduct the changeovers,
accessories, and other useful tools for this operation (see Figure 13).
Before After
Figure 13: Use a support car – Before and after.
The use of support car would decrease the number of external operations to be undertaken
before the changeover, reducing the time spent on unnecessary travel. This proposal would also
facilitate the work of the operator, through the standardization of operations, i.e., the same tools
and accessories to remain together, making it easier to use during the changeover.

23
• Proposal 6 (Use of integrated file with layers): replacement of individual economic
containing the documentation for a file that had the integrated economic, facilitating the
exchange of documentation after the exchange of moulds.
• Proposal 7 (On and off the plastic supplying): the supply hoses plastic, are rolled up to
each other and the number of hoses is equal for most of the hoses, thus hindering its rapid
identification. Some actions could be implemented, such as:
o Action 1: Increase the distance between the supply hose (about twenty centimeters
would be enough);
o Action 2: Use a color code, that is, all hoses for supplying the horizontal machines
have labels with the same color, showing the number that corresponded to the
machine.
o Action 3: support structure for the hoses that were not being used at the time, making
up putting it every time a hose was disconnected and was not necessary to turn it on
at that moment.
These measures would help reduce the time spent in the operations of the hoses to connect
and disconnect the supply of material and facilitate the work of the operator in carrying out such
operations.
3.3 Implementation and analysis of results
All the previously submitted proposals for the improvement were possible to implement
during this study, except the last one because this proposal involves additional monetary costs
24
that are in consideration by the company. The implementation of the proposals involved only the
reorganization of existing resources and was possible to test in three different changeovers, for
each group (see Table 2).
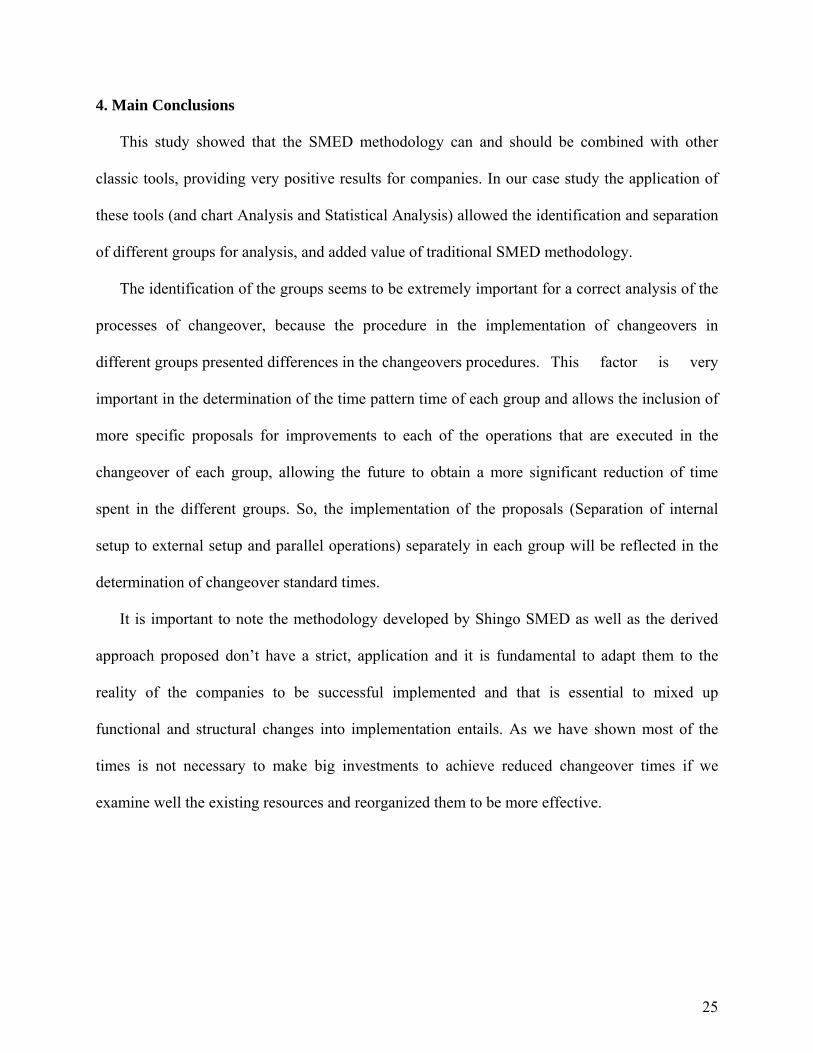
Table 2: Improvement achieved with the implementation of the proposals.
The Table 2 shows the execution time of three changeovers in each group. Considering the
time of execution of changeovers, after implementation of proposed improvements, it appears
that the running time is quite different in the two groups, because of the different operations that
are necessary make. We can also see that were reduced the internal setup about forty-four
percent (44%) in both groups and the time that the machine is shut down has reduced nearly by
half.
For external transactions obtained is an improvement of about thirty percent (30%) in
external operations that take place before the exchange of templates, in both groups. While the
external operations that take place after the exchange of moulds obtained is an improvement of
twenty-eight percent (28%) for the exchange of Group I and approximately forty-eight percent
(48%) for trade belonging to Group II.
25
4. Main Conclusions
This study showed that the SMED methodology can and should be combined with other
classic tools, providing very positive results for companies. In our case study the application of
these tools (and chart Analysis and Statistical Analysis) allowed the identification and separation
of different groups for analysis, and added value of traditional SMED methodology.
The identification of the groups seems to be extremely important for a correct analysis of the
processes of changeover, because the procedure in the implementation of changeovers in
different groups presented differences in the changeovers procedures. This factor is very
important in the determination of the time pattern time of each group and allows the inclusion of
more specific proposals for improvements to each of the operations that are executed in the
changeover of each group, allowing the future to obtain a more significant reduction of time
spent in the different groups. So, the implementation of the proposals (Separation of internal
setup to external setup and parallel operations) separately in each group will be reflected in the
determination of changeover standard times.
It is important to note the methodology developed by Shingo SMED as well as the derived
approach proposed don’t have a strict, application and it is fundamental to adapt them to the
reality of the companies to be successful implemented and that is essential to mixed up
functional and structural changes into implementation entails. As we have shown most of the
times is not necessary to make big investments to achieve reduced changeover times if we
examine well the existing resources and reorganized them to be more effective.
26
References
1. MCINTOSH, R.I., S.J. CULLEY; A.R. MILEHAM, G.W. OWEN. 2007. Changeover
improvement: Reinterpreting Shingo’s “SMED” methodology. IEEE Transactions on
Engineering Management, 54(1) 98-111.
2. GOUBERGEN, D.; H. LANDEGHEM. 2002. Rules for Integrating Fast Changeover
Capabilities into New Equipment design. Belgium: Pergamon.
3. MONDEM, Y. 1983. Toyota production system: Practical approach to production
management. USA: Institute of Industrial Engineers.
4. FOGLIATTO, F., P. FAGUNDES. 2003. Troca rápida de ferramentas: Proposta
metodológica e estudo de caso. Gestão &Produção 10 (2) 163-181.
5. FAGUNDES, P., F. FOGLIATTO. 2002. Metodologia para a troca rápida de
ferramentas: Proposta metodológica (Vol. 1). ENEGEP, Porto Alegre, RS: ABEPRO.
6. SHINGO, S. (1985). A Revolution in Manufacturing: The SMED system. USA:
Productivity Press.
7. SHINGO, S. (1989). A Study of the Toyota production system. USA: Productivity Press.
8. SEKINE, K. (1987). Kaizen for quick changeover: going beyond SMED. USA:
Productivity Press.
9. SUGAI, M., R. MCINTOSH, O. NOVASKI. 2007. Metodologia de Shigeo Shingo
(SMED): análise critica e estudo de caso, Gestão &Produção, 14(2) 323-335.
10. SHERALI, H., D.V. GOUBERGGEN, H.V. LANDEGHEM. 2006. A quantitative
approach for scheduling activities to reduce setup in multiple machine lines. European
Journal of Operational Research 187(3) 1224-1237.
27
11. MCINTOSH, R.I; S.J. CULLEY, A.R. MILEHAM, G.W. OWEN. 2000. A critical
evaluation of Shingo’s “SMED” (Single Minute Exchange of die) methodology. UK:
Taylor & Francis Ltd.
12. TROVINGER, S.; R. BOHN. 2005. Setup time reduction for electronics assembly:
Combining simple (SMED) and IT- based methods. USA: Production and Operations
Management 14(2) 205-217.