Embed Size (px)
Citation preview

agronomy
Article
Improving the Conservation and Use of TraditionalGermplasm through Breeding for Local Adaptation:The Case of the Castellfollit del Boix Common Bean(Phaseolus vulgaris L.) Landrace
Joan Casals 1 , Ana Rivera 1,*, Aurora Rull 1, Roser Romero del Castillo 1, Josep Sabaté 1,Silvia Sans 1, Salvador Soler 2, María José Díez 2, Francesc Casañas 1, Jaime Prohens 2
and Joan Simó 1
1 Mixed Research Unit for the Valorization and Breeding of Horticultural Landraces, Fundació Miquel Agustí,BarcelonaTech, Esteve Terradas, 8, 08860 Castelldefels, Spain; [email protected] (J.C.);[email protected] (A.R.); [email protected] (R.R.d.C.); [email protected] (J.S.);[email protected] (S.S.); [email protected] (F.C.); [email protected] (J.S.)
2 Mixed Research Unit for the Valorization and Breeding of Horticultural Landraces, Institut de Conservació iMillora de l’Agrodiversitat Valenciana, Universitat Politècnica de València, Camí de Vera 14, 46022 València,Spain; [email protected] (S.S.); [email protected] (M.J.D.); [email protected] (J.P.)
* Correspondence: [email protected]; Tel.: +34 935521228
Received: 15 November 2019; Accepted: 12 December 2019; Published: 14 December 2019 �����������������
Abstract: The dramatic reduction in the diversity of crops in the last century is often attributed to theconsolidation of scientific breeding, probably because the two processes have occurred at the sametime. We carried out a breeding program to enhance the Castellfollit del Boix landrace of commonbean (Phaseolus vulgaris L.) in a low-input environment to determine the effects of breeding on alandrace at risk of disappearing. The program increased the number of accessions conserved ex situand obtained more efficient genotypes that are less likely to be abandoned by farmer without alteringthe characteristics that consumers appreciate most. As a result, the availability of the product, itspromotion, and its use have increased. We propose a Conservation Potential Index to measure theimpact of changes in the crop’s epiphenotype, and also apply it to a set of landraces from several crops.We argue that scientific breeding and information gathered in the context of genetic improvementprograms can help to conserve biodiversity when they aim to adapt materials to different localenvironments, rather than having a negative impact on the biodiversity of crops. This approachcontrasts with the genetic erosion that results from efforts to homogenize environments by increasinginputs, so that a few improved varieties adapted to these environments can be grown.
Keywords: breeding for low inputs; plant genetic resources; landraces; Conservation Potential Index
1. Introduction
The loss of agrobiodiversity has coincided in time with the development and widespreadapplication of genetic improvement programs, but the causality of this relationship is beingquestioned [1]. This coincidence gave rise to the conservationist movement that aims to retainestablished combinations of alleles that had become adapted to multiple local environments over thecenturies. However, it is important to recall that scientific breeding has developed side-by-side withscientific improvement of environmental conditions and land use and that the Green Revolution wasthe result of both to understand the entire process [2,3].
Agronomy 2019, 9, 889; doi:10.3390/agronomy9120889 www.mdpi.com/journal/agronomy

Agronomy 2019, 9, 889 2 of 17
Our ability to affect ecosystems by applying huge amounts of energy, mostly from fossil fuels [4],has enabled us to cultivate large tracts of land and to supply them with water and nutrients whilealso combating the organisms that would decimate the crops. Human intervention converted largeareas into homogeneous environments that made it easy for a few varieties that grew optimallyin these environments to rapidly supplant diverse varieties that arose through symbiosis betweenhumans and local environments [5,6]. Is it then really breeding that is responsible for the decrease incultivated biodiversity?
Castellfollit del Boix (hereafter, simplified to Castellfollit) is a landrace of the common bean(Phaseolus vulgaris L.) that is adapted to cultivation without irrigation in the conditions of the Castellfollitdel Boix municipality in central Catalonia (northeast of the Iberian Peninsula), where its cultivationis centered. Being of Mesoamerican origin [7], this bean has been grown in the locality since theeighteenth century [8]. White seeds, whose shape is between rectangular and oval, characterizeCastellfollit landrace (Figure 1). The plant has an indeterminate growth pattern type III [9], but it iscultivated without supports because the plants do not grow very high without irrigation. This variety’smain appeal lies in its sensory traits (hardly perceptible seed coat, high creaminess, and delicate butintense dry bean flavor) and culinary qualities (large proportion of whole seeds after cooking).
Agronomy 2019, 9, x FOR PEER REVIEW 2 of 18
Our ability to affect ecosystems by applying huge amounts of energy, mostly from fossil fuels [4], has enabled us to cultivate large tracts of land and to supply them with water and nutrients while also combating the organisms that would decimate the crops. Human intervention converted large areas into homogeneous environments that made it easy for a few varieties that grew optimally in these environments to rapidly supplant diverse varieties that arose through symbiosis between humans and local environments [5,6]. Is it then really breeding that is responsible for the decrease in cultivated biodiversity?
Castellfollit del Boix (hereafter, simplified to Castellfollit) is a landrace of the common bean (Phaseolus vulgaris L.) that is adapted to cultivation without irrigation in the conditions of the Castellfollit del Boix municipality in central Catalonia (northeast of the Iberian Peninsula), where its cultivation is centered. Being of Mesoamerican origin [7], this bean has been grown in the locality since the eighteenth century [8]. White seeds, whose shape is between rectangular and oval, characterize Castellfollit landrace (Figure 1). The plant has an indeterminate growth pattern type III [9], but it is cultivated without supports because the plants do not grow very high without irrigation. This variety’s main appeal lies in its sensory traits (hardly perceptible seed coat, high creaminess, and delicate but intense dry bean flavor) and culinary qualities (large proportion of whole seeds after cooking).
Figure 1. Typical shape of the seeds of the Castellfollit landrace; seeds from the ends of the pods tend to be more rounded. The scale is in cm.
About 10 years ago, the crop had nearly disappeared due to irregular production (despite the existence of a consolidated market). Accordingly, farmers and local authorities fostered the development of a breeding program to boost cultivation by making evolve the landrace to a more determinate growth and higher tolerance to drought, while keeping its sensory quality.
This situation provides a good opportunity for studying the effects of a program to make a landrace evolve into its particular ecosystem, on its genetic diversity, and conservation expectatives over time. Their quantitative evaluation can also make it possible to compare situations, study costs, and take decisions about the conservation of agrobiodiversity. The objectives of the present study are to: (i) describe the process of genetic improvement in the Castellfollit landrace to underline the changes that are brought about in the genotypic and phenotypic information and in the diversity of the germplasm conserved in situ and ex situ, (ii) propose an index to enable the quantification of changes in the information regarding a landrace/variety over period of time, and (iii) apply this index to several landraces from diverse crops, including the Castellfollit landrace, before and after the selection processes to evaluate current trends.
2. Materials and Methods
2.1. The Castellfollit del Boix Breeding Project
The evaluated effects of the breeding programs had three phases: (1) collecting germplasm, (2) characterizing and elaborating an agromorphological and sensory ideotype, and (3) selection and
Figure 1. Typical shape of the seeds of the Castellfollit landrace; seeds from the ends of the pods tendto be more rounded. The scale is in cm.
About 10 years ago, the crop had nearly disappeared due to irregular production (despitethe existence of a consolidated market). Accordingly, farmers and local authorities fostered thedevelopment of a breeding program to boost cultivation by making evolve the landrace to a moredeterminate growth and higher tolerance to drought, while keeping its sensory quality.
This situation provides a good opportunity for studying the effects of a program to make alandrace evolve into its particular ecosystem, on its genetic diversity, and conservation expectativesover time. Their quantitative evaluation can also make it possible to compare situations, study costs,and take decisions about the conservation of agrobiodiversity. The objectives of the present studyare to: (i) describe the process of genetic improvement in the Castellfollit landrace to underline thechanges that are brought about in the genotypic and phenotypic information and in the diversityof the germplasm conserved in situ and ex situ, (ii) propose an index to enable the quantificationof changes in the information regarding a landrace/variety over period of time, and (iii) apply thisindex to several landraces from diverse crops, including the Castellfollit landrace, before and after theselection processes to evaluate current trends.
2. Materials and Methods
2.1. The Castellfollit del Boix Breeding Project
The evaluated effects of the breeding programs had three phases: (1) collecting germplasm,(2) characterizing and elaborating an agromorphological and sensory ideotype, and (3) selection

Agronomy 2019, 9, 889 3 of 17
and genetic improvement. Throughout the study, we also collected information regarding culturalcharacteristics that are related to the landrace (epiphenotype) (Figure 2).
Agronomy 2019, 9, x FOR PEER REVIEW 3 of 18
genetic improvement. Throughout the study, we also collected information regarding cultural characteristics that are related to the landrace (epiphenotype) (Figure 2).
Figure 2. Chronogram of the project for the Castellfollit bean landrace. The different phases are represented in different colors: Collecting material and characterizing the epiphenotype (green), characterization, study of preferences, and elaboration of the ideotype (yellow), and selection and genetic improvement (blue).
2.2. Collecting Accessions and Characterizing the Epiphenotype
Through visits with farmers in the area of cultivation, we collected all of the available germplasm that presumably belonged to the landrace. In parallel, we searched the inventories of the most important seed banks in Spain (Centro de Recursos Fitogenéticos (CRF-INIA), Instituto de Conservación de la Agrodiversidad Valenciana (COMAV-UPV), and Banco de Germoplasma de Especies Hortícolas de Zaragoza (BGHZ)) for accessions that belong to the landrace according to the passport data and/or name.
We surveyed farmers to collect information regarding the traditional ways of managing the crop and of using the beans while collecting germplasm and throughout the program. Moreover, we conducted several assays to optimize the approach to cultivating the landrace (to determine the minimum soil depth required, the type of mechanization, best method of weed control, etc.); in other words, we worked toward the epiphenotypical characterization of the landrace [10].
2.3. From Characterizing the Phenotypes to the Elaboration of the Ideotype
2.3.1. Characterizing the Phenotypes
The collected accessions were cultivated at a single site representative of the zone (Location 0: 41°39′56.9” N; 1°41′05.0” E). The soil characteristics in the area are considerably homogeneous (Table S1); they are loamy, slightly alkaline, with high concentrations of Ca, acceptable cation exchange capacity, and occasional differences in the concentrations of some elements (Na, P) that we consider are basically due to differences in the management of the fields. The beans are cultivated without irrigation; the mean precipitation during the growing season (mid-April–August) over the last 10 years is 203 mm, and the temperature of the soil in this period ranges from −2 °C to 40 °C, with mean monthly minimum of 1, 4, 8, 11, 12 °C, and mean monthly maximum of 24, 27, 32, 34, 35 °C, respectively, for the five months considered.
Figure 2. Chronogram of the project for the Castellfollit bean landrace. The different phases arerepresented in different colors: Collecting material and characterizing the epiphenotype (green),characterization, study of preferences, and elaboration of the ideotype (yellow), and selection andgenetic improvement (blue).
2.2. Collecting Accessions and Characterizing the Epiphenotype
Through visits with farmers in the area of cultivation, we collected all of the available germplasmthat presumably belonged to the landrace. In parallel, we searched the inventories of the most importantseed banks in Spain (Centro de Recursos Fitogenéticos (CRF-INIA), Instituto de Conservación dela Agrodiversidad Valenciana (COMAV-UPV), and Banco de Germoplasma de Especies Hortícolasde Zaragoza (BGHZ)) for accessions that belong to the landrace according to the passport dataand/or name.
We surveyed farmers to collect information regarding the traditional ways of managing thecrop and of using the beans while collecting germplasm and throughout the program. Moreover,we conducted several assays to optimize the approach to cultivating the landrace (to determine theminimum soil depth required, the type of mechanization, best method of weed control, etc.); in otherwords, we worked toward the epiphenotypical characterization of the landrace [10].
2.3. From Characterizing the Phenotypes to the Elaboration of the Ideotype
2.3.1. Characterizing the Phenotypes
The collected accessions were cultivated at a single site representative of the zone (Location0: 41◦39′56.9” N; 1◦41′05.0” E). The soil characteristics in the area are considerably homogeneous(Table S1); they are loamy, slightly alkaline, with high concentrations of Ca, acceptable cation exchangecapacity, and occasional differences in the concentrations of some elements (Na, P) that we considerare basically due to differences in the management of the fields. The beans are cultivated withoutirrigation; the mean precipitation during the growing season (mid-April–August) over the last 10years is 203 mm, and the temperature of the soil in this period ranges from −2 ◦C to 40 ◦C, withmean monthly minimum of 1, 4, 8, 11, 12 ◦C, and mean monthly maximum of 24, 27, 32, 34, 35 ◦C,respectively, for the five months considered.
Agronomy 2019, 9, 889 4 of 17
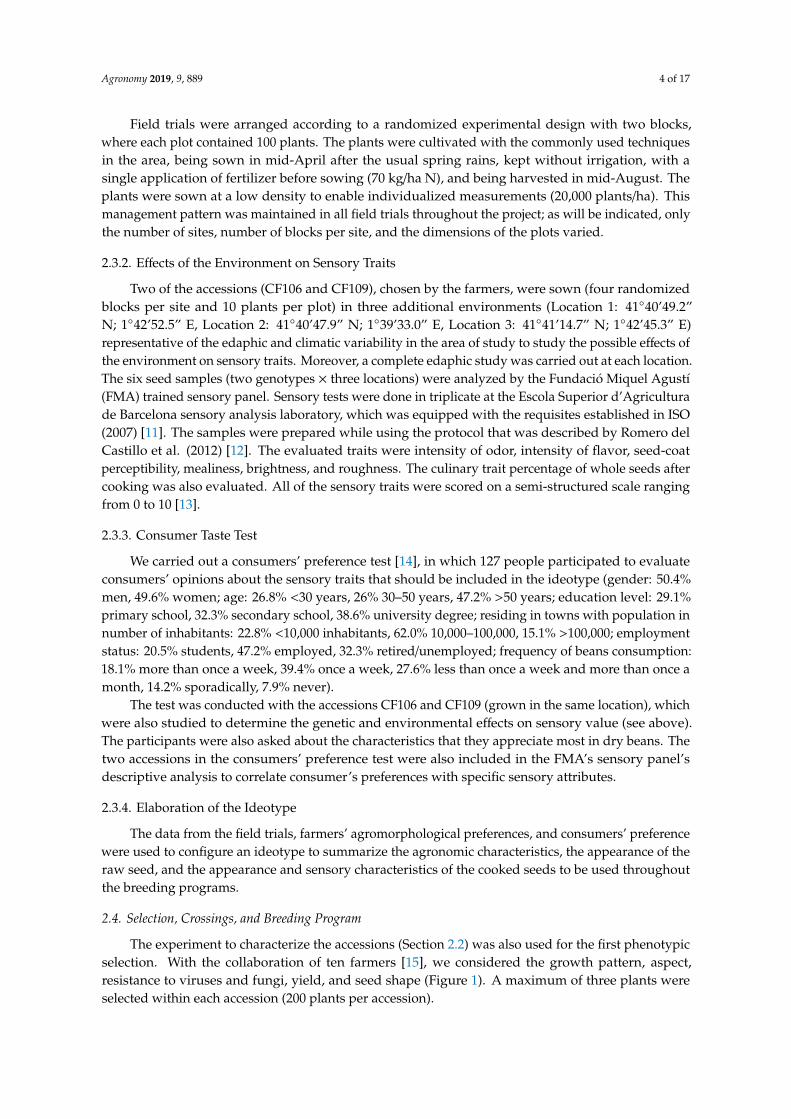
Field trials were arranged according to a randomized experimental design with two blocks,where each plot contained 100 plants. The plants were cultivated with the commonly used techniquesin the area, being sown in mid-April after the usual spring rains, kept without irrigation, with asingle application of fertilizer before sowing (70 kg/ha N), and being harvested in mid-August. Theplants were sown at a low density to enable individualized measurements (20,000 plants/ha). Thismanagement pattern was maintained in all field trials throughout the project; as will be indicated, onlythe number of sites, number of blocks per site, and the dimensions of the plots varied.
2.3.2. Effects of the Environment on Sensory Traits
Two of the accessions (CF106 and CF109), chosen by the farmers, were sown (four randomizedblocks per site and 10 plants per plot) in three additional environments (Location 1: 41◦40’49.2”N; 1◦42’52.5” E, Location 2: 41◦40’47.9” N; 1◦39’33.0” E, Location 3: 41◦41’14.7” N; 1◦42’45.3” E)representative of the edaphic and climatic variability in the area of study to study the possible effects ofthe environment on sensory traits. Moreover, a complete edaphic study was carried out at each location.The six seed samples (two genotypes × three locations) were analyzed by the Fundació Miquel Agustí(FMA) trained sensory panel. Sensory tests were done in triplicate at the Escola Superior d’Agriculturade Barcelona sensory analysis laboratory, which was equipped with the requisites established in ISO(2007) [11]. The samples were prepared while using the protocol that was described by Romero delCastillo et al. (2012) [12]. The evaluated traits were intensity of odor, intensity of flavor, seed-coatperceptibility, mealiness, brightness, and roughness. The culinary trait percentage of whole seeds aftercooking was also evaluated. All of the sensory traits were scored on a semi-structured scale rangingfrom 0 to 10 [13].
2.3.3. Consumer Taste Test
We carried out a consumers’ preference test [14], in which 127 people participated to evaluateconsumers’ opinions about the sensory traits that should be included in the ideotype (gender: 50.4%men, 49.6% women; age: 26.8% <30 years, 26% 30–50 years, 47.2% >50 years; education level: 29.1%primary school, 32.3% secondary school, 38.6% university degree; residing in towns with population innumber of inhabitants: 22.8% <10,000 inhabitants, 62.0% 10,000–100,000, 15.1% >100,000; employmentstatus: 20.5% students, 47.2% employed, 32.3% retired/unemployed; frequency of beans consumption:18.1% more than once a week, 39.4% once a week, 27.6% less than once a week and more than once amonth, 14.2% sporadically, 7.9% never).
The test was conducted with the accessions CF106 and CF109 (grown in the same location), whichwere also studied to determine the genetic and environmental effects on sensory value (see above).The participants were also asked about the characteristics that they appreciate most in dry beans. Thetwo accessions in the consumers’ preference test were also included in the FMA’s sensory panel’sdescriptive analysis to correlate consumer’s preferences with specific sensory attributes.
2.3.4. Elaboration of the Ideotype
The data from the field trials, farmers’ agromorphological preferences, and consumers’ preferencewere used to configure an ideotype to summarize the agronomic characteristics, the appearance of theraw seed, and the appearance and sensory characteristics of the cooked seeds to be used throughoutthe breeding programs.
2.4. Selection, Crossings, and Breeding Program
The experiment to characterize the accessions (Section 2.2) was also used for the first phenotypicselection. With the collaboration of ten farmers [15], we considered the growth pattern, aspect,resistance to viruses and fungi, yield, and seed shape (Figure 1). A maximum of three plants wereselected within each accession (200 plants per accession).

Agronomy 2019, 9, 889 5 of 17
The following autumn, 50 seeds from each of the selected plants were individually sown in agreenhouse to: (a) check to make sure that there was no phenotypic segregation in the progeny of theplants chosen in the field, (b) multiply the material to ensure enough inbred seeds to continue the trials,and (c) carry out controlled crossings with the inbred line (Croscat) that was chosen to provide thedeterminate growth trait [16]. All of the F1 populations resulting from crossing Castellfollit with Croscatthat would provide the determinate growth trait were sown and allowed to self-fertilize to obtain thefirst generation of inbreeding (S1 generation) from which to start the pedigree selection program.
2.4.1. Individual Selection Program
A brief individual selection program was conducted over two campaigns on 15 progenies thatwere obtained from a single plant into a non-segregating family chosen during the phenotypic selection(Section 2.3 and Table 2).
The aim of the first campaign was to: (a) study the genotypic value of the plants that werechosen through their mean phenotypic value of their progenies and (b) choose the plants closest to theideotype and collect the seeds from self-fertilization to enable the obtainment of selected lines of theCastellfollit type.
The first campaign used a randomized block design with two blocks and 10 plants per plot, in twolocalities (Castellfollit del Boix (41◦41’29.5” N 1◦42’57.7” E) and Maians (41◦38’23.5” N 1◦41’40.4” E))that mainly differed in their altitudes (626 and 554 m, respectively). During cultivation, we analyzedtraits, such as resistance to disease and pests, growth habit, earliness, yield, and size and shape of theseeds (with an image processing program: WinSEEDLE Pro v2005b; Regent Instruments, Inc. Quebec,Canada). The information collected was used to select seven lines for the second campaign, whichwere conducted in the same two localities with 20 plants per plot. In the second campaign, we addedsome chemical components of the seed coat and cotyledon calculated to the recorded traits while usingregression methods from near-infrared spectroscopy [17,18]. We also analyzed the sensory traits, asdescribed in Section 2.3.2.
2.4.2. Pedigree Selection
For pedigree selection, we chose four of the 30 S1 families that were obtained by crossing thelandrace with Croscat. We selected plants that had totally determinate growth habit (type I) [9], goodoverall appearance, high resistance to disease and pests, and high yields in a single locality with asingle block and 150 plants per plot. Only selecting plants with determinate growth habit results inthe exclusion of plants that are heterozygous for the determinate growth gene (probably the gene fin,which is recessive [19,20]). This is a fast way to proceed in the selection process without the need formolecular analyses. The seeds were obtained by self-fertilization of plants with determinate growth,and while considering the information obtained from F1 and S1, 22 plants were chosen from all of theS1 families (S2 seeds) to continue the process of selection.
The seeds from these 22 S2 families were assayed in the following campaign in the localitiesof Maians and Castellfollit del Boix with two randomized blocks and 15 plants per plot. Duringcultivation, we controlled the number of plants that sprouted, the earliness of flowering, the incidenceof viral infection, the growth habit, the general vegetative appearance of the rows, the abundanceof pods, and the resistance to root fungi. Finally, the plants were selected from the rows that hadthe best mean phenotypic values. The seeds that resulted from self-fertilization of these plants weremeasured to determine the yield as well as to determine their size and shape (scanned and analyzedwith WinSEEDLE Pro v2005b; Regent Instruments, Inc. Quebec, Canada); this information was used toselect the individual plants whose progenies would be used in the next selection cycle. The maximumselection pressure within each family was approximately 5%; on the other hand, no plants were selectedfrom some families. This procedure was repeated over the next three years until 98.5% homozygousplants were obtained; we considered these S6 plants to be inbreds for practical purposes.

Agronomy 2019, 9, 889 6 of 17
The number of families decreased with each generation, because when two families convergedtoward very similar characteristics, one of them was eliminated, depending on the degree ofdifferentiation observed among the families closest to the ideotype.
A trial was carried out in the two localities (Maians and Castellfollit del Boix) at the end of theselection process to compare the new inbred lines obtained, all of which had determinate growth andupright bearing, together with the controls Croscat and LCF109 (an inbred with indeterminate growththat was obtained through individual selection within the CF109 population). We used an experimentaldesign with two randomized blocks and 15 plants per plot, and we recorded agromorphological andsensory data (Tables 8 and 9).
2.5. Statistical Analysis of the Data and Index to Measure Conservation Status and Conditions Favorablefor Conservation
2.5.1. Statistical Analyses
We performed analyses of variance while considering all of the factors in the design and allthe measurable interactions in all of the phenotyping studies. To compare means, we used Tukey’smultiple comparison test with the level of significance set at p ≤ 0.05. We also performed a normalizedprincipal component analysis (PCA) to study the phenotypic relationship between the lines that wereobtained in the project. We used the binomial test for the consumer preference test [21]. All of theanalyses were done with the R program [22,23].
2.5.2. Measuring Conservation Status and Conditions Favorable for Conservation
As mentioned above, one of the objectives of this paper is to propose a method for easilysummarizing the elements favorable for the conservation of the germplasm for a determinate landraceat a determinate point in time, beyond the number of accessions inventoried and conserved. This typeof measurement (Conservation Potential Index—CPI), as applied at different points in time, has toenable us to compare diverse situations, including long-term trends in the conservation of landraces,or to evaluate the usefulness of an intervention by calculating the cost per each unit of increase inthe index. For that, we propose to: (a) use a collection of items that are related to the landrace,including aspects, such as conservation, phenotyping, epiphenotyping, etc. (Table 1), (b) assess eachof these items on a scale ranging from 0 to 10, and (c) add up the points for all of the items anddivide the sum by the maximum possible score (200). We have decided to give each item equalimportance rather than weighting them until we understand the relationship between items better.We assume that the deviations in the scores for each item that are due to the evaluator’s bias willbe randomly distributed and, therefore, the algebraic sum of the deviations will be close to zero ifall of the items are equally weighted. This index ranges from 0 to 1. The information provided bythe CPI complements other measures, such as the conserved number of accessions of the landrace,of the varieties obtained from selection within the landrace, and of the improved varieties that wereobtained through the introgression of genes from outside the landrace that still have the differentialcharacteristics of the landrace.
Table 1. Items evaluated for the calculation of the Conservation Potential Index. Each item is scored ona scale ranging from 0 to 10.
Items Definition
Controlled multiplication ofgermplasm
Degree of multiplication of germplasm done in an isolated and controlled way,with conservative selection
Morphological characterization Degree of characterization of the morphological variability found in the landrace
Agronomic characterization Degree of characterization of the agronomic variability found in the landrace
Sensory characterization Degree of characterization of the sensory variability found in the landrace

Agronomy 2019, 9, 889 7 of 17
Table 1. Cont.
Items Definition
Chemical characterization Degree of characterization of the chemical variability found in the landrace
Genetic characterization Degree of characterization of the genetic variability found in the landrace
Characterization ofenvironmental effects
Degree of characterization of the effects of the environment on the variabilityfound in the landrace
Edaphic description Degree of characterization of the soils in the territory where the landrace hastraditionally been cultivated
Climatic description Degree of characterization of the climate in the territory where the landrace hastraditionally been cultivated
Historical/culturaldocumentation Degree of historical/cultural characterization of the uses of the landrace
Documentation of traditionalcultivation methods
Degree of knowledge and documentation of the traditional methods ofcultivating the landrace
Bringing managementtechnologies up to date
Degree of exploration of new farming technologies and mechanization triedand/or incorporated into cultivation of the landrace
Associations among farmers Degree of association among farmers for the purpose of exploiting andcommercializing the landrace
European Union geographicalquality label State of the process toward obtaining a European quality label
External quality control Degree of external quality control of the product’s sensory traits
Farmers’ preferences Degree of formulation of farmers’ preferences
Consumers’ preferences Degree of formulation of consumers’ preferences
Use in restaurants Degree of use of the product in restaurants (mainly in the area of cultivation)
Use in transformed products Degree of transformation of the product (canning, etc.)
Collective promotion in events Degree of promotion of the product at fairs and events
3. Results
The main results regarding the epiphenotypic characteristics and the recommendations foroptimizing the management of Castellfollit have been compiled in a best practices manual [24]. All ofthe previously existing materials that were documented and the newly developed materials areconserved ex situ at the FMA seed germplasm collection, regardless of whether they are currentlybeing used by farmers. All of the information that was collected about the genetic and environmentaleffects on sensory value will be presented together with the studies of environmental homogeneity andtraditional management and the availability of well-defined genetic material to apply for a geographicalquality label from the European Union.
3.1. Collecting Accessions, Phenotypic and Epiphenotypic Characterization, Phenotypic Selection, Study ofPreferences, and Elaboration of the Ideotype
Searches in Spanish seed banks by name and geographical origin found no accessions of theCastellfollit landrace. Thus, only the 15 accessions that were collected from farmers in the areawere used.
The field trial with these accessions revealed considerable phenotypic variation in the traitsstudied (Table 2). Some of the variability among plants must be attributed to environmental factors,since the crop is cultivated without irrigation and there were substantial differences in environmentalfactors in the experimental field.

Agronomy 2019, 9, 889 8 of 17
Table 2. Characteristics of the accessions studied: mean (±SE) of all plants in each accession, mean ofall the plants in the trial, and the mean of the plants selected for breeding.
Accession Virus 1 GrowthHabit 2 Appearance 3 Days to
FloweringNumber ofPod/Plant
Yield(g/plant)
100 SeedsWeight (g)
CF7102 2.11 ± 0.25 1.51 ± 0.24 1.22 ± 0.09 50.56 ± 1.01 38.56 ± 4.85 51.78 ± 8.64 33.46 ± 1.45CF114 2.00 ± 0.18 1.50 ± 0.22 1.52 ± 0.18 48.88 ± 0.01 33.01 ± 4.82 40.13 ± 0.67 34.12 ± 1.70CF201 2.50 ± 0.15 1.57 ± 0.17 1.21 ± 0.11 48.12 ± 0.31 30.14 ± 3.88 37.29 ± 7.72 32.81 ± 2.77CF214 2.14 ± 0.26 1.64 ± 0.24 1.57 ± 0.17 48.88 ± 0.02 34.14 ± 5.51 52.12 ± 6.59 40.33 ± 2.58CF301 2.32 ± 0.17 1.45 ± 0.14 1.45 ± 0.08 50.36 ± 0.76 46.09 ± 4.84 51.18 ± 5.68 31.48 ± 1.92CF314 2.42 ± 0.37 1.51 ± 0.18 1.33 ± 0.21 49.63 ± 0.84 47.00 ± 4.90 54.33 ± 8.01 28.50 ± 1.59CF401 1.63 ± 0.13 1.17 ± 0.08 1.22 ± 0.09 49.38 ± 0.56 43.78 ± 3.64 55.67 ± 5.34 34.89 ± 0.92CF106 1.83 ± 0.17 1.33 ± 0.17 1.17 ± 0.08 49.87 ± 0.74 43.56 ± 6.05 63.89 ± 7.56 36.48 ± 1.22CF501 2.38 ± 0.18 1.63 ± 0.23 1.31 ± 0.09 49.44 ± 0.63 37.38 ± 5.79 47.01 ± 9.61 33.33 ± 1.87CF514 2.08 ± 0.20 1.53 ± 0.32 1.33 ± 0.17 49.63 ± 0.84 43.33 ± 4.88 61.17 ± 7.84 39.17 ± 2.26CF614 2.29 ± 0.15 1.14 ± 0.14 1.07 ± 0.07 51.11 ± 1.04 47.57 ± 5.45 64.14 ± 6.87 35.20 ± 1.58CF701 2.23 ± 0.18 1.41 ± 0.14 1.27 ± 0.08 50.10 ± 0.68 43.42 ± 3.49 54.75 ± 6.12 36.36 ± 3.36CF714 1.86 ± 0.14 1.07 ± 0.07 1.43 ± 0.17 50.16 ± 0.92 53.29 ± 8.31 65.14 ± 9.75 37.86 ± 3.78
CF7002 2.51 ± 0.13 1.35 ± 0.15 1.15 ± 0.08 51.11 ± 0.84 45.00 ± 5.32 51.91 ± 5.48 31.73 ± 2.12CF109 2.31 ± 0.23 1.31 ± 0.13 1.25 ± 0.13 50.01 ± 0.82 32.63 ± 2.71 39.88 ± 5.42 32.91 ± 2.43
Initial population 2.67 ± 0.02 0.94 ± 0.01 1.13 ± 0.01 56.44 ± 0.07 29.20 ± 0.28 40.73 ± 0.52 29.61 ± 0.18Selected plants 2.17 ± 0.06 1.40 ± 0.04 1.29 ± 0.03 49.81 ± 0.22 41.25 ± 1.56 52.67 ± 2.09 34.56 ± 0.731 0 = no virus, 3 = extensive viral infection; 2 0 = trailing, 3 = very upright; 3 0= poor overall impression, 3 = goodoverall impression.
The sets of plants that were selected for their phenotype within each accession had less variabilitythan the rest of the plants in the accession, since they were selected for their superior characteristics(Table 2).
Regarding the influence of the environment on sensory and culinary traits (see material andmethods Section 2.3.2) the trained panelists detected significant differences between localities for mostparameters studied (Table 3). Nevertheless, the differences were small if we consider that the sensorytraits were measured on a scale that ranged from 0 to 10. The differences in the edaphic and climaticcharacteristics of the locations were also small (Table S1), and no significant correlations were foundbetween these characteristics and the differences in sensory and culinary traits. These findings are notunusual, because the environmental effects are diffuse and affected by many interactions [25].
Table 3. Comparison of means of sensory and culinary traits for each locality using CF106 and CF109accessions. Values within the same column followed by the same letter are not significantly different atp ≤ 0.05 according to Tukey’s multiple comparison test.
Locality Odor 1 Flavor Seed-CoatPerception Mealiness Seed-Coat
Roughness Brightness % Whole Seedsafter Cooking
Loc 1 3.2 a 35 b 0.8 b 4.3 a 4.3 a 6.2 b 72.1 aLoc 2 2.8 a 3.0 b 1.9 a 4.5 a 4.2a 7.2 a 64.5 bLoc 3 3.2 a 4.6 a 1.1 b 4.3 a 4.7 a 6.4 b 65.8 b
1 All sensory traits were measured on a scale ranging from 0 (absence of the trait) to 10 (maximum expression ofthe trait).
Significantly more consumers preferred accession CF109 to CF106 (p > 0.05) in the study ofconsumers’ preference (see Material and Methods Section 2.3.3), although the differences in thepreferences were not very large (56% CF109; 44% CF106). Although the trained panel’s descriptiveanalysis (see Material and Methods Section 2.3.2) found significant differences in most sensory traits,these differences were relatively small (Table 4). Therefore, it is difficult to attribute consumers’preference to any particular trait scored by the trained panel.

Agronomy 2019, 9, 889 9 of 17
Table 4. Comparison of means of sensory traits for the accessions CF109 and CF106. Values within thesame column followed by the same letter are not significantly different at p ≤ 0.05 according to Tukey’smultiple comparison test.
Accession Odor 1 Flavor Seed-CoatPerception Mealiness Seed-Coat
Roughness Brightness % Whole Seedsafter Cooking
CF109 3.3 a 3.7 a 0.8 a 3.5 a 5.2 a 5.4 a 74.8 aCF106 2.5 b 3.5 a 1.6 b 4.7 b 6.0 b 6.7 b 62.0 a
1 All sensory traits were measured on a scale ranging from 0 (absence of the trait) to 10 (maximum expression ofthe trait).
The information from the farmers and the results of our trials during this first phase of the studyled to the following ideotype for Castellfollit beans: upright plant with partially or totally determinategrowth habit that is resistant to drought, root disease (especially Pythium sp., Fusarium oxysporum, andRhizoctonia sp.), and viruses (bean common mosaic virus), and that provide good yields. Moreover, alarge proportion of the seeds shape should be truncate to facilitate the identification of the landrace inthe marketplace (with not rounded ends; see the seeds of the right upper part of Figure 1). A highpercentage of the seeds should remain whole after cooking, and very low seed-coat perception, lowmealiness, and intense flavor characterize the cooked beans.
3.2. Selection
3.2.1. Individual
No plants with determinate growth habit were identified in the original populations of the landrace.Nevertheless, all of the selected lines had the maximum score for upright bearing. These plants showedconsiderable variability for the remaining agromorphological traits, being related to yield and seed sizeand shape (Table 5). Lines LCF420, with big seeds, and LCF109, with small seeds, had the best yields;there were no differences between these two inbreds in the shape of the seeds that were measuredby the quotient width/length. Inbred line LCF181, despite having a significantly lower yield than thetwo lines above, is interesting, because its seeds are easily distinguished (large projected area and size;Table 6) from those of the Navy commercial class [26], with which Castellfollit could be confused.
Table 5. Agromorphological traits of the inbred lines chosen by individual selection in the final trial ofthe program. Values within the same column followed by the same letter are not significantly differentat p ≤ 0.05 according to Tukey’s multiple comparison test.
Inbred Line Yield(g/plant)
100-Seed Weight(g)
Projected Area ofthe Seed (mm2)
SeedWidth/Length
LCF101 37.7 cd 31.5 ab 66.4 bcd 0.67 bLCF122 27.8 e 34.5 a 70.4 bcd 0.68 abLCF181 28.4 e 35.9 a 80.7 a 0.63 cLCF191 43.3 bc 26.5 b 58.1 d 0.67 bLCF420 52.6 a 37.7 a 73 ab 0.68 abLCF810 33.4 de 27.2 b 61.7 cd 0.68 abLCF109 47.0 ab 25.4 b 56.2 d 0.7 a
In the sensory traits (Table 6), the lines that were closest to the ideotype were LCF122, LCF181,LCF810, and LCF109. In the culinary trait, LCF420 was noteworthy, in a negative sense, because it hada low proportion of whole seeds after cooking.

Agronomy 2019, 9, 889 10 of 17
Table 6. Sensory and culinary traits of the inbred lines chosen by individual selection in the final trialof the program. Numbers within the same column followed by the same letter are not significantlydifferent at p ≤ 0.05 according to Tukey’s multiple comparison test.
InbredLine Odor 1 Flavor Seed-Coat
Perception Mealiness Seed-CoatRoughness Brightness % Whole Seeds
after Cooking
LCF101 4.9 a 5.7 abc 3.0 ab 4.7 a 4.9 b 6.5 a 77.5 aLCF122 5.1 a 6.5 a 1.3 cd 4.5 a 5.7 ab 6.0 ab 72.5 aLCF181 5.5 a 6.3 ab 2.1 bc 4.8 a 6.2 a 5.9 ab 65.7 abLCF191 4.7 a 5.2 bc 2.2 bc 3.9 a 5.2 ab 6.9 a 76.8 aLCF420 4.7 a 4.8 c 3.9 a 4.3 a 5.1 ab 6.7 a 46.6 bLCF810 4.6 a 6.3 ab 1.7 cd 4.0 a 6.0 ab 5.9 ab 68.2 abLCF109 4.5 a 6.2 ab 0.8 d 3.8 a 5.8 ab 5.2 b 78.6 a
1 All sensory traits were measured on a scale ranging from 0 (absence of the trait) to 10 (maximum expression ofthe trait).
The chemical composition of the cotyledon did not significantly differ between lines (Table 7,but there were some differences in the composition of the seed coat. The genotypes with the lowestvalues for Ca (LCF191) and Mg (LCF 109), indicators of low seed-coat perceptibility [27], overlappedwith other lines. Uronic acid, which is the other trait related with seed-coat perceptibility [27], did notsignificantly differ between the genotypes.
Table 7. Chemical components of the cotyledon and seed coat of the inbred lines used in the final trialof the individual selection program, expressed as g.kg−1. Values within the same column followed bythe same letter are not significantly different at p ≤ 0.05 according to Tukey’s multiple comparison test.
Cotyledon Seed Coat
InbredLine Starch Protein Amylose Apparent
Amylose Ash Ca Mg DietaryFiber P Uronic
Acid
LCF101 383.70 a 257.79 a 273.90 a 328.21 a 68.31 ab 18.33 b 3.40 ab 769.45 a 0.23 ab 128.49 aLCF122 397.89 a 248.34 a 301.91 a 328.84 a 74.17 ab 20.83 ab 3.29 abc 789.85 a 0.18 ab 125.27 aLCF181 362.76 a 284.96 a 273.58 a 312.09 a 65.66 b 17.01 b 3.18 bc 808.36 a 0.11 b 130.00 aLCF191 366.33 a 269.90 a 312.35 a 333.27 a 60.85 b 14.56 b 3.47 ab 817.60 a 0.30 a 125.79 aLCF420 386.60 a 260.40 a 289.85 a 328.22 a 76.58 ab 20.86 ab 3.32 abc 822.11 a 0.23 ab 123.45 aLCF810 388.20 a 251.48 a 282.00 a 330.35 a 71.68 ab 19.28 ab 3.72 a 804.95 a 0.21 ab 121.54 aLCF109 361.94 a 277.62 a 265.63 a 319.80 a 88.26 a 25.66 a 2.95 c 772.91 a 0.18 ab 122.26 a
In light of these results, future efforts will aim to multiply and cultivate inbred lines LCF109,LCF122, and LCF101; LCF181 has also been included because of the peculiar shape of its seeds.
3.2.2. Pedigree Selection
The main aim of the pedigree selection program was to obtain plants with a totally determinategrowth habit and upright bearing. All of the selected lines achieved this objective. On the other hand,these lines differed in most other traits. The line that most closely resembles LCF109, the control withindeterminate growth representative of Castellfollit material is LCF6091, which significantly differsin three of the eight traits; the other three lines significantly differ in four of the eight traits (Table 8).In general, the inbred line that has donated determinate growth habit and a degree of resistance todrought has conferred a less flat seed shape (smaller projected area), although three of the four linesstill have the elongated seeds that clearly differ from the more rounded seeds of Croscat (Table 8) thatare characteristic of the Navy commercial class [26].

Agronomy 2019, 9, 889 11 of 17
Table 8. Characteristics of the new inbred lines (S6) obtained in the pedigree selection program fromthe initial Castellfollit line and the Croscat line that donated the trait determinate growth habit. Valueswithin the same column followed by the same letter are not significantly different at p ≤ 0.05 accordingto Tukey’s multiple comparison test.
Inbred Days toFlowering
GeneralValue 1
Number ofPods/Plant
Pod Length(cm)
Yield(g/Plant)
100 SeedsWeight (g)
ProjectedArea of theSeed (mm2)
SeedWidth/length
LCF6001 49 b 2.9 a 62 bc 10.5 ab 56.4 b 23.4 c 46.2 b 0.67 bcLCF6012 57 c 1.8 b 60 c 10.9 a 65.1 ab 27.4 ab 48.6 b 0.67 bLCF6071 43 a 2.4 ab 67 b 10.8 a 67.9 ab 24.2 bc 47.2 b 0.66 bcLCF6091 43 a 2 ab 63 bc 10.9 a 63.1 b 25.5 abc 50.5 b 0.66 bcLCF109 46 ab 2.1 ab 61 c 10.3 ab 74.9 a 28.9 a 58.9 a 0.65 cCroscat 54 c 1.9 ab 76 a 9.7 b 71.3 ab 26.5 abc 45.9 b 0.73 a
1 Measured on a scale ranging from 0 (very poor) to 3 (very good).
Crossings with Croscat in the pedigree selection program also resulted in changes in sensory traits(Table 9). Mealiness decreased in lines LCF6071, LCF6001, and LCF6091. In general, the seed-coatroughness and brightness increased. No changes in aroma or flavor were detected. The most negativeresult of the pedigree selection program was a decrease in the percentage of seeds that remainedwhole after cooking (Table 9); this percentage was lower in all of the new lines than in the initialCastellfollit population, but still higher than in the line used to confer determinate growth habit, whereit is approximately 20% [16].
Table 9. Sensory and culinary traits of the new inbred lines (S6) with determinate growth habit obtainedthrough pedigree selection; of line LCF109, with indeterminate growth habit, representative of thehistoric landrace; and of line Croscat, used to confer determinate growth habit. Values within thesame column followed by the same letter are not significantly different at p ≤ 0.05 according to Tukey’smultiple comparison test.
Inbred Odor 1 Flavor Seed-CoatPerception Mealiness Seed-Coat
Roughness Brightness % Whole Seedsafter Cooking
LCF6001 4.4 a 5.6 a 1.2 ab 2.3 b 7.1 a 7.3 a 50 bLCF6012 4.7 a 4.4 b 2.0 a 2.9 ab 6.7 b 6.6 ab 62 bLCF6071 4.5 a 5.6 a 1.2 ab 2.4 b 7.2 a 7.3 a 58 bLCF6091 4.6 a 5.5 a 1.3 ab 2.3 b 7.3 a 7.2 a 60 bLCF109 4.4 a 5.1 ab 0.9 b 3.3 a 4.7 c 4.7 c 91 aCroscat 4.1 b 6.2 c 2.1 a 3.8 a 4.6 c 3.1 d 18 c
1 All sensory traits were measured on a scale ranging from 0 (absence of the trait) to 10 (maximum expression ofthe trait).
We have decided to multiply the four lines and distribute them to farmers to observe theirbehavior over several seasons and to gauge consumers’ opinions, since the differences in the sensoryand culinary traits between the new lines are small and the differences in agromorphological traitsindicate considerable variability.
3.2.3. The Selected Germplasm
We performed a PCA analysis to evaluate the relationships among the different materials afterselection and breeding with the scores of the seven lines coming from the individual selection program(Tables 5–7), the four lines of the pedigree selection, and Croscat (Tables 8 and 9) (Figure 3). Beforeprocessing, data were divided by the value of LCF109, present in both experiments, to lower the effectsof environmental factors.
The cumulative variation was explained by the first two axes was 71,23% (Figure 3). The traitsthat best correlated with the first axis were projected area and 100 seeds weight (R = 0.95 and R = 0.90,respectively), and width/length (R = −0.85). With the second axis the highest correlations were those ofbrightness (R = 0.77), seed-coat roughness (R = 0.59), intensity of odor (R = 0.56), and yield (R = −0.55).Croscat, which is the donor of the determinate growth, has the most extreme position and it is clearly
Agronomy 2019, 9, 889 12 of 17
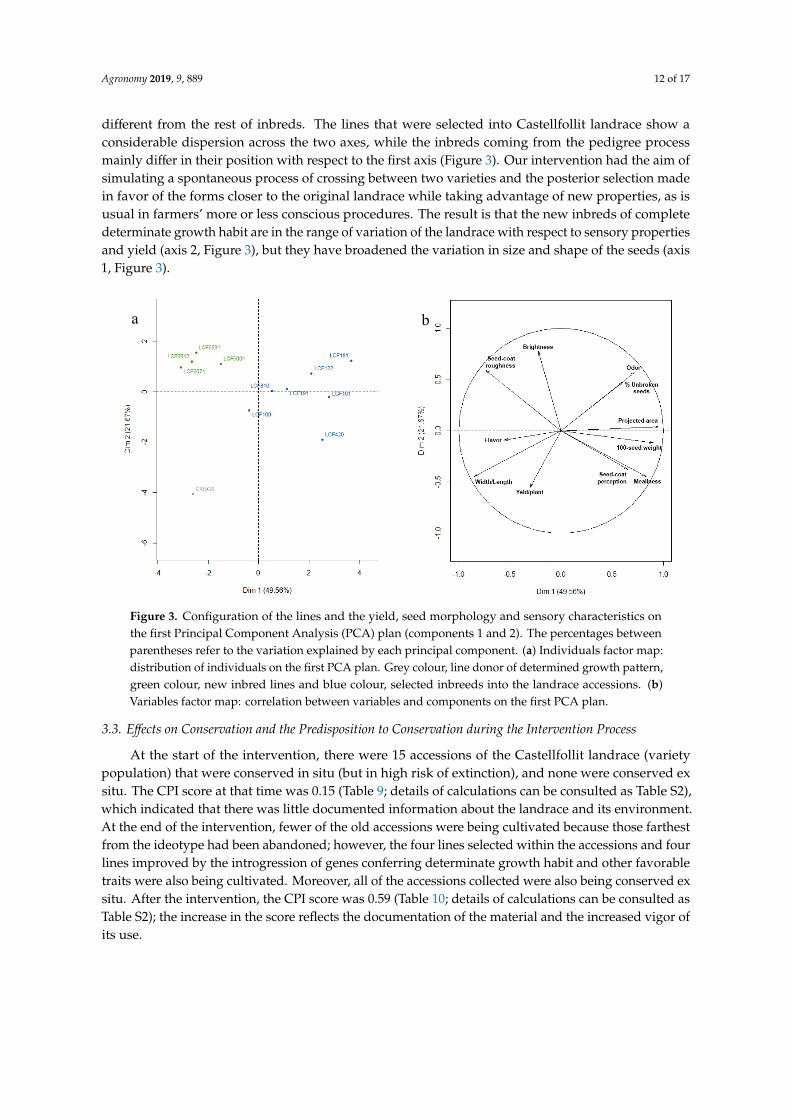
different from the rest of inbreds. The lines that were selected into Castellfollit landrace show aconsiderable dispersion across the two axes, while the inbreds coming from the pedigree processmainly differ in their position with respect to the first axis (Figure 3). Our intervention had the aim ofsimulating a spontaneous process of crossing between two varieties and the posterior selection madein favor of the forms closer to the original landrace while taking advantage of new properties, as isusual in farmers’ more or less conscious procedures. The result is that the new inbreds of completedeterminate growth habit are in the range of variation of the landrace with respect to sensory propertiesand yield (axis 2, Figure 3), but they have broadened the variation in size and shape of the seeds (axis1, Figure 3).Agronomy 2019, 9, x FOR PEER REVIEW 12 of 18
Figure 3. Configuration of the lines and the yield, seed morphology and sensory characteristics on the first Principal Component Analysis (PCA) plan (components 1 and 2). The percentages between parentheses refer to the variation explained by each principal component. (a) Individuals factor map: distribution of individuals on the first PCA plan. Grey colour, line donor of determined growth pattern, green colour, new inbred lines and blue colour, selected inbreeds into the landrace accessions. (b) Variables factor map: correlation between variables and components on the first PCA plan.
The cumulative variation was explained by the first two axes was 71,23% (Figure 3). The traits that best correlated with the first axis were projected area and 100 seeds weight (R = 0.95 and R = 0.90, respectively), and width/length (R = −0.85). With the second axis the highest correlations were those of brightness (R = 0.77), seed-coat roughness (R = 0.59), intensity of odor (R = 0.56), and yield (R = −0.55). Croscat, which is the donor of the determinate growth, has the most extreme position and it is clearly different from the rest of inbreds. The lines that were selected into Castellfollit landrace show a considerable dispersion across the two axes, while the inbreds coming from the pedigree process mainly differ in their position with respect to the first axis (Figure 3). Our intervention had the aim of simulating a spontaneous process of crossing between two varieties and the posterior selection made in favor of the forms closer to the original landrace while taking advantage of new properties, as is usual in farmers’ more or less conscious procedures. The result is that the new inbreds of complete determinate growth habit are in the range of variation of the landrace with respect to sensory properties and yield (axis 2, Figure 3), but they have broadened the variation in size and shape of the seeds (axis 1, Figure 3).
3.3. Effects on Conservation and the Predisposition to Conservation during the Intervention Process
At the start of the intervention, there were 15 accessions of the Castellfollit landrace (variety population) that were conserved in situ (but in high risk of extinction), and none were conserved ex situ. The CPI score at that time was 0.15 (Table 9; details of calculations can be consulted as Table S2), which indicated that there was little documented information about the landrace and its environment. At the end of the intervention, fewer of the old accessions were being cultivated because those farthest from the ideotype had been abandoned; however, the four lines selected within the accessions and four lines improved by the introgression of genes conferring determinate growth habit and other favorable traits were also being cultivated. Moreover, all of the accessions collected were also being conserved ex situ. After the intervention, the CPI score was 0.59 (Table 10; details of calculations can be consulted as Table S2); the increase in the score reflects the documentation of the material and the increased vigor of its use.
a b
Figure 3. Configuration of the lines and the yield, seed morphology and sensory characteristics onthe first Principal Component Analysis (PCA) plan (components 1 and 2). The percentages betweenparentheses refer to the variation explained by each principal component. (a) Individuals factor map:distribution of individuals on the first PCA plan. Grey colour, line donor of determined growth pattern,green colour, new inbred lines and blue colour, selected inbreeds into the landrace accessions. (b)Variables factor map: correlation between variables and components on the first PCA plan.
3.3. Effects on Conservation and the Predisposition to Conservation during the Intervention Process
At the start of the intervention, there were 15 accessions of the Castellfollit landrace (varietypopulation) that were conserved in situ (but in high risk of extinction), and none were conserved exsitu. The CPI score at that time was 0.15 (Table 9; details of calculations can be consulted as Table S2),which indicated that there was little documented information about the landrace and its environment.At the end of the intervention, fewer of the old accessions were being cultivated because those farthestfrom the ideotype had been abandoned; however, the four lines selected within the accessions and fourlines improved by the introgression of genes conferring determinate growth habit and other favorabletraits were also being cultivated. Moreover, all of the accessions collected were also being conserved exsitu. After the intervention, the CPI score was 0.59 (Table 10; details of calculations can be consulted asTable S2); the increase in the score reflects the documentation of the material and the increased vigor ofits use.
Agronomy 2019, 9, 889 13 of 17
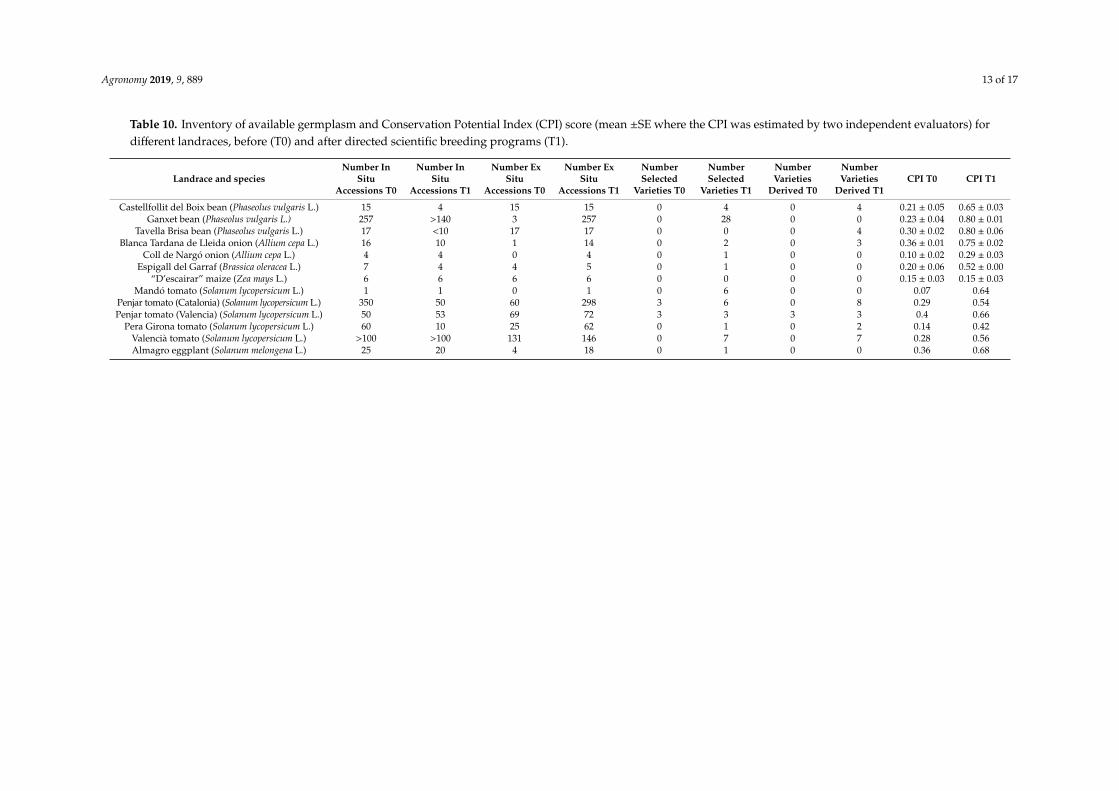
Table 10. Inventory of available germplasm and Conservation Potential Index (CPI) score (mean ±SE where the CPI was estimated by two independent evaluators) fordifferent landraces, before (T0) and after directed scientific breeding programs (T1).
Landrace and speciesNumber In
SituAccessions T0
Number InSitu
Accessions T1
Number ExSitu
Accessions T0
Number ExSitu
Accessions T1
NumberSelected
Varieties T0
NumberSelected
Varieties T1
NumberVarieties
Derived T0
NumberVarieties
Derived T1CPI T0 CPI T1
Castellfollit del Boix bean (Phaseolus vulgaris L.) 15 4 15 15 0 4 0 4 0.21 ± 0.05 0.65 ± 0.03Ganxet bean (Phaseolus vulgaris L.) 257 >140 3 257 0 28 0 0 0.23 ± 0.04 0.80 ± 0.01
Tavella Brisa bean (Phaseolus vulgaris L.) 17 <10 17 17 0 0 0 4 0.30 ± 0.02 0.80 ± 0.06Blanca Tardana de Lleida onion (Allium cepa L.) 16 10 1 14 0 2 0 3 0.36 ± 0.01 0.75 ± 0.02
Coll de Nargó onion (Allium cepa L.) 4 4 0 4 0 1 0 0 0.10 ± 0.02 0.29 ± 0.03Espigall del Garraf (Brassica oleracea L.) 7 4 4 5 0 1 0 0 0.20 ± 0.06 0.52 ± 0.00
“D’escairar” maize (Zea mays L.) 6 6 6 6 0 0 0 0 0.15 ± 0.03 0.15 ± 0.03Mandó tomato (Solanum lycopersicum L.) 1 1 0 1 0 6 0 0 0.07 0.64
Penjar tomato (Catalonia) (Solanum lycopersicum L.) 350 50 60 298 3 6 0 8 0.29 0.54Penjar tomato (Valencia) (Solanum lycopersicum L.) 50 53 69 72 3 3 3 3 0.4 0.66
Pera Girona tomato (Solanum lycopersicum L.) 60 10 25 62 0 1 0 2 0.14 0.42Valencià tomato (Solanum lycopersicum L.) >100 >100 131 146 0 7 0 7 0.28 0.56Almagro eggplant (Solanum melongena L.) 25 20 4 18 0 1 0 0 0.36 0.68

Agronomy 2019, 9, 889 14 of 17
We calculated the CPI for 13 other landraces of diverse species that our team has worked with(Table 10; details of calculations can be consulted as Table S2). One of these (maize “d’escairar”, usedto make soups) was included, because the only activities to date have been collecting accessions andsome local promotion, but no other efforts to characterize the landrace have been undertaken. In theremaining cases, the CPI score ranged from 0.07 to 0.36 before intervention and from 0.29 to 0.80 afterthe intervention. The lowest initial CPI score was for the Mandó tomato, a landrace about which verylittle information had been documented when we started to work with it. The highest final CPI scorewas for the Ganxet and Tavella Brisa landraces of common beans, which our team has been researching,breeding, and promoting for 25 years and 20 years, respectively.
In each case, one or two researchers working with each landrace were asked to quickly assess theitems in the CPI based on their knowledge; in fact, on average calculating the CPI only took 10 min.Despite the inevitable risk of error related to the personal bias of the estimations, in the cases wheretwo independent assessors calculated the CPI for a landrace, the results were very similar (Table 10),which suggested the confirmation of the hypothesis proposed in the material and methods section thatthe deviations of all the items would add up to zero. Without doubt, in its present form, the indexis far from achieving the efficiency and predictive capacity of established indices for cardiovascularrisk [28], diet quality [29], or food safety [30], but it might be a starting point for further development.
Disregarding the above-mentioned case of maize “d’escairar”, the CPI score increases duringthe intervention, but this increase is not linear (mean correlation coefficient between the two series[excluding the maize landrace], R = 0.54, nearly significant at p < 0.05). The differences among thesituations of the landraces before the intervention, in the time between T0 and T1, in the investmentsin each case, etc. could explain the differences among cases.
It is also noteworthy that the CPI scores are independent of the number of accessions conservedin situ and/or ex situ (correlation coefficient between the CPI and the number of accessions conservedex situ after the intervention, R = 0.21, not significant at p < 0.05). This is important, because theobjective of the CPI is to complement the information that is obtained in a simple inventory of theresources conserved.
4. Discussion
At the start of this intervention in the Castellfollit bean, the cultivation of the landrace hadsubstantially decreased, despite the greater ease of cultivating large fields of beans facilitated bymechanization and the presence of a market demand that exceeded the supply. It seems paradoxical thatthe dilution of the autochthonous seed with improved materials, mainly by spontaneous crossings withGreat Northern [7], combined with increased capacity to transform fields leading to the abandonmentof traditional methods of production in an ecosystem that was very fragile, due to a lack of water, ledto the near disappearance of the cultivation of dry beans in the area of Castellfollit del Boix due todecreasing yields.
The project to recover and improve the Castellfollit landrace has enabled us to collect, characterize,multiply, and conserve the historic material. We assessed farmers’ needs and consumers’ preferences,which were obtained inbred lines within the historic material, and introduced genes that favormanagement and avoid yield loses while keeping modifications to the sensory profile to a minimum.It is true that we have not limited our genetic intervention to the introduction of a single gene to conferdeterminate the growth habit through backcrossing, so the new varieties with determinate growthhabit probably have a considerable number of genes from the donors’ genome. Nevertheless, thissituation is not unlike the process that has occurred throughout history in landraces through fortuitouscrossings with other varieties [31,32]. We selected the crossings with determinate growth that gave thehighest yields of seeds most similar to the historical variety, analogously to what farmers have alwaysdone (selecting the plants whose appearance they found most interesting from the appearance of thesefortuitous hybrids and continuing this process until they obtained totally homozygous materials).We are also aware that the number of accessions and plants involved in the selection programs is

Agronomy 2019, 9, 889 15 of 17
limited, but this kind of interventions must reach a consensus between effectiveness and funding, asthe application of the results cover a limited geographical area. Nevertheless, the results show thateven dealing with a reduced sample of the variability significant progress is possible.
Throughout this process, we also documented the epiphenotype of the landrace, and proposedmethods of cultivation that respected the traditional values while combining them with moderntechniques [24]. We also rejected the currently very common, inefficient practice of cultivation inshallow fields, which is acceptable for cereals, but not for beans. Finally, the farmers now have all thetools that are necessary to apply for a quality label, such as a protected denomination of origin (PDO)from the European Union [33].
All of the changes brought about in the intervention have been used to develop an index thatquantifies the aspects that our experience tells us favors the conservation of landraces. We consider itto be especially important that the proposed index takes the information collected about a landrace andthe efforts to promote it into account, because information regarding the germplasm is fundamentalfor fomenting its use and thus for its conservation [10,34].
When comparing both the conservation of the landrace and its derivatives before and after theprocess and comparing the CPI scores at the two points in time indicate that the prospects for conservingthe landrace have improved, as has also occurred in other species and situations in which our teamhas intervened. In every case, the interventions have had a very positive effect on the conservationof the landraces and aspects that are related to their use. The proposed CPI has proven to be easy tocalculate and useful in explaining the state of conservation of landraces, complementing simple dataregarding the number of accessions conserved in situ and ex situ and diversity indices derived fromthese data [35,36]. The simplicity with which a person who knows the landrace and its environmentcan calculate the CPI score makes it, together with the list of accessions, especially appropriate forevaluating the achievements of interventions to conserve plant genetic resources.
Our projects have shown us that landraces lose ground, because it is difficult for them to competewith improved materials, mostly because of their low response to the more intensive cultivationmethods that have become generalized. This is fundamentally a matter of objectives, because theresults favor biodiversity when the goal is to improve the materials in a specific environment ratherthan in a generalized environment [37]. Scientific breeding of landraces, which should be the naturalevolution of these varieties in the twenty-first century [5], normally involves collecting materials andcharacterizing them, followed by selection within the collected materials, sometimes incorporatinggenes from crop wild relatives or other cultivated varieties, a process that significantly increases thegenetic variability of the materials. As a result, the ex situ conservation of the previously characterized(often from many points of view) material is ensured, and new variants that are adapted to diverseconditions can be obtained. The number of varieties that have evolved from initial populations dependson the diversity of environments in the area of cultivation and the intended uses for the obtainedvarieties. The more microenvironments there are, the more it makes sense to develop many varieties.It is evident that we can use our knowledge of genetics and agronomy to recover some of the diversityand wealth of traditional varieties that arose before the advent of scientific crop management and tomake these varieties competitive if we opt for low-input crops for a sustainable agriculture [38,39].Thus, restoring diversity is mainly a matter of appreciating environmental diversity; in this way, wecan save and even expand genetic diversity. We can achieve new varieties that are adapted to localconditions very quickly by applying our knowledge of the genome. Perhaps by refocusing the aims ofbreeding programs, we can transform what Louwaars [1] aptly describes as “troubled relationships”between plant breeding and diversity into a true friendship.
Supplementary Materials: The following are available online at http://www.mdpi.com/2073-4395/9/12/889/s1,Table S1: Edaphic characteristics of the fields in the area of Castellfollit del Boix, estimated from samples obtainedat 8 representative sites where the bean landrace is cultivated. Table S2: Detail of the calculation of the indexesappearing in Table 10.

Agronomy 2019, 9, 889 16 of 17
Author Contributions: Conceptualization, A.R. (Ana Rivera), J.C., F.C., J.P., M.J.D. and J.S. (Joan Simó);methodology, A.R. (Ana Rivera), A.R. (Aurora Rull), S.S. (Salvador Soler) and J.S. (Josep Sabaté); validation, F.C.,J.C., J.S. (Joan Simó) and S.S. (Salvador Soler); investigation, A.R. (Aurora Rull), R.R.D.C., A.R. (Ana Rivera) andS.S. (Silvia Sans); resources, J.S. (Joan Simó) and J.C.; data curation, A.R. (Ana Rivera), A.R. (Aurora Rull), S.S.(Silvia Sans) and J.S. (Josep Sabaté) and R.R.D.C.; writing—original draft preparation, F.C.; writing—review andediting, A.R. (Ana Rivera), J.C. and J.S. (Joan Simó); supervision, J.P. and M.J.D.; funding acquisition, J.C.
Funding: This research was funded by Ajuntament de Castellfollit del Boix, Consell Comarcal del Bages andDiputació de Barcelona.
Acknowledgments: Agrupació de productors de Mongeta de Castellfollit del Boix, and the members of thesensory panel.
Conflicts of Interest: The authors declare no conflict of interest. The funders had no role in the design of thestudy; in the collection, analyses, or interpretation of data; in the writing of the manuscript, or in the decision topublish the results.
References
1. Louwaars, N.P. Plant breeding and diversity: A troubled relationship? Euphytica 2018, 214, 114–123.[CrossRef] [PubMed]
2. Borlaug, N.E. The green revolution revisited and the road ahead. In Proceedings of the Special 30thAnniversary Lecture, Oslo, Norway, 8 September 2000.
3. Gollin, D.; Morris, M.; Ekbyerlee, A. Technology adoption in intensive post-green revolution systems. Am. J.Agric. Econ. 2005, 87, 1310–1316. [CrossRef]
4. Stout, J. Handbook of Energy for World Agriculture; Elsevier: New York, NY, USA, 1990.5. Casañas, F.; Simó, J.; Casals, J.; Prohens, J. Towards an evolved concept of landrace. Front. Plant Sci. 2017, 8,
145. [CrossRef] [PubMed]6. FAO. The Second Report on the State of the World’s Plant Genetic Resources for Food and Agriculture; FAO: Rome,
Italy, 2010.7. Sánchez, E.; Sifres, A.; Casañas, F.; Nuez, F. Common bean (Phaseolus vulgaris L.) landraces in Catalonia, a
Mesoamerican germplasm hotspot to be preserved. J. Hortic. Sci. Biotech. 2007, 82, 529–534. [CrossRef]8. Young, A. Tour in Catalonia. In Annals of Agriculture and Other Useful Arts; Arthur Young: London, UK, 1787.9. Singh, S.P. A key for identification of different growth habits of Phaseolus vulgaris L. Annu. Rep. Bean Improv.
Coop. 1982, 25, 92–95.10. Díez, M.J.; de la Rosa, L.; Martín, I.; Guasch, L.; Cartea, M.E.; Mallor, C.; Casals, J.; Simó, J.; Rivera, A.;
Anastasio, G.; et al. Plant Genebanks: Present Situation and Proposals for Their Improvement. The Case ofthe Spanish Network. Front. Plant Sci. 2018, 9, 1794. [CrossRef]
11. ISO. 8589 Sensory Analysis—General Guidance for the Design of Test Rooms; International Organization forStandardization: Génève, Switzerland, 2007.
12. Romero del Castillo, R.; Costell, E.; Plans, M.; Simó, J.; Casañas, F. A standardized method of preparingcommon beans (Phaseolus vulgaris L.) for sensory analysis. J. Sens. Stud. 2012, 27, 188–195. [CrossRef]
13. Romero del Castillo, R.; Valero, J.; Casañas, F.; Costell, E. Training, validation and maintenance of a panel toevaluate the texture of dry beans (Phaseolus vulgaris L.). J. Sens. Stud. 2008, 23, 303–319. [CrossRef]
14. Meilgaard, M.C.; Civille, G.V.; Carr, B.T. Sensory Evaluation Techniques, 4th ed.; CRC Press: Boca Raton, FL,USA, 2007.
15. Dawson, J.C.; Murphy, K.M.; Jones, S. Decentralized selection and participatory approaches in plant breedingfor low-input systems. Euphytica 2008, 160, 143–154. [CrossRef]
16. Almirall, A.; Bosch, L.; Romero del Castillo, R.; Rivera, A.; Casañas, F. ‘Croscat’ common bean (Phaseolusvulgaris L.), a prototypical cultivar within the ‘Tavella Brisa’ type. HortScience 2010, 45, 432–433. [CrossRef]
17. Plans, M.; Simó, J.; Casañas, F.; Sabaté, J. Near-infrared spectroscopy analysis of seed coats of common beans(Phaseolus vulgaris L.): A potential tool for breeding and quality evaluation. J. Agric. Food Chem. 2012, 60,706–712. [CrossRef] [PubMed]
18. Plans, M.; Simó, J.; Casañas, F.; Romero del Castillo, R.; Rodriguez-Saona, L.E.; Sabaté, J. Estimating sensoryproperties of common beans (Phaseolus vulgaris L.) by near infrared spectroscopy. Food Res. Int. 2014, 56,55–62. [CrossRef]

Agronomy 2019, 9, 889 17 of 17
19. Coyne, D.P. Photoperiodism: Inheritance and linkage studies in Phaseolus vulgaris. J. Hered. 1967, 58,313–314. [CrossRef]
20. Koinange, E.M.K.; Singh, S.P.; Gepts, P. Genetic control of the domestication syndrome in common-bean.Crop Sci. 1996, 36, 1037–1145. [CrossRef]
21. O’Mahony, M. Sensory Evaluation of Food. In Statistical Methods and Procedures; Marcel Dekker: New York,NY, USA, 1986.
22. R Development Core Team. R: A Language and Environment for Statistical Computing; R Foundation forStatistical Computing: Vienna, Austria, 2010.
23. Mendiburu, F. Agricolae: Statistical Procedures for Agricultural Research; R Package Version 1.0–9; R Foundationfor Statistical Computing: Vienna, Austria, 2010.
24. FMA. Manual de bones pràctiques. Mongeta de Castellfollit del Boix. 2019. Available online:http://fundaciomiquelagusti.com/es/2017/03/04/projecte-de-recuperacio-i-millora-genetica-de-la-mongeta-de-castellfollit-del-boix/ (accessed on 20 October 2019).
25. Sans, S.; Casals, J.; Simó, J. Improving the Commercial Value of the ‘Calçot’ (Allium cepa L.) Landrace:Influence of Genetic and Environmental Factors in Chemical Composition and Sensory Attributes. Front.Plant Sci. 2018, 9, 1465. [CrossRef] [PubMed]
26. Santalla, M.; de Ron, A.M.; Voysest, O. European Bean Market Classes. In Catalogue of Bean Genetic Resources;Amurrio, M., Santalla, M., de Ron, A.M., Eds.; PHASELIEUFAIRPL97-3463-MBG-CSIC; Fundación PedroBarrié de la Maza: Pontevedra, Spain, 2001; pp. 79–94.
27. Casañas, F.; Pujolà, M.; Romero del Castillo, R.R.; Almirall, A.; Sánchez, E.; Nuez, F. Variability in sometexture characteristics and chemical composition of common beans (Phaseolus vulgaris L.). J. Sci. Food Agric.2006, 86, 2445–2449. [CrossRef]
28. De la Iglesia, B.; Potter, J.F.; Poulter, N.R.; Robins, M.M.; Skinner, J. Performance of the ASSIGN cardiovasculardisease risk score on a UK cohort of patients from general practice. Heart 2011, 97, 491–499. [CrossRef]
29. Kant, A.K. Indexes of overall diet quality: A review. J. Am. Diet. Assoc. 1996, 8, 85–791.30. Ross, T.; Summer, J. A simple, spreadsheet-based, food safety risk assessment tool. Int. J. Food Microbiol.
2002, 77, 39–53. [CrossRef]31. Bitocchi, E.; Nanni, L.; Rossi, M.; Rau, D.; Bellucci, E.; Giardini, A.; Buonamici, A.; Vendramin, G.G.; Papa, R.
Introgression from modern hybrid varieties into landrace populations of maize (Zea mays ssp. mays L. incentral Italy. Mol. Ecol. 2009, 18, 603–621. [CrossRef]
32. Van Heerwaarden, J.; Doebley, J.; Briggs, W.H.; Glaubitz, J.C.; Goodman, M.M.; Sanchez Gonzalez, J.J.;Ross-Ibarra, J. Genetic signals of origin, spread, and introgression in a large sample of maize landraces. Proc.Natl. Acad. Sci. USA 2011, 108, 1088–1092. [CrossRef] [PubMed]
33. European Union. Regulation No 1151/2012 of the European Parliament and of the Council of 21 November2012 on quality schemes for agricultural products and foodstuffs. Off. J. Eur. Union 2012, 14, 12.
34. Prada, D. Molecular population genetics and agronomic alleles in seed banks: Searching for a needle in ahaystack? J. Exp. Bot. 2009, 60, 2541–2552. [CrossRef] [PubMed]
35. Shannon, C.E.; Weaver, W. The Mathematical Theory of Communication; University Illinois Press: Urbana, IL,USA, 1963.
36. Nei, M. Analysis of gene diversity in subdivided populations. Proc. Natl. Acad. Sci. USA 1973, 70, 3321–3323.[CrossRef]
37. Witcombe, J.R.; Joshi, A.; Joshi, K.D.; Sthapit, B.R. Farmer participatory crop improvement. I. Varietalselection and breeding methods and their impact on biodiversity. Exp. Agric. 1996, 32, 445–460. [CrossRef]
38. Pimentel, D.; Culliney, T.W.; Buttler, I.W.; Reinemann, D.J.; Beckman, K.B. Low-input sustainable agricultureusing ecological management practices. Agric. Ecosyst. Environ. 1989, 27, 3–24. [CrossRef]
39. Lammerts van Bueren, E.T.; Østergård, H.; Goldringer, I.; Scholten, O. Plant breeding for organic andsustainable, low-input agriculture: Dealing with genotype–environment interactions. Euphytica 2008, 163,321–322. [CrossRef]
© 2019 by the authors. Licensee MDPI, Basel, Switzerland. This article is an open accessarticle distributed under the terms and conditions of the Creative Commons Attribution(CC BY) license (http://creativecommons.org/licenses/by/4.0/).