Embed Size (px)
Citation preview
1 /// Income volatility and health care decision-making
Income volatility and
health care decision-
making ______________________________________________________ Mina Addo Mina Addo is PhD Research Fellow at the University of Pennsylvania School of Social Policy and Practice.
Lisa Servon Lisa Servon is the Kevin and Erica Penn Presidential Professor and Chair of City and Regional Planning at
the University of Pennsylvania.
This report is available online at: https://www.brookings.edu/research/ income-volatility-and-healthcare-decision-making/
The Brookings Economic Studies program analyzes current and emerging economic issues facing the United States and the
world, focusing on ideas to achieve broad-based economic
growth, a strong labor market, sound fiscal and monetary policy, and economic opportunity and social mobility. The
research aims to increase understanding of how the economy
works and what can be done to make it work better.
May 2021
2 /// Income volatility and health care decision-making
ABSTRACT
Income volatility has been rising since the 1970s and reflects a decline in economic security among middle- and low-income households. Half of all American adults are affected by chronic illness, and 40 percent of adults who have health insurance have difficulty paying for medical care (Claxton et al., 2017). Considering these trends together, this study explored characteristics of households that experience income volatility and medical expenses, how they pay for health care, the extent to which technology (including fintech) can be a solution to their challenges, and factors influencing their health care decision-making.
KEY FINDINGS
• The study population has some economic and social advantages but is also showing signs of financial precarity.
• The study population included prime working age adults (aged 27 through 55), was primarily female (79% female, 21% male), highly educated (more than half had at least a BA/4-year college degree), racially diverse (70% non-white, 30% white), median income of $60,000.
• More than half of the sample depended on multiple income sources to make ends meet. Income volatility stemmed from changes to secondary income sources. Income volatility can be both an indicator of and response to economic insecurity when workers depend on multiple income streams to supplement insufficient wages from a primary job.
• Most were familiar with fintech (such as banking, budgeting, and credit monitoring apps) but did not see it as a solution to fundamental financial challenges they faced.
• The majority of the study population had health insurance, and more than three quarters had employer sponsored plans. But health insurance was not enough to make health care affordable, beyond primary care or preventive services.
• Health insurance was a source of uncertainty in health care decision-making. Some participants opted to skip or delay care due to cost, or when they couldn’t anticipate the cost of treatment.
• Overall, the results show a need for higher wages and affordable comprehensive health benefits to ensure access to care beyond primary care and preventive services.
ACKNOWLEDGEMENTS
This work was funded by the Brookings Institution and Filene Research Institute. We are grateful to Tim Lucas and Xiao Bi at SaverLife for partnering with us on this study, and to the SaverLife members who were generous with their time and willingness to share their experiences with the research team. The authors thank reviewers who have provided comments on previous drafts.
CONFLICT OF INTEREST DISCLOSURE
The authors did not receive financial support from any firm or person for this article or from any firm or
person with a financial or political interest in this article. They are currently not an officer, director, or
board member of any organization with an interest in this article.
3 /// Income volatility and health care decision-making
Background
The erosion of economic security for workers over the past four decades has been well-documented (Benach et al., 2014; Hacker & Jacobs, 2008). Three primary indicators of this trend are declining wages, the erosion of benefits from private sector jobs, and rising income volatility. This study focuses on income volatility among U.S. households, which has been rising since the 1970s. Rising income volatility affects household financial health and can make it difficult for families to meet their basic needs such as food, housing, and medical care (Hannagan & Morduch, 2015; Larrimore, Durante, Park, & Tranfaglia, 2017). Income volatility, defined as month to month income changes above or below average monthly earnings, poses a specific challenge to health care access (Aspen Institute, 2016). Although existing research documents health care affordability challenges among uninsured and underinsured populations, the role of income volatility in households’ ability to access health care has received less attention. Nearly 60 percent of Americans indicate that they or someone in their immediate family is affected by a chronic health condition that requires ongoing medical treatment (Kirzinger, Munana, & Brodie, 2018). Among those with a chronic condition, 35 percent report having trouble paying medical bills (Kirzinger et al., 2018). A recent survey conducted by the Kaiser Family Foundation and the Los Angeles Times found that 40 percent of non-elderly adults with employer-based health insurance had difficulty paying medical bills, and nearly half indicated that they or a family member skipped or postponed health care in the past year due to cost (Claxton et al., 2017). Financial technology or “fintech” plays an increasing role in consumer financial services. Partnerships between fintech entrepreneurs and research organizations have the potential to address challenges resulting from income volatility such as difficulty saving and tracking fluctuating income and expenses (De La Rosa & Chen, 2017; Urbane Development, 2018). If fintech has the potential to help consumers stabilize volatile income and plan for expenses, consumers may face a broader set of health care options. Conversely, income volatility may preclude consumers from taking advantage of fintech or other technology-based solutions designed to address financial insecurity and, in turn, limit their health care options. This study explores the experiences of households affected by income volatility, decision-making regarding medical care, and the extent to which fintech, or other technologies, are a factor in their health care access and decision-making. We sought to better understand the relationship between volatile income and health care expenses. It also explores solutions with the potential to improve access to health care. We interviewed 33 adults who had experienced income volatility in the past year and found that many struggled to afford health care, even when they were college educated, had relatively high incomes, and had health insurance. We argue that fintech may be able to make a difference at the margins, but other measures, including consumer protection, higher wages, and universal access to health care are required in order to ensure that Americans get the health care they need.
Income volatility trends
Existing studies show rising income volatility over the past four decades. Annual income volatility has increased by at least one-third since the 1970s (Dynan et al., 2012; Ziliak, Hardy, & Bollinger, 2011). Using the Panel Study of Income Dynamics (PSID), a 2015 study by Pew Charitable Trusts found that between 1979 and 2011, nearly half of all households experienced an income loss or gain of 25 percent or more (Currier et al., 2015). There is evidence that the pattern has continued; more than one-third of households had an income change of 25 percent or more between 2014 and 2015 (Elmi, Currier, & Key, 2017). Year to year volatility studies illuminate trends but miss income changes that occur within the year. Existing studies also document month-to-month volatility. The JP Morgan Chase Institute that families experience have five months out of the year when income spikes or dips (Farrell, Greig, & Yu, 2019). Consistent with that finding, The Financial Diaries tracked income and expenses among more than 230 low- and moderate-income households for one year and found that on average, households experienced
4 /// Income volatility and health care decision-making
five months when income increased or decreased by 25 percent or more (Morduch & Schneider, 2019). This pattern was true across low- and moderate-income households. Different studies reach slightly different conclusions about the share of Americans who experience income volatility. The JP Morgan Chase Institute found that 41 percent of individuals experience more than a 30 percent change in income on a month-to-month basis (Farrell et al., 2019). The FDIC Survey of Household Use of Banking and Financial Services found that in 2019, roughly 22 percent of respondents experienced income volatility, defined as having income that varied “somewhat” or “a lot” from month to month, a slight increase from about 20 percent in 2017 (Kutzbach, Lloro, & Weinstein, 2020). The 2019 Federal Reserve Study on Household Wellbeing estimates that 3 in 10 households experience month-to-month income volatility sometimes or often, roughly the same share as reported in the 2017 study (Durante & Chen, 2019; Larrimore et al., 2017). Differences between these findings are likely related to the study sample for each. While the FDIC and Federal Reserve studies rely on a nationally representative sample of U.S. residents, the JP Morgan Chase Institute sample included a random sample of individuals with active checking accounts between 2012 and 2015 (Farrell et al., 2019). Income volatility is more pronounced among some groups (low-income households, households headed by individuals with lower education attainment, and households headed by a person of color). The Federal Reserve Board Study of Household Economic Well-Being found that 60 percent of Black and 59 percent of Hispanic respondents indicated their monthly income was stable, compared to 70 percent of white respondents (Larrimore, 2016). Similarly, Pew Charitable Trusts found that households headed by a person who identified as Black, Hispanic, or “other race” were more likely to report income gains or losses within the year compared to the overall study population (Elmi et al., 2017). The same study found that low-income households, earning less than $25,000 per year, and households headed by a single adult were more likely to report volatility (Elmi et al., 2017). Some income volatility is expected, such as receiving an annual tax refund or in months where there are five Fridays, and workers receive an extra paycheck. The effects of income volatility vary, and some groups are more likely than others to experience negative consequences stemming from volatility. The Federal Reserve Board survey found that 40 percent of respondents that experienced income volatility had trouble paying their bills at least once due to income volatility, and more Black (19 percent) and Hispanic (18 percent) respondents had trouble paying their bills when income fluctuated than their white counterparts (11 percent) (Larrimore, 2016). Wolf et al. (2014) found that low- to moderate-income households whose budgets are already stretched were more likely to face (Wolf, Gennetian, Morris, & Hill, 2014). The data show rising income volatility over the past four decades, including within year fluctuation. Low-income households and those headed by a person of color are more likely to experience negative consequences of volatility. However, there is evidence that middle-income households experience similar patterns of income spikes and dips. Given the prevalence of chronic illness among U.S. adults, this study examined the relationship between volatile income, health care spending, and health care decision-making.
Research methods This study was conducted in partnership with SaverLife, a non-profit fintech organization that promotes prosperity for working families by helping them save and invest in their futures. We sought a sample of prime working age individuals who experienced month-to-month income volatility and could speak to their experiences managing ups and downs in income and expenses, and how these fluctuations affected their health care decisions. Prime working age adults includes works between age 25 and 54. The U.S. Census Bureau reports educational attainment for people age twenty-five and older, therefore the minimum age was selected in order to make observations about education (McElrath & Martin, 2021). The age limit for this study was extended beyond the upper limit of BLS’ definition of prime working age (age 54) to include workers up to age 64 who have not yet retired. Labor force participation rates among workers between the ages of 55 and 64 have increased over the past twenty years, from 59.3 percent in
5 /// Income volatility and health care decision-making
1999 to 65.3 percent in 2019, and BLS data projects that this rate will continue to grow through 2029 (Bureau of Labor Statistics, 2020a). Workers in this age group are operating within the same labor market and may also be experiencing rising income volatility. Workers older than age 65 were excluded because they are eligible for Social Security and Medicare, which provide a stable source of income and health insurance that may mitigate income volatility and related challenges. Interviews were conducted by phone and included participants from 16 U.S. states, enabling us to avoid bias related to any specific geographic area and offering insight on the range of challenges stemming from income volatility and recurring health care expenses. Participants’ names and some details have been changed to protect their identities.
Findings
Demographic summary
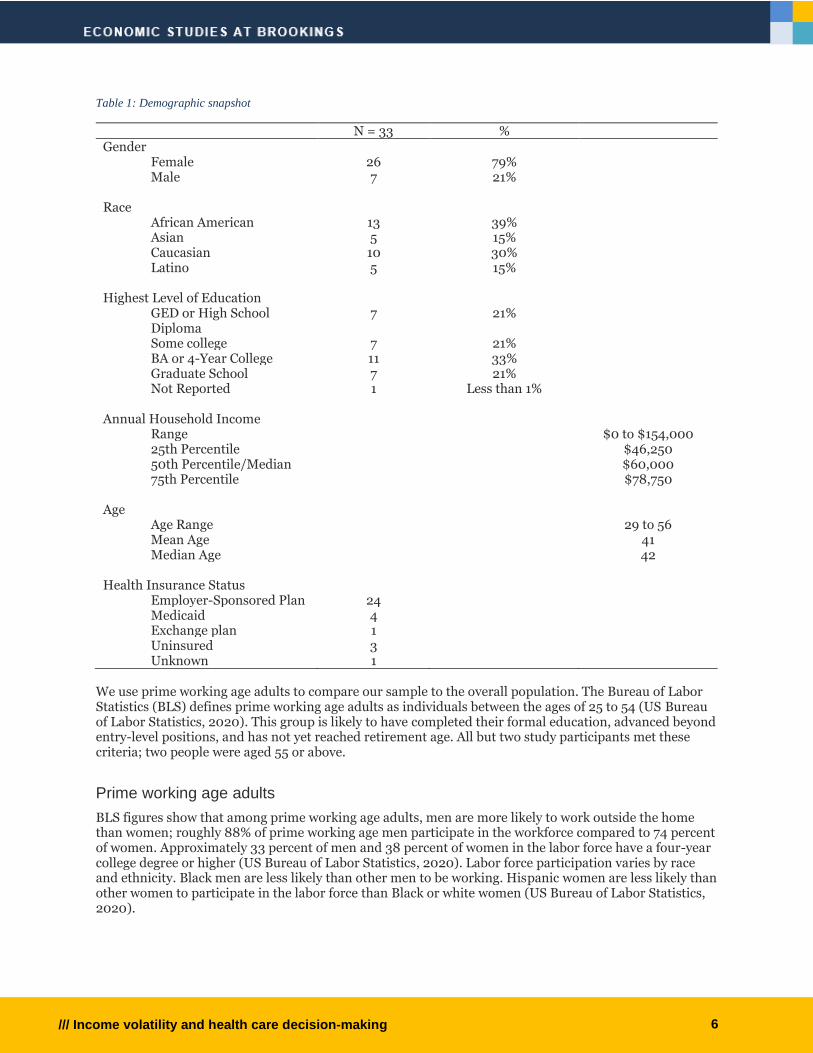
Table 1 (below) summarizes the demographic characteristics of our study sample. Participants ranged in age from 29 to 56, and the median age was 42. The sample included more females (N=25 or 76%) than males (N=8 or 24%). Study participants self-identified as one of four race categories: African American (N=13 or 39%), Asian (N=5 or 15%), Caucasian (N=10 or 30%) and Latino (N=5 or 15%). More than half had a four-year college degree or higher (N=19 or 57%), and within that group seven participants (22%) held a graduate degree. Slightly fewer than half of participants were married or partnered (N=15 or 47%). Annual household income, self-reported income from 2019, ranged from $0 to $154,000. Median income from the interview sample was $60,000, below the national median household income of $68,703 (Smega, Kollar, Shrider, & Creamer, 2020). The interview sample is not a nationally representative sample of the US population, therefore some variation from national figures is expected. Given the focus of the study, we also report health insurance status. The majority of our study sample had health insurance (N=29 or roughly 91%); just three respondents reported being uninsured (N=3). In some cases, household members were covered by separate plans, such as two adult workers each covered by their respective employers’ plans, or families where the wife and child were covered by under her employer’s plan, but the husband was uninsured. Health insurance status reported in Table 1 refers to the individual and does not include other household members who may be covered under different plans or who may be uninsured.
6 /// Income volatility and health care decision-making
Table 1: Demographic snapshot
N = 33 % Gender
Female 26 79% Male 7 21%
Race
African American 13 39% Asian 5 15% Caucasian 10 30% Latino 5 15%
Highest Level of Education
GED or High School Diploma
7 21%
Some college 7 21% BA or 4-Year College 11 33% Graduate School 7 21% Not Reported 1 Less than 1%
Annual Household Income
Range $0 to $154,000 25th Percentile $46,250 50th Percentile/Median $60,000 75th Percentile $78,750
Age Age Range 29 to 56 Mean Age 41 Median Age 42
Health Insurance Status
Employer-Sponsored Plan 24 Medicaid 4 Exchange plan 1 Uninsured 3 Unknown 1
We use prime working age adults to compare our sample to the overall population. The Bureau of Labor Statistics (BLS) defines prime working age adults as individuals between the ages of 25 to 54 (US Bureau of Labor Statistics, 2020). This group is likely to have completed their formal education, advanced beyond entry-level positions, and has not yet reached retirement age. All but two study participants met these criteria; two people were aged 55 or above.
Prime working age adults
BLS figures show that among prime working age adults, men are more likely to work outside the home than women; roughly 88% of prime working age men participate in the workforce compared to 74 percent of women. Approximately 33 percent of men and 38 percent of women in the labor force have a four-year college degree or higher (US Bureau of Labor Statistics, 2020). Labor force participation varies by race and ethnicity. Black men are less likely than other men to be working. Hispanic women are less likely than other women to participate in the labor force than Black or white women (US Bureau of Labor Statistics, 2020).
7 /// Income volatility and health care decision-making
Comparing the study population to prime working age adults overall, our sample includes more female, more non-white, and more college-educated individuals.
Fintech
Prior to starting field work, we interviewed fintech leaders to explore solutions that could address volatile income and recurring medical expenses. The experts we interviewed universally agreed that health care was a source of clients’ financial burdens, but none had developed or was aware of a technology-based solution to manage the specific issue of volatile income and recurring medical expenses. Overall, the fintech providers described the value of their products in two ways: 1) simplifying decision-making, such as helping clients identify the health plan that best meets their needs; and 2) improving transparency by giving consumers better information about health care costs. Both of these solutions address themes from our interviews that are discussed in greater detail below. Two fintech providers, Earnin and Even, described health care-related solutions they currently offer. Earnin offers HealthAid, a service that helps users manage medical bills by setting up payment plans, negotiating lower prices with providers, or seeking debt forgiveness. Importantly, most clients approach Earnin for help with medical bills only after they are in distress. Even offers a planning tool that allows clients to save money to pay for future medical expenses. This tool functions like existing health care savings plans, such as FSAs and HSAs, and depends on clients having some sense of expenses they may incur and/or having time to save money before receiving treatment. We discuss HSAs in greater detail below. Earnin previously launched two health care related solutions but neither was successfully scaled. The first tool was designed to help consumers comparison shop for prescription drugs at local pharmacies. An evaluation found that clients did not typically change pharmacies, even if they knew they could save as much as $10 per prescription by switching pharmacies. Earnin found that consumers valued the relationship with their pharmacy and were reluctant to travel to less convenient locations, even if it meant saving money. This is consistent with previous research on consumer financial services which finds that factors other than cost – transparency, convenience, the way consumers are treated, and hours of operation – drive consumers’ decisions about financial services (Morduch, Ogden, & Schneider, 2017; Servon, 2017). A second solution designed by Earnin was Remedy, which received a $250,000 start up grant from CFSI, now called the Financial Health Network. Remedy was designed to review bills to detect overbilling and other common medical billing errors. The solution depended on access to data that requires cooperation from health care providers. Providers were reluctant to provide data citing HIPAA privacy concerns. Remedy’s leadership noted that having reliable access to billing data is critical to reducing the cost of this solution, scaling it, and generating savings for consumers. Billing errors lack of price transparency are discussed in greater detail below. Fintech leaders understood the root cause of consumers’ challenges: low wages ultimately made it difficult for clients to manage their financial lives. Although apps can be helpful with income smoothing (Even) and more frequent payouts for hours worked (Earnin), they cannot fully compensate for the declining value of wages and an overall reduction in financial stability. This insight is consistent with some of our findings on sources of income volatility that are discussed later in this report. The fintech solutions discussed here do address some of the health care-related financial challenges described in the next section of this report. Notably, all study participants were SaverLife members and were therefore likely to be more financially literate and tech savvy than the general population. However, none mentioned using the fintech products and solutions discussed above, suggesting a mismatch between these efforts and the target population. SaverLife offers financial incentives for members who save consistently for a six-month period and financial education resources. Participants valued the financial advice they received through the platform and the opportunity to share tips with other SaverLife members.
8 /// Income volatility and health care decision-making
The majority of participants were not heavy users of fintech. Among those that used fintech, use was limited to the apps from the financial institutions where they had accounts. Beyond that, experience and usage of fintech ranged widely across the study group. The most common types of apps used other than banking apps were those that enabled participants to monitor their credit, including Credit Karma, Credit Sesame, and Experian. Several participants used budgeting apps such as You Need A Budget, Nanci, and Mint. Others, however, had tried using budgeting apps but found them cumbersome because of the need to input a large quantity of data, or they struggled with getting the app to do what they wanted it to do. Others expressed concern about data privacy. Many told us they found simple spreadsheets or pen and paper worked well for what they needed. A few participants used a second savings app such as Qapital and Digit, and a couple used investing apps such as Robin Hood and Acorn. Several mentioned using payment apps such as PayPal and Venmo. A few reported that they were unaware of financial apps beyond what their bank or credit union provides.
Income volatility
We anticipated that a mismatch between volatile income and recurring medical expenses would be burdensome for consumers and could influence access to health care. Our findings reveal a more complex relationship. Understanding that relationship requires a deeper understanding of the sources of income volatility. For some, income from a primary job was enough to afford their basic needs but did not allow them to cover a financial shock, such as needing unexpected dental work, or a large expense like a wedding. These participants relied on secondary income sources to manage occasional expenses. Others needed secondary income routinely because they could not meet their financial obligations using a primary income source alone. For them, income volatility resulted from changes to the secondary income source such as changes to the number of hours worked. Four participants were independent contractors as a primary job. Their income varied due to different payment rates on contracts or periods of not working in between contracts. More than half of all study participants (19) reported that they (or their spouse or partner) received income from multiple sources. When we asked participants to classify their work, using categories from the Consumer Financial Protection Bureau’s Financial Well Being survey, many struggled with the question (Consumer Financial Protection Bureau, 2017). When prompted, some who held multiple jobs within the year went into their files to figure out how many 1099s they used to file taxes and indicated that that number changed from year to year. Many engaged in “income patching,” a concept used by microenterprise researchers to refer to people who use self-employment as an income supplement that increases overall household income and mitigates risk as the owner maintains paid employment” (Aspen Institute, 2013). Others scaled their supplemental employment or self-employment up or down in response to lumpy expenses. For hourly workers, volatility resulted from changes to number of hours worked, or changes to payment rate such as overtime or bonus pay. The type of supplemental work participants engaged in ranged widely, from Tammy, who runs errands and recycles cans and bottles for extra money, to Clark, an audio-visual technology technician for a local theater company, who does audio and technology consulting on the side. Although our sample size is not large enough to generalize, it is worth noting that participants were much more likely to work two or more jobs than the general US population. Bureau of Labor Statistics data shows that multiple jobholding peaked between 1995 and 1996, when it was 6.2 percent; the rate was 5.0 percent in 2019 (Bureau of Labor Statistics, 2018, 2020b). Women and Black workers are more likely to work multiple jobs than other groups. For many study participants, income volatility resulted from changes to their non-primary income sources. Eleven participants with full-time jobs had a second, part-time job, engaged in self-employment, and/or picked up gig work such as driving for Uber or Lyft. Carla, for example, works full-time as a substance-abuse counselor, part-time as a receptionist, and has a janitorial company on the side. Her
9 /// Income volatility and health care decision-making
janitorial clients were contractually obligated to pay her even though many of them shut down during the pandemic. Eventually, she lost one main client who could not afford to renew their contract. Sabrina, who has a full-time job as a communications manager for a nonprofit organization, also works part-time for another nonprofit and owns her own dance company. The income from her full-time job is stable, but the other two sources of income fluctuate. Although our data do not allow us to draw firm conclusions about the connection between changes in secondary income and access to health care, it is clear that many participants used this secondary income to prepare for the unexpected, to make ends meet because their primary income was not sufficient, or to save for irregular expenses—dental work, a wedding—that their regular income could not accommodate. Some experienced changes in income because of a lag between a medical event and receiving insurance benefits. Karima, for example, needed surgery after becoming ill, and could not work for six months. Although she had been paying for a disability insurance plan, she did not receive any disability benefits until she had been back at work for two weeks. Gina’s husband sustained a serious injury that left him unable to work. He received six months of short-term disability benefits, but there was a lag of ten months between when they applied for long-term disability and when they began to receive payments. They cut back dramatically on expenses in order to get by; Gina also withdrew money from a retirement account linked to a previous job. Other participants experienced income volatility stemming from a lag between applying for and receiving unemployment benefits. This was true for unemployment related to and not related to the pandemic. Some participants’ current instability was linked to the pandemic. Tammy, who has a union job with the school district, had her hours greatly reduced because of COVID-19. In the past, she could depend on summer work in a neighboring school district, but that wasn’t the case in 2020. Both Claudia and her husband’s jobs have been affected by the pandemic. Claudia, who was employed through a catering and events staffing agency, stopped working in the fall when she became pregnant. She has since had a healthy baby but had not resumed work since many events are on hold. Her husband, an electrician, was scheduled to start work on a construction project in April, but the project was abandoned when the pandemic started. He struggled to find work for several months until things started picking up again in the summer. Regardless of whether people had or did not have health insurance, we saw differences in how participants paid for health care. As mentioned, the majority of our sample – nearly ninety percent – had health insurance. This was true for most people with stable jobs. Those who were uninsured tended to be contract workers or had other unstable jobs. The next section describes how participants paid for care. Whether they had health insurance or not, income volatility sometimes resulted from participants’ need to take on extra work, sometimes in order to pay for health care.
Paying for health care
Health insurance This section describes how participants paid for health care. The majority of participants had health insurance and unsurprisingly, health insurance was commonly used to pay for a portion of care. The type of insurance and the type of health care influenced the need for other financial resources and participants’ decision-making around care. Insurance, which is designed to mitigate risk and uncertainty, sometimes introduced uncertainty into participants’ decision-making because of a lack of transparency around cost. Most participants used their health plan to access primary and preventive care, resulting in minimal or low out-of-pocket costs that could be paid in cash or available funds. Very few participants expressed difficulty affording routine care. Those with comprehensive health plans were least likely to have trouble affording health care. Naveen, who works for a state government agency and is enrolled in a comprehensive health plan, pays very little out of pocket. His plan has no deductible and the co-pays are affordable. “If I have to take my son to an urgent care, my copay is only $25. If I have to go to a hospital, it’s like $100. I don’t have any deductible or anything.”
10 /// Income volatility and health care decision-making
Nine participants were covered by a high-deductible plan. In some cases, consumers were responsible for the total cost of their health care – including primary and preventive care – until reaching the deductible. These participants were more likely to report financial burdens overall and trouble paying for primary care. Several also used Health Savings Accounts (HSAs) to manage health expenses. We describe their experiences in greater detail in the next section. Finally, uninsured participants used a few common strategies to pay for care: delaying or avoiding care, seeking discounts, or enrolling in financial assistance plans. Within our sample, two uninsured participants were white, and one was Asian. They ranged in age from late 30s to mid-40s. One person reported household income above the sample median of $60,000, and two reported below median income. In Willis’ case, she had been uninsured since leaving her last long-term job in October 2019. Rather than seeking an affordable plan, she prefers to find ways to manage health care expenses on her own.
“I’d rather figure out how to pay out of pocket and like a cash discount or a health savings plan or something than to deal with insurance. Because they could possibly deny it for whatever reason and then you’re paying for it out of pocket anyway. And I’d rather plan or put it on my credit card, for example.”
Insured participants used some of these same strategies; their experiences are described in greater detail below. In general, consumers used a combination of resources to pay for care. In this section we describe individual strategies and resources.
Health Savings Accounts (HSAs)
More than one quarter (N=9) of participants were covered by high-deductible plans and relied on Health Savings Accounts (HSAs) to pay for out-of-pocket expenses until their deductible was met. HSAs are tax-favored accounts that allow consumers to set aside a portion of their pre-tax earnings for health care expenses. In 2019, the limit was $3,500 for individuals and up to $7,000 for families (Internal Revenue Service, 2019). There are tax benefits associated with using HSAs; an individual’s contribution to an HSA is tax deductible and employer contributions may not be counted as gross income (Internal Revenue Service, 2019). Participants described varying levels of coverage across different high-deductible plans. For example, some plans included pre-deductible prescription drug coverage, meaning that the consumer paid only co-pays for prescription drugs before reaching their deductible. The least generous plans offered limited coverage, even after a participant reached their deductible, leaving consumers responsible for a substantial part of the cost of care. Karima is a nurse at a mental health hospital, where she has worked for the past eight years. She has an employer-sponsored health plan and when asked about the value of her insurance, Karima responded, “it’s actually horrible, but it’s something.” She went on to describe her experiences accessing prescription drugs.
“Initially, when I first joined it, you paid the deductible, then you only pay like your copays once you met your deductible. Now, you pay your deductible, you still have a bill anywhere from 25% to 50%. And also, we used to only have just a copay for the medicine. Now you have to reach your deductible before you get it [lower prescription drug costs], and after the deductible, you only get like 25% off or 50% off the medicines. So, it's really not good, but it's something.”
Some participants valued HSAs as tools that helped them plan for health care expenses. This was common among those who experienced high out-of-pocket costs and, based on their experiences, adjusted the amount of money they set aside. Naima is a loan processor for a major bank, working with home equity customers. She experienced income volatility due to COVID-19; initially she was earning substantial overtime pay and performance-based incentives as consumers began tapping into home equity products. After a few months when loan volume slowed down, her overtime and bonus pay ended. In Naima’s case, two unexpected medical events resulted in steep medical bills.
11 /// Income volatility and health care decision-making
“In 2018, I had a dental emergency, and I had to do a dental surgery, and I had to pay that out of pocket. [Then later] I fell down the stairs at my home, and I had to do physiotherapy for eight weeks, all in one year. So, my medical, my out-of-pocket was just ridiculous. I probably paid $4,000 to $5,000 out-of-pocket in that one year. And that is why the next year I changed my plan, maxed out everything that I could. I think I'm contributing probably $2,000 or is it $2,600 to my HSA just so I don't have to think about finding this money, because it's already drawn out of my pay every week.”
Others reported receiving limited financial protection from their health plan and HSA, such as when they did not reach their deductible within the plan year. That was the case for Tammy who paid out of pocket for annual check-ups and visits to her cardiologist every six months.
“I have $50 taken out of my paycheck every paycheck, which is biweekly, so it’s $25 a week. So that’s going into an account, and then I use that for [medical] bills. As far as I understand, it will cover 100% [after meeting the deductible]. But I’ve never made my deductible. I’ve been told it’s $2,000, and then I’ve been told it’s $3,000. But my boss just hit $2,000, and she’s still paying. So, I think it’s $3,000.”
HSAs were most effective for people who were more financially stable and who earned enough to save money each month. Of the participants who discussed HSAs, five were below the sample median age (four were in their twenties and one was in their 40s) suggesting that these plans were attractive to younger workers. One participant who was in their 20s discussed shifting coverage from a comprehensive to high-deductible plan after tracking her medical expenses for a year. Five HSA users reported household income above the sample median ($60,000) and four were below. Although our focus in this paper is on income volatility, it is likely that more of the costs borne by participants would have been covered by their insurance before the mid-1970s, when employers and government began to scale back benefits packages.
Credit Some participants used credit cards to pay for care, often when the service was not covered by their health plan. Keisha, who had recently been laid off from her job and was enrolled in Medicaid, used a credit card in combination with other resources to pay for weekly mental health therapy sessions that were not covered by her plan. Keisha explained that it was less expensive to pay monthly than to pay for individual sessions each week.
“So right now, my therapy is reduced because I’m unemployed, so I’d say it’s probably around $350 a month. At first, I was using remaining money that I had in the HSA from my job. And then most recently I pay monthly for it. I’ve put it on my credit card and I’m planning to pay it off by the end of the month.”
Participants also used credit when faced with an unexpected bill. Summer, who had recently switched to a high-deductible health plan, needed a diagnostic test.
“In January, I had a [medical test.] I wasn’t anticipating how expensive it was going to be with my high deductible plan. It ended up being $380. At the time, because I hadn’t anticipated it, I didn’t have the money in my checking account to cover it, and so I put it on my credit card.”
In other cases, use of credit indicated larger financial challenges. That was the case for Gina, whose husband was recovering from a serious accident and was unable to work. The family was managing regular household bills with greatly reduced income, and at the same time, the husband’s extensive medical care. The family used a combination of cash and credit cards to cover monthly copays. “He takes six different medications. He also has to do continuous blood glucose monitoring, so it’s costly. And for myself, I have two prescription medications that I take. But when we add it all together, it’s expensive.” Their plan covers part of their monthly expenses, but even with insurance coverage, Gina estimated their monthly out-of-pocket expenses at $375. “These are just our copays,” she said.
12 /// Income volatility and health care decision-making
A few people mentioned using medical credit cards, products marketed to consumers to pay for health care expenses that may not be covered by insurance, including dental care, cosmetic procedures, and Lasik eye surgery. Medical credit cards typically offer deferred interest rates, allowing consumers to repay the balance interest free if it is repaid by the end of the promotional period. CareCredit, which is among the most common medical credit card products, can be used to cover health and wellness services including dental care, primary care, cosmetic surgery, and veterinary care (“About Us | CareCredit,” n.d.). CareCredit offers a 29.66% variable APR with deferred interest for 12, 18, or 24 months. Wells Fargo offers a Health Advantage Card that covers health and veterinary services. This product has a 12.99% APR; details about deferred interest arrangements are not available through Wells Fargo’s website (“Wells Fargo Health Advantage Card,” n.d.). Edward used a combination of savings and a health care credit card to pay for an unexpected dental bill.
“My wife had some dental treatments, a procedure that was about $1,800. We had to apply for one of the medical-type credit cards, the one that you get in the clinic. I paid half the amount with that card, and the other half, I paid out of my pocket in cash. One reason I accepted that [credit card] is because there was no interest attached if it was paid within 12 months. But that was an unexpected expense. And coming up with $1,800 in cash at once is hard. But getting a little bit of support from your savings, and then other support was definitely helpful.”
The number of participants in this study is too small to generalize about the utility of medical credit cards. The data suggest that they would work best for people with strong credit scores and sufficient resources who feel certain they could pay back the debt without accruing significant interest.
Discount programs
When participants could not afford care, some turned to hospital or provider discount programs, often following a medical emergency. Participants relied on discount programs even if they had insurance, which was the case for Keisha and Leticia. In Keisha’s case, a high-deductible health plan meant she was responsible for the total cost of care after suffering a serious asthma attack and being taken to the hospital by ambulance.
“With me finding out that I had asthma, I was actually at work, and they sent me to the hospital via ambulance. And my deductible with that insurance, I think it was $1,500. That was a pretty high deductible for me. So, with the hospital, I ended up having to apply for financial assistance to get that bill covered.”
At the time of our interview, Keisha was still waiting to receive a response to her application for assistance. Leticia needed financial assistance after she fell while ice skating and severely broke her arm. She was insured at the time, but her plan didn’t cover an out-of-network emergency room visit.
“I ended up going to the emergency room at a hospital, then I got like the bills from the emergency care room, which it wasn’t under my plan. It was a pretty hefty amount, like $3,000 or $4,000. I didn’t have the money to pay that. I wrote them a letter telling them I couldn’t afford to pay them. They had a program where you could get your bills reviewed, and if you didn’t make enough, if you qualified, then you could either pay a small portion or not pay any at all. I think I had to send them some financial tax returns or something like that. I definitely wasn’t able to pay my bills, my bill at that time at all because I was between jobs, and so I didn’t really have any income coming in. And then the insurance I had, again, it didn’t cover it because they were out of network.”
13 /// Income volatility and health care decision-making
A few participants mentioned seeking treatment at a free clinic or a place that offers health care at a low cost or on a sliding scale. Claudia’s husband, who was uninsured, could access some health care at a local clinic. Sabrina also mentioned using a free clinic during a period when she was uninsured. “It was just for getting certain birth control. Or I would have to get TB tests for teaching, so I would go to a free clinic because I didn’t have insurance.”
Delaying or skipping treatment
We observed three primary reasons why participants delayed or skipped treatment. Uninsured participants delayed or skipped treatment all together. Insured participants avoided or limited care for services that were not covered by their plan. Insured patients also tended to avoid or skip services that were only partially covered and left them with large co-pays. Lack of transparency around fees and complexity of navigating health care systems also influenced the decision to avoid or skip care. In those cases, health insurance created uncertainty for consumers who tried to determine what parts of treatment are covered or not covered, rather than facilitating access to care. More than half of participants (N=19) described an instance when they decided to delay or skip medical care. Uninsured patients tended to avoid care altogether. Jessica, a healthy woman in her late 30’s, had not seen a doctor in about two years since her health insurance lapsed. Katelyn, who suffers from serious chronic illness, was managing several health conditions as best she could without insurance.
“I’ve got a lot of problems. I’m on the up and up, but I don’t have access to a lot of the things I normally do at reasonable pricing without insurance. I’ve been good about getting my medications. I got the Walgreens prescription discount. But when it comes to actual doctor’s appointments and stuff, even telehealth is pretty expensive. I’ve had televisits with my neurologist and my psychiatrist. But both the dermatologist and the primary [care physician] I have to see for physical things, so I had to go in person. But now that I don’t have [insurance], … still have the cysts, but I’ve been putting it off. I just can’t afford to pay out-of-pocket right now.”
Insured participants avoided or limited health care for services not covered by their plan. Nia started, but later stopped going to counseling when she realized her sessions were not fully covered by her health plan. Since many large employer-sponsored plans had waived copays for mental health services due to COVID, Nia and the therapist believed her plan would cover the full cost of sessions.
“I was going to mental health therapy pretty regularly, actually until I realized that it was not covered. And it’s pretty expensive, more so than I anticipated. It turns out your company had to opt into the COVID waiver. Mine did not. And I saw her [the therapist] seven times over the summer at a rate of $100 an hour. That’s a big difference from my expectation that it would be free.”
Similarly, Kira who has an employer-sponsored health plan covering herself, her husband and their two-year-old son, accessed mental health therapy through her employer’s Employee Assistance Program (EAP). The plan limits her to eight sessions per health issue, and beyond that she would have to pay out-of-pocket. She hasn’t opted to pay for more sessions due to the expense. “I probably pay about $400 per month just in premiums … that’s really just the monthly cost.” In a few cases, patients opted for some, but not all parts of prescribed treatment. We heard this from a handful of participants who were diabetic (N=3) and prioritized routine doctors’ visits but declined to purchase expensive equipment that would allow them to monitor blood sugar between appointments. Elaine typically saw her doctor every three or four months to manage chronic conditions, but she stopped tracking her blood sugar in between medical visits.
“[I take] medication for the high blood pressure, and supposedly diet and exercise for the diabetes. I haven’t been monitoring my blood sugar just because I don’t want to know. And the test strips are quite expensive, even with the insurance. I’m lucky that I work for a hospital and pharmacy, if you get the medicines at the hospital, they don’t
14 /// Income volatility and health care decision-making
even require a copay, they pay the copay. But that does not work for diabetic test strips. We’re talking $50 every two months; you know around $300 a year.”
Mercedes also found the cost of diabetic testing equipment burdensome.
“When my doctor checks my glucose levels, she does a three-month A1c as opposed to me checking my blood sugar with the machine, which honestly I would prefer so that I could keep track of it. But I don’t really want to shell out the money for a machine and the strips and all that stuff.”
In an extreme case, a participant delayed dental care indefinitely, deciding that the treatment was too expensive. Sarah, who was in her late twenties at the time of our interview, was told that her wisdom teeth needed to be extracted more than a decade before. But she delayed the procedure until it became unavoidable.
“I put off getting my wisdom teeth pulled up until July of this year actually because it was expensive, but it got to the point where I couldn’t avoid it anymore. There was always pain there because they grew in sideways. And since they would never fully come up, they were pushing all my teeth together. It got to the point where I started not being able to eat without excruciating pain. Tylenol didn’t help anymore. So, I went to the dentist. They took an x-ray and showed me how much my teeth had been pushed together over the last decade, and it was kind of scary. But then we also found out that I had some kind of cyst in my jaw because of not getting them removed, and they thought it might have been cancer, so I didn’t have a choice anymore.”
Lack of transparency was another factor that caused people to delay or avoid care. In Clark’s case, he had been reluctant to seek care if the cost was unknown. “I have, in the past, been worried about, if I go have this checked out is it covered? Is it not? So that has been periodically a reason for delaying it or putting [things] off.” In Summer’s case, she was reluctant to go for recommended screenings after visiting her doctor for a health problem. “I don't know if I would necessarily say that I've waited because of the cost, but I do think that if I would know the cost more up front, I would be more willing to have the procedure or get the scan.” In all of these examples, participants’ decisions to delay or avoid care have potential for negative health consequences, adverse financial consequences, or both. With respect to health, delaying treatment can cause problems to worsen and potentially become untreatable. As a medical condition worsens, it also often becomes more expensive and time-consuming to treat and can jeopardize the person’s ability to work.
Seeking treatment abroad
A few California-based participants sought care in Mexico because it was more affordable there. It’s worth noting the planning and costs involved: saving money to pay for the procedure, making travel arrangements, and potentially missing work. Further there are risks associated with any procedure, maybe more so when travel is involved, but some participants felt this was their best option. Claudia’s husband is uninsured. He can access primary care at local clinics, but the cost can be high. When he needed a dental procedure to extract an infected tooth, a local clinic told them the extraction would cost. $1,000. Since they have to pay for all of his medical expenses out-of-pocket, they planned to go to Tijuana to get the work done because it was much less expensive, and they trusted the quality of care. When COVID hit, they decided against that plan. She explained:
“And I keep thinking that, if I can cut more, if I can tighten the budget even more, just for him to have the medical care and attention that he would need, at least if it was just like a physical, or something that he would need, that’s what we’re looking at. I think that he, like, obviously, his health is very important.”
15 /// Income volatility and health care decision-making
Similarly, Miguel traveled to Tijuana for oral surgery. “It was like $2,000, and here it would have been closer to $16,000. That's one thing that I can never really understand how expensive dental visits are, because over there it's like ten times cheaper, and they do quality work.” The term medical tourism stems from the practice of seeking elective care abroad, such as cosmetic procedures, while on vacation. The term is not perfectly applicable to the participants in this study who sought treatment in Mexico. Miguel and Claudia’s husband planned to travel in order to save money, but not as part of a vacation. A relatively small but not insignificant number of Americans seek medical care abroad each year and the numbers are growing. In 2007, an estimated 750,000 Americans sought medical care abroad. (Boyd, Mcgrath, & Maa, 2011). Before the COVID-19 crisis, more than two million Americans were projected to seek medical care abroad in 2020 (“Patients Beyond Borders | Media,” n.d.). Among U.S. residents the most common destinations for medical care are Mexico and Costa Rica, where patients commonly seek dental care, cosmetic surgery and prescription medications (Yeginsu, 2021). For more complex treatment, such as cancer care and fertility treatment, patients may travel to Thailand, India, and South Korea (Yeginsu, 2021). The main reason consumers seek medical care abroad is cost. Most Americans who travel for medical care do not have insurance or their insurance does not cover the type of care they need (Dalen & Alpert, 2019). This is consistent with our findings; cost was a primary factor for study participants who chose to seek care abroad. In a 2006 survey, 25 percent of uninsured respondents and 10 percent of respondents with health insurance were willing to travel abroad for medical care to save between $1,000 and $2,400 (Herrick, 2007). When the hypothetical savings were more than $10,000, those figures grew to roughly 38 percent of uninsured and 25 percent of insured respondents (Herrick, 2007).
Medical needs In our sample of 33 participants, nearly all could describe an experience where they had trouble affording health care. In this section, we describe specific health care services that were difficult to afford or where participants faced other barriers to access.
Dental care
Participants often didn’t have sufficient dental insurance, limiting their access to care. Elaine delayed getting crowns on her teeth for ten years, and then split up the work over two years to take advantage of an annual benefit provided by her husband’s insurance. Sarah was supposed to get her wisdom teeth out as a teenager but put it off for over ten years. When she finally went to the dentist, the $3,800 of dental work emptied her emergency fund.
Physical therapy
Six participants said they have used or needed physical therapy. The cost was burdensome because the copays tended to be higher than copays for other medical visits – around $50 compared to between $10 and $30 respectively – and because participants needed several sessions to address their condition. Jim suffered an ankle injury and needed six months of physical therapy.
“Some of the major stuff I had to have like MRIs and X-rays, that was all covered. But when it came to the actual physical therapy, they paid for it but the [$50] copay was pretty expensive because I was going twice a week, it was starting to add up.”
Sameer’s wife needed physical therapy stemming from sports injuries. She delayed seeking care which caused her condition to worsen. “She delayed getting her legs and wrists checking out. She would typically have PT [physical therapy] once or twice a month. They had her coming twice a week, sometimes, and then once a week after that.” Lynda’s daughter needed physical therapy to strengthen her legs. She didn’t recall the details of her health plan, but she recalled her difficulty paying for care.
16 /// Income volatility and health care decision-making
“I was having $750 a month coming out of my check just for myself and my daughter for health insurance. And then on top of that, I would get bills. Most of them were for her, and it was just really difficult to pay those. It was physical therapy to make her legs stronger. One of her legs was shorter than the other. So, she had to go through physical therapy, and it was twice a week. It [the insurance] wasn’t really covering any of it.”
Half of the participants who used physical therapy indicated that they stopped their treatment due to cost. In Mercedes’ case, a misunderstanding about insurance coverage left her with an outstanding bill of $1,200. She was concerned about continuing to pay for care while trying to pay off the amount she owed. She also questioned whether her condition would improve given the limits of her plan.
“I was doing physical therapy because I somehow randomly developed this chronic back pain in December. I stopped just because I didn’t really want to keep shelling out money for it. I started off at one institution, and then apparently, they weren't fully covered by my insurance. So now I still have like a huge bill from them for the portion that I owe. Also, like with my plan, they only give you a certain number of visits. And the way things were going, I wasn't going to feel better within those number of visits anyway, so it was kind of just like, you know what, like I'm not even going to keep spending money on this.”
Gina and her husband decided to stop his physical therapy because they couldn’t afford it on top of monthly copays for other services “I would say about $375 a month. And then it would be about another $300 if we included the physical therapy.”
Injury or serious medical event
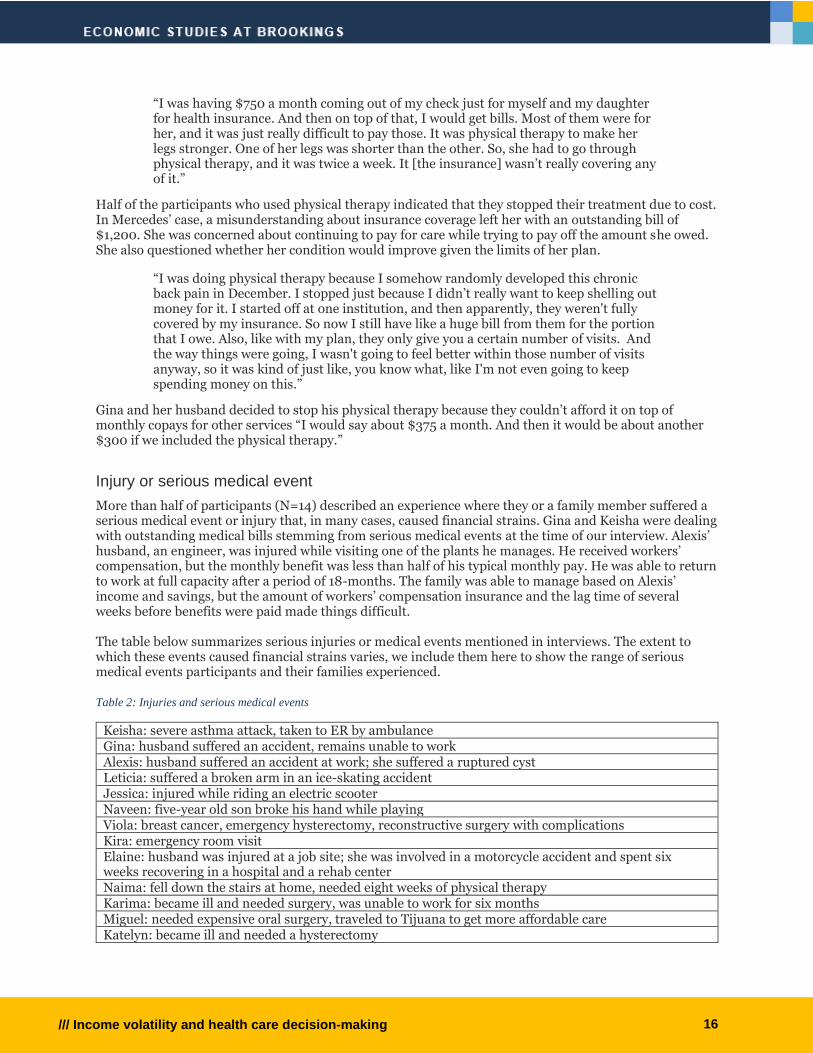
More than half of participants (N=14) described an experience where they or a family member suffered a serious medical event or injury that, in many cases, caused financial strains. Gina and Keisha were dealing with outstanding medical bills stemming from serious medical events at the time of our interview. Alexis’ husband, an engineer, was injured while visiting one of the plants he manages. He received workers’ compensation, but the monthly benefit was less than half of his typical monthly pay. He was able to return to work at full capacity after a period of 18-months. The family was able to manage based on Alexis’ income and savings, but the amount of workers’ compensation insurance and the lag time of several weeks before benefits were paid made things difficult. The table below summarizes serious injuries or medical events mentioned in interviews. The extent to which these events caused financial strains varies, we include them here to show the range of serious medical events participants and their families experienced.
Table 2: Injuries and serious medical events
Keisha: severe asthma attack, taken to ER by ambulance Gina: husband suffered an accident, remains unable to work Alexis: husband suffered an accident at work; she suffered a ruptured cyst Leticia: suffered a broken arm in an ice-skating accident Jessica: injured while riding an electric scooter Naveen: five-year old son broke his hand while playing Viola: breast cancer, emergency hysterectomy, reconstructive surgery with complications Kira: emergency room visit Elaine: husband was injured at a job site; she was involved in a motorcycle accident and spent six weeks recovering in a hospital and a rehab center Naima: fell down the stairs at home, needed eight weeks of physical therapy Karima: became ill and needed surgery, was unable to work for six months Miguel: needed expensive oral surgery, traveled to Tijuana to get more affordable care Katelyn: became ill and needed a hysterectomy
17 /// Income volatility and health care decision-making
Billing errors
In addition to the physical and financial toll of serious medical events, participants were also burdened by inaccurate medical bills. Medliminal, a company that reviews medical bills to identify errors, reported that nearly 25 percent of charges on bills it reviews are inappropriate (Fox, 2020). A few study participants (N=6) had experience with medical billing errors. Participants spent considerable amounts of time and effort to resolve these issues and some ended up paying out-of-pocket to resolve the outstanding claims. Clark, a 30-year-old young man who is in good health, encountered a problem when his insurance wasn’t applied correctly for a doctor’s visit.
“A few doctor’s visits that I have had, the insurance wasn’t necessarily a coverage issue, but there was a billing problem that I had to deal with for a long time. I ended up just deciding to eat the cost of a doctor’s visit. That was probably $250. If it had been covered the way it was supposed to [the insurance] should have been adequate.”
Those who needed more advanced care spent significant time and effort to resolve billing errors. Erica dealt with billing errors related to the birth of her second child. “There were all these bills we were being charged with, and we really had to fight the insurance company to pay for it. A lot of times, the insurance just, for whatever reason, wasn’t applied.” The problem was even more pronounced when complex care was needed. At the time of our interview, Gina was managing medical bills from her husband’s injury and subsequent care. He required several surgeries, six weeks in an intensive care unit, and intensive rehabilitation.
“Some of the charges were just because they weren’t submitted correctly or were missing codes. There just seems to be a lot of errors happening. Sometimes it’s on the provider. Sometimes, it’s on the insurance. Sometimes, on us, I guess, maybe for not providing all of the information. But it’s just, it’s a very difficult, very tangled mess to try and deal with. And, at last count, [there were] over 400 claims since this accident happened. Every single claim that wasn’t covered properly, it’s like three days’ worth of phone calls. It’s a lot of follow-up and it’s a very convoluted process.”
We did not ask specific questions about billing errors, but participants raised them in response to questions about challenges they had experienced in affording medical care.
Prioritizing care
For many participants, financial challenges existed independent of medical needs. But economic insecurity was exacerbated when participants needed care. We observed a pattern of health care prioritization based on cost. Some forms of care were treated as essential when covered by insurance, but elective when it was not covered by insurance or when the participant perceived it to be too expensive. Participants’ decisions around mental health treatment provides an example. Nine participants mentioned that they or members of their household had a mental health condition; the most common diagnoses were anxiety and depression. Participants relied on a combination of medication and counseling to manage their mental health. Medication tended to be affordable using insurance or discount plans offered by pharmacies, and therefore treated as essential. In contrast, the way participants treated counseling varied. Some accessed counseling that was covered by insurance or otherwise affordable. That was true for Summer and Erica who used telehealth services. Viola saw a religious therapist weekly; she did not mention paying for these sessions. Some deemed treatment essential and figured out how to pay for care. Keisha, whose weekly counseling sessions were not covered by her Medicaid plan, prioritized this care despite the high out-of-pocket cost. She was able to reduce the cost a bit by paying for weekly sessions together. Others used only the amount of mental health services allowed by their plan but treated it as non-essential beyond that coverage. Kira, for example, used her employer’s EAP program, which offered a few therapy sessions at no cost. But she elected to stop going to therapy when she reached the maximum number of sessions rather than paying out of pocket.
18 /// Income volatility and health care decision-making
These decisions were not limited to mental health services. In three cases, participants stopped physical therapy due to cost; two of the three – Mercedes and Gina’s husband – found the treatment had been effective. Sarah avoided having her wisdom teeth extracted until it became painful and therefore unavoidable. Nia’s avoided seeing a dermatologist due to cost.
“I've been blessed to not have, not ever have to be in a place where I had to choose between serious health and finances, but there are those things that I would identify as being like a nice-to-have that I will opt out of for financial reasons. I started taking a supplement for health reasons that broke me out really badly. I have considered seeing a dermatologist, but it's not something I'm doing right now for cost reasons. But again, it's a nice-to-have.”
Stopping or avoiding health care due to cost is a rational decision. But making health care decisions based on cost can have negative health or financial consequences.
Discussion This qualitative study has identified factors that influence health care decision-making among participants who experience income volatility and have health care needs: financial concerns, lack of transparency around pricing, and health insurance coverage gaps. The study population included prime working-age adults who are more educated than the general population, the majority of whom had health insurance, and earned median household income of $60,000, which is well above the federal poverty level. But these financial and social advantages did not ensure access to affordable health care. These findings highlight underlying challenges within our economic and political system. A key insight gained from this study relates to drivers of income volatility; many participants relied on secondary sources of income to supplement insufficient wages from a primary job. These secondary sources appear to be responsible for much of the income volatility participants were experiencing. A second important insight is that most participants had health insurance – often an employer-sponsored plan – that enabled them to access primary and preventive care. But paying for other services was burdensome because so many participants were financially precarious and because of the cost of care. Nearly every participant described a situation where they or a member of their household struggled to pay for medical care, illustrating the scale of health care affordability challenges. Roughly one fourth of the study population was enrolled in a health plan with limited coverage, including high-deductible plans and HSAs. This included participants across the age range (age 27 through 53) and across all four income quartiles. We observed a range of experiences with HSAs. These plans worked well for younger participants and those who could anticipate and save for expenses, implying that they earned enough to cover household expenses and to put money aside each month. But high deductible plans and HSAs were less advantageous for: 1) those who could not save; 2) those whose expenses never reached or exceeded the deductible; or 3) those whose plans offered limited coverage even after a deductible was met. Given the rate of job changes in the labor market, portability is an important consideration in evaluating HSA plans. Since these accounts are linked to employer sponsored health plans, the funds do not necessarily transfer when someone starts a new job. Keisha was able to access remaining HSA funds after leaving her job, which she used to pay for therapy. But after changing jobs and enrolling in a new health plan, Sameer and his wife had to start over.
“Previously, we were using an HSA, and we were maxing that out for the year, and so that was paying all the deductibles, all out-of-pocket costs. And we, when all of these things started becoming recurring, we had almost hit our deductible, and then I had the job change. And so, we were kind of in that same boat again.”
The examples presented here illustrate what Hacker describes as “The Great Risk Shift,” declining economic security caused by the decline of stable jobs with benefits, stagnant wages and the deterioration of social welfare protections that once protected workers against economic risks (Hacker, 2006).
19 /// Income volatility and health care decision-making
Third, participants made rational decisions about paying for health care. They prioritized care when it was affordable, such as primary care and other services that could be reasonably paid for using insurance. They deprioritized health care that was unaffordable, opting to delay it as long as possible or avoid it entirely, such as physical therapy or diabetes testing materials. When possible, participants sought ways to afford care they deemed essential but unaffordable such as using credit, negotiating with providers for payment plans or discounts, or going so far as to seek care in places where it was affordable. While understandable, these decisions pose risks to financial and physical health. There are obvious risks associated with delaying care; one’s condition can deteriorate over time and leading to higher treatment costs in the long-term. Borrowing money to pay for care, such as using medical credit cards, served some participants well (those who could pay off the charges relatively quickly without incurring substantial interest). But medical credit cards convey the same risks as other forms of credit. Credit score inquiries and payment patterns are reported to credit agencies and can affect a consumers’ credit score. Consumers who cannot repay the balance within the promotional period begin incurring interest charges, and in some cases, they may be liable for retroactive interest on the entire initial balance (Bond & Kissell, 2020). These products may be attractive when offered just in time to meet an unexpected bill. But patients may also be able to borrow money at lower rates through other credit products. Participants’ health care decisions were often driven by cost, yet the strategies participants used manage their health had potential for negative health and financial consequences putting people at risk for further instability. Finally, participants were generally knowledgeable about financial technology and comfortable using apps for routine banking transactions. This is not surprising given the source of our sample, SaverLife. However, participants did not necessarily see apps as solutions to their financial or health care challenges. This perspective does not mean there are no opportunities in this space. Rather, it appears that fintech is not an obvious solution to this group, or that fintech developers have not figured out how to effectively reach this population. It may be that the strengths of fintech solutions do not match well with the problems people face.
Implications
The Affordable Care Act established a basic level of insurance coverage by requiring health plans to cover preventive care services. But our data show that individuals facing income volatility, due to changes in primary or secondary income sources, who have medical expenses would likely benefit from comprehensive health plans that limit out-of-pocket expenses. As shown here, participants may have been better served by plans with higher premiums and more comprehensive coverage. But beyond the experiences documented here, there is a need for affordable health plans that can do more than guarantee access to primary care. Our findings do not point to a specific technology-based solution to manage volatile income and recurring medical expenses. What our findings can do is identify common pressure points that are opportunities for policy and practice intervention.
Solutions and conclusion The examples presented here demonstrate the need for sufficient wages that enable workers and their families to afford a reasonable standard of living – including quality housing, education, and health care – as well as the ability to build savings to buffer short-term emergencies and also plan for the future. There is a need for wages that reflect the cost of living and are adjusted to keep pace as the cost-of-living increases. Implementing a universal health care system is the most direct path to ensuring access to affordable health care. In the absence of immediate solutions to address these problems, we propose the following solutions to mitigate the challenges middle-income households are facing when managing insufficient and volatile income and medical expenses.
20 /// Income volatility and health care decision-making
Health insurance plan choice
Helping consumers identify the optimal health plan to meet their needs has potential to reduce costly out-of-pocket expenses. Several participants described changing their health plan after a period of learning. Some, for example, changed from a high-deductible plan to a comprehensive plan or increasing savings through an HSA after incurring high out-of-pocket expenses in a previous year. If consumers could identify the plan that best meets their needs sooner, there is potential to mitigate financial harms by reducing or eliminating the period of learning when consumers end up incurring high health care expenses. This observation speaks to a solution raised by fintech experts: leveraging technology as a decision-making tool. In this case, an app or other technology-based solution could help consumers identify health plans that may best meet their needs. Although research on some forms of financial education has not shown much evidence of a positive effect, it can help when the education is given close to the time that a decision is made (Fernandes, Lynch, & Richard, 2014). The concept of “just in time” financial education, which has proven effective, could be modified to help consumers select health plans. An important caveat is that this depends on a consumer having access to multiple plan options, which may or may not be the case. Further, the information would have to come from a trusted source.
Consumer protection
We identified two related consumer protection issues: medical billing errors and lack of transparency around health care costs. Billing errors are financially expensive and required participants to spend a considerable amount of time and effort to correct. Participants discussed billing errors for a range of services, from routine doctors’ visits to more involved procedures, and among participants in multiple states: Connecticut, Texas, and Georgia. This suggests that the problem of medical billing errors is widespread and routine, further evidence of the scale of the problem that Remedy’s solution was designed to address. Another approach is to consider penalties for providers or insurers who engage in patterns of billing errors. A few participants succeeded in resolving medical billing disputes, resulting in the health plan paying for services. But sanctions could be imposed on providers or insurers for the time and effort required of consumers to correct erroneous claims. Some participants decided not to pursue tests or treatment because they did not know how much they would be charged. This issue seems to be one that is most amenable to a policy solution linked to technology. For example, the Centers for Medicare & Medicaid Services (CMS) developed a rule requiring hospitals to disclose their prices. CMS is also developing regulations that would require health plans to disclose prices and out-of-pocket costs to consumers (Centers for Medicare & Medicaid Services, 2020). This kind of information could be linked to a technology-based tool such as Health care Bluebook. Health care Bluebook is a web-based tool that is marketed as an add-on to employer-based health plans (“Health care Bluebook,” n.d.). Health care Bluebook allows members to search by provider, facility, or procedure to compare prices for medical care. It is not clear if Bluebook or another service is widely available for different kinds of health plans.
Health-specific Savings Accounts
Participants valued HSAs to help them plan and save for medical expenses, often after they understood how to use them and when they could roughly anticipate the cost of health care services they would use. We do not advocate for expanding high-deductible plans; evidence is mixed based on the experiences of our study population. But widely available health-specific savings plans could be valuable for consumers who have recurring medical expenses that can be anticipated over the course of a year. In sum, although technology may mitigate challenges associated with volatile income, it does not address the fundamental issue of inadequate wages and insufficient coverage from health plans. These two issues must be addressed in order to ensure that all Americans have access to affordable, quality health care.
21 /// Income volatility and health care decision-making
Future research
This study raises several topics for future research. Participants discussed several points at which they interact with health care systems such as choosing a health plan, seeking a provider, seeking information about the cost of treatment, among other things. Future research could explore the potential of health care decision-making tools to assist consumers at different phases along their health care journeys. We saw evidence of participants delaying care due to cost, which can create both financial risks and health risks. In some cases, these risks are compounding. Future research could explore these relationships. Related to the idea of compounding financial and health risks, future research could explore the role of these types of risks in social mobility.
22 /// Income volatility and health care decision-making
Works Cited About Us | CareCredit. (n.d.). Retrieved February 3, 2021, from https://www.carecredit.com/about/ Aspen Institute. (2013). Income patching among microentrepreneurs. Washington, DC. Aspen Institute. (2016). Income Volatility: A Primer. Washington, DC. Retrieved from
https://assets.aspeninstitute.org/content/uploads/files/content/docs/pubs/EPIC+Volatility+Primer+(May).pdf
Benach, J., Vives, A., Amable, M., Vanroelen, C., Tarafa, G., & Muntaner, C. (2014). Precarious
Employment: Understanding an Emerging Social Determinant of Health. Annual Review of Public Health, 35, 229–253. https://doi.org/10.1146/annurev-publhealth-032013-182500
Bond, C., & Kissell, C. (2020, February 20). Medical Credit Cards: Should You Apply? Retrieved February
3, 2021, from https://creditcards.usnews.com/articles/what-is-a-medical-credit-card Boyd, J. B., Mcgrath, M. H., & Maa, J. (2011). Emerging Trends in the Outsourcing of Medical and
Surgical Care. Arch Surg (Vol. 146). Bureau of Labor Statistics. (2018, July 19). 4.9 percent of workers held more than one job at the same
time in 2017. Retrieved February 7, 2021, from https://www.bls.gov/opub/ted/2018/4-point-9-percent-of-workers-held-more-than-one-job-at-the-same-time-in-2017.htm
Bureau of Labor Statistics. (2020a). Civilian labor force participation. Retrieved March 2, 2021, from
https://www.bls.gov/emp/tables/civilian-labor-force-participation-rate.htm Bureau of Labor Statistics. (2020b). Multiple jobholders by selected characteristics. Washington, DC.
Retrieved from https://www.bls.gov/cps/cpsaat36.pdf Centers for Medicare & Medicaid Services. (2020). Transparency in Coverage Final Rule Fact Sheet
(CMS-9915-F). Centers for Medicare & Medicaid Services. Retrieved from https://www.cms.gov/newsroom/fact-sheets/transparency-coverage-final-rule-fact-sheet-cms-9915-f
Claxton, G., Rae, M., Long, M., Damico, A., Foster, G., & Whitmore, H. (2017). 2017 Employer Health
Benefits Survey. Menlo Park, CA. Retrieved from http://files.kff.org/attachment/Report-Employer-Health-Benefits-Annual-Survey-2017
Consumer Financial Protection Bureau. (2017). Financial well-being in America. Retrieved from
https://files.consumerfinance.gov/f/documents/201709_cfpb_financial-well-being-in-America.pdf
Currier, E., Biernacka-Lievestro, J., Elliott, D., Elmi, S., Key, C., Lake, W., & Sattelmeyer, S. (2015). The
Precarious State of Family Balance Sheets. Dalen, J. E., & Alpert, J. S. (2019). Medical Tourists: Incoming and Outgoing. The American Journal of
Medicine, 132, 9–10. https://doi.org/10.1016/j.amjmed.2018.06.022 De La Rosa, W., & Chen, J. (2017, July). Helping Recipients of Food Assistance Use Their Benefits Wisely. Durante, A., & Chen, L. (2019). Report on the Economic Well-Being of U.S. Households in 2018.
Washington, DC. Retrieved from https://www.federalreserve.gov/publications/default.htm.
23 /// Income volatility and health care decision-making
Dynan, K., Elmendorf, D., Sichel, D., Auerbach, A., Carroll, C., Dahl, M., … Zimmerman, S. (2012). The Evolution of Household Income Volatility. Journal of Economic Analysis & Policy Advances, 12(2).
Elmi, S., Currier, E., & Key, C. (2017). How Income Volatility Interacts With American Families’
Financial Security. Washington. Retrieved from http://www.pewtrusts.org/~/media/assets/2017/03/incomevolatility_and_financialsecurity.pdf
Farrell, D., Greig, F., & Yu, C. (2019). Weathering Volatility 2.0 A Monthly Stress Test to Guide Savings.
New York, NY. Retrieved from https://institute.jpmorganchase.com/ institute/research/household-income-spending/report-weathering-volatility-2.0
Fernandes, D., Lynch, J. G., & Richard, G. (2014). Financial literacy, financial education, and downstream
financial behaviors. Management Science, 60(8), 1861–1883. https://doi.org/10.1287/mnsc.2013.1849
Fox, M. (2020, October 28). How to negotiate steep medical bills. Retrieved February 3, 2021, from
https://www.cnbc.com/2020/10/28/you-can-negotiate-your-medical-bills-heres-how-to-lower-your-costs.html
Hacker, J. S. (2006). The Great Risk Shift: The new economic insecurity and the decline of the American
Dream (1st ed.). New York: Oxford University Press. Hacker, J. S., & Jacobs, E. (2008). The Rising Instability of American Family Incomes, 1969-2004:
Evidence from the Panel Study of Income Dynamics. Washington, DC. Retrieved from www.epi.org
Hannagan, A., & Morduch, J. (2015). Income Gains and Month-to-Month Income Volatility: Household
evidence from the US Financial Diaries 1. Retrieved from www.usfinancialdiaries.org Healthcare Bluebook. (n.d.). Retrieved February 3, 2021, from
https://www.healthcarebluebook.com/explore-home/ Herrick, D. M. (2007). Medical Tourism: Global Competition in Health Care. Retrieved from
www.ncpa.org/pub/st/st304 Internal Revenue Service. (2019). Internal Revenue Bulletin: 2019-22. Washington, DC. Retrieved from
https://www.irs.gov/irb/2019-22_IRB#REV-PROC-2019-25 Kirzinger, A., Munana, C., & Brodie, M. (2018). Public Opinion on Chronic Illness in America.
Washington, DC. Retrieved from https://www.kff.org/health-costs/poll-finding/public-opinion-on-chronic-illness-in-america/
Kutzbach, M., Lloro, A., & Weinstein, J. (2020). How America Banks: Household Use of Banking and
Financial Services, 2019 FDIC Survey. Washington, DC. Retrieved from https://www.fdic.gov/analysis/household-survey/2019report.pdf
Larrimore, J. (2016). Recent Trends in Economic Well-Being from the Survey of Household Economics
and Decisionmaking. Retrieved from http://gflec.org/wp-content/uploads/2016/11/SHED-2015-FLSS-Presentation.pdf?x87657
Larrimore, J., Durante, A., Park, C., & Tranfaglia, A. (2017). Report on the Economic Well-Being of U.S.
Households in 2016. Washington, D.C.: The Federal Reserve Board of Governors. Retrieved from https://www.federalreserve.gov/publications/files/2016-report-economic-well-being-us-households-201705.pdf
24 /// Income volatility and health care decision-making
McElrath, K., & Martin, M. (2021). Bachelor’s Degree Attainment in the United States: 2005 to 2019. Washington, DC. Retrieved from https://www.census.gov/content/dam/Census/library/publications/2021/acs/acsbr-009.pdf
Morduch, J., Ogden, T., & Schneider, R. (2017). The USFD methodology: The financial lives of low-and
moderate-income Americans. Morduch, J., & Schneider, R. (2019). The Financial Diaries. The Financial Diaries.
https://doi.org/10.2307/j.ctvc77n3j Patients Beyond Borders | Media. (n.d.). Retrieved January 20, 2021, from
https://www.patientsbeyondborders.com/media Servon, L. (2017). The unbanking of America : how the new middle class survives. Smega, J., Kollar, M., Shrider, E. A., & Creamer, J. (2020). Income and Poverty in the United States:
2019. Retrieved from https://www.census.gov/library/publications/2020/demo/p60-270.html Urbane Development. (2018). A Scan of Municipal Financial Capability Efforts. New York, NY. US Bureau of Labor Statistics. (2020, January 22). Labor Force Statistics from the Current Population
Survey. Retrieved January 19, 2021, from https://www.bls.gov/cps/cpsaat08.htm Wells Fargo Health Advantage Card. (n.d.). Retrieved February 3, 2021, from
https://retailservices.wellsfargo.com/locator/WFHA Wolf, S., Gennetian, L. A., Morris, P., & Hill, H. D. (2014). Patterns of income instability among low-and
middle-income households with children. Family Relations, 63, 379–410. https://doi.org/10.1111/fare.12067
Yeginsu, C. (2021, January 19). Why Medical Tourism Is Drawing Patients, Even in a Pandemic - The New
York Times. The New York Times. Retrieved from https://www.nytimes.com/2021/01/19/travel/medical-tourism-coronavirus-pandemic.html
Ziliak, J. P., Hardy, B., & Bollinger, C. (2011). Earnings volatility in America: Evidence from matched CPS
☆. https://doi.org/10.1016/j.labeco.2011.06.015
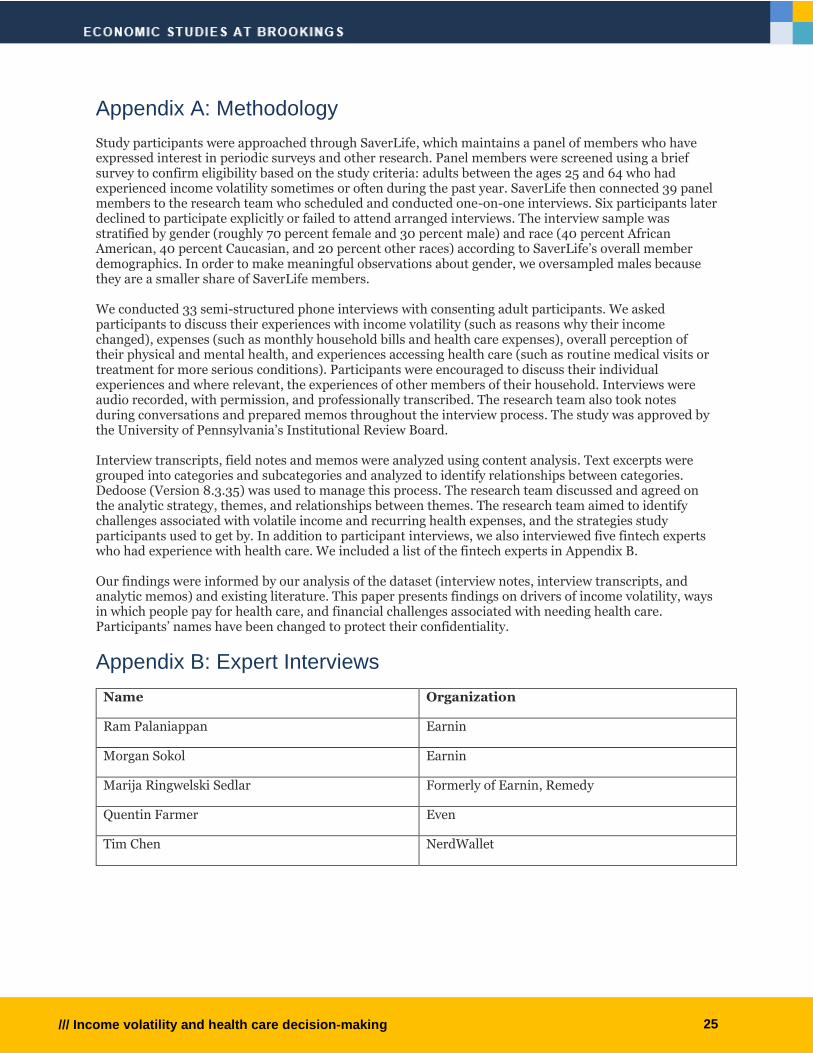
25 /// Income volatility and health care decision-making
Appendix A: Methodology Study participants were approached through SaverLife, which maintains a panel of members who have expressed interest in periodic surveys and other research. Panel members were screened using a brief survey to confirm eligibility based on the study criteria: adults between the ages 25 and 64 who had experienced income volatility sometimes or often during the past year. SaverLife then connected 39 panel members to the research team who scheduled and conducted one-on-one interviews. Six participants later declined to participate explicitly or failed to attend arranged interviews. The interview sample was stratified by gender (roughly 70 percent female and 30 percent male) and race (40 percent African American, 40 percent Caucasian, and 20 percent other races) according to SaverLife’s overall member demographics. In order to make meaningful observations about gender, we oversampled males because they are a smaller share of SaverLife members. We conducted 33 semi-structured phone interviews with consenting adult participants. We asked participants to discuss their experiences with income volatility (such as reasons why their income changed), expenses (such as monthly household bills and health care expenses), overall perception of their physical and mental health, and experiences accessing health care (such as routine medical visits or treatment for more serious conditions). Participants were encouraged to discuss their individual experiences and where relevant, the experiences of other members of their household. Interviews were audio recorded, with permission, and professionally transcribed. The research team also took notes during conversations and prepared memos throughout the interview process. The study was approved by the University of Pennsylvania’s Institutional Review Board. Interview transcripts, field notes and memos were analyzed using content analysis. Text excerpts were grouped into categories and subcategories and analyzed to identify relationships between categories. Dedoose (Version 8.3.35) was used to manage this process. The research team discussed and agreed on the analytic strategy, themes, and relationships between themes. The research team aimed to identify challenges associated with volatile income and recurring health expenses, and the strategies study participants used to get by. In addition to participant interviews, we also interviewed five fintech experts who had experience with health care. We included a list of the fintech experts in Appendix B. Our findings were informed by our analysis of the dataset (interview notes, interview transcripts, and analytic memos) and existing literature. This paper presents findings on drivers of income volatility, ways in which people pay for health care, and financial challenges associated with needing health care. Participants’ names have been changed to protect their confidentiality.
Appendix B: Expert Interviews
Name Organization
Ram Palaniappan Earnin
Morgan Sokol Earnin
Marija Ringwelski Sedlar Formerly of Earnin, Remedy
Quentin Farmer Even
Tim Chen NerdWallet
26 /// Income volatility and health care decision-making
The Brookings Economic Studies program analyzes current and emerging economic issues facing the United States and the world, focusing on ideas to achieve broad-based economic growth, a strong labor market, sound fiscal and monetary policy, and economic opportunity and social mobility. The research aims to increase understanding of how the economy works and what can be done to make it work better.