Embed Size (px)
Citation preview

OPPORTUNITIES AND BARRIERS TO BUSINESS INNOVATION IN RURAL AREAS: THEORY AND EVIDENCE
A Report produced for Department for Environment, Food and Rural Affairs (Defra)
Date: December 2010

Opportunities and Barriers to Business Innovation in Rural AreasInterim Report: Theory and Evidence
A Report submitted by GHKin association with
Professor Robert Huggins (Centre for International Competitiveness, University of Wales Institute) and Rob Hindle (Rural Innovation)
Date: 24/12/2010
GHK, Clerkenwell House,
67 Clerkenwell Road, London
EC1R 5BL

www.ghkint.com

Opportunities and Barriers to Business Innovation in Rural Areas: Theory and Evidence
Document Control
Document Title Opportunities and Barriers to Business Innovation in Rural Areas: Theory, Evidence and Implications
Job No. J7302
Prepared by Rob Hindle, Robert Huggins and Charu Wilkinson
Checked by Matt Rayment
Date 24 December 2010

Opportunities and Barriers to Business Innovation in Rural Areas: Theory and Evidence
CONTENTSINDEX OF FIGURES............................................................................................................................. 1INDEX OF TABLES.............................................................................................................................. 1EXECUTIVE SUMMARY........................................................................................................................ I1 INTRODUCTION........................................................................................................................ 11.1 Aims and Objectives of the Research.........................................................................................11.2 Research Methodology...............................................................................................................11.3 Structure of the Report................................................................................................................42 FIRM LEVEL INNOVATION: A REVIEW OF THEORY..............................................................52.1 Definition of Innovation...............................................................................................................52.2 The Innovation Process..............................................................................................................52.3 Drivers of Innovation................................................................................................................... 62.4 Concluding Remarks................................................................................................................. 123 BUSINESS INNOVATION IN RURAL AREAS: A REVIEW OF EVIDENCE............................133.1 Approach to Statistical Analysis and Evidence Review.............................................................133.2 Defining Rural Geography.........................................................................................................133.3 Evidence on Drivers of Innovation............................................................................................153.4 Wider Framework Conditions for Innovation.............................................................................203.5 Contextual Factors.................................................................................................................... 394 KEY MESSAGES..................................................................................................................... 61ANNEX 1 BIBLIOGRAPHY AND REFERENCES...............................................................................65ANNEX 2 CLASSIFICATIONS AND DEFINITIONS...........................................................................82ANNEX 3 CASE STUDIES.................................................................................................................. 86CASE STUDY 1: PHYSICAL AGGLOMERATION AND RURAL INNOVATION................................87CASE STUDY 2: THE ROLE OF VIRTUAL NETWORKS..................................................................92CASE STUDY 3: THE ROLE OF A SCIENCE PARK.........................................................................96CASE STUDY 4: THE ROLE OF SECTORAL NETWORKS............................................................103CASE STUDY 5: BUSINESS INNOVATION IN REMOTE RURAL AREAS.....................................107ANNEX 4 LIST OF RESEARCH PARTICIPANTS............................................................................112
Opportunities and Barriers to Business Innovation in Rural Areas: Theory and Evidence
INDEX OF FIGURES Figure 2:1 The Innovation Value Chain.................................................................................................6Figure 2:2 Innovation Eco-System.........................................................................................................6Figure 2:3 Wider Framework Conditions for Innovation.........................................................................9Figure 3:1 Framework for Evidence Review and Analysis...................................................................13Figure 3:2 Local Authority Rural-Urban Classification (post April 2009)..............................................14Figure 3:3 Importance of Wider Conditions for Innovation to Rural and Urban Businesses in England............................................................................................................................................................. 21Figure 3:4 Importance of Wider Conditions for Innovation to Rural Businesses in England................21Figure 3:5 R&D Employment as a % of Total Employment 2007.........................................................25Figure 3:6 Urban and rural variations of workforce qualification, 2007................................................30Figure 3:7 Map of areas that cannot receive more than 2mbps...........................................................39Figure 3:8 Accumulation of Patent Applications (Number per Million Inhabitants) 1995-2006.............43Figure 3:9 Total Patent Applications (Number per Million Inhabitants) 1995-2006..............................44Figure 3:10 Total Patent Applications by Type (Number per Million Inhabitants) 1995-2006..............45Figure 3:11 Accumulation of High-Tech Patent Applications (Number per Million Inhabitants) 1995-2006..................................................................................................................................................... 47Figure 3:12 Accumulation of ICT Patent Applications (Number per Million Inhabitants) 1995-2006....48Figure 3:13 Accumulation of Biotechnology Applications (Number per Million Inhabitants) 1995-2006............................................................................................................................................................. 49Figure 3:14 Percentage Change in the numbers of firms in Knowledge Intensive Business Services 1998-2006........................................................................................................................................... 52Figure 3:15 Percentage of Employees in Knowledge Intensive Business Services 1998-2005...........52Figure 3:16 Innovation Activity in Firms in England, 2009 (% of Firms)...............................................54Figure 3:17 Labour Productivity in English Districts, 2002 to 2007, Indices (England = 100)..............56Figure 3:18 Labour Productivity in English Districts treating London based districts separately, 2002 to 2007, Indices (England = 100).............................................................................................................57
INDEX OF TABLES Table 3:1 Source of New Knowledge for Firms in England (% of Firms).............................................15Table 3:2 Percentage of Firms Rating themselves as ‘Average’ or ‘Above Average’ in comparison to other Firms in the same Industry.........................................................................................................15Table 3:3 Frequency with which Firms Source Knowledge from Actors Located within their Own Region................................................................................................................................................. 16Table 3:4 Frequency with which Firms Source Knowledge from Actors Located in Other Regions of the UK.................................................................................................................................................. 17Table 3:5 Frequency with which Firms Source Knowledge from Actors Located Overseas................18Table 3:6 Types of Knowledge Most Frequently Sourced from External Actors..................................18Table 3:7 Use of Intermediaries to Source Knowledge from Different Locations.................................19Table 3:8 Barriers to Sourcing Knowledge..........................................................................................19Table 3:9 Share of Employment by Broad Industry Group, 2009.........................................................23Table 3:10 R&D Employment as a % of Total Employment 2007 and 2005........................................24Table 3:11 Creative Class Location Quotients by Local Authority Level Urban-Rural Classification in England (Mean Average=1).................................................................................................................26Table 3:12 Creative Class, Creative Core and Boho Location Quotients at a Regional Level by Local Authority Urban-Rural Classification in England (Mean Average=1)...................................................28Table 3:13 Percentage of Working Age Population with NVQ 4+ in England, 2007 and 2008............29

Opportunities and Barriers to Business Innovation in Rural Areas: Theory and Evidence
Table 3:14 Mean Average Contract Research Income Received per University (£000’s) 2007/08......33Table 3:15 Mean Average Number of Contract Research Projects Received per University 2007/2008............................................................................................................................................................. 33Table 3:16 Mean Average Spin-Offs Established per University by Type, 2007-08.............................33Table 3:17 Innovation Outputs per University 2007/08........................................................................34Table 3:18 Number of New (VAT) Business Registrations per 10,000 Inhabitants within English Districts 2006 and 2007.......................................................................................................................35Table 3:19 Number of New (VAT) Business Registrations per 10,000 Inhabitants within English Districts by Region 2006 and 2007......................................................................................................36Table 3:20 Strategies for Deriving Innovativeness from a Rural Environment.....................................41Table 3:21 Total Patent Applications by Type (Number per Million Inhabitants) 1995-2006................46Table 3:22 Number of Knowledge-Based Businesses as a % of Total Business within English Districts 2007 and 2008..................................................................................................................................... 51Table 3:23 Number of Knowledge-Based Businesses as a % of Total Business within English Districts by Region 2007 and 2008.................................................................................................................... 51Table 3:24 Innovation Active Small Firms in England in 2004 (% of Firms undertaking innovation during the last 12 months)................................................................................................................... 53Table 3:25 Innovation Activity in Firms in England, 2009 (% of Firms)................................................54Table 3:26 Number of Innovations Introduced by Firms in England during the Last 3 Years (innovations per firm), 2009................................................................................................................. 55Table 3:27 Labour Productivity (Output per Employee) within English Districts 2006 and 2007..........56Table 3:28 Labour Productivity in English Districts, 2002 to 2007, Indices (England = 100)...............56Table 3:29 Labour Productivity (Output per Employee) within English Districts 2006 and 2007 by Region................................................................................................................................................. 57Table 3:30 UK Competitiveness Index by Local Authority Level Urban-Rural Classification in England (Mean Average=100), 2008................................................................................................................. 59Table 3:31 UK Competitiveness Index at Regional Level by Local Authority Urban-Rural Classification in England (Mean Average=100).........................................................................................................60Table 3:32 Change in the UK Competitiveness Index at Regional Level by Local Authority Urban-Rural Classification in England............................................................................................................60

Opportunities and Barriers to Business Innovation in Rural Areas: Theory and Evidence
EXECUTIVE SUMMARYBackground and Context
This research was commissioned by Defra in December 2009 and undertaken by GHK Consulting in association with Professor Robert Huggins from the Centre for International Competitiveness, University of Wales Institute; and, Rob Hindle, Rural Innovation. The overall aim of this research was to examine rural-urban differences in innovation behaviour, capability and context in order to identify the opportunities and barriers to business innovation in rural England. To achieve this, quantitative and qualitative evidence was drawn from a variety of sources. This report is based on an extensive review of innovation literature and other secondary evidence; detailed analysis of a range of statistical datasets; and a series of case studies designed to understand the barriers and opportunities to business innovation in different rural contexts. The evidence contained in this report offers policy makers the means by which to grasp the fundamental conditions that bear on a rural firm’s innovativeness, as well as to gauge the extent to which rural innovation conditions are more or less favourable, compared with urban areas. While this is a good starting point, reliance upon existing statistics does bring compromise. Going forward, there would be advantages in developing the key indicators and some underlying data further.
Main Findings of the Research
The headline findings of the study are as follows:
There are a number of aspects of the context for innovation which are more disadvantageous in rural areas as compared to urban areas. For example, the labour pool is smaller and less diversified in rural areas as compared to urban areas; there is limited availability of finance; markets are often lacking in critical mass; rural businesses are further removed from markets, higher education institutions and networks; and their access to them is constrained by distance and a lower quality of ICT infrastructure.
However, innovative firms demonstrate an ability to overcome these disadvantages e.g. by accessing knowledge from further afield and engaging in collaboration and networks. In this context, personal attitude and outlook of entrepreneurs (in particular, motivation, confidence and a willingness to embrace new technologies and ideas) are key factors in overcoming barriers to innovation by some businesses.
At the same time, there are a number of positive drivers for business innovation in rural areas related to social, environmental and demographic trends. For example, the high quality of life in the countryside is attracting highly skilled people from urban areas; changing consumer preferences, climate change and new regulations are creating distinctive opportunities for rural businesses in sectors such as renewable energy, food and drink, tourism, creative industries, high tech engineering, outdoor goods and business services.
Overall, there is little difference between rural and urban firms on most statistical indicators of innovation. However there are some aspects of innovation in which rural firms appear to be performing less well (patents, proportion of knowledge intensive businesses, innovation intensity).
There are variations in business innovation within rural areas – although most regions indicate minor differences, there is some evidence of weak performance in more peripheral areas (e.g. the North East and South West). Whilst the data does not support analysis at a more local leve, it seems likely that these differences are present within regions as well as between them.
i

Opportunities and Barriers to Business Innovation in Rural Areas: Theory and Evidence
Table 1 overleaf, summarises the evidence on the relative strengths and weaknesses of innovation drivers in rural areas. On balance, the evidence suggests that a rural location does not impair the ability of businesses to innovate. While there are significant barriers to innovation in rural areas, it is clear that there are advantages also, and that some businesses derive their innovativeness from being in the rural environment.
ii

Opportunities and Barriers to Business Innovation in Rural Areas: Theory and Evidence
Table 1: Relative Strengths and Weaknesses of Rural Areas
Innovation Drivers Strengths Weaknesses
Entrepreneurship Relatively high levels of self-employment
High start-up levels
Economic Structure: Lower density of knowledge-intensive firms
Businesses are typically smaller in size
Skills Higher proportion of the workforce qualified to Level 4
High quality of life in countryside facilitates the attraction and retention of highly skilled people
Lower levels of innovation-related workers
Smaller and less diversified labour pool as compared to urban areas
Issues with retention of graduates – brain drain – due to limited HE provision and employment opportunities
Finance Fewer options for businesses to obtain private funding locally from financial intermediaries – banks or investors.
Business characteristics such as small size, lack of own capital and tendency to be ‘lifestyle’ businesses (as opposed to growth orientated businesses make rural businesses) less attractive to lenders and external investors
Public Research Few or no HEIs – businesses rely on sources outside the region to source knowledge
Urban universities have more developed links with a larger pool of local SME community as compared to rural universities; are better at commercialising the knowledge that they produce; and produce more graduate start-ups
Intensity of competition
A small business in rural areas is disadvantaged by distance and location; so it faces greater pressure to innovate in order to remain competitive
Internet connectivity is having the dual effect of opening up more distant local markets to greater competition and also enabling firms in rural areas to compete on larger
Thin business environment potentially reduces competitive pressures and the incentive to innovate
iii

Opportunities and Barriers to Business Innovation in Rural Areas: Theory and Evidence
Innovation Drivers Strengths Weaknesses
markets
ICT Infrastructure Significantly lower speed and quality of broadband
Access to Networks Firms more dependent on innovation links within the national economy, suggesting less integration with local clusters or local systems of innovation.
Sparsity of business and population may mean that businesses are relatively more isolated and there are fewer knowledge sources within the region restricting access to tacit knowledge
Demand High purchasing power of rural residents Small size of local markets; particularly, lacking critical mass in sparse/ peripheral areas
iv

Opportunities and Barriers to Business Innovation in Rural Areas: Theory and Evidence
1 INTRODUCTIONInnovation is a key driver of productivity and output growth. According to recent estimates, innovation accounted for two-thirds of UK private sector labour productivity growth between 2000 and 2007, increasing productivity by an average of 1.8 percentage points per year (NESTA, 2009a). Innovation therefore has a key role to play in the development of rural economies; and in determining their competitiveness and economic performance relative to urban areas.
It has however, been argued that there are several aspects of the context for innovation which are more disadvantageous in rural areas as compared to urban areas. Previous research suggests that the distinctive characteristics of rural businesses (e.g. smaller size) and the characteristics of the rural environment itself (e.g. small population and business densities) create barriers to innovation. But, the overall evidence base on rates, patterns and drivers of business innovation in rural areas is weak. Moreover, the nature of innovation has changed dramatically over the past decade due to globalisation; to the emergence of new players like China and India; to the widespread diffusion of information and communication technologies (ICTs); and to competitive pressures to engage in more ‘open’ innovating methods. In parallel, the search for solutions to societal issues such as climate change and aging population is driving new forms of innovation (social innovation). The implications of these developments for rural innovation are yet to be properly examined.
This report draws on analytical literature – both theoretical and empirical studies - and the most recent statistical datasets to address some of the gaps in evidence base on the nature and extent of innovation activity in rural businesses. The report also examines any rural -urban differences in innovation behaviour, capability and context in order to identify the opportunities and barriers to business innovation in rural England.
1.1 Aims and Objectives of the Research
The overall aim of this research is to contribute to the development of a policy agenda designed to support and strengthen the innovative performance of rural businesses.
The research brief issued by Defra specified two objectives for this study:
Objective One: To establish if business innovation in rural areas is different to that in urban areas. And if it is different, how the mechanisms and functions differ.
Objective Two: To examine the implications of the research findings emerging from objective one and to recommend appropriate policy responses for addressing the challenges and opportunities to business innovation in rural areas.
In November 2010, Defra decided to limit the scope of the study to the first of these objectives. This report therefore, does not attempt to draw out the policy implications of the research findings.
1.2 Research Methodology
The following research methods were used to collect and analyse evidence:
1.2.1 Literature Review
The study commenced with a thorough review of academic and grey literature on innovation. This provided the theoretical basis for understanding the processes and determinants of firm-level innovation. Literature on economic geography was also reviewed to understand innovation in a spatial context. Finally, evidence on key aspects of rural economies which are of relevance to innovation (such as business characteristics,
1

Opportunities and Barriers to Business Innovation in Rural Areas: Theory and Evidence
economic structure, demographic trends, skills, access to broadband infrastructure etc.) was collected and analysed. Annex 1 provides a list of research material used for this study.
1.2.2 Statistical Analysis A series of statistical datasets were compiled and analysed to compare rural-urban differences in innovation capacity, innovation outputs and economic outcomes. The main elements of the statistical analysis are briefly summarised below. Further detail on the methodologies used for statistical analysis and the approach to rural-urban classification can be found in Annex 2.
Analysis of ‘Mainstream’ Science, Technology and R&D indicators
Data on following core indicators, usually deemed as important measures of innovation capacity, was compiled and analysed:
R&D expenditure across sectors, especially those of rural significance such as agriculture and energy;
R&D expenditure and R&D personnel;
Patent applications; and,
Human Resources in Science and Technology (HRST).
Many of these metrics were only available at a NUTS 2 or 3 level which meant that rural-urban comparisons could not be drawn at lower and more precise levels of geographies; nonetheless, these indicators were useful in providing a high-level overview of how innovation differs between rural and urban areas.
Analysis of Competitiveness and Knowledge-Based Business Indicators
Drawing on the time series data that has been accumulated by the UK Competitiveness Index (UKCI) initiative over the last ten years, a district level analysis of overall competitiveness (a useful proxy measure of innovation capacity of a district) was carried out. In particular, the analysis was useful in identifying:
The extent to which the competitiveness of rural districts differs from that of urban districts;
The extent to which competitiveness varies across different types of rural districts;
The evolution of the competitiveness of rural districts in comparison with urban districts; and,
The evolution of the competitiveness across different types of rural districts.
Furthermore, the UKCI provides times series data for the density of knowledge-based businesses in particular districts. These knowledge-based businesses are recognised by the Organisation for Economic Co-operation and Development (OECD) and the UK Department for Business, Innovation and Skills (BIS) as those operating in sectors with the greatest innovation and R&D intensity. Both a cross-sectional and times series analysis of the UKCI knowledge-based business index was undertaken to ascertain variations across rural and urban districts. The index was also disaggregated by manufacturing and service-based firms to better understand if, and how, innovation capacities in the rural economy are more reliant on manufacturing or service-led activities.
Analysis of Innovation-Intensive Occupations
An occupational analysis at county level, focussing on those occupations with a propensity for high levels of innovation and creativity, was also undertaken. This analysis was inspired by the work of Richard Florida, who has sought to measure the so-called ‘creative class’ across cities. Given the relative neglect of the rural economy in connection with these
2

Opportunities and Barriers to Business Innovation in Rural Areas: Theory and Evidence
metrics, it was useful to undertake such an analysis in the context of this study. As part of this analysis, location quotients (i.e. densities) were estimated for the following occupational groups:
Scientists and engineers, architects and designers, academics and teaching professionals (the so-called ‘creative core’);
Associated professional and technical occupations of the creative core, as well as managers, financial and legal professionals (so-called ‘creative professionals’); and,
Artistic and creative occupations (so-called ‘bohemians’).
This approach provided a wider view of innovation beyond ‘traditional’ technology and knowledge-based approaches; and a new perspective on patterns of creativity and innovation capacity.
Analysis of an England-wide Business Innovation Survey
A unique analysis was carried out of the respondents from England (c. 350) to the UK-wide business survey co-funded by the National Endowment for Science, Technology and the Arts (NESTA) and the Economic and Social Research Council (ESRC). The survey addressed the following key themes and issues:
The extent of innovation – numbers of product, process or organisational innovations;
The types of actors from which knowledge for innovation is sourced;
The nature of the networks which firms use to source knowledge for innovation, e.g. informal or more strategically managed;
The location of actors from which knowledge is sourced, e.g. local region, elsewhere in the UK, or overseas;
The types of knowledge sourced to innovate, e.g. technology, scientific information, or professional intelligence; and
Barriers to innovating.
The survey results were analysed to assess whether or not there are any discernable or significant differences between firms located in rural and urban areas. This analysis provided important insights into the nature of the systems of innovation and networks employed by firms located in rural economies.
Analysis of the Higher Education Business Interaction Survey
Alongside the business sector, universities and the higher education sector are increasingly recognised as important innovation actors and key nodes within knowledge networks and innovation systems. The purpose of this analysis was to better understand if universities located in rural economies differ in terms of their innovation outputs and whether or not their engagement, through knowledge transfer activities, with their local economies is different from that of universities located in urban areas. This analysis utilised the data captured annually by the Higher Education Business and Community Interaction Survey (HEBCIS) managed by the Higher Education Statistics Agency (HESA) and previously by the Higher Education Funding Council for England (HEFCE). HEBCIS, which covers all Higher Education Institutions (HEIs) in England, provides a wealth of data related to university knowledge commercialisation and knowledge transfer activity. Key metrics captured by the HEBCIS survey include:
Spin-out activity;
Patenting and licensing activity;
3

Opportunities and Barriers to Business Innovation in Rural Areas: Theory and Evidence
Income from Intellectual Property;
Income for knowledge transfer and commercialisation; and,
Percentage of knowledge commercialisation income generated from local (regional) sources.
Analysis of NESTA’s Firm Level Survey Data
The study team was given access to the raw data collected via a survey of 1,500 firms across the UK undertaken in 2009 as part of NESTA’s Innovation Index (NESTA, 2009b). The survey collected data on innovation activity in nine knowledge intensive sectors of the UK industry, namely: architectural services; accountancy services; business consultancy; legal services; software and IT services; automotive; construction; energy; and design services.
For the purpose of this research, data for those firms located in England was isolated. This amounted to 1,278 firms (798 in urban localities, and 480 in rural localities).
The survey data provided evidence on the following themes:
Drivers of innovation;
Sources of knowledge and ideas;
Innovation process; and,
Knowledge exploitation - how firms exploit and benefit from innovation.
1.2.3 Case StudiesFinally, case study based research was conducted to understand the barriers and opportunities to business innovation in different rural contexts. Four case studies were developed to explore qualitatively and illustrate the role of agglomeration in overcoming barriers associated with ‘rurality’ and in enhancing the innovativeness of rural businesses. Additionally, a case study was developed to understand innovation behaviour and activity of businesses located in the remote rural areas of Northumberland and Lincolnshire. The case studies were based on desk review and interviews with key stakeholders and a limited number of businesses.The aim of the case studies was not to draw generalisations but, rather, enrichment of knowledge as to ‘how’ and ‘why’ rural businesses innovate.
1.3 Structure of the Report
The Report continues in the following sections:
Section 2 provides an overview of key concepts and theories by way of background information;
Section 3 presents an analysis of the evidence collected within the context of this research project; and,
Section 4 draws out the main messages from this research.
The following annexes provide additional information:
Annex 1: Bibliography and references;
Annex 2: Classifications and definitions;
Annex 3: Case studies;
Annex 4: List of research participants.
4

Opportunities and Barriers to Business Innovation in Rural Areas: Theory and Evidence
2 FIRM LEVEL INNOVATION: A REVIEW OF THEORYThis section provides the theoretical basis for the evidence review presented in the following section (section 3). It first defines innovation; followed by an overview of the firm level innovation process and a description of the main drivers of innovation as identified in literature.
2.1 Definition of Innovation
While there is general understanding of what innovation is, there is no universally accepted definition of innovation. Over time, definitions have evolved from a narrow focus on technological product and process innovation to include a much wider range of activities, including marketing and organisational innovations, and hidden innovation.
The Oslo Manual (OECD/ Eurostat, 2005) defines innovation as ‘the implementation of a new or significantly improved product (good or service), process, a new marketing method, or a new organisational method in business practices, workplace organisation or external relations’. By definition, all innovation must contain a degree of novelty. The Oslo Manual distinguishes three relevant concepts: new to the firm, new to the market and new to the world. The first concept covers diffusion of existing innovation to a firm (i.e. the innovation may have already been implemented by other firms, but is new to the firm in question). Firms that first develop innovation (new to market or new to world) can be considered as drivers of innovation.
However, every novel idea is not necessarily innovation; it must be capable of commercialisation. According to BIS, ‘innovation is the successful exploitation of new ideas’. A recent definition adopted by the US Advisory Committee1 recognises that innovation is more than something new; it has the added component of adding value for both customers and firms. It defines innovation as ‘the design, invention, development and/or implementation of new or altered products, services, processes, systems, organisational structures, or business models for the purpose of creating new value for customers and financial returns for the firm’.
The concept of adding value or commercialisation of outcomes is also emphasised by Nedis and Byler (2009), who define innovation as ‘the ability to take new ideas and translate them into commercial outcomes by using new processes, products or services in a way that is better and faster than the competition’.
2.2 The Innovation Process
The process by which firms commercially exploit new knowledge can be represented as an innovation value chain (IVC) comprising three stages: knowledge sourcing, transformation and exploitation (Hansen and Birkinshaw, 2007) (Figure 2:1). The first of these includes firms’ efforts to source the different types of knowledge necessary for innovation (Hansen and Birkinshaw 2007; Roper, Du, and Love 2008). This may involve firms undertaking in-house knowledge creation alongside, and either complementing or substituting for, external knowledge sourcing (Pittaway et al. 2004). The second stage in the innovation value chain is the transformation of knowledge inputs into innovation outputs i.e. new or improved products or processes, marketing or organisational methods). The final stage in the innovation process is the exploitation of firms’ innovation outputs with the aim of creating value (i.e. productivity improvements or growth).
1 The Advisory Committee on Measuring Innovation in the 21st Century Economy (2008) Innovation Measurement: Tracking the State of Innovation in the American Economy, A Report to the Secretary of Commerce, Department of Commerce, Washington DC.
5

Knowledge Sourcing Knowledge TransformationKnowledge Exploitation Economic Outcomes
Opportunities and Barriers to Business Innovation in Rural Areas: Theory and Evidence
Figure 2:1 The Innovation Value Chain
2.3 Drivers of Innovation
The efficacy of a firm’s innovation value chain is influenced by a variety of internal and external factors. Contextual factors, shaped by regional, national and international policies, the general business climate as well as inter- and intra-firm conditions contribute to the innovation performance of firms.
A review of innovation literature suggests that the drivers of innovation are multi-dimensional, multi-layered, and at least three levels can be distinguished (Figure 2:2):
Firm specific factors such as its internal capabilities as well as its external linkages and interactions with suppliers, customers, competitors, and research institutions;
Wider framework conditions that surround innovation activities at the firm level and determine the broad parameters within which innovation can occur; and,
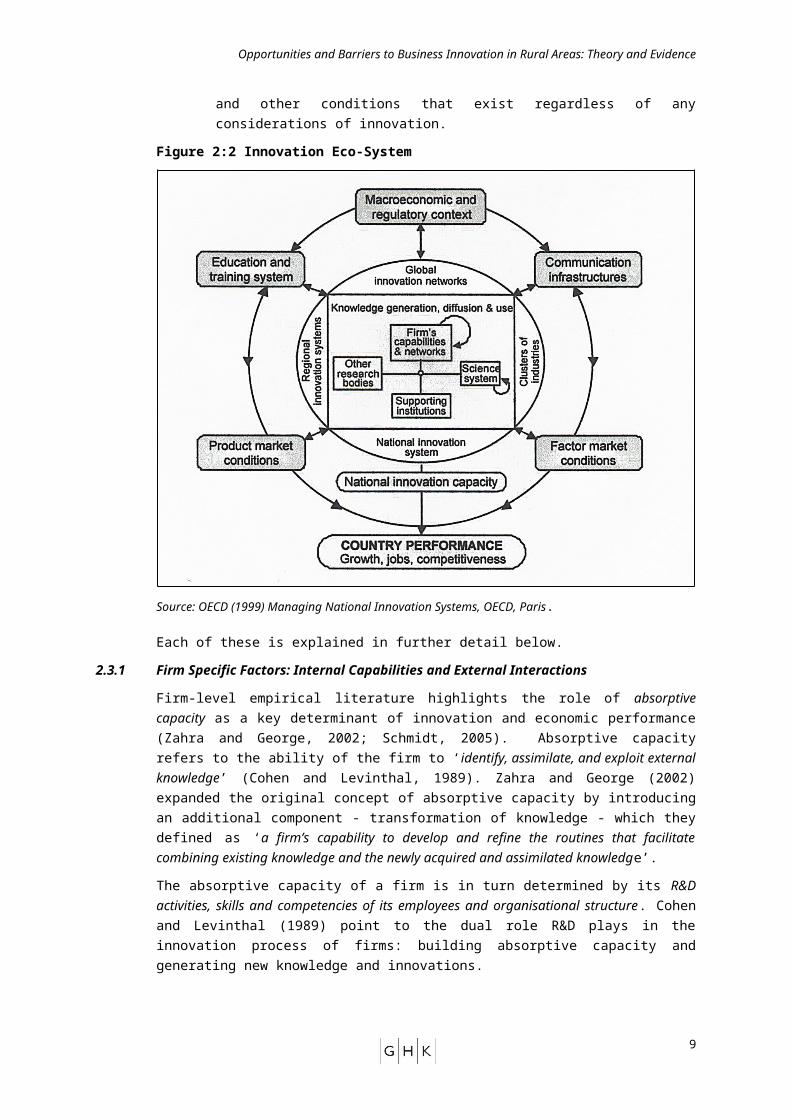
The range of opportunities for innovation is also influenced by a third set of factors – the surrounding environment of institutions, legal arrangements, macroeconomic settings, and other conditions that exist regardless of any considerations of innovation.
Figure 2:2 Innovation Eco-System
Source: OECD (1999) Managing National Innovation Systems, OECD, Paris.
Each of these is explained in further detail below.
6

Opportunities and Barriers to Business Innovation in Rural Areas: Theory and Evidence
2.3.1 Firm Specific Factors: Internal Capabilities and External Interactions
Firm-level empirical literature highlights the role of absorptive capacity as a key determinant of innovation and economic performance (Zahra and George, 2002; Schmidt, 2005). Absorptive capacity refers to the ability of the firm to ‘identify, assimilate, and exploit external knowledge’ (Cohen and Levinthal, 1989). Zahra and George (2002) expanded the original concept of absorptive capacity by introducing an additional component - transformation of knowledge - which they defined as ‘a firm’s capability to develop and refine the routines that facilitate combining existing knowledge and the newly acquired and assimilated knowledge’.
The absorptive capacity of a firm is in turn determined by its R&D activities, skills and competencies of its employees and organisational structure. Cohen and Levinthal (1989) point to the dual role R&D plays in the innovation process of firms: building absorptive capacity and generating new knowledge and innovations.
‘…while R&D obviously generates innovations, it also develops the firm’s ability to identify, assimilate and exploit knowledge from the environment – what we call a firm’s ‘learning’ or ‘absorptive’ capacity’ (Cohen and Levinthal, 1989).
A firm’s absorptive capacity depends also on the knowledge embodied in human capital and individual skills. Vinding (2004) stresses that formal education, work experience, the organisational set-up and development of a closer relationship with external and internal actors, all matter for the determination of absorptive capacity. There is also extensive evidence that investments in employee training and acquisition of new skills develop a firm’s absorptive capacity. However, a firm’s absorptive capacity is not the simple sum of its employees’ abilities as Cohen and Levinthal (1990) argue. According to them, it depends on the ability of an organisation as a whole to stimulate and organise the transfer of knowledge across departments, functions, and individuals. This aspect of absorptive capacity has been incorporated into many studies: It has been shown that the absorptive capacity of a firm is determined by its expertise in stimulating and organising knowledge sharing (Van Den Bosch et al., 1999). Different organisational structures and management practices allow an organisation to stimulate and organise the transfer of knowledge across functions and between individuals, and from external sources (Aghion and Tirole, 1994; Cosh et al., 2004, Lam, 2005). Human resource management can also stimulate learning through reward systems and training which increase absorptive capacities (Daghfous, 2004). Williamson (1967) has argued that information can be lost or distorted as it is transferred through different hierarchal structures. He suggests that human resource management systems lead to a more efficient transfer of knowledge and, therefore, higher absorptive capacity.
According to the literature, a firm’s absorptive capacity influences not only its capability to create knowledge in-house; but also its ability to assimilate and exploit external knowledge and network with potential partners in innovation activity. In order to carry out innovative activities, firms must accumulate and process internal and external knowledge, establishing learning processes based on different sources (Malecki, 1991; Stiglitz, 1987). In other words, firms must synthesise a wide variety of expertise and knowledge produced by different complementary sources in order to produce and successfully commercialise innovation.
‘ … innovation is becoming more complex for businesses of all sizes and all sectors Innovation is becoming more widely distributed and collaborative. Both at home and abroad, a growing number of businesses are sharing knowledge with universities, suppliers and small firms, rather than relying on in-house knowledge. As a result, collaboration and networking (often across geographical boundaries) are playing an increasingly central role in innovation processes’ (NESTA, 2008a).
7

Opportunities and Barriers to Business Innovation in Rural Areas: Theory and Evidence
Innovation studies have also underlined the importance of firm’s linkages to external networks and the interaction of different organisations in fostering the innovation process. Innovation studies have shown that firms’ innovation activity is enhanced, and sometimes depends upon, cooperation between firms and other organisations (Freeman, 1991, 1994) such as universities and research centres (Cohen et al., 2002; Jaffe, 1989), suppliers and users (Lundvall, 1988; Sako, 1994; Shaw, 1994, Von Hippel, 1988) or even competitors (Coombs et al., 1996). Adler and Shenbar (1990) use the term ‘external assets’ to describe a firm’s external linkages. They delineate three specific linkages that a firm could foster:
Downstream links to customers: this refers to the extent of access a firm has over customers’ decision-makers. Also the extent to which the firm learns from the customers, since customers are often an important source of new ideas.
Upstream links to materials and component suppliers, equipment vendors and relevant sources of scientific and technological knowledge: this relates to how well the firm has formed links with best people in the field and whether those relationships are sufficiently collaborative.
Horizontal links through alliances, industry associations and informal networking: these linkages can provide substantial knowledge to trigger the development of the firm’s technological assets (reproducible capabilities in product, process, and support areas).
In this context, the New Economic Geography literature emphasises the role of ‘agglomeration’ and the ‘density’ of economic interactions as the key catalysers of innovation. Agglomeration influences economic outputs and innovative performance through a mix of different sources of Marshallian agglomeration economies (labour market interactions, linkages between intermediate and final good suppliers, knowledge spillovers). The literature distinguishes between agglomeration effects that arise from the scale or density of activity within a particular industry (localisation economies) and from those due to urban scale i.e. spatial proximity of many diverse firms (urbanisation economies).
Following Duranton and Puga (2003), the forces behind agglomeration economies can be broken down into ‘sharing’ (e.g. sharing of infrastructure, production facilities and marketplaces, thereby reducing the cost for each user), ‘matching’ (access to a large and diverse pool of customers, suppliers and highly skilled labour, making it easier for each firm to fulfil its specific/ distinctive needs), and ‘learning’ mechanisms (close proximity to other firms and individuals in similar industries provides opportunities for face to face contact and facilitates the building of trusts, leading to the sharing of information, ideas and experiences). The creation, accumulation, and diffusion of knowledge also rely upon different types of coordination enabled by face-to-face contacts (Storper and Venables 2004). Close proximity thus becomes a condition for the dissemination of information, which would otherwise be impossible or too expensive to codify (Charlot and Duranton 2006).
2.3.2 Wider Framework Conditions for Innovation
In order to perform as knowledge producing and exploiting organisations, firms not only need internal capabilities and assets, but an innovation friendly ecology. The innovation performance of firms often hinges upon the quality of ‘wider framework conditions’ and the existence of an innovation-friendly environment.
8

Competition
FinanceDemand
Skills
Culture
Public ResearchICT Infrastructure
Opportunities and Barriers to Business Innovation in Rural Areas: Theory and Evidence
‘Wider Framework Conditions’ are defined in literature as those factors which are outside the direct control of the firm that shape its innovation performance. An extensive review of literature demonstrates an empirical relationship (or at least a strong theoretical link) between the following framework conditions and firm level innovation performance: skills; finance, demand; competition; ICT infrastructure; culture and public research (Figure 2:3).
Figure 2:3 Wider Framework Conditions for Innovation
Skills –The evidence for a link between skills and innovation is well established in literature (e.g. DTI, 2006; Nickell and Nicolitsas, 1997; de Clercq and Dakhli, 2003 regarding general education; Baldwin and Johnson, 1995 regarding on-the-job training). Numerous studies support the hypothesis that a skilled and trained workforce fosters productivity and innovation (e.g. Dearden et al., 2000; Acernoglu, 1998, who finds that increases in the worker skill profile are associated with complementary increases in firms’ innovativeness). The importance of skills is most obvious in relation to ‘front-line’ R&D staff whose job it is to carry out work with the objective of facilitating the ultimate production of innovative products or processes, and other employees who participate actively and directly in R&D. However, formal R&D skills are often neither a necessary nor sufficient condition for the successful generation and adoption of innovations. Skills and flexibility to adapt working practices and adopt new procedures is a crucial component of the overall need for adequate absorptive capacity for new technology within the firm. This applies both to internally-generated innovations and those that have diffused from external innovators. More generally, the ability for day-to-day problem solving within the workforce, which should be fostered by general education, will help both adaptability to new ideas and generation of them. Further, the supply of innovations, from whatever source, is no guarantee of adoption or usage – the demand side is equally important. This has implications for skills both within the innovating business and in the wider population. With the production of increasingly sophisticated goods and services, the knowledge and skills set embodied in the general consumer population becomes an important factor in the adoption and diffusion of innovations. The ability of the general population to adapt to, and learn how to use, new devices is essential to their success in the market place.
Availability and access to finance - Firms need finance to commercially exploit new ideas. There are two basic sources of finance: internally generated funds (i.e. personal savings, retained profit and sales of assets); and external funding (debt, equity and ‘soft capital’). According to financing theory, innovation is principally funded by firms' own financing. However, there is clear evidence, based on theories, surveys and empirical estimation, that innovation is often obstructed or abandoned due to financing constraints; and that, new and small innovative firms often cannot finance investment (in innovation)
9

Opportunities and Barriers to Business Innovation in Rural Areas: Theory and Evidence
from internal sources and are particularly reliant on external sources of finance . After an entrepreneur or team of entrepreneurs identify a business opportunity, and exhaust their own resources, they often turn to external sources of finance (debt, equity, stock markets). At this stage, firms tend to be high risk investment opportunities with intangible assets and uncertain cash flows. These features make it extremely difficult for innovative start-ups to secure a loan from banks. Such firms rely on early-stage equity finance: venture capital and angel investments to meet their financing needs. However, as firms become larger, they increasingly rely on institutional investors and banks as their primary source of finance. While stock markets provide access to equity for established firms, banks serve as a source of finance for private firms and small firms from established sectors (Levine and Zervos, 1998).
Demand conditions – These refer to the factors that influence the creation and articulation of demand, the take-up of innovations and thereby the innovation activity and performance of companies. Demand has two dimensions of importance for innovation: responsiveness i.e. the way in which firms, consumers and public users absorb innovations. Next to market size (Schmookler 1962, 1966), the marketing literature has put great emphasis on the adoption and the speed of diffusion of innovation as an important positive characteristic of markets and the innovation behaviour in markets (e.g. Dekinpe et al 2000, Tellis et al 2003, Trott 2003, Veryzer 2003). The second dimension of demand is triggering demand i.e. the way in which firms, consumers and public users signal new needs for innovation, and the willingness for, and the level of interaction of, users with producers. Customers provide important input to the innovation process (e.g. von Hippel 1986, Guerzoni 2007, Prandelli et al. 2008) and contribute to the productivity and competitiveness of firms and markets (more generally see Porter 1990, McMeekin et al 2002).
Intensity of competition - In an increasingly globalised and commoditised world, firms have to differentiate themselves in order to preserve their market position or to break into new markets; and in order to differentiate, they have to innovate. And when their competitors catch-up with these innovations, the really successful firms produce some more innovations; while the less successful firms cease to exist. The literature, on balance, also supports the existence of a strong link between competitive intensity and innovation and productivity (Arrow 1962, and Scherer, 1967). This literature indicates that the entry and exit, and the growth and decline of individual firms (firm dynamics), by allowing resources to be reallocated from less productive to more productive businesses, plays an important role in enabling innovation and productivity growth.
ICT infrastructure - The innovation literature tends to focus on ICT infrastructure as the important driver of innovation, rather than more traditional forms of infrastructure. ICT infrastructure has produced a massive increase in the connectivity of a typical business, both in terms of the scope and scale of its connections as well as the speed at which potential links can be appraised and connections made and unmade. The rise of advanced ICT technologies has provided firms much more locational freedom and the market for an increasing share of goods and services is now global. The increasing capacity and almost costless quality of this information superhighway is providing a platform for developments both in the way that businesses innovate, and for innovations themselves, just as earlier generations of ‘new’ infrastructure would have done. The innovation literature suggests that the extent to which some or all of a country’s business community has ready access to high-speed communications infrastructure, will have a bearing, all things being equal, on national innovativeness. The overall rate of innovation should improve the closer one gets to universal coverage of this enabling technology.
Cultural factors - Concepts of entrepreneurship and risk taking are often highlighted as important social-cultural determinants of innovation. Beugelsdijk (2007), for example, demonstrated that the propensity for innovation and entrepreneurship go hand-in-hand. A strong risk taking culture is a crucial enabling condition for the emergence of innovations that can find commercial tractability in the marketplace. According to the literature, out of
10

Opportunities and Barriers to Business Innovation in Rural Areas: Theory and Evidence
the personal entrepreneurial traits, fear of failure is one of the most important obstacles preventing start-ups (Caliendo et al. 2009, Wagner 2003 and 2005). High-risk aversion can retard nascent entrepreneurship. Among cultural factors, tolerance, openness and inclusion are also considered vital to economic growth and innovation. It is often argued that talent is attracted to an open, tolerant and inclusive society. As long ago as 1869, John Stuart Mill recognised that tolerance is essential for objective thinking. The toleration of diverse opinions allows an intellectual freedom that is just not available when the individual rights of the person are not given their fullest expression. More recent work by Florida (1999, 2000, 2002a, 2002b, 2002c, 2005; Florida and Gates 2001) demonstrates that talent is attracted to regions that offer low barriers to entry and higher levels of openness and tolerance. Florida and Gates (2001) found a significant relationship between the level of immigration and regional growth for small and medium-size regions and between the level of the gay population and growth in large regions.
Public research - Alongside other sources of knowledge such as companies and users, the science base (mainly universities) is widely recognised as an important component of the innovation system, and as a key driver for the creation of new ideas, some of which have the potential to deliver both innovation and significant economic and social benefits (DIUS, 2008; D´Este and Patel 2007; Etzkowitz 2002; Agrawal and Henderson 2002; Schartinger et al. 2002). However, empirical work demonstrating the profitability of the ‘science-industry connection’ is not so abundant, although there are a number of studies that provide substantial empirical evidence of the positive influence of university research on innovation (O´Shea, Chugh and Allen 2008; Wright et al. 2006 on spin offs creation; and Etzkowitz 2004; Slaughter and Leslie 1999, on entrepreneurial universities; and OECD, 2004; Hollanders, and Arundel, 2007; Innobarometer; 2007, and Nordic Innovation Monitor, 2009 on wider framework conditions for innovation).There is a presumption that geography matters still in this area, and that businesses will benefit from proximity to a strong local research base, producing density of outputs – trained people, new knowledge, know how, etc – that cannot easily be substituted by tapping into flows generated in other, more remote territories.
Finally, it should be noted that while innovation literature helps us identify specific conditions influencing innovativeness; a key limitation of the literature however, is that it provides no empirical evidence on the relative importance of the wider framework conditions for innovation. One could intuitively rank skills as the most important framework condition for innovation; but there is no empirical evidence to confirm this.
2.3.3 Other Contextual Factors
The absorptive capacity of firms and the framework conditions for innovation are in turn influenced by exogenous factors or wider social and economic processes, most notably:
Demographic change – such as migration and age profile of the population;
Environmental factors such as climate change;
Macroeconomic conditions such as the state of the economy (recession or recovery), monetary conditions etc.;
Quality of and access to business infrastructure e.g. business premises, transport infrastructure;
Social trends and changing consumer preferences; and
Regulations and standards
The relative importance of these wider contextual factors is likely to vary between sectors. For example, regulations are a key driver of innovation with regard to environmental technologies, while changing consumer tastes and preferences are relatively more important in the leisure sector.
11
Opportunities and Barriers to Business Innovation in Rural Areas: Theory and Evidence
2.4 Concluding Remarks
All of these factors discussed above create the eco-system within which individual businesses operate, and to which they respond. The first question in examining innovation in rural areas therefore is to consider whether these factors are overtly influenced by different spatial conditions – i.e. whether “place” matters. An initial appraisal suggests that, while a number of the firm level factors may be within the internal control of an organisation and therefore not necessarily place dependent, others relate to the external interactions of firms with suppliers, customers, competitors and knowledge providers. To the extent that these relationships are influenced by the geographical proximity (and density), and accessibility of these different actors, they are potentially affected by the firm’s location. Furthermore, while some of the wider framework conditions and contextual factors (e.g. national regulations, economic climate, consumer preferences) are likely to be common to all firms; many also vary by location (e.g. demographic change, skills, competition, ICT and other infrastructure, and cultural factors). These place-related drivers have the potential to impact differently on rural and urban areas, and therefore to influence opportunities and barriers for business innovation. Perhaps as a result of these factors, the economic outputs generated by rural businesses appear to be lower than those generated by urban businesses when measured by the level of earnings, their contribution to national output relative to share of business stock and productivity per worker. These differences in output have also contributed to suggestions that rural areas may be disadvantaged and may face greater barriers to innovation than urban areas. The following sections test this proposition with reference to statistical evidence and the wider literature.
12

Opportunities and Barriers to Business Innovation in Rural Areas: Theory and Evidence
3 BUSINESS INNOVATION IN RURAL AREAS: A REVIEW OF EVIDENCEThis section presents the results of the statistical analysis and the evidence review. It is structured as follows: approach to statistical analysis and evidence review (section 3.1); definition of rural and urban areas (section 3.2); evidence on drivers of innovation (section 3.3); and, evidence on rates and patterns on innovation (section 3.4).
3.1 Approach to Statistical Analysis and Evidence Review
Figure 3:4 illustrates the framework that was adopted for reviewing and analysing evidence. It reflects the gist of the theoretical concepts discussed in the previous section i.e. a firm’s innovation capacity is influenced by a variety of internal and external factors; and is reflected in its innovation outputs which a firm commercially exploits to create economic value.
Figure 3:4 Framework for Evidence Review and Analysis
3.2 Defining Rural Geography
The urban-rural classification of local authority areas used in this report is based on that published by Defra (). It consists of a six-fold classification as follows:
Major Urban: districts with either 100,000 people or 50 per cent of their population in an urban area with a population of more than 750,000.
Large Urban: districts with either 50,000 people or 50 per cent of their population in one of 17 urban areas with a population between 250,000 and 750,000.
Other Urban: districts with fewer than 37,000 people or less than 26 per cent of their population in rural settlements and larger market towns.
13

Opportunities and Barriers to Business Innovation in Rural Areas: Theory and Evidence
Significant Rural: districts with more than 37,000 people and more than 26 per cent of their population in rural settlements and larger market towns.
Rural-50: districts with at least 50 per cent but less than 80 per cent of their population in rural settlements and larger market towns.
Rural-80: districts with at least 80 per cent of their population in rural settlements and larger market towns.
Figure 3:5 Local Authority Rural-Urban Classification (post April 2009)
This definition was adapted for some datasets (for which data is only available for higher level geographies) to achieve the level of granularity required for rural-urban analysis. For example, some of the metrics utilised in this report are only available at a NUTS 2 regional level. It was therefore, necessary to produce a separate classification at a NUTS 2 level based on an analysis of the rural population contained within the constituent districts of each NUTS 2 region. In some sections of the report, rural-urban comparisons have been drawn from datasets based on eight point classification or postcodes. The underlying geographical units for the datasets used are indicated in the footnotes to each table/ graph.
14

Opportunities and Barriers to Business Innovation in Rural Areas: Theory and Evidence
3.3 Evidence on Drivers of Innovation3.3.1 Firm Specific Factors: Absorptive Capacity and External Linkages
As previously mentioned, innovating firms actively seek and combine knowledge from different sources, both internal and external. Knowledge sourcing from external sources has become increasingly important to firms which cannot generate internally all of the knowledge necessary for new product and process development. Table 3:1 shows that firms in rural locations show a similar tendency to innovate using externally sourced knowledge and that a slightly greater proportion of rural firms engage in R&D in relation to their urban counterparts.
Table 3:1 Source of New Knowledge for Firms in England (% of Firms)
Percentage of firms reporting that... Urban Areas
Rural Areas
...None of new products or services typically come from ideas that were initially developed outside the firm 31.5% 30.8%
...1 to 49% of new products or services typically coming from ideas that were initially developed outside the firm 39.1% 38.0%
...50% or more of new products or services typically coming from ideas that were initially developed outside the firm 21.0% 22.6%
...Conducting or commissioning R&D over the last year 20.7% 22.3%
Based on data collected by Roper et al (2009) as part of NESTA Innovation Index projectNote: Binary classification based on postcodes *= difference significant at 0.05 level; **= 0.01 level; *** = 0.001 level (non-parametric Mann-Whitney tests).
Table 3:2 on the other hand, suggests that firms in rural locations may commit slightly less internal resource to innovation although not to an extent that is statistically significant. For example, firms in rural areas appear to spend less than urban firms on R&D; new equipment or software; and, staff training and development.
Table 3:2 Percentage of Firms Rating themselves as ‘Average’ or ‘Above Average’ in comparison to other Firms in the same Industry
CriteriaUrban Areas
Rural Areas
Amount spent on R&D 65.9% 62.9%
Amount spent on new equipment or software 82.2% 79.2%
Amount spent on staff training and development 80.1% 78.5%
Amount spent on design or design services 65.4% 64.0%
Extent to which a firm works with external partners to obtain the ideas and information needed to develop new products, services or processes
75.4% 70.4%
Acquiring and generating the ideas and information needed to develop new or improved products or services
90.6% 87.1%
Using this knowledge to create new or improved services or processes 91.6% 85.8%
Selling these new or improved products and services 86.5% 85.4%
15

Opportunities and Barriers to Business Innovation in Rural Areas: Theory and Evidence
CriteriaUrban Areas
Rural Areas
Creating intellectual property 67.5% 65.2%
Selecting ideas that will generate the greatest return 89.5% 89.0%
Development time from idea to market 76.7% 76.9%
Use of development time from idea to market 64.2% 58.5%
Extent to which a firm works with external partners on products, services, and process development 71.8% 66.3%
Based on data collected by Roper et al (2009) as part of NESTA Innovation Index projectNote: Rural-urban classification based on postcodes *= difference significant at 0.05 level; **= 0.01 level; *** = 0.001 level (non-parametric Mann-Whitney tests).
Table 3:3 to Table 3:8 examine further evidence on the knowledge sourcing patterns of firms in England based on the geographic location of existing knowledge sources. Table 3:3 illustrates the frequency with which firms access knowledge from actors within their own region. Suppliers and customers tend to be the most frequently accessed sources of local knowledge. Overall, it appears that there is very little difference in the frequency with which firms in either rural or urban locations source local external knowledge for innovation. Using a Mann-Whitney two-tailed test of difference across the two samples we find that the most significant difference is for ‘competitors or other businesses in your industry’ (significant at a level of 6%) [Note a 5% level is generally considered to be the minimum required to state that two samples are significantly different].
Table 3:3 Frequency with which Firms Source Knowledge from Actors Located within their Own Region
Source within own region Urban Rural All
Suppliers of equipment, materials, services, or software 4.6 4.6 4.6
Clients or customers 4.6 4.5 4.6
Universities or other higher education institutes 3.9 3.4 3.7
Conferences, trade fairs, exhibitions 2.8 2.8 2.8
Scientific journals and trade/technical publications 2.6 3.2 2.8
Competitors or other businesses in your industry 2.9 2.2 2.7
Consultants 2.7 2.5 2.6
Technical, industry or service standards 2.2 1.9 2.1
Government or public research institutes 1.6 1.7 1.6
Commercial labs or private R&D institutes 1.1 1.0 1.0
Source: Based on Data Collected for Huggins et al. (2009); (0=Never, 10=Very Often)Note: Rural-urban classification based on postcodes *= difference significant at 0.05 level; **= 0.01 level; *** = 0.001 level (non-parametric Mann-Whitney tests).
The above assertion was also confirmed through case study research examining the interaction of rural firms with HEIs (see Evidence Box 1).
16

Opportunities and Barriers to Business Innovation in Rural Areas: Theory and Evidence
Evidence Box 1: Interaction of Rural Firms with HEIs
Knowledge Exchange practitioners from Lancaster University Management School and University of Central Lancashire, who were interviewed for the case study work, expressed the view that there was no real difference in the ability of rural and urban firms to engage with HEI innovation networks. Their experience was of firms travelling from throughout the region to engage in networking and knowledge exchange activity on the campus. It was the view of the practitioners that a firm’s ability to engage with knowledge exchange and to apply intelligence gained to innovation was as much to do with culture and attitude as it was with geography.
The frequency with which firms access knowledge from sources located in UK regions other than own home region is shown in Table 3:4. It is noticeable that firms in rural locations tend to more frequently access knowledge from non-regional domestic sources. The fact that this tendency is consistent across the majority of source types suggests that firms in rural areas place a higher premium on accessing sources from other parts of the UK than do their urban counterparts. Firms in urban areas may have better links or be able access better quality knowledge from known knowledge sources within their region, whilst firms in rural areas may possess fewer links to quality knowledge locally, and therefore look further afield. Interestingly, it is found that firms in rural areas are significantly more likely to source knowledge from conferences, trade fair and exhibitions, and government or public research institutes in other parts of the UK, compared with firms located in urban areas.
Table 3:4 Frequency with which Firms Source Knowledge from Actors Located in Other Regions of the UK
Source outside own region Urban Rural All
Clients or customers 5.5 5.6 5.5
Suppliers of equipment, materials, services, or software 5.0 5.9 5.3
Scientific journals and trade/technical publications 4.9 5.5 5.1
Conferences, trade fairs, exhibitions 3.8** 5.1** 4.1
Competitors or other businesses in your industry 3.5 3.4 3.5
Technical, industry or service standards 3.4 3.8 3.5
Universities or other higher education institutes 2.9 3.5 3.1
Consultants 2.5 2.7 2.5
Government or public research institutes 2.0* 2.9* 2.2
Commercial labs or private R&D institutes 1.4 1.5 1.5
Source: Based on Data Collected for Huggins et al. (2009); (0=Never, 10=Very Often)Note: Rural-urban classification based on postcodes *= difference significant at 0.05 level; **= 0.01 level; *** = 0.001 level (non-parametric Mann-Whitney tests).
As shown by Table 3:5, firms tend to access knowledge for innovation less frequently from overseas sources compared with domestic sources. In terms of differences across firms located in urban and rural areas there appears to be little variation in the frequency of international knowledge sourcing. This indicates that the propensity and barriers to engage in international innovation efforts do not appear to vary across location type.
17

Opportunities and Barriers to Business Innovation in Rural Areas: Theory and Evidence
Table 3:5 Frequency with which Firms Source Knowledge from Actors Located Overseas
Overseas sources Urban Rural All
Clients or customers 3.8 4.0 3.9
Suppliers of equipment, materials, services, or software 3.6 4.2 3.8
Scientific journals and trade/technical publications 3.7 3.8 3.7
Conferences, trade fairs, exhibitions 3.4 3.7 3.5
Competitors or other businesses in your industry 3.0 2.9 2.9
Technical, industry or service standards 2.5 2.3 2.5
Universities or other higher education institutes 1.5 1.5 1.5
Consultants 1.1 1.3 1.2
Commercial labs or private R&D institutes 1.0 0.8 0.9
Government or public research institutes 0.8 1.0 0.8
Source: Based on Data Collected for Huggins et al. (2009); (0=Never, 10=Very Often)Note: Rural-urban classification based on postcodes *= difference significant at 0.05 level; **= 0.01 level; *** = 0.001 level (non-parametric Mann-Whitney tests).
As well as the location of knowledge sources, it is important to assess what types of knowledge the firms are accessing in their bid to innovate, and whether or not this varies across locations. As indicated by Table 3:6, new technology, followed by professional information/intelligence and skills/expertise, are the most frequently sourced types of knowledge, although overall most knowledge types are accessed with a relatively similar frequency. Furthermore, there is little variation across firms in either urban or rural areas, which indicates that firms in different locations do not vary in terms of the type of knowledge they require to innovate.
Table 3:6 Types of Knowledge Most Frequently Sourced from External Actors
Knowledge type Urban Rural All
Access to new technology 5.5 5.4 5.5
Access to professional information and intelligence 5.2 5.4 5.2
Access to skills or expertise 5.0 4.9 5.0
Access to market or competitor intelligence 5.0 4.6 4.9
Access to research and development 4.6 4.6 4.6
Access to scientific information 4.4 4.7 4.5
Source: Based on Data Collected for Huggins et al. (2009); (0=Never, 10=Very Often)Note: Rural-urban classification based on postcodes *= difference significant at 0.05 level; **= 0.01 level; *** = 0.001 level (non-parametric Mann-Whitney tests).
The interactive nature of innovation means that it increasingly requires intermediary actors and organisations to link different knowledge sources. As shown by Table 3:7, firms are most likely to utilise intermediaries – be they public or private sector – to source knowledge from within their own regions. This is understandable, given that many intermediary organisations, such as those supported by regional development agencies have a regional
18

Opportunities and Barriers to Business Innovation in Rural Areas: Theory and Evidence
focus and remit. In general terms, although firms in rural areas are slightly less likely to use intermediaries to access local knowledge, their overall propensity to use intermediaries is largely similar to that of their urban counterparts. DIUS study on absorptive capacity revealed that national and overseas collaborations have a substantial relationship with goods product innovation, while national collaborations are most important for service innovation. Local collaborations have some significant associations with different types of innovation but in general, they are not as important as national and international collaborations.
Table 3:7 Use of Intermediaries to Source Knowledge from Different Locations
Knowledge type Urban Rural All
Accessing knowledge in your region 3.2 2.7 3.1
Accessing knowledge elsewhere in the UK 2.9 2.8 2.9
Accessing knowledge overseas 2.1 2.4 2.2
Source: Based on Data Collected for Huggins et al. (2009); (0=Never, 10=Very Often)Note: Rural-urban classification based on postcodes *= difference significant at 0.05 level; **= 0.01 level; *** = 0.001 level (non-parametric Mann-Whitney tests).
Firms in the Huggins et al. (2009) survey were asked to indicate the extent to which their internal resource base – comprising skills, R&D/innovation, IT and physical infrastructure – was sufficient to effectively utilise and implement externally sourced knowledge, i.e. the absorptive capacity of firms. It was found that the perceived absorptive capacity of firms based in rural and urban locations is almost identical suggesting little variation in those internal factors facilitating interactive innovation.
Similarly, the barriers to sourcing knowledge do not appear to vary greatly across urban and rural boundaries (Table 3:8). The largest difference (although not statistically significant) indicated by the data is the ability to access knowledge from relevant sources within the same region as the firm. This barrier is measured to be higher for rural firms which chimes with the earlier evidence indicating that firms in rural areas are more likely to source knowledge from other parts of the UK outside of their own region. However, care is needed in interpreting the figures in Table 3:8, which are based on the judgements of individual firms, rather than objective indicators.
Table 3:8 Barriers to Sourcing Knowledge
Barrier Urban Rural All
Inapplicability or quality of knowledge held by others in region 3.9 4.0 3.9
Inapplicability or quality of knowledge held by others in the UK 3.6 3.4 3.5
Unable to access relevant sources in your region 3.2 3.6 3.3
Unable to access relevant sources in the UK 3.0 3.0 3.0
Unable to access relevant sources overseas 3.1 3.2 3.2
The cost of sourcing knowledge 4.9 5.1 5.0
Source: Based on Data Collected for Huggins et al. (2009); (0=Not a Barrier; 10=Very Significant Barrier)Note: Rural-urban classification based on postcodes *= difference significant at 0.05 level; **= 0.01 level; *** = 0.001 level (non-parametric Mann-Whitney tests).
19

Opportunities and Barriers to Business Innovation in Rural Areas: Theory and Evidence
According to the literature, rural businesses are further removed from markets and networks (NESTA, 2008). Their access to them is constrained by distance and a lower quality of ICT infrastructure; and although greater ICT access has improved connectivity of businesses, they still lack access to tacit knowledge. Moreover, low business density and dispersed business population is presumed to undermine rural businesses’ ability to access and benefit from agglomeration economies. However, case study research conducted as part of this assignment provides some evidence (albeit limited) to suggest that science parks, market towns, virtual networks and sectoral networks are some of the channels through which benefits of agglomeration are being realised by businesses in rural areas (see Evidence Box 2).
Evidence Box 2 The Role of Sectoral Networks in Promoting Innovation in the Food and Drink Sector
Sectoral networks encourage focused networking and knowledge sharing among like minded companies, HEIs and providers of support services. They work across rural and urban areas, and help to overcome some of the barriers that rural firms may face in accessing knowledge and engaging with other businesses. They also provide a means of focusing business support for target sectors, some of which, such as food and drink, may have a strong rural focus. Case study 4 examines the role of the Food and Drink iNet in promoting innovation in the East Midlands’ food and drink sector. The iNet offers specialist business and innovation advice, innovation support grants and organises events to promote knowledge sharing and innovation among food and drink businesses. Interviews with participating firms revealed that their innovation behaviour has been positively affected by involvement in the iNet, making them more willing to explore new collaborative opportunities, engage in knowledge sharing and technology transfer, and focus on the development of new products and processes. While some interviewees see their rural location as a barrier to innovation, the view was also expressed that this was often a perception rather than a reality, and that rural areas also offer opportunities to the firms located within them. Another regional food and drink network, Heart of England Fine Foods, covering the West Midlands, has a greater focus on marketing of regional produce, while also encouraging networking activities, providing business support and facilitating engagement with regional HEIs, including Harper Adams College and University College Birmingham.
3.4 Wider Framework Conditions for Innovation
The sectoral survey of UK firms undertaken in one of the work streams of the UK Innovation Index work asked UK businesses to rank the seven framework conditions identified in section 2.2.2 (as well as government policy on innovation) by importance:
a. Demand for new services or products;
b. The availability of finance;
c. The intensity of competition in the firm’s industry;
d. The availability of talented people (skills);
e. Quality of ICT infrastructure
f. Public research;
g. Government policy on innovation;
Figure 3:6 presents the results of the survey for businesses in rural and urban areas in England. A relatively higher proportion of rural businesses (as compared to urban businesses) rated skills, competition, demand, ICT infrastructure and finance as
20
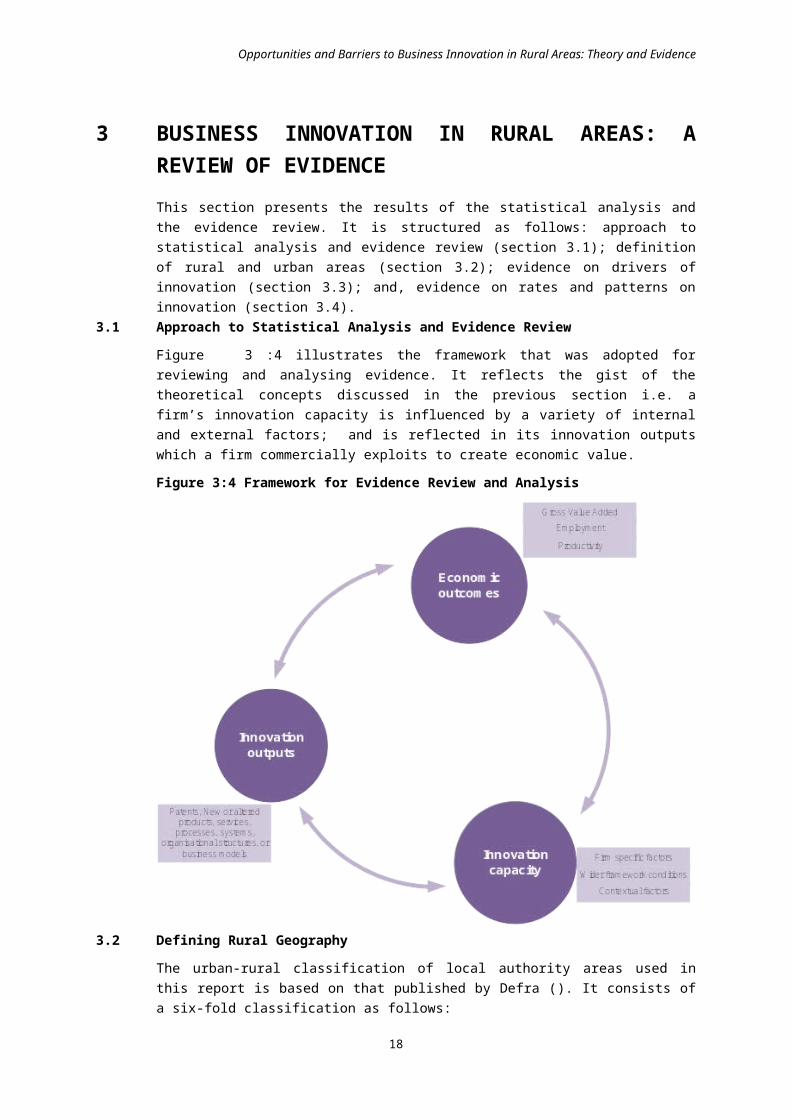
Opportunities and Barriers to Business Innovation in Rural Areas: Theory and Evidence
‘important’ or ‘very important’ external factors influencing their firm’s ability to successfully innovate.
Figure 3:6 Importance of Wider Conditions for Innovation to Rural and Urban Businesses in England
97%92% 89% 88%
83%
48% 48%
82% 78% 76% 74% 73%
43%48%
0%
20%
40%
60%
80%
100%
120%
Skills Competition Demand ICT infrastructure
Finance Public research
Govt. Policy on innovation
Rural
Urban
Based on data collected by Roper et al (2009) as part of NESTA Innovation Index projectNote: Rural-urban classification based on postcodes
The most important framework condition for rural businesses appears to be the availability of skills with 71 per cent of rural businesses ranking it as ‘very important’ (Figure 3:7).
Figure 3:7 Importance of Wider Conditions for Innovation to Rural Businesses in England
71%
52% 51%47% 45%
20%11%
26%39%
32%42% 43%
27% 36%
0%
20%
40%
60%
80%
100%
120%
Skills Competition Finance Demand ICT infrastructure
Govt. Policy on innovation
Public research
Fairly Important
Very Important
Based on data collected by Roper et al (2009) as part of NESTA Innovation Index projectNote: Rural-urban classification based on postcodes
21

Opportunities and Barriers to Business Innovation in Rural Areas: Theory and Evidence
3.4.1 Skills
Existing research2 suggests that rural areas have a smaller and less diversified labour pool as compared to urban areas; and that rural areas suffer from ‘brain drain’ i.e. graduate retention is considered to be an issue in rural areas because of limited local employment opportunities (both quantitatively and qualitatively) and relatively low wages3. Moreover, access to suitable ‘off the job’ training provision is considered to be more difficult in rural (and particularly more peripheral) rural areas.
Recent evidence compiled from various sources and presented in this report by and large validates the above findings.
Size of the Labour Market
Rural areas have a lower percentage (58.5% in 2008) of their population in the working age group4 as compared to urban areas (63%). In sparse areas, only 56.8% of the rural population is of working age5. However, economic activity rates tend to be higher in rural areas. In Q4 2009, a higher proportion of the working age population was reported to be economically active in rural areas (82.5%) as compared to urban areas (78.4%)6. Moreover, there is greater underemployment in urban areas. At its peak in Q3 2009, underemployment represented 10.6% of all employment in rural areas as compared to 11.4% of all employment in urban areas7.
Brain Drain
For people aged 16 to 24, the overall trend is of out migration from rural areas to Major Urban Areas; although there are some exceptions (such as Cornwall). Students from rural areas are very much less likely to study in the area from which they originate. About 42% of students from urban households end up living somewhere other than the area they originate from (unitary or county authority) compared to 62% from rural towns and 65% from villages8.
Sectoral Composition of Rural Labour Markets
Rural labour markets are considered to have a restricted skills base due to their occupational composition. Traditionally, sectoral differences have existed in rural and urban areas with agriculture, mining and tourism being the major sources of employment in rural areas. However, the structure of employment in rural localities is becoming more similar to that of urban areas: traditional sectors of employment, such as agriculture, forestry and fishing have contracted, whilst employment in manufacturing remains significant and jobs in services have increased. Table 3:9 shows that the property and business services sector is the largest employer in both urban and rural areas (albeit it accounts for a much smaller proportion of employees in rural areas). However, the agriculture and manufacturing sectors employ a higher proportion of employees in rural areas than in urban areas. Sectors such as finance and health are under-represented in rural areas.
Table 3:9 Share of Employment by Broad Industry Group, 2009
2 For example, the series of essays on rural innovation published by NESTA and Smallbone et al (2002)3 While people living in rural areas, on average, earn more than those in urban areas, wages for jobs located in rural areas are lower than for urban areas, and lowest in the peripheral areas such as Northumberland and Cornwall. Low paid jobs are found more often in rural areas. (Figure 3.2.6 and Figure 3.2.7 on page 81 of 2009 State of the Countryside Report).4 16 – 64 (Males) / 16 – 59 (Females)5 Figure 2.2.4 on p.19 of the 2010 State of the Countryside Report6 Figure 3.3.14 on p.119 of the 2010 State of the Countryside Report7 Figure 3.3.17 on p.122 of the 2010 State of the Countryside Report8 Figure 2.8.3 on p. 61 of the 2009 State of the Countryside Report
22

Opportunities and Barriers to Business Innovation in Rural Areas: Theory and Evidence
Rural Urban >10KAgriculture 7.5% 0.3%Construction 7.4% 4.5%Education 8.3% 8.9%Finance 1.2% 4.6%Health 8.5% 11.9%Hotels and catering 8.4% 5.9%Manufacturing 13.1% 9.5%Mining/quarrying and utilities 0.8% 0.5%Motor Trades 2.6% 2.0%Post and telecommunications 1.1% 1.9%Property and business services 16.1% 20.0%Public administration and other services 8.4% 10.7%Retail 6.6% 11.0%Transport 4.9% 3.9%Wholesale 5.1% 4.3%
Source: State of the Countryside Report, 2010Note: Based on ONS (2004) two class definition of rural and urban areas
To better understand the nature and extent of diversity of rural labour markets, it is also useful to look at indicators of R&D employment and creative workforce.
R&D Employment
Levels of R&D employment are an important measure of the availability of innovation-related human capital and provide some indication of the concentration of knowledge workers in an economy. The share of all workers employed as professional scientists and engineers is an important indicator of the capacity of an industrial system to produce technological innovations. Research personnel play a critical role in the creation of technological innovations, and are treated as one of the major factors of production in studies of technical change and economic growth. It should be noted that R&D employment is not only a driver of innovation activity but also an indicator of innovation activity, since only those firms actively involved in innovation are likely to employ R&D staff.
As shown by Table 3:10, it is the most urbanised areas of England within which R&D employees make up the greatest percentage of total employment. However, there are some differences across regions with, most notably, the most rural parts of Eastern England, and to a lesser extent Yorkshire and Humberside, possessing a greater density of R&D employees than urban areas in these regions.
As shown in Figure 3:8, with the exception of East Anglia and North Yorkshire, it is the most rural economies that have the lowest density of R&D workers. However, it should be noted that R&D in the UK is extremely concentrated. In 2007, the 88 UK firms in the G1400 accounted for 66% of R&D by the UK850 (2008 R&D scoreboard, BIS). The three largest sectors - pharmaceuticals and biotechnology, fixed line communications and banks - accounted for 60% of R&D spending by the 88 UK firms in the G1400. Likewise, the aerospace and defence sector accounted for 5% of R&D spending by the 88 UK firms in the G1400. Therefore, areas where businesses in these sectors are located will naturally be characterised by a relatively high share of R&D employment.
23

Opportunities and Barriers to Business Innovation in Rural Areas: Theory and Evidence
Table 3:10 R&D Employment as a % of Total Employment 2007 and 2005
Major Urban Large Urban Other Urban Significant Rural Rural 50 Rural 80
2007 2005 2007 2005 2007 2005 2007 2005 2007 2005 2007 2005
North East 1.45% 1.42% - - - - 1.14% 1.07% - - - -
North West 1.46% 1.38% - - 1.40% 1.40% 1.66% 1.49% 1.10% 0.86% - -
Yorkshire and The Humber 1.34% 1.32% 1.64% 1.52% - - 0.55% 0.68% 1.63% 1.51% - -
East Midlands - - - - - - 1.76% 1.68% 0.48% 0.45% - -
West Midlands 1.91% 1.86% - - - - 0.79% 0.75% - - - -
Eastern - - - - 2.00% 1.80% 1.41% 1.37% 2.80% 2.70% - -
London 1.83% 1.74% - - - - - - - - - -
South East 3.04% 2.85% - - - - 1.66% 1.57% - - - -
South West - - - - - - 1.67% 1.62% 0.20% 0.17% 1.15% 1.12%
ENGLAND 1.73% 1.75% 1.57% 1.52% 1.61% 1.62% 1.38% 1.40% 1.71% 1.72% 1.08% 1.12%
Source: EUROSTATNote: Based on Defra’s six-point urban-rural classification of local authority areas (post April 2009)
24

Opportunities and Barriers to Business Innovation in Rural Areas: Theory and Evidence
Figure 3:8 R&D Employment as a % of Total Employment 2007
Inner LondonBerkshire, Bucks and Oxfordshire
East AngliaHampshire and Isle of Wight
Gloucestershire, Wiltshire and Bristol/Bath areaBedfordshire, Hertfordshire
West MidlandsDerbyshire and Nottinghamshire
CheshireSouth Yorkshire
Leicestershire, Rutland and NorthantsNorth Yorkshire
MerseysideGreater Manchester
Northumberland, Tyne and WearEssex
LancashireWest Yorkshire
Surrey, East and West SussexKent
DevonTees Valley and Durham
Herefordshire, Worcestershire and WarksCumbria
Dorset and SomersetOuter London
East Yorkshire and Northern LincolnshireShropshire and Staffordshire
LincolnshireCornwall and Isles of Scilly
0.00 0.50 1.00 1.50 2.00 2.50 3.00 3.50 4.00
3.723.04
2.802.59
2.152.00
1.911.87
1.661.641.631.63
1.471.461.45
1.411.40
1.341.26
1.231.151.14
1.111.10
0.690.59
0.550.51
0.480.20
Major Urban
Large Urban
Other Urban
Signific-ant Rural
Rural 50
Rural 80
25

Opportunities and Barriers to Business Innovation in Rural Areas: Theory and Evidence
Source: EUROSTAT; Note: Based on Defra’s urban-rural classification of local authority areas (post April 2009)
26

Opportunities and Barriers to Business Innovation in Rural Areas: Theory and Evidence
Creative Workers
As part of the process of measuring the geography of the creative human capital that facilitates innovation, it is also useful to look at measures that plot differences in the density of creative workers across England. The key variables used in this report mirror those employed in previous research by Richard Florida on the geography of talent and the rise of the creative class in the United States. Clearly of central importance is the ability to actually quantify the size of the creative class present in any given location. These are essentially people who as a key constituent of their work are involved in the creation of new knowledge, or use of existing knowledge in new ways, combinations and so on. In the absence of a primary data set relating to the actual engagement in such activities, this is proxied by the use of occupational categories (see Annex 2 for further methodological details).
The creative class discourse is intrinsically related to the regeneration of cities and urban areas and their conversion to knowledge-based economies, as well as the concept of a quality of place, i.e. a desirable location of high value workers to both work and live. This thesis has been shown to hold in the US, with the dominance of cities as the prime high population zones - only 20% of the US population reside in rural areas. However, is the bias of high value workers in the UK necessarily towards urban areas? In other words, is the creative class an urban-only phenomenon? As shown by Table 3:11, although major urban localities have an above average proportion of creative class workers this is largely boosted by the major concentration of artists, writers, designers, musicians, actors, directors, painters and sculptors, photographers and dancers (the Bohemian LQ) in London.
Removing these occupations from the analysis shows a considerably more even distribution, with both ‘other urban’ areas (small towns and cities) and localities with significant rural parts having a proportion of workers in these occupations in line with the average. Also the proportion of creative core workers is only marginally lower than the national average. This suggests that the distribution in the ‘stock’ of the creative class is more evenly spread than might be anticipated. However, the most ruralised areas do possess a significantly lower proportion of workers in these occupations.
Table 3:11 Creative Class Location Quotients by Local Authority Level Urban-Rural Classification in England (Mean Average=1)
Creative Class LQ Creative Core LQ Boho LQ
Major Urban 1.08 1.11 1.50
Large Urban 0.92 0.98 0.85
Other Urban 1.03 1.01 0.92
Significant Rural 0.99 0.96 0.80
Rural-50 0.92 0.92 0.83
Rural -80 0.92 0.87 0.93
Source: Huggins, R. and Clifton (2010) Competitiveness and Creativity: A Place-Based Perspective, UWIC: CardiffNote: Based on Defra’s urban-rural classification of local authority areas (post April 2009)
As Table 3:12 indicates, the distribution of the creative class within regions often shows comparable or even greater proportions of these workers within rural areas. Therefore, differences that show up at an aggregated national level are not mirrored across individual regions. For instance, in the rural localities of the West Midlands and the North West a greater proportion of the workforce has ‘creative’ occupations in comparison with the urban areas of these regions. Furthermore, although the proportion of artistic workers (Bohemian LQ) at a national level is significantly higher in urban areas, this is largely due to the ‘London effect’ (Table 3:12).
27

Opportunities and Barriers to Business Innovation in Rural Areas: Theory and Evidence
At a regional level, the rural areas of the West Midlands and the South West have a higher proportion of artistic workers than their respective regional urban counterparts. Often these artists may be located in areas of outstanding natural beauty within these regions, which are important tourism areas. A similar phenomenon relating to a ‘rural creative class’ has also been identified in the US whereby a social fabric rich in ‘cultural interaction’ is coupled with the presence of a significant and active arts community that is promoted through cultural heritage and civic associations.
28
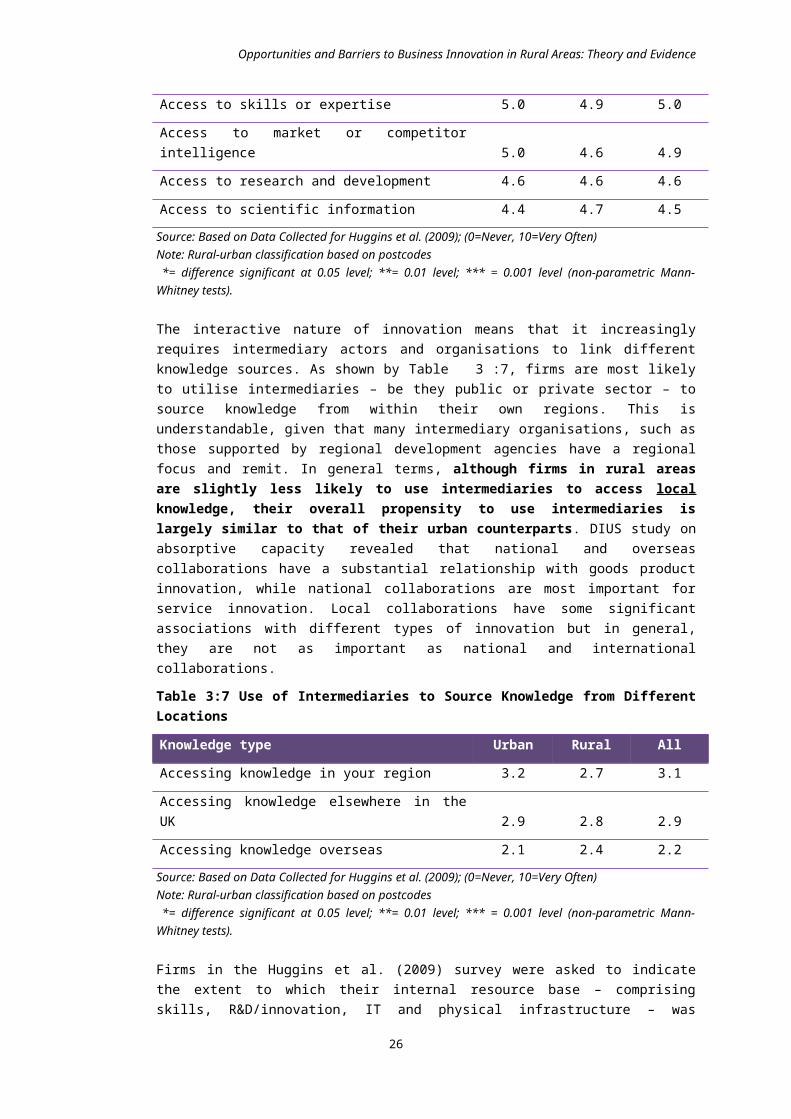
Opportunities and Barriers to Business Innovation in Rural Areas: Theory and Evidence
Table 3:12 Creative Class, Creative Core and Boho Location Quotients at a Regional Level by Local Authority Urban-Rural Classification in England (Mean Average=1)
Creative Class LQ Creative Core LQ Boho LQ
Urban Localities
Rural Localities
All Localities
Urban Localities
Rural Localities
All Localities
Urban Localities
Rural Localities
All Localities
East Midlands 0.84 0.91 0.90 0.94 0.87 0.88 0.80 0.67 0.69
Eastern 1.07 0.98 1.01 1.03 0.94 0.97 0.99 0.83 0.88
London 1.31 - 1.31 1.33 - 1.33 2.41 - 2.41
North East 0.82 0.82 0.82 0.86 0.86 0.86 0.57 0.54 0.56
North West 0.90 0.95 0.92 0.92 0.99 0.94 0.68 0.68 0.68
South East 1.15 1.07 1.10 1.17 1.04 1.09 1.17 1.00 1.06
South West 0.94 0.94 0.94 0.95 0.92 0.93 0.90 0.98 0.96
West Midlands 0.83 0.97 0.89 0.85 0.95 0.90 0.56* 0.70* 0.63
Yorkshire and Humberside 0.87 0.88 0.87 0.88 0.84 0.87 0.70 0.63 0.68
England 1.04 0.97 1.00 1.06 0.95 1.00 1.25 0.81 1.00
Source: Huggins, R. and Clifton (2010) Competitiveness and Creativity: A Place-Based Perspective, UWIC: CardiffNote: Based on Defra’s urban-rural classification of local authority areas (post April 2009)
29
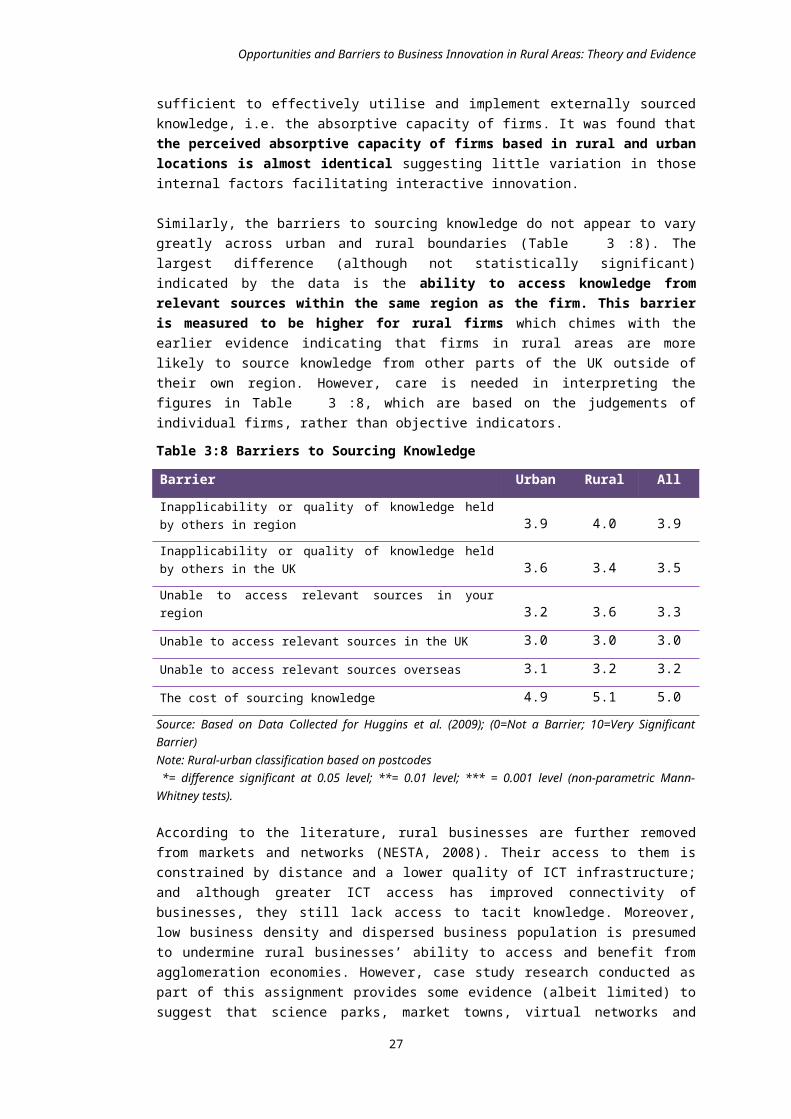
Educational Attainment
General educational levels impact on innovation in many ways. With respect to the workplace, econometric evidence indicates clearly that there are positive returns in terms of wages to qualifications at all levels The returns are greater at higher levels of qualification, but basic skills such as such as literacy and numeracy yield a significant positive return (e.g. Sianesi, 2003; Dearden et al., 2000). The literature on absorptive capacity stresses that an educated, and hence relatively flexible and adaptable workforce, is an important component in a firm’s ability to incorporate innovative ideas. General education is also important in promoting an aware and sophisticated consumer population.
One commonly used measured of general education is the percentage of the working age population with qualification level at NVQ 4 or above. As illustrated by Table 3:13 although major urban areas have the highest proportion of their working age population with NVQ 4+ in England, rural areas also have relatively well-educated populations, with levels of education higher than those of large and other urban areas.
Table 3:13 Percentage of Working Age Population with NVQ 4+ in England, 2007 and 2008
2008 2007
Major Urban 31.1% 30.5%
Large Urban 26.6% 26.3%
Other Urban 25.7% 24.3%
Significant Rural 28.0% 29.0%
Rural-50 29.0% 28.6%
Rural-80 27.9% 28.6%
Source: Huggins, R. and Clifton (2010) Competitiveness and Creativity: A Place-Based Perspective, UWIC: CardiffNote: Based on Defra’s urban-rural classification of local authority areas
However, an important caveat is that as this data is residence-based, it does not accurately measure workforce educational attainment, since it does not account for travel-to-work patterns across districts of differing types. Many individuals in higher paid, higher skilled employment live in rural districts and commute to work elsewhere. Figure 3:9, which is based on workplace statistics, shows that on average, Rural 80 and Rural 50 districts have a significantly higher proportion of the workforce qualified to Level 4 and above at 29.8%, compared to the regional average of 27.3%. Urban districts perform significantly poorer on this measure. The proportion of those with a Level 4 and above qualification was the lowest in Other Urban districts at 24.3%, which is 3.0 percentage points lower than the regional average. Rural 50 and Rural 80 districts have a lower proportion of the workforce with a qualification below Level 2 at 30.5% and 28.0% respectively compared to the regional average of 32.8%. Urban districts also perform less well on this measure. The proportion of working age population with a qualification below Level 2 was 35.2% in Other Urban districts and 35.0% in Large Urban districts
Opportunities and Barriers to Business Innovation in Rural Areas: Theory and Evidence
Figure 3:9 Urban and rural variations of workforce qualification, 2007
Source: Department for Children, Schools and Families, ‘Qualifications and Participation in Learning at a local level: England 2007, Population aged 19-59/64’.Note: Without Level 2 qualification is the sum of those with lower than Level 2 and those with no qualification.Note: Based on Defra’s urban-rural classification of local authority areas
Besides, the 2010 State of the Countryside Report shows that the highest proportion of young people not in education, employment or training (NEET) between the ages of 16 and 18 are located in urban districts9. According to the report, the proportion of NEET was <6% in rural areas as compared to 7.2% in major urban areas, 8.1% in large urban areas and 7.3% in other urban areas in 2008.
The Rural Skills Challenge
Most rural districts are better endowed with human capital in terms of educational attainment than urban areas. However, more than 33% of adults in town and fringe areas have no qualifications. Around one in four adults in villages and hamlets have no qualifications and nearly one in four 19 year olds in rural districts fails to achieve a basic qualification (NVQ2 or equivalent)10.
A report by the Commission for Rural Communities11 on skill shortages and gaps in rural England found that:
Skill shortages, in both rural and urban firms, are the most common cause of recruitment difficulties.
Rural firms are less likely than urban firms to have staff that are not fully proficient at their jobs, with the exception perhaps of staff in elementary occupations, an important group in rural businesses.
Rural firms are less likely to have provided training for their workforce than their urban equivalents, and are less likely to have formal training or human resource management processes. 40% of all rural employers had no business plan, no
9 Figure 3.3.16 on p.12110 DIUS – A new ‘University Challenge’ consultation on proposals for new higher education centres, CRC 200811 CRC (2006) Rural Analysis NESS 2005: Skills Development and Deficiencies in Rural England
31

Opportunities and Barriers to Business Innovation in Rural Areas: Theory and Evidence
training plan and no training budget (compared to less than one third of urban employers).
Rural employers with such processes, engaged in training and successful at recruiting, are likely to provide more training days per trainee than urban employers.
The further away the resident is from a higher education centre, the more likely they are to have a lower level of qualification.
3.4.1.1 Demand Conditions
The small size of the local market is one of the potential disadvantages faced by rural firms in comparison with their urban counterparts. Based on the Defra rural definition, it is estimated that 26.9% of England’s population (13.2 million people) lives in rural areas and large market towns12. However, according to State of the Countryside Report 2010, which is based on the Office of National Statistics definition, people living in rural areas comprise 19.1% (9.8 million people) of England’s population compared to 80.9% (41.6 million) in urban areas. Most of these live in less sparse areas – only around 731,300 people (1.4% of the population) live in sparse areas. Population density differs markedly across England, from more than 4 persons per hectare in some metropolitan areas to less than 0.06 persons per hectare in the most sparsely populated areas13.
Although rural markets remain relatively small, population growth in recent years has meant that some of the classic rural problems of sparsity have declined. The fastest average rate of population growth between 2001 and 2008 was in village, hamlet and isolated dwellings14. Rural population is forecast to continue to grow at a faster pace than urban areas – mainly due to net inward migration. This has increased the number of consumers in many of these areas towards the kind of critical mass that has been identified as a driver of innovation (NESTA, 2007a)15.
Moreover, rural households, on average, earn more, have more disposable income and spend more (about £60 per week) than urban households. The mean equivalised household disposable income in England before housing costs in rural areas was £27,100 in 2008, compared to £25,100 in urban areas16.
There is also evidence of user-led innovation in rural areas (NESTA, 2009c). For example, supermarkets are driving innovation on farms, through Farm Biodiversity Action Plans (Sainsbury’s premium fresh produce suppliers), conservation plans linked to FWAG (Tesco’s ‘Nature’s Choice’), and the development of additional audit requirements for the Assured Produce Scheme linked to the LEAF audit (used by Waitrose).
3.4.1.2 Public Research
Universities are increasingly portrayed as core knowledge-producing entities that can play an enhanced role in driving innovation and development processes, acting as key elements of innovation systems, and providing knowledge for business and industry. The transfer and commercialisation of university-generated knowledge is also taking a stronger role within government policies at a number of levels, with many governments and their agencies turning their attention to the role of HEI knowledge commercialisation in developing
12 Defra, Rural Urban Definition, LA Classification Dataset post April 2009. Available at: http://www.defra.gov.uk/evidence/statistics/rural/rural-definition.htm 13 Figure 2.2.4 on page 14 of 2009 State of the Countryside Report14 Figure 2.2.2 on page 17 of 2010 State of the Countryside Report15 However, it should also be noted that rural areas are not homogeneous. Many rural areas are losing population (especially some of the more remote sparse areas) but also some areas in South East England and many coastal areas.16 page 86 of 2010 State of the Countryside Report
32

Opportunities and Barriers to Business Innovation in Rural Areas: Theory and Evidence
innovative, sustainable and prosperous regional and national economies. Universities, therefore, are viewed as important actors within networks of regional clusters of knowledge-based activities or systems of regional innovation. Harwell and Daresbury highlight the important role that campus based science parks can play in stimulating agglomeration economies and innovation (Evidence Box 3).
Evidence Box 3 The Role of Campus-based Science Parks in Rural Innovation
Two Science and Innovation Campuses, at Harwell (in Oxfordshire) and Daresbury (in Cheshire), both located in rural areas, support concentrations of innovation activity. Both sites provide a variety of services to support networking, collaboration, innovation and access to finance among their tenants, and as a result are able to demonstrate significant levels of success in achieving innovation outcomes.
For example, at Daresbury, 64% of companies on site developed a total of 219 new products and services in 2009, of which three quarters had been taken to market. About half of these companies had also filed patents. Harwell has been able to attract a variety of high profile, knowledge intensive businesses, and there are numerous examples of collaborative working in pursuit of innovation outcomes.
While both sites have significantly increased rates of business innovation in their respective rural areas, they might be regarded as specialist examples of innovation activity focusing on agglomeration of knowledge intensive businesses, rather than models that could be applied widely in rural areas. However, both examples demonstrate that a rural location can offer advantages to a science park – in terms of its environment, the availability of green field sites, and transport links.
This section utilises data from the annual Higher Education Business and Community Interaction Survey, coordinated by the Higher Education Funding Council for England (HEFCE), to assess the extent to which the innovation contribution of universities is associated with location; and if there are any differences in the innovation and commercialisation activities and outputs of universities located in either urban or rural parts of England. As background, it can be noted that there are 17 HEIs which can be classified as rural17 as compared to 112 urban universities (or 1.73 HEIs per million inhabitants in rural areas as compared to 2.69 per million inhabitants in urban areas); and, on average universities in urban locations tend be larger than those in predominately rural settings (urban universities have an average of 1,986 FTE employees, and rural universities an average of 1,403).
assesses the engagement of universities in the business innovation process through the income they receive from contract research provided to the private sector. Urban and rural universities receive similar average amounts for contract research, with rural universities in fact receiving slightly more, despite their smaller average size. However, the location of these sources differs on a number of counts. In particular, urban universities receive significantly more income from sources within their own regions in comparison with universities in rural areas; markedly so in the case of income received from SMEs. More generally, urban universities appear to engage more with the SME community, suggesting that they have more developed links with a larger pool of SMEs.
17 rural universities as institutions that have their main campuses (or the majority of activity) located in an local authority areas classed as either: Significant Rural: districts with more than 37,000 people and more than 26 per cent of their population in rural settlements and larger market towns; Rural-50: districts with at least 50 per cent but less than 80 per cent of their population in rural settlements and larger market towns; Rural-80: districts with at least 80 per cent of their population in rural settlements and larger market towns.
33
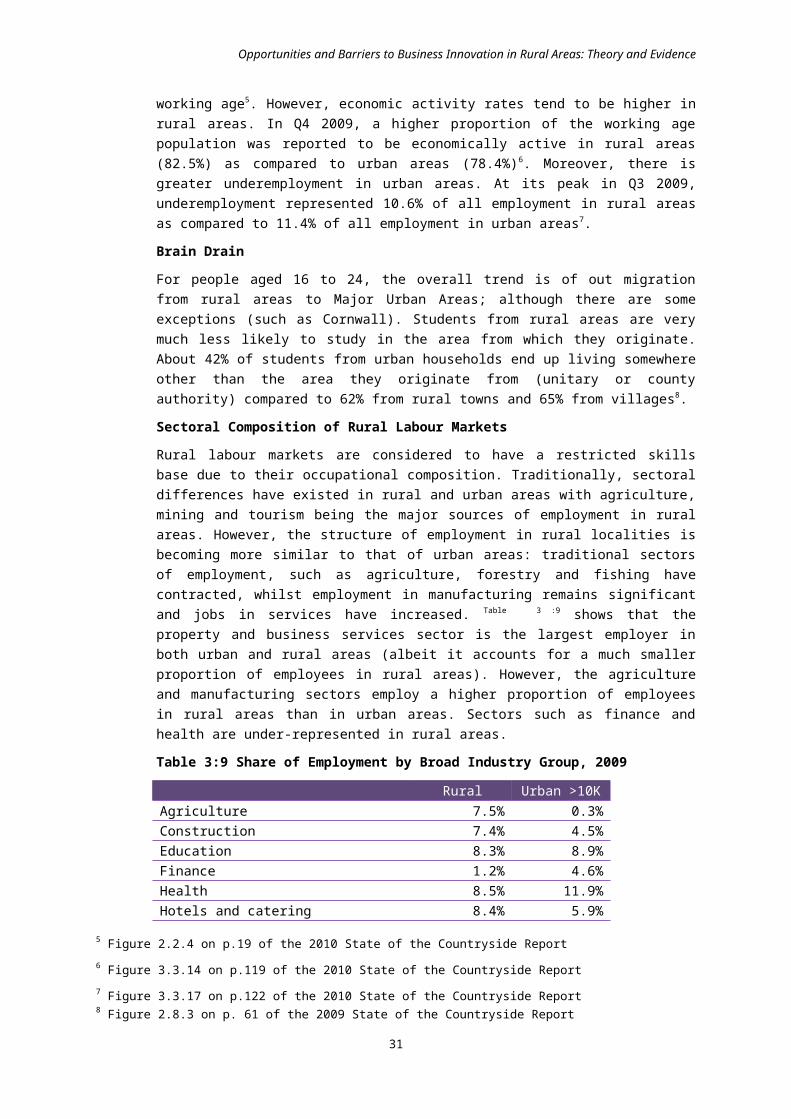
Opportunities and Barriers to Business Innovation in Rural Areas: Theory and Evidence
Table 3:14 Mean Average Contract Research Income Received per University (£000’s) 2007/08
Urban Rural
SMEs
Sources within own region 100.8 24.7
Sources outside own region 90.4 144.3
All SME sources 191.2 169.1
Large firms
Sources within own region 230.6 167.2
Sources outside own region 1,777.8 1,978.5
All non-SME sources 2,008.4 2,145.7
All sources 2,199.5 2,314.8
Source: HEFCENote: Based on Defra’s urban-rural classification of local authority areas (post April 2009)
shows the average number of contract research projects undertaken by universities. It indicates that on average, universities in rural areas are less engaged in contract research, at least in terms of the number of such projects. However, adjusting for the average size of university significantly reduces this differential.
Table 3:15 Mean Average Number of Contract Research Projects Received per University 2007/2008
Urban Rural
SMEs 16.0 9.3
Non-SME private sector 72.2 51.9
All private sector 88.2 61.2
Source: HEFCENote: Based on Defra’s urban-rural classification of local authority areas (post April 2009)
Another, and growing form, of business innovation undertaken by universities is the formation of spin-off firms. illustrates the average number of spin-off firms per university recorded in 2007-08. With the exception of graduate-start-ups, rural universities outperform urban universities (despite their smaller average size). This may be partly due to a significant number of rural universities possessing infrastructure, in the form of science parks and incubators, to house new start-up firms.
Table 3:16 Mean Average Spin-Offs Established per University by Type, 2007-08
Spin-off Type Urban Rural
Spin-offs with some university ownership 6.3 6.8
Formal spin-offs, not university owned 1.0 2.8
Staff start-ups 1.3 5.3
Graduate start-ups 30.7 21.3
Source: HEFCENote: Based on Defra’s urban-rural classification of local authority areas (post April 2009)
34

Opportunities and Barriers to Business Innovation in Rural Areas: Theory and Evidence
Table 3:17 presents data for two tangible measures of university innovation activity: the average cumulative portfolio of active patents; and the average income received from Intellectual Property. For both metrics, urban universities significantly outperform rural universities, indicating that on average their innovation outputs are superior. This is largely due to the constituency of the two groups, and whilst relatively high-performing universities such as Cranfield, Lancaster, and Warwick are located in rural areas, the majority of England’s most prestigious and research-facing universities are located in major cities, especially London. This not only allows them to engender, on average, more innovation, but allows them to become more integrated actors in the business innovation process.
Table 3:17 Innovation Outputs per University 2007/08
Urban Rural
Cumulative Portfolio of Active Patents 95.9 17.8
Average Income from Intellectual Property (£000s) 478.9 126.2
Source: HEFCENote: Based on Defra’s urban-rural classification of local authority areas (post April 2009)
3.4.1.3 Finance
Although financial services are in principle equally provided in all parts of a country, in practice there may be fewer options for firms in rural areas (particularly, peripheral rural areas as indicated by case study research) to obtain private funding locally from financial intermediaries, whether banks, venture capitalists or business angels. Financial institutions are less likely to have a base in rural areas, so that businesses in these areas may need to travel some distance to meet a lender. From the population and number of service outlets statistics contained in the 2010 State of the Countryside Report it can be estimated that there are 1.44 bank and building society outlets per 10,000 inhabitants in rural areas as compared on 2.44 in urban areas (surprisingly, sparse rural areas have almost 4 outlets per 10,000 inhabitants)18.
It is also argued that rural businesses may also have characteristics that make them less attractive to financial institutions or external investors, for example very small size, lack of own capital, and limited profitability (e.g. because they operate in seasonally restricted sectors such as tourism). Businesses in rural areas tend to be smaller than their urban counterparts: 88% of VAT and/or PAYE registered businesses in rural areas employ fewer than 10 people as compared to 81% in urban areas19. Smaller businesses may lack internal resources to invest in innovation and find it harder to access finance as compared to larger businesses (due to existence of market failures).
Moreover, to the extent that firms in rural areas are more likely to be ‘lifestyle’ rather than ‘growth-oriented’ firms, they may also be both less attractive to external investors and more reluctant to bring in a Business Angel or to take on a loan with stringent conditions.
However, the above cannot be verified. Evidence on availability and access to finance by rural firms is virtually non-existent. Urban-rural breakdown of statistics is not available for key indicators such as: availability of and access to debt finance; availability of and access to venture capital; business angel investment etc.
However, some evidence is available from regional sources. For example, in the Rural Business Survey for North East20 respondents were asked to indicate the importance of a
18 Estimated from data presented in Figure 2.3.1 on p.26 of the 2010 State of the Countryside Report19 p.124 of 2010 State of the Countryside Report20 Atterton, J. and Affleck, A. (2010) Rural Businesses in the North East of England: Final Survey Results (2009), Centre for Rural Economy Research Report.
35

Opportunities and Barriers to Business Innovation in Rural Areas: Theory and Evidence
number of possible constraints on the business, using a scale of 1 to 5 where 1 is not important at all and 5 is very important. A shortage of finance and the high cost of borrowing were cited as an ‘important’ or ‘very important’ constraint by over 40% of respondents.
3.4.1.4 Entrepreneurship
A strong risk taking culture is a crucial enabling condition for the emergence of innovations that can find commercial tractability in the marketplace. As a means of gaining some insights into the overall entrepreneurial dynamism of urban and rural districts, it is useful to assess differences in business start-up rates. presents VAT start-up rates on a per capita basis for 2006 and 2007, and although major urban districts have the highest rates, rural economies perform well - and higher than those for large and other urban districts. This suggests significant dynamism; however, it should be borne it mind that as the rate has been calculated on a per capita basis, the relative sparseness of the districts inflates its output. Nevertheless, it does also confirm that rural locations are not without entrepreneurial vigour.
Table 3:18 Number of New (VAT) Business Registrations per 10,000 Inhabitants within English Districts 2006 and 2007
District Type 2007 2006
Major Urban 39.3 34.2
Large Urban 28.8 25.4
Other Urban 29.4 26.0
Significant Rural 36.4 32.7
Rural-50 34.5 31.8
Rural-80 35.8 33.6
Source: UK Competitiveness Index, Centre for International Competitiveness CardiffNote: Based on Defra’s urban-rural classification of local authority areas (post April 2009)
Table 3:19 presents the breakdown in start-up rates for urban and rural localities across English regions. With the exception of the wholly urbanised region of London, start-up rates in rural economies outstrip those in urban areas on a per capita basis. However, changes in the stock of knowledge-based businesses (presented in section 3.6.1.1) suggest that these business starts are not always in the most knowledge-intense and innovative sectors.
Table 3:19 Number of New (VAT) Business Registrations per 10,000 Inhabitants within English Districts by Region 2006 and 2007
2007 2006
Urban Areas Rural Areas Urban Areas Rural Areas
36
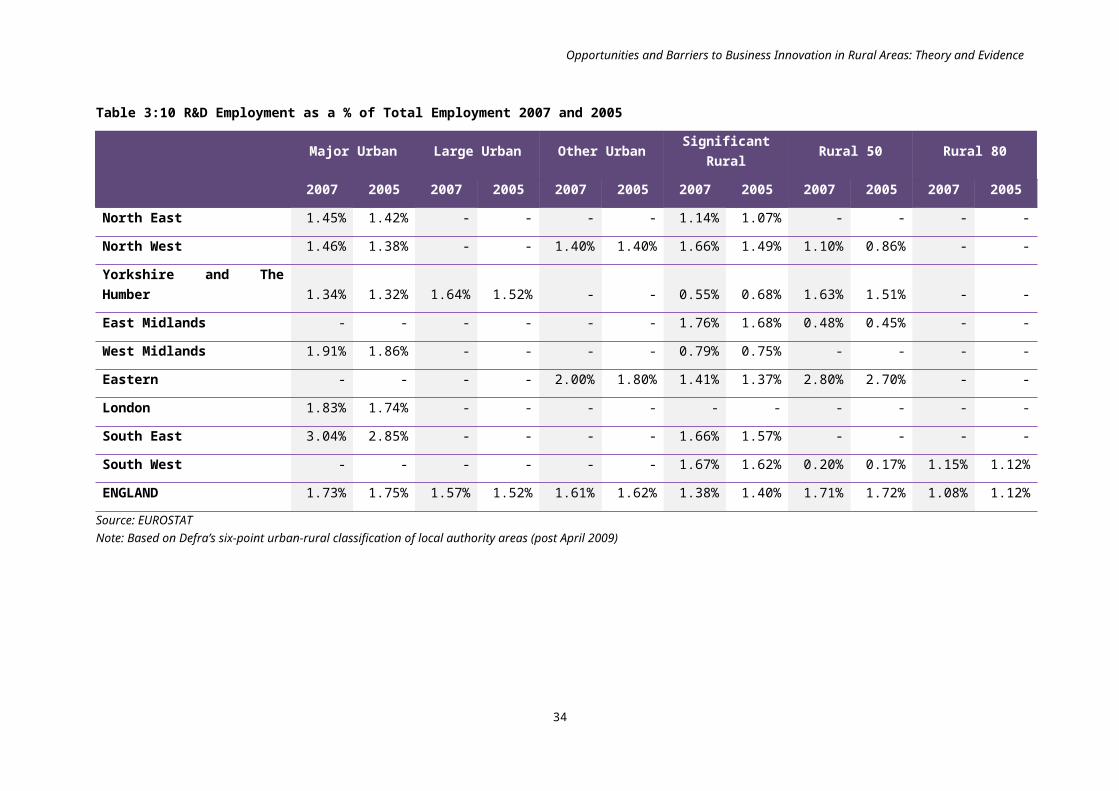
Opportunities and Barriers to Business Innovation in Rural Areas: Theory and Evidence
East Midlands 26.6 33.5 24.9 31.5
Eastern 33.3 35.9 28.4 32.9
London 53.2 - 45.2 -
North East 22.2 23.0 17.8 19.5
North West 28.6 34.1 25.4 29.6
South East 35.0 41.9 31.2 38.4
South West 32.0 33.5 28.0 31.7
West Midlands 25.0 36.8 23.7 34.6
Yorkshire and Humberside 26.1 32.2 23.2 28.7
England 34.6 35.5 30.3 32.6
Source: UK Competitiveness Index, Centre for International Competitiveness CardiffNote: Based on Defra’s urban-rural classification of local authority areas (post April 2009)
Bank Search data (previously sourced via Barclays Bank’s Mainstream Business Starts) is an additional source of information on business start-ups. It provides annual figures on the opening of new and separate business bank accounts with all the major banks in the UK. This data provides a more comprehensive picture of business start-ups as it includes those businesses that do not need to register for VAT due to their smaller size. According to this data, rural areas demonstrate entrepreneurship. In 2009, there were 13.9 small business start-ups per 1,000 of working age population in rural areas as compared to 12.7 in urban areas. Less sparse village, hamlet and isolated dwellings had the highest start-up rate (15.7); while sparse urban areas had the lowest (10.6)21.
Moreover, total early stage entrepreneurial activity (TEA) in the rural locations, and especially in rural-sparse, is higher than in urban areas and similar to that observed in Inner London22.
Although entrepreneurial activity is relatively strong in rural areas, it has been suggested that businesses in rural (particularly remote rural) locations are less likely to be growth orientated than their urban counterparts, mainly because the desire for a rural lifestyle is the dominant motive for setting up a business in that kind of area (Townroe & Mallalieu, 1993). However, subsequent studies have found little empirical evidence to support this. Urban-rural differences in future growth objectives, reported in both the 1997 and 1999 CBRC surveys were small and not statistically significant, although in the latter case the rural sample did contain the smallest percentage of firms aiming at substantial future growth compared with small towns, urban areas and conurbations (Cosh and Hughes, 1998; 2000). The finding was similar to that reported in the 1997 survey (Cosh and Hughes, 1998).
3.4.1.5 Competition
It has been suggested that a thin business environment - low geographical business density relative to urban areas23 - reduces competitive pressures and thus the incentive for rural businesses to innovate. A counter-argument is that a small business in rural areas is disadvantaged by distance and location; so it faces greater pressure to innovate in order to remain competitive.
21 Figure 3.4.7, page 131 of 2010 State of the Countryside Report22 Figure 3.4.9, page 133 of 2010 State of the Countryside Report23 There are slightly more businesses per head of population in rural areas as compared to urban areas, though they have a smaller average size (page 104 of 2009 State of the Countryside Report).
37

Opportunities and Barriers to Business Innovation in Rural Areas: Theory and Evidence
Statistics show that businesses in rural areas also demonstrate greater longevity and stability. The highest proportions of VAT and/or PAYE based businesses trading for 10 years or greater can be found in the most rural areas. In contrast the highest proportions of those businesses that have been trading for less than two years can be found in urban areas24. The 2007 release by the SBS of 1 and 3 year survival rates shows that survival rates are typically higher for rural businesses as compared to urban businesses 25. Urban areas demonstrate greater churn compared to rural areas, perhaps indicating greater competitive pressure in these areas.
3.4.1.6 ICT Infrastructure
It is argued that relatively low business density and dispersed business population undermine rural businesses’ ability to access and benefit from knowledge spillovers that prevail in cities; and that this may be a major constraint on innovation in rural areas. The opportunities for interaction and connectivity offered by ICT (and broadband in particular) are helping rural businesses to overcome locational disadvantages such as lack of density and proximity. Broadband links are not only facilitating access to large distant markets, but also enhance opportunities for businesses and individuals to access information from elsewhere (Evidence Box 4).
Evidence Box 4 The Role of Virtual Networks in Promoting Knowledge Sharing and Innovation
Recent years have seen the development of virtual networks which encourage networking, knowledge sharing and collaboration between businesses. These are equally accessible to rural and urban based firms, and therefore help to overcome some of the potential barriers caused by rurality. Case study 2 examines the role of some of these networks in innovation – including formal networks such as Digital Peninsula Network, Network Cornwall, Women in Rural Enterprise (WiRE), Enterprise Nation and the Live Work Network, as well as informal networks (including sector specific activity on www.twitter.com such as #agchat, #commschat and #watercoolermoment) and the fast growing co-working movement, Jelly.
These networks seem to be enabling businesses to find, sift and test intelligence that they can apply to improve their output and the competitiveness of their business. They are being used for “peer to peer” business support – asking technical questions of peers rather than of business support practitioners or professional service providers. They are being used for collaboration – to develop networks and partnerships which can then be leveraged to win new business, and they are being used to test and shape ideas for new services and products. They are therefore working, and developing as enablers of innovation, although there is limited evidence of innovation outcomes that can be ascribed to them, beyond the testimony of a few rural businesses of the value they derive from participation.
Given the important role of ICT in stimulating innovation, it makes sense to look at some hard evidence on the availability of and access to broadband infrastructure in rural areas. According to existing research, ICT adoption rates by rural businesses are broadly similar to urban businesses in many areas (SQW Consulting, 2008a). This suggests that information is now more accessible even in remote rural areas; however rural firms are less intensive users of ICT and therefore do not use ICT applications to their maximum potential (SQW Consulting, 2008a).
The percentage of households with access to the internet is the lowest (42.3%) in sparse rural areas (village, hamlet and isolated dwellings). There is very little difference in rates of internet accessibility in other area types (around 45%); except for less sparse urban >10k
24 Figure 3.4.5, p.129 of 2010 State of the Countryside Report25 Figure 3.4.4 on p. 92, State of the Countryside Report, 2007
38

Opportunities and Barriers to Business Innovation in Rural Areas: Theory and Evidence
where 70% of the households have access to internet26. However, broadband penetration varies greatly from place to place even within rural areas. The highest proportions with access in rural areas are generally found in the more affluent areas of England, but some sparse areas (which tend to be poorer) such as Lincolnshire, Norfolk, Cornwall and Shropshire also have high levels on broadband penetration27.
The quality of ICT infrastructure varies significantly across rural and urban areas. Around 5% of rural households use dial-up; and approximately 30% of households in village, hamlet and isolated dwellings (both sparse and less sparse) have a speed of less than 1 Megabits per second (Mbps) and approximately 80% have less than 5 Mbps. In urban areas (urban >10k), fewer than 15% of the households have a speed of less than 5Mbps (see also Figure 3:10 overleaf).
Moreover, research commissioned by Advantage West Midlands (forthcoming) into rural broadband infrastructure reveals that:
Even businesses nominally receiving good broadband package of 2 mbps have poor upload speeds e.g. 0.5mbps;
There are localised issues for businesses receiving different download speeds in the same neighbourhood;
Regionally 90% of urban businesses are within 2km of the nearest exchange, while only 70% rural businesses are. 2km being the distance after which the broadband service declines significantly; and,
There is less competition from broadband providers in rural areas.
26 Figure 2.3.7 on p.32 of 2010 State of the Countryside Report27 Figure 2.3.8 on p.32 of 2010 State of the Countryside Report
39

Opportunities and Barriers to Business Innovation in Rural Areas: Theory and Evidence
Figure 3:10 Map of areas that cannot receive more than 2mbps
Source: http://www.telegraph.co.uk/technology/broadband/ 3.5 Contextual Factors
There are some distinctive aspects of the rural environment which may potentially inhibit innovation:
Public transport: access to public transport is relatively limited in rural areas. For example, availability of a good bus service has improved in rural areas over time; but it remains significantly lower than urban areas. While 96% of households in urban areas have an hourly or better bus service within 13 minutes walk, the figure for villages and hamlet settlements is 50%28.
Premises: Another issue for small business development in peripheral rural areas is the provision of space (NESTA, 2007a). Whereas urban areas are generally characterised by a wide range of sizes and kinds of business property, this is invariably not the case in rural areas. Evidence suggests that whilst certain advantages stem from space availability at low cost in rural areas, there are also significant constraints affecting growing businesses resulting from the shortage of larger premises. For example, Keeble et al (1992) found that a higher proportion of remote rural businesses expressed dissatisfaction with the small size of their premises than was the case with urban based firms, the shortage of larger premises in these localities being attributed to strict planning policies. In the survey of businesses in the East Yorkshire and North Lincolnshire Rural Development Area (CEEDR, 1998), a third of firms considered space constraints to be a problem, with 15% considering it to be a
28 Figure 2.4.5 on page 39 of 2010 State of the Countryside Report
40

Opportunities and Barriers to Business Innovation in Rural Areas: Theory and Evidence
major problem. A similar proportion (18%) of growth orientated firms in a survey of manufacturing firms in rural northern England considered shortage of space to be a significant constraint on their growth (Smallbone et al, 1997). Whilst the space problem may only apply to a minority of rural firms, it is a more serious problem than the proportions suggest because it is most likely to affect the fastest growing firms. The planning system is also viewed as a constraint to growth and development of businesses in rural areas. For example, businesses report difficulties with planning applications to change the use of agricultural buildings to business, artistic or cultural premises (NESTA, 2007a).
The rural innovation literature however, highlights a number of positive drivers for business innovation in rural areas. These, in summary, are:
In migration: There has been a steady flow of people migrating from major urban to rural areas since the mid 1990s. These migrants tend to be over 35 and highly skilled / entrepreneurial29. Indeed in-migrant business owners are consistently reported to be more dynamic than indigenous ones (NESTA, 2007a)30.
Changing consumer preferences: more and more people are seeking ‘quality of life innovations’ such as demand for locally sourced, organic products, value added food products based on geographical provenance; and growing preference for consumers to spend leisure time in the countryside. This has led to the emergence of niche markets around health and quality of life.
Climate change: there is a growing importance of environmental technologies that rely on natural resources that are available in abundance in rural areas (e.g. crop based energy, renewable energy derived from wind and wave power).
Regulation and legislation: new regulations (for example, the EU Water Framework Directive) have provided an impetus for innovation for example, in ‘catchment sensitive farming’. Similarly, feed in tariffs have triggered innovation in micro renewables.
These social and environmental trends are already contributing to ‘on-farm diversification’. For example, farms are now producing non-food crops for energy purposes and are serving as tourism attractions. In parallel, developments in ICT infrastructure are making rural businesses more efficient and accessible.
Moreover, some businesses are deriving their innovativeness from being in the rural environment. Recent research31 identifies new opportunities and innovation potential for rural businesses specifically in the following sectors (see also Table 3:20):
Renewable energy: several distinctive features of rural areas such as climate (e.g. wind), geography (e.g. tidal) and economy (e.g. biomass from agricultural activity) give rural businesses an advantage over their urban counterparts in exploiting the opportunities resulting from climate change (and related regulatory requirements such as the ‘Renewables Obligation’ which requires electricity suppliers to supply an increasing percentage of their electricity from renewable sources).
High tech engineering: the development of energy based sectors provides opportunities for the emergence of businesses in related technology fields such as design and engineering, equipment for oil and gas exploration, off-shore environmental sector etc.
29 Figure 2.2.10 on page 17 of 2009 State of the Countryside Report30 However, it should also be noted that since many in-migrants move in to rural areas at or near retirement. Whilst some of this group may engage in entrepreneurial activity, this may not be on a full-time basis, nor with any intention of growing their business to employ others.31 Davies, S. (2010) Innovative Sectors in Peripheral Rural Areas, Workshop on Innovation in Remote and Peripheral Areas, Discussion Paper 1, EPRC, Scotland: Strathclyde.
SQW (2008) Innovation in rural areas, Presentation to One NorthEast.
41
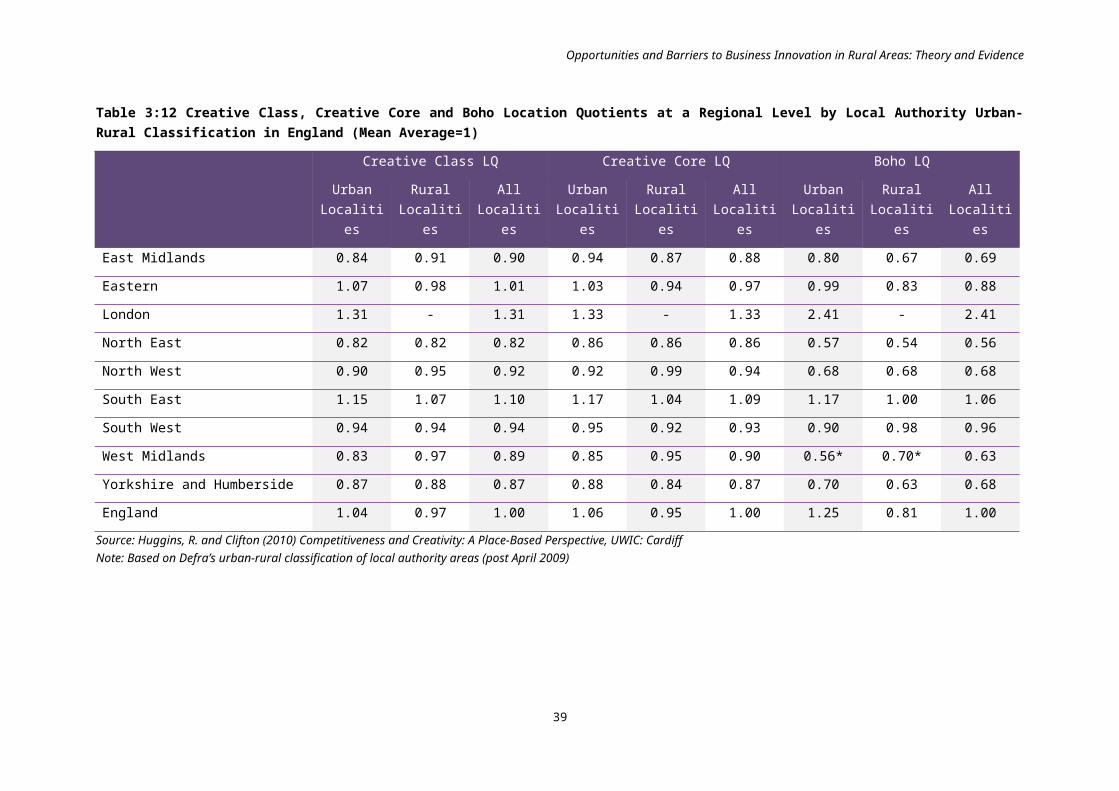
Opportunities and Barriers to Business Innovation in Rural Areas: Theory and Evidence
Food and drink: as highlighted previously, growing consumer appetite for organic or specialist products is driving innovation in the food and drink sector (particularly, artisanal food sector) in the form of local, added value processing; local supply chain development and collaboration; and innovations in branding and marketing.
Tourism: tourism is a growing sector in many rural areas; growth in this sector is being driven by a variety of factors including consumer preferences, ICT developments and greater innovation. Examples of innovation in this sector include the development of new products around nature, outdoor/environmental/ farm-based tourism; new marketing approaches; and development of collaborations and supply chains.
Outdoor goods: extensive opportunities to engage in outdoor activities such as walking, climbing and rafting have in some cases stimulated the creation of specialist outdoor clothing and equipment manufacturers in rural areas.
Business services: the development of broadband infrastructure has been a driver for location of back office functions in rural areas.
Creative sector: the expansion of broadband infrastructure has allowed many businesses to providing niche creative products and services in rural areas. Creative businesses are often micro-businesses or free-lancers who are attracted to rural areas because of their natural environment and high quality of life.
Table 3:20 Strategies for Deriving Innovativeness from a Rural Environment
Innovation strategy Sectors Examples of innovation
Negating aspects of peripherality
oil/gas-related engineering, electronics
R&D, technological, organisational and marketing innovations in specialist sectors
Focused on global markets
Using the periphery’s natural resources
renewable energies, Arctic technologies
R&D, technological
Image/ milieu based - exploiting an image of remoteness
food, creatives, tourism, outdoor goods
Mainly organisational and marketing
Building on local human capital
business services, creatives, tourism
Mainly organisational, marketing, technological adaptation
Adapted from Davies, S. (2010) Innovative strategies in remote areas, presentation at Seminar on Innovation in peripheral areas, Glasgow, 15th June 2010, Available at: http://www.eprc.strath.ac.uk/irr/workshop/Davies.pdf
Evidence Box 5 provides some insight into the specific barriers and opportunities for business innovation in the remote, rural areas of Northumberland.
42

Opportunities and Barriers to Business Innovation in Rural Areas: Theory and Evidence
Evidence Box 5: Barriers and Opportunities for Innovation in Rural Northumberland
Located in the north-eastern corner of England, Northumberland is England’s most rural county, with an average population density of 61 per square kilometre. Interviews with rural businesses in Northumberland identified several that were engaged in innovative activity (Case Study 5). Interviewees expressed the view that rurality does present a variety of barriers to innovation, making it more difficult or time consuming to develop networks, engage with HEIs, recruit specialist staff, and potentially (as a result of limited local markets) to access finance. Firm level factors – and especially the personal attitude and outlook of entrepreneurs - were highlighted as key factors in overcoming these barriers. In particular, motivation, confidence and a willingness to embrace new technologies and ideas were highlighted as key drivers of innovation activity. It was also stressed that rural areas may provide opportunities for innovation as a result of environmental and quality of life factors, access to low cost premises and assets that help them to exploit new market opportunities in growth sectors such as renewable energy.
3.6 Rates and Patterns of Business Innovation
Next, we assess whether or not there are any significant differences in rates and patterns of business innovation across rural and urban areas in England. This can be done using both direct measures of innovation performance (such as the number of innovations produced by firms and the proportion of firms undertaking innovation) and innovation intensity of firms i.e. percentage of firms’ sales derived from new or improved products or services; as well as proxy measures of innovation such as patents, and employment in knowledge intensive sectors. In this section we also examine the economic impact of innovation as measured by changes in productivity and competitiveness.
3.6.1 Patents
The generation of innovation can be represented by levels of patenting, as the nearest proxy to direct indicators of knowledge formation and knowledge capitalisation. The number of patents can be used to indicate how successful firms are in converting knowledge into potentially commercially viable products and processes. This indicator is not perfect, and it may be a better innovation measure for some industries rather than others. For example, automotive companies are more likely to patent than those firms working in financial services. However, there does appear to be a significant relationship between patenting rates and broader innovation capacity.
Figure 3:11 illustrates the accumulation of patent applications between 1995 and 2006 by type of area. By far the fastest growing areas are the significant rural areas. Patenting in most rural areas has grown more slowly, although only slightly less than the most urbanised ones. As shown by Figure 3:12, the ‘star’ rural performer is East Anglia, which is ranked second only to Berkshire, Bucks and Oxfordshire. The relatively rural economies of South Yorkshire and Lincolnshire have been the least patent active over the period.
Figure 3:13 and Table 3:21 highlight the total patent applications made across areas by patent type. It is clear that significant rural areas make a large contribution. Figures Figure3:14 to Figure 3:16 further illustrate the accumulation of patent application by sector between 1995 and 2006. Although the trends vary, the underlying feature is that patent application tends to be concentrated in or around the smaller cities and towns in the more southern parts of England.
43

Opportunities and Barriers to Business Innovation in Rural Areas: Theory and Evidence
Figure 3:11 Accumulation of Patent Applications (Number per Million Inhabitants) 1995-2006
1995 1996 1997 1998 1999 2000 2001 2002 2003 2004 2005 20060
2000
4000
6000
8000
10000
12000
14000
16000
Major Urban Large Urban Other Urban Significant Rural Rural 50 Rural 80
Source: EUROSTAT; Note: Large Urban and Rural 80 lines overlapNote: Based on Defra’s urban-rural classification of local authority areas (post April 2009)
44

Opportunities and Barriers to Business Innovation in Rural Areas: Theory and Evidence
Figure 3:12 Total Patent Applications (Number per Million Inhabitants) 1995-2006
Berksh
ire, B
ucks a
nd Oxford
shire
East
Anglia
Glouceste
rshire
, Wilt
shire
and Bris
tol/B
ath ...
Cheshire
Bedford
shire
, Hertf
ordsh
ire
Hampsh
ire an
d Isle o
f Wigh
t
Hereford
shire
, Worce
stersh
ire an
d Wark
s
Surre
y, Ea
st an
d West
Susse
xEss
exKen
t
Leice
stersh
ire, R
utland an
d Northan
ts
North Yo
rkshire
Derbysh
ire an
d Nottingham
shire
Mersey
side
London
Dorset a
nd Somers
et
West
Yorks
hire
Tees
Valley
and Durh
am
Cumbria
Shro
pshire
and St
afford
shire
West
Midlan
ds
Northumberl
and, T
yne a
nd Wea
r
Lanca
shire
Greater
Man
chest
er
East
Yorks
hire an
d Northern
Linco
lnshire
Devon
Cornwall
and Isl
es of S
cilly
South
Yorks
hire
Linco
lnshire
0.000
2000.000
4000.000
6000.000
8000.000
10000.000
12000.000
14000.000Major Urban
Signific-ant
RuralRural 80Large
UrbanOther Urban Rural 50
Source: EUROSTAT; Note: Based on Defra’s urban-rural classification of local authority areas (post April 2009)
45
Opportunities and Barriers to Business Innovation in Rural Areas: Theory and Evidence
Figure 3:13 Total Patent Applications by Type (Number per Million Inhabitants) 1995-2006
Major Urban
Large Urban
Other Urban
Significant Rural
Rural 50
Rural 80
0 2000 4000 6000 8000 10000 12000 14000
Biotech PatentsICT PatentsHigh-tech PatentsAll patents
Source: EUROSTATNote: Based on Defra’s urban-rural classification of local authority areas (post April 2009)
46

Opportunities and Barriers to Business Innovation in Rural Areas: Theory and Evidence
Table 3:21 Total Patent Applications by Type (Number per Million Inhabitants) 1995-2006
Major Urban Large Urban Other Urban Significant Rural Rural 50 Rural 80
All patents 3,069.9 362.4 1,859.4 13,626.7 4,551.9 352.4
High-tech Patents 527.6 76.6 358.1 3,339.8 1,386.8 38.9
ICT Patents 102.6 12.6 50.3 540.4 165.5 5.5
Biotech Patents 221.0 56.3 147.0 857.7 364.2 7.1
Source: EUROSTATNote: Based on Defra’s urban-rural classification of local authority areas (post April 2009)
47

Opportunities and Barriers to Business Innovation in Rural Areas: Theory and Evidence
Figure 3:14 Accumulation of High-Tech Patent Applications (Number per Million Inhabitants) 1995-2006
1995 1996 1997 1998 1999 2000 2001 2002 2003 2004 2005 20060
500
1000
1500
2000
2500
3000
3500
4000
Major Urban Large Urban Other Urban Significant Rural Rural 50 Rural 80
Source: EUROSTATNote: Based on Defra’s urban-rural classification of local authority areas (post April 2009)
48

Opportunities and Barriers to Business Innovation in Rural Areas: Theory and Evidence
Figure 3:15 Accumulation of ICT Patent Applications (Number per Million Inhabitants) 1995-2006
1995 1996 1997 1998 1999 2000 2001 2002 2003 2004 2005 20060
100
200
300
400
500
600
Major Urban Large Urban Other Urban Significant Rural Rural 50 Rural 80
Source: EUROSTATNote: Based on Defra’s urban-rural classification of local authority areas (post April 2009)
49

Opportunities and Barriers to Business Innovation in Rural Areas: Theory and Evidence
Figure 3:16 Accumulation of Biotechnology Applications (Number per Million Inhabitants) 1995-2006
1995 1996 1997 1998 1999 2000 2001 2002 2003 2004 2005 20060
100
200
300
400
500
600
700
800
900
1000
Major Urban Large Urban Other Urban Significant Rural Rural 50 Rural 80
Source: EUROSTATNote: Based on Defra’s urban-rural classification of local authority areas (post April 2009)
50

Opportunities and Barriers to Business Innovation in Rural Areas: Theory and Evidence
3.6.1.1 Knowledge-Based Businesses and Sectors
Knowledge-based sectors are those sectors characterised by concentrations of high-end technology and intelligence, with the production process requiring high levels of investment and innovation. Firms in such industries deploy a significantly higher proportion of their resources in research and development and often provide increased value-added in terms of generating wealth. Overall, these sectors have the most ‘knowledge intensive’ production processes, with the importance of innovation and the efficiency of production providing an opportunity for competitive advantage. The outputs from these knowledge-intensive sectors can also increase productivity in other economic sectors and support the diffusion of knowledge.
Table 3:22 shows the number of knowledge-based businesses as a proportion of all businesses for rural and urban areas; Table 3:23 shows the same data broken down by region. The OECD definition of knowledge-based businesses is used, covering the following sectors:
Pharmaceuticals
Office machinery and computers
Aerospace
Precision instruments
Electrical/Electronic engineering
Telecommunications
Financial intermediation, except insurance and pension funding
Insurance and pension funding, except compulsory social security
Activities auxiliary to financial intermediation
Computer & related activities
R&D
Other business activities
Motion picture and video activities
Radio & television activities.
As shown by Table 3:22, the concentration of knowledge-based businesses is highest in major urban areas, and whilst the percentage is relatively similar across the middle strata of districts, there is a relative paucity of knowledge-based businesses in districts where at least 80% of the population live in a rural environment. Given the undoubted association between the knowledge-intensity of sectors and their relative innovation capabilities, it is clear that economic structure plays a role in harbouring business innovation within the most rural communities of England. It is also proposed in the literature that differences in firms’ absorptive capacity are due to sectoral and technological specificities. An empirical study on absorptive capacity and regional patterns of innovation (DIUS, 2008) reveals that industry specific effects on absorptive capacity are large and significant whereas regional specific effects are not significant. The importance of industry specific effects shows that the innovative performance of a region will, in large part, be determined by its industrial composition.
51
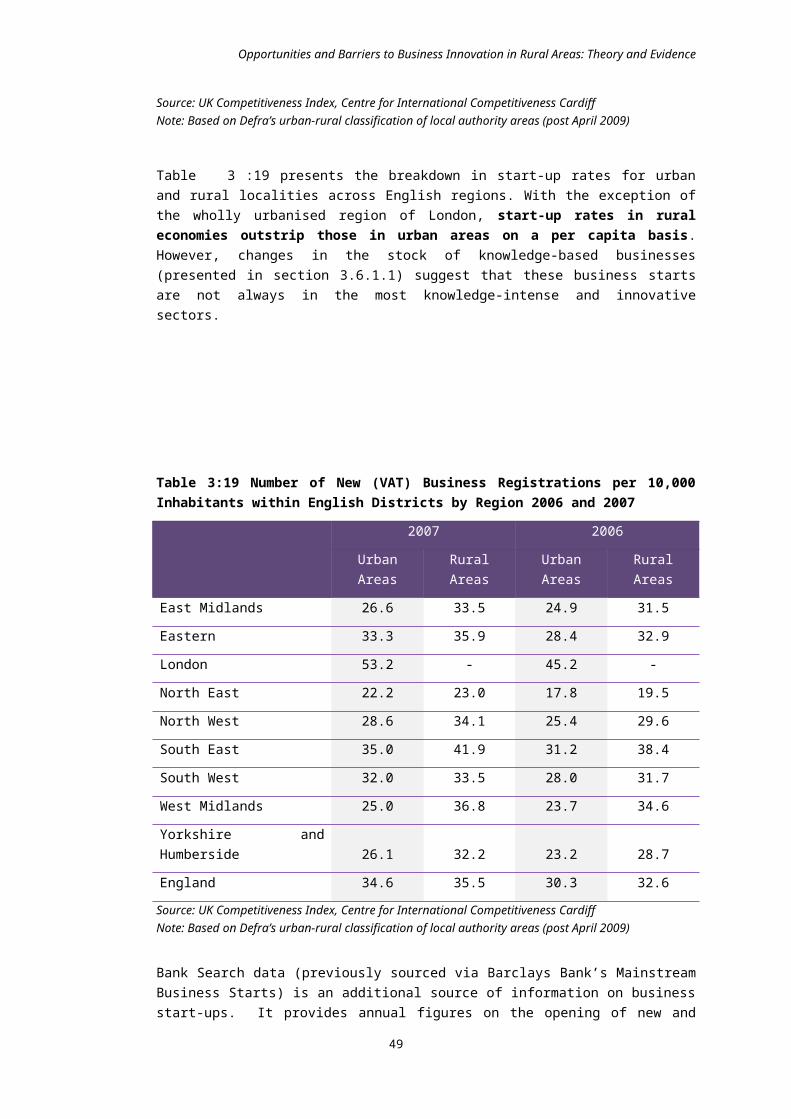
Opportunities and Barriers to Business Innovation in Rural Areas: Theory and Evidence
Table 3:22 Number of Knowledge-Based Businesses as a % of Total Business within English Districts 2007 and 2008
District Type 2008 2007
Major Urban 26.2% 25.3%
Large Urban 21.0% 20.5%
Other Urban 20.3% 19.9%
Significant Rural 22.5% 22.0%
Rural-50 20.5% 19.9%
Rural-80 18.5% 17.9%Source: UK Competitiveness Index, Centre for International Competitiveness CardiffNote: Based on Defra’s urban-rural classification of local authority areas (post April 2009)
The most telling feature of Table 3:23 is the very high percentage of businesses in London that operate in knowledge-based sectors. This is in stark contrast to the low percentage of such businesses in rural parts of northern England. Interestingly, the proportion of knowledge-based businesses in rural parts of South East England is higher than that for the urban parts of the region. The same is also true for North West England and the West Midlands. In contrast, there is a greater concentration of knowledge based businesses in the urban parts of the South West, which is likely to reflect a concentration of knowledge based activity in the more urbanised eastern areas of that region. This highlights that even within the rural economy of England, we see inter-regional divides, as well as differing levels of urban-rural innovation dependency within particular regions.
Table 3:23 Number of Knowledge-Based Businesses as a % of Total Business within English Districts by Region 2007 and 2008
2008 2007
Urban Areas Rural Areas Urban Areas Rural Areas
East Midlands 17.9% 18.1% 17.0% 17.3%
Eastern 22.0% 21.7% 21.2% 21.0%
London 30.8% 29.6%
North East 18.5% 14.2% 18.7% 14.2%
North West 19.1% 19.5% 19.5% 19.4%
South East 25.5% 25.9% 24.9% 25.1%
South West 21.8% 17.8% 21.9% 17.2%
West Midlands 18.4% 19.5% 17.8% 18.6%
Yorkshire and Humberside 17.4% 16.0% 16.7% 15.9%
England 23.9% 20.6% 23.2% 20.0%Source: UK Competitiveness Index, Centre for International Competitiveness CardiffNote: Based on Defra’s urban-rural classification of local authority areas (post April 2009)
However, it is encouraging to note that rural districts witnessed a larger growth in the Knowledge Intensive Business Services (KIBS) sectors as compared to urban districts between 1998 and 2007 as shown in Figure 3:17.
52

Opportunities and Barriers to Business Innovation in Rural Areas: Theory and Evidence
Figure 3:17 Percentage Change in the numbers of firms in Knowledge Intensive Business Services 1998-2006
Source: Commission for Rural Communities (2008)
At the start of this decade, KIBS firms in rural districts employed 295,000 people, just 11.4% of all such employment in England. Public services sector employment has always been a substantial part of rural employment – and in 1998 employment in the Knowledge Intensive Public Services (KIPS) amounted to just under 960,000 or 19.6% of rural employment. Over the decade an additional 291,000 people have taken employment in these knowledge-dependent sectors in rural districts. Despite the growth in KIBS, rural England has failed to keep pace with national growth rates in these sectors (Figure 3:18). However, the greatest growth in employment in KIBS and KIPS over the period 1998 to 2005 has been in Rural 50 (24.3%), closely followed by Rural 80 (22.1%) districts.
Figure 3:18 Percentage of Employees in Knowledge Intensive Business Services 1998-2005
Source: Commission for Rural Communities (2008)
53

Opportunities and Barriers to Business Innovation in Rural Areas: Theory and Evidence
Recent work done by the Work Foundation32 confirms the view that the British knowledge economy remains highly urban-centric with 47 per cent of employment in private knowledge intensive services in Great Britain located in London and the twelve largest regional cities in 2007; and London alone accounts for more than a quarter of all jobs in private knowledge intensive services. And although London is expected to continue to be a driving force for the British knowledge economy in 2020, the evidence presented in the report suggests that the share of private knowledge service employment based in rural areas will grow over the next decade; and that this growth will be driven by a combination of dis-agglomeration economies, the decentralisation of back office functions to lower cost locations and regional catch up. According to the report:
‘Looking ahead to 2020 it is clear that the agglomeration pull that compels some businesses in some knowledge sectors to locate in more expensive areas close to consumers, highly skilled workers and similar firms will continue to be counterweighed by technological flattening in the form of new technologies and high speed communications networks that allow set-up and growth in lower cost, more rural areas over the next decade.’
3.6.2 Innovation Outcomes
Table 3:24 presents data from a survey of more than 4,000 small firms in England, undertaken by the Small Business Service Analytical Unit in 2004. It shows that across urban and rural areas there is little difference in the percentage of innovation active small firms. However, this data tells us little about the number of innovations achieved, the level of investment in the innovation process, or the output or outcomes of innovation.
Table 3:24 Innovation Active Small Firms in England in 2004 (% of Firms undertaking innovation during the last 12 months)
Innovation Type Urban Rural, town
Rural, village
Rural, disperse
dTotal
Introduced New Products 34% 33% 35% 33% 34%
Introduced New Processes 25% 21% 23% 25% 25%
Source: Small Business Service Analytical Unit
Table 3:25 (and corresponding Figure 3:19) illustrate a range of indicators for firm level innovation activity. The data show that on average there is little difference across firms located in urban and rural areas in terms of rates and outcomes of innovation.
32 Morris, K. (2010) Flat or Spiky: The changing location of the British knowledge economy, A Knowledge Economy Working Paper, The Work Foundation.
54
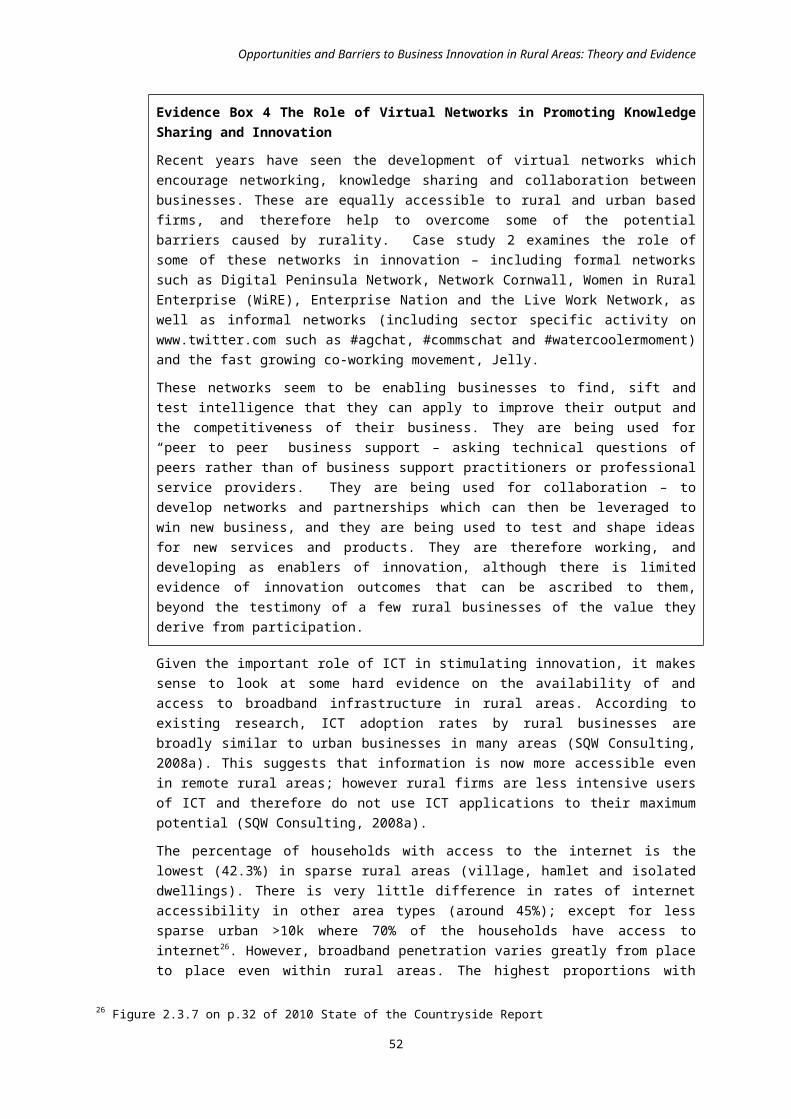
Opportunities and Barriers to Business Innovation in Rural Areas: Theory and Evidence
Table 3:25 Innovation Activity in Firms in England, 2009 (% of Firms)
Urban Areas
Rural Areas
Introduced new or significantly improved products over the last 3 years
51.0% 51.6%
Introduced new or significantly improved services over the last 3 years
40.8% 38.7%
Average percentage of sales coming from products and services introduced or improved over the last 3 years
32.5% 29.3%
Innovation extended the range of products on offer 25.2% 24.9%
Innovation added value to the products and services on offer 26.3% 24.9%
Innovation improved the speed of delivery of products and services
17.4% 17.0%
Source: NESTA Innovation Index, 2009; Note: Rural-urban classification based on postcodes
Figure 3:19 Innovation Activity in Firms in England, 2009 (% of Firms)
0% 10% 20% 30% 40% 50% 60%
Innovation improved the speed of delivery of products and services
Innovation extended the range of products on offer
Innovation added value to the products and services on offer
Average percentage of sales coming from product or process innovation
Introduced new or significantly improved services
Introduced new or significantly improved products
Rural Areas Urban Areas
Source: NESTA Innovation Index, 2009; Note: Rural-urban classification based on postcodes
Table 3:26 presents data from a survey of 343 firms across urban and rural areas in England (242 from urban areas and 101 from rural areas). The general characteristics of firms across urban and rural areas are relatively similar, with service sector firms accounting for about two-thirds of respondents in both urban and rural areas, although respondents from urban areas tend to be slightly larger than respondents in rural area (mean average employment size of firms in urban areas = 183 employees; rural areas = 153 employees).
Table 3:26 shows the average number of innovations produced by firms during the most recent period. Innovations are categorised according to whether they relate to goods or services, methods of production or supply, or improved forms of organisation, structures or practices. Firms in urban areas have produced more innovations across all three types, but significantly so in the case of the production of new or significantly improved goods and services. This suggests that firms located in urban areas of England
55

Opportunities and Barriers to Business Innovation in Rural Areas: Theory and Evidence
are dynamic in terms of innovation related to growing market share or entering new markets.
Table 3:26 Number of Innovations Introduced by Firms in England during the Last 3 Years (innovations per firm), 2009
Urban Rural All
New or significantly improved goods or services 9.0 5.6 8.1
New or significantly improved methods for the production or supply of goods and/or services 3.8 3.5 3.7
New or significantly improved forms of organisation, business structures or practices 2.7 2.3 2.6
Source: Based on Data Collected for Huggins, R., Izushi, I., Clifton, N., Jenkins, S., Prokop, D., and Whitfield, C. (2009) Sourcing Knowledge for Innovation: The Internationalisation of Flows, London: NESTA.
It should be noted that rural firms are on average smaller than urban ones, and on that basis they might therefore be expected to produce fewer innovations on average.
The available data (albeit drawn from different sources) suggest that whilst the share of firms that have introduced new or significantly improved services during the last three years is more or less same for urban and rural areas (Table 3:24); the innovation intensity i.e. the number of innovations per firm is higher in urban areas as compared to rural areas (Table3:26). This could partly explain why the average proportion of overall turnover resulting from product or service innovation is slightly higher among firms in urban areas (32.5%) as compared to firms in rural areas (29.3%). This is by no means a definitive conclusion; but rather an initial hypothesis that needs to be validated (or refuted) through further research.
3.6.3 Economic Impact3.6.3.1 Innovation and Productivity Rates
Although the sources of productivity are numerous, significant research indicates that productivity is at least partly a function of innovation. Indeed, the whole premise of new growth theory is that that knowledge, and the innovation it facilitates, is a key driver of productivity and economic growth, which departs from the traditional emphasis on the accumulation of physical capital. Therefore, it is pertinent to assess productivity differences across rural and urban areas as a means of inferring innovation differences. However, as with differences in measures such as the proportion of knowledge-based businesses, these differences are to some extent related to underlying economic structure, rather than the means by with the innovation process is implemented across different locations.
This section analyses productivity data derived from two sources: the UK Competitiveness Index and Defra’s own estimates33. According to the data sourced from the UK Competitiveness Index (Table 3:27), labour productivity (measured by output per employee) is highest within the most urbanised areas, and lowest in the most rural. However, within these poles there is relatively little variation, which implies that whilst business innovation rates may be polarised when comparing the most urban localities with the most rural, there may be significantly less difference across the ‘middle ground’ districts.
Table 3:27 Labour Productivity (Output per Employee) within English Districts 2006 and 2007
District Type 2007 2006
33 Dey-Chowdhury, S. And Gibson, P. (2008) Experimental estimates of rural-urban productivity, Economic and Labour
56

Opportunities and Barriers to Business Innovation in Rural Areas: Theory and Evidence
Major Urban £50,925 £48,520
Large Urban £42,088 £40,125
Other Urban £43,033 £41,437
Significant Rural £43,919 £42,233
Rural-50 £42,746 £41,047
Rural-80 £40,966 £38,899Source: UK Competitiveness Index, Centre for International Competitiveness CardiffNote: Based on Defra’s urban-rural classification of local authority areas (post April 2009)
These findings are consistent with Defra’s own estimates (Table 3:28Error: Referencesource not found) which also show that that there is no discernible rural-urban productivity gap, except at the poles (i.e. major urban and rural-80 LADs). However, while productivity improvements can be noted in major and large urban areas between 2006 and 2007; the relative productivity of rural areas appears to have declined over the same period (Figure3:20).
Table 3:28 Labour Productivity in English Districts, 2002 to 2007, Indices (England = 100)
2002 2003 2004 2005 2006 2007Major Urban 112.7 112.7 112.1 112.5 109.9 114.3
Large Urban 93.7 94.7 94 92.7 90.9 91.7
Other Urban 94.2 93.7 94.2 93.6 94.7 93.3
Significant Rural 95.6 93.3 94.6 95.6 100.1 97
Rural-50 94.2 94.1 94 94.2 94.8 90.4
Rural-80 83.7 86.4 86.8 86.5 89 85.4Source: Defra. Available at: http://www.defra.gov.uk/rural/policy/dso/productivity/index.htm
Figure 3:20 Labour Productivity in English Districts, 2002 to 2007, Indices (England = 100)
80
90
100
110
120
2002 2003 2004 2005 2006 2007
Major Urban Large Urban Other Urban Signif icant Rural Rural-50 Rural-80
Note: Produced from Defra’s statistics
57

Opportunities and Barriers to Business Innovation in Rural Areas: Theory and Evidence
When districts in the London region are separated from the Major Urban category, however, a different picture emerges. Figure 3:21 shows that there is no discernible productivity gap between rural and urban areas if London is separated from the other major areas – this points to the existence of a ‘London’ effect rather than a productivity gap.
Figure 3:21 Labour Productivity in English Districts treating London based districts separately, 2002 to 2007, Indices (England = 100)
80
90
100
110
120
130
140
2002 2003 2004 2005 2006 2007
Major Urban Large Urban Other Urban Signif icant Rural Rural-50 Rural-80 London
Source: Defra; Available at: http://www.defra.gov.uk/rural/policy/dso/productivity/index.htm. Some overlap between lines representing Major Urban and large Urban areas.
Table 3:29 provides data on differences in rural and urban productivity broken down by region. Overall, the data suggest that, apart from in the most productive (London) and least productive areas (parts of the South West and North East), there is very little difference in productivity rates between urban and rural areas in England. This suggests that it is the most peripheral rural areas that suffer from low productivity.
Table 3:29 Labour Productivity (Output per Employee) within English Districts 2006 and 2007 by Region
2007 2006
Urban Areas Rural Areas Urban Areas Rural Areas
East Midlands £41,491 £40,827 £40,259 £39,872
Eastern £45,989 £46,109 £43,366 £43,054
London £62,148 - £59,578 -
North East £39,345 £37,243 £36,944 £35,317
North West £37,983 £39,964 £36,582 £38,507
South East £48,128 £47,196 £46,389 £45,630
South West £44,290 £41,012 £42,251 £39,500
West Midlands £39,115 £39,080 £37,140 £37,184
Yorkshire and Humberside £38,577 £39,300 £36,683 £37,767
58

Opportunities and Barriers to Business Innovation in Rural Areas: Theory and Evidence
2007 2006
Urban Areas Rural Areas Urban Areas Rural Areas
England £47,189 £42,729 £45,064 £40,936Source: UK Competitiveness Index, Centre for International Competitiveness CardiffNote: Based on Defra’s urban-rural classification of local authority areas (post April 2009)
According to the literature, regional productivity differentials can be attributed to the presence of agglomeration effects in urban areas (Ciccone, 2001). This research therefore explored the role of physical agglomeration in addressing barriers to business innovation in rural areas (Evidence Box 6).
Evidence Box 6: Physical Agglomeration- The Role of Market Towns, Enterprise and Innovation Centres
Market towns, enterprise centres and innovation centres provide opportunities for businesses in rural areas to locate close to other firms and organisations. These models represent different elements of agglomeration, ranging from the passive (co-location without facilitation), intermediate (co-location with networking), to the active (coming together specifically to engage in knowledge exchange with access to expertise and facilitation). The potential for these to induce positive agglomeration effects such as knowledge spill-overs, co-ordinated input-output linkages, and specialised labour pooling is explored in Case Study 1.
Interviews with rural businesses and stakeholders suggest that market towns may provide convenient locations for rural businesses but lack the scale of urban centres, and, without active facilitation, may therefore fail to attract a sufficient critical mass of like minded businesses to stimulate knowledge exchange leading to innovation. Business and Innovation Centres may attract greater concentrations of businesses with an interest in networking and knowledge sharing, and may encourage such activity by providing pro-active networking support and encouraging collaboration. Their success is reliant upon a combination of location, accessibility, the quality of their space (and ancillary facilities) and the atmosphere that they create. It is often easier for operators to provide a winning combination of these factors in campus or out of town locations. The availability of high quality Business and Innovation Centres is determined by the market and is therefore site specific. As such rurality should not be a barrier to their success.
The case study supports the proposition that the size of rural settlements can be a barrier to innovation by limiting the likelihood of agglomeration effects occurring naturally. However, enterprise and innovation centres in rural areas can act as a focus for innovation activity, overcoming these barriers by proving the right combination of place, facilities, culture and facilitation.
3.6.3.2 Economic Competitiveness
This section is based on data drawn from the UK Competitiveness Index (UKCI). As shown by Table 3:30, only localities in the major urban areas are more competitive than the national average, indicating the extent to which UK competitiveness is driven by the Greater South East of England, covering the three regions of London, South East England and Eastern England, which the regional UK Competitiveness Index finds to be the only regions performing above the UK average. Interestingly, those localities with significant rural parts, and with more than 50% of their population in rural communities, are more competitive than non-major urban areas. This chimes with evidence from the US, which suggests that less dense and relatively ruralised localities in close proximity to the urban core - which in the US have been termed ‘edge cities’) - are often attractive places to live and work due to the quality of the environment and amenities. These edge of city rural areas in the UK are often the location for innovative firms started by relatively highly educated people who are in-migrants seeking a better quality of life.
59

Opportunities and Barriers to Business Innovation in Rural Areas: Theory and Evidence
The UKCI suggests that this pattern of competitiveness is changing, with growing divergence in urban and rural competitiveness over time. Between 1997 and 2008, the UKCI suggests that rural areas have seen a considerable fall in their relative competitiveness compared to the most urbanised communities. In the more recent period between 2005 and 2008 the figures suggest that this pattern has become more accentuated, with urban localities improving their economic competitiveness compared to their rural counterparts.
However, significant caution needs to be exercised in interpreting these trends. There are time lags in the UKCI data, which make the interpretation of trends difficult. In addition, the UKCI is a UK wide index, so comparisons between trends in English urban and rural areas with the UKCI as a whole are influenced by trends in competitiveness in Wales, Scotland and Northern Ireland. As a result, the finding from the UKCI that there has been a sharp recent decline in competitiveness in the Rural 80 areas conflicts with the results obtained from separately analysing the most recent data for individual indicators (that feed into the overall composite index).
Table 3:30 UK Competitiveness Index by Local Authority Level Urban-Rural Classification in England (Mean Average=100), 2008
RegionCompetitiveness
Index 2008% Change 1997-
2008% Change 2005-
2008
Major Urban 102.45 0.63 0.50
Large Urban 94.33 -0.46 -0.16
Other Urban 97.22 0.09 -0.01
Significant Rural 99.33 -1.10 -1.47
Rural-50 96.69 -1.20 -0.75
Rural-80 95.74 -1.84* -2.35*Source: UK Competitiveness Index, Centre for International Competitiveness CardiffNote: Based on Defra’s urban-rural classification of local authority areas (post April 2009)*Caution needs to be exercised in interpreting these data; UKCI may have overestimated trends in competitiveness
A regional perspective on urban-rural patterns of competitiveness provides an interesting snapshot of differences in performance. In the South West, North East, Eastern England and Yorkshire, urban areas outperform rural areas, but in the remainder of the regions rural areas are more competitive in overall terms, and significantly so in the case of the North West and West Midlands (Table 3:31).
Table 3:31 UK Competitiveness Index at Regional Level by Local Authority Urban-Rural Classification in England (Mean Average=100)
Urban Localities Rural Localities All Localities
East Midlands 94.23 95.36 94.86
Eastern 101.70 98.46 99.77
London 114.93 - 114.93
60

Opportunities and Barriers to Business Innovation in Rural Areas: Theory and Evidence
North East 85.45 83.26 84.23
North West 90.35* 96.87* 91.63
South East 105.48 105.56 105.52
South West 100.02 95.13 97.03
West Midlands 90.11 97.50 92.69
Yorkshire and Humberside 90.59 90.03 90.39
Source: UK Competitiveness Index, Centre for International Competitiveness CardiffNote: Based on Defra’s urban-rural classification of local authority areas (post April 2009)
As Table 3:32 shows, across England UKCI suggests that rural localities appear to be losing economic ground compared to urban areas. This is a trend ongoing since 1997 but which the index suggests has become even more accentuated in recent years, and across the nation as a whole the differences in urban-rural competitiveness changes appear to be significant. However, as noted above, caution is needed in interpreting these trends.
Table 3:32 Change in the UK Competitiveness Index at Regional Level by Local Authority Urban-Rural Classification in England
Region
% Change 1997-2008 % Change 2005-2008
Urban Localities
Rural Localities
Urban Localities
Rural Localities
East Midlands 1.89 -0.16 1.56 0.26
Eastern -0.57 -1.67 0.40 -1.47
London 0.67 - 1.44 -
North East 3.62 -0.47 1.37 0.63
North West 0.33 -2.31 -0.25 -3.41
South East -0.29 -2.15 -0.53 -2.05
South West -0.48 -1.42 -0.61 -2.17
West Midlands -0.68 -0.69 -0.65 -0.26
Yorkshire and Humberside 0.17 -1.26 -0.77 -1.98
England 0.26 -1.36 0.24 -1.57
Source: UK Competitiveness Index, Centre for International Competitiveness Cardiff*Caution needs to be exercised in interpreting these data; UKCI may have overestimated trends in competitivenessNote: Based on Defra’s urban-rural classification of local authority areas (post April 2009)
61

Opportunities and Barriers to Business Innovation in Rural Areas: Theory and Evidence
4 KEY MESSAGES
1. There are a number of aspects of the context for innovation which are more disadvantageous in rural areas as compared to urban areas.
Skills and Knowledge
There is a smaller and less diversified labour pool compared to urban areas - rural businesses operate in an environment where there are fewer people of working age, it is harder to attract graduates to settle, there is a reverse brain drain, where nearly one in five of the economically active are travelling away to work and the cost of living is higher.
There are lower numbers of innovation-related workers in significant rural and rural 80 districts. Specifically, it is the most rural areas that have the lowest density of R&D workers (with the exception of East Anglia and North Yorkshire) and other knowledge-based workers.
The proportion of people in the most rural areas of England receiving job related training is consistently lower than for England as a whole.
With few exceptions, rural areas have a lack of Higher Education Institutions (HEIs) and research institutions.
Competition
The thin business environment potentially reduces competitive pressures and the incentive to innovate. The relatively lower business churn in rural areas is indicative of lower competitive intensity.
Demand
Local rural markets are relatively small in size, lacking critical mass particularly in sparse/ remote rural areas.
Rural businesses are further removed from markets and networks. Their access to them is constrained by distance and a lower quality of ICT infrastructure; and although greater ICT access has improved connectivity of businesses, they still lack access to tacit knowledge.
Finance
Rural economies have a greater dependence on small businesses than urban economies. Smaller businesses lack resources to invest in innovation and find it harder to access finance as compared to larger businesses (due to existence of market failures). There are fewer options for rural businesses to obtain external funding locally from financial intermediaries – banks or investors - although this cannot be verified.
Public Research
Urban universities have more developed links with a larger pool of local SMEs compared to rural universities; are better at commercialising the knowledge that they produce; and, produce more graduate start-ups.
62

Opportunities and Barriers to Business Innovation in Rural Areas: Theory and Evidence
2. Innovative firms demonstrate an ability to overcome these disadvantages e.g. by accessing knowledge from further afield and engaging in collaboration and networks.
The personal attitude and outlook of entrepreneurs (in particular, motivation, confidence and a willingness to embrace new technologies and ideas) have been highlighted as key factors in overcoming barriers to innovation by some businesses.
Rural firms are more likely to source knowledge from outside their own region than within – pointing to a propensity to go and find the knowledge that they need. Indeed, most rural entrepreneurs are in-migrants - entrepreneurial individuals who are not born locally tend to rely less upon the local setting for the supply of materials and capital, as well as a market for their products/services. They also tend to have closer relationships with national and international sources of information than their locally-born counterparts.
Greater ICT access has made it easier for rural businesses to connect with others, collaborate and access new markets (e.g. through virtual networks).
Although the size of rural settlements can be a barrier to innovation by limiting the likelihood of agglomeration effects occurring naturally; enterprise and innovation centres in rural areas can act as a focus for innovation activity, overcoming these barriers by proving the right combination of place, facilities, culture and facilitation.
3. At the same time there are a number of positive drivers for business innovation in rural areas related to social, environmental and demographic trends
There is a steady flow of people from urban to rural areas – the high quality of life in the countryside is attracting highly skilled people.
Rural areas also have relatively well-educated populations, with levels of education higher than those of large and other urban areas.
Rural households, on average, earn more, have more disposable income and spend more than urban households.
Changing consumer preferences, climate change and new regulations have provided an impetus for innovation. There are specific opportunities for rural businesses in sectors such as renewable energy, food and drink, tourism, creative industries, high tech engineering, outdoor goods and business services.
4. There is little difference between rural and urban firms on most statistical indicators of innovation. However there are some aspects of innovation in which rural firms appear to be performing less well (patents, proportion of knowledge intensive businesses, innovation intensity).
There is no discernible rural-urban productivity difference (measured as output per employee), except at the poles i.e. major urban and rural-80 LADs. The polarity disappears if London is separated from the other major areas.
Across urban and rural areas there is little difference in the percentage of innovation active small firms.
However, firms in urban areas have produced more innovations, significantly so in the case of the production of new or significantly improved goods and services.
Most rural districts have a lower proportion of knowledge intensive businesses when compared to the English average; moreover, the proportion of knowledge based businesses within all new businesses is lower in rural than in urban areas.
63

Opportunities and Barriers to Business Innovation in Rural Areas: Theory and Evidence
Patenting in rural areas has grown more slowly, although rural areas do make a contribution particularly around bio-science and high technology.
5. There are clear variations in business innovation within rural areas – although most regions indicate minor differences, there is some evidence of weak performance in more peripheral areas (e.g. the North East and South West). Whilst the data does not support analysis at a more local level it seems likely that these differences are present within regions as well as between them.
Outside London, the proportion of knowledge based businesses shows little difference between rural and urban areas in most regions, with the exception of North East and South West of England.
The urban-rural productivity differential is greatest in the North East and South West of England.
6. Overall, it does not seem that being located in a rural region impairs the ability of businesses to innovate. While there are significant barriers to innovation in rural areas, it is also clear that there can also be advantages, and that some businesses derive their innovativeness from being in the rural environment.
There are examples of strongly performing rural areas (e.g. East Anglia) and weakly performing ones (Cornwall).
Many of the indicators do not differ greatly between rural and urban areas within regions. However, there are strong differences in innovation between London and the rest of England, and also significant differences in urban and rural innovation in more peripheral regions (the North East and South West).
This suggests that other factors such as peripherality may affect innovation activity and outcomes – although this study cannot offer definitive conclusions in this regard.
7. The evidence contained in this report offers policy makers the means by which to grasp the fundamental conditions that bear on a rural firm’s innovativeness, as well as to gauge the extent to which rural innovation conditions are more or less favourable, compared with urban areas. While this is a good starting point, reliance upon existing statistics does bring compromise. There would be advantages in developing the key indicators and some underlying data further - whether through negotiated refinements to existing surveys or, through a more demanding approach of creating new surveys.
Evidence is particularly weak on access to finance; demand factors; and, impact of competition on business innovation.
Interrogation of the available datasets in different ways would enable alternative hypotheses regarding factors influencing innovation to be explored, such as the effect of peripherality.
64

Opportunities and Barriers to Business Innovation in Rural Areas: Theory and Evidence
ANNEXES
65

Opportunities and Barriers to Business Innovation in Rural Areas: Theory and Evidence
ANNEX 1 BIBLIOGRAPHY AND REFERENCESAbreu, D. and Brunnermeier, M.K. (2003). ‘Bubbles and Crashes’, Econometrica 71, 173-204.
Acemoglu, D. (1998). ‘Why do Technologies Complement Skills?’ Quarterly Journal of Economics, 113(4), pp. 1055-1089.
Acs, Z. J. and Audretsch, D. B. (1987). ‘Innovation, Market Structure and Firm Size’, The Review of Economics and Statistics, 69(4), pp.569-570.
Adler, P.S., and Shenbar, A. (1990). ‘Adapting your technological base: the organizational challenge’. Sloan Management Review, 32(1), pp. 25–37.
Advantage West Midlands (2006). ‘Rural Access to Services’. Birmingham, Advantage West Midlands.
Advantage West Midlands (2007). ‘Urban rural interdependence of the City Region of Birmingham, Coventry and the Black Country’. Birmingham, Advantage West Midlands.
Advantage West Midlands (2008). ‘West Midlands Rural Evidence 2008’, Birmingham, Advantage West Midlands.
Aghion, P. and Tirole, J. (1994). ‘The Management of Innovation’. The Quarterly Journal of Economics, 109(4), pp.1185-1209.
Aghion, P., and Howitt, P. (1992). ‘A Model of Growth through Creative Destruction’. Econometrica, 60(2), pp.323-351.
Aghion, P., and Howitt, P. (1998). ‘Endogenous Growth Theory’. New York: McGraw-Hill.
Aghion, P., Bloom, N., Blundell, R., Griffith, R. and Howitt, P. (2002). ‘Competition and Innovation: An Inverted U Relationship.’ Quarterly Journal of Economics, 120(2), pp. 701-728.
Aghion, P. (2006). ‘A Primer on Innovation and Growth’. Unpublished paper, Bruegel, October.
Aghion, P., and Griffith, R. (2005). ‘Competition and Growth: Reconciling Theory and Evidence’. Cambridge, MA: MIT Press.
Aghion, P., Blundell, R., Griffith, R., Howitt, P. and Prantl, S. (2004). ‘Entry and Productivity Growth: Evidence from Microlevel Panel Data’. Journal of the European Economic Association, 2(2-3), pp.265-276
Agrawal, A. and Henderson, R. (2002). ‘Putting Patents in Context: Exploring Knowledge Transfer from MIT’. Management Science, 48(1), pp.44-60.
Agrawal, A. K. (2001). ‘University-to-industry knowledge transfer: literature review and unanswered questions’. International Journal of Management Reviews, 3(4), pp. 285-302.
Ahn, S. (2002). ‘Competition, Innovation and Productivity Growth: A Review of Theory and Evidence’. OECD Economics Department Working Paper No. 317, OECD Publishing. doi:10.1787/182144868160.
Micco, A. and Serebrisky, T. (2004). ‘Infrastructure, competition regimes and air transport costs: cross-country evidence’. RES Working Paper No. 510, Inter-American Development Bank, Research Department.
Alesina, A., Ardagna, S., Schiantarelli, F. and Nicoletti, G. (2003). ‘Regulation and Investment’. NBER Working Paper No. 9560.
Kahn, A. E. (1971). ‘The Economics of Regulation: Principles and Institutions’. New York: John Wiley & Sons, Inc., 2, pp.112.
66

Opportunities and Barriers to Business Innovation in Rural Areas: Theory and Evidence
Anderson, E. S. (2007). ‘Innovation and Demand’, in Hanusch, H.; Pyka, A. (eds.) ‘Elgar Companion to Neo-Schumpeterian Economics’, Cheltenham.
Anderson, R.D., Hollander, A., Monteiro, J. and Stanbury, W.T. (1998). ‘Competition Policy and Regulatory Reform in Canada, 1986 – 1997’. Review of Industrial Organization, 13(1-2), pp. 177-204.
Armington, C. and Acs, Z. J. (2002). 'The determinants of regional variation in new firm formation'. Regional Studies, 36(1), pp. 33-45.
Arrow, K. (1959). ‘Economic Welfare and the Allocation of Resources for Invention’. RAND Corporation Discussion Paper P-1856-RC, December 15, accessed at: http://www.rand.org/pubs/papers/2006/P1856.pdf
Arrow, K. (1962). ‘Economic Welfare and the Allocation of Resources for Invention’, in The Rate and Direction of Economic Activity, National Bureau of Economic Research, Princeton: Princeton University Press.
Arundel, A. (2004) ‘IB Results, 2004 Trend Chart Statistical Papers Series’. European Trend Chart on Innovation, Brussels: Commission of the European Communities.
Arundel, A. and Hollanders, H. (2007). ‘Differences in socio-economic conditions and regulatory environment: explaining variations in national innovation performance and policy implications’. INNO-Metrics Thematic Paper, www.proinno-europe.eu/admin/uploaded_documents/eis_2007_Socio-economic_conditions.pdf
Ashelford, T. & Dawkins, E. (2007). ‘Regional Rural Insights Report 2006/07’. Leeds: Yorkshire and The Humber Regional Observatory.
Ashelford, T. & Knight, A. (2008). ‘Yorkshire and The Humber Rural Evidence Base’. Leeds: Yorkshire and The Humber Regional Observatory.
Atherton, A. & Price, L. (2009). ‘Secondary Centres of Economic Activity in the East Midlands’. Lincoln: Enterprise Research and Development Unit (ERDU) and University of Lincoln.
Atkin, C. Francis, M. & Fane, P. (2006). ‘Agricultural, Food And Drink Industries In The East Of England: A Clear Way Ahead’. National Farmers Union (NFU), the East of England Development Agency (EEDA) and Government Office for the East of England (GO-East).
Atterton, J., Carroll, T., Driver, H., Johnson, L. and Saunby, J. (2006). ‘Study to Inform the Mainstreaming of Business Support in the Rural North East’. Final Report for One NorthEast (unpublished).
Baily, M. N. (1993). ‘Competition, Regulation, and Efficiency in Service Industries’. Brookings Papers on Economic Activity. Microeconomics, 2, pp. 71-159.
Baily, M. N. (2003). ‘The Sources of Economic Growth in OECD Countries: A Review Article’. International Productivity Monitor, 7(Fall), pp. 66-70.
Baldwin, J.R. and Johnson, J (1995). ‘Human Capital Development and Innovation: The Case of Training in Small and Medium-Sized Firms’. Statistics Canada Working Paper 74.
Barnett, H.G. (1953). ‘Innovation: The Basis of Cultural Change’. New York: McGraw Hill.
Baumol, W. (2002). ‘The Free Market Innovation Machine: Analyzing the Growth Miracle of Capitalism’. Princeton: Princeton University Press.
Beugelsdijk, S. (2007). ‘Entrepreneurial culture, regional innovativeness and economic growth’. Journal of Evolutionary Economics, 17(1), pp. 187-210.
Beugelsdijk, S. and van Schaik, T. (2006). ‘Differences in Social Capital between 54 Western European Regions’. Regional Studies, 39(8), pp. 1053-1064.
67

Opportunities and Barriers to Business Innovation in Rural Areas: Theory and Evidence
Beugelsdijk, S., van Schaik, T. and Arts, W. (2006). ‘Toward a Unified Europe? Explaining Differences in Value Patterns by Economic Development, Cultural Heritage and Historical Shocks’. Regional Studies, 40(3), pp. 317-327.
Bhide, A. (2006). ‘Venturesome Consumption, Innovation and Globalisation’. Paper for a Joint Conference of CESifo and the Center on Capitalism and Society, Venice, 21 - 22 July. Accessed at http://www.bhide.net/bhide_venturesome_consumption.pdf
Blundell, R., Griffith, R. and Van Reenen, J. (1995). ‘Dynamic Count Data Models of Technological Innovation’. Economic Journal, 105(429), pp.333-44.
Blundell, R., Griffith, R. and Van Reenen, J. (1999). ‘Market Share, Market Value and Innovation in the British Manufacturing Firms’. Review of Economic Studies, 66(3), pp. 529-54.
Boden, R., Cox, D., Georghiou, L. And Barker, K. (2001). ‘Administrative Reform of United Kingdom Government Research Establishments: case studies of new organisational forms’, in Cox, D., Gummett, P., Barker, K. (eds.), ‘Laboratories: Transition and Transformation’, pp. 77-96, IOS Press.
Bonaccorsi, A. and Piccaluga, A. (1994). ‘A theoretical framework for the evaluation of university-industry relationships’. R & D management, 24(3), pp.229-247.
Boone, J. (2000). ‘Competitive Pressure: The Effects on Investments in Product and Process Innovation’. RAND Journal of Economics, 31(3), pp. 549-569.
Boone, J. (2001). ‘Intensity of Competition and the Incentive to Innovate’. International Journal of Industrial Organization, 19(5), pp. 705-726.
BOP and Experian (2007). ‘Creative Countryside: Creative Industries Driving New Rural Economies’. Report for One NorthEast, Scottish Enterprise, Highlands and Islands Enterprise, East Riding Council, and Lancashire County Council.
BOP work on the creative industries in rural areas for the North Yorkshire Creative Industry Network (BOP 2005) and in the South West for SWRDA and Culture South West (2004), as well as many other studies such as Perfect Moment’s work in Devon and Torbay (2005) and Cornwall (Perfect Moment and Nottingham Trent University 2003), and Arts Council England’s national review (2005).
Boschma, R. (2005). ‘Social Capital and Regional Development: An Empirical Analysis of the Third Italy’, in: Boschma, R.A. and Kloostermann, R.C. (eds.) ‘Learning from Clusters: A Critical Assessment’, Dordrecht: Springer Verlag, pp. 139-168.
Bottger, P., Hallein, I. and P. Yetton (1985). ‘A cross-national study of leadership: participation as a function of problem structure and leader power’. Journal of Management Studies, 22(4), pp. 358-368.
Branscomb, L.M., Kodama, F. and Florida, R. (1999). ‘Industrializing Knowledge: University–Industry Linkages in Japan and the United States’. MIT Press, London, UK.
Burger, S. (2007). ‘Establishment of baseline to monitor key indicators of the health of the Yorkshire and Humberside Rural Economy Regional Update’. Cheshire; Promar International.
Burns Owens Partnership Ltd (2008). ‘Creative Industries in the Rural East Midlands Regional Study Report’. Nottingham: Culture East Midlands.
Calderini, M., Franzoni, C. and Vezzul, A. (2009). ‘The Unequal Benefit of Academic Patenting for Science and Engineering Research’. IEEE Transactions on Engineering Management, 56(1), pp. 16-30.
Campbell, J. R., and Hopenhayn, H. A. (2005). ‘Market Size Matters’. Journal of Industrial Economics, 53(1), pp. 1-25.
Canepa, A. and Stoneman, P. (2002). ‘Financial constraints on innovation: a European cross country study’. United Nations University, Institute for New Technologies, The Netherlands. Accessed at http://www.intech.unu.edu/publications/eifc-tf-papers/eifc02-11.pdf
68

Opportunities and Barriers to Business Innovation in Rural Areas: Theory and Evidence
Card, D., and Freeman, R. B. (2002). ‘What Have Two Decades of British Economic Reform Delivered in Terms of Productivity Growth?’. International Productivity Monitor, 5(Fall), pp. 41-52.
Carter, C.F. and Williams, B.R. (1957). ‘Industry and Technical Progress’. Oxford University Press.
Caselli, S., Gatti, S. and Perrini, F. (2008). ‘Are Venture Capitalists a Catalyst for Innovation?’. European Financial Management, 15(1), pp. 92-111.
Caves, R.E. (1990). ‘Industrial Efficiency in Six Nations’. Cambridge, MA: MIT Press.
Caves, R.E. (1998). ‘Industrial Organization and New Finding on the Turnover and Mobility of Firms’. Journal of Economic Literature, 36(4), pp. 1947- 1982.
Cefis, E., and Marsili, O. (2005). ‘A Matter of Life and Death: Innovation and Firm Survival’. Industrial and Corporate Change, 14(6), pp. 1167-92.
Chen, Z. (2006). ‘Rivalry, Market Structure, and Industrial Competitiveness: Issues and Evidence’. Report prepared for the Micro-Economic Policy Analysis Branch, Industry Canada, November 6.
Charlot, S. and Duranton, G. (2006). ‘Cities and workplace communication: some quantitive French evidence’. Urban Studies, 43(8), pp. 1369-1394.
Chesbrough, H.W. (2003). ‘The era of open innovation’. MIT Sloan Management Review, 44 (3), 35-41.
Clark, B. (2001). ‘The Entrepreneurial University: New Foundations for Collegiality, Autonomy, and Achievement’. Higher Education Management, 13(2), pp. 9-24.
Cockburn, I. and Henderson, R. (1996). ‘Public-private interaction in pharmaceutical research’. PNAS, 93(23), pp. 12725-12730.
Cohen, W. M. and Levinthal, D. A. (1990). ‘Absorptive Capacity: a New Perspective on Learning and Innovation’. Administrative Science Quarterly, 36(1), pp. 128-152.
Cohen, W. M. and Levinthal, D. A. (1989). ‘Innovation and Learning: The Two Faces of R&D’. The Economic Journal, 99 (397), pp. 569–596.
Cohen, W. M., Nelson, R. R. and Walsh, J. P. (2002). ‘Links and Impacts: The Influence of Public Research on Industrial R&D’. Management Science, 48(1), pp.1-23.
Cohen, W. M., Levin, R. C. and Mowery, D. (1987). ‘Firm Size and R&D Intensity: A Re-examination’. Journal of Industrial Economics, 35(4), pp. 543-565.
Cohen, W. M. and Klepper, S. (1996). ‘A Reprise of Size and R&D’. The Economic Journal, 106(437), pp. 925-951.
Cohen, W. M. and Levin, R. (1989). ‘Empirical Studies of Innovation and Market Structure’, in Handbook of Industrial Organization, 2, Schmalensee, R. and Willig, R. (eds.), Amsterdam: Nothh Holland, pp. 1059- 1107.
Commission for Rural Communities (2008a). ‘England’s rural areas: steps to release their economic potential’. Cheltenham Glos; Commission for Rural Communities.
Commission for Rural Communities (2008b). ‘State of the Countryside 2008, Summary Report’. Cheltenham Glos; Commission for Rural Communities.
Commission for Rural Communities (2009). ‘Recession Impacts on the Economies and Communities of Rural England’. Cheltenham Glos; Commission for Rural Communities.
Compaine, B. M. (ed.) (2001). ‘The Digital Divide: Facing a Crisis or Creating a Myth?’. Cambridge, Massachusetts: MIT Press.
Conti, A. and Gaule, P. (2009). ‘Are the US outperforming Europe in university technology licensing? A new perspective on the European paradox’. CEMI Working Paper No. 2009-003.
69

Opportunities and Barriers to Business Innovation in Rural Areas: Theory and Evidence
Cooke, P., Uranga, M. G. and Extebarria, G. (1997). ‘Regional innovation systems: institutional and organisations dimensions’. Research Policy, 26(4-5), pp. 475–491.
Coombs, R., Richards, A., Saviotti, P. P. and Walsh, V., (1996). ‘Technological Collaboration: The dynamics of cooperation in industrial innovation’. Edward Elgar, Cheltenham.
Cornford, J., Richardson, R., Sokol, M., Marques, P. and Gillespie, A. (2006). ‘Transformation of Regional Societies Through ICTs: State(s) of the Art(s) – A Discussion Document’, Bonn: TRANSFORM Consortium.
Cosh, A., Hughes, A. and Lester, R. (2005). ‘UK PLC: Just How Innovative Are We? Findings from the Cambridge-MIT Institute International Innovation Benchmarking Project’. Cambridge MIT Institute.
Cosh, A., Fu, X. and Hughes, A. (2004). ‘Innovatability of small and medium enterprises and its determinants: evidence from UK survey data’. Centre for Business Research, University of Cambridge, mimeo.
Cosh, A., Hughes, A. and Wood, E (1996). ‘Innovation in UK SMEs: causes and the consequences for firm failure and acquisition’. Working Paper No. 48, ESRC Centre for Business Research, University of Cambridge, Cambridge.
Council for Science and Technology (2009). ‘A National Infrastructure for the 21st Century’.
COWI (2009). ‘Coordination and Cooperation: non –universities research performing organisations’. (RPOs). D8 Final Report. January 2009. Report prepared for DG Research.
Cox, D., Georghiou, L. and Salazar, A. (2000). ‘Links to the Science Base of the Information Technology and Biotechnology Industries’. Report produced on behalf of the Economic and Social Research Council for the Director General of Research Councils.
Tether, B. (1999). ‘Small Firms, Innovation and Employment Creation in Business and Europe: A Question of Expectations’. University of Manchester, Centre for Innovation and Competition, Briefing Paper No. 2. Manchester: University of Manchester
Christensen, C.M. and Overdorf, M. (2001). ‘Meeting the challenge of disruptive change’, in Harvard Business School (ed.) ‘Harvard Business Review on Innovation’, Cambridge, MA: Harvard Business School Press. pp. 103-130.
Cunninghan, P. (2009). ‘ERAWATCH Research Inventory Report’, for the United Kingdom.
Daghfous, A. (2004). ‘Absorptive Capacity and the Implementation of Knowledge-Intensive Best Practices’. SAM Advanced Management Journal, 69 (2), pp. 21-27.
Dalpé, R. (1994). ‘Effects of Government Procurement on Industrial Innovation’. Technology in Society, 16 (1), pp. 65-83.
Dasgupta, P. and Stiglitz, J. (1980). ‘Uncertainty, Industrial Structure, and the Speed of R&D’. Bell Journal of Economics, 11(1), pp. 1-28.
Davies, S., Coles, H., Olczak, M., Pike, C. and Wilson, C. (2004). ‘The Benefits from Competition: Some Illustrative UK Cases’. DTI Economics Paper No. 9, Centre for Competition Policy, University of East Anglia, July.
Davis, S., Haltiwanger, J. and Schuh, S. (1998). ‘Job Creation and Destruction’. Cambridge: Cambridge University Press.
Dakhli, M. and De Clercq, D. (2003). ‘Human Capital, Social Capital, and Innovation: A Multi-Country Study’. Vlerick Leuven Gent Working Paper No. 2003-18.
De Man, A. and Duysters, G. (2005). ‘Collaboration and Innovation: A Review of the Effects of Mergers, Acquisitions and Alliances on Innovation’. Technovation, 25(12), pp.1383-1384.
Disney, R., Haskel, J. and Heden, Y. (2003). ‘Restructuring and Productivity Growth in UK Manufacturing’, Economic Journal, 113(489), pp. 666-694.
70

Opportunities and Barriers to Business Innovation in Rural Areas: Theory and Evidence
Deakins, D. (2007). ‘Innovation and Rural SMEs’. Working Paper No. 4. Paisley: Centre for Research into Regional Development, University of Paisley.
Dearden, L., Reed, H. and Van Reenen, J. (2000a). ‘Who Gains when Workers Train? Training and Corporate Productivity in a Panel of British Industries’. Institute of Fiscal Studies, Working Paper No. 00-04, pp. 69.
Dearden, L., McIntosh, S., Myck, M. and Vignoles, A. (2000b). ‘The Returns to Academic, Vocational and Basic Skills in Britain’. Skills Task Force Research Paper.
Defra (2004). ‘Map of England showing the Rural/Urban definition 2004 applied to CAS 2003 Wards’. Rural Evidence Hub.
D'Este, P. and Patel, P. (2007). 'University-industry linkages in the UK: What are the factors underlying the variety of interactions with industry?'. Research Policy, 36(9), pp. 1295-1313.
Dieckmann, O. (1996) ‘Cultural Determinants of Economic Growth: Theory and Evidence’. Journal of Cultural Economics, 20, pp. 297-320.
Rivaud-Danset, D. (2002). ‘Innovation and New Technologies: Corporate Finance and Financial Constraints’. International Conference – Innovation and New Technologies: Corporate Finance and Financial Constraints, jointly organised by the European Commission (DG Research) and the Institute for New Technologies of the United Nations University, Brussels, 7-8 November.
Dörrenbächer, H. and Schulz, C. (2002). ‘Cross-Border Production Systems and Cross-Border corporate cultures? The Case of the Saar-Lorraine Automotive Industry’, in: Die Erde, 133(1), pp. 3-17.
DTZ Pieda Consulting Ltd (undated). ‘Summary report: The Rural economies of the North-East’. Edinburgh; Countryside Agency.
Duranton, G. & Puga, D. (2003). ‘Microfoundations of agglomeration economies’. Centre for Economic Policy Research.
Eaton, J. and Kortum, S. (1995). ‘Engines of growth’. NBER Working Paper No 5207.
ECOFYS (2005). ‘A Renewable Energy Operational Plan For The East Of England: Final Report’. Cambridge; East of England Development Agency.
Edgerton, D. and Economic History Society (1996). ‘Science, technology, and the British industrial "decline", 1870-1970’. Cambridge: Cambridge University Press.
Edler, J (ed.) (2007). ‘Nachfrageorientierte Innovationspolitik: Benchmarking-Studie im Auftrag des Deutschen Bundestag’. (Demand-oriented Innovation Policy: Benchmarking Study on behalf of the German Parliament).
Edler, J. (2010). ‘Demand Oriented Innovation Policy’, in: Smits, R; Kuhlmann, S.; Shapira, P. (eds.), ‘The Co-Evolution of Innovation Policy – Innovation Policy Dynamics, Systems and Governance’. Cheltenham: Edward Elgar (forthcoming).
Edler, J. and Georghiou, L. (2007). ‘Public procurement and innovation — Resurrecting the demand side’, in Research Policy, 36, pp 949-963.
Edquist, C. (2005). ‘Systems of Innovation: Perspectives and Challenges’, in ‘The Oxford Handbook of Innovation’, Fagerberg, J., Mowery, D. C. and Nelson, R. R. (eds.). Oxford: Oxford University Press, pp. 181-208.
Engel, D. and Keilbach, M. (2007). ‘Firm Level Implications of Early Stage Venture Capital Investment – An Empirical Investigation’. Journal of Empirical Finance, 14(2), pp. 150-167.
ERAWATCH (2008). ‘Research inventory reports for higher education institutions’. European Communities, 2008. See http://cordis.europa.eu/erawatch.
71

Opportunities and Barriers to Business Innovation in Rural Areas: Theory and Evidence
Etro, F. (2004) ‘Innovation by Leaders’. Economic Journal, 114(495), pp. 281-303.
Etzkowitz, H. (2002). ‘MIT and the Rise of Entrepreneurial Science’. Routledge Press, London, UK.
Farrell, D. (2003). ‘The Real New Economy’. Harvard Business Review, October, pp.105-112.
Faulkner, W. W. and Senker, J. (1994). ‘Making sense of diversity: Public-private sector research linkages in three technologies’. Research Policy, 23, pp. 673-695.
Fawcett, N. and Cameron, G. (2005). ‘The Five Drivers: An Empirical Review’. University of Oxford, Discussion Paper Series No. 252, December.
Florida, R. (2000). ‘The role of the university: leveraging talent, not technology’, in: A. Teich et al. (eds.): ‘AAAS Science and Technology Policy Yearbook’. Washington, pp. 363-373.
Fortin, P. (2001). ‘The Irish Economic Boom: What Can We Learn?’. International Productivity Monitor, 3(Fall), pp. 19-31.
Foster L., Haltiwanger, J. and Krizan, C. J. (2001). ‘Aggregate Productivity Growth: Lessons from Micro-economic Evidence’, in Hulten, C. R., Dean, E. R. and Harper, M. J. (eds.), ‘New Developments in Productivity Analysis’, Chicago: University of Chicago Press.
Freeman, C. (1991). ‘Networks of Innovators: A Synthesis of Research Issues’. Research Policy, 20, pp. 499-514.
Freeman, C. (1994). ‘The economics of technical change’. Cambridge Journal of Economics, 18, pp. 463-514.
Fuss, M. and Waverman, L. (2005). ‘Canada‘s Productivity Dilemma: The Role of Computers and Telecom – Annex A’, Bell Canada‘s Submission to the Telecommunications Policy Review Panel.
Galdon-Sanchez, J. E. and Schmitz, J. A. Jr. (2003). ‘Competitive Pressure and Labor Productivity: World Iron Ore Markets in the 1980s’. Quarterly Review, Federal Reserve Bank of Minneapolis, Spring.
Gee, S. and Miles.I. (2008). ‘Global review of innovation intelligence and policy studies’. PRO INNO EUROPE Mini Study 04 – Innovation culture.
Geiger, R. L. and Sá, C. M. (2008). ‘Tapping the Riches of Science: Universities and the Promise of Economic Growth’. Harvard University Press.
Georghiou, L. (2007). ‘Demanding Innovation Lead markets, public procurement and innovation’. NESTA Provocation 02, February; London. See www.nesta.org.uk/ assets/pdf/ demandinginnovation_provocation_NESTA.pdf
Georghiou, L. and Rigby, J. (2002). 'Industry Science Relationships in the United Kingdom'. OECD.
Geroski. P. (1990). ‘Innovation, Technological Opportunities, and Market Structures’. Oxford Economic Papers, 43(3), pp. 586-602.
Gibbons, M., Limoges, C., Nowotny, H., Schwartzman, S., Scott, P. and Trow, M. (1994). ‘The New Production of Knowledge’, Sage Publications, London.
Gilbert, R. (2006). ‘Looking for Mr. Schumpeter: Where Are We in the Competition-Innovation Debate?’, in Jaffe, A. B., Lerner, J. and Stern, S. (eds.), ‘Innovation Policy and the Economy’, 6, Cambridge, MA: MIT Press, pp. 159-215.
Goldsmith, R. W. (1969). ‘Financial Structure and Development’. Yale University Press, New Haven.
Guellec, D. and van Pottelsberghe, B. (2004). ‘From R&D to Productivity Growth’. Oxford Bulletin of Economics and Statistics.
72

Opportunities and Barriers to Business Innovation in Rural Areas: Theory and Evidence
Guerzoni, M. (2007). ‘The impact of market size and sophistication on innovation: The patterns of demand’. Presentation to the Conference: Appropriability, proximity, routines and innovation, Copenhagen, June 18.
Hall, B. (2005). ‘The Financing of Innovation’. University of California at Berkeley; accessed at http://emlab.berkeley.edu/users/bhhall/papers/ShaneHB_BHH%20chapter_rev.pdf
Hall, E. and Hall, M. (1990). ‘Understanding Cultural Differences’. Intercultural Press, Yarmouth, ME.
Harkness, J.A., Van de Vijver, F.J.R. and Mohler, P.P. (2003). ‘Cross-Cultural Survey Methods’. Hoboken: John Wiley & Sons.
Hasan, H. and Ditsa, G. (1999). ‘The Impact of Culture on the Adoption of IT: An Interpretative Study’, in: Journal of Global Information Management, 7(1), pp. 5-15.
HE-BCI UK. ‘Higher education-business and community interaction survey’. http://www.hefce.ac.uk/econsoc/buscom/hebci/
HEFCE (2008). ‘Higher education - business and community interaction survey’.
Heisey, P.W., King, J. L. and Rubenstein, K. (2005). ‘Patterns of public-sector and private-sector patenting in agricultural biotechnology’. AgBioForum, 8(2-3), pp. 73-82.
Herbig, P. A. and Miller, J.C. (1992). ‘Cultural Aspects of Innovation’. Journal of Global Marketing, 6(3), pp. 23-45.
Herbig, P. and Dunphy, S. (1998). ‘Culture and Innovation’, Cross Cultural Management, 5(4), pp. 13-21.
HESA (2008). Higher Education Statistics Agency, http://www.hesa.ac.uk/
Hirukawa, M. and Ueda, M. (2008). “Venture capital and innovation: Which is first?” CEPR Discussion Paper No. 7090.
HM Treasury (2006). ‘Skills in the UK – The Long-Term Challenge’. Leitch Review of Skills, mimeo
Hofstede, G., Noorderhaven, N. G., Thurik, A. R. and Wildeman, R. E. (2004). ‘Culture’s role in entrepreneurship: self-employment out of dissatisfaction’, in Brown, T. and Ulijn, J. (eds.), ‘Innovation, Entrepreneurship and Culture’.
Hofstede, G. (2001). ‘Culture’s consequences – comparing values, behaviours, institutions and organizations across nations’. London: Sage Publications.
Hoj, J. and Wise, M. (2006). ‘Product Market Competition and Economic Performance in France’. OECD, Economic Department Working Paper No. 473, January 4.
House of Commons Science and Technology Committee (2002). ‘Short-term research contracts in science and engineering’. Eighth report of session, 2001-02.
Howells, J., Nedeva, M. and Georghiou, L. (1998). ‘Industry-Academic Links in the UK’. Report to the Higher Education Funding Councils for England, Scotland and Wales.
Howitt, P. (2004). ‘Endogenous Growth, Productivity and Economic Policy: A Progress Report’. International Productivity Monitor, 8(Spring), pp.3-15.
Howitt, P. (2007). ‘Innovation, Competition and Growth: A Schumpeterian Perspective on Canada‘s Economy’. C.D. Howe Institute, April.
Huang, H. and Xu, C. (1999). ‘Financial Institutions and the Financial Crisis in East Asia’. European Economic Review, 43(4-6), pp. 903–914.
Hughes, A. (2006). ‘University-Industry Linkages and UK Science and Innovation Policy’. ESRC Centre for Business Research Working Paper No. 326, University Of Cambridge.
73

Opportunities and Barriers to Business Innovation in Rural Areas: Theory and Evidence
Ingham, G. K. (1984). ‘Capitalism divided?: the city and industry in British social development’. London: Macmillan.
Inglehart, R. (1997). ‘Modernization and Postmodernization: Cultural, Economic and Political Change in 43 Societies’. Princeton N.J.: Princeton University Press.
Inglehart, R. and Baker, W.E. (2000). ‘Modernization, Cultural Change, and the Persistence of Traditional Values’. American Sociological Review, 65, pp. 19-51.
Inglehart, R. and Welzel, C. (2005). ‘Modernization, Cultural Change, and Democracy: The Human Development Sequence’. Cambridge, MA, et al.: Cambridge University Press.
Jaffe, A. B. and Lerner, J. (2004). ‘Innovation and Its Discontents: How Our Broken Patent System is Endangering Innovation and Progress and What to Do About It’. Princeton University Press.
Jaffe, A.B. (1989). ‘Real Effects of Academic Research’. American Economic Review, 79(5), pp.957-70.
James, A. (2005). ‘Demystifying the role of culture in Innovative Regional Economics’, in: Regional Studies, 39(9), pp. 197-1216.
James, A. (2003). ‘Regional Culture, Corporate Strategy and High Tech Innovation: Salt Lake City’. Dissertation submitted for the degree of Doctor of Philosophy, Department of Geography and Fitzwilliam College, University of Cambridge.
Jaumotte, F., and Pain, N. (2005). ‘An Overview of Public Policies to Support Innovation’. OECD Economics Department Working Paper No.456.
Jaumotte, F., and Pain, N. (2005). ‘Innovation in the Business Sector’. OECD Economics Department Working Paper No. 459.
Kamien, M. and Schwartz, N. (1982). ‘Market Structure and Innovation’. Cambridge: Cambridge University Press.
JM Consulting and SQW Ltd. (2007). ‘Review of provision for landbased studies’. Final Report to HEFCE (May 2007).
Jordan, D. and O’Leary, E. (2007). ‘Is Irish Innovation Policy Working? Evidence from High-Technology Businesses’. Journal of Statistical and Social Inquiry Society of Ireland, October.
Katila, R. and Shane, S. (2005). “When does Lack of Resources Make New Firms Innovative?”, Academy of Management Journal, 48(5), pp. 814-829.
Keeble, D., Tyler, P., Broom, G. and Lewis, J. (1992). ‘Business Success in the Countryside: The Performance of Rural Enterprise’. London: HMSO.
Kerr, C. (1983). ‘The Future of Industrial Societies: Convergence or Continuing Diversity’. Cambridge, MA: Harvard Univserity Press.
Kirchhoff, B. and Armington, C. (2002). ‘The influence of R&D expenditures on new firm formation and economic growth’. Maplewood: Research Report for the Office of Economic Research.
Knack, S. and Keefer, P. (1997). ‘Does Social Capital Have an Economic Payoff? A Cross-Country Investigation’. Quarterly Journal of Economics, 112(4), pp. 1251-1288.
Kortum, S. and Lerner, J. (2000). ‘Assessing the impact of venture capital on innovation’. Rand Journal of Economics, 31(4), pp. 674-692.
Lam, L. (2005). ‘Organisational innovation’, in Fagerberg, J., Mowery, D. C. and Nelson, R. R. (eds), ‘The Oxford Handbook of Innovation’, Oxford University Press: Oxford.
Landos, D. (2000). ‘Culture makes almost all the difference’, in Harrison, L. E. and Huntington, S. P. (eds), ‘Culture matters: How values shape human progress’, New York: Basic Books.
74

Opportunities and Barriers to Business Innovation in Rural Areas: Theory and Evidence
Law, W. A. (1986). ‘A Corporation Is More Than Its Stock’. Harvard Business Review, May/June, pp. 80-83.
Lawton-Smith, H. L. (2007). 'Universities, innovation, and territorial development: a review of the evidence'. Environment and planning. C, Government and Policy, pp. 25: 98.
Lee, C. (1998). ‘Determinants of National Innovativeness and International Market Segments’. International Marketing Review, 7(5), pp. 39-49.
Lee, S. Y., Florida, R. and Acs, Z. J. (2004). 'Creativity and entrepreneurship: A regional analysis of new firm formation'. Regional Studies, 38(8), pp. 879-891.
Levie, J. (IIP) (2009). ‘The IIIP Innovation Confidence Index 2008’. Strathclyde.
Levine, R. and Zervos, S. (1998). ‘Capital Control Liberalization and Stock Market Development’. World Development, 26(7), pp. 1169–83.
Leydesdorff, L. and Meyer, M. (2009). ‘The Decline of University Patenting and the End of the Bayh-Dole Effect’. Scientometrics, forthcoming.
Lowe, P. and Ward, N. (2007). ‘Sustainable Rural Economies: Some Lessons from the English Experience’. Sustainable Development, 15(5), pp. 307-317.
Lundvall, B-A. (1988) ‘Innovation as an interactive process: from user-producer interaction to the national system of innovation’, in Dosi, G., Freeman, C., Nelson, R., Silverberg, G. and Soete, L. (eds.), ‘Technical change and economic theory’, London.
Malecki, E.J., (1991). ‘Technology and Economic Development: The Dynamics of Local, Regional and National Change’. Longman, London.
Mansfield, E. J. (1963). ‘Size of Firm, Market Structure and Innovation’. Journal of Political Economy, 71(6), pp. 556-576.
Mata, J., Portugal, P. and Guimaraes, P. (1995). ‘The Survival of New Plants: Start-up Conditions and Post-entry Evolution’. International Journal of Industrial Organization, 13(4), pp. 459-481.
Franklin, M., Stam, P. and Clayton, T. (2009). ‘ICT impact assessment by linking data’, a paper presented to a statistics conference in Prague in spring 2009. UK Office for National Statistics.
Mauro, P. (1995). ‘Corruption and Growth’. Quarterly Journal of Economics, 110(3), pp. 681-712.
Maye, D., Holloway, L. and Kneafsey, M. (2007) (eds.) ‘Alternative Food Geographies: Representation and Practice.’ UK/The Netherlands: Elsevier.
McGuckin, R. H., Speigelman, M. and van Ark, B. (2005). ‘The Retail Revolution: Can Europe Match U.S. Productivity Performance?’. The Conference Board Research Report R-1358-05-RR
McKenzie, K. (2005). ‘Tax Subsidies for R&D in Canadian Provinces’. Canadian Public Policy, 31(1), pp. 29-44.
McKinsey Global Institute (1995a). ‘Sweden’s Economic Performance’. Washington, D.C.: McKinsey & Company.
McKinsey Global Institute (1995b). ‘Australia’s Economic Performance’. Washington, D.C.: McKinsey & Company.
McKinsey Global Institute (1997a). ‘Removing Barriers to Growth and Employment in France and Germany’. Washington, D.C.: McKinsey & Company.
McKinsey Global Institute (1997b). ‘Boosting Dutch Economic Performance’. Washington, D.C.: McKinsey & Company.
McKinsey Global Institute (1998a). ‘Driving Productivity and Growth in the U.K. Economy’. Washington, D.C.: McKinsey & Company.
75

Opportunities and Barriers to Business Innovation in Rural Areas: Theory and Evidence
McKinsey Global Institute (1998b). ‘Productivity the Key to an Accelerated Development Path for Brazil’. Washington, D.C.: McKinsey & Company.
McKinsey Global Institute (2000). ‘Why the Japanese Economy is not Growing’. Washington, D.C.: McKinsey & Company.
McMeekin, A., Green, K., Tomlinson, M. and Walsh, V. (eds.) (2002). ‘Innovation by Demand: An Interdisciplinary Approach to the Study of Demand and its Role in Innovation’. Manchester and New York: Manchester University Press.
Menzel, H.C. Krauss, R. Ulijn, J.M. and Weggeman, M. (2006). ‘Developing characteristics of an intrapreneurship-supportive culture’. Working Paper No. 06.10, Eindhoven: Eindhoven Centre for Innovation Studies, Department of Technology Management.
Meyer, M., (2003). ‘Academic entrepreneurs or entrepreneurial academics? Research-based ventures and public support mechanism’. R&D Management, 33, pp. 107–115.
Meyer-Krahmer, F., Schmoch, U. (1998). ‘Science-based Technologies: University-Industry Interactions in Four Fields’. Research Policy, 27, pp. 835-8.
Mokyr, J. (1991). ‘The Lever of Riches: Technological Creativity and Economic Progress’. London: Oxford University Press.
Duran, X., Molas-Gallart, J., Patel, P., Salter, A. and Scott, A. (2002). ‘Measuring Third Stream Activities: Final Report to the Russell Group of Universities’. SPRU, University of Sussex, April.
Morck, R., and Yeung, B. (2002). ‘The Economic Determinants of Innovation’, in Rao, S. and Sharpe, A. (eds.), ‘Productivity Issues in Canada’, pp. 361-418. Calgary: University of Calgary Press.
Motta, M. (2004). ‘Competition Policy: Theory and Practice’. Cambridge: Cambridge University Press.
Nelson, R., and Winter, S. (1982). ‘An Evolutionary Theory of Economic Change’. Cambridge, MA: Harvard University Press.
Moulaert, F. and Nussnaumer, J. (2005). ‘Beyond the learning region: the dialectics of Innovation and Culture in Territorial Development’, in: Boschma, R.A. and Kloosterman, R.C (eds.), ‘Learning from Clusters: A critical Assessment’, Dordrecht: Springer Verlag, pp. 89-109.
Mowery, D and Rosenberg, N. (1979). ‘The influence of market demand upon innovation: A critical review of some recent empirical studies’. Research Policy, 8(2), pp. 102-153.
Myers, S. and Majluf, N. S. (1984). ‘Corporate Financing and Investment Decisions When Firms Have Information That Investors Do Not Have’. Journal of Financial Economics, 13, pp. 187-221, Routledge, New York
Myers. M. and Tan, F. (2002). ‘Beyond Models of National culture in Information Systems Research’. Advanced Topics in Global Information Management, pp. 14-29.
Nedis, R. & Byler, E. (2009). ‘Creating a National Innovation Framework’. Science Progress, April.
NESTA (2007a). ‘Rural Innovation’. London; NESTA.
NESTA (2007b). ‘The Nesta Innovation Index; Hidden Innovation’. London; NESTA.
NESTA (2008a). ‘Total Innovation: Harnessing all forms of innovation to maximise competitive advantage’. Policy Briefing T1/24, London; NESTA.
NESTA (2008b). ‘Shifting sands: The changing nature of the early-stage venture capital market in the UK’. London, NESTA.
NESTA (2009a). ‘Innovation, knowledge spending and productivity growth in the UK’. London; NESTA.
76

Opportunities and Barriers to Business Innovation in Rural Areas: Theory and Evidence
NESTA (2009b). ‘Measuring sectoral innovation capability in the nine areas of the UK economy’. Report for NESTA Innovation Index project, London, NESTA.
NESTA (2009c). ‘The wider framework conditions for innovation in the UK’. London, NESTA.
NESTA (2009d). ‘From funding gaps to thin markets’. London, NESTA.
NESTA (2009e). ‘Reshaping the UK economy’. London, NESTA.
NESTA (2009f). ‘Siding with the Angels’. London, NESTA.
Nickell,S. and Nicolitsas, D. (1997). ‘Human Capital and Innovation: What are the Connections?’. LSE Centre for Economic Performance Working Paper CEPDP 370.
Niebuhr, A. (2006). ‘Migration and Innovation: Does Cultural Diversity Matter for Regional R&D Activity?’. IAB Discussion Paper No. 14/2006, Nürnberg: Bundesagentur für Arbeit.
North East Regional Information Partnership (2006). ‘Rural and Urban Comparisons in North East England Report’. Newcastle upon Tyne; North East Regional Information Partnership
North West Development Agency (undated). ‘The Rural Development Programme for England in the Northwest – Summary’. Cheshire; North West Development Agency.
North, D. and Smallbone, D. (2000). 'The Innovativeness and Growth of Rural SMEs in the 1990s'. Regional Studies, 34(2), pp. 145-157.
Noyons, E.C.M., Buter, R.K., Van Raan, A.F.J., Schmoch, U., Heinze, T., Hinze, S. and Rangnow, R. (2003). ‘Mapping excellence in science and technology across Europe-Life Science: Nanoscience and nanotechnology’. CWTS/FhG-ISI reports for the European Commission/ DG Research.
O’ Shea, R.P, Chugh, H. and Allen, T. J. (2008). ‘Determinants and consequences of university spin-off activity: A conceptual framework’. Journal of Technology Transfer, forthcoming.
OCDE (2005). ‘Innovation Policy and Performance: A Cross- country comparison.’ Innovation Policy and Performance in The United Kingdom, Chapter 7, pp. 203-231.
OECD (2002), ‘Benchmarking Industry-Science Relationships’. OECD, Paris.
OECD (2003). ‘The sources of economic growth in OECD countries.’
OECD (2004). ‘Financing innovative SMEs in a global economy’.
OECD (2004a), ‘OECD Economic Surveys Canada’, 2004/16, Section 2, Product Market Competition and Macroeconomic Performance.
OECD (2004b). ‘The Sources of Economic Growth’. OECD, Paris.
OECD (2004c). ‘Understanding Economic Growth: A Macro-level, Industry-level, Firm- level Perspective’. OECD, Paris.
OECD (2005). ‘The Benefit of Liberalizing Product Market and Reducing Barriers to International Trade and Investment: The Case of the United States and European Union’. OECD Economics Department Working Paper No. 432.
OECD (2006a). ‘Economic Surveys: Australia’.
OECD (2006b). ‘Economic Surveys: Canada’.
OECD (2007). ‘Competition and Barriers to Entry’. Policy Brief, January.
OECD (2009). ‘Highlights from Education at a Glance 2009’.
OECD/ Eurostat (2005). ‘Oslo Manual – Proposed Guidelines for Collecting and Interpreting Innovation Data’. 3rd edition, OECD, Paris
77
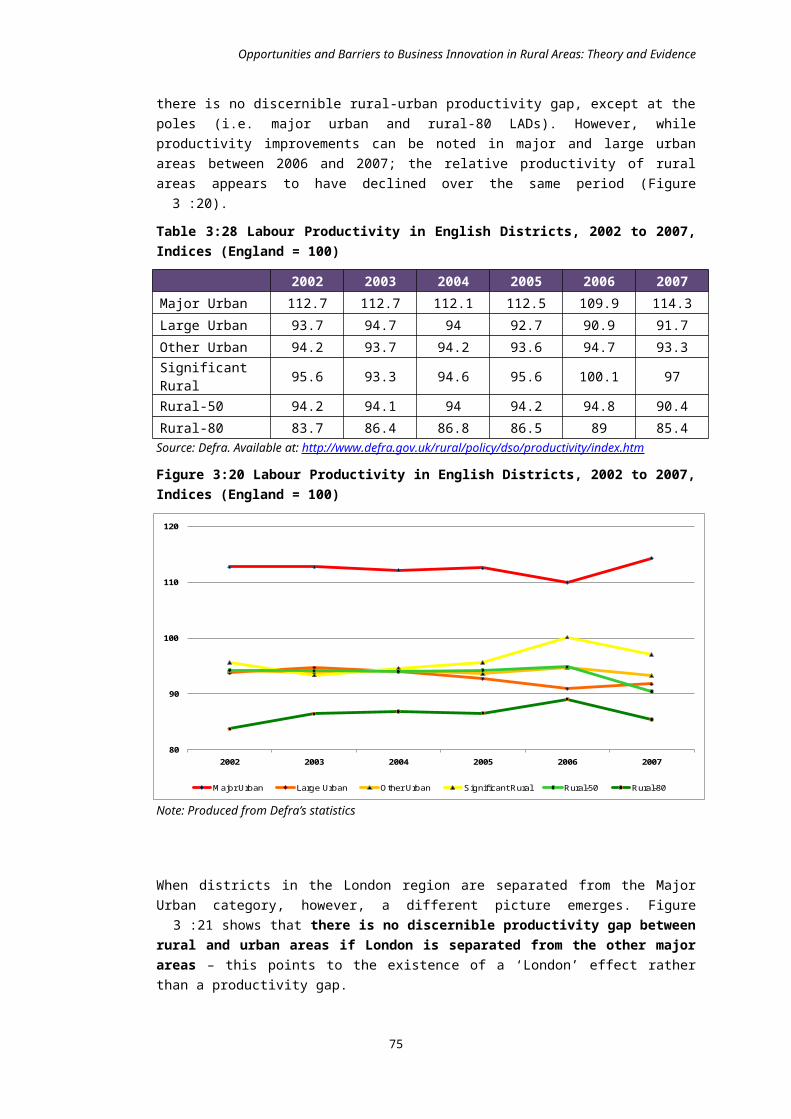
Opportunities and Barriers to Business Innovation in Rural Areas: Theory and Evidence
Perkmann, M. and Walsh, K. (2007). 'University-industry relationships and open innovation: Towards a research agenda ' International Journal of Management Reviews, 9(4), pp. 259-280.
Porter, M. (1985). ‘Competitive Advantage: Creating and Sustaining Superior Performance’. New York: Free Press.
Porter, M. (1990). ‘The Competitive Advantage of Nations’. New York: MacMillan Press.
Porter, M. (2000). ‘Competition and Prosperity, Global Competitiveness Report’.
Porter, M. (2001). ‘Competition and Antitrust’. Presentation made at the conference – Canadian Competition Policy, Richard Ivey School of Business, Toronto, June 19.
Porter, M. and Sakaibara, M. (2001). ‘Competing at Home to Win Abroad: Evidence from Japanese Industry’. Review of Economics and Statistics, 83(2), pp. 310-322.
Porter, M., Takeuchi, H. and Sakakibara, M. (2000). ‘Can Japan Compete?’. New York: MacMillan Press.
Prandelli, E., Sawhney, M. and Verona, G. (2008). ‘Collaborating with Customers to Innovate: Conceiving and Marketing Products in the Networking Age’. Cheltenham.
Quigley, J. (1998). ‘Urban Diversity & Economic Growth’. The Journal of Economic Perspectives, 12(2), pp. 127-138.
Reynolds, P., Storey, D. J. and Westhead, P. (1994). 'Cross-National Comparisons of the Variation in New Firm Formation Rates'. Regional Studies, 28(4), pp. 443-456.
Ridley, T., Yee-Cheong, L. and Juma, C.: ‘Infrastructure, Innovation and Development’, International Journal of Technology and Globalisation, 2(2-4), pp.268-278.
Rigby, J. and Georghiou, L. (2004). ‘Industry Science Relationships in the United Kingdom'. OECD.
Romain, A. and van Pottelsberghe, B. (2004). ‘The Economic Impact of Venture Capital’. Deutsch Bundes Bank.
Rothwell, R. and Wissema, H. (1986). ‘Technology, culture, and public policy’. Technovation, 4(2), pp. 91-115.
Rothwell, R. and Zegveld, W. (1981). ‘Government regulations and innovation – Industrial Innovation and Public Policy’. London
Rothwell, R. and Zegveld, W. (eds.), ‘Industrial Innovation and Public Policy’, London, pp. 116-147.
Grabher, G. (1993). ‘The Weakness of Strong Ties: The Locking of Regional Development in the Ruhr Area’, in G. Grabher (ed.) ‘The Embedded Firm: On the Socioeconomics of Interfirm Relations’, London and New York: Routledge, pp. 255-278.
Sako, M. (1994). ‘Supplier Relationships and Innovation’, in Dodgson, M. and Rothwell, R. (1991), ‘External Linkages and Innovation in Small and Medium-sized Enterprises’ R&D Management, 21, pp. 125-137.
Salter, A.J. and Martin, B. R., (2001). ‘The economic benefits of publicly funded basic research: a critical review’. Research Policy, 30, pp. 509 – 24.
Saxenian, A. (1994). ‘Regional Advantage: Culture and Competition in Silicon Valley and Route 128’. Cambridge Mass.: Harvard University Press.
Scherer, F. M. (1998). ‘The Size Distribution of Profits from Innovation’. Annales d'Economie et de Statistique, 49/50, pp. 495-516.
Scherer, F.M (2006). ‘A New Retrospective on Mergers’. Review of Industrial Organization, 28(4), pp. 327-341.
Scherer, F.M. (1984). ‘Innovation and Growth: Schumpeterian Perspectives’. Cambridge: MIT Press.
78

Opportunities and Barriers to Business Innovation in Rural Areas: Theory and Evidence
Scherer, F.M. (1992). ‘Schumpeter and Plausible Capitalism’. Journal of Economic Literature, 30(3), pp. 1415-34.
Schmidt, T. (2005). ‘What Determines Absorptive Capacity’. Paper presented at the DRUID Tenth Anniversary Summer Conference on ’Dynamics of Industry and Innovation: Organisations, Networks and Systems’.
Schmitz, J. A. Jr., (2005). ‘What Determines Productivity? Lessons from the Dramatic Recovery of the U.S. and Canadian Iron Ore Industries Following Their Early 1980s Crisis’. Journal of Political Economy, 113(3), pp. 582-625.
Schmookler, J. (1962). ‘Economic Sources of inventive activity’, in: Journal of Economic History, 22, pp. 1-20.
Schmookler, J. (1966). ‘Invention and Economic Growth’. Cambridge.
Schumpeter, J. (1942). ‘Capitalism, Socialism, and Democracy’. New York: Harper and Row (reprinted 1960).
Scott, A., Steyn, G., Geuna, A., Brusoni, S. and Steinmueller E. (2001). ‘The Economic Returns to Basic Research and the Benefits of University-Industry Relationships: a literature review and update of findings’. Report for the Office of Science and Technology by SPRU Science and Technology Policy Research.
Shane, S. A., Venkataraman, S. and MacMillan, I. (1995). ‘Cultural differences in innovation championing strategies’. Journal of Management, 21(5), pp. 931-952.
Shane, S.A. (1993). ‘Cultural influences on national rates on innovation’. Journal of Business Venturing, 8, pp. 59-73.
Shaw, B., (1994). ‘User/Supplier Links and Innovation’, in: Dodgson, M. and Rothwell, R. (eds.), op. cit.
Shaw, G. and Williams, A. M. (2003). ‘From lifestyle consumption to lifestyle production: changing patterns of tourism entrepreneurship’, in Thomas, R. (ed.) ‘Small Firms in Tourism: International Perspectives’, Oxford: Elsevier, pp. 99-113.
Shrader, R., & Siegal D. S. (2007). ‚Assessing the relationship between human capital and firm performance: Evidence from technology-based new ventures’. Entrepreneurship Theory and Practice, pp. 893-908.
Sianesi, B. (2003). ‘Returns to Education’. Institute of Fiscal Studies.
Siegel, D. S., Veugelers, R. and Wright, M. (2007a). 'Technology transfer offices and commercialization of university intellectual property: performance and policy implications'. Oxford Review of Economics Policy, 23(4), pp. 640-660.
Siegel, D. S., Lockett, A. and Wright, M. (2007b). 'The rise of entrepreneurial activity at universities: organizational and societal implications'. Industrial and Corporate Change, 16(4), pp. 489-504.
South East England Intelligence Network (2008). ‘The Rural South East: An evidence base’. Guildford: South East England Intelligence Network
SQW Consulting (2008a). ‘State of the Rural North West 2008’. Cheshire; North West Development Agency
SQW Consulting (2008b). ‘Rural Community Sustainability; Thematic Chapters, Chapter 7 Critical Rural Services’. Birmingham; Advantage West Midlands and West Midlands Regional Assembly.
SQW Consulting and Cambridge Econometrics (2006). ‘Economic Performance of Rural Areas inside and outside City-Regions’. London: Defra.
79

Opportunities and Barriers to Business Innovation in Rural Areas: Theory and Evidence
Stiglitz, J.E. (1987). ‘Learning to Learn, Localized Learning and Technological Progress’, in: Dasgupta, P. and Stoneman, P., (eds.), ‘Economic Policy and Technological Change’, Cambridge University Press.
Storper, M. and Venables, A.J. (2004). ‘Buzz: face-to-face contact and the urban economy’. Journal of Economic Geography, Oxford University Press, 4(4), pp. 351-370.
Stuck, B. and Weingarten, M. (2005). ‘How Venture Capital Thwarts Innovation’. IEEE Spectrum, April, pp. 50-55.
Swann, P. (2002). ‘Innovative Businesses and the Science and Technology Base’. Report to DTI, October.
Tang, M.-C., and Chyi, Y.-L. (2008). ‘Legal Environments, Venture Capital, and Total Factor Productivity’. Contemporary Economic Policy, 26, pp. 468-481.
‘Technology, Progress and Economic Growth’, Cheltenham, Massachusetts: Edward Elgar Publishing, pp. 162-203.
Technopolis (2008). ‘Fourth annual survey of knowledge transfer activities in public sector research establishments’. For DIUS.
Technopolis (2008). ‘Socio-cultural determinants of innovation’. Europe Innova Working Paper No. 10.
Tellis, G.J., Stremersch, S., Yin, E. (2003). ‘The International Takeoff of New Products’. Marketing Science, 22, pp. 188–208.
Tether, B. (2004). ‘Do Services Innovate Differently?’. University of Manchester, Centre for Innovation and Competition, Discussion Paper 66. Manchester: University of Manchester.
The Countryside Agency (2004). ‘Stepping Stones to Healthier Futures - The rural economies of the East of England – summary’. Cambridge; The Countryside Agency.
The Economist (2004). ‘Slackers or Pace-setters? Monopolies May have More Incentive to Innovate than Economists have Thought’. The Economist, Print Edition, May 20.
Tijssen, R.J.W. (2006). ‘Universities and industrially relevant science: Towards measurement models and indicators of entrepreneurial orientation’. Research Policy 35(2006), pp. 1569–1585.
Trott, P. (2003). ‘Innovation and Market Research’, in: Shavinina, L. (ed.), ‘International Handbook on Innovation’, Oxford; pp. 835-844.
Ueda, M. and Hirukawa, M. (2008). ‘Venture capital and Industrial “Innovation”’. CEPR Discussion Paper No. 7089.
Ueda, M. (2001). ‘Does Innovation Spur Venture Capital?’. Barcelona: Universitat Pompeu Fabra.
Uhlaner, L. and Thurik, R. (2007). ‘Postmaterialism influencing total entrepreneurial activity across nations’, in: Journal of Evolutionary Economics, 17(1), pp. 161-185.
UK Department of Trade and Industry (2006). ‘Innovation in the UK: Indicators and Insights’. DTI Occasional Paper No. 6.
Ulijn, J. and Weggeman, M. (2001). ‘Towards an innovation culture: what are its national, corporate, marketing, and engineering aspects, some experimental evidence’, in: Cooper, C, Cartwright, S. and Early, C. (eds.), ‘Handbook of Organisational Culture and Climate’, London: Wiley, pp. 487-517.
Universities of Gloucester and Plymouth (2004). ‘Determinants of Relative Economic Performance of Rural Areas’. Report for Defra, by the Rural and Tourism Research Group and the Countryside and Community Research Group at the University of Plymouth.
Uyarra, E. (2009). ‘Conceptualising the regional roles of universities, implications and contradictions’. Forthcoming in European Planning Studies.
80

Opportunities and Barriers to Business Innovation in Rural Areas: Theory and Evidence
Van Den Bosch, F.A.J., Van Wijk, R. and Volberda, H.W. (2003). ‘Absorptive capacity: Antecedents, models, and outcomes’, in: Easterby-Smith, M. and Lyles M.A. (eds.), ‘Handbook of Organizational Learning and Knowledge Management’, Blackwell, Oxford, pp. 278–301.
Van Looy, B., Callaert, J., Debackere, K. and Verbeek, A. (2003). ‘Patent related indicators for assessing knowledge-generation institutions: towards a contextualised approach’. The Journal of Technology Transfer, 28, pp. 53–61.
Van Looy, B., Ranga, M., Callaert, J., Debackere, K. and Zimmermann, E. (2004). ‘Combining entrepreneurial and scientific performance in academia: towards a compounded and reciprocal Matthew-effect’. Research Policy, 33, pp. 425–441.
Veryzer, R. W. (2003). ‘Marketing and the Development of Innovative New Products’, in: Shavinina, L. (ed.), ‘International Handbook on Innovation’, Oxford; pp. 845-855.
Vinding, A.L., (2004). ‘Human resources: absorptive capacity and innovative performance’, in: Christensen, J.L. and Lundvall, B.-Å., (eds.), ‘Product Innovation, Interactive Learning and Economic Performance’, Elsevier, Oxford.
Von Hippel, E. (1986). ‘Lead Users: A source of novel product concepts’, Management Science, 32 (7), pp. 791-805.
Von Hippel, E. (1988). ‘The sources of innovation’, Oxford : Oxford University Press.
Von Hippel, E. (2005). ‘Democratizing innovation’. Cambridge, MA: MIT Press.
Von Rosenstiel, L. and Koch, S. (2001). ‘Changes in Socioeconomic Values as a Trigger of Organisational Learning’, in: Dierkes, M. (ed.) ‘Handbook of organisational learning and knowledge’, New York: Oxford University Press.
Ward, N., Atterton, J., Kim, T., Lowe, P., Phillipson, J. and Thompson, N. (2005). ‘Universities, the Knowledge Economy and Neo-endogenous Rural Development.’ Centre for Rural Economy Discussion Paper No. 1.
Ward, N. (2006). ‘Rural Development and the Economies of Rural Areas’, in J. Midgley (ed.) ‘A New Rural Agenda’. London: IPPR.
Wennekers, S., Thurik, R., von Stel, A. and Noorderhaven, N. (2007). ‘Uncertainty avoidance and the rate of business ownership across 21 OECD countries, 1976-2004’. Journal of Evolutionary Economics, 17(1), pp. 133-160.
Wiener, M. J. (1985). ‘English culture and the decline of the industrial spirit, 1850-1980’. Harmondsworth: Penguin.
Williams, A. M. (2007). ‘Listen to me, learn with me: International migration and knowledge’. British Journal of Industrial Relations, 45(2), pp. 361-382.
Williams, L. And McGuire, S. (undated). ‘Effects of National Culture on Economic Creativity and Innovation Implementation’. Unpublished paper. (www.isnie.org/ISNIE05/Papers05/Williams_McGuire.PDF).
Williamson, O.E. (1967), ‘Hierarchical Control and the Optimum Firm Size’, Journal of Political Economy, 75 (2), pp.123-138.
Williamson, O. E. 1988. ‘Corporate Finance and Corporate Governance’, Journal of Finance, 43, pp. 567-91.
Wright, M., Clarysse, B., Lockett, A. and Binks, M. (2006). ‘University spin-out companies and venture capital’. Research Policy, 35 (4), pp. 481-501.
Youtie, J. and Shapira, P. (2008). ‘Building an Innovation Hub: A Case Study of the Transformation of University Roles in Regional Technological and Economic Development’. Research Policy, 37, pp. 1188-1204.
81

Opportunities and Barriers to Business Innovation in Rural Areas: Theory and Evidence
Zahra, S., and George G. (2002). ‘Absorptive Capacity: A Review and Reconceptualisation and Extension’. Academy of Management Review, 27(2), pp. 185–203.
Zantout, Z. Z. (1997). ‘A Test of the Debt Monitoring Hypothesis: The Case of Corporate R&D Expenditures’. Financial Review, 32(1), pp. 21-48.
Zucker, L. G., Darby, M.R. and Brewer, M.B. (1998). ‘Intellectual Human Capital and the Birth of US Biotechnology Enterprises’. American Economic Review, 88, pp. 290-306.
82

Opportunities and Barriers to Business Innovation in Rural Areas: Theory and Evidence
ANNEX 2 CLASSIFICATIONS AND DEFINITIONSThe urban-rural classification of local authority areas used in this report is based on that published by Defra. It consists of a six-fold classification as follows:
Major Urban: districts with either 100,000 people or 50 per cent of their population in an urban area with a population of more than 750,000.
Large Urban: districts with either 50,000 people or 50 per cent of their population in one of 17 urban areas with a population between 250,000 and 750,000.
Other Urban: districts with fewer than 37,000 people or less than 26 per cent of their population in rural settlements and larger market towns.
Significant Rural: districts with more than 37,000 people and more than 26 per cent of their population in rural settlements and larger market towns.
Rural-50: districts with at least 50 per cent but less than 80 per cent of their population in rural settlements and larger market towns.
Rural-80: districts with at least 80 per cent of their population in rural settlements and larger market towns.
The breakdown of population within the defined bands is shown by Table A.1. Overall, 35% of the population resides in major urban areas. This includes the whole of the London region, parts of the South East and Eastern England in relatively close proximity to London and the metropolitan areas of the North East, North West, West Midlands, and Yorkshire and Humberside. The large urban areas band consists of relatively large cities such as Sheffield, Leicester, Brighton, and other localities within the main metropolitan areas. Other urban areas largely consist of smaller provincial towns and cities such as Ipswich, Swindon, Peterborough and Oxford. Localities with significant rural tracts also include smaller towns and cities, but which are located at a relative distance from the main conurbations and near the coast, such as Great Yarmouth, Lancaster, and Scarborough. The rural-50 and rural-80 bands cover the remainder of the nation, and include parts of all English regions with the exception of London.
Table A.1: Population Breakdown in England by Local Authority Level Urban-Rural Classification (%)
Locality % of Total Population of England
Major Urban 35.0
Large Urban 14.7
Other Urban 13.7
Significant Rural 13.1
Rural-50 11.7
Rural-80 11.8
Source: Based on Defra’s Local Authority Classification
Grouping the six bands into two, i.e. broadly ‘urban’ or ‘rural’, it is estimated that 64% of the national population resides in urban areas, and 36% in rural areas (Table A.2). London is clearly the most urbanised, followed by the North West. The most ruralised regions are the South West and Eastern England. In general, it is clear that there is significant variation in the urban-rural split across regions.
83

Opportunities and Barriers to Business Innovation in Rural Areas: Theory and Evidence
Table A.2: Regional Population Breakdown by Broad Local Authority Level Urban-Rural Classification (%) Urban Localities Rural Localities Total
East Midlands 44.7 55.3 100.0
Eastern 40.3 59.7 100.0
London 100.0 - 100.0
North East 44.6 55.4 100.0
North West 80.5 19.5 100.0
South East 52.0 48.0 100.0
South West 38.8 61.2 100.0
West Midlands 65.1 34.9 100.0
Yorkshire and Humberside 65.1 34.9 100.0
England 63.3 36.7 100.0
Source: Based on Defra’s Local Authority Classification
Classification of NUTS 2 Regions
As some of the metrics utilised in this report were only available at a NUTS 2 regional level, it was necessary to classify these regions according their level of rurality. In order to achieve this, we first matched LADs against NUTS 2 geographies as best as possible; we then estimated the proportion of population living in rural areas at a NUTS 2 level by summing up the rural-urban population sizes of the constituent LADs (this has been done using Defra’s April 2009 dataset). Finally, the regions were classified into six categories according to the share of their population residing in rural areas.
Table A.3 lists the NUTS 2 regions in England and their classification.
Table A.3: Typology for Classifying NUTS 2 Regions
NUTS 2 Name NUTS 2 Code ClassificationBedfordshire and Hertfordshire UKH2 Other UrbanBerkshire, Buckinghamshire and Oxfordshire UKJ1 Significant RuralCheshire UKD2 Significant RuralCornwall and Isles of Scilly UKK3 Rural 80Cumbria UKD1 Rural 50Derbyshire and Nottinghamshire UKF1 Significant RuralDevon UKK4 Rural 50Dorset and Somerset UKK2 Rural 50East Anglia UKH1 Rural 50East Riding and North Lincolnshire UKE1 Significant RuralEssex UKH3 Significant RuralGloucestershire, Wiltshire and North Somerset UKK1 Significant RuralGreater Manchester UKD3 Major UrbanHampshire and Isle of Wight UKJ3 Significant RuralHerefordshire, Worcestershire and Warwickshire UKG1 Significant RuralInner London UKI1 Major UrbanKent UKJ4 Significant RuralLancashire UKD4 Other UrbanLeicestershire, Rutland and Northamptonshire UKF2 Significant RuralLincolnshire UKF3 Rural 50Merseyside UKD5 Major Urban
84

Opportunities and Barriers to Business Innovation in Rural Areas: Theory and Evidence
NUTS 2 Name NUTS 2 Code ClassificationNorth Yorkshire UKE2 Rural 50Northumberland and Tyne and Wear UKC2 Major UrbanOuter London UKI2 Major UrbanShropshire and Staffordshire UKG2 Significant RuralSouth Yorkshire UKE3 Large UrbanSurrey, East and West Sussex UKJ2 Significant RuralTees Valley and Durham UKC1 Significant RuralWest Midlands UKG3 Major UrbanWest Yorkshire UKE4 Major Urban
UK Competitiveness Index Methodology
The methodology underlying part of the analysis presented in this report consists of the development of the UK Competitiveness Index data. The key concern with the design process of the UK Competitiveness Index is to develop a series of indices incorporating data that are available and comparable at the local and regional level, and that go some way towards reflecting the link between macro-economic performance and innovative business behaviour. Consideration also has to be given to the overall ‘value’ of indicators, and their relative effectiveness as performance measures. In particular, the interrelationships between the ‘measure-chain’ of inputs, outputs and outcomes, and the underlying ability of the index to be updated as frequently as possible, are of major significance.
Given the methodological parameters, a number of different modes of creating the index, and the variables to be included, have been considered. After testing, a 3-Factor model for measuring competitiveness was adopted. The 3-Factor model consists of a linear framework for analysing competitiveness based on: (1) input; (2) output; and (3) outcome factors. In order to achieve a valid balance between each of the indicators, in terms of their overall significance to the composite index, each of the three measures - Measure 1: Inputs; Measure 2: Outputs; and Measure 3: Outcomes - are given an equal weighting, since it is hypothesised that each will be interrelated and economically bound by the other. In this paper we draw on the results of the 2008 local UK Competitiveness Index, covering local authority areas and districts. The variables included in this index consist of:
Inputs – economic activity rates; business start-up rates per 1,000 inhabitants; number of businesses per 1,000 inhabitants; proportion of working age population with NVQ Level 4 or higher qualification; and proportion of businesses operating in knowledge-based sectors.
Outputs – Gross Value Added per head at current basic prices; labour productivity (output per hour worked); and employment rates.
Outcomes – Gross weekly pay, and unemployment rates.
For each measure an index was calculated with a UK average base of 100, and the distribution range for each measure calculated (in the case of unemployment rates these values are inverted). As expected, it is found that some of the ranges have both a skewed and a long distribution range, the result being that these variables have an overly strong influence on the composite index. Therefore, each datum is transformed into its logarithmic form to produce distributions that are closer to the ‘normal’ curve, and that dampen out extreme values so that no single variable distorts the final composite score. It is the case that the untransformed values are no more real or ‘natural’ than the transformed ones. However, in order to reflect as far as possible the scale of difference in area competitiveness, the composite scores were finally ‘anti-logged’ through exponential transformation. This is achieved by calculating the exponential difference between the mean logged and un-logged index of the fifty localities nearest the overall UK mean of 100. This resulted in a mean exponential difference slightly less than the cubed-mean of the logged index. Therefore, the exponential cube
85

Opportunities and Barriers to Business Innovation in Rural Areas: Theory and Evidence
transformation approach is adopted. Given the above criteria and methodology, a composite Competitiveness Index was calculated for regions and localities of the UK.
Creative Class Methodology
The methodology underlying part of the analysis presented in this report consists of the development of location quotients for the density of the Creative Class across England. The dataset for the Creative Class Location Quotients was constructed using data from Census of Population, supplemented by the Labour Force Survey and the Annual Business Inquiry, allowing for the development of a range of location quotients. We subdivide the Creative Class into the Creative Core (scientists and engineers, architects and designers, academics and teaching professionals), and the Creative Professionals (associated professional and technical occupations of the Creative Core, managers, financial and legal professionals).
Data for this index (and the others using occupational data) were derived from the Census of Population, the only source with sufficient same size to allow 4 digit SOC breakdowns at the levels of regional disaggregation required. The Bohemian index is defined using employment in artistic and creative occupations. It is a locational quotient that compares the region’s share of the nation’s ‘bohemians’ to the region’s share of the nation’s population (local prominence of employment in artistic/creative occupations compared to national prominence of employment in the same occupations). Data for the UK is delineated using the Standard Occupational Classification 2000 (SOC2000) system; within this it is convenient to use sub-major group 34 (Culture, Media and Sports) to define the bohemian occupations.
86

Opportunities and Barriers to Business Innovation in Rural Areas: Theory and Evidence
ANNEX 3 CASE STUDIES
87

Opportunities and Barriers to Business Innovation in Rural Areas: Theory and Evidence
CASE STUDY 1: PHYSICAL AGGLOMERATION AND RURAL INNOVATION Introduction
New Economic Geography literature suggests that spatial concentration of economic activity can have a positive effect on a firm’s innovation performance. It is argued that physical proximity to other firms and organisations like universities induces positive agglomeration effects such as knowledge spillovers, co-ordinated input-output linkages, and specialised labour pooling. This case study seeks to understand whether physical agglomeration in rural areas is, or can be a stimulus for innovation. Does it compare with the benefits of agglomeration identified from science parks and leading commercial centres? How important are opportunities for physical agglomeration to foster innovation and drive economic growth in rural areas? Are there alternatives to physical agglomeration such as engagement in programmes or networks run by Higher Education Institutes? To answer these questions, the case study examines three types of physical agglomeration in rural areas: market towns, “business centre” clusters and HEI operated networks. The case study is based on interviews with HEIs in Lancashire; and a roundtable discussion with innovation and business centre operators and economic development practitioners and planners in Northamptonshire. It should therefore be noted that much of the information presented here is based on the personal views and experience of these interviewees.
The Role of Towns, Business Centres and HEI Networks
Market towns originally developed through the clustering of businesses around the driver of local commerce – the livestock market. Regular operation of the livestock market attracted farmers from the surrounding hinterland into the town. This aggregation of customers provided an incentive for businesses (of all kinds) which served this sector to locate close to the market, creating critical mass and economic vitality within the town.
Livestock markets still act as a catalyst for co-location and clustering in many of our larger rural towns – examples include Melton Mowbray, Bakewell and Chippenham. The economic influence of the farming sector has Significant reduced however, and with it, the power of many “market” towns to attract businesses and to drive clustering of locally significant sectors.
Informants at our roundtable discussion in Northamptonshire expressed the view that businesses were no longer drawn to towns to be part of a wider cluster of like minded or similar enterprises, but predominantly to gain access to labour, premises and ancillary facilities such as shops, cafés etc. The offer provided by business and enterprise centres is also mainly based on the provision of workspace, ancillary facilities such as meeting rooms and kitchens, access to reception and cleaning services and, in some circumstances, access to a vibrant and “funky” workplace culture which are felt to be important to attract and retain young skilled workers – which can be especially hard in a rural context.
According to interviewees, access to other like minded businesses and opportunities for ideas exchange was not felt to be a key driver of locational choice for businesses in rural towns or enterprise / business centres.
In contrast, the experience of Innovation Centre operators was that in addition to the requirement for connections with HEI and access to R&D facilities, many of their occupiers were directly motivated by the potential for knowledge exchange created by the opportunity to share common spaces with like minded businesses, those operating in the same sector and even competitors. This view was endorsed by the inward investment professionals in the room who confirmed that businesses in higher tech and specialist sectors ‘always want to know’ about the incidence of other businesses in their sector locally. This interest is driven by a desire to cluster in order to secure access to appropriately skilled labour, suppliers and professional service providers.
88

Opportunities and Barriers to Business Innovation in Rural Areas: Theory and Evidence
One would expect that this desire to cluster would make businesses more open to networking and to invest time and energy in knowledge exchange activities. However, the Innovation Centre operators reported that despite this pre-disposition it was still necessary to “oil the wheels” to develop connections and collaborations that will lead to innovation outcomes. Simply to put people alongside one another in a building or on campus is not sufficient to generate exchange of ideas, some sort of pro-active enabling or facilitation is also necessary.
The value of targeted enabling is demonstrated by the outcomes achieved by the involvement of HEIs in positive interventions to promote and enable knowledge exchange leading to innovation. We have used an analysis of the knowledge exchange activity of Lancaster University to provide an insight into the way that HEIs engage with businesses, their motivation and their reach.
Lancaster University is an active participant in knowledge exchange initiatives. Over the last five years it has a run a series of programmes using European Regional Development Fund (ERDF) money and has engaged more than 2,200 businesses. These programmes have been targeted at businesses of all type, size and location. Individual programmes have focused on certain sectors (for example tourism, manufacturing, creative and digital) yet taken as a whole the Universities programmes have included business from all sectors of the regional economy.
The impact of their work has been evaluated at the macro level in a report entitled “Innovation, Knowledge Exchange & Higher Education: An Impact Evaluation Study”34 and for specific programmes – LEAD: Leading Enterprise and Development Evidence of Innovation, June 2007. The evaluation report found significant impacts amongst businesses that engaged in innovation and knowledge exchange activity with the University:
Average growth in employee numbers from 12.6 to 14 FTEs (Full Time Equivalent).
An Average employment growth of 25% in micro enterprises.
Aggregate annual employment growth for assisted enterprises of 9% (versus a background Northwest rate estimated in the range: -2.2% to 0.2%.
75% of assisted enterprises reported that they had developed a more strategic approach or vision, with 85% of those attributing it to Lancaster’s intervention
Participants in the LEAD programme consistently demonstrated an increase in internally focused innovation (in terms of management structures, leadership processes & systems) and externally focused innovation through new ideas, products and services and practices.
These evaluation findings clearly demonstrate the potential benefits of bringing businesses together specifically to engage in “ideas exchange”.
Opportunities and Barriers to Business Innovation in this Context
Towns, Business / Innovation Centres and HEI networks represent different elements of agglomeration, ranging from the passive (co-location without facilitation), intermediate (co-location with networking) to the active (coming together specifically to engage in knowledge exchange with access to expertise & facilitation). The impact of rurality on these models differs and is unlikely to be consistent across each region or geography.
Obviously rural towns do not generate the scale of agglomeration offered by larger urban centres. As a result, they do not tend to have access to the best and most modern facilities; to date the market has focused its investment on larger centres – for example, the business centre operator Regus has 84 business centres across the UK, virtually all of which are located in large urban centres (or strategically located in places such as Heathrow). There is very limited penetration into rural areas, especially in the North.35 Analysis of risk related to the market driven roll out of NGA broadband shows the limited reach of commercial services into rural areas36. It is arguable, however, that should or could this gap in the quality of space and connectivity be bridged. According to the interviewees,
34 Available at: http://www.lums.lancs.ac.uk/files/14588.pdf 35 A full list of Regus centres is available here: http://www.regus.co.uk/locations/GB/default.html
89

Opportunities and Barriers to Business Innovation in Rural Areas: Theory and Evidence
many rural towns are better equipped to meet the requirements of knowledge based innovative sectors than all but the best urban city centres - they offer a high quality built and natural environment; are relatively easy to get in and out of (especially those with rail services and / or extensive areas of parking); and have distinctive town centres supported by a range of small independent shops, cafes, bars and restaurants. What they lack is a ‘facilitator’ – it appears that simply providing the conditions to encourage co-location is not sufficient to stimulate and bring about knowledge exchange leading to innovation.
Business / Innovation Centres on the other hand, are more suited, and able to provide pro-active networking support. They can also link businesses to reliable suppliers and enable collaboration. Their success is reliant upon a combination of location, accessibility, the quality of their space (and ancillary facilities) and the atmosphere that they create. It is often easier for operators to provide a winning combination of these factors in campus or out of town location, separating them from many smaller towns. The availability of high quality Business and Innovation Centres is determined by the market and is therefore site specific. As such rurality should be no barrier to access – nor will it be any guarantor – good centres will only be found where the market has provided them.
Lancaster University primarily delivers its interventions on campus. It attracts businesses to take part via business support agencies, local recommendations and marketing campaigns. Source of funding can very often influence a focus on a particular sector (e.g. ICT, manufacturing, environmental technology etc) or geographical location (some ERDF money was targeted at specific wards or linked to area based initiatives).
Knowledge Exchange practitioners from the Lancaster University Management School and University of Central Lancashire expressed the view that there was no real difference in the ability of rural and urban firms to engage with HEI innovation networks. Their experience was of firms travelling from throughout the region to engage in networking and knowledge exchange activity on campus. More intensive innovation support tends to be delivered via the University’s managed workspace facilities, such as InfoLab. In this instance, the origin of the supported business was considered to be irrelevant.
It was the view of the practitioners that a firm’s ability to engage with knowledge exchange and to apply intelligence gained to innovation was ‘as much to do with culture and attitude as it was with geography’. It is tempting to think that firms in rural locations would be less likely to learn about the opportunity to engage via ERDF funded programmes due to a more limited connection with business support activity. In practice this does not appear to have been the case.
Analysis of the location of 2,000 businesses37 that have engaged with Lancaster’s programmes shows that the involvement of rural businesses has generally been commensurate with the proportion of rural businesses in the region.
Innovation Programme (ERDF Funded) Rural Urban
Cross Sector Enterprise & Innovation Support 33% 67%
Cross Sector ICT Support Digital Industries 32% 68%
Creative Industries Sector Support 0% 100%
Cross Sector Marketing Support 4% 96%
Manufacturing Sector Support 35% 65%
Tourism Sector Support 44% 56%
36 An assessment and practical guidance on next generation access (NGA) risk in the UK, HM Government, March 2010; Making NGA a reality in the North West, March 2010.37 Postcode analysed by ONS eight point rural-urban classification
90

Opportunities and Barriers to Business Innovation in Rural Areas: Theory and Evidence
Innovation Programme (ERDF Funded) Rural Urban
Student Placement 26% 74%
All ERDF funded interventions 31% 69%
Regional Distribution of Business Stock – Micro Businesses* 29% 71%
Regional Distribution of Business Stock – SMEs* 28% 72%
Source: Analysis of ERDF supported businesses by postcodes, LMUS & Rural Innovation, May 2010. *State of the Rural North West, SQW Ltd, December 2008
The practitioners did agree that size was likely to be a factor and may be a barrier to engagement in knowledge exchange. For example, experience from several cohorts of the LEAD programme suggested that firms which were able to apply learning to an organisational structure tended to get more measurable benefit than micro-businesses. It is interesting to note however, that micro-businesses surveyed for the evaluation attributed higher levels of increased turnover to Lancaster’s intervention that did SMEs. It is plausible that the culture and attitude of the individual business matters as much as its size.
Role of Physical Agglomeration in addressing Opportunities and Barriers to Innovation
Rurality appears to have been no barrier to businesses engagement with Lancaster University’s ERDF funded innovation programmes over the past few years. Unfortunately it has not been possible to analyse the data held by the University to ascertain whether the value and volume of the impact of the interventions has been similar across businesses based in rural and urban areas – the data is not held in a way that enables such analysis.
It might be possible to establish this using surveys of businesses involved – the total database of firms supported by ERDF programmes extends to 2064 records – but this has not been possible as part of this research.
In our view rural towns have a strong role to play in hosting and enabling groups of businesses to co-locate, and to benefit from that co-location. This is not likely to happen without the right environment and conditions however. Without a business imperative to cluster, firms will need to be attracted by a town’s offer of facilities, environment and culture. This will need to fit the way they want to do business and the image that they want to promote to the labour market and to their customers. In 21st Century local economies, this will need to include fast broadband connectivity; access to “third places” (cafés, restaurants, green spaces); a high quality environment; and easy in / easy out access (to place and premises) as a minimum.
Individual towns need to understand what sort of businesses are, and could, operate within their catchment and determine what type of businesses they are best equipped to attract.
Regardless of the facilities and culture that towns are able to offer – knowledge exchange will happen more often and is likely to deliver more valuable results if it is enabled and facilitated by a third party. This is part of core business in dedicated Innovation and Enterprise Centres. It is not so easily provided in a small town context – especially as public finance becomes hard to come by. In any event it is probable that this facilitation / network leader / matchmaker role is best played by someone in the private or non-profit sector than by the local council.
If small towns are to attract clusters of businesses, and enable innovation, they need to develop an approach which is complementary to, and makes the best use of, existing Business / Innovation Centres. Where these do not exist, they might think about how one could be incorporated within the town’s offer.
Small towns and Business / Innovation Centres should be not competitors. The ideal location for an Enterprise Centre is to be accessible to a vibrant and distinctive local centre. There are an increasing
91
Opportunities and Barriers to Business Innovation in Rural Areas: Theory and Evidence
number of successful privately owned and operated Business Centres within rural towns; the Old Church School in Frome, one of three centres operated by a business called Forward Space, is a leading example.
Sector specific and high tech R&D driven Innovation Centres are slightly different ‘beasts’ however, with their stronger access to, and links with, HEIs and / or R&D facilities. These are often campus based and work best where they are able to provide the range of additional facilities (food, green space, shops, easy in easy out accessibility) within their own boundaries. Many of these campuses are in rural locations – such as Daresbury Science and Innovation Park – and so are equally accessible to rural as well as urban businesses.
The proximity of successful Innovation Centres can be both an opportunity and a challenge for neighbouring towns. There is a risk that the provision of services and facilities on site will prevent any connection developing between town and site. This can be damaging for the vitality of the town centre, but also prevent an over-spill of ideas and innovative culture into the wider local enterprise base.
Main Findings and Conclusions of the Case Study
The key findings from this case study are summarised below:
Innovation is Significant enhanced through third party facilitation of knowledge exchange;
Co-location without interaction is not sufficient to create innovation;
Rural towns are well suited to create the ‘right condition’s to foster and enable innovation;
Innovation is best enabled by a combination of place, facilities, culture and facilitation; and,
Policy needs to create the right conditions for investment in place. facilities and activity to maximise innovation outcomes.
These findings seem to suggest that successful agglomeration involves a sufficient critical mass of firms with an interest in sharing and exploiting knowledge. The different agglomeration models explored are likely to attract different concentrations of innovative/knowledge intensive businesses. Without some degree of focus in attracting certain types of firms, market towns may be insufficient in size to support enough like-minded businesses to generate the desired agglomeration effects – this agglomeration driven innovation is less likely to occur naturally than in larger cities. As stated, firms attracted to market towns may be motivated by more general facilities available. But where there is a more specific focus on collaboration/knowledge sharing/innovation – through enterprise centres and more so through innovation centres – this can attract greater concentrations of knowledge intensive businesses and therefore promote innovation.
It is therefore possible to conclude that the degree to which agglomeration works depends on scale effects as well as the degree of concentration of like minded firms. Market towns can be a focus for innovation activity but may be too small to attract a sufficient concentration of suitable firms – hence the need for facilitation and specific initiatives with an innovation focus.
92

Opportunities and Barriers to Business Innovation in Rural Areas: Theory and Evidence
CASE STUDY 2: THE ROLE OF VIRTUAL NETWORKSIntroduction
Virtual networks are those which use internet and web based applications as their primary route to engagement and participation. This case study looks at the development and use of virtual networks by and for rural businesses. It reviews a number of formal and informal virtual networks and looks at the reason for their creation, the way they have developed, and the way they are used. It examines the use of networks by rural businesses and the value that they receive from them. It goes on to consider the opportunities that networks offer as drivers of innovation and some of the barriers to their development and wider participation. This case study is based on interviews with operators and users of the networks supported by wider reading on their role and value.
Theoretical Perspectives
The value of “open innovation” and the power of networks is an emerging theme among academics working on rural economic development in the United States. In his keynote address to the 2010 Northeast Rural Summit Brian Dabson (Rural Policy Research Institute) highlights the need for entrepreneurship to drive innovation, and the requirement for a collaborative systems approach to entrepreneurship development of “connecting the dots” among resource providers, within the public private and non-profit sectors, between communities and schools, and between practitioners, researchers and policy makers.
Ed Morrison focuses on networks as the key element of what he calls our “Grandchildren’s” economy, an economy based on collaboration and “horizontal” peer to peer networks rather than hierarchies. Mark Drabenstott highlights the need to develop regional innovation networks as a critical part of moving the economy of Midwest America beyond manufacturing and intensive agriculture.
In the UK, developing and facilitating networks has long been understood as an important route to innovation through knowledge exchange. We consider some of the sector networks in other case studies. More recently, we can see a shift towards the sort of “horizontal” network that Morrison refers to; networks of peers where members support each other and freely share intelligence and information. Many of those which have developed most recently are “virtual” networks where interaction takes place predominantly online. These networks appear to be particularly valuable to small businesses and those based in deep rural locations where access to more formal networks is constrained by distance.
Virtual Networks Reviewed as part of this Case Study
In the course of this case study we have reviewed the activity of a series of formal and informal networks. All of these have a strong ‘online’ element, some use this to maintain connectivity between – and sometimes to drive – physical networks; whilst others are more reliant upon and comfortable with, a “virtual” platform.
Formal networks which we have reviewed include:
Digital Peninsula Network was started by a small group of creative businesses and freelancers working around Penzance who got together to share experiences and to collaborate. Its focus then shifted to securing access to broadband and subsequently into a training, business support and consultancy organisation.
Network Cornwall is a “virtual” self managed network for women involved in business and homeworking.
Women in Rural Enterprise (WiRE) supports women in rural business by offering members a package of practical business services including: WiRE Local Network Groups which offer the chance to network and do business with like-minded women, a glossy magazine, monthly e-newsletters and countless marketing opportunities.
93

Opportunities and Barriers to Business Innovation in Rural Areas: Theory and Evidence
Enterprise Nation is a web portal and online community for home-based workers. It seeks to enable people to start and grow and business from home.
The Live Work Network is a membership organisation for everyone with an interest in providing high quality dual use 'live/work' property. It operates as an information service, bringing members together to share intelligence. It is also a research and consultancy business.
Informal networks that we have examined include sector specific activity on www.twitter.com such as #agchat, #commschat and #watercoolermoment and the fast growing co-working movement, Jelly.
Some of these networks were set up specifically to address issues associated with rurality:
WiRE was created in 1996 from a research study into falling farm incomes and the need for diversification. Creation of the network was a response to the needs of rural businesses (developed and run by women). The success and growth of the network demonstrates that this form of collaborative activity and mutual support is in great demand in rural areas.
Digital Peninsula Network came about as a result of like minded businesses operating in a deeply rural market place seeking each other out to combat isolation and share their experiences in the late 1990s. Its success and longevity demonstrates a continued interest in networking and collaboration amongst businesses in rural areas. Network Cornwall was established more recently as a means for professional and business women to connect with and mutually support each other. Development as a virtual network was intentional as it was felt this was the most effective way to combat distance and geography – a particular challenge in the South West peninsula. The rapid growth experienced by the network – from 250 to 4,200 members in three years – demonstrates the interest in collaboration amongst this cohort and gives some indication that virtual networks are particularly useful to businesses operating in rural areas.
Opportunities and Barriers to Business Innovation in this Context
Two of the four formal networks which we have reviewed (Digital Peninsula Network and WiRE) were set up with public money specifically to address issues associated with operating small businesses in rural areas such as isolation, disconnection with mainstream business support services and poor internet access. They have both been extremely successful and have evolved into autonomous organisations serving an extensive cohort of rural businesses. In the case of Digital Peninsula Network this has taken them down the path of training provider, whilst WiRE is still very much a membership organisation providing technical support, advice, selling and networking opportunities to its members operating much like other business orientated membership organisations such as the Federation of Small Businesses.
Enterprise Nation and Live Work Network were both set up as commercial enterprises by entrepreneurs who saw a demand for technical support, advice and in more recent times, companionship, amongst a particular type of business. Live Work Network has since developed into a more consultancy focused business – its content and intelligence is maintained as a marketing tool as much as a service to members.
Enterprise Nation has developed as a multi channel content provider and a virtual community for home-based business as well as a vehicle to champion and promote home-working more generally.
The informal networks are far more organic. They are not formally managed in any real sense. Rather they are a vehicle used by people to find and share intelligence. They can be hugely powerful and fast growing:
#agchat is an online moderated conversation held weekly on www.twitter.com. It has several thousand followers and attracts participants from across the world each week.
#commschat is a new version of the practice which is aimed at communications professionals. It was started two weeks ago and the second session attracted 80 participants and over 400 communications during the 60 minute session.
94

Opportunities and Barriers to Business Innovation in Rural Areas: Theory and Evidence
#watercoolermoment runs every day at 11.00am enabling home workers to engage in the sort of chats which take place in every office.
Currently, there is no evidence to show if those networks set up with a particular sectoral focus (such as Live Work and Enterprise Nation) appeal more to rural businesses than to businesses based in urban areas. It has not been possible to interrogate their membership records to establish this. Indeed the more informal the network, the less possible it is to access this sort of evidence as membership details are often limited to e-mail addresses.
Role of Virtual Networks in addressing Opportunities and Barriers to Innovation
The common theme in these networks is one of mutual support and shared intelligence. People are using them for a variety of reasons, but the most common seem to be:
For contact – to mitigate the social isolation of working in a small business / at home / by oneself / out of town
For “business systems” intelligence – to get access to personal recommendations and trusted “signposting” to business critical suppliers like IT consultants, PAYE and VAT bureaus, web designers, to find answers to technical IT enquiries
For “external facing business intelligence” – to get access to and learn about technological advances, new techniques (i.e. use of social media in marketing), sources of research and market intelligence
For collaboration – to find and develop partners for collaboration, to identify opportunities for collaboration and promote themselves as potential partners
For marketing and promotion – to make themselves visible to people and organisations interested in their area of expertise
For network development – to build capacity and advertise their skills and culture in order to develop a network which can then be leveraged for all of the things set out above
Clearly some of these uses (e.g. external business intelligence, collaboration) are closely related to innovation while others (social interaction, technical support) are less so.
We were able to discuss these issues with a group of home based businesses from the rural North East in a roundtable meeting hosted by Teesdale & Weardale Enterprise Agency. Around 20 businesses attended the roundtable discussion, of these around half where based in the larger market towns (Barnard Castle and Darlington) and half were from the wider rural area. These businesses all found engagement with formal and informal networks to be of significant value in improving their access to reliable suppliers, securing market intelligence, finding collaborators and mitigating the isolation associated with working on their own (or in small teams). This last point was especially important for those outside the market towns.
The formal networks are maintained and enabled (to some extent) by third parties. This engagement can be very low key and restricted to the “back office” – for example Digital Peninsula Network simply provides a mail server and a membership secretariat function for Network Cornwall. This input enables the 4,000 (and growing) female members of Network Cornwall to communicate and share intelligence by e-mail and generates in excess of 500 mails a week, each distributed to over 2,500 addresses. Enterprise Nation maintains a pro-active presence during working hours on Twitter and Facebook as well as posting regular news and blogs on their website and has positioned themselves as the “homeworkers companion”.
Where there is a commercial application of the network, this function appears to be viable. Where there is no “revenue model” associated with the network, this enabling function needs to be paid for and may be an appropriate target for public intervention.
The informal networks are completely organic and grow as a result of recommendations and people searching social media to develop their own networks. Parts of the more formal networks work in this
95

Opportunities and Barriers to Business Innovation in Rural Areas: Theory and Evidence
way as well – the forums on Enterprise Nation are often busy with people exchanging ideas and asking questions of each other.
Main Findings and Conclusions of the Case Study
Innovation Impact
These networks seem to be enabling businesses to find, sift and test intelligence that they can apply to improve their output and the competitiveness of their business. They are being used for “peer to peer” business support – asking technical questions of peers rather than of business support practitioners or professional service providers. They are being used for collaboration – to develop networks and partnerships which can then be leveraged to win new business, and they are being used to test and shape ideas for new services and products.
They are therefore working, and developing as enablers of innovation. There is much in the literature which points to the increasing power and value of the internet to sustain and develop networks 38. Evaluations of the Digital Peninsula Network and WiRE point to a local economic impact – in terms of increased sales, employment and training activity. To date however we have not unearthed evidence of innovation outcomes that can be ascribed to these networks – beyond the testimony of a few rural businesses of the value they derive from participation.
Of course, the newer virtual networks are at the beginning of their life cycle. As they are not delivered via public funding it is unlikely that formal evaluation will be carried out. It is to be hoped that their contribution might be recognised by organisations such as NESTA and investigated in due course.
It seems probable however that this type of collaboration and networking will have a positive influence on the businesses that participate in it, and consequently enable them to increase their contribution to local economies. This is likely to be especially valuable in more remote rural areas where opportunities for physical networking and collaboration are more limited.
Promoting awareness of these networks, leveraging them to improve connections between public and private sector, and enabling engagement via digital inclusion would all therefore seem to be valid and valuable actions by the authorities.
Constraints
The main constraint to engagement in virtual networks by businesses is access to decent broadband connectivity. The functionality of the platforms on which they are hosted is such that it is not possible to access them via dial up. ADSL enabled exchanges provide sufficient speeds currently, but as the complexity and functionality of internet hosted applications increases slower speeds experienced by businesses over a mile from their local exchange may start to compromise their ability to fully engage with these forms of virtual networks.
Virtual collaborative networks, such as that used by Apple to develop the i-phone, which stretched across five continents, are heavily reliant on access to high speed broadband. Ubiquitous access to NGA broadband is therefore an important element of innovation opportunity in rural areas.
Provision and maintenance of formal networks clearly requires revenue. In some instances it appears that a critical mass has been reached which enables a membership-fee model to work (e.g. WiRE). Many “free to access” networks are still reliant on some form of public grant funding, however, and are likely to remain so. The main benefits of these networks arise from their role in bringing together and creating an online community of businesses; thus providing a platform to businesses / entrepreneurs for peer to peer networking and exchange of knowledge, experience and expertise.
38 Rebooting Britain, Policy Statement and Essay Series, Nesta, 2009
96
Opportunities and Barriers to Business Innovation in Rural Areas: Theory and Evidence
CASE STUDY 3: THE ROLE OF A SCIENCE PARK Introduction
The New Economic Geography literature underlines the positive effects of agglomeration and spatial clustering on innovation and economic growth. In this context, science, and technology parks – characterised by the co-location or proximity of industry and research - are seen increasingly around the world as a means to create dynamic clusters and innovation hotspots. It is argued that the physical proximity offered by a science park eases the flow of knowledge; and fosters interaction and collaboration among different science park actors, in the process stimulating and strengthening knowledge spillovers. Additionally, resident companies can benefit not only from the university’s knowledge base and ongoing research; but also gain privileged access to highly specialised manpower in the form of graduate students and university researchers. Moreover, science parks are managed by specialised professionals who typically offer tenants business development services, programme and project co-operation, and key contacts and networks.
This case study looks at two science and innovation campuses located in rural England - Harwell and Daresbury - to explore the role of science and innovation campuses in creating agglomeration economies and promoting innovation in rural areas. The case study also examines the interactions between science-park firms and their local economies to test the extent to which these science-parks function as seedbeds rather than enclaves of innovation. It is based on desk based research and interviews with:
Four businesses based on the Harwell Science and Innovation Campus;
Harwell stakeholders – Goodman, Science and Technologies Facilities Council (STFC), SEEDA;
One business based on the Daresbury Science and Innovation Campus;
Daresbury stakeholders including STFC, and Daresbury Science and Innovation Campus Ltd (DSIC);
Participants at a networking conference organised to celebrate the IDEAS programme which provided an opportunity to conduct informal interviews with a number of businesses and stakeholders attending.
Theoretical Perspectives
A science or technology park is a place-based activity configured around the following characteristics: formal operational links with a university or other higher educational or research institution, the formation and growth of knowledge-based business and other organisations (Scott 2006), and a management function that is actively engaged in the transfer of technology and business skills to the organisations on site (e.g. Storey and Tether 1998). Typically, such activity leads to a cluster of firms with spatially concentrated networks, characterised by extensive local inter-firm linkages (Harrison 1992). As noted in the literature, not all spatial agglomerations of small firms in the same or related sectors necessarily comprise technology parks. An essential phenomenon for technology parks is an effective functioning network of firms in a locale (Malecki 1995).
According to the literature, for a firm, location on a science park, especially a campus based science park, provides a greater opportunity (in relation to off-park firms) for the acquisition of new knowledge—tacit knowledge in particular. As well, for the university, having juxtaposed firms provides a localised opportunity for licensing university-based innovations. Moreover, empirical evidence, although mixed, on balance confirms the view that science park location triggers interactions and knowledge spillovers and positively relates to the tenants’ innovative output performance (Colombo and Delmastro 2002, Fugukawa 2006 and Squicciarini 2009).
97

Opportunities and Barriers to Business Innovation in Rural Areas: Theory and Evidence
Harwell Science and Innovation Campus
Established infrastructure, attractive location and proximity to academic talent in Oxford, meant that Harwell was chosen as the UK’s centre for civil nuclear power research. However, from the 1990s the focus was shifted, and much of the Campus occupied by the United Kingdom Atomic Energy Agency (UKAEA) has since been transformed from a government research site into a centre of science and technology business. Harwell Science and Innovation Campus (HSIC), created by the UK government in 2006, aims to build on the set of existing science and technology facilities already on site to become a world-leading centre of science and technology. The campus at Harwell is a joint venture between the STFC (a government-funded organisation); the UK Atomic Energy Authority; and property group Goodman.39
Harwell is classed as a rural site – located in rural south Oxfordshire, therefore all of its occupant firms are classed as having a rural location. By locating on a rural science and innovation campus firms are able to combine the environmental benefits of a rural location with the ability to collaborate and share knowledge with other businesses and organisations.
Figure 1: Harwell science and Innovation Campus
Source: Goodman for Science and Technology Facilities Control40
The Campus is now the focus of £500 million investment in new science and business facilities including the Diamond Synchrotron, the UK’s largest investment in science for 30 years and ISIS41, the world's largest pulsed neutron source. Harwell has a mix of business sectors that operate within the same environment and have the opportunity to work with on-park businesses as well as external clients. They are also encouraged by site management to collaborate with universities and form links
39 Science and Technology Facilities Control; Information Note March 2010 - http://ukspaceagency.bis.gov.uk/assets/pdf/HarwellandISIC0310.pdf40 Science and Technology Facilities Control (February 2010) The Detector Systems Technology Gateway Centre - http://www.adams-institute.ac.uk/lectures/11_Feb_MFrench_OXU_Seminar.pdf41 Harwell Science and Innovation Campus website - http://www.harwell.org.uk/
98
Opportunities and Barriers to Business Innovation in Rural Areas: Theory and Evidence
with STFC and the research organisations on site. Rutherford laboratory is focused on high-tech scientific innovation and research and links are fostered with companies in the other areas of the Harwell site, leading to technology transfer. In addition the building of the Diamond synchrotron propelled the campus forward in terms of innovation activity and, along with other developments, has helped to raise the profile and visibility of HSIC. Role of Harwell in addressing Opportunities and Barriers to Innovation
Harwell is located in a rural area, yet due to the critical mass created by the co-location of a range of different organisations, it overcomes many of the traditional barriers that rural businesses may face such as lack of connectivity, access and infrastructure:
Access to new markets, technological development, research:
Firms locating at Harwell have an advantage over other firms in rural areas as they have access to a strong science base, research organisations and academia. Support services provided at Harwell are important and companies have access to equipment that they would otherwise not be able to afford such as electron microscopes. Companies reported that they were able to use the STFC technology on a bespoke basis, and that high-tech equipment was available for use at a flexible rate42, which for a start-up company is invaluable.
In addition, ICT technology can be a major challenge for many rural businesses who cannot take advantage of new developments as they lack access or infrastructure. Locating on a Science and Innovation Campus such as Harwell overcomes these problems as businesses gain access to first class ICT technology such as the JANET network which connects UK universities, FE Colleges, Research Councils and Specialist Colleges.
In addition, Harwell is frequented by visitors from government and from national/international private companies which often creates new opportunities for campus based businesses.
Access to finance:
STFC also provides advice on obtaining finance to businesses. Networking events are organised frequently where start-ups can pitch their business ideas to venture capitalists. This is particularly useful as venture capitalists are unlikely to make individual trips to see rural companies.
Agglomeration effects:
The close proximity of businesses allows them to engage in formal and informal ways to reap agglomeration economies by sharing skills, knowledge and technologies. For example, all spin-out companies are located in the same building which gives them the opportunity to collaborate and learn from each other. One interviewee stated that they had taken part in several breakfast meetings. In addition a company which has recently located at Harwell held an opening event on the 2nd of June 2010 where they invited onsite organisations – firms, STFC, European Space Agency etc.
The interviews point to the existence of strong connections between on-park firms and HEIs. Universities with established connections include the University of Oxford, the Open University, Southampton University and the University of Reading. Universities that have expressed an interest in collaboration include Imperial College, University College London and the University of Birmingham. Additionally, those that have expressed an interest in becoming part of a hub and spokes model include the University of Surrey, Leicester and Nottingham. Harwell also promotes interactions through conferences and knowledge sharing events. One interviewee stated that they will be involved in developing a new project with STFC and the European Space Agency – on both this and other major collaborative projects they expect to benefit from cross-fertilisation of ideas and technology. In addition, there is a pool of specialised labour at Rutherford with many people possessing similar or complementary skills. Companies are able to buy the time of a specialist to work with them on specific projects.
42 Rates are discussed on a case by case basis and dependent on several factors including the type of technology or equipment used.
99

Opportunities and Barriers to Business Innovation in Rural Areas: Theory and Evidence
STFC sits within a sufficient, well-run supply chain and companies locating on-site can gain access to this. For firms at Harwell there is the opportunity to engage with people who can offer advice in terms of the supply chain and the right distribution channels to use to introduce a product to market.
Networking effect:
Interviewees reported that they had been introduced to bodies to which they would not have had access to, had they been located elsewhere. Harwell brings its own credibility and has connections to public sector innovation networks and a range of organisations including TSB, the Carbon Trust and Knowledge Transfer Networks (KTNs). These organisations work with STFC to facilitate introductions between businesses that have the potential to work together and can also help businesses to find relevant financial support. Many of the companies interviewed stated that they will be looking to involve universities as well as research centres in their work.
The Science and Innovation Campus has also fostered strong links with Business Link, UK trade and Investment (UKTI) and Oxfordshire Innovation Network which together make it easier for companies to access business support.
Linkages with the local economy:
STFC has incubators across the region and is able to encourage networking between them. In addition, science-parks regularly communicate with each other, for example to find a location better suited for certain companies. There is also a regular flow of communication with universities and therefore, a constant transfer of knowledge, personnel and skills. A SEEDA representative works with businesses/organisations on-site at Harwell but also looks at opportunities for collaboration with nearby science parks and other growth areas.
Stakeholder interviews illustrated that Harwell has a positive impact on the local economy due to the high value enterprises that are located there. It attracts inward investment into the region as well as skilled employees and contributes to the development of local supply chains. One interviewee stated that they use local firms where possible as logistically it is much easier, there are also many high-tech firms based in the Oxfordshire area which can be used as suppliers. As more commercialisation occurs, there will be increased economic benefit for the region. 4,500 staff are located on campus, many live and have relocated to the surrounding rural areas, and there are benefits for local property markets, and spending of earnings in local area. One interviewee stated how their company will be looking to recruit UK nationals and may source these employees from the local area. Another interviewee stated that almost 100 per cent of their employees reside locally and therefore spend money in the local economy. Finally STFC is an active member and participant of various relevant forums promoting the region as ‘a place to do business’ and as ‘a place for innovation’ such as ‘Didcot First’.
Comparison with Daresbury Science and Innovation Campus
In 2006 the Government announced Daresbury Science and Innovation Campus (DSIC), alongside Harwell, as a focus of government science research and innovation investment as a key part of its 10 year UK Science and Innovation Investment Framework. Stakeholders at Daresbury include NWDA, STFC, Halton Borough Council and the Universities of Liverpool, Lancaster and Manchester.43.
Table 1: Comparison of Harwell and Daresbury Science and Innovation Campuses
43 Daresbury Science & Innovation Campus website - http://www.daresburysic.co.uk/
100

Opportunities and Barriers to Business Innovation in Rural Areas: Theory and Evidence
Harwell SIC Daresbury SIC
Area 734 acres 100 acres
On-site companies and employment
4,500 people and over 100 companies on site
77 Companies with over 900 employees
Key Assets STFC Rutherford Appleton Laboratory
Diamond Light Source
ISIS
START & HarwelI Innovation Centre
Medical Research Council, Health Protection Agency, AEA Technology
STFC Daresbury Laboratory
Cockcroft Institute
Daresbury Innovation Centre
Business link, UKTI and the NHS innovation hub
Source: Science and Technology Facilities Control44
Like Harwell, Daresbury is home to a variety of science and technology businesses, ranging from small start-ups to strategic units of large multi-national corporations. Harwell has fostered links with universities and similarly DSIC has well-established links with STFC and the Universities of Lancaster, Liverpool and Manchester.45 There are many similar features between Harwell and DSIC:
Well-established cluster of high-tech companies with strong linkages to universities providing an opportunity for technological and commercial collaboration;
Tranquil rural locations but with excellent transportation links – local motorway networks and rail links;
Strong regional, national and international networks make it easier and faster to find key partners, customers and service providers; and,
Provision of all-inclusive of rates, gas/electricity, IT and telecoms services, cleaning and security and a wide variety of space options available, ranging from single desks to offices.
Together, the two campuses form what has become known as the Campus ‘Dipole’ Model i.e. two renowned centres of scientific excellence, building on and expanding their expertise within science, technology, innovation and business. The Government will look to develop these campuses so as to ensure that their facilities are internationally competitive, support world-class science, and maximise opportunities for knowledge transfer. Harwell and Daresbury Science and Innovation Campuses will be relied upon to support the Government’s Science and Innovation Investment Framework by creating an interactive community of leading scientists and innovators whilst providing amenities and facilities to encourage collaboration.
A company located at Daresbury stated that a main advantage of a science park location was proximity to ‘like-minded’ businesses with whom they could interact with and form relationships with. Through monthly breakfast meetings companies have been introduced to relevant venture capital firms and a majority of the interviewees stated that it would have been much harder to make these introductions if they hadn’t been located at Daresbury. A stakeholder mentioned that Daresbury has presented many businesses with contacts and opportunities that have helped them to trade internationally. For example UKTI runs a clinic from Daresbury looking for international sales
44 Science and Technology Facilities Control (February 2010) The Detector Systems Technology Gateway Centre - http://www.adams-institute.ac.uk/lectures/11_Feb_MFrench_OXU_Seminar.pdf45 Daresbury Science & Innovation Campus website - http://www.daresburysic.co.uk/
101

Opportunities and Barriers to Business Innovation in Rural Areas: Theory and Evidence
opportunities for businesses. Stakeholders also emphasised that clustering opportunities were a key advantage of a science park location; and it also fostered greater collaboration and knowledge sharing. A DSIC stakeholder emphasised that high-tech firms often have great expertise but, the breadth is very narrow and they therefore need to collaborate with other firms to be as successful as possible
A company located at Daresbury stated that its science park location had facilitated connections to Liverpool and Lancaster University and had helped them understand the role that universities can play in their innovation activities. This interviewee stated that the company works with more contacts (both on and off site) than they previously had in other locations; and their network and client list has extended since moving to Daresbury. For this particular interviewee, the location has also enhanced access to markets via improved links to airports (enabling increased travel to Europe). Daresbury has also helped some companies in their recruitment through formal events facilitating access to potential employees.
Stakeholders stressed that Daresbury is ‘outwardly focused’ and encourages any high-tech firm in its surrounding rural areas to locate on-site or at the very least use the services and facilities that it offers. STFC engages with Halton Borough Council and works closely with the innovation manager. STFC also deals with all local innovation centres, and works closely with the RDA and the Universities nearby. Collaborative research is undertaken with universities and university staff use STFC facilities. Networking with the wider region occurs on a regular basis and strategic partnerships are formed for example with STFC who are involved in other science parks, NWDA, the local council, business link, UKTI and the NHS innovation hub. The board and STFC management have recently devised a ‘hub and spokes’ model which they hope to implement in the future to further integrate with the wider innovation system. This model would involve a network system that allows for easier connections and relationships to be built either electronically or by attending meetings and events.
Daresbury management described how they work with Halton Borough Council to promote employment and training for young people and offer internship opportunities. STFC are involved with key industry players in the region including Rolls Royce and AstraZeneca and are working with them on collaborative R&D projects. These factors can help businesses to become more successful which feeds into the local economy in terms of growth and job creation. In addition, ensuring that the supply chain is high on the agenda enables a mini-local economy to develop which supports the companies at Daresbury
In addition, the IDEAS programme, run from Daresbury by Lancaster, Liverpool and Manchester Business and Management schools and ImaginationLancaster, is an example of collaborative efforts focused on innovation but drawing businesses from across the region. The programme consisted of a series of workshops aiming to help businesses adapt to new markets and strategic and technological opportunities as well as encouraging firms to network and collaborate. Businesses involved in the programme reported that they had gained important benefits which have helped them to survive the economic recession in some cases or to grow and become more successful.
Innovation and linkages at Daresbury:
The following headline results of the Daresbury 2009 tenants’ survey provide an indication of the level of innovation occurring at Daresbury and the level of collaboration and connectivity between on-site firms:
64% of companies developed a total of 219 new products and services in 2009, of which three quarters had been taken to market. About half of these companies had also filed patents.
53% of Daresbury companies actively collaborate with each other particularly in the form of buyer-seller relationships, joint-ventures and collaborative partnerships.
Overall there are 66 connections between tenants with the most active company reporting 18 links. This has generated an approximate value to the businesses in terms of new sales
102

Opportunities and Barriers to Business Innovation in Rural Areas: Theory and Evidence
or cost savings of over £500,000.
Over 40% of Daresbury companies are utilising services and/or expertise from STFC and similarly from stakeholder universities.
There is a very high level of usage of public sector business support products and schemes by Daresbury companies. In particular whilst Business Link and UKTI have both maintained a high level of penetration (51% and 37% respectively), two new products through the NWDA (Innovation Vouchers and the High Growth scheme) have achieved a take-up of 30% each within 12 months of launch.
Campus companies have also derived significant financial benefits from key NWDA products and schemes. About 13% of companies are actively engaged with the GRAND R&D funding scheme.
Source: DSIC (2010) Daresbury Science and Innovation Campus – 2009 Company Survey
Main Findings and Conclusions of the Case Study
Harwell and Daresbury are shining examples of innovation ‘hotspots’ in rural areas. Each also seeks to interact with its rural hinterland; thus delivering wider benefits to the rural economy. Both sites also demonstrate that a rural location can offer advantages to a science park – in terms of environment, green field sites and transport links.
The benefits of agglomeration through the science park model are clear in each case. The research and interviews conducted at Harwell and Daresbury suggest that companies locating on-site are seeing positive business results through innovation. This innovation is heightened in scale and intensity as a result of locating at Harwell or Daresbury rather than in the surrounding rural areas due to the immediate access to facilities, infrastructure, knowledge and expertise. The Harwell and Daresbury sites are extremely competitive which pushes businesses to achieve and provides them with the means to do so. Some of the most high-tech, cutting edge developments are taking place at Harwell and Daresbury and therefore it is advantageous in terms of status and image for companies to locate here.
This research suggests that the role of agglomeration can be significant in enhancing rural business innovation. The advantage of proximity, face to face interaction and networking are cited as particularly important by businesses. In addition the behaviour of firms is positively affected by locating on such a high-tech competitive site and interviewees found this gave them increased impetus to innovative.
The case study demonstrates that a science park location such as at Harwell or Daresbury offers tangible benefits in promoting innovation compared to other rural locations. It is less clear, however, whether science parks such as these are likely to attract firms that would otherwise locate in rural areas, or whether their rural location is purely coincidental. While some of the attributes of Harwell and Daresbury (e.g. environment, space for development, transport links) may be shared with other rural areas, it is likely that many relate to their strengths as science parks rather than their rurality, and that many of their occupants would be located in urban locations if not at Harwell or Daresbury
103

Opportunities and Barriers to Business Innovation in Rural Areas: Theory and Evidence
CASE STUDY 4: THE ROLE OF SECTORAL NETWORKSIntroduction
This case study focuses on the Food and Drink iNet and explores the role of sectoral networks in promoting and encouraging innovation and how rural businesses are overcoming any locational disadvantages through involvement in such networks.
For this case study telephone interviews were conducted with:
Five rural businesses based in Lincolnshire and one Derbyshire based rural business;
The Lincolnshire and Derbyshire iNet advisors;
Stakeholders – Food and drink Forum, Nottingham Trent University, East Midlands Development agency (emda);
A representative of heart of England Fine Foods (HEFF) for comparison.
Food and Drink iNet
The Food and Drink iNet is a region-wide initiative co-ordinating specialist support for businesses, universities and individuals working in the food and drink sector in the East Midlands.
Funded by emda, the Food and Drink iNet is managed by a consortium including the Food and Drink Forum Ltd - which is the lead partner - plus the Food Processing Faraday Partnership, Nottingham Trent University, the University of Lincoln and the University of Nottingham. The three iNet products are:
Information, Diagnostic and Brokerage service (IDB) - an advisor identifies and discusses the business’s innovation needs and refers businesses to the most appropriate support provider.
Innovation Support Grants (ISGs) - for small to medium-sized enterprises (SMEs) based in the region to help with the costs of external consultancy or expertise required for an innovative project.
Events to promote and drive innovation in the industry. An innovation Exchange (iExchange) has also been developed which allows for the sharing of ideas and offer opportunities to work in partnership with businesses or research organisations.
Food and drink is the largest manufacturing sub-sector in the East Midlands, accounting for five per cent of the region’s economy and just over three per cent of employment. emda has identified the food and drink sector as one of four priority sectors likely to make the greatest contribution to the East Midlands’ economy. The forecast is for output growth of around 30%, compared to 9% for the UK during the period to 2014.46
Opportunities and Barriers to Business Innovation in this Context
Interviews with rural food sector businesses in Lincolnshire and Derbyshire revealed that the main barriers to business innovation were common across most companies and included the following:
A limited customer base.
The challenge to stay connected with each other and to keep up to date with ICT developments in order to access new markets.
The relative lack of support systems in rural areas which provide funding and advice.
A lack of awareness among businesses regarding potential sources of information.
Distribution can be a challenging issue for several of the small rural businesses who are not experienced in assessing different routes to market and are not so proactive with regards to
46 Food and Drink iNet – East Midlands Innovation - http://www.eminnovation.org.uk/food/Default.aspx
104

Opportunities and Barriers to Business Innovation in Rural Areas: Theory and Evidence
marketing their products. For a small business getting products to market on time and under the right conditions e.g. frozen/chilled can also be a very complex task. Finding suitable staff with the relevant expertise.
Role of iNet in addressing opportunities and barriers to innovation
According to most interviewees, a major benefit of the iNet for rural businesses is the access that they have gained in terms of the specialist knowledge and experience of the iNet advisors. The advisors are fully mobile and therefore able to access even the remote rural businesses which may not have access to other more regional and urban-based networks. The iNet teams have also been useful in providing specific help and guidance, for example they have helped rural businesses in shortening the supply chain by finding local suppliers, introducing a more cost effective distribution as well as looking at issues such as security of supply. The iNet has also helped several businesses to overcome the limited customer base by encouraging and facilitating on-line development of the business. One assisted business has been looking at the way orders are tracked and has subsequently changed their internal system with the help of Food and drink iNet advisors to make the system more efficient.
The majority of businesses interviewed stated that their involvement in the iNet has fostered greater networking and interaction through events and iNet seminars where they have had the opportunity to meet like-minded people. In some cases, these new relationships have led to a collaborative partnership. For example, one company met a marketing specialist at an iNet event and has since used its services for an innovative branding project. Furthermore, iNet advisors frequently facilitate introductions between specific businesses where they see potential opportunities for cooperation. Through the networking events, some knowledge transfer and knowledge sharing has occurred in an informal setting. This is very important for rural firms, one of which stated that they can easily become isolated.
The iNet has facilitated linkages with HEIs for several businesses interviewed. These collaborations have included seeking specialist knowledge and advice from universities or sub-contracting certain projects to them. For example, one business involved in producing a new drinks production line described how Lincoln University students undertook some market research on its behalf. In addition internship/apprenticeship schemes have been run between several businesses and universities.
Another main benefit of iNet, as identified by business interviews, is its role in facilitating access to finance, particularly in the current economic climate where many rural firms are struggling to access funds to enable innovation activity to be carried out. For example, one Derbyshire based company, a vegetable packer and supplier, used the iNet grant to contract services to produce a work flow analysis to help manage and plan production flow and gain a more detailed idea of future direction of the business. Furthermore the iNet is able to signpost businesses to alternative funding sources in the region that they may not previously have been aware of.
The iNet fits into a wider innovation network in the region through its linkages with other relevant programmes as well as with HEIs and their student population. The iNet, where appropriate, also signposts businesses to other relevant services therefore enhancing connectivity between support services. In addition, the Directors of the different iNets meet regularly which provides the potential for integration between iNets – for example there are linkages between the Food and Drink iNet and the transport iNet (supply chain and distribution channels) which could potentially be exploited in future.
Future plans for the iNet suggest that there will be lots of new opportunities for businesses:
A ‘Collaborate to Innovate’ programme which is currently in the pipeline, will encourage less competitive businesses to work together to solve common issues.
An increased number of advisors in the next phase (funded through ERDF) will mean that advisors will be able to spend more time with businesses to work through issues identified.
A food and engineering programme will become embedded into the iNet in the future. Many businesses have a supply chain that is national or international, whereas in fact there are local companies that could provide suitable equipment and technology which would have added benefit for the regional economy.
105

Opportunities and Barriers to Business Innovation in Rural Areas: Theory and Evidence
The Heart of England Fine Foods (HEFF) Network
For comparison, we researched the HEFF network, the Regional Food Group for the West Midlands. Like the iNet, HEFF works with a wide variety of food and drink businesses from food producers to companies selling, serving and promoting food and drink. HEFF aims to create trade opportunities through a growing range of innovative initiatives. The aim is to help food and drink producers and processors develop profitable and sustainable markets for their products utilising regional strengths and expertise. The network covers business in Staffordshire, Shropshire, Worcestershire, Warwickshire, Herefordshire, Birmingham and the Black Country.47
Services provided include:
Trade development activities –representing businesses at trade fairs.
Organised ‘Meet the Buyer’ days between a retailer and a number of food producers to enhance business opportunities. This is similar to iNet services which help to facilitate introductions.
Experts in-house who visit businesses and help them with any problems and have a similar role to the iNet advisors.
HEFF also works in partnership with Business Link to signpost to relevant sources.
Like the iNet, HEFF works with several HEIs including Harper Adams College and University College Birmingham. It encourages universities to work together to publicise their capabilities and how they can help businesses. HEFF actively encourages businesses to get involved with Universities and will help to facilitate contact.
In comparing the two networks several similarities become evident, particularly in the services offered. The trade development and networking activities of both organisations focus on enhancing access to new markets, sharing knowledge and meeting people with specialised skills that they can collaborate with. Being involved in these networks means that businesses have access to a pool of contacts to spread the word about their products and to gain benefits from joint marketing and publicity. HEFF also encourages the purchasing of local food and drink, particularly from farmers' markets, and so directly supports local businesses. HEFF seems to focus on this aspect to a greater degree than the Food and drink iNet; although the iNet does facilitate introductions to local suppliers where possible.
Main Findings and Conclusions of the Case Study
The role of sectoral network in promoting and encouraging innovation:
Sectoral networks have a specific focus as compared to other networks or means of promoting agglomeration and collaboration. The iNet adds value by joining up firms with similar interests in a way that more generalised networks might not be able to. The iNet also acts as a focus for sectoral based support by involving stakeholders with industry expertise and assisting businesses in gaining access to finance. Many food and drink firms are located in rural areas. The food and drink INet and HEFF provide networking and collaboration opportunities which are particularly important to rural firms to ensure that they do not become isolated due to their rurality. The networks increase connectivity and the opportunity for knowledge sharing and technology transfer which is important for rural businesses which may not possess the knowledge internally.
How being part of a sectoral network shapes and influences the innovation performance of firm:
Businesses interviewed for this case study revealed that their innovation behaviour had been positively affected by their involvement with the iNet. Businesses stated that they were more willing to explore new opportunities and ways of working as encouraged by the iNet advisors. In addition companies have been encouraged to take a greater interest in technology transfer and how they can work with partners to achieve this as well as knowledge sharing. Businesses involved in the iNet have reported a greater focus on new product development and developing new working processes since
47 Heart of England Fine Foods website - http://www.heff.co.uk/
106

Opportunities and Barriers to Business Innovation in Rural Areas: Theory and Evidence
joining the network. Businesses stated that these benefits would not have occurred as quickly or at the same scale if they had not been involved in the iNet.
How rural businesses are overcoming ‘physical remoteness’ / any locational disadvantages through involvement in network:
Many firms see their rural locality as a barrier and the iNet has been particularly important in highlighting solutions to businesses. Although the iNet and other sectoral networks provide similar benefits to urban based firms it could be argued that sectoral networks have more relevance in a rural context as they facilitate collaboration and linkages that may not otherwise occur; and help overcome isolation. Furthermore some sectors, such as food and drink, have a particularly rural focus.
107

Opportunities and Barriers to Business Innovation in Rural Areas: Theory and Evidence
CASE STUDY 5: BUSINESS INNOVATION IN REMOTE RURAL AREASIntroduction
The purpose of this case study was to gain a better understanding of innovation activities in disconnected rural areas, particularly focusing on the barriers that companies face when undertaking innovation.
For the purpose of this case study businesses in remote rural Northumberland and Lincolnshire were interviewed. The annex provides a list of consultees. Table 1 profiles the two businesses and one rural entrepreneur interviewed in Northumberland.
Table 1: Profiles of Businesses Interviewed
Business/ Entrepreneur Name
Type of business Overview of innovation activities of the business/ entrepreneur
Alnside Associates Business Consultancy Runs innovative team development courses employing outdoor activities
Twenty Seven Designs Brand and design consultant
Creating new methods of working and new business models
Ian Brown Serial entrepreneur Examples include: on-site use of innovative biomass energy technology; a bespoke catering company offering local food; eco-friendly business park. Business model involves leveraging distinctive rural assets.
Theoretical Perspectives
Empirical evidence establishes the importance of proximity for the transmission of economically productive knowledge. It demonstrates that spillovers are geographically bounded and there is strong distance decay effect, supporting the idea that ‘remoteness’ can act as a barrier to innovation. (Rodríguez-Pose and Crescenzi, 2008). Other factors associated with peripherality include:
External innovation infrastructures are usually less developed than in central regions (Gatrell, 2001).
Skills and market access are more difficult to obtain (Anderson et al., 2001).
This adds further weight to the belief that remoteness is a barrier to innovation. And while ICT developments (such as broadband) reduces the importance of geographical distance; it does not eliminate the need for face-to-face-contact. According to available evidence (albeit somewhat dated) ICT does not remove the distance barriers for peripheral areas (Manniche and Marcussen, 1997); although it can give firms in peripheral areas the opportunity to compensate for some of the disadvantages of their localisation, and can give the populations in the periphery the opportunity to combine a countryside-living with city-like jobs and education.
The Northumberland Economy and its Local Innovation Eco-system
Northumberland borders Cumbria to the west, County Durham to the south and Tyne and Wear to the south east. It had an estimated population of 309,237 in 2003. The county is rural in nature with few large settlements and with only 61 persons per sq/km is the least densely populated county in England (Northumberland InfoNet, 2009). Northumberland also has an ageing population. Approximately 18% are aged between 0-15, 64% are of working age and 19% are at retirement age. By 2021, there will be more older people in Northumberland and fewer people of working age to support them (Northumberland InfoNet, 2009).
Northumberland’s economy is strongly linked to that of Tyneside because almost a third of the county’s workforce commutes there on a daily basis (Northumberland InfoNet, 2009). The rural county is a net exporter of labour; in 2001 there were 74,000 economically active residents but only 63,300
108

Opportunities and Barriers to Business Innovation in Rural Areas: Theory and Evidence
jobs (Northumberland Strategic Partnership, 2003). Overall economic performance is poor. The unemployment rate is broadly similar to the national average, but the average wage earned from employment within the county is Significant lower. GVA per head in in Northumberland and Tyne & Wear increased by 5.1% from £15,466 in 2005 to £16,296 in 2006, when it was slightly higher than the North East average (Northumberland InfoNet, 2009).
Northumberland InfoNet, (2009) highlights that the number of new VAT registered businesses per 10,000 head of population increased from 27 in 2005 to 33 in 2007. Although this is higher than the North East (28), a region in which promoting entrepreneurship has been identified as a key challenge, it is Significant lower than the England average (43). The majority of employers in the county are small businesses; 83% employ fewer than 10 people, whilst only 3% employ more than 50 people.
Northumberland InfoNet, reports the sectoral composition of the economy. A substantial proportion of Northumberland’s land area is devoted to farming and forestry. Although farming has been in decline for many years the industry still accounts directly for just over 5% of all employment in the county. Fishing remains an important economic activity for some ports and harbours on the North East coast but the industry has also declined in size and value over the past few decades. Although not a large employer in the county, the creative industries sector has seen significant growth in the last six years, compared to only a small growth in the North East, and a decrease in England. Nearly a fifth of the employees and employers in the North East in this sector are based in Northumberland. Knowledge intensive business services, the public sector and renewable energy are all growing sectors in Northumberland. The visitor economy is one of Northumberland’s most important economic sectors. When indirect revenue of £260 million is taken into account, the total contribution of tourism to the Northumberland economy in 2007 was £710 million.
Drivers of Innovation
Insights into the drivers of innovation were provided by the businesses interviewed in Northumberland. The business consultancy owner suggested that the main driver of innovation was the demand from clients for new and different products and ways of working. The design and brand consultancy owner had worked as a design and brand consultant for 20 years and saw gaps in the market for a high quality brand consultant without the overheads that big businesses charge. Moreover, this interviewee wanted to create a new business model - a ‘hub and spokes’ model, which mixes different teams together on a freelance basis. The rural entrepreneur stated that the main drivers for innovation were a desire to stay ahead of the competition, to grow the business, generate wealth and work in a collaborative way.
All businesses interviewed stated that they faced greater pressure to innovate as a result of their rural location, and that it is important for small rural businesses to demonstrate a greater level of innovation in order to stay ahead of the competition. It was suggested that this was healthy for a business and a positive outcome of locating in a remote rural area. The business consultancy owner commented that there was no local innovation eco-system: ‘everything in this area including research facilities and event organisation gravitates towards Newcastle. This distance makes things logistically more difficult and results in a greater pressure to innovate and bring new, fresh ideas to clients’.
Interviewees expressed varying views as to whether they engaged in innovation to thrive or to survive – this depended greatly on the stage of development of the business. The design and brand consultancy business was in the start-up phase and for this interviewee, it was necessary to innovate in order to survive. The business consultancy owner stated that innovative developments aimed to help the business thrive and create a new and improved offer. This interviewee was involved in using outdoor space as a training ground as a new and innovative approach to business consultancy. The rural entrepreneur stated the reason for engaging in innovation was to thrive.
Barriers and Opportunities facing Rural Businesses
Different perspectives on barriers to rural innovation were given by interviewees. All interviewees indicated that access to finance and knowing where to look for funding opportunities was a challenge. It was noted that rural businesses focused on local markets face particular challenges in convincing
109

Opportunities and Barriers to Business Innovation in Rural Areas: Theory and Evidence
investors of their prospects. In addition, all interviewees commented that research institutions, universities and networks that they engaged with, were located ‘a good distance away’ which at times was inconvenient.
The owner of the design and brand consultancy expressed the view that specialist skills and experience are required to facilitate growth of the business. He expressed doubt as to whether employees would be prepared to commute to remote rural areas, particularly as he was looking to employ younger professionals with a couple of years of experience. In addition, this interviewee stressed that there is also a lack of high quality office space and it was therefore difficult to plan expansion and growth. He also stated that connectivity was an additional barrier to innovation and although the broadband connection is currently adequate, as businesses become more dependent on the internet it will become apparent that connectivity could be improved. The owner of the business consultancy stated that time and resources are a potential barrier to innovation, and that the time taken to run and grow a business on a daily basis can make it more difficult to find time for innovation related opportunities. He found this increasingly difficult with the lack of a local innovation eco-system and support services in remote rural areas. Access and distance were cited as barriers to business innovation by the rural entrepreneur, particularly in winter months (when adverse weather conditions cause disruption to transport links). This interviewee also suggested that mobile phone coverage is poor which can make conducting business difficult.
Several opportunities exist in rural areas, however. Interviewees stressed that rent is cheaper, quality of life is better which means that employees will stay with the company for longer. In addition, being a rural business can create a defining feature for a company. The owner of the business consultancy felt that being a rural business is a lifestyle choice more than anything else. If you are looking to balance this with quality of life, a rural area can provide many opportunities; and, although it may be harder to innovate and more effort is required in making contacts and building a network of people, it is still possible to be a successful innovative company in a remote rural area. The rural entrepreneur suggested that climate change provides opportunities for business in rural areas. This interviewee owns a business park in rural Northumberland which is able to demonstrate its capability by creating two private sources of water, generating its own heat and electricity and growing its own food. However, the interviewee commented that there are not significant differences between rural enterprises and urban enterprises apart from the lower population and lower critical mass which is something that advancements in ICT can help overcome.
Tackling the Barriers
All interviewees are aiming to embrace innovative technology or techniques to overcome barriers to growth and innovation, to stay ahead of the competition and to present clients with alternative methods. The design and brand consultancy owner found that recruitment problems had proved to be a barrier to business growth. He has therefore had to generate innovative solutions, for example offering company cars as part of a remuneration package to young professionals who do not have a car and would otherwise struggle to get into work. This interviewee has also created a new business model - a ‘hub and spokes’ model, which mixes different teams together on a freelance basis which can overcome some of the barriers to employing local people as they are not required to be on site on a full-time basis. The issue of critical mass was recognised by the rural entrepreneur who subsequently created a community of businesses and included a cafe on his business park to help foster collaboration and interaction between companies.
Characteristics of Innovative Businesses
Characteristics of remote rural businesses involved in innovation include motivation and confidence. The business consultancy owner had several innovative ideas for starting his own business but, it was only after he had attended a training course that he gained the confidence and the support that he needed to take his ideas to the next step. The ability to embrace and invest in new technology is also important. For example, the business consultancy owner stated that he was fully engaged in ‘Twitter’ and believes that both physical and virtual ways of interacting are important to bring together entrepreneurs and the information they require. Accessing new markets can be a difficult task for a remote rural business but, all interviewees were willing to embrace technology and to try different
110

Opportunities and Barriers to Business Innovation in Rural Areas: Theory and Evidence
approaches. For example, the business consultancy owner found that a mixture of ‘word of mouth’ and an online presence with a blog updating the company’s activities has been a successful strategy. Vision is an important characteristic for individuals engaged in innovation and includes the ability to see opportunity. For example, the design and brand consultancy owner saw how public-private enterprise will be increasingly important and decided that his consultancy company could be useful in facilitating this, helping the public and private sector work together. In addition, the rural entrepreneur saw the potential market for renewable and environmentally friendly technology.
Comparison with Rural Businesses in Lincolnshire
Lincolnshire’s economy faces significant challenges, including a dominance of traditional sectors and a shortage of growth opportunities. In addition Lincolnshire's sparse population particularly in the north and east, remoteness, the low wage, low skill economy and the casual and seasonal nature of much work results in around 100,000 people being in labour market difficulty. Three of the East Midlands' five 'lagging districts' (rural areas characterised by low income) are in Lincolnshire, and one third of people of working age have below level 2 or no qualifications, with unqualified people earning one third of the amount graduates earn.
Interviews were undertaken with two businesses involved in innovation activity (Table 2).
Table 2: Profile of Interviewees - Lincolnshire rural businesses
Business Name Type of business Overview of innovation activities of the business
Sheltons Sports Turf Drainage Ltd
Manufacturers of sports turf drainage equipment
Used innovative technology to develop specialist land drainage machinery and techniques
The Thomas Centre Autism friendly holiday specialist
Innovative in their idea and approach to providing holiday accommodation in giving families with an autistic member a unique and new experience
The manager of the sports turf drainage equipment company stated that he was aware of the barriers facing rural businesses including a limited local market size and access to outside expertise and knowledge. He has therefore, tried to overcome these difficulties by using innovative techniques to create new products, new technology and access new markets on a national and international level to ensure that the business stays ahead of competitors. For example, the company has produced a new range of wheel trenches which have enabled them to work under wet weather conditions. They have also used innovative methods to increase the size of the engine to enable deeper installation of pipes. The manager has gained access to regional support programmes such as the East Midlands High Growth Scheme which has encouraged ‘soft’ innovation including the revision of the corporate strategy and organisational structure; and has used Computer Aided Design (CAD) software to design new and improved machinery which has led to efficiency gains. Through Innovation Lincolnshire, the company has accessed university support within the region. Furthermore, the company feels well placed to continue its innovative venture from its rural location as it does not suffer from any lack of infrastructure or lack of skilled personnel; but, instead can take advantage of opportunities that the rural location offers such as space for expansion and low running costs.
Similarly, the owner of the Thomas Centre has taken an innovative approach to his business which is now trading successfully. The business offers five star holiday accommodation for families with a member suffering from autism. This is a new offering to the market and the concept and idea is highly innovative and unrivalled by competitors. The business uses ICT technology and a differentiated marketing strategy to gain access to a national market. In addition the rural location has provided opportunities, such as the type of outdoor activities available on site, which has added to the overall offering. The owner of this business could not cite any barriers resulting from the rural location.
111

Opportunities and Barriers to Business Innovation in Rural Areas: Theory and Evidence
Although the above cases may not necessarily be the norm for rural businesses striving to be innovative, they demonstrate that there is much opportunity that can be gained from a rural location as long as businesses are willing to embrace new ideas and have the vision to succeed.
However, a stakeholder from Innovation Lincolnshire, cited a lack of capitalisation as a main barrier to innovation in rural areas and a lack of general business and management skills. She stated that Lincolnshire businesses were not accessing their fair share of innovation support programmes and therefore the Innovation Lincolnshire programme was run to encourage businesses to gain strength, stability and growth through innovation. This programme made a great effort to reach businesses in rural areas as well as urban areas through Business Link, district councils, and a substantial marketing campaign.
Main Findings and Conclusions of the Case Study
Rural businesses can become isolated in a physical and intellectual sense – engaging with other companies or organisations and forming collaborative partnerships is a challenge in a remote rural area which lacks a local innovation eco-system. An ability to develop innovative solutions to barriers is therefore extremely important. The ability to network; identify potentially fruitful partnerships; to collaborate with other firms, businesses and institutions; and to engage in technology transfer and knowledge sharing are also important in overcoming the barriers associated with rurality. In many rural areas, publicly funded support programmes exist to assist firms with innovation, but accessing these programmes requires a knowledge of where to look, as well as the ability and commitment to do so. Drive and determination are prerequisites for innovation in remote rural areas, because of the challenges of gaining access to knowledge, networks and facilities.
As well as these barriers, remote rural areas may also have opportunities for innovation such as a higher quality of life, low running costs, and assets that make them well placed to exploit opportunities in growth sectors such as renewable energy. Embracing ICT is often paramount to accessing knowledge and exploiting business opportunities, and this is dependent on the availability of appropriate ICT infrastructure.
112

Opportunities and Barriers to Business Innovation in Rural Areas: Theory and Evidence
ANNEX 4 LIST OF RESEARCH PARTICIPANTS
Name Role/ Team, Organisation
Physical agglomeration
ALEXIS HOLDEN Knowledge Exchange Unit, University of Central Lancashire
DION WILLIAMS Knowledge Exchange Manager, Lancaster University Management School
GREG CHOPPER Inward Investment, Kettering
HELEN FOGG Lancaster University Management School
KAREN HORNER Principal Planner, North Northamptonshire Planning Unit
KAREN WALTERS Star Virtual Office
MICK JUDGE Wellingborough Innovation Centre
PETER RUGENYI North Northamptonshire Development Company
TOM GROZDOSKI Economic Development, East Northamptonshire Council
Virtual networks
EMILY CAGLE #commschat
EMMA JONES Enterprise Nation
GARY HOSEY High Impact Development
JAMES HOWARD Digital Peninsula Network
JANET ROSS Network Cornwall
JEREMY SCALLY Little Big Fish
POLLY GIBB WiRE
STUART FISHER Foveae Business Improvement Consultancy
TIM DWELLY Live Work Network
VALERIE COLLING Colling Sustainable Buildings
113

Opportunities and Barriers to Business Innovation in Rural Areas: Theory and Evidence
Name Role/ Team, Organisation
Campus-based science parks
ALDO DE LEONIBUS Managing Director - Inventya Limited & Business Development Director - Teknisolar Ltd (both located at Daresbury)
ANDY AKERMAN Director of Finance and Corporate Services – Diamond Light Source
ANDY BENNETT Campus Account & New Business Opportunity Manager. Daresbury – STFC
COLIN WHITEHOUSE Deputy CEO of STFC Daresbury and Harwell
HELEN FOGG Knowledge Exchange Project Manager – Lancaster University
JOHN LEAKE General Manager of DSIC Ltd Daresbury
MARC GORMAN Head of International Development - Magellium
PATRICK COHEN Finance Director - Oxsensis
PAUL VERNON Buisness Development Manager Daresbury – STFC
PETER EBDON CEO - Professional Software Engineering Ltd
SALLY-ANN FORSYTH Director, Science Parks at Goodman International
SEAN STEWART Head of Laboratory Operations - STFC, Rutherford Appleton Laboratory
STEPHANIE HILLS Campus Communication Manager - STFC, Rutherford Appleton Laboratory
WARREN RALLS Harwell lead and Area Director, SEEDA
Sectoral networks
ASGAR DUNGARWALLA Vin De Terre, iNet Business, Lincolnshire
CHRIS BROCK Head of Sector Innovation - EMDA
CLAIRE HALL Drink It Ltd, iNet Business, Lincolnshire
FIONA ANDERSON Managing Director - Food and Drink Forum
HANNAH BLEVINS Peter's Eden, iNet Business, Lincolnshire
JAMES ALLEN Partnership Manager - HEFF
MARTIN MCQUAIDE AB Produce, iNet Business, Derbyshire
114

Opportunities and Barriers to Business Innovation in Rural Areas: Theory and Evidence
Name Role/ Team, Organisation
MICHAEL DIXON Consortium Partner, Nottingham Trent Uni & Chairman of Strategic Advisory Panel for Food and Drink iNet
PAUL SHEPHERDFood and Drink iNet Advisor - Derbyshire area
RACHEL LINSTEAD Food and Drink iNet Advisor – Lincolnshire area
RACHEL ROBERTS Hay Hampers Limited / Vintners, iNet Business, Lincolnshire
Remote rural areas
CLIVE GRAY Director, Alnside Associates, Northumberland
IAN BROWN Rural entrepreneur
MICK CLAXTON Sheltons Sports Turf Drainage Ltd, Lincolnshire
RICHARD CREANE The Thomas Centre, Lincolnshire
RICHARD FOWLER Director, Twenty Seven Design, Northumberland
SAMANTHA HARRISON Programme Manager - Enterprise & Innovation, Lincolnshire County Council
115


![[XLS]sciencesearch.defra.gov.uksciencesearch.defra.gov.uk/Document.aspx?Document=11836... · Web view44.483493881639767 38.748389262519794 38.748389262519794 38.748389262519794 33.013284643399814](https://img.pdfslide.net/doc/110x75/5b5de2027f8b9a9c398f0f99/xls-web-view44483493881639767-38748389262519794-38748389262519794-38748389262519794.jpg)