Embed Size (px)
Citation preview
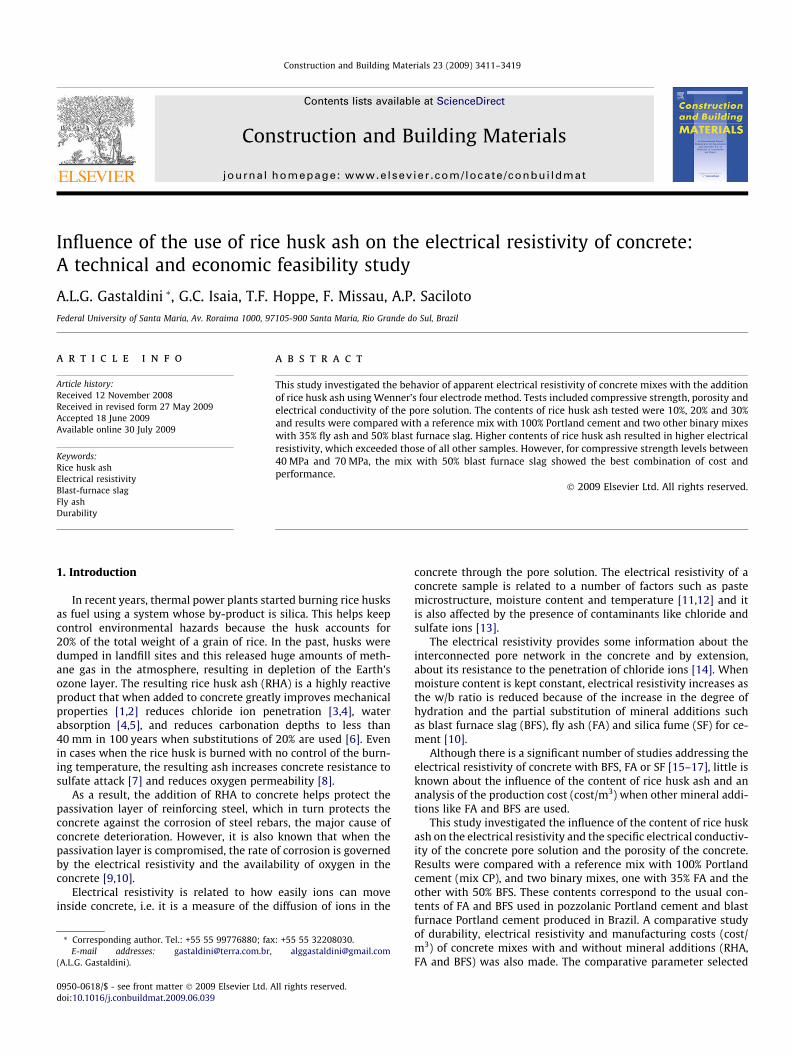
Construction and Building Materials 23 (2009) 3411–3419
Contents lists available at ScienceDirect
Construction and Building Materials
journal homepage: www.elsevier .com/locate /conbui ldmat
Influence of the use of rice husk ash on the electrical resistivity of concrete:A technical and economic feasibility study
A.L.G. Gastaldini *, G.C. Isaia, T.F. Hoppe, F. Missau, A.P. SacilotoFederal University of Santa Maria, Av. Roraima 1000, 97105-900 Santa Maria, Rio Grande do Sul, Brazil
a r t i c l e i n f o a b s t r a c t
Article history:Received 12 November 2008Received in revised form 27 May 2009Accepted 18 June 2009Available online 30 July 2009
Keywords:Rice husk ashElectrical resistivityBlast-furnace slagFly ashDurability
0950-0618/$ - see front matter � 2009 Elsevier Ltd. Adoi:10.1016/j.conbuildmat.2009.06.039
* Corresponding author. Tel.: +55 55 99776880; faxE-mail addresses: [email protected],
(A.L.G. Gastaldini).
This study investigated the behavior of apparent electrical resistivity of concrete mixes with the additionof rice husk ash using Wenner’s four electrode method. Tests included compressive strength, porosity andelectrical conductivity of the pore solution. The contents of rice husk ash tested were 10%, 20% and 30%and results were compared with a reference mix with 100% Portland cement and two other binary mixeswith 35% fly ash and 50% blast furnace slag. Higher contents of rice husk ash resulted in higher electricalresistivity, which exceeded those of all other samples. However, for compressive strength levels between40 MPa and 70 MPa, the mix with 50% blast furnace slag showed the best combination of cost andperformance.
� 2009 Elsevier Ltd. All rights reserved.
1. Introduction
In recent years, thermal power plants started burning rice husksas fuel using a system whose by-product is silica. This helps keepcontrol environmental hazards because the husk accounts for20% of the total weight of a grain of rice. In the past, husks weredumped in landfill sites and this released huge amounts of meth-ane gas in the atmosphere, resulting in depletion of the Earth’sozone layer. The resulting rice husk ash (RHA) is a highly reactiveproduct that when added to concrete greatly improves mechanicalproperties [1,2] reduces chloride ion penetration [3,4], waterabsorption [4,5], and reduces carbonation depths to less than40 mm in 100 years when substitutions of 20% are used [6]. Evenin cases when the rice husk is burned with no control of the burn-ing temperature, the resulting ash increases concrete resistance tosulfate attack [7] and reduces oxygen permeability [8].
As a result, the addition of RHA to concrete helps protect thepassivation layer of reinforcing steel, which in turn protects theconcrete against the corrosion of steel rebars, the major cause ofconcrete deterioration. However, it is also known that when thepassivation layer is compromised, the rate of corrosion is governedby the electrical resistivity and the availability of oxygen in theconcrete [9,10].
Electrical resistivity is related to how easily ions can moveinside concrete, i.e. it is a measure of the diffusion of ions in the
ll rights reserved.
: +55 55 [email protected]
concrete through the pore solution. The electrical resistivity of aconcrete sample is related to a number of factors such as pastemicrostructure, moisture content and temperature [11,12] and itis also affected by the presence of contaminants like chloride andsulfate ions [13].
The electrical resistivity provides some information about theinterconnected pore network in the concrete and by extension,about its resistance to the penetration of chloride ions [14]. Whenmoisture content is kept constant, electrical resistivity increases asthe w/b ratio is reduced because of the increase in the degree ofhydration and the partial substitution of mineral additions suchas blast furnace slag (BFS), fly ash (FA) and silica fume (SF) for ce-ment [10].
Although there is a significant number of studies addressing theelectrical resistivity of concrete with BFS, FA or SF [15–17], little isknown about the influence of the content of rice husk ash and ananalysis of the production cost (cost/m3) when other mineral addi-tions like FA and BFS are used.
This study investigated the influence of the content of rice huskash on the electrical resistivity and the specific electrical conductiv-ity of the concrete pore solution and the porosity of the concrete.Results were compared with a reference mix with 100% Portlandcement (mix CP), and two binary mixes, one with 35% FA and theother with 50% BFS. These contents correspond to the usual con-tents of FA and BFS used in pozzolanic Portland cement and blastfurnace Portland cement produced in Brazil. A comparative studyof durability, electrical resistivity and manufacturing costs (cost/m3) of concrete mixes with and without mineral additions (RHA,FA and BFS) was also made. The comparative parameter selected
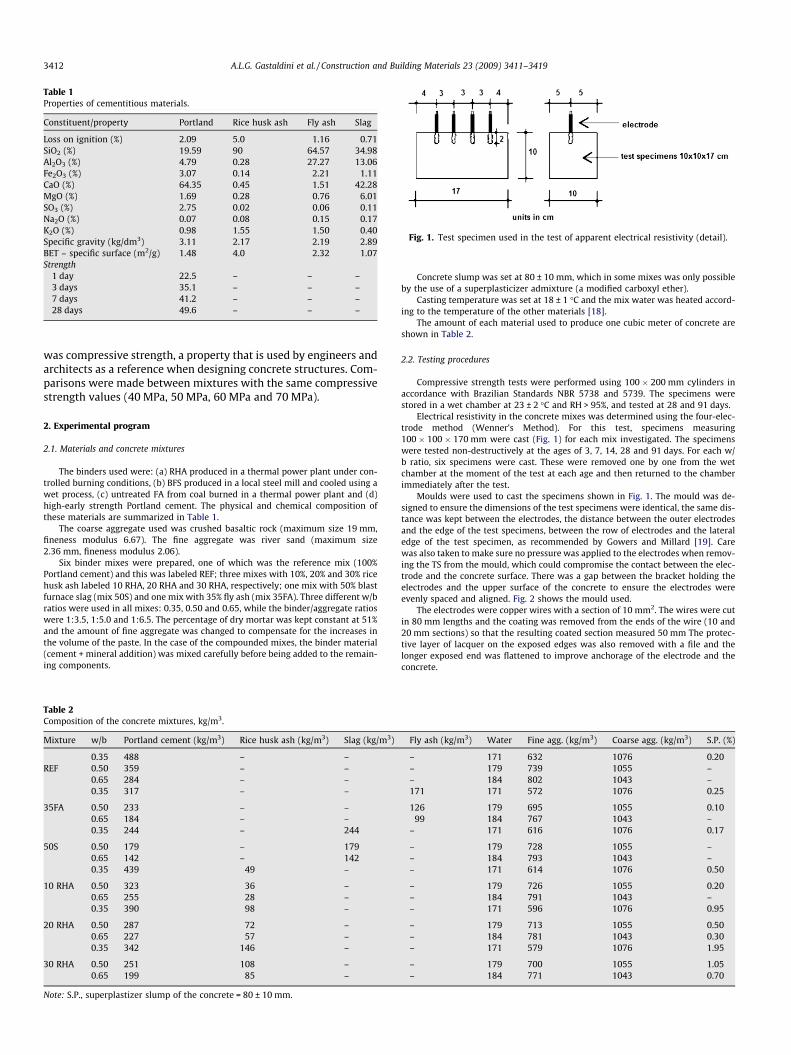
Table 1Properties of cementitious materials.
Constituent/property Portland Rice husk ash Fly ash Slag
Loss on ignition (%) 2.09 5.0 1.16 0.71SiO2 (%) 19.59 90 64.57 34.98Al2O3 (%) 4.79 0.28 27.27 13.06Fe2O3 (%) 3.07 0.14 2.21 1.11CaO (%) 64.35 0.45 1.51 42.28MgO (%) 1.69 0.28 0.76 6.01SO3 (%) 2.75 0.02 0.06 0.11Na2O (%) 0.07 0.08 0.15 0.17K2O (%) 0.98 1.55 1.50 0.40Specific gravity (kg/dm3) 3.11 2.17 2.19 2.89BET – specific surface (m2/g) 1.48 4.0 2.32 1.07Strength
1 day 22.5 – – –3 days 35.1 – – –7 days 41.2 – – –28 days 49.6 – – –
Fig. 1. Test specimen used in the test of apparent electrical resistivity (detail).
3412 A.L.G. Gastaldini et al. / Construction and Building Materials 23 (2009) 3411–3419
was compressive strength, a property that is used by engineers andarchitects as a reference when designing concrete structures. Com-parisons were made between mixtures with the same compressivestrength values (40 MPa, 50 MPa, 60 MPa and 70 MPa).
2. Experimental program
2.1. Materials and concrete mixtures
The binders used were: (a) RHA produced in a thermal power plant under con-trolled burning conditions, (b) BFS produced in a local steel mill and cooled using awet process, (c) untreated FA from coal burned in a thermal power plant and (d)high-early strength Portland cement. The physical and chemical composition ofthese materials are summarized in Table 1.
The coarse aggregate used was crushed basaltic rock (maximum size 19 mm,fineness modulus 6.67). The fine aggregate was river sand (maximum size2.36 mm, fineness modulus 2.06).
Six binder mixes were prepared, one of which was the reference mix (100%Portland cement) and this was labeled REF; three mixes with 10%, 20% and 30% ricehusk ash labeled 10 RHA, 20 RHA and 30 RHA, respectively; one mix with 50% blastfurnace slag (mix 50S) and one mix with 35% fly ash (mix 35FA). Three different w/bratios were used in all mixes: 0.35, 0.50 and 0.65, while the binder/aggregate ratioswere 1:3.5, 1:5.0 and 1:6.5. The percentage of dry mortar was kept constant at 51%and the amount of fine aggregate was changed to compensate for the increases inthe volume of the paste. In the case of the compounded mixes, the binder material(cement + mineral addition) was mixed carefully before being added to the remain-ing components.
Table 2Composition of the concrete mixtures, kg/m3.
Mixture w/b Portland cement (kg/m3) Rice husk ash (kg/m3) Slag (kg/m3)
0.35 488 – –REF 0.50 359 – –
0.65 284 – –0.35 317 – –
35FA 0.50 233 – –0.65 184 – –0.35 244 – 244
50S 0.50 179 – 1790.65 142 – 1420.35 439 49 –
10 RHA 0.50 323 36 –0.65 255 28 –0.35 390 98 –
20 RHA 0.50 287 72 –0.65 227 57 –0.35 342 146 –
30 RHA 0.50 251 108 –0.65 199 85 –
Note: S.P., superplastizer slump of the concrete = 80 ± 10 mm.
Concrete slump was set at 80 ± 10 mm, which in some mixes was only possibleby the use of a superplasticizer admixture (a modified carboxyl ether).
Casting temperature was set at 18 ± 1 �C and the mix water was heated accord-ing to the temperature of the other materials [18].
The amount of each material used to produce one cubic meter of concrete areshown in Table 2.
2.2. Testing procedures
Compressive strength tests were performed using 100 � 200 mm cylinders inaccordance with Brazilian Standards NBR 5738 and 5739. The specimens werestored in a wet chamber at 23 ± 2 �C and RH > 95%, and tested at 28 and 91 days.
Electrical resistivity in the concrete mixes was determined using the four-elec-trode method (Wenner’s Method). For this test, specimens measuring100 � 100 � 170 mm were cast (Fig. 1) for each mix investigated. The specimenswere tested non-destructively at the ages of 3, 7, 14, 28 and 91 days. For each w/b ratio, six specimens were cast. These were removed one by one from the wetchamber at the moment of the test at each age and then returned to the chamberimmediately after the test.
Moulds were used to cast the specimens shown in Fig. 1. The mould was de-signed to ensure the dimensions of the test specimens were identical, the same dis-tance was kept between the electrodes, the distance between the outer electrodesand the edge of the test specimens, between the row of electrodes and the lateraledge of the test specimen, as recommended by Gowers and Millard [19]. Carewas also taken to make sure no pressure was applied to the electrodes when remov-ing the TS from the mould, which could compromise the contact between the elec-trode and the concrete surface. There was a gap between the bracket holding theelectrodes and the upper surface of the concrete to ensure the electrodes wereevenly spaced and aligned. Fig. 2 shows the mould used.
The electrodes were copper wires with a section of 10 mm2. The wires were cutin 80 mm lengths and the coating was removed from the ends of the wire (10 and20 mm sections) so that the resulting coated section measured 50 mm The protec-tive layer of lacquer on the exposed edges was also removed with a file and thelonger exposed end was flattened to improve anchorage of the electrode and theconcrete.
Fly ash (kg/m3) Water Fine agg. (kg/m3) Coarse agg. (kg/m3) S.P. (%)
– 171 632 1076 0.20– 179 739 1055 –– 184 802 1043 –171 171 572 1076 0.25
126 179 695 1055 0.1099 184 767 1043 –
– 171 616 1076 0.17
– 179 728 1055 –– 184 793 1043 –– 171 614 1076 0.50
– 179 726 1055 0.20– 184 791 1043 –– 171 596 1076 0.95
– 179 713 1055 0.50– 184 781 1043 0.30– 171 579 1076 1.95
– 179 700 1055 1.05– 184 771 1043 0.70
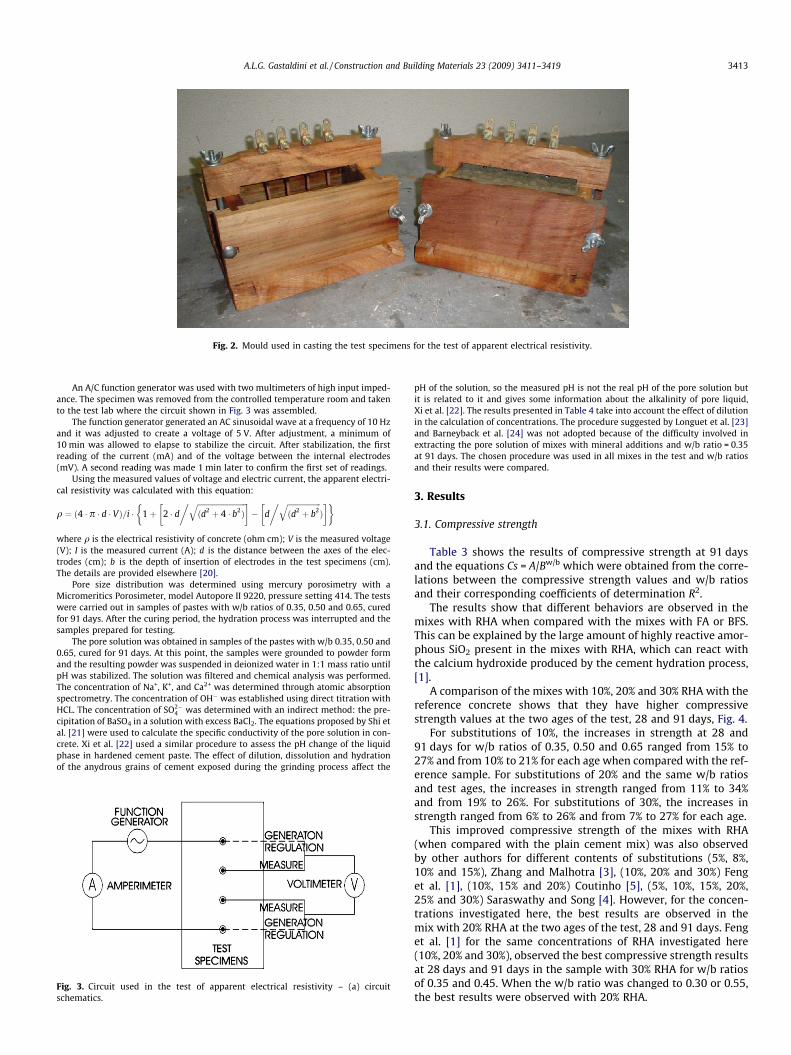
Fig. 2. Mould used in casting the test specimens for the test of apparent electrical resistivity.
A.L.G. Gastaldini et al. / Construction and Building Materials 23 (2009) 3411–3419 3413
An A/C function generator was used with two multimeters of high input imped-ance. The specimen was removed from the controlled temperature room and takento the test lab where the circuit shown in Fig. 3 was assembled.
The function generator generated an AC sinusoidal wave at a frequency of 10 Hzand it was adjusted to create a voltage of 5 V. After adjustment, a minimum of10 min was allowed to elapse to stabilize the circuit. After stabilization, the firstreading of the current (mA) and of the voltage between the internal electrodes(mV). A second reading was made 1 min later to confirm the first set of readings.
Using the measured values of voltage and electric current, the apparent electri-cal resistivity was calculated with this equation:
q ¼ ð4 � p � d � VÞ=i � 1þ 2 � dffiffiffiffiffiffiffiffiffiffiffiffiffiffiffiffiffiffiffiffiffiffiffiffiffiffiðd2 þ 4 � b2Þ
q� �� d
ffiffiffiffiffiffiffiffiffiffiffiffiffiffiffiffiffiffiðd2 þ b2
qÞ
� �� ���
where q is the electrical resistivity of concrete (ohm cm); V is the measured voltage(V); I is the measured current (A); d is the distance between the axes of the elec-trodes (cm); b is the depth of insertion of electrodes in the test specimens (cm).The details are provided elsewhere [20].
Pore size distribution was determined using mercury porosimetry with aMicromeritics Porosimeter, model Autopore II 9220, pressure setting 414. The testswere carried out in samples of pastes with w/b ratios of 0.35, 0.50 and 0.65, curedfor 91 days. After the curing period, the hydration process was interrupted and thesamples prepared for testing.
The pore solution was obtained in samples of the pastes with w/b 0.35, 0.50 and0.65, cured for 91 days. At this point, the samples were grounded to powder formand the resulting powder was suspended in deionized water in 1:1 mass ratio untilpH was stabilized. The solution was filtered and chemical analysis was performed.The concentration of Na+, K+, and Ca2+ was determined through atomic absorptionspectrometry. The concentration of OH� was established using direct titration withHCL. The concentration of SO2�
4 was determined with an indirect method: the pre-cipitation of BaSO4 in a solution with excess BaCl2. The equations proposed by Shi etal. [21] were used to calculate the specific conductivity of the pore solution in con-crete. Xi et al. [22] used a similar procedure to assess the pH change of the liquidphase in hardened cement paste. The effect of dilution, dissolution and hydrationof the anydrous grains of cement exposed during the grinding process affect the
Fig. 3. Circuit used in the test of apparent electrical resistivity – (a) circuitschematics.
pH of the solution, so the measured pH is not the real pH of the pore solution butit is related to it and gives some information about the alkalinity of pore liquid,Xi et al. [22]. The results presented in Table 4 take into account the effect of dilutionin the calculation of concentrations. The procedure suggested by Longuet et al. [23]and Barneyback et al. [24] was not adopted because of the difficulty involved inextracting the pore solution of mixes with mineral additions and w/b ratio = 0.35at 91 days. The chosen procedure was used in all mixes in the test and w/b ratiosand their results were compared.
3. Results
3.1. Compressive strength
Table 3 shows the results of compressive strength at 91 daysand the equations Cs = A/Bw/b which were obtained from the corre-lations between the compressive strength values and w/b ratiosand their corresponding coefficients of determination R2.
The results show that different behaviors are observed in themixes with RHA when compared with the mixes with FA or BFS.This can be explained by the large amount of highly reactive amor-phous SiO2 present in the mixes with RHA, which can react withthe calcium hydroxide produced by the cement hydration process,[1].
A comparison of the mixes with 10%, 20% and 30% RHA with thereference concrete shows that they have higher compressivestrength values at the two ages of the test, 28 and 91 days, Fig. 4.
For substitutions of 10%, the increases in strength at 28 and91 days for w/b ratios of 0.35, 0.50 and 0.65 ranged from 15% to27% and from 10% to 21% for each age when compared with the ref-erence sample. For substitutions of 20% and the same w/b ratiosand test ages, the increases in strength ranged from 11% to 34%and from 19% to 26%. For substitutions of 30%, the increases instrength ranged from 6% to 26% and from 7% to 27% for each age.
This improved compressive strength of the mixes with RHA(when compared with the plain cement mix) was also observedby other authors for different contents of substitutions (5%, 8%,10% and 15%), Zhang and Malhotra [3], (10%, 20% and 30%) Fenget al. [1], (10%, 15% and 20%) Coutinho [5], (5%, 10%, 15%, 20%,25% and 30%) Saraswathy and Song [4]. However, for the concen-trations investigated here, the best results are observed in themix with 20% RHA at the two ages of the test, 28 and 91 days. Fenget al. [1] for the same concentrations of RHA investigated here(10%, 20% and 30%), observed the best compressive strength resultsat 28 days and 91 days in the sample with 30% RHA for w/b ratiosof 0.35 and 0.45. When the w/b ratio was changed to 0.30 or 0.55,the best results were observed with 20% RHA.
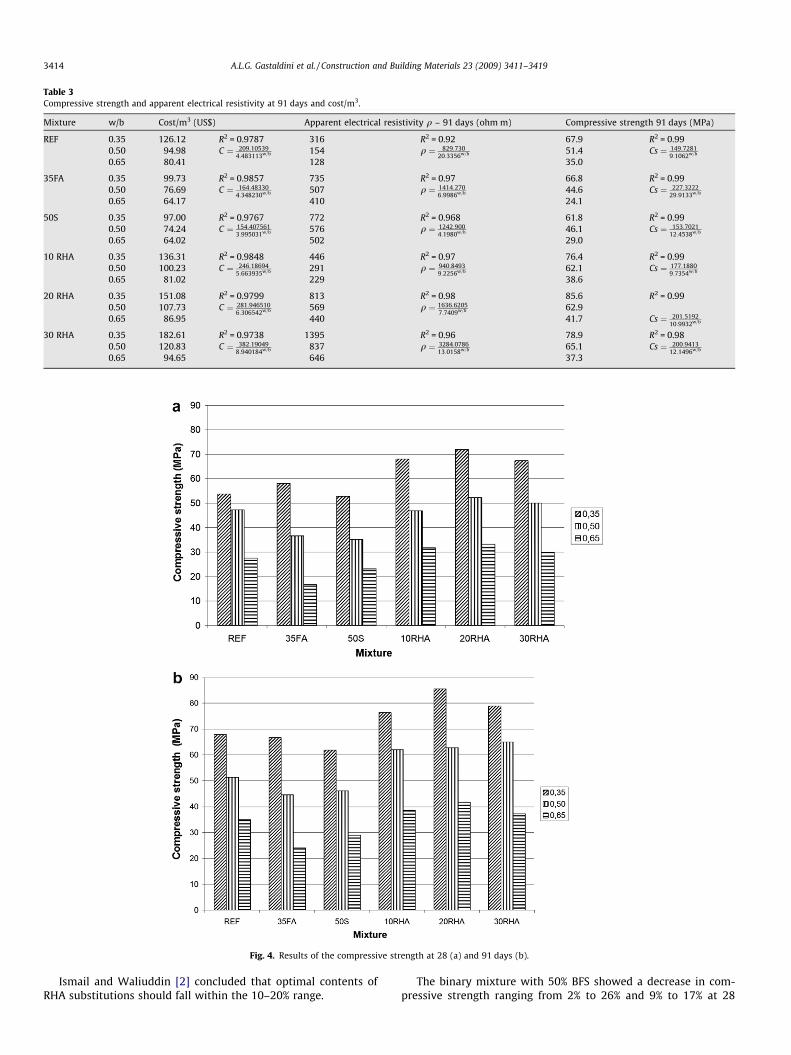
Table 3Compressive strength and apparent electrical resistivity at 91 days and cost/m3.
Mixture w/b Cost/m3 (US$) Apparent electrical resistivity q – 91 days (ohm m) Compressive strength 91 days (MPa)
REF 0.35 126.12 R2 = 0.9787 316 R2 = 0.92 67.9 R2 = 0.990.50 94.98 C ¼ 209:10539
4:483113w=b 154 q ¼ 829:73020:3356w=b 51.4 Cs ¼ 149:7281
9:1062w=b
0.65 80.41 128 35.0
35FA 0.35 99.73 R2 = 0.9857 735 R2 = 0.97 66.8 R2 = 0.990.50 76.69 C ¼ 164:48330
4:348230w=b 507 q ¼ 1414:2706:9986w=b 44.6 Cs ¼ 227:3222
29:9133w=b
0.65 64.17 410 24.1
50S 0.35 97.00 R2 = 0.9767 772 R2 = 0.968 61.8 R2 = 0.990.50 74.24 C ¼ 154:407561
3:995031w=b 576 q ¼ 1242:9004:1980w=b 46.1 Cs ¼ 153:7021
12:4538w=b
0.65 64.02 502 29.0
10 RHA 0.35 136.31 R2 = 0.9848 446 R2 = 0.97 76.4 R2 = 0.990.50 100.23 C ¼ 246:18694
5:663935w=b 291 q ¼ 940:84939:2256w=b 62.1 Cs ¼ 177:1880
9:7354w=b
0.65 81.02 229 38.6
20 RHA 0.35 151.08 R2 = 0.9799 813 R2 = 0.98 85.6 R2 = 0.990.50 107.73 C ¼ 281:946510
6:306542w=b 569 q ¼ 1636:62057:7409w=b 62.9
0.65 86.95 440 41.7 Cs ¼ 201:519210:9932w=b
30 RHA 0.35 182.61 R2 = 0.9738 1395 R2 = 0.96 78.9 R2 = 0.980.50 120.83 C ¼ 382:19049
8:940184w=b 837 q ¼ 3284:078613:0158w=b 65.1 Cs ¼ 200:9413
12:1496w=b
0.65 94.65 646 37.3
Fig. 4. Results of the compressive strength at 28 (a) and 91 days (b).
3414 A.L.G. Gastaldini et al. / Construction and Building Materials 23 (2009) 3411–3419
Ismail and Waliuddin [2] concluded that optimal contents ofRHA substitutions should fall within the 10–20% range.
The binary mixture with 50% BFS showed a decrease in com-pressive strength ranging from 2% to 26% and 9% to 17% at 28
A.L.G. Gastaldini et al. / Construction and Building Materials 23 (2009) 3411–3419 3415
and 91 days, respectively, when compared with the referencesample.
The mixture with FA showed an increase of 8% in compressivestrength at 28 days for a w/b ratio of 0.35. However, with w/b ra-tios of 0.50 and 0.65, there were decreases in compressive strengththat ranged from 23% to 39% at 28 days and from 2% to 31% at91 days.
3.2. Electrical resistivity
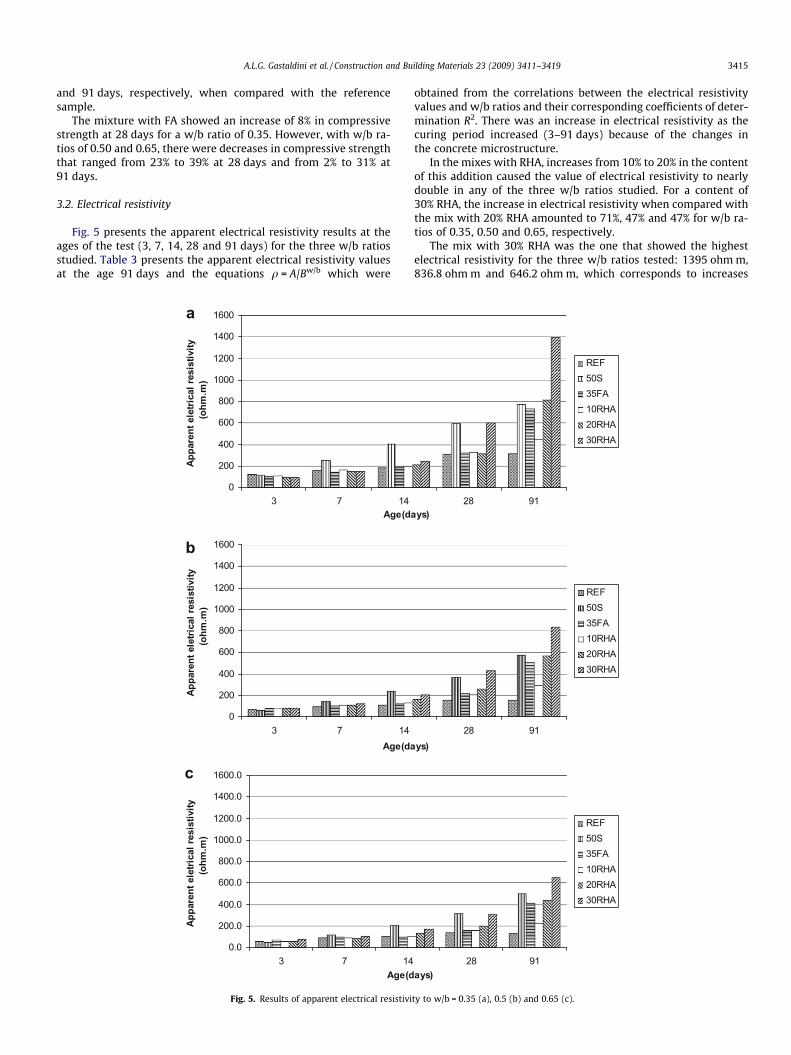
Fig. 5 presents the apparent electrical resistivity results at theages of the test (3, 7, 14, 28 and 91 days) for the three w/b ratiosstudied. Table 3 presents the apparent electrical resistivity valuesat the age 91 days and the equations q = A/Bw/b which were
0
200
400
600
800
1000
1200
1400
1600
3 7 14
Appa
rent
ele
trica
l res
istiv
ity
(ohm
.m)
0
200
400
600
800
1000
1200
1400
1600
3 7 14Age(da
Age(da
Age(d
Appa
rent
ele
trica
l res
istiv
ity
(o
hm.m
)
0.0
200.0
400.0
600.0
800.0
1000.0
1200.0
1400.0
1600.0
3 7 14
Appa
rent
ele
trica
l res
istiv
ity
(o
hm.m
)
a
b
c
Fig. 5. Results of apparent electrical resistivi
obtained from the correlations between the electrical resistivityvalues and w/b ratios and their corresponding coefficients of deter-mination R2. There was an increase in electrical resistivity as thecuring period increased (3–91 days) because of the changes inthe concrete microstructure.
In the mixes with RHA, increases from 10% to 20% in the contentof this addition caused the value of electrical resistivity to nearlydouble in any of the three w/b ratios studied. For a content of30% RHA, the increase in electrical resistivity when compared withthe mix with 20% RHA amounted to 71%, 47% and 47% for w/b ra-tios of 0.35, 0.50 and 0.65, respectively.
The mix with 30% RHA was the one that showed the highestelectrical resistivity for the three w/b ratios tested: 1395 ohm m,836.8 ohm m and 646.2 ohm m, which corresponds to increases
28 91
REF50S35FA10RHA20RHA30RHA
28 91ys)
ys)
ays)
REF50S35FA10RHA20RHA30RHA
28 91
REF50S35FA10RHA20RHA30RHA
ty to w/b = 0.35 (a), 0.5 (b) and 0.65 (c).
3416 A.L.G. Gastaldini et al. / Construction and Building Materials 23 (2009) 3411–3419
of 340%, 442% and 404% for the w/b ratios of 0.35, 0.50 and 0.65when compared with the reference sample. The same mix showedthe greatest increase in electrical resistivity from 3 to 91 days –1460%, 1008% and 867% for the same set of w/b ratios. It is believedthat the higher values of resistivity observed in the mixes withRHA is a result of the changes in the concrete microstructure pro-moted by this addition.
A partial substitution of 35% FA for cement resulted in increasesof 132%, 273% and 220% in electrical resistivity at 91 days for thethree w/b ratios tested when compared with the reference mix-ture. The mixture with 50% BFS showed increases of 144%, 273%and 291% for the same w/b ratios.
The mixture with 50% BFS showed a greater increase in electri-cal resistivity from 3 to 91 days as the w/b ratio also increased. Inthe other mixtures investigated, the opposite behavior wasobserved.
Other authors [12,15,17,20,25] also observed higher values ofelectrical resistivity of the mixtures with mineral additions whencompared with the reference sample, particularly when the curingtime and the content of the substitution was increased. Wee [17]attributes this higher resistivity to the lower ionic conductivity ofthe pore solution (OH� ions) and the denser packing of the con-crete microstructure.
3.3. Electrical conductivity and porosity
Table 4 shows the values of the electrical conductivity of thepore solution calculated from the equations proposed by Shi etal. [21], as well as the total mercury intrusion volume. For all mix-tures tested, an increase in w/b ratios resulted in a decrease in elec-trical conductivity, a phenomenon that can be attributed to thelower concentration of ions in the pore solution. In addition, highercontents of RHA substitutions for cement also resulted in lowerelectrical conductivity.
For the reference mixture (REF) and mixes 10 RHA, 20 RHAand 30 RHA, these values ranged from 2.101/ohm cm to 2.834/ohm cm, from 2.076/ohm cm to 2.525/ohm cm, from 1.929/ohm cm to 2.371/ohm cm and from 1.837/ohm cm to 2.204/ohm cm, respectively, when the w/b ratio changed from 0.65 to0.35.
In the mixtures with 50% BFS (50S), the values of electrical con-ductivity changed from 0.951/ohm cm to 1.504/ohm cm and in thesample with 35% FA (35FA), they increased from 0.870/ohm cm to
Table 4Electrical conductivity of pore solution, mercury intrusion volume and pore-size distribut
Mixture w/b Electrical conductivity r (1/ohm cm) In
REF 0.35 2.834 0.0.50 2.504 0.0.65 2.101 0.
35FA 0.35 1.719 0.0.50 1.193 0.0.65 0.870 0.
50S 0.35 1.504 0.0.50 1.191 0.0.65 0.951 0.
10 RHA 0.35 2.525 0.0.50 2.294 0.0.65 2.076 0.
20 RHA 0.35 2.371 0.0.50 2.137 0.0.65 1.929 0.
30 RHA 0.35 2.204 0.0.50 1.933 0.0.65 1.897 0.
1.719/ohm cm, respectively, when the w/b ratio changed from 0.65to 0.35.
All mixtures with mineral additions showed lower electricalconductivity values when compared with the reference sample.This was more evident in samples 35FA (35% FA) and 50S (50%BFS) for all w/b ratios studied and can be explained by the changesin the pore solution. The same behavior was observed by Shi et al.[21], by Dal Ri [26], who investigated samples with 50% RHA, 70%BFS and 50% FA, and by Gomes [27], who used binary binder mix-tures with 20% RHA, 70% BFS and 20% FA.
When mineral additions are used as substitutions for cement,pore sizes become smaller. When compared with the referencemixture, for the same w/b ratios, the mixtures with mineral addi-tions show a higher total volume of mercury intrusion. However,most of this volume is concentrated in pores whose size is smallerthan 50 nm, which explains the smaller pore size as shown in Table4. The results show that there is no single relationship betweencompressive strength and total volume of mercury intrusion alsoreported by other researchers [28,29].
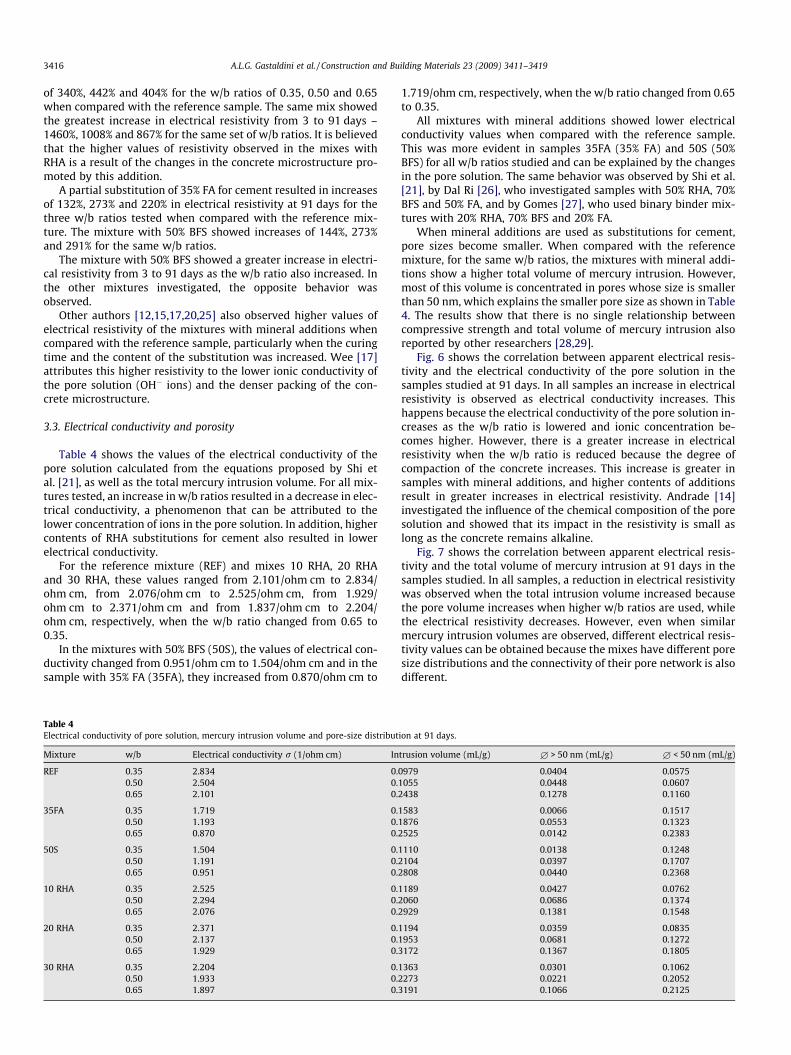
Fig. 6 shows the correlation between apparent electrical resis-tivity and the electrical conductivity of the pore solution in thesamples studied at 91 days. In all samples an increase in electricalresistivity is observed as electrical conductivity increases. Thishappens because the electrical conductivity of the pore solution in-creases as the w/b ratio is lowered and ionic concentration be-comes higher. However, there is a greater increase in electricalresistivity when the w/b ratio is reduced because the degree ofcompaction of the concrete increases. This increase is greater insamples with mineral additions, and higher contents of additionsresult in greater increases in electrical resistivity. Andrade [14]investigated the influence of the chemical composition of the poresolution and showed that its impact in the resistivity is small aslong as the concrete remains alkaline.
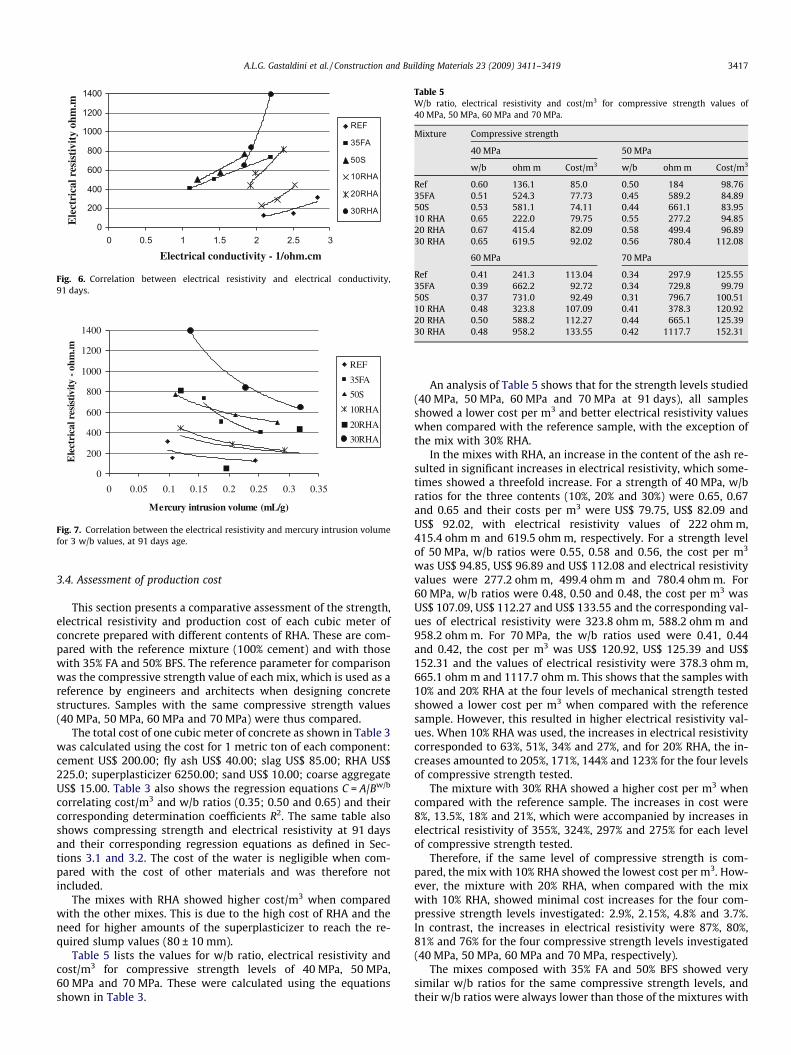
Fig. 7 shows the correlation between apparent electrical resis-tivity and the total volume of mercury intrusion at 91 days in thesamples studied. In all samples, a reduction in electrical resistivitywas observed when the total intrusion volume increased becausethe pore volume increases when higher w/b ratios are used, whilethe electrical resistivity decreases. However, even when similarmercury intrusion volumes are observed, different electrical resis-tivity values can be obtained because the mixes have different poresize distributions and the connectivity of their pore network is alsodifferent.
ion at 91 days.
trusion volume (mL/g) £ > 50 nm (mL/g) £ < 50 nm (mL/g)
0979 0.0404 0.05751055 0.0448 0.06072438 0.1278 0.1160
1583 0.0066 0.15171876 0.0553 0.13232525 0.0142 0.2383
1110 0.0138 0.12482104 0.0397 0.17072808 0.0440 0.2368
1189 0.0427 0.07622060 0.0686 0.13742929 0.1381 0.1548
1194 0.0359 0.08351953 0.0681 0.12723172 0.1367 0.1805
1363 0.0301 0.10622273 0.0221 0.20523191 0.1066 0.2125
0
200
400
600
800
1000
1200
1400
0 0.5 1 1.5 2 2.5 3
Electrical conductivity - 1/ohm.cm
Ele
ctri
cal r
esis
tivi
ty o
hm.m
REF
35FA
50S
10RHA
20RHA
30RHA
Fig. 6. Correlation between electrical resistivity and electrical conductivity,91 days.
0
200
400
600
800
1000
1200
1400
0 0.05 0.1 0.15 0.2 0.25 0.3 0.35
Mercury intrusion volume (mL/g)
Ele
ctri
cal r
esis
tivity
- oh
m.m
REF
35FA
50S
10RHA
20RHA
30RHA
Fig. 7. Correlation between the electrical resistivity and mercury intrusion volumefor 3 w/b values, at 91 days age.
Table 5W/b ratio, electrical resistivity and cost/m3 for compressive strength values of40 MPa, 50 MPa, 60 MPa and 70 MPa.
Mixture Compressive strength
40 MPa 50 MPa
w/b ohm m Cost/m3 w/b ohm m Cost/m3
Ref 0.60 136.1 85.0 0.50 184 98.7635FA 0.51 524.3 77.73 0.45 589.2 84.8950S 0.53 581.1 74.11 0.44 661.1 83.9510 RHA 0.65 222.0 79.75 0.55 277.2 94.8520 RHA 0.67 415.4 82.09 0.58 499.4 96.8930 RHA 0.65 619.5 92.02 0.56 780.4 112.08
60 MPa 70 MPa
Ref 0.41 241.3 113.04 0.34 297.9 125.5535FA 0.39 662.2 92.72 0.34 729.8 99.7950S 0.37 731.0 92.49 0.31 796.7 100.5110 RHA 0.48 323.8 107.09 0.41 378.3 120.9220 RHA 0.50 588.2 112.27 0.44 665.1 125.3930 RHA 0.48 958.2 133.55 0.42 1117.7 152.31
A.L.G. Gastaldini et al. / Construction and Building Materials 23 (2009) 3411–3419 3417
3.4. Assessment of production cost
This section presents a comparative assessment of the strength,electrical resistivity and production cost of each cubic meter ofconcrete prepared with different contents of RHA. These are com-pared with the reference mixture (100% cement) and with thosewith 35% FA and 50% BFS. The reference parameter for comparisonwas the compressive strength value of each mix, which is used as areference by engineers and architects when designing concretestructures. Samples with the same compressive strength values(40 MPa, 50 MPa, 60 MPa and 70 MPa) were thus compared.
The total cost of one cubic meter of concrete as shown in Table 3was calculated using the cost for 1 metric ton of each component:cement US$ 200.00; fly ash US$ 40.00; slag US$ 85.00; RHA US$225.0; superplasticizer 6250.00; sand US$ 10.00; coarse aggregateUS$ 15.00. Table 3 also shows the regression equations C = A/Bw/b
correlating cost/m3 and w/b ratios (0.35; 0.50 and 0.65) and theircorresponding determination coefficients R2. The same table alsoshows compressing strength and electrical resistivity at 91 daysand their corresponding regression equations as defined in Sec-tions 3.1 and 3.2. The cost of the water is negligible when com-pared with the cost of other materials and was therefore notincluded.
The mixes with RHA showed higher cost/m3 when comparedwith the other mixes. This is due to the high cost of RHA and theneed for higher amounts of the superplasticizer to reach the re-quired slump values (80 ± 10 mm).
Table 5 lists the values for w/b ratio, electrical resistivity andcost/m3 for compressive strength levels of 40 MPa, 50 MPa,60 MPa and 70 MPa. These were calculated using the equationsshown in Table 3.
An analysis of Table 5 shows that for the strength levels studied(40 MPa, 50 MPa, 60 MPa and 70 MPa at 91 days), all samplesshowed a lower cost per m3 and better electrical resistivity valueswhen compared with the reference sample, with the exception ofthe mix with 30% RHA.
In the mixes with RHA, an increase in the content of the ash re-sulted in significant increases in electrical resistivity, which some-times showed a threefold increase. For a strength of 40 MPa, w/bratios for the three contents (10%, 20% and 30%) were 0.65, 0.67and 0.65 and their costs per m3 were US$ 79.75, US$ 82.09 andUS$ 92.02, with electrical resistivity values of 222 ohm m,415.4 ohm m and 619.5 ohm m, respectively. For a strength levelof 50 MPa, w/b ratios were 0.55, 0.58 and 0.56, the cost per m3
was US$ 94.85, US$ 96.89 and US$ 112.08 and electrical resistivityvalues were 277.2 ohm m, 499.4 ohm m and 780.4 ohm m. For60 MPa, w/b ratios were 0.48, 0.50 and 0.48, the cost per m3 wasUS$ 107.09, US$ 112.27 and US$ 133.55 and the corresponding val-ues of electrical resistivity were 323.8 ohm m, 588.2 ohm m and958.2 ohm m. For 70 MPa, the w/b ratios used were 0.41, 0.44and 0.42, the cost per m3 was US$ 120.92, US$ 125.39 and US$152.31 and the values of electrical resistivity were 378.3 ohm m,665.1 ohm m and 1117.7 ohm m. This shows that the samples with10% and 20% RHA at the four levels of mechanical strength testedshowed a lower cost per m3 when compared with the referencesample. However, this resulted in higher electrical resistivity val-ues. When 10% RHA was used, the increases in electrical resistivitycorresponded to 63%, 51%, 34% and 27%, and for 20% RHA, the in-creases amounted to 205%, 171%, 144% and 123% for the four levelsof compressive strength tested.
The mixture with 30% RHA showed a higher cost per m3 whencompared with the reference sample. The increases in cost were8%, 13.5%, 18% and 21%, which were accompanied by increases inelectrical resistivity of 355%, 324%, 297% and 275% for each levelof compressive strength tested.
Therefore, if the same level of compressive strength is com-pared, the mix with 10% RHA showed the lowest cost per m3. How-ever, the mixture with 20% RHA, when compared with the mixwith 10% RHA, showed minimal cost increases for the four com-pressive strength levels investigated: 2.9%, 2.15%, 4.8% and 3.7%.In contrast, the increases in electrical resistivity were 87%, 80%,81% and 76% for the four compressive strength levels investigated(40 MPa, 50 MPa, 60 MPa and 70 MPa, respectively).
The mixes composed with 35% FA and 50% BFS showed verysimilar w/b ratios for the same compressive strength levels, andtheir w/b ratios were always lower than those of the mixtures with
Table 6Correlation between aggression class and concrete quality.a
Concrete Type Aggressiveness class
I II III IV
w/b Ratio, by weight CA 60.65 60.60 60.55 60.45CP 60.60 60.55 60.50 60.45
Concrete strength level (MPa) CA PC20 PC25 PC30 PC40CP PC25 PC30 PC35 PC40
Cement content per cubic meter of concrete (kg/m3) CA and CP P260 P280 P320 P360
CA – Components and structural elements in reinforced concrete.CP – Components and structural elements in prestressed concrete.
a Brazilian Standard NBR 12655 C20 = 20 MPa.
3418 A.L.G. Gastaldini et al. / Construction and Building Materials 23 (2009) 3411–3419
RHA. Their cost per m3 was very similar for all compressivestrength values studied, while their electrical resistivity was thehighest of all mixes with the exception of the mix with 30% RHA.When compared with the reference sample, the mixes with 35%FA and 50% BFS showed cost reductions of 85%, 14%, 18%, 20%and 12.8%, 15%, 18% and 20% for the same compressive strengthvalues, respectively.
Brazilian Standard NBR 12655 [30] recommends the adoption ofthe minimum requirements presented in Table 6 in situationswhere no tests can be used to check the strength, durability andperformance of a structure in relation to the environment it is de-signed for. These requirements are based on a strong correlationbetween w/b ratios, compressive strength and durability. In this ta-ble, aggressiveness classes I, II, III and IV represent weak, moderate,severe and extremely severe aggressive environments, and the riskof corrosion is classified as insignificant, small, high and extremelyhigh.
The mixtures with RHA showed the highest w/b ratios and forcompressive strength values of 40 MPa and 50 MPa, the w/b ratiosobtained are suitable for weak or moderately aggressive environ-ments, respectively. For strength values of 60 MPa and 70 MPa, Ta-ble 6 shows that these samples can be used in severe andextremely severe aggressive environments.
The mixtures with 35% FA (35FA) and 50% BFS (50S) showed thelowest cost per m3 and w/b ratios overall, in addition to high elec-trical resistivity values. For a strength level of 40 MPa, their w/b ra-tios are suitable for highly aggressive environments. For the otherstrength levels studied, these samples can be used in extremelyhigh aggressive conditions.
4. Conclusions
For the concrete tested in this study, it was found that:
� For similar w/b and slump values, the mixes with 10%, 20% and30% RHA showed higher compressive strength values whencompared with the reference mix (100% Portland cement) at28 and 91 days. The same was true when they were comparedwith the mixes with 35% FA and 50% BFS.Because of their larger specific surface, the mixes with RHArequire higher additions of superplasticizer than the other mix-tures in the study, and this contributed to the higher cost inthese mixtures.In the study, the best compressive strength behavior wasobtained in the mixture with 20% RHA.
� For identical w/b ratios, all mixes with mineral additions dis-played much higher electrical resistivity values than those ofthe reference sample. In the mixes with RHA, the increase inthe content of RHA resulted in higher values of apparent electri-cal resistivity, as well as lower values of electrical conductivity
and a larger proportion of small pores. When the contents ofRHA increased from 10% to 20% of RHA for a similar w/b ratio,there was an increase of almost 100% in the values of electricalresistivity.
� For identical compressive strength values (from 40 MPa to70 MPa), the mixes with 10% and 20% RHA showed lower costsper m3 when compared with the reference sample, in additionto showing higher electrical resistivity values.
� The mixes with 50% slag, 35% fly ash, 20% and 30% RHA and w/b = 0.65 showed higher electrical resistivity when compared tothe reference mix with w/b = 0.35 (59%, 31%, 39% and 104%,respectively). None of the applicable technical standards (NBR12655, ACI [31] or CEB-FIP Model [32] for Concrete Structureswould rate as ‘durable’ a concrete with w/b = 0.65. It seems thatusing electrical resistivity values as a variable to estimate dura-bility may be risky.
� Of all mixes with the same compressive strength value investi-gated, the one that offered the best combination of electricalresistivity and cost was the one with 50% BFS, followed by themixture with 35% FA.
Acknowledgements
The authors would like to acknowledge the following for theirsupport: CNPq for the financial support and initiation researchscholarships; FAPERGS for the initiation research scholarship of-fered; and the companies Cimento MIZU, BK Energia, Reitex Indú-stria e Artefatos de Concreto and Master Builders for the materialssupplied.
References
[1] Feng Q, Yamamichi H, Shoya M, Sugita Shuichi. Efficiency of highly active ricehus ash on the high-strength concrete. In: 11th International congress on thechemistry of cement Durban, 2003.
[2] Ismail MS, Waliuddin AM. Effect of rice husk ash on high strength concrete.Constr Build Mater 1996;10(7):521–6.
[3] Zhang Min-Hong, Malhotra VM. High-performance concrete incorporating ricehusk ash as a supplementary cementing material. ACI Mater J1996;93(6):629–36.
[4] Saraswathy V, Song HW. Corrosion performance of rice husk ash blendedconcrete. Constr Build Mater 2007;21:1779–84.
[5] Coutinho JS. The combined benefits of CPF and RHA in improving the durabilityf concrete structures. Cem Concr Compos 2003;25:51–9.
[6] Gastaldini ALG, Isaia GC, Gomes NS, Sperb JEK. Chloride penetration andcarbonation in concrete with rice husk ash and chemical activators. Cem ConcrCompos 2007;27.
[7] GastaldiniI ALG, Isaia GC. Comportamento de argamassas com adiçõesminerais submetidas ao ataque de sulfato de sódio. In: ENTAC/98, 1998,FLORIANOPOLIS – SC. Anais do VII ENTAC/98, vol. 1. Florianópolis, SC:Associação Nacional de Tecnologia do Ambiente Construído; 1998. p. 45–54.
[8] Frizzo BT, Isaia GC, GastaldiniI ALG. Influência do teor e da finura de misturaspozolânicas na permeabilidade do concreto ao oxigênio, em igualdade deresistência à compressão. In: XXX Jornadas Sul-Americanas de EngenhariaEstrutural, 2002, Brasíllia – DF. Anais das XXX Jornadas Sul-Americanas deEngenharia Estrutural, vol. 1; 2002. p. 246.
A.L.G. Gastaldini et al. / Construction and Building Materials 23 (2009) 3411–3419 3419
[9] Gj£rv OE, et al. Electrical resistivity of concrete in the oceans. In: Proceedings ofthe 9th annual offshore technology conference, Houston, Texas; 1997. p. 581–8.
[10] Polder RB. Test methods for on site measurement of resistivity of concrete – aRILEM TC-154 technical recommendation. Constr Build Mater2001;15:125–31.
[11] Hunkeler F. The resistivity of pore water solution – a decisive parameter ofrebar corrosion and repair methods. Constr Build Mater 1996;10(5):381–9.
[12] Hope BB, Ip AK. Corrosion and electrical impedance in concrete. Cem Concr Res1985;15(3):525–34.
[13] Saleem M, Shameem M, Hussain SE, Maslehudddin M. Effect of moisture,chloride and sulphate contamination on the electrical resistivity of Portlandcement concrete. Constr Build Mater 1996;10(3):209–14.
[14] Andrade C. Model for prediction of reinforced concrete service life based onelectrical resistivity. IBRACON Mater J 2005;1(1):1–5.
[15] Smith KM, Schokker AJ, Tikalsky P. Performance of supplementarycementitious materials in concrete resistivity and corrosion monitoringevaluations. ACI Mater J 2004;101(5):385–90.
[16] Hope BB, Ip AKC. Corrosion of steel in concrete made with slag cement. ACIMater J 1987;84(6):525–31.
[17] Wee TH, Suryavanshi AK, Tin SS. Evaluation of rapid chloride permeability test(RCPT) results for concrete containing mineral admixtures. ACI Mater J2000;97(2):221–32.
[18] Mehta PK, Monteiro PJM. Concreto: estrutura, propriedades e materiais. SãoPaulo: Pini; 1994.
[19] Gowers KR, Millard SG. Measurement of concrete resistivity for assessment ofcorrosion severity of steel using Wenner technique. ACI Mater J1999;96(5):536–41.
[20] Abreu AG. The effect of mineral additions on the electrical resitivity ofconventional concrete. Porto Alegre. Master’s thesis, Universidade Federal doRio Grande do Sul.; 1998. 129p. (Supervisor: Professora Denise CarpenaCoitinho Dal Molin).
[21] Shi C, Stegemann JA, Caldwell R. Effect of supplementary cementing materialson the specific conductivity of pore solution and its implications on the rapid
chloride permeability test (AASHTO T 277 and ASTM C1202) results. ACI MaterJ 1998;95(4).
[22] Xi Y, Siemer DD, Scheetz BE. Strength development, hydration reaction andpore structure of autoclaved slag cement with added silica fume. Cem ConcrRes 1997;27:75–82.
[23] Longuet P, Burglen LM, Zelwer A. La phase liquide du ciment hidraté. RevMater Constr, Paris 1973;767:34–41.
[24] Barneyback Jr RS, Diamond S. Expression and analysis of pore fluids fromhardned cement pastes and mortars. Cem Concr Res 1981;11:279–85.
[25] Hussain SE, Rasheeduzzafar S. Corrosion resistance performance of fly ashblended cement concrete. ACI Mater J 1994;91(3):264–72.
[26] Dal Ri M. The effects of the addition of hydrated lime in concrete mixes withhigh concentrations of mineral additions on chloride penetration and tecomposition of the pore solution. Santa Maria, 2002. Master’s thesis, College ofCivil Engineering, Universidade Federal de Santa Maria, Santa Maria; 2002(Supervisor: Professor Antônio Luiz G.Gastaldini).
[27] Gomes NS. The influence of chemical activators and mineral additions onconcrete chloride behavior. Santa Maria, 2003. Master’s thesis, College of CivilEngineering, Universidade Federal de Santa Maria, Santa Maria; 2003(Supervisor: Professor Antônio Luiz G.Gastaldini).
[28] Takemoto K, Uchikawa H. Hydration of pozzolanic cement. In: Proceedings ofthe 7th international congress on the chemistry of cement, Paris, vol. 1; 1980.p. 21–9.
[29] Uchikawa H. Effect of blending components on hydration and structureformation. In: Proceedings of the 8th international congress on the chemistryof cement, Rio de Janeiro, vol. 1; 1986. p. 249–81.
[30] Associação Brasileira de Normas Técnicas. NBR 12655: Concreto de cimentoPortland – Preparo, controle e recebimento – Procedimento, Rio de Janeiro,Brazil; 2006.
[31] ACI 318-08. Building code requirements for structural concrete andcommentary.
[32] Comité Euro-International Du Béton CEB-FIP Model Code 1990. Final draft,Lausanne; 1991 (Bulletin de Information n. 205).