Embed Size (px)
Citation preview
Information on aviation’s environmental impact
CAP 1524

CAP 1524
March 2017
Published by the Civil Aviation Authority, 2017
Civil Aviation Authority,
Aviation House,
Gatwick Airport South,
West Sussex,
RH6 0YR.
You can copy and use this text but please ensure you always use the most up to date version and use it in context so as not to
be misleading, and credit the CAA.
First published 2017
The latest version of this document is available in electronic format at www.caa.co.uk, where you may also register for e-mail
notification of amendments.
CAP 1524 Contents
March 2017
Contents
Contents ............................................................................................................................... 3
Introduction ........................................................................................................................... 6
Purpose ......................................................................................................................... 6
General ......................................................................................................................... 6
Chapter 1 ............................................................................................................................. 8
Climate change ..................................................................................................................... 8
Introduction ................................................................................................................... 8
Types of greenhouse gases created by aviation ............................................................ 8
Aviation’s contribution to CO2 generation ...................................................................... 9
Climate change policies ............................................................................................... 10
Factors contributing to aviation’s CO2 emissions ........................................................ 12
Aircraft type .......................................................................................................... 12
Flight profile and distance .................................................................................... 12
Weight of the aircraft ............................................................................................ 14
Operational procedures........................................................................................ 14
Use of next generation biofuels ............................................................................ 15
The weather ......................................................................................................... 15
Efficiency improvements ...................................................................................... 16
Consumer ability to reduce CO2 emissions ................................................................. 16
Data ............................................................................................................................ 17
Issues with CO2 emissions reporting and forecasts ............................................. 17
Observations on emissions reporting ................................................................... 17
CO2 emissions by airline ..................................................................................... 19
Sustainable Aviation members’ absolute CO2 emissions and efficiency between 2003 and 2012 ..................................................................................................... 21
CO2 emissions and efficiency by airline ............................................................... 22
Greenhouse gas emissions by airport .................................................................. 23
CO2 emissions by airport in 2012 ........................................................................ 25
Aircraft age by airline ........................................................................................... 26
Use of next generation biofuels ............................................................................ 28
Passenger load factors by airline in 2013 ............................................................. 29
Chapter 2 ........................................................................................................................... 30
Air quality ............................................................................................................................ 30
Introduction ................................................................................................................. 30
Types of pollutant created by aviation ......................................................................... 30
CAP 1524 Contents
March 2017
Aviation’s contribution to protecting from air pollutants ................................................ 30
Changes made by airlines .................................................................................... 30
Changes made by airports ................................................................................... 31
Air quality policies ........................................................................................................ 31
Consumer ability to reduce pollutant emissions ........................................................... 32
Data ............................................................................................................................ 33
Issues with air quality reporting ............................................................................ 33
Contextual data from other parts of the UK .......................................................... 33
Nitrogen dioxide (NO2) at UK airports .................................................................. 34
Particulate matter (PM) at UK airports .................................................................. 35
Chapter 3 ........................................................................................................................... 36
Local environment ............................................................................................................... 36
Introduction ................................................................................................................. 36
Types of local environment impact by aviation ............................................................. 36
Aviation’s contribution to local environment ................................................................. 36
Biodiversity .......................................................................................................... 36
Wildlife ................................................................................................................. 36
Surface access .................................................................................................... 37
Waste – airports ................................................................................................... 37
Waste – airlines ................................................................................................... 38
Water quality ........................................................................................................ 38
Water consumption .............................................................................................. 38
Tranquillity ........................................................................................................... 38
Local environment policies .......................................................................................... 39
Wildlife ................................................................................................................. 39
National Parks and Areas of Outstanding Natural Beauty .................................... 39
Data ............................................................................................................................ 40
Modes of transport used to access airports, 2014 ................................................ 40
Waste and recycling/diversion performance by airport ......................................... 42
Water consumption by airport .............................................................................. 44
Chapter 4 ........................................................................................................................... 45
Noise .................................................................................................................................. 45
Introduction ................................................................................................................. 45
Aviation’s contribution to noise management ............................................................... 45
Noise policies .............................................................................................................. 46
European legislation ............................................................................................ 46
Local regulation ................................................................................................... 46
National regulation – designated airports ............................................................. 46
Data ............................................................................................................................ 48
CAP 1524 Contents
March 2017
Measuring noise .................................................................................................. 48
Aircraft movements by airport .............................................................................. 49
Leq sound level at UK airports ............................................................................... 50
Lden sound level at UK airports ............................................................................. 51
Appendix A ........................................................................................................................ 52
Sources of further information ............................................................................................. 52
Climate change ........................................................................................................... 52
Air quality .................................................................................................................... 52
CAP 1524 Introduction
March 2017
Introduction
Purpose
The purpose of this document is to bring together environmental information and
data published on the CAA website between 2011 and 2014.
This data was initially presented with the intention of providing a ‘one stop shop’ for
publicly available information on the environmental impact of the UK’s civil aviation
activity.
As the CAA no longer considers this the most effective way of providing the public
with environmental information, this data is no longer published on the CAA’s
environment web pages and exists here in archive form.
In addition to specific figures on the environmental impact of airports, airlines and
other bodies, this document also contains some high level explanations of how
aviation affects the environment. Additionally, it provides more detailed explanation
of how to interpret the relevant metrics of environmental impact than can be found on
the CAA’s environmental web pages. While this information represented the most up
to date thinking at the time it was published on the CAA website, we cannot ensure
its continued accuracy.
General
The most common concerns around the environmental impact of aviation are climate
change and noise, but air quality and local environments are also directly impacted
by aviation.
Airlines and airports are not obliged to produce the data below, and while there are
standard protocols (particularly around emissions) there are no standardised
requirements for reporting. This makes it extremely difficult to produce comparable
data, and users should be wary of drawing comparisons from the material in this
document. In many cases the methodologies and time periods between entries are
inconsistent, and users are advised to refer to source material from the airline or

CAP 1524 Introduction
March 2017
airport in order to understand the specific conditions under which their data was
produced. More recent data, subsequent to that below, can also be found from the
relevant airline/airport website.
This document will not be updated and no responsibility can be taken for the
continued accuracy of any part.
CAP 1524 Climate change
March 2017
Chapter 1
Climate change
Introduction
Aircraft emit a range of greenhouse gases throughout different stages of flight.
Aircraft are fairly unique in that they directly emit gases into the higher levels of the
atmosphere. When emitted at this altitude, the same gases can have very different
effects than when emitted at ground level.
Scientific evidence strongly indicates that these greenhouse gases contribute to
climate change.
Greenhouse gases move throughout the atmosphere and so do not respect
international boundaries. This means that they are an international issue regardless
of where the emissions were released.
Types of greenhouse gases created by aviation
Many different gases contribute to climate change. CO2 is generally viewed as the
most problematic greenhouse gas. It has a long life cycle and plays a key role in
global warming. In aviation, it is primarily generated by burning carbon-rich ‘fossil
fuels’ in engines. Other gases emitted by aircraft are:
Oxides of nitrogen (NOx)
Ozone (O3) – created by the reaction of NOx and sunlight
Soot and aerosols
Water vapour – causing contrail or man-made cirrus clouds
Less is known about the effects of these other gases. Some researchers predict that
these gases have a far greater effect than CO2 when emitted in the higher levels of
the atmosphere.
CAP 1524 Climate change
March 2017
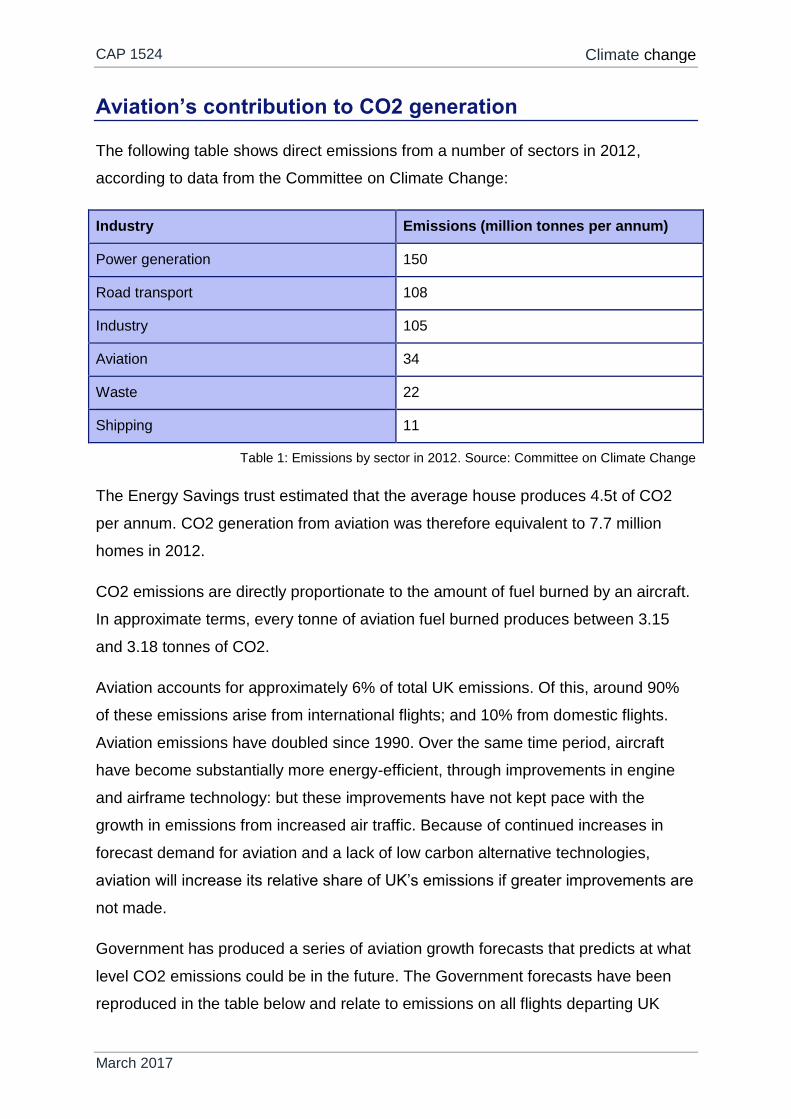
Aviation’s contribution to CO2 generation
The following table shows direct emissions from a number of sectors in 2012,
according to data from the Committee on Climate Change:
Industry Emissions (million tonnes per annum)
Power generation 150
Road transport 108
Industry 105
Aviation 34
Waste 22
Shipping 11
Table 1: Emissions by sector in 2012. Source: Committee on Climate Change
The Energy Savings trust estimated that the average house produces 4.5t of CO2
per annum. CO2 generation from aviation was therefore equivalent to 7.7 million
homes in 2012.
CO2 emissions are directly proportionate to the amount of fuel burned by an aircraft.
In approximate terms, every tonne of aviation fuel burned produces between 3.15
and 3.18 tonnes of CO2.
Aviation accounts for approximately 6% of total UK emissions. Of this, around 90%
of these emissions arise from international flights; and 10% from domestic flights.
Aviation emissions have doubled since 1990. Over the same time period, aircraft
have become substantially more energy-efficient, through improvements in engine
and airframe technology: but these improvements have not kept pace with the
growth in emissions from increased air traffic. Because of continued increases in
forecast demand for aviation and a lack of low carbon alternative technologies,
aviation will increase its relative share of UK’s emissions if greater improvements are
not made.
Government has produced a series of aviation growth forecasts that predicts at what
level CO2 emissions could be in the future. The Government forecasts have been
reproduced in the table below and relate to emissions on all flights departing UK
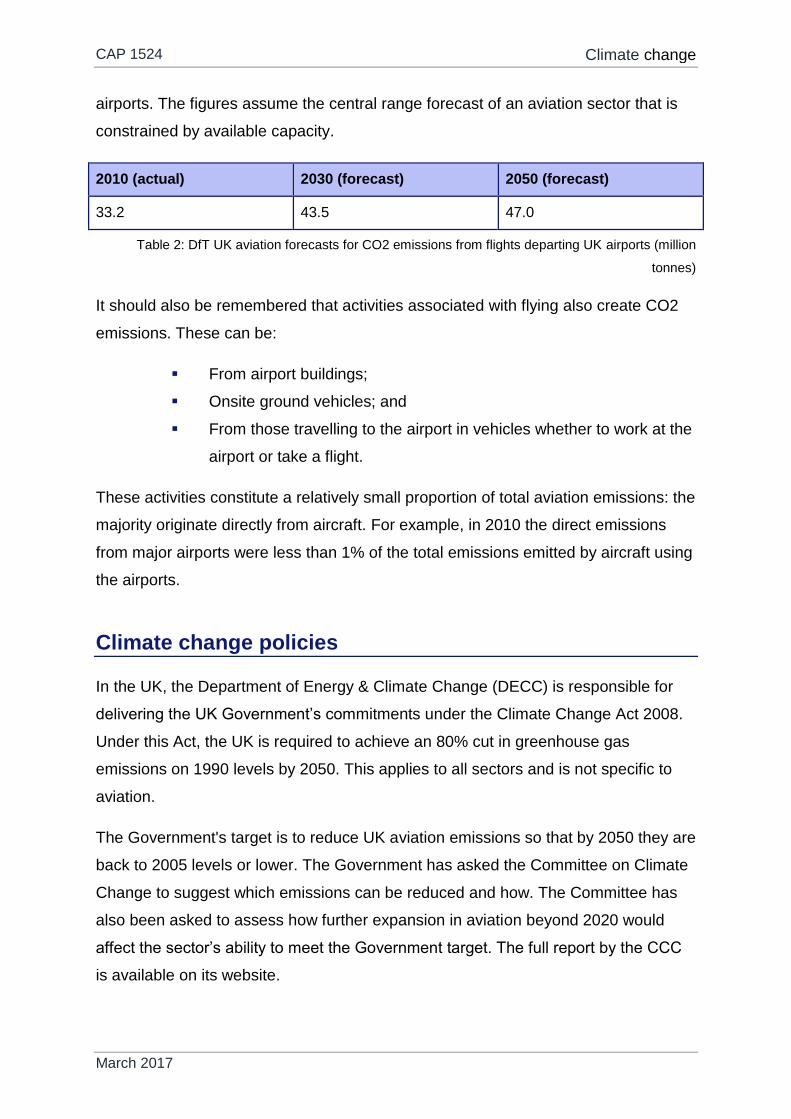
CAP 1524 Climate change
March 2017
airports. The figures assume the central range forecast of an aviation sector that is
constrained by available capacity.
2010 (actual) 2030 (forecast) 2050 (forecast)
33.2 43.5 47.0
Table 2: DfT UK aviation forecasts for CO2 emissions from flights departing UK airports (million
tonnes)
It should also be remembered that activities associated with flying also create CO2
emissions. These can be:
From airport buildings;
Onsite ground vehicles; and
From those travelling to the airport in vehicles whether to work at the
airport or take a flight.
These activities constitute a relatively small proportion of total aviation emissions: the
majority originate directly from aircraft. For example, in 2010 the direct emissions
from major airports were less than 1% of the total emissions emitted by aircraft using
the airports.
Climate change policies
In the UK, the Department of Energy & Climate Change (DECC) is responsible for
delivering the UK Government’s commitments under the Climate Change Act 2008.
Under this Act, the UK is required to achieve an 80% cut in greenhouse gas
emissions on 1990 levels by 2050. This applies to all sectors and is not specific to
aviation.
The Government's target is to reduce UK aviation emissions so that by 2050 they are
back to 2005 levels or lower. The Government has asked the Committee on Climate
Change to suggest which emissions can be reduced and how. The Committee has
also been asked to assess how further expansion in aviation beyond 2020 would
affect the sector’s ability to meet the Government target. The full report by the CCC
is available on its website.
CAP 1524 Climate change
March 2017
In 2012 the CCC also recommended that emissions from international aviation
should be included in the UK Carbon budget. However, due to the uncertainty over
the international framework for reducing aviation emissions, this decision has been
deferred by Government
Within the Aviation Policy Framework, the Government set out its expectation for
aviation in relation to climate change – ‘to ensure that the aviation sector makes a
significant and cost-effective contribution towards reducing global emissions.’ (2.4).
The policy framework goes on to say that ‘Our emphasis is on action at a global level
as the best means of securing our objective, with action within Europe the next best
option and a potential step towards wider international agreement.’ (2.5)
Within the European context, emissions from aviation are being tackled through the
EU Emissions Trading System (ETS). The ETS regulates emissions in those sectors
with the highest emissions such as power generation. The aviation sector became
part of the scheme in 2012, and flight operators in the European Economic Area are
required to submit data under the ETS.
The EU Commission publishes annual lists of emissions for those in the scheme.
At the international level, ICAO has agreed to targets for delivering carbon neutral
growth from aviation from 2020 and delivering 2% annual emission improvements up
to 2050. This will be achieved using a combination of improvements in technology,
operational procedures, use of alternative fuels and the introduction of a global
market based measure.
The ICAO General Assembly, through Resolution A38-18, agreed to develop this
global market-based measure scheme for international aviation. The scheme that is
being developed would be implemented from 2020. The design of this measure will
require the agreement of the ICAO member states at the next ICAO General
Assembly in September 2016.
More information can be found on this by visiting:
The policy owner – The European Commission
Responsibility for delivering EU-ETS policy within the UK –
Department of Energy & Climate Change
CAP 1524 Climate change
March 2017
The regulator for the EU-ETS – the Environment Agency
Factors contributing to aviation’s CO2 emissions
There are many factors that affect the amount of CO2 emissions from a flight. Some
of these are in the control of airlines; some can be controlled or influenced by
airports and regulators; some are to do with the weather.
The main factors are:
Aircraft type
Flight profile and distance
Weight of the aircraft
Operational procedures
Use of next generation biofuels
The weather
Efficiency improvements
Aircraft type
Each aircraft will burn fuel at a different rate. There can be variances between
models: air frame design and modifications will affect drag and weight; different
engines will operate at varying levels of efficiency depending upon the range that
they are designed to fly. Between aircraft families the variances can be even greater.
Aircraft and engine manufacturers have significantly improved the efficiency of
aircraft and engines since the early 1960s. Newer aircraft are in general more fuel-
efficient and produce fewer emissions. While airlines obviously can control the age of
their fleet, there is often a long lead time between order and delivery - meaning
investments they make in fuel-efficient aircraft can take some time to make a
difference to emissions performance.
Flight profile and distance
Aircraft burn fuel and emit emissions at differing rates during the different stages of a
flight. These can be broadly categorised as:
CAP 1524 Climate change
March 2017
Take-off and climb to cruise altitude
There is a higher fuel burn rate at this stage because of the power needed to get the
aircraft to climb to its cruise altitude. Air at a lower altitude is denser, creating more
drag on the aircraft: at this stage the aircraft is at its heaviest because it holds all the
fuel needed for the journey.
At cruise altitude
This is the most fuel-efficient stage of the flight because the air is less dense and the
aircraft is flying at its most efficient operating speed.
Landing
At this stage the aircraft is at its lightest because it will have consumed most of its
fuel load. The aircraft is also descending, requiring less power to be in operation,
emitting proportionally lower emissions than at the start of the flight.
Efficiency and distance
Because of the high emissions at the start of a journey, short-haul flights are deemed
the most inefficient because they spend a greater proportion of their total journey in
the high emissions phase. These aircraft are also likely to do more short flights
during a day, spending more time in the take-off and climb phase than longer haul
aircraft.
Long-haul journeys are broadly speaking the next most inefficient type of flight.
Although the aircraft spends a long time at its most efficient cruise altitude, the
aircraft has to carry more fuel to cover the long distance and this extra weight makes
it burn more fuel.
Medium distance flights of between 2,000 and 5,000 km are therefore the most fuel-
efficient flights and tend to emit the lowest emissions per km travelled.
External factors
There are factors outside of an airline operator’s control in relation to duration of
flight. Very few flights can fly the most direct ‘as the crow flies’ route because of the
need to safely manage aircraft traffic. In more congested airspace – such as above
London and the South East of England – aircraft are often held in holding patterns or
CAP 1524 Climate change
March 2017
stacks before they are allowed to land. Airspace is also controlled for military
purposes; and some airspace in the world is deemed not safe to fly over due to
conflict on the ground which means greater distances have to be flown to avoid such
areas.
Weather can also influence flight profiles – see below for further details.
Weight of the aircraft
The lighter an aircraft is, the less fuel it will burn. Reducing unnecessary weight on
an aircraft can therefore reduce CO2 emissions (as well as fuel costs). Airlines are
always looking for ways to reduce the weight of their aircraft, and have taken a wide
range of steps to do so. These include:
using lighter types of paint
taking fewer and lighter catering trolleys on board
removing in-flight magazines
reducing the baggage allowance rates
Per flight, the level of emission saving is negligible. However, a Project Omega study
found that if all these measures were taken on a single Boeing 747 (Jumbo Jet) that
operated a daily return from the UK to the US, it would save 456.2 tonnes of CO2
per year. That's roughly equivalent to the average domestic carbon footprint of 45
UK residents.
Operational procedures
Changes to aircraft operational procedures both in the air and on the ground can
reduce the amount of fuel they burn and hence the volume of CO2 they emit.
Continuous Climb Operations and Continuous Descent Operations aim to make the
climb to or descent from cruising altitude more efficient. Just as in a car, smoother
acceleration and deceleration burns less fuel, so a smoother, steadier climb with
fewer changes of speed will require less aircraft fuel. A similar principle applies to
descent, where a smoother descent, perhaps begun earlier, reduces the need for
braking and re-acceleration.
CAP 1524 Climate change
March 2017
Clearly, this requires detailed flight planning and assistance from air traffic control.
However, the aviation industry is looking to increase its use: industry body
Sustainable Aviation has launched a campaign to increase the use of Continuous
Descent Operations in the UK by 5%, which could reduce CO2 emissions by 10,000
tonnes a year. On the ground reduced engine taxiing and the use of Fixed Electrical
Ground Power can also reduce the amount of fuel used. Further information can be
found in relation to air quality in subsequent chapters.
Use of next generation biofuels
Conventional jet fuel, in common with other road transport fuels such as diesel and
petrol, is based on fossil fuels and has a high carbon content - creating high levels of
CO2 emissions. The aviation industry has looked at alternatives, such as biofuels
(fuels derived from organic matter such as plants) which enable overall CO2
emissions to be reduced by taking account of the carbon absorbed during plant
growth.
Early development of biofuels typically involved growing crops solely for fuel.
However, it's now recognised that this approach can be environmentally
counterproductive, because of the effects of land use change, competition with food
crops and water supplies. Instead, there is a concerted effort to produce biofuels
from waste sources.
Industry body Sustainable Aviation has published a roadmap outlining where the
industry believes growth in biofuels can come from and what the barriers are to this
growth.
The weather
The weather can worsen or improve the environmental impact on the environment
from flight to flight:
Headwinds will require more fuel to be burnt so increases emissions,
although a tailwind will help reduce emissions.
Bad weather such as snow, high winds or fog can cause delays with
take-off and landing which see aircraft idling on the ground or being
held in stacks which increases the emissions of the aircraft.
CAP 1524 Climate change
March 2017
Temperature can result in higher and lower emission rates; with
aircraft requiring less fuel to take off in colder temperatures due to
the air being denser which enables the engine to run more efficiently.
Indirect environmental effects can also occur from bad weather such
as an increase in the amount of de-icing fluid needed to be used in
prolonged spells of cold weather.
Efficiency improvements
In addition to reducing emissions levels overall, the aviation industry seeks to
increase its efficiency. In environmental terms, this means reducing the level of
emissions per passenger or tonne of freight carried.
Passengers make up a relatively small proportion of the total weight of an aircraft,
but an aircraft is more ‘efficient’ when more passengers are carried as the total
emissions are shared between larger numbers of people.
Consumer ability to reduce CO2 emissions
The easiest way to reduce CO2 emissions from flying is to reduce the amount you
fly. This is not always practical: aviation is an important and convenient form of
transport for millions of people.
Some steps can be taken to reduce emissions without ceasing to fly:
Select airlines with modern (i.e. more efficient) aircraft
Consider flying economy rather than business or first class
Fly with airlines with lower CO2 performance figures
Use public transport to get to the airport
Make a carbon offset payment when you fly. This involves the
payment of a sum to compensate for the emissions produced by a
flight. Money from these schemes goes to projects working to reduce
emissions. Some airlines offer a carbon offset charge when booking
a flight, but specialist carbon offsetting companies are another
option. Research your options. Information is available from the
International Carbon Reduction and Offsetting Alliance.
CAP 1524 Climate change
March 2017
Data
Issues with CO2 emissions reporting and forecasts
Emissions calculations are difficult and in the absence of solid data, must often use
assumptions. There are a number of factors to be aware of when studying and
comparing emissions data. These include:
Differences in calculation methods. The UK Government
calculates emissions based on fuel usage. It tracks sales of bunker
fuel (the fuel used by airlines), then uses a conversion factor to
generate the CO2 figure. Airlines typically calculate emissions using
fuel burn data and a conversion factor. Each method will lead to a
different figure, so when comparing emissions data, it is important to
ensure the calculation method used is the same.
Risk of double counting. Different organisations report the same
emissions – for example airports and airlines. So, there is a danger
that emissions can be double counted.
The difficulty of emissions reporting and forecasting is demonstrated by the
difference in the forecasts for 2050 between the Government and industry body
Sustainable Aviation. They have used different assumptions about air traffic control
efficiency improvements, the speed of introduction of sustainable fuels, the relative
efficiency of new aircraft and the degree of carbon trading that may occur.
Observations on emissions reporting
Airports are not required to publish data about their greenhouse gas emissions.
There are no official standards, and while most organisations report emissions using
standard greenhouse gas reporting protocols, there are often slight variants in their
calculations. Users are advised to visit organisations’ websites to determine the
details of exact methodologies and to be wary of making comparisons. In general,
data is published in terms of CO2 equivalent (CO2e) which includes greenhouse
gases besides carbon dioxide.
It should be noted that although airports generate direct CO2 emissions, the majority
of airport emissions are from the arrival and departure of aircraft.
CAP 1524 Climate change
March 2017
The most appropriate method of comparison for the performance of airlines is to use
efficiency metrics. In order to compare operators, the same efficiency metric must be
used, but the lack of common reporting practice used across airlines makes it difficult
for consumers to make these comparisons. Efficiency metrics in the tables below will
have been calculated using different methodologies. The CAA is encouraging
airlines to report in a more standardised format to increase the availability of more
comparative environmental performance data.
CAP 1524 Climate change
March 2017
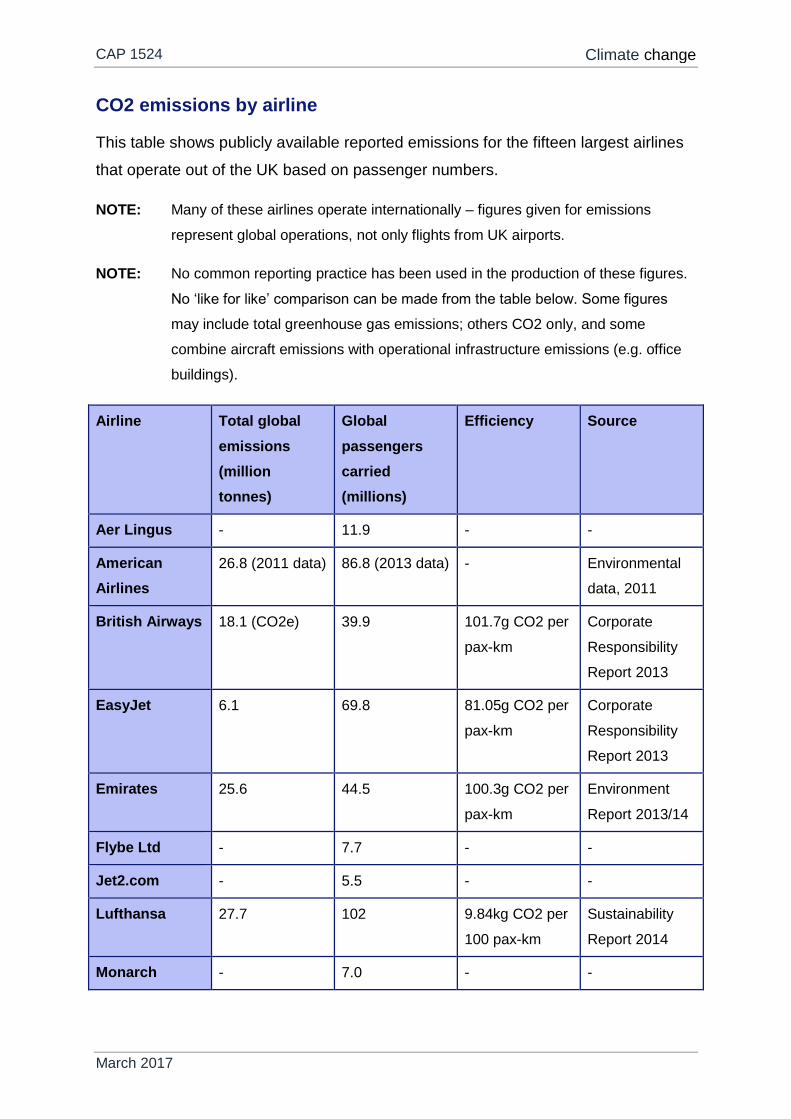
CO2 emissions by airline
This table shows publicly available reported emissions for the fifteen largest airlines
that operate out of the UK based on passenger numbers.
NOTE: Many of these airlines operate internationally – figures given for emissions
represent global operations, not only flights from UK airports.
NOTE: No common reporting practice has been used in the production of these figures.
No ‘like for like’ comparison can be made from the table below. Some figures
may include total greenhouse gas emissions; others CO2 only, and some
combine aircraft emissions with operational infrastructure emissions (e.g. office
buildings).
Airline Total global
emissions
(million
tonnes)
Global
passengers
carried
(millions)
Efficiency Source
Aer Lingus - 11.9 - -
American
Airlines
26.8 (2011 data) 86.8 (2013 data) - Environmental
data, 2011
British Airways 18.1 (CO2e) 39.9 101.7g CO2 per
pax-km
Corporate
Responsibility
Report 2013
EasyJet 6.1 69.8 81.05g CO2 per
pax-km
Corporate
Responsibility
Report 2013
Emirates 25.6 44.5 100.3g CO2 per
pax-km
Environment
Report 2013/14
Flybe Ltd - 7.7 - -
Jet2.com - 5.5 - -
Lufthansa 27.7 102 9.84kg CO2 per
100 pax-km
Sustainability
Report 2014
Monarch - 7.0 - -
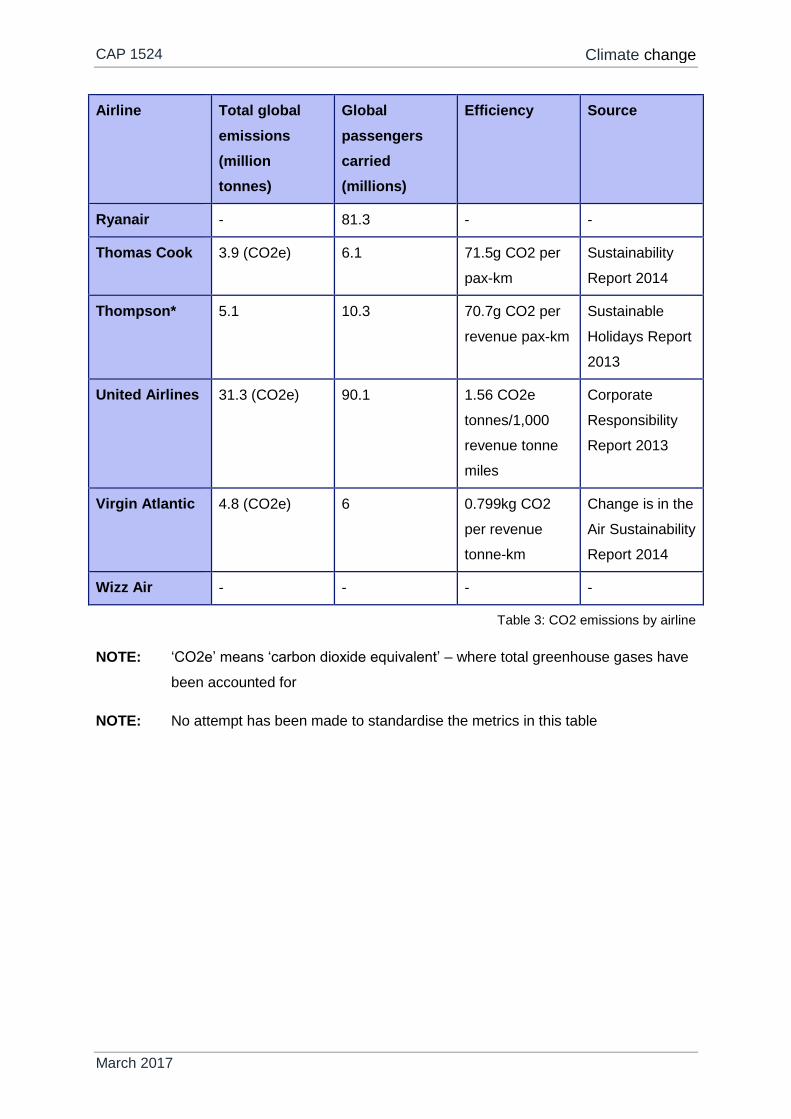
CAP 1524 Climate change
March 2017
Airline Total global
emissions
(million
tonnes)
Global
passengers
carried
(millions)
Efficiency Source
Ryanair - 81.3 - -
Thomas Cook 3.9 (CO2e) 6.1 71.5g CO2 per
pax-km
Sustainability
Report 2014
Thompson* 5.1 10.3 70.7g CO2 per
revenue pax-km
Sustainable
Holidays Report
2013
United Airlines 31.3 (CO2e) 90.1 1.56 CO2e
tonnes/1,000
revenue tonne
miles
Corporate
Responsibility
Report 2013
Virgin Atlantic 4.8 (CO2e) 6 0.799kg CO2
per revenue
tonne-km
Change is in the
Air Sustainability
Report 2014
Wizz Air - - - -
Table 3: CO2 emissions by airline
NOTE: ‘CO2e’ means ‘carbon dioxide equivalent’ – where total greenhouse gases have
been accounted for
NOTE: No attempt has been made to standardise the metrics in this table
CAP 1524 Climate change
March 2017
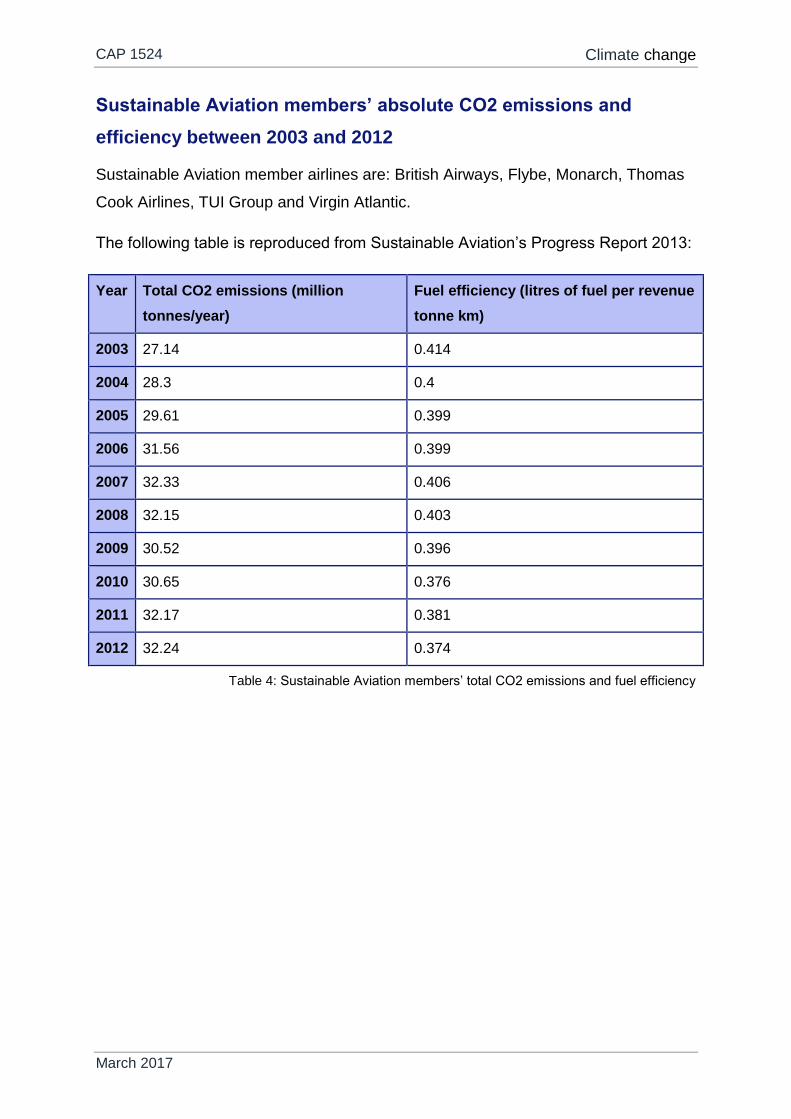
Sustainable Aviation members’ absolute CO2 emissions and
efficiency between 2003 and 2012
Sustainable Aviation member airlines are: British Airways, Flybe, Monarch, Thomas
Cook Airlines, TUI Group and Virgin Atlantic.
The following table is reproduced from Sustainable Aviation’s Progress Report 2013:
Year Total CO2 emissions (million
tonnes/year)
Fuel efficiency (litres of fuel per revenue
tonne km)
2003 27.14 0.414
2004 28.3 0.4
2005 29.61 0.399
2006 31.56 0.399
2007 32.33 0.406
2008 32.15 0.403
2009 30.52 0.396
2010 30.65 0.376
2011 32.17 0.381
2012 32.24 0.374
Table 4: Sustainable Aviation members’ total CO2 emissions and fuel efficiency
CAP 1524 Climate change
March 2017
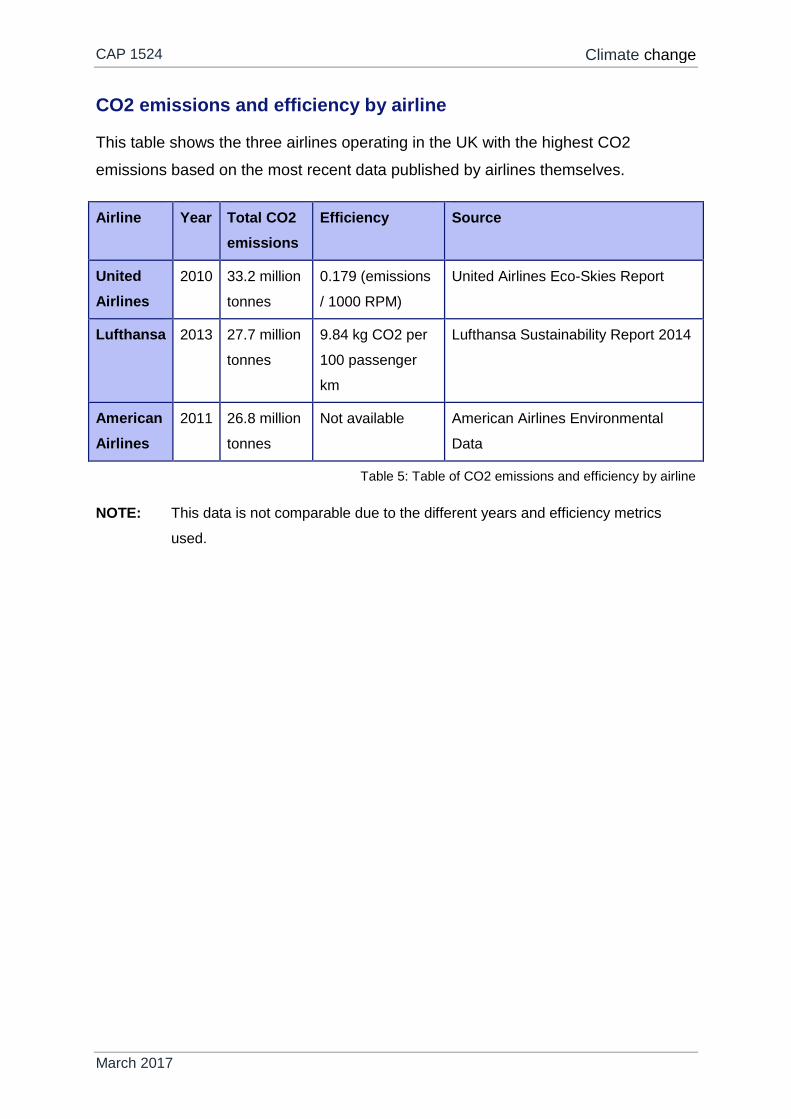
CO2 emissions and efficiency by airline
This table shows the three airlines operating in the UK with the highest CO2
emissions based on the most recent data published by airlines themselves.
Airline Year Total CO2
emissions
Efficiency Source
United
Airlines
2010 33.2 million
tonnes
0.179 (emissions
/ 1000 RPM)
United Airlines Eco-Skies Report
Lufthansa 2013 27.7 million
tonnes
9.84 kg CO2 per
100 passenger
km
Lufthansa Sustainability Report 2014
American
Airlines
2011 26.8 million
tonnes
Not available American Airlines Environmental
Data
Table 5: Table of CO2 emissions and efficiency by airline
NOTE: This data is not comparable due to the different years and efficiency metrics
used.
CAP 1524 Climate change
March 2017
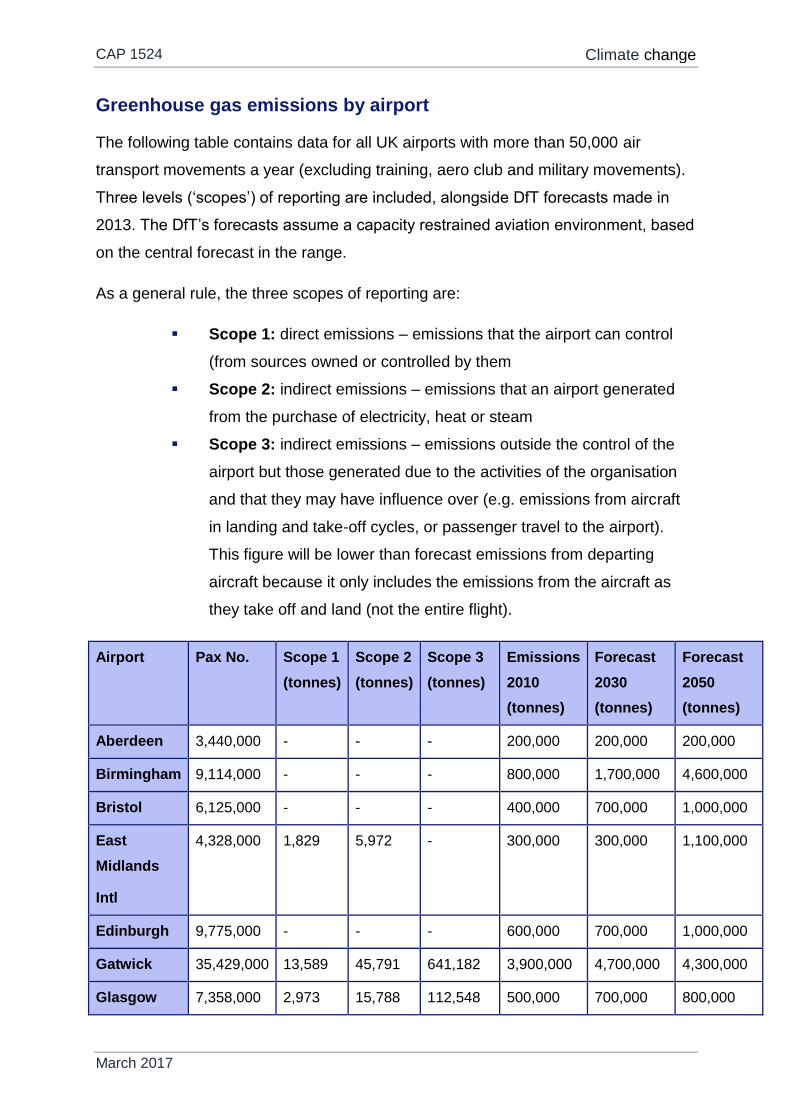
Greenhouse gas emissions by airport
The following table contains data for all UK airports with more than 50,000 air
transport movements a year (excluding training, aero club and military movements).
Three levels (‘scopes’) of reporting are included, alongside DfT forecasts made in
2013. The DfT’s forecasts assume a capacity restrained aviation environment, based
on the central forecast in the range.
As a general rule, the three scopes of reporting are:
Scope 1: direct emissions – emissions that the airport can control
(from sources owned or controlled by them
Scope 2: indirect emissions – emissions that an airport generated
from the purchase of electricity, heat or steam
Scope 3: indirect emissions – emissions outside the control of the
airport but those generated due to the activities of the organisation
and that they may have influence over (e.g. emissions from aircraft
in landing and take-off cycles, or passenger travel to the airport).
This figure will be lower than forecast emissions from departing
aircraft because it only includes the emissions from the aircraft as
they take off and land (not the entire flight).
Airport Pax No. Scope 1
(tonnes)
Scope 2
(tonnes)
Scope 3
(tonnes)
Emissions
2010
(tonnes)
Forecast
2030
(tonnes)
Forecast
2050
(tonnes)
Aberdeen 3,440,000 - - - 200,000 200,000 200,000
Birmingham 9,114,000 - - - 800,000 1,700,000 4,600,000
Bristol 6,125,000 - - - 400,000 700,000 1,000,000
East
Midlands
Intl
4,328,000 1,829 5,972 - 300,000 300,000 1,100,000
Edinburgh 9,775,000 - - - 600,000 700,000 1,000,000
Gatwick 35,429,000 13,589 45,791 641,182 3,900,000 4,700,000 4,300,000
Glasgow 7,358,000 2,973 15,788 112,548 500,000 700,000 800,000
CAP 1524 Climate change
March 2017
Airport Pax No. Scope 1
(tonnes)
Scope 2
(tonnes)
Scope 3
(tonnes)
Emissions
2010
(tonnes)
Forecast
2030
(tonnes)
Forecast
2050
(tonnes)
Heathrow 72,332,000 43,000 241,000 1,987,000 18,800,000 21,400,000 18,200,000
London City 3,380,000 - - - 200,000 500,000 500,000
Luton 9,693,000 - - - 700,000 1,300,000 900,000
Manchester 20,680,000 13,415 46,361 - 2,200,000 3,200,000 5,300,000
Newcastle 4,415,000 - - - 300,000 300,000 500,000
Stansted 17,849,000 9,940 29,684 - 1,100,000 3,500,000 1,900,000
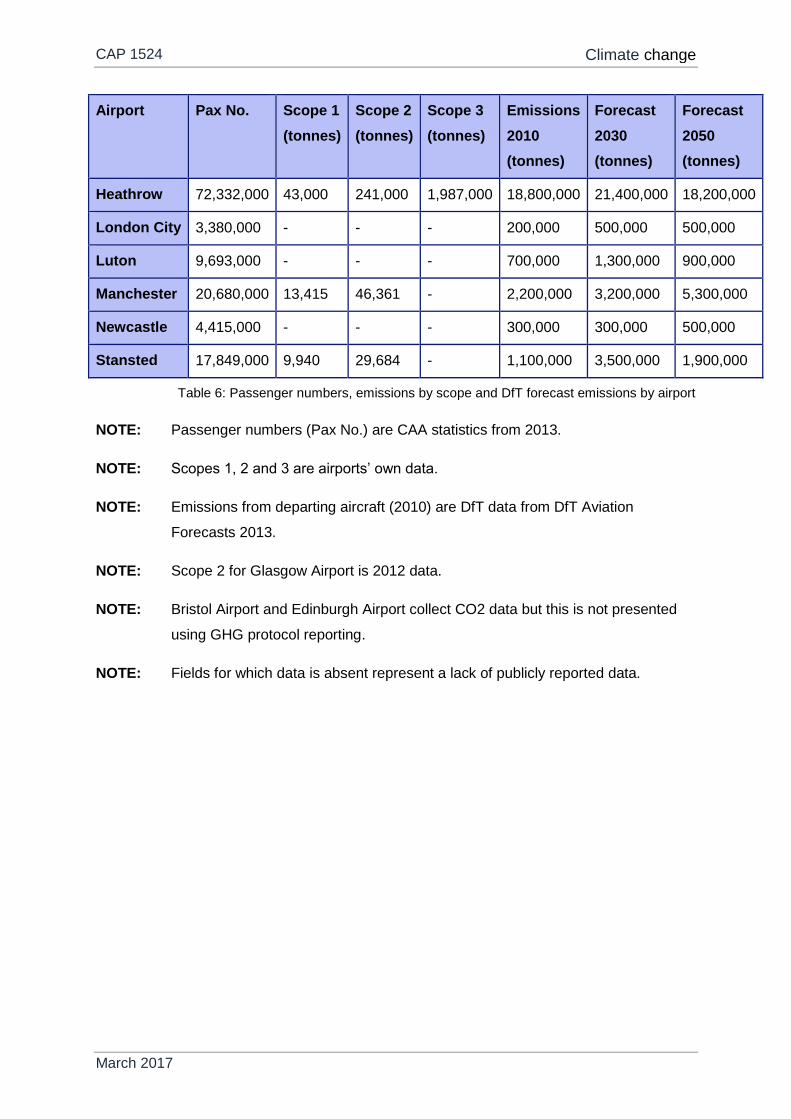
Table 6: Passenger numbers, emissions by scope and DfT forecast emissions by airport
NOTE: Passenger numbers (Pax No.) are CAA statistics from 2013.
NOTE: Scopes 1, 2 and 3 are airports’ own data.
NOTE: Emissions from departing aircraft (2010) are DfT data from DfT Aviation
Forecasts 2013.
NOTE: Scope 2 for Glasgow Airport is 2012 data.
NOTE: Bristol Airport and Edinburgh Airport collect CO2 data but this is not presented
using GHG protocol reporting.
NOTE: Fields for which data is absent represent a lack of publicly reported data.
CAP 1524 Climate change
March 2017
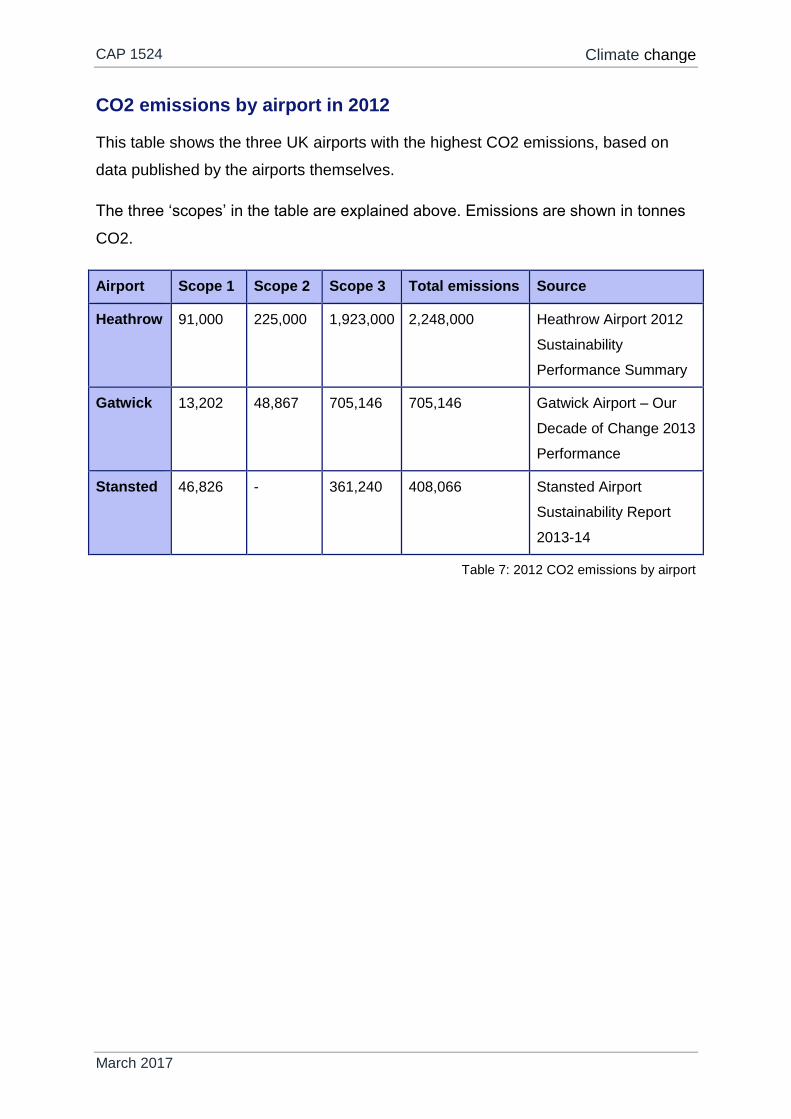
CO2 emissions by airport in 2012
This table shows the three UK airports with the highest CO2 emissions, based on
data published by the airports themselves.
The three ‘scopes’ in the table are explained above. Emissions are shown in tonnes
CO2.
Airport Scope 1 Scope 2 Scope 3 Total emissions Source
Heathrow 91,000 225,000 1,923,000 2,248,000 Heathrow Airport 2012
Sustainability
Performance Summary
Gatwick 13,202 48,867 705,146 705,146 Gatwick Airport – Our
Decade of Change 2013
Performance
Stansted 46,826 - 361,240 408,066 Stansted Airport
Sustainability Report
2013-14
Table 7: 2012 CO2 emissions by airport
CAP 1524 Climate change
March 2017
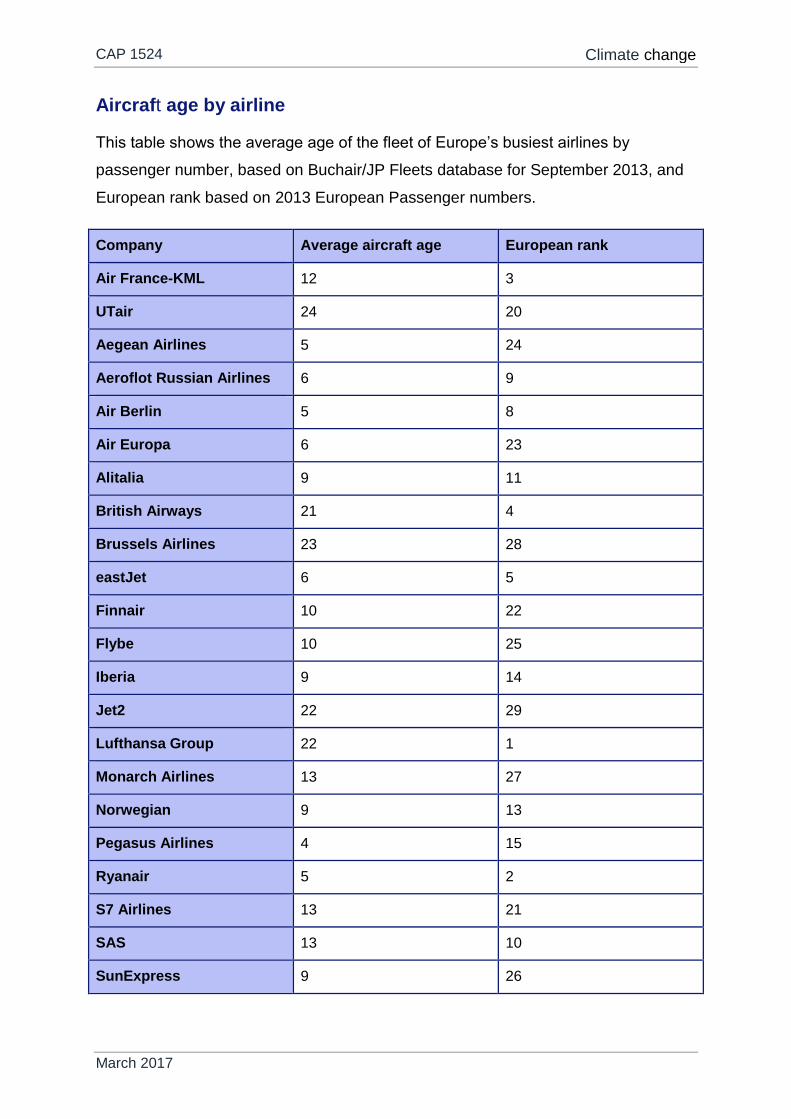
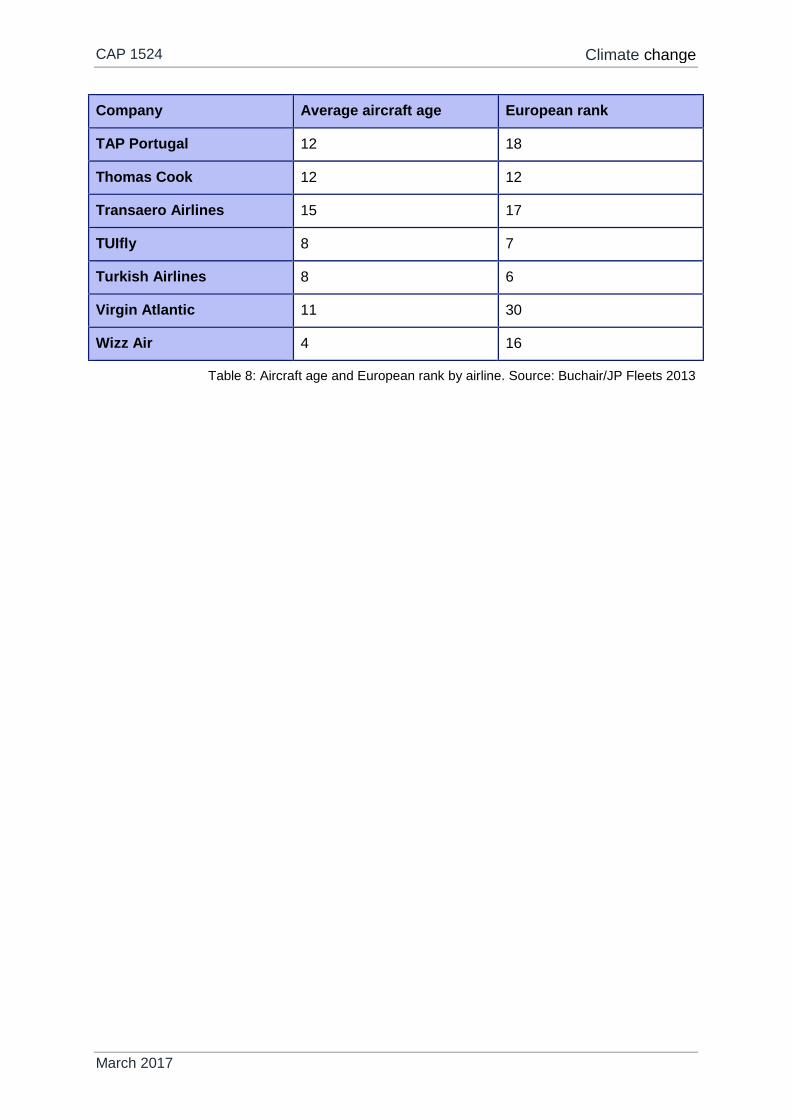
Aircraft age by airline
This table shows the average age of the fleet of Europe’s busiest airlines by
passenger number, based on Buchair/JP Fleets database for September 2013, and
European rank based on 2013 European Passenger numbers.
Company Average aircraft age European rank
Air France-KML 12 3
UTair 24 20
Aegean Airlines 5 24
Aeroflot Russian Airlines 6 9
Air Berlin 5 8
Air Europa 6 23
Alitalia 9 11
British Airways 21 4
Brussels Airlines 23 28
eastJet 6 5
Finnair 10 22
Flybe 10 25
Iberia 9 14
Jet2 22 29
Lufthansa Group 22 1
Monarch Airlines 13 27
Norwegian 9 13
Pegasus Airlines 4 15
Ryanair 5 2
S7 Airlines 13 21
SAS 13 10
SunExpress 9 26
CAP 1524 Climate change
March 2017
Company Average aircraft age European rank
TAP Portugal 12 18
Thomas Cook 12 12
Transaero Airlines 15 17
TUIfly 8 7
Turkish Airlines 8 6
Virgin Atlantic 11 30
Wizz Air 4 16
Table 8: Aircraft age and European rank by airline. Source: Buchair/JP Fleets 2013
CAP 1524 Climate change
March 2017
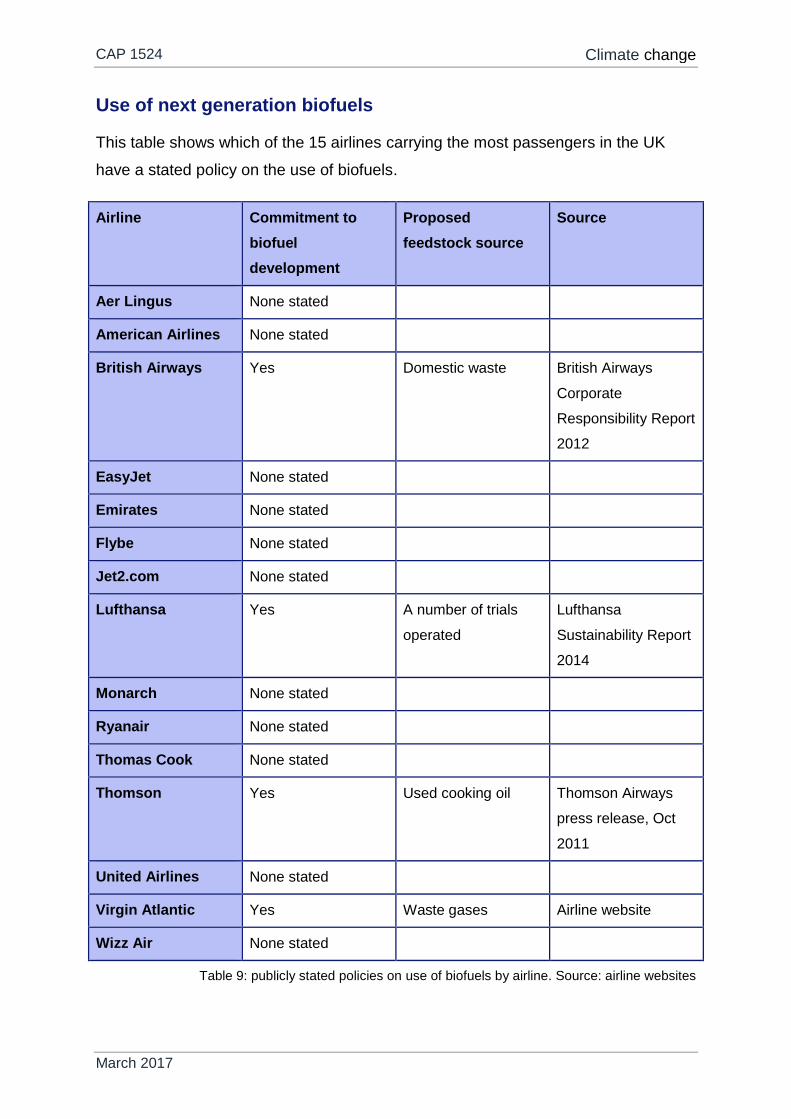
Use of next generation biofuels
This table shows which of the 15 airlines carrying the most passengers in the UK
have a stated policy on the use of biofuels.
Airline Commitment to
biofuel
development
Proposed
feedstock source
Source
Aer Lingus None stated
American Airlines None stated
British Airways Yes Domestic waste British Airways
Corporate
Responsibility Report
2012
EasyJet None stated
Emirates None stated
Flybe None stated
Jet2.com None stated
Lufthansa Yes A number of trials
operated
Lufthansa
Sustainability Report
2014
Monarch None stated
Ryanair None stated
Thomas Cook None stated
Thomson Yes Used cooking oil Thomson Airways
press release, Oct
2011
United Airlines None stated
Virgin Atlantic Yes Waste gases Airline website
Wizz Air None stated
Table 9: publicly stated policies on use of biofuels by airline. Source: airline websites
CAP 1524 Climate change
March 2017
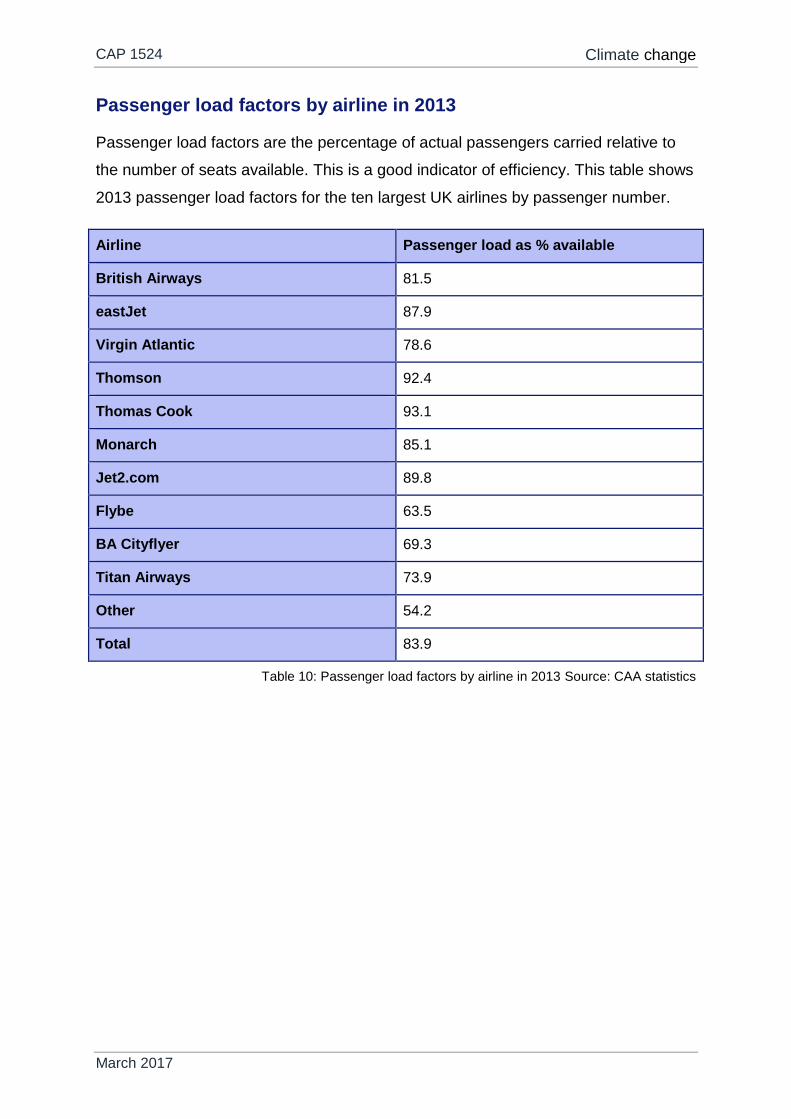
Passenger load factors by airline in 2013
Passenger load factors are the percentage of actual passengers carried relative to
the number of seats available. This is a good indicator of efficiency. This table shows
2013 passenger load factors for the ten largest UK airlines by passenger number.
Airline Passenger load as % available
British Airways 81.5
eastJet 87.9
Virgin Atlantic 78.6
Thomson 92.4
Thomas Cook 93.1
Monarch 85.1
Jet2.com 89.8
Flybe 63.5
BA Cityflyer 69.3
Titan Airways 73.9
Other 54.2
Total 83.9
Table 10: Passenger load factors by airline in 2013 Source: CAA statistics
CAP 1524 Air quality
March 2017
Chapter 2
Air quality
Introduction
Poor air quality is known to have a damaging effect on health. Depending on the
level and type of pollution, symptoms can range from minor irritation to severe
effects (particularly amongst those suffering from respiratory illnesses). Air pollution
can also damage vegetation and ecosystems.
Pollutants are emitted from aircraft engines, particularly affecting those working and
living near an airport. Ground vehicles operating at airports, passenger transport,
employee transport and delivery vehicles also contribute to aviation’s pollutant
emissions.
Types of pollutant created by aviation
The main pollutants that are monitored are:
Nitrogen dioxide (NO2)
Nitrogen oxides (NOx)
Particulate matter (PM)
Carbon monoxide, polycyclic aromatic hydrocarbons, benzene and 1,3-Butadiene
are also amongst pollutants of concern.
Aviation’s contribution to protecting from air pollutants
The aviation industry is working to reduce the level of pollutants emitted through
improvements to aircraft and engine design, operational procedures and fuels.
Changes made by airlines
Airlines can help to improve air quality by:
CAP 1524 Air quality
March 2017
Switching off main engines on arrival and, where possible, limiting
the use of aircraft auxiliary power units by using fixed electrical
ground power, ground power units and pre-conditioned air.
Delaying the switching on of main engines until absolutely necessary
on departure.
Whilst parked at aircraft stands, operating aircraft on the lowest
possible energy draw (e.g. turning off unnecessary electrical
systems such as In Flight Entertainment).
Reducing the number of engines used when taxiing.
Applying reduced-thrust take-off.
Changes made by airports
Airports can help to improve air quality by:
Providing fixed electrical ground power and pre-conditioned air for
aircraft.
Optimising the most efficient flow of aircraft when moving between
runways and stands.
Investing in lower emission ground vehicles for use at the airport.
Considering charging higher landing charges for aircraft with higher
NOx emissions.
Developing surface access strategies that encourage the use of
public transport.
In 2013, one monitoring station at Heathrow showed that local air quality annual
mean limits for NO2 had been exceeded. All other airports were within legal limits.
Heathrow has developed a dedicated website, Heathrow Airwatch, to allow data to
be closely monitored and presented in order to tackle this issue.
Air quality policies
EU Member States are set air quality targets through European legislation. Some of
these targets are reflected as UK-wide objectives whilst others are devolved
objectives with separate targets for England, Scotland, Wales and Northern Ireland.
CAP 1524 Air quality
March 2017
Defra is the Government department with responsibility for setting national policy on
air quality to meet these targets. At a local level, local authorities are required to
assess air quality and Air Quality Management Areas (AQMAs) are declared if
national air quality objectives are not being met.
Two of these targets are for average mean levels of 40µgm-3 for NO2 and PM10 in
the UK. Data is available below for a number of UK airports in relation to both
targets.
There are no specific air quality targets for the UK aviation industry. Instead, air
quality at airports is measured as part of a local authority’s duties around air quality
and any issues are dealt with between the airport and local authority.
Different airports have different obligations for monitoring and reporting air quality,
with some reporting requirements necessary by law through planning obligations.
Consumer ability to reduce pollutant emissions
Passengers can influence air quality in their travel choices to and from airports.
Public transport and car park use impact air quality less than being dropped off and
collected from airports.
CAP 1524 Air quality
March 2017
Data
Issues with air quality reporting
Monitoring stations capture air pollution from all sources in a particular area and it is
therefore impossible to isolate the pollution arising from aviation activity in these
measurements.
Contextual data from other parts of the UK
Monitoring location NO2 2014 annual average
mean
PM10 2014 annual average
mean
Manchester, Oxford Road 68 28
Cambridge, Parker Street 45 22
Hounslow, Brentford (M4) 53 36
London, Euston Road 98 -
Table11: Air quality readings for parts of the UK. Source: All but London, Euston Road from Air
Quality England (London, Euston Road from London Air Quality Network)

CAP 1524 Air quality
March 2017
Nitrogen dioxide (NO2) at UK airports
This table shows the mean level of NO2 in µgm-3 at UK airports with more than
50,000 air transport movements per year.
Airport 2005 2006 2007 2008 2009 2010 2011 2012 2013
Aberdeen - - - - - - - - -
Birmingham - 27 28 25 21 28 24 24 24
Bristol - - - - - - - 19 20
East
Midlands
- - - - - - 27 29 23
Edinburgh - - - - - - - - -
Gatwick - - - - - 37 32 33 32
Glasgow - - - - - - - - -
Heathrow
LHR2
53 52 54 53 50 50 50 48 48
Heathrow
Harlington
38 37 37 35 36 34 34 33 38
Heathrow
Green Gates
36 37 38 38 38 41 35 33 33
Heathrow
Oaks Road
38 33 38 35 33 37 30 30 34
London City - - - - - 35 33 35 32
Luton - - - - - - - - -
Manchester - - - - - - 23 24 22
Newcastle - - - - - - - - -
Stansted
Location 3
- - - - - - 22 26 24
Stansted
Location 4
- - - - - - 19 19 19
Table 12: Annual average mean NO2 levels at UK airports. Source: Airport websites. Figures not
publicly available are marked with ‘-‘
CAP 1524 Air quality
March 2017
Particulate matter (PM) at UK airports
This table shows the mean level of PM10 in µgm-3 at UK airports with more than
50,000 air transport movements per year.
Airport 2005 2006 2007 2008 2009 2010 2011 2012 2013
Aberdeen - - - - - - - - -
Birmingham - 22 21 16 18 19 21 18 19
Bristol - - - - - - - 18 19
East
Midlands
- - - - - - 19 18 18
Edinburgh - - - - - - - - -
Gatwick - - - - - 22 22 22 24
Glasgow - - - - - - - - -
Heathrow
LHR2
28 28 25 23 23 24 25 25 25
Heathrow
Harlington
25 23 21 21 16 14 - 18 20
Heathrow
Green Gates
24 24 22 17 17 19 21 21 21
Heathrow
Oaks Road
24 24 22 20 20 21 24 22 22
London City - - - - - 22 24 21 23
Luton - - - - - - 17 15 21
Manchester - - - - - - 15 13 15
Newcastle - - - - - - - - -
Stansted
Location 3
- - - - - - 15 20 15
Stansted
Location 4
- - - - - - - - -
Table 13: Annual average mean PM10 levels at UK airports. Source: Airports’ websites. Figures not
publicly available are marked with ‘-‘
CAP 1524 Local environment
March 2017
Chapter 3
Local environment
Introduction
Aviation can affect a number of features in local environments. Biodiversity and
landscape can be affected by habitat loss and fragmentation; light pollution can be
visually intrusive; wildlife can be disturbed by increased noise and vibration levels;
and measures taken to reduce the risk of planes colliding with birds can have their
own disruptive effects.
Types of local environment impact by aviation
Different local environmental impacts of aviation include:
Biodiversity
Water
Waste
Surface access
Air quality – this is dealt with above
Aviation’s contribution to local environment
Biodiversity
Airports manage large sites which are not accessible by the general public and can
therefore provide good opportunities to increase biodiversity. Many airports are
proactive in encouraging biodiversity on their sites and further information on a
specific airport’s activities can found from the airport itself.
Wildlife
Wildlife – particularly birds and large mammals such as deer and foxes – can pose a
hazard to aircraft. Airports have wildlife management strategies to reduce the
CAP 1524 Local environment
March 2017
incidence of these species in and around airports. Airports must report birdstrikes by
aircraft to the CAA.
Aircraft flying over protected sites have the potential to cause disturbance
(particularly during breeding seasons) and bird congregations cause a particularly
high risk.
There are also a limited number of areas around the UK that, for civil aviation
purposes, are officially designated as bird sanctuaries. Civilian pilots are asked to
avoid flying over these areas below a specified altitude, but this is not mandatory and
these areas are not ‘no-fly’ zones. The UK Aeronautical Information Publication (UK
AIP) provides a list of designated sites.
Surface access
Thousands of people travel to airports each day. The transport choices they make
can have a significant effect on the environmental impact of the airport as a whole.
Where airports are located near busy roads, for example, extra traffic can create
significant congestion and have an impact on air quality.
There are many ways to improve airport surface access. The best options depends
on location and existing infrastructure. Many airports have published surface access
strategies, and measures taken have included:
Invest in new or improved infrastructure to enhance traffic flow and
ease congestion
Encourage more public transport use
Develop staff car sharing schemes
Actively discourage the number of car journeys to and from the
airport
Waste – airports
Waste is generated both at the terminal and when constructing new airport
infrastructures. Waste is managed locally by airports and involves a mixture of waste
disposal methods. As with any other organisation, airports are being challenged to
CAP 1524 Local environment
March 2017
recycle and re-use waste wherever possible. Waste performance data is available
below.
Waste – airlines
Waste is generated during flight. Some airlines have waste policies in place to
reduce the amount of waste as well as to encourage the re-use and recycling of
generated waste.
Catering waste originating outside of the EU must be carefully treated for bio security
reasons and must either be sent to deep landfill or incinerated.
A number of airlines publish information on waste management approaches and
performance. Visit an airline’s website to find this information.
Water quality
Aviation fuel leaks and spillages can damage water quality. There are strict rules in
place around the storage and handling of fuels. More information is available in CAP
784: Aircraft fuelling and fuel installations management, published by the CAA.
During winter months, aircraft sometimes have to be de-iced to allow their safe
departure. De-icing fluid can impact water quality if not handled correctly. The
Environment Agency has produced a report on the possible environmental impacts
of de-icing chemicals used in the UK which also contains priorities for environmental
quality standards development.
Water consumption
Some larger airports consume as much water as small towns. It is therefore
important that measures are put in place to manage water consumption and reduce
the amount of water used.
Tranquillity
Tranquillity is often linked to engagement with the natural environment and aviation
activity can disturb this. Refer to our publications around noise for further
information. Tranquillity maps are also available from the Campaign to Protect Rural
England.
CAP 1524 Local environment
March 2017
Local environment policies
To minimise the impact on wildlife, airports are required to meet a range of
legislation and carry out environmental impact assessments for any new
construction. They are also expected to be involved in local planning processes that
affect areas close to airports. There is Government guidance on safeguarding
airports which covers planning issues, but please contact your local authority or
airport for further information.
Wildlife
Across the UK, there are dozens of protected wildlife sites. The level of protection is
set out in legislation and details of such sites in England can be found on the Natural
England website.
New sites would only be added to this list where there is an existing and quantifiable
problem, supported with evidence. Any proposal for a new bird sanctuary would be
considered by the CAA and we would take account of the potential impact on both
aviation and wildlife.
National Parks and Areas of Outstanding Natural Beauty
The UK has 15 National Parks and 49 Areas of Outstanding Natural Beauty
(AONBs). These span a large area of the country and it would be impractical to ban
flight over them.
The CAA is required by law to ‘have regard to the effects’ of flying over these areas.
This must be balanced with the established Government policy of minimising flights
over densely populated areas. The CAA’s general principle is therefore to encourage
planes to avoid flying over national parks and AONBs below 7,000 ft wherever
possible while balancing this requirement with other environmental and safety
considerations.
As a public authority, the CAA also has a duty under the Natural Environment and
Rural Communities Act 2006 to conserve and enhance biodiversity.
CAP 1524 Local environment
March 2017
Data
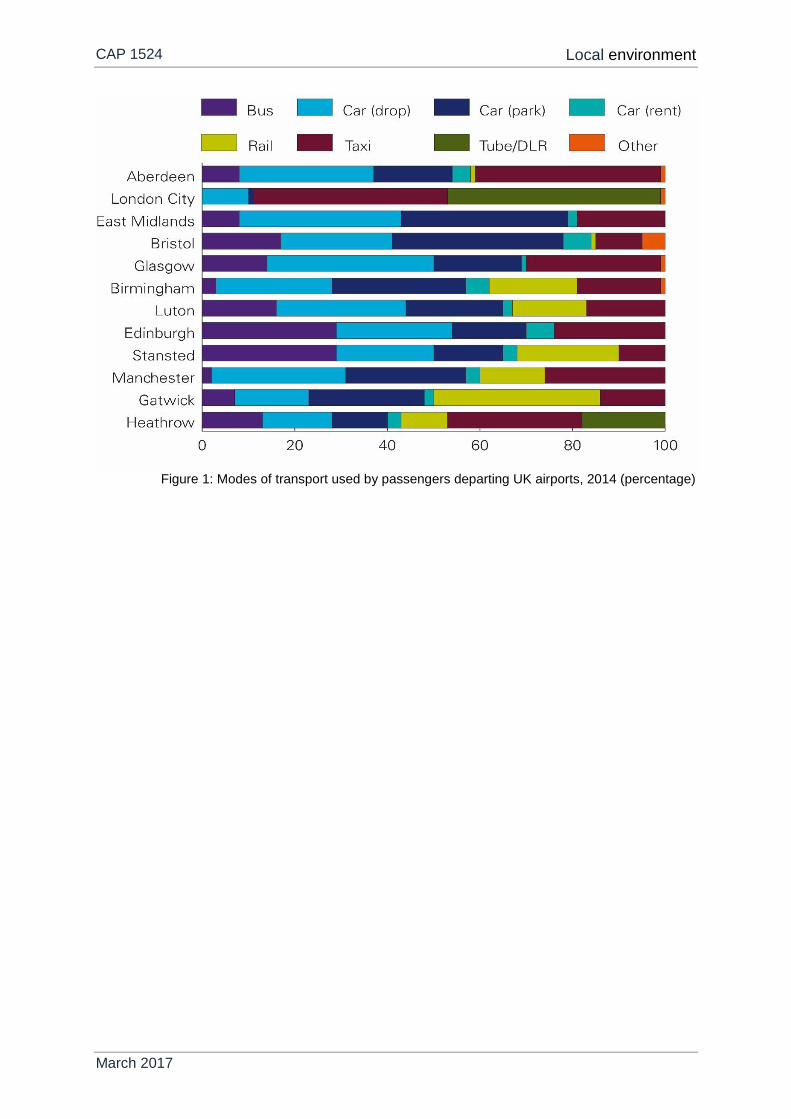
Modes of transport used to access airports, 2014
This table and the graph below show the modes of transport used by passengers
departing UK airports in 2014 (percentage)
Airport Bus Car
(drop)
Car
(park)
Car
(rent)
Rail Taxi Tube /
DLR
Other
Aberdeen 8 29 17 4 1 40 - 1
London City - 10 1 - - 42 46 1
East
Midlands
8 35 36 2 - 19 - -
Bristol 17 24 37 6 1 10 - 5
Glasgow 14 36 19 1 - 29 - 1
Birmingham 3 25 29 5 19 18 - 1
Luton 16 28 21 2 16 17 - -
Edinburgh 29 25 16 6 - 24 - -
Stansted 29 21 15 3 22 10 - -
Manchester 2 29 26 3 14 26 - -
Gatwick 7 16 25 2 36 14 - -
Heathrow 13 15 12 3 10 29 18 -
Table 14: Modes of transport by airport. Source: CAA statistics 2014
CAP 1524 Local environment
March 2017
Figure 1: Modes of transport used by passengers departing UK airports, 2014 (percentage)
CAP 1524 Local environment
March 2017
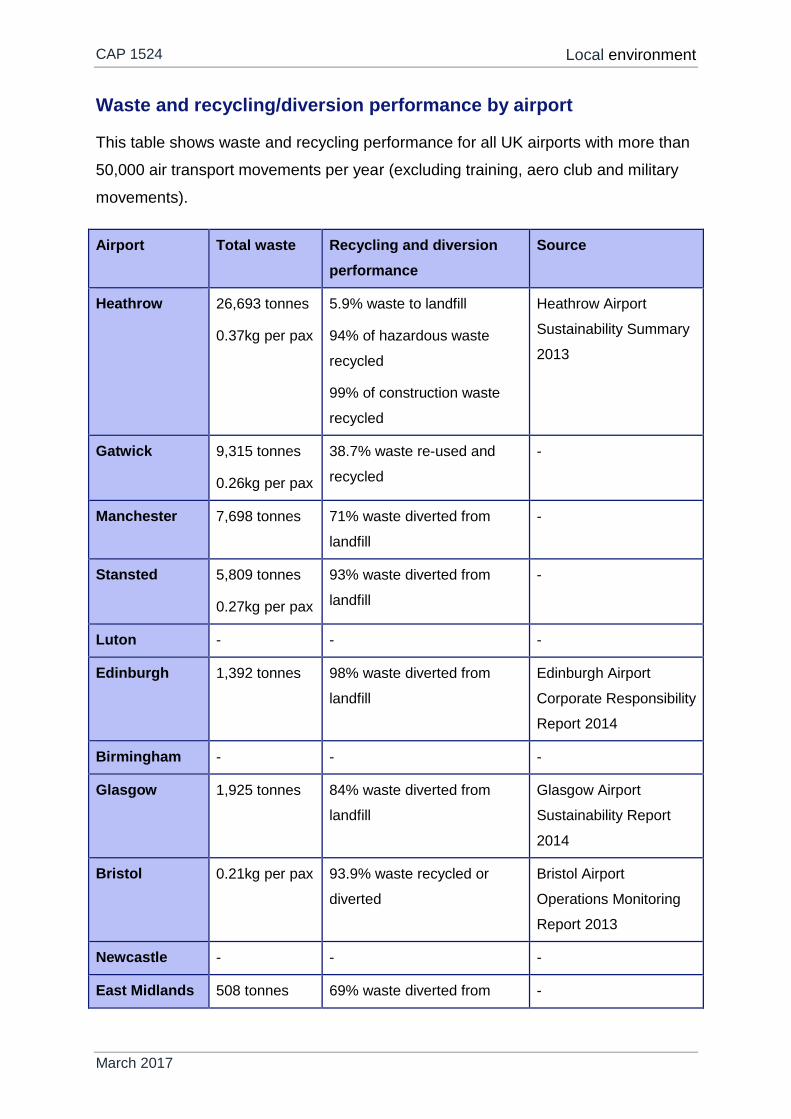
Waste and recycling/diversion performance by airport
This table shows waste and recycling performance for all UK airports with more than
50,000 air transport movements per year (excluding training, aero club and military
movements).
Airport Total waste Recycling and diversion
performance
Source
Heathrow 26,693 tonnes
0.37kg per pax
5.9% waste to landfill
94% of hazardous waste
recycled
99% of construction waste
recycled
Heathrow Airport
Sustainability Summary
2013
Gatwick 9,315 tonnes
0.26kg per pax
38.7% waste re-used and
recycled
-
Manchester 7,698 tonnes 71% waste diverted from
landfill
-
Stansted 5,809 tonnes
0.27kg per pax
93% waste diverted from
landfill
-
Luton - - -
Edinburgh 1,392 tonnes 98% waste diverted from
landfill
Edinburgh Airport
Corporate Responsibility
Report 2014
Birmingham - - -
Glasgow 1,925 tonnes 84% waste diverted from
landfill
Glasgow Airport
Sustainability Report
2014
Bristol 0.21kg per pax 93.9% waste recycled or
diverted
Bristol Airport
Operations Monitoring
Report 2013
Newcastle - - -
East Midlands 508 tonnes 69% waste diverted from -
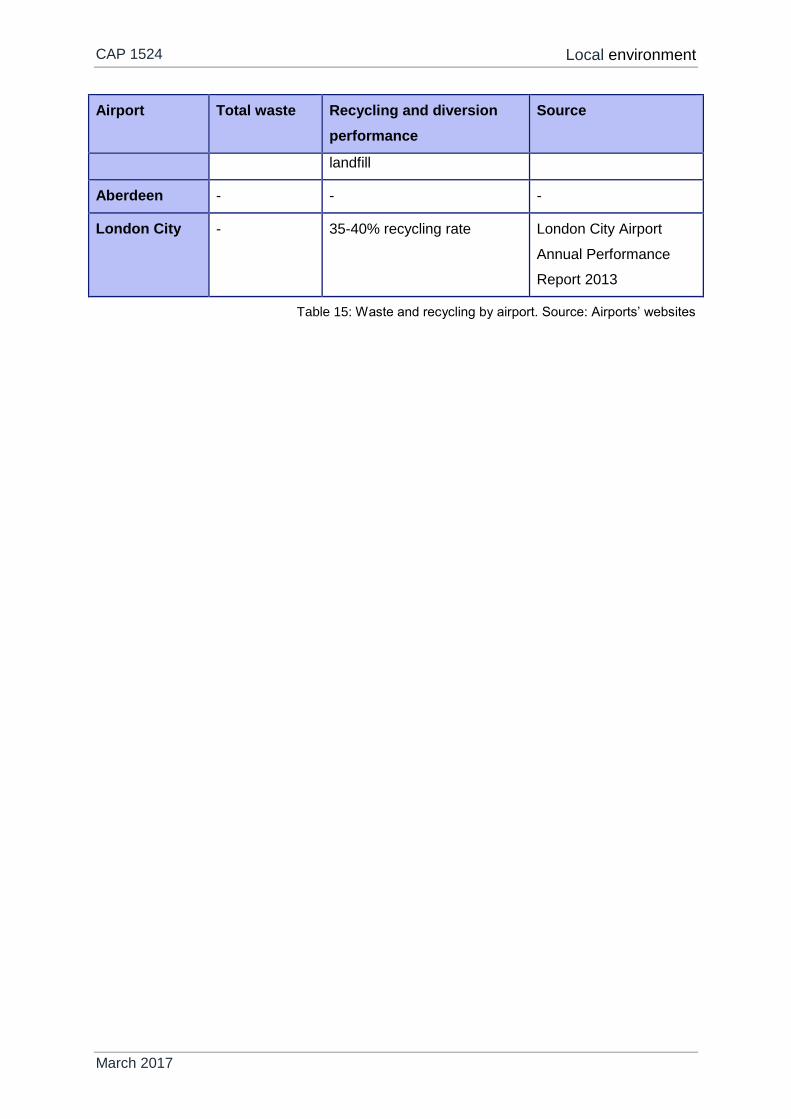
CAP 1524 Local environment
March 2017
Airport Total waste Recycling and diversion
performance
Source
landfill
Aberdeen - - -
London City - 35-40% recycling rate London City Airport
Annual Performance
Report 2013
Table 15: Waste and recycling by airport. Source: Airports’ websites
CAP 1524 Local environment
March 2017
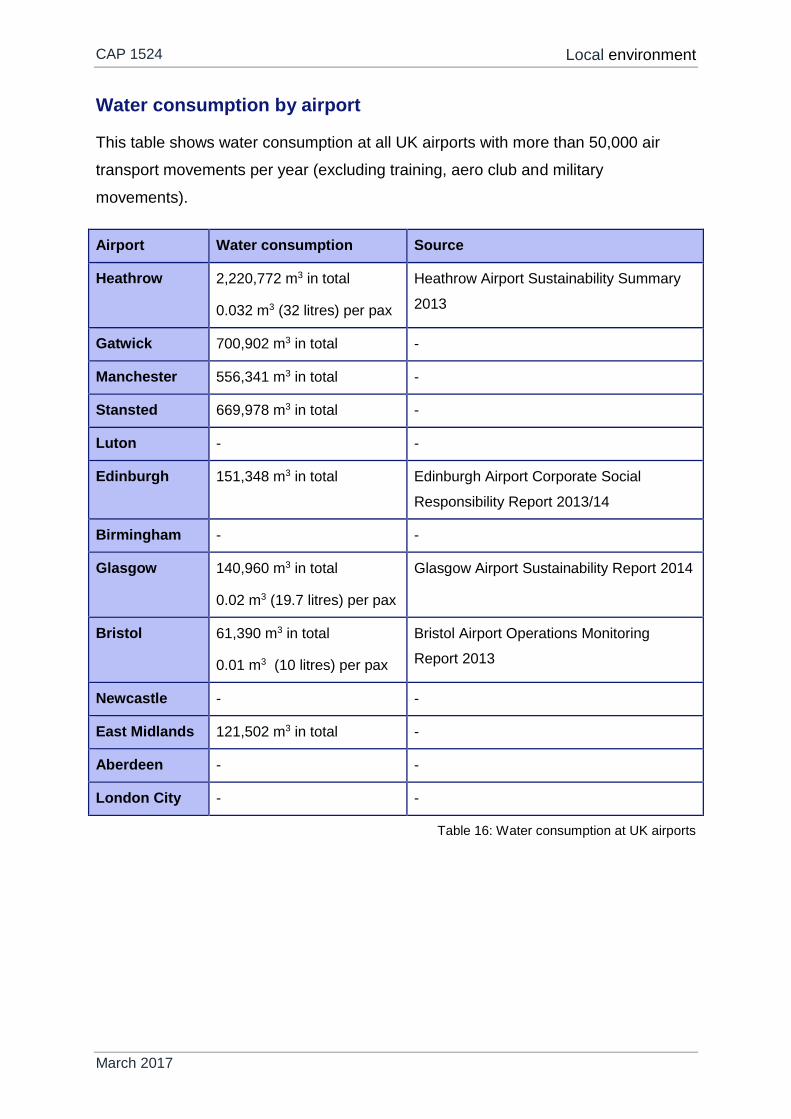
Water consumption by airport
This table shows water consumption at all UK airports with more than 50,000 air
transport movements per year (excluding training, aero club and military
movements).
Airport Water consumption Source
Heathrow 2,220,772 m3 in total
0.032 m3 (32 litres) per pax
Heathrow Airport Sustainability Summary
2013
Gatwick 700,902 m3 in total -
Manchester 556,341 m3 in total -
Stansted 669,978 m3 in total -
Luton - -
Edinburgh 151,348 m3 in total Edinburgh Airport Corporate Social
Responsibility Report 2013/14
Birmingham - -
Glasgow 140,960 m3 in total
0.02 m3 (19.7 litres) per pax
Glasgow Airport Sustainability Report 2014
Bristol 61,390 m3 in total
0.01 m3 (10 litres) per pax
Bristol Airport Operations Monitoring
Report 2013
Newcastle - -
East Midlands 121,502 m3 in total -
Aberdeen - -
London City - -
Table 16: Water consumption at UK airports
CAP 1524 Noise
March 2017
Chapter 4
Noise
Introduction
Noise is an issue at almost every airport. The laws around noise make it clear that
sound only becomes noise when it exists in the wrong place or at the wrong time,
causing annoyance, sleep disturbance or other effects. Airports in more densely
populated areas will have a greater noise impact as more people are likely to be
affected.
Aviation’s contribution to noise management
With noise best managed locally, different airports offer different types of information
and assistance depending upon both local circumstances and legal requirements.
Information available from airports may include:
Details of operational information such as runway use and direction
of take-off and landing to assess when aircraft will be flying overhead
Flight tracking tools to allow individual flights to be tracked. A
number of airports have online tools for this
More detailed information on what generates noise and how the
airport is attempting to reduce this impact
Performance reports of how an airport is performing in relation to
noise
Explanation of airspace change proposals or trials being operated
Some airports also offer schemes to help local residents insulate homes and
community buildings such as schools against noise. A few also provide direct
financial assistance to help severely affected residents relocate to quieter areas.
Noise complaints should be made to the airport in question.
Noise can still be an issue at smaller airports. The CAA provides guidance on noise
management at these sites.
CAP 1524 Noise
March 2017
Other actions that can be taken by different sectors of the aviation industry include:
Aircraft and engine manufacturers can design quieter aircraft
Air navigation service providers (ANSPs) can design airspace, air
traffic routes and operational procedures that aim to reduce the
number of people affected by noise
Airlines can use their quietest aircraft at airports where noise impacts
more people
Research organisations can undertake research into methods for
reducing aviation noise
Noise policies
European legislation
Under the EU Environmental Noise Directive, any airport with more than 50,000
aircraft movements a year or that has a significant noise impact on a densely
populated urban area must produce a noise action plan and strategic noise plans.
These must be updated every five years.
This EU Directive was transposed into the UK’s Environmental Noise Regulations
2006, and the UK Government publishes guidance to help airports in England to
develop noise action plans.
Local regulation
As noise is a local issue, some local authorities have placed additional obligations on
airports through their planning frameworks. These can include caps on the total
number of aircraft movements or restrictions on night flights. Currently, some form of
restriction exists on night flights at nineteen UK airports.
An airport or the relevant local authority should be contacted about the obligations
affecting that particular airport.
National regulation – designated airports
Under section 78-80 of the Civil Aviation Act 1982, Government has the power to
decide to regulate certain airports directly in relation to noise. Currently, Heathrow,

CAP 1524 Noise
March 2017
Gatwick and Stansted are regulated in this manner. At these airports, the
Government:
Sets noise preferential routes (NPRs) and any associated swathes
Sets limits and quotas on night flights
Produces noise contour maps
CAP 1524 Noise
March 2017
Data
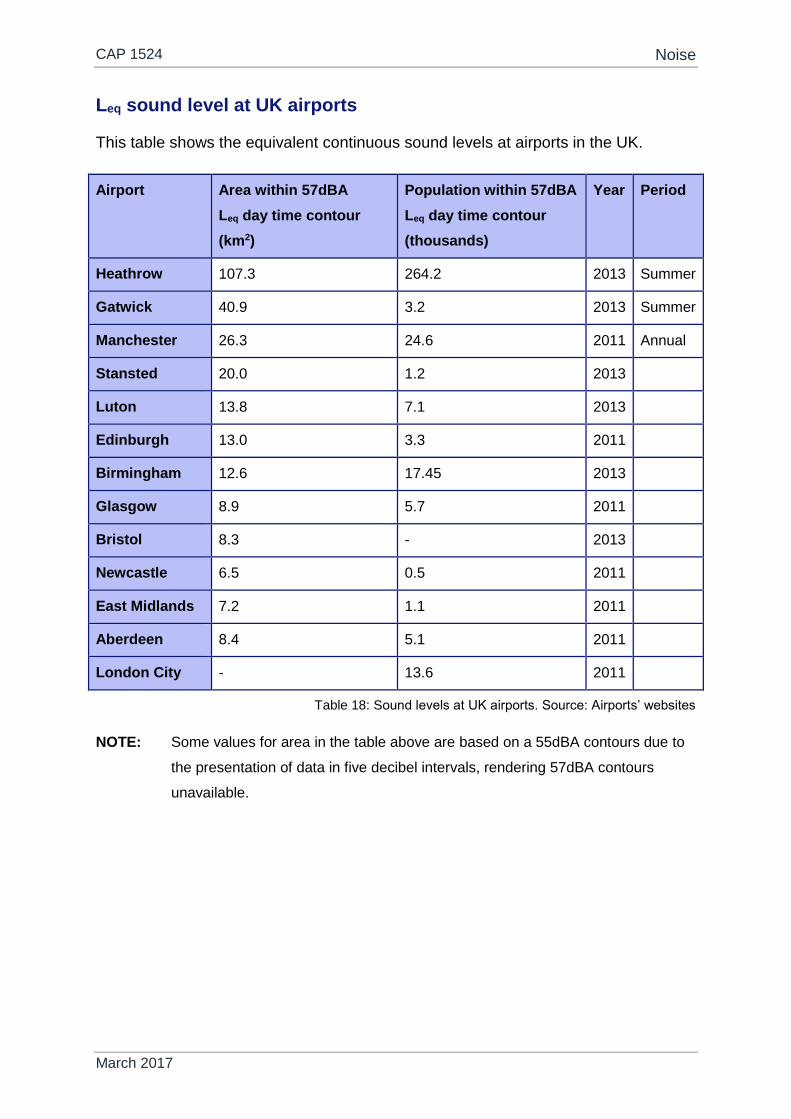
Measuring noise
Two basic measures are used for assessing the impact of noise:
Leq is the ‘equivalent continuous sound level’. The UK Government
considers a Leq of over 57dBA to represent the noise level for the
onset of significant community annoyance.
Lden uses an annual average of Leq but also takes into account the
additional disturbance of noise generated in the evening and at
night.
Noise in the following tables is measured in dBA. ‘A-weighted decibels’ (dBA) reduce
the decibel value of sounds at low and high frequencies to account for the human
ear being less sensitive to these.
CAP 1524 Noise
March 2017
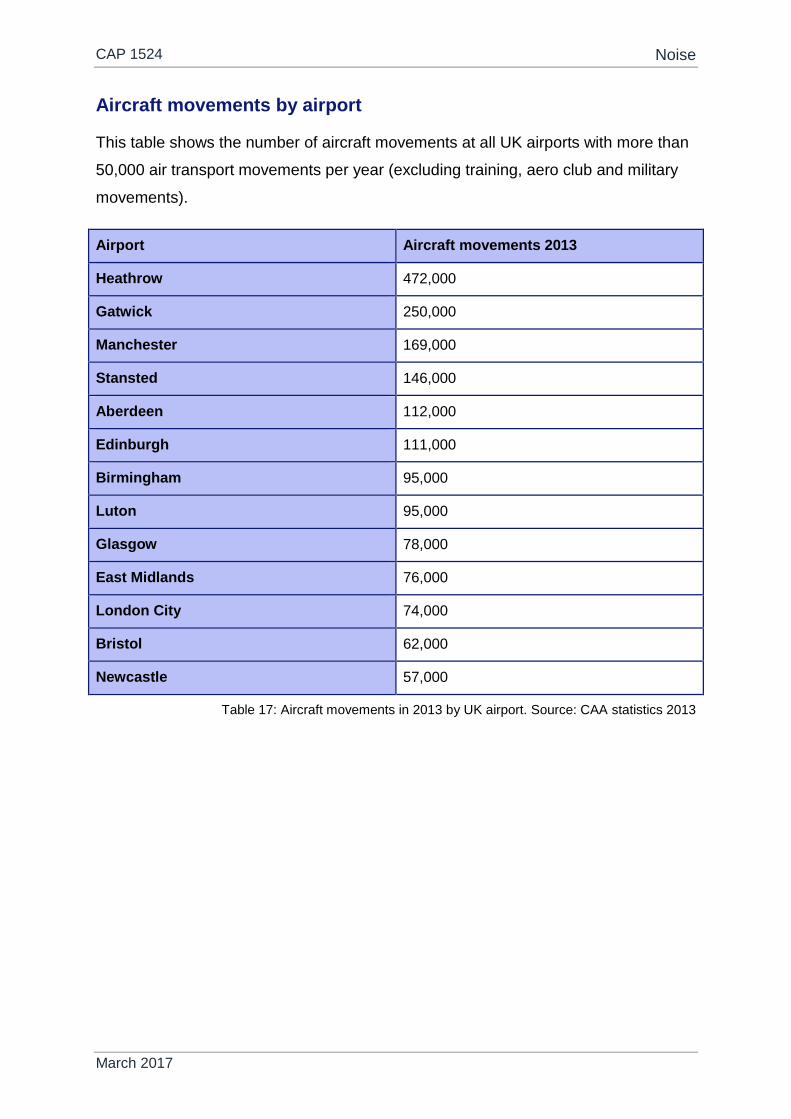
Aircraft movements by airport
This table shows the number of aircraft movements at all UK airports with more than
50,000 air transport movements per year (excluding training, aero club and military
movements).
Airport Aircraft movements 2013
Heathrow 472,000
Gatwick 250,000
Manchester 169,000
Stansted 146,000
Aberdeen 112,000
Edinburgh 111,000
Birmingham 95,000
Luton 95,000
Glasgow 78,000
East Midlands 76,000
London City 74,000
Bristol 62,000
Newcastle 57,000
Table 17: Aircraft movements in 2013 by UK airport. Source: CAA statistics 2013
CAP 1524 Noise
March 2017
Leq sound level at UK airports
This table shows the equivalent continuous sound levels at airports in the UK.
Airport Area within 57dBA
Leq day time contour
(km2)
Population within 57dBA
Leq day time contour
(thousands)
Year Period
Heathrow 107.3 264.2 2013 Summer
Gatwick 40.9 3.2 2013 Summer
Manchester 26.3 24.6 2011 Annual
Stansted 20.0 1.2 2013
Luton 13.8 7.1 2013
Edinburgh 13.0 3.3 2011
Birmingham 12.6 17.45 2013
Glasgow 8.9 5.7 2011
Bristol 8.3 - 2013
Newcastle 6.5 0.5 2011
East Midlands 7.2 1.1 2011
Aberdeen 8.4 5.1 2011
London City - 13.6 2011
Table 18: Sound levels at UK airports. Source: Airports’ websites
NOTE: Some values for area in the table above are based on a 55dBA contours due to
the presentation of data in five decibel intervals, rendering 57dBA contours
unavailable.
CAP 1524 Noise
March 2017
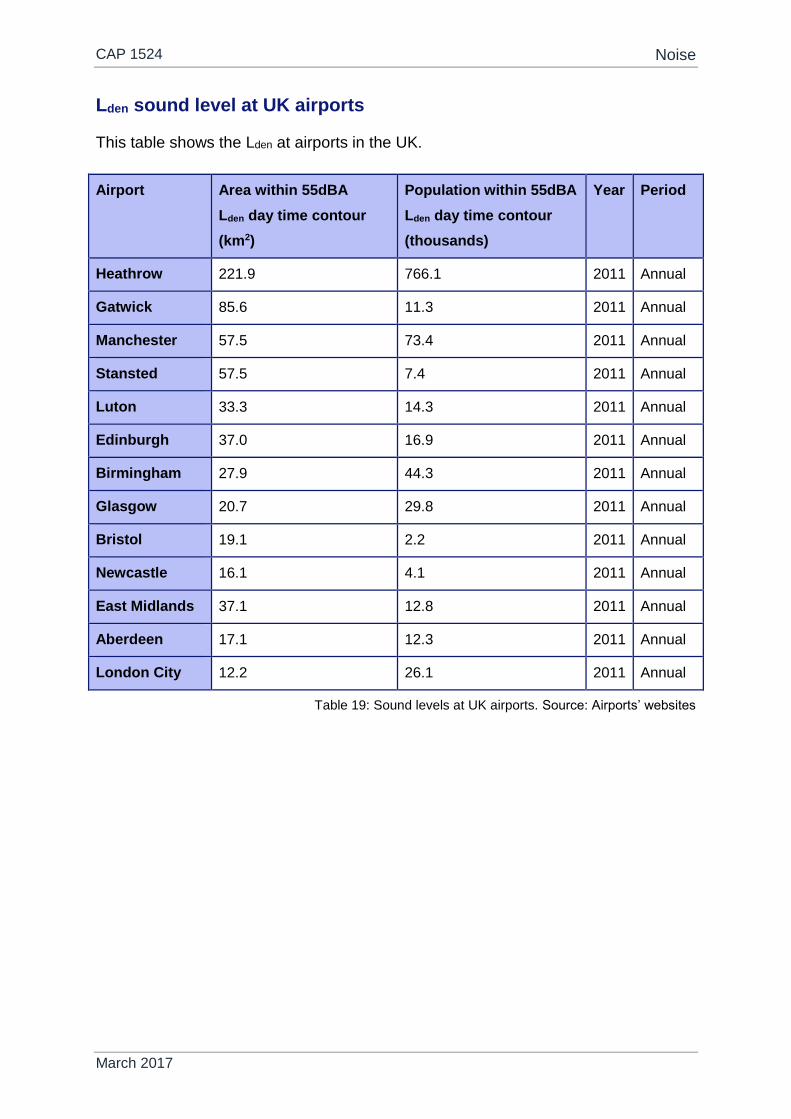
Lden sound level at UK airports
This table shows the Lden at airports in the UK.
Airport Area within 55dBA
Lden day time contour
(km2)
Population within 55dBA
Lden day time contour
(thousands)
Year Period
Heathrow 221.9 766.1 2011 Annual
Gatwick 85.6 11.3 2011 Annual
Manchester 57.5 73.4 2011 Annual
Stansted 57.5 7.4 2011 Annual
Luton 33.3 14.3 2011 Annual
Edinburgh 37.0 16.9 2011 Annual
Birmingham 27.9 44.3 2011 Annual
Glasgow 20.7 29.8 2011 Annual
Bristol 19.1 2.2 2011 Annual
Newcastle 16.1 4.1 2011 Annual
East Midlands 37.1 12.8 2011 Annual
Aberdeen 17.1 12.3 2011 Annual
London City 12.2 26.1 2011 Annual
Table 19: Sound levels at UK airports. Source: Airports’ websites
CAP 1524 Sources of further information
March 2017
Appendix A
Sources of further information
Climate change
The Omega Project, run by the Manchester Metropolitan University
between 2007 and 2009, investigated factors associated with the
sustainable development of the UK air transport sector. The project
involved many leading individuals and organisations in the world of
sustainable aviation and led to a wealth of resources and knowledge
being created on the subject, including greenhouse gases.
The UK Government’s Non-CO2 greenhouse gas emissions
projections report: Autumn 2013
The Climate Change Act 2008
The Committee on Climate Change (CCC), an independent body set
up under the Climate Change Act, has assessed the evidence
behind climate change and has extensive information on climate
effects.
The CCC’s Meeting the UK Aviation target – options for reducing
emissions to 2050
The Carbon Disclosure Project
Air quality
UK Air provides comprehensive information on types of pollutants,
their sources and their effects
Aviation-specific information on local air quality can be found from
the Centre for Aviation Transport and Environment at Manchester
Metropolitan University, and the Laboratory for Aviation and the
Environment at MIT.
You can find out if you live in an AQMA (air quality management
area) online.

CAP 1524 Sources of further information
March 2017
You can check the local air quality in your area using UK Air’s Daily
Air Quality Index.
ICAO air quality pages
Sustainable Aviation’s Industry Code of Practice for Reducing the
Environmental Impacts of Ground Operations and Departing Aircraft
(technical information).