Embed Size (px)
Citation preview
MANAGEMENT SCIENCEArticles in Advance, pp. 1–24
http://pubsonline.informs.org/journal/mnsc/ ISSN 0025-1909 (print), ISSN 1526-5501 (online)
InformedQ: 1 Options, 2 Trading Prior to Takeover Announcements:Insider Trading?
Q: 3 Patrick Augustin,a Menachem Brenner,b Marti G. Subrahmanyamb
aDesautels Faculty of Management, McGill University, Montreal, Quebec H3A 1G5, Canada; bLeonard N. Stern School of Business,New York University, New York, New York 10012Contact: [email protected], http://orcid.org/0000-0001-9138-4860 (PA); [email protected] (MB);[email protected] (MGS)
Received: December 3, 2015Revised: August 26, 2016; December 15, 2017Accepted: April 8, 2018Published Online in Articles in Advance:∎∎ ∎∎, 2018
https://doi.org/10.1287/mnsc.2018.3122
Copyright: © 2018 INFORMS
Abstract. We quantify the pervasiveness of informed trading activity in target companies’equity options before the announcements of 1,859 U.S. takeovers between 1996 and 2012.About 25% of all takeovers have positive abnormal volumes, which are greater for short-dated, out-of-the-money calls, consistent with bullish directional trading before the an-nouncement. Over half of this abnormal activity is unlikely due to speculation, news andrumors, trading by corporate insiders, leakage in the stock market, deal predictability, orbeneficial ownership filings by activist investors. We also examine the characteristics ofoption trades litigated by the Securities and Exchange Commission (SEC) for alleged illegalinsider trading. Although the characteristics of such trades closely resemble the patterns ofabnormal option volume in the U.S. takeover sample, we find that the SEC litigates onlyabout 8% of all deals in it.
History: Accepted by Lauren Cohen, finance.Funding: ThisQ: 4 project was supported by the Social Sciences & Humanities Research Council of Canada[SSHRC 430-2014-00747] and the ChicagoMercantile Exchange. P. Augustin acknowledges financialsupport from the Institute of Financial Mathematics of Montreal.
Supplemental Material: The online appendix is available at https://doi.org/10.1287/mnsc.2018.3122.
Keywords: civilQ: 5
litigations • derivatives • insider trading • mergers and acquisitions
1.Q: 6 IntroductionHowQ: 7 pervasive is informed options trading aroundtakeover announcements? Cao et al. (2005), for ex-ample, suggest that abnormal trading in equity op-tions prior to takeover announcements is informed, asdirectional trading activity positively foreshadowsfuture price movements.1 This finding raises questionsabout the nature of the run-up in option volumesbefore takeover announcements and the distributionof informed trading across deals. Is the run-up drivenby a few deals with significant volumes, or do all dealscontribute to the options activity that is abnormal onaverage? What information drives the individual run-ups in option volumes, and can they be explained bypublicly available sources of information besides il-legal insider trading? In this paper, we characterizethe pervasiveness of informed options trading aroundtakeover announcements and study the sources ofthe preannouncement run-up in option volumes.
We first quantify the pervasiveness of informedtrading in the equity options of target companies aheadof 1,859 U.S. takeover transactions between January1996 and December 2012. To better understand thesources of informed trading, in the second step, weexamine a large number of channels that could
plausibly explain the abnormal trading volumes inoptions based on correct anticipation of upcomingtakeover activity. It is the deal-by-deal examination ofthe preannouncement activity that allows us to ex-amine the overlaps in explanations across deals andto identify the deals with abnormal options activitythat are unlikely to be anticipated. Third, we alsoverify whether the run-up may be the result of illegalinsider trades reported by the Securities and Ex-change Commission (SEC), and we compare thecharacteristics of all option trades litigated for allegedillegal insider trading with those of the preannouncementoptions activity. This comparison strengthens our as-sessment of the nature and sources of the preannounce-ment run-up in option volumes.We document that about 25% (467) of all deals in our
sample have abnormal volumes of equity options overthe 30-day period preceding the takeovers, which arestatistically significant at the 5% level. The proportion ofcases with abnormal volumes is relatively higher for calloptions than for put options. Stratifying the results by“moneyness,” we find that there is significantly higherabnormal trading volume in out-of-the-money (OTM)call options comparedwith at-the-money (ATM) and in-the-money (ITM) calls.2
1
An examination of the characteristics of cumulativeabnormal volume shows that informed trading is morepervasive for larger deals, those for which informedinvestors may potentially have less uncertainty aboutthe final takeover price, and in cases where target firmsreceive cash offers. We study the trading volume,implied volatility, and bid-ask spreads of equity op-tions, and we consider a number of robustness testsQ: 8 ,which support the evidence of informed investorstrading directionally in anticipation of a price jump inthe target company’s stock. It is the deal-by-deal ex-amination of the preannouncement activity that helpsus appreciate the pervasiveness of informed trading intakeover transactions.
We next explore whether the takeover announce-ments could have been anticipated based on publicsources of information.We first show that the run-up inoptions volume is unlikely due to speculative tradingactivity in response to observable stock trading ac-tivity or industry and firm characteristics. We com-pare the options activity in the takeover sample toseveral control samples that are matched either on thestock market activity or on industry and firm char-acteristics. Informed trading activity in options aheadof takeover announcements is absent from these con-trol groups.
In addition, we examine how much of the informedoptions activity can be explained by news and rumors.To identify rumors and news about upcoming take-overs, we use RavenPack News Analytics, a databasethat is constructed from textual information in majornewspaper outlets, public relations feeds, and morethan 19,000 other traditional and social media websites.We associate news with 170 takeover transactions andwith only 9% (40/467) of the deals that exhibit in-formed options activity. We find no statistically sig-nificant difference in the average cumulative abnormaloptions trading volumes between the sample of 170takeovers with news and the sample of 1,689 withoutnews. We further check whether the option tradesoriginate from corporate insider accounts. Corporateofficers, directors, or large block-holders are legallyrequired to disclose security transactions in theircompany’s options. An analysis of the derivativetransactions and holdings information in the ThomsonReuters insider filings reveals that not a single optionstransaction was executed by registered insiders in the30-day period before the announcement.
We also consider the possibility that astute optiontraders trade on information leakage in the stockmarket. However, our analysis suggests that optionvolume leads stock volume, and that past stock volumeand return performance is not significantly related tofuture abnormal options activity. In addition, we findthat only 7% of the deals in our sample exhibit ab-normal stock returns in the preannouncement period,
whereas about 44% of all deals exhibit excess impliedvolatility. Although 19% of the takeover transactionsexhibit statistically significant abnormal stock volume—a frequency somewhat lower than in the optionsmarket—the economic magnitude is substantiallysmaller. Thus, quantifying how many deals are subjectto informed trading may also be informative aboutwhether informed trading is more prevalent in theoptions or in the stock market.Next, we show that it is difficult to predict takeover
announcements based on publicly available informa-tion. Thus, the documented abnormal option tradingvolume is unlikely due to traders’ ability to time themarket. However, we observe that most of the in-formed activity arises in the 5–10 days before the in-formation gets publicly released. Finally, we screen theSchedule Q: 913D beneficial ownership reports, which needto be filed by registered active investment advisors nolater than 10 days following the acquisition of beneficialownership of more than 5% of any class of publiclytraded securities. The trading we identify by suppos-edly informed activist investors is unlikely to fullyexplain the abnormal options activity, as only 17 ofthese deals have a filing in the 30-day period prior tothe takeover announcement date.Of the 467 deals in our sample with significant cu-
mulative abnormal options volume, 13% (236) areunlikely to be associated with publicly availablesources of information. In the subsample of 236 deals,we exclude those deals that exhibit statistically sig-nificant stock volume or returns, which appear to lagthe option market in the takeover preannouncementperiod. An additional channel that may drive the run-up in options volume could be illegal insider trading.Therefore, we filter through more than 8,000 publicSEC litigation records dated between 1990 and 2013 toidentify whether the takeover transactions in oursample were subject to a litigation for alleged insidertrading. We find that the SEC litigated about 8% of thetakeovers in our sample for insider trading in optionsor stocks and only 9% (43/467) of the transactions thatwe associate with informed trading. Moreover, only10% (24/236) of the deals that we fail to associate withpublic sources of information are involved in a litiga-tion. Thus, the number of civil lawsuits for insidertrading appears modest in comparison with the per-vasive informed trading activity reflected in 25% of thetakeover transactions.Using the SEC’s litigation records, we hand-collect
information on the size, timing, and type of illegaltrades; we supplement with information in the criminalrecords from the U.S. Department of Justice (DoJ). The Q: 10
characteristics of the illegal option trades—that is,short-dated OTM call options on target companiesthat are initiated, on average, 21 days before theannouncement—closely resemble the characteristics
Augustin, Brenner, and Subrahmanyam: Options Trading Before Takeover Announcements2 Management Science, Articles in Advance, pp. 1–24, © 2018 INFORMS

and timing of the abnormal options activity in a rep-resentative sample of takeover transactions. Thisresemblance, coupled with the absence of public informa-tion sources that could have led to the anticipation ofthe takeover transaction, calls for further regulatoryexamination of the informed options activity.
DeMarzo et al. (1998) suggest that it may be optimalto prosecute insiders only after large price moves orafter large volume transactions. We find that the SEC islikely to examine large target firms that experiencesubstantial abnormal returns after the takeover an-nouncement and in which the acquirers are head-quartered outside the United States. We find, however,no evidence that the probability of litigation is posi-tively related to the preannouncement abnormal op-tions volume.
We extend the literature along three key dimensions.FirstQ: 11 , in this paper, we quantify the prevalence of in-formed trading and document that the informed op-tions activity is driven by 25% of all deals, in contrast toprior research. Second, we diverge from previous workand examine the sources of informed trading in theoptions market and show that for at least 13% of alldeals, it is difficult to associate the abnormal optionsactivity with public sources of information. Third,a unique feature of our research is that we study thecharacteristics of SEC-litigated cases related to insidertrading in options prior to takeover announcements.This allows us to compare the nature of abnormaloptions activity to illegal option trades and examinehow the SEC’s litigation record relates to abnormaloptions trading around takeover announcements.
2. Literature ReviewThe run-up in the stock prices of target companiesbefore merger and acquisition (M&A) announcementsis well documented (Mandelker 1974, Dodd 1980,Asquith 1983, Jensen and Ruback 1983, Dennis andMcConnell 1986, Schwert 1996). A long-standing de-bate relates to whether this run-up is due to publicinformation such as, for example, media speculation(Jarrell and Poulsen 1989), or whether it is the result ofprivate information leakage and illegal insider trading(Keown and Pinkerton 1981, Meulbroek 1992, Sandersand Zdanowicz 1992).
Abnormal options volume and price activity aheadof M&A announcements have been the subject of manypapers, particularly in recent years. Jayaraman et al.(1991) are the first to document a preannouncementincrease in the option-implied volatilities of targetcompanies that precede an increase in stock returns, asconfirmed by Levy and Yoder (1993). Jayaraman et al.(2001) document that the abnormal options volume isaccompanied by abnormal open interest that is con-centrated in short-term OTM options, that it leadsabnormal stock volume, and that the increase in
abnormal options volume is greater for call than for putoptions. Using signed volume, Cao et al. (2005) supportthe presence of informed activity because prior totakeover announcements, the option volume orderimbalance contains information regarding subsequentstock price movements, greater call volume balancesare associated with greater announcement returns,and the options market displaces the stock market forinformation-based trading (see also Arnold et al.2006). Acharya and Johnson (2010) show that a largenumber of equity participants in leveraged buyoutsyndicates is associated with greater levels of suspi-cious stock and options activity. Clements and Singh(2011) argue that preannouncement options volumereflects both informed and “contraire” trading, andShafer (2012) documents a positive correlation be-tween the preannouncement option-to-stock volumeratio and the probability of being a takeover targetthat becomes weaker after Regulation Fair Disclosurein 2000.Many studies have corroborated the evidence of
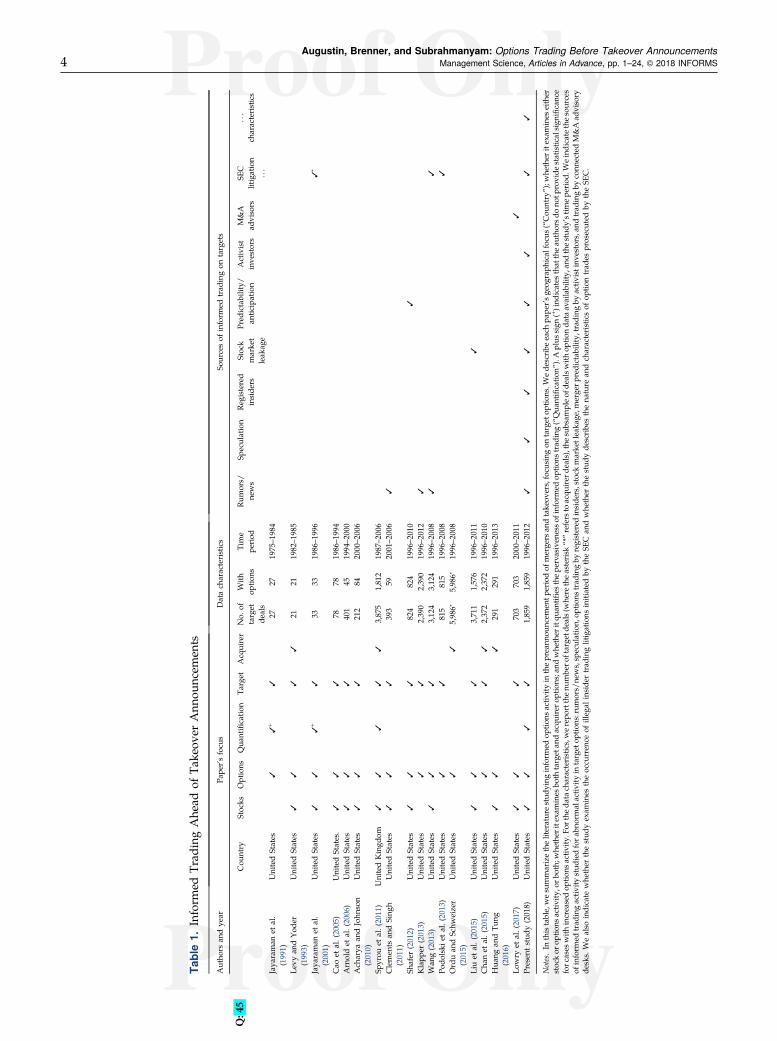
abnormal preannouncement option activity in targetcompanies in the United States and United Kingdom(Spyrou et al. 2011). The literature emphasizes differentaspects of the preannouncement activity, includingabnormal changes in the implied Q: 12volatility (IV) skew,IV spread, and the option-to-stock volume ratio(Klapper 2013); a positive correlation between pre-announcement run-up and abnormal options volume(Wang 2013); an increasing importance of options’leading role for price discovery (Liu et al. 2015); ora greater propensity of informed trading to occur inmore liquid and higher leverage options (Podolski et al.2013). Chan et al. (2015) show that the one-day pre-event implied volatility spread (the implied volatilityskew), a proxy for informed option trading, is posi-tively (negatively) associated with acquirer cumulativeabnormal returns. Ordu and Schweizer (2015) associ-ate greater abnormal volumes with greater chief Q: 13ex-ecutive officer wealth-to-performance sensitivity forstock-financed takeovers, suggesting that informed man-agers hedge anticipated negative acquirer announce-ment returns. Focusing also on acquirers, Huang andTung (2016) find a positive relation between an-nouncement returns and preannouncement option-to-stock volume ratios, which are positively related toidiosyncratic stock volatility. Chesney et al. (2015)propose a method for detecting abnormal options ac-tivity and relate six unusual transactions to M&Aannouncements. Kedia and Zhou (2014) conclude infavor of preannouncement informed trading in targetbonds. Poteshman (2006) concludes that informed in-vestors traded put options ahead of the 9/11 terroristattacks.In Table 1, we show the differences between this
study and prior work. Apart from Spyrou et al. (2011),
Augustin, Brenner, and Subrahmanyam: Options Trading Before Takeover AnnouncementsManagement Science, Articles in Advance, pp. 1–24, © 2018 INFORMS 3
Tab
le1.
Inform
edTrad
ingAhe
adof
Take
over
Ann
ounc
emen
ts
Autho
rsan
dye
arPa
per’sfocu
sDatach
aracteristics
Sourcesof
inform
edtrad
ingon
targets
Cou
ntry
Stocks
Options
Qua
ntificatio
nTa
rget
Acquirer
No.
oftarget
deals
With
optio
nsTime
period
Rum
ors/
news
Speculation
Reg
istered
inside
rsStock
marke
tleak
age
Pred
ictability/
antic
ipation
Activist
inve
stors
M&A
advisors
Q:45
SEC
litigation
...
...
characteristics
Jaya
raman
etal.
(199
1)UnitedStates
33
+3
2727
1975–1
984
Levy
andYod
er(199
3)UnitedStates
33
33
2121
1982–1
985
Jaya
raman
etal.
(200
1)UnitedStates
33
3+
333
3319
86–1
996
3∗
Cao
etal.(20
05)
UnitedStates.
33
378
7819
86–1
994
Arnoldet
al.(20
06)
UnitedStates
33
340
145
1994–2
000
Ach
arya
andJohn
son
(201
0)UnitedStates
33
321
284
2000–2
006
Spyrou
etal.(20
11)
UnitedKingd
om3
33
33
3,87
51,81
219
87–2
006
Clemen
tsan
dSing
h(201
1)UnitedStates
33
339
359
2001–2
006
3
Shafer
(201
2)UnitedStates
33
382
482
419
96–2
010
3
Klapp
er(201
3)UnitedStates
33
2,39
02,39
019
96–2
012
3
Wan
g(201
3)UnitedStates
33
33,12
43,12
419
96–2
008
33
Podo
lski
etal.(20
13)
UnitedStates
33
815
815
1996–2
008
3
Orduan
dSchw
eizer
(201
5)UnitedStates
33
5,98
6∗5,98
6∗19
96–2
008
Liuet
al.(20
15)
UnitedStates
33
33,71
11,57
619
96–2
011
3
Cha
net
al.(20
15)
UnitedStates
33
32,37
22,37
219
96–2
010
Hua
ngan
dTu
ng(201
6)UnitedStates
33
329
129
119
96–2
013
Lowry
etal.(20
17)
UnitedStates
33
370
370
320
00–2
011
3
Presen
tstud
y(201
8)UnitedStates
33
33
1,85
91,85
919
96–2
012
33
33
33
33
Notes.In
thistable,wesu
mmarizetheliteraturestud
ying
inform
edop
tions
activ
ityin
thepreann
ounc
emen
tperiodof
merge
rsan
dtake
overs,focu
sing
ontarget
optio
ns.W
ede
scribe
each
pape
r’sge
ograph
ical
focu
s(“Cou
ntry”);w
hether
itexam
ines
either
stockor
optio
nsactiv
ity,o
rboth;
whe
ther
itexam
ines
both
target
andacqu
irer
optio
ns;and
whe
ther
itqu
antifi
esthepe
rvasiven
essof
inform
edop
tions
trad
ing(“Qua
ntificatio
n”).Aplus
sign
(+)ind
icates
that
theau
thorsdo
notp
rovide
statistic
alsign
ificanc
eforc
ases
with
increasedop
tions
activ
ity.F
ortheda
tach
aracteristics,werepo
rtthenu
mbe
roftarge
tdeals(w
here
theasterisk
“*”refers
toacqu
irer
deals),the
subsam
pleof
dealswith
optio
nda
taav
ailability,
andthestud
y’stim
epe
riod
.Weindicatethesources
ofinform
edtrad
ingactiv
itystud
iedfora
bnormal
activ
ityin
target
optio
ns:rum
ors/
news,sp
eculation,
optio
nstrad
ingby
registered
inside
rs,stock
marke
tleaka
ge,m
erge
rpredictab
ility,trading
byactiv
istinv
estors,and
trad
ingby
conn
ectedM&Aad
visory
desks.W
ealso
indicate
whe
ther
thestud
yexam
ines
theoccu
rren
ceof
illeg
alinside
rtrad
inglitigations
initiated
bytheSE
Can
dwhe
ther
thestud
yde
scribe
sthena
ture
andch
aracteristicsof
optio
ntrad
esprosecuted
bytheSE
C.
Augustin, Brenner, and Subrahmanyam: Options Trading Before Takeover Announcements4 Management Science, Articles in Advance, pp. 1–24, © 2018 INFORMS
who examine UK data, most studies are not informa-tive about the distribution of informed options trading.For a small sample that is not representative of optiontrading over the last two decades, Jayaraman et al.(1991, 2001) identify positive changes in implied vol-atilities, without mentioning statistical significance. Bycontrast, we examine deals, case by case, and em-phasize how and where insiders trade in the optionsmarket: they engage in directional strategies for targets,which are reflected in more pronounced abnormalactivity in OTM calls and cash-financed takeovers. Inaddition, we consider synthetic option strategies thatlead to long bullish or short bearish exposures fortargets, and we review earlier evidence, as the findingsappear to be inconsistent across studies.3
Importantly, there is only scarce information on thesources of informed options trading for target firms.Klapper (2013) and Wang (2013) examine media spec-ulation and rumors, but their results are inconsistentwith each other.4 Liu et al. (2015) provide some evidenceagainst the leakage hypothesis but do not explainwhether abnormal options activity for a given dealmightbe the result of abnormal stock activity. Lowry et al.(2016) indicate that trading desks connected to M&Aadvisory desks take abnormal call option positions in thetarget companies from seven quarters to one quarterbefore the announcement. Ordu and Schweizer (2015)examine the sources of informed trading (managers) butfocus on the options of the acquirers. Our focus here is ondocumenting the abnormal options activity for the targetfirms and identifying the specific types of options tradedbefore the announcement.
Some authors examine the illegal insider trading in-vestigated by the SEC (Jayaraman et al. 2001, Podolskiet al. 2013) or study the predictability of SEC litigations(Wang 2013). Using a proprietary sample of illegal tradeslitigated by the SEC, Meulbroek (1992) and Meulbroekand Hart (1997) document that insider trades have animmediate effect on stock prices, that half of the pre-announcement run-up occurs on insider trading days,and that the announcement returns are a third largerwhen insider trading is detected. Frino et al. (2013) studyhand-collected SEC litigations and find that illegal stocktrades are positively associated with subsequent pricechanges but negatively associated with the size of thepenalties and the stock’s liquidity. However, we find noinformation in the literature on the characteristics andpatterns of option trades litigated for illegal insidertrading, nor on how prosecution relates to the degree ofabnormal options activity. In this paper, we relate ourresults to the literature associated with illegal insidertrading in stocks.
Cornell and Sirri (1992) and Chakravarty andMcConnell (1997, 1999) conduct clinical studies ofillegal stock trades ahead of the 1982 takeover ofCampbell Taggart by Anheuser-Busch and the 1984
takeover of Carnation by Nestlé. Both studies findpositive price impactsand either a positive or no effect onbid-ask spreads or depth. Fishe and Robe (2004) findthat trading by brokers, who illegally had advanceaccess to news information on 116 stocks, negativelyimpacted market depth. Guercio et al. (2017) argue thatillegal insider trading has decreased in response tomore aggressive regulatory enforcement. Ahern (2017)describes insider trading networks from civil andcriminal prosecutions initiated by the SEC and the DoJ,and Kacperczyk and Pagnotta (2016) show that marketprice and liquidity signals are impacted by illegal tradingusing SEC litigation information. Heitzman and Klasa(2016) document that investors trade quickly in stocksupon new information from nonpublic merger negoti-ations. Bhattacharya (2014) provides a comprehensiveliterature review of insider trading. For a discussionon the legal aspects of insider trading, see, for ex-ample, Arshadi (1998) and Crimmins (2013).Our focus differs from the literature examining in-
formed stock trading by corporate insiders. For ex-ample, Cohen et al. (2012) show that only opportunistictransactions, as opposed to routine transactions, havepredictive content for stock prices. Agrawal andNasser(2012) discuss widespread “passive” insider trading ontargets, whereby registered insiders increase their netexposure through reduced stock selling. Our focus is onoption trading, not stock trading.Our work broadly relates to the literature on when
and how informed agents choose to trade in the optionsmarket in the presence of asymmetric information(Easley et al. 1998), differences in opinion (Cao and Ou-Yang 2009), short-sale constraints (Johnson and So 2012),or margin requirements and wealth constraints (Johnet al. 2003) and on the predictability of option-impliedmeasures for stock returns (Easley et al. 1998, Pan andPoteshman 2006, Cremers and Weinbaum, 2010, Xinget al. 2010, Jin et al. 2012, Johnson and So 2012, Hu 2014,Tse-Chun and Xiaolong 2015). Several other papers areperipherally related to this paper. Roll et al. (2010) studythe relation Q: 14between the option-to-stock trading volumeand postearnings announcement returns. Subramanian(2004) and Bester et al. (2011) develop theoretical optionpricingmodels for the target in the case of stock-for-stockand cash mergers, respectively.
3. Data Selection and TakeoverDeal Characteristics
The data for our study come from three primarysources: the Thomson Reuters Securities Data Com-pany Platinum (SDC) database, the Center for Researchin Securities Prices (CRSP) database, and the Option-Metrics database. We start our sample selection withthe full domestic M&A data set for U.S. target firmsfrom SDC Platinum for the time period from Q: 15January
Augustin, Brenner, and Subrahmanyam: Options Trading Before Takeover AnnouncementsManagement Science, Articles in Advance, pp. 1–24, © 2018 INFORMS 5
1996, the starting date for available option informationin OptionMetrics, through December 2012. Our finalsample consists of 1,859 takeover transactions for whichwe were able to identify matching stock and optioninformation for the target. These deals were undertakenby 1,279 unique acquirers on 1,669 unique targets.5
Starting from an initial sample of 185,419 trans-actions, we restrict the study to deals aimed at af-fecting a change of control, where the acquirer ownedless than 50% of the target’s stock before the trans-action andwas seeking to ownmore than 50% after it.Hence, our sample includes only M&As of majorityinterest, excluding all deals that were acquisitions ofremaining or partial interest (minority stake purchases),acquisitions of assets, recapitalizations, or buybacks/repurchases/self-tender and exchange offers. In addi-tion, we exclude deals with pending or unknown status(i.e., we only include completed, tentative, or with-drawn deals). These restrictions reduce the sample sizeto 34,350 deals. Next, we require information on thedeal value and eliminate deals with a transaction valuebelowUSD 1million, which reduces the sample furtherto 19,064 transactions. Finally, we match the infor-mation from SDC with price and volume informationin both the CRSP and OptionMetrics databases. Werequire a minimum of 90 days of valid stock and option
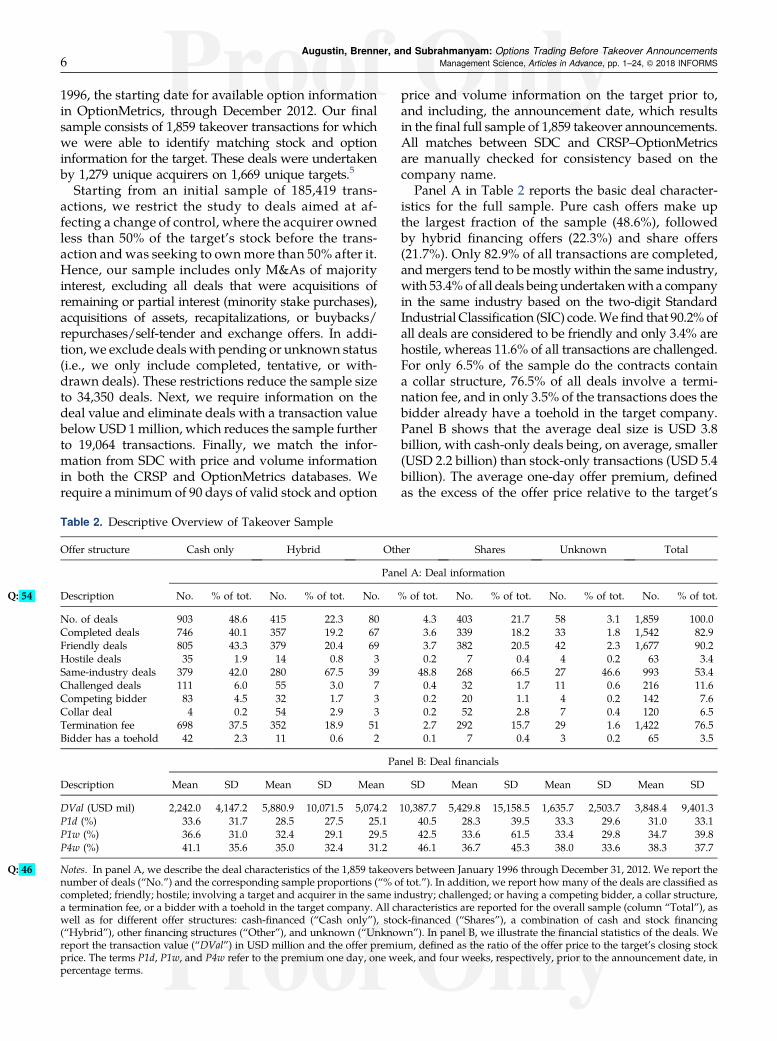
price and volume information on the target prior to,and including, the announcement date, which resultsin the final full sample of 1,859 takeover announcements.All matches between SDC and CRSP–OptionMetricsare manually checked for consistency based on thecompany name.Panel A in Table 2 reports the basic deal character-
istics for the full sample. Pure cash offers make upthe largest fraction of the sample (48.6%), followedby hybrid financing offers (22.3%) and share offers(21.7%). Only 82.9% of all transactions are completed,andmergers tend to be mostly within the same industry,with 53.4% of all deals beingundertakenwith a companyin the same industry based on the two-digit StandardIndustrial Classification (SIC) code.Wefind that 90.2%ofall deals are considered to be friendly and only 3.4% arehostile, whereas 11.6% of all transactions are challenged.For only 6.5% of the sample do the contracts containa collar structure, 76.5% of all deals involve a termi-nation fee, and in only 3.5% of the transactions does thebidder already have a toehold in the target company.Panel B shows that the average deal size is USD 3.8billion, with cash-only deals being, on average, smaller(USD 2.2 billion) than stock-only transactions (USD 5.4billion). The average one-day offer premium, definedas the excess of the offer price relative to the target’s
Table 2. Descriptive Overview of Takeover Sample
Offer structure Cash only Hybrid Other Shares Unknown Total
Panel A: Deal information
Description No. % of tot. No. % of tot. No. % of tot. No. % of tot. No. % of tot. No.Q: 54 % of tot.
No. of deals 903 48.6 415 22.3 80 4.3 403 21.7 58 3.1 1,859 100.0Completed deals 746 40.1 357 19.2 67 3.6 339 18.2 33 1.8 1,542 82.9Friendly deals 805 43.3 379 20.4 69 3.7 382 20.5 42 2.3 1,677 90.2Hostile deals 35 1.9 14 0.8 3 0.2 7 0.4 4 0.2 63 3.4Same-industry deals 379 42.0 280 67.5 39 48.8 268 66.5 27 46.6 993 53.4Challenged deals 111 6.0 55 3.0 7 0.4 32 1.7 11 0.6 216 11.6Competing bidder 83 4.5 32 1.7 3 0.2 20 1.1 4 0.2 142 7.6Collar deal 4 0.2 54 2.9 3 0.2 52 2.8 7 0.4 120 6.5Termination fee 698 37.5 352 18.9 51 2.7 292 15.7 29 1.6 1,422 76.5Bidder has a toehold 42 2.3 11 0.6 2 0.1 7 0.4 3 0.2 65 3.5
Panel B: Deal financials
Description Mean SD Mean SD Mean SD Mean SD Mean SD Mean SD
DVal (USD mil) 2,242.0 4,147.2 5,880.9 10,071.5 5,074.2 10,387.7 5,429.8 15,158.5 1,635.7 2,503.7 3,848.4 9,401.3P1d (%) 33.6 31.7 28.5 27.5 25.1 40.5 28.3 39.5 33.3 29.6 31.0 33.1P1w (%) 36.6 31.0 32.4 29.1 29.5 42.5 33.6 61.5 33.4 29.8 34.7 39.8P4w (%) 41.1 35.6 35.0 32.4 31.2 46.1 36.7 45.3 38.0 33.6 38.3 37.7
Notes. In panel A, we describe the deal characteristics of the 1,859 takeovers betweenQ: 46 January 1996 through December 31, 2012. We report thenumber of deals (“No.”) and the corresponding sample proportions (“% of tot.”). In addition, we report how many of the deals are classified ascompleted; friendly; hostile; involving a target and acquirer in the same industry; challenged; or having a competing bidder, a collar structure,a termination fee, or a bidder with a toehold in the target company. All characteristics are reported for the overall sample (column “Total”), aswell as for different offer structures: cash-financed (“Cash only”), stock-financed (“Shares”), a combination of cash and stock financing(“Hybrid”), other financing structures (“Other”), and unknown (“Unknown”). In panel B, we illustrate the financial statistics of the deals. Wereport the transaction value (“DVal”) in USD million and the offer premium, defined as the ratio of the offer price to the target’s closing stockprice. The terms P1d, P1w, and P4w refer to the premium one day, one week, and four weeks, respectively, prior to the announcement date, inpercentage terms.
Augustin, Brenner, and Subrahmanyam: Options Trading Before Takeover Announcements6 Management Science, Articles in Advance, pp. 1–24, © 2018 INFORMS
closing stock price one day before the announcementdate, is 31%.
4. Informed Options Activity Priorto Takeovers
The first objective of our empirical analysis is toquantify the prevalence of informed trading usingoptions volume. Investors with private informationabout the anticipated announcement return trade offthe options’ market leverage (Black 1975) against thegreater stock market liquidity and perhaps a lowerprobability of detection. In the presence of asym-metric information (Easley et al. 1998), wealth con-straints (John et al. 2003), short-sale constraints (Johnsonand So 2012), or disagreement (Cao and Ou-Yang 2009),some informed investors will migrate toward theoption market. A necessary condition for informedpreannouncement activity is, therefore, the detection ofabnormal options volume, as stated in Hypothesis 1Q: 16 .
Hypothesis 1 (H1). There is evidence of positive abnormaltrading volume in the equity options of target firms prior totakeover announcements.
Investors with inside information would pursuedirectional trading strategies on the target firm’sstock, as it almost always goes up after a takeover an-nouncement (Andrade et al. 2001). Thus, in the presenceof superior information, a trading strategy involvingthe purchase of OTM call options should generatea significantly higher abnormal return, as a consequenceof the higher leverage (“more bang for the buck”). Hence,we expect a larger increase in abnormal trading vol-ume for OTM calls relative to ATM and ITM calls.Moreover, an informed investor, taking advantage ofhis privileged knowledge of the future direction of thetarget’s stock price, may also increase the tradingvolume through the sale of ITM puts, as these willbecome less valuable with the increase in the target’sstock price upon announcement. An alternative, andmore cash-intensive, strategy would be to mimic thestrategy of buying OTM calls by buying ITM putscoupled with the underlying stock, financed by bor-rowing. Thus, an abnormally high volume in ITM putsmay result from either mimicking the purchase ofOTM calls or taking a synthetic long position in thestock (buying a call and selling a put with the samestrike price). An informed trader may possibly engagein more complicated trading strategies to hide hisintentions. Irrespective of which strategy is employed,we should observe abnormal trading volume in OTMcall and/or ITM put options if investors with preciseinformation exploit option leverage. This leads toa sharper prediction in Hypothesis 2.
Hypothesis 2 (H2). The ratios of the abnormal tradingvolumes in (a) OTM call options to ATM and ITM call
options and (b) ITM put options to ATM and OTM putoptions, written on the target firms, are higher prior totakeover announcements.
To test H1 and H2, we examine the deal-by-dealtrading volume in equity options written on targetfirms during the 30 days preceding takeover an-nouncements. In a nutshell, we find that approximately25% of all deals in our sample exhibit statisticallysignificant abnormal options activity (at the 5% level) inthe preannouncement period. In the United Kingdom,Spyrou et al. (2011) also document abnormal pre-announcement options volume for 25% of the deals.The magnitude of abnormal volume is greater for OTMcall options than for ATM and ITM calls in our sample,confirming the results of Cao et al. (2005). Our resultssuggest that the odds of abnormal volumes beinggreater in a sample with randomized announcementdates are at most one in a million.
4.1. Identifying Abnormal Trading VolumesWe test H1 by applying event study methodology totrading volumes. To compute the abnormal tradingvolume, we use, as a conservative benchmark, a marketmodel for volume (MMV model), which accounts forthe market volume in options (median trading volumeacross all options in the OptionMetrics database), theChicago Board of Options Exchange Volatility Index, aswell as the contemporaneous return of the underlyingstock and the market, proxied by the return on the S&P500 Index. In addition, we control for lagged values ofthe dependent and all independent variables. The es-timation window starts 90 days before the announce-ment date andfinishes 30 days before the announcementdate. As we are interested in the abnormal tradingvolume in anticipation of the event, we use a 30-dayevent window before the announcement date. To ac-count for the possibility of clustered event dates, wecorrect standard errors in aggregate tests for cross-sectional dependence.In panel A of Table 3, we show that the average
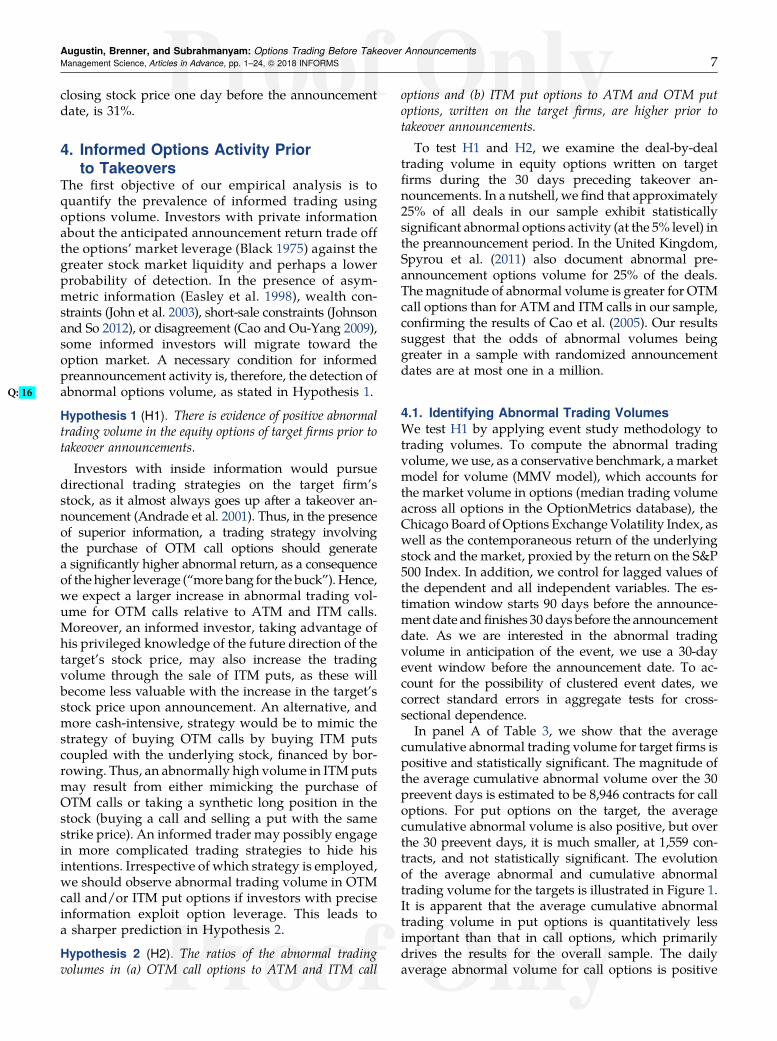
cumulative abnormal trading volume for target firms ispositive and statistically significant. The magnitude ofthe average cumulative abnormal volume over the 30preevent days is estimated to be 8,946 contracts for calloptions. For put options on the target, the averagecumulative abnormal volume is also positive, but overthe 30 preevent days, it is much smaller, at 1,559 con-tracts, and not statistically significant. The evolutionof the average abnormal and cumulative abnormaltrading volume for the targets is illustrated in Figure 1.It is apparent that the average cumulative abnormaltrading volume in put options is quantitatively lessimportant than that in call options, which primarilydrives the results for the overall sample. The dailyaverage abnormal volume for call options is positive
Augustin, Brenner, and Subrahmanyam: Options Trading Before Takeover AnnouncementsManagement Science, Articles in Advance, pp. 1–24, © 2018 INFORMS 7

and increases to approximately 1,500 contracts the daybefore the announcement. Individually, the number ofdeals with positive abnormal trading volumes, at the5% significance level, ranges from 467 for calls to 304for puts, corresponding to approximately 25% and 16%of the entire sample, respectively.6 Thus, approximately25% of the deals exhibit statistically significant cumu-lative abnormal options trading volume.7
We further stratify our sample by moneyness andconduct an event study for each category, using onlyoptions expiring after the announcement date. We findthat there is significantly higher abnormal tradingvolume for the targets in OTM call options comparedwithATMand ITM calls, in terms of both volume levelsand frequencies. Table 3 shows that the average cu-mulative abnormal volume is 3,380 (1,417) contracts forOTM calls (puts) and 1,540 (984) contracts for the ITMcalls (puts), whereas it is 1,156 (457) for ATM calls
(puts). These values correspond to 408 (343, 482) deals,or 22% (18%, 26%) of the sample, for OTM (ATM, ITM)calls, and 451 (362, 396) deals, or 24% (19%, 21%), forOTM (ATM, ITM) puts, respectively.In panel B of Table 3, we report results from paired
t-tests for the differences in themeans of the cumulativeaverage abnormal volumes across different categories.Consistent with H2, these results emphasize that there ishigher abnormal trading volume for OTM call optionsthan for ATM or ITM calls. The differences in the meansforOTMcalls relative toATMand ITMcalls are 2,224 and1,840, respectively, which are positive and statisticallydifferent from zero. On the other hand, the difference inthe means between ATM and ITM calls is slightly neg-ative (−384) but not statistically different from zero. Theaverage cumulative abnormal volume for ITM put op-tions is higher than for ATMput options, which providessome evidence that informed traders may not only
Table 3. PositiveQ: 47 Abnormal Options Trading Volume on Target Companies
Panel A: Magnitude and frequency of cumulative abnormal volume deals
All options: Target OTM options: Target
Parameter All Calls Puts All Calls Puts
Sign. t-stat 5% (no.) 446 467 304 423 408 451Sign. t-stat 5% (freq.) 0.24 0.25 0.16 0.23 0.22 0.24
E[CAV] 10,385 8,946 1,559 5,071 3,380 1,417t ¯CAV 3.76 5.77 1.04 5.44 5.46 3.34
ATM options: Target ITM options: Target
All Calls Puts All Calls PutsSign. t-stat 5% (no.) 341 343 362 393 482 396Sign. t-stat 5% (freq.) 0.18 0.18 0.19 0.21 0.26 0.21
E[CAV] 1,652 1,156 457 2,526 1,540 984t ¯CAV 2.84 2.65 1.98 4.71 6.40 2.42
Panel B: Differences in cumulative abnormal volume across moneyness
All options: Target Call options: Target
Diff SE p-value Diff SE p-valueOTM–ATM 3,419 722 0.00 2,224 531 0.00OTM–ITM 2,544 669 0.00 1,840 561 0.00ATM–ITM −874 632 0.17 −384 444 0.39
Put options: Target
Diff SE p-valueOTM–ATM 960 450 0.03 — — —OTM–ITM 433 367 0.24 — — —ATM–ITM −527 429 0.22 — — —
Notes. Panel A reports the number and frequency of deals with statistically significant positive cumulative abnormal volume at the 5% significancelevel for the target companies, as well as the average cumulative abnormal volume (E[CAV]) and corresponding t-statistic (t ¯CAV), computed usingheteroscedasticity-robust standard errors. All results are reported separately for call options, for put options, and for the aggregate option volume.Results stratified bymoneyness are based only on those options expiring after the announcement date. The estimationwindow starts 90 days beforethe announcement date and runs until 30 days before the announcement date. The event window stretches from 30 days before until one day beforethe announcement date. In panel B,we report the results of t-tests for the differences in the average cumulative abnormal volumes acrossmoneynesscategories: OTM, ITM, and ATM. We report the difference in average cumulative abnormal volume (“Diff”), the standard error, and the p-value.
Augustin, Brenner, and Subrahmanyam: Options Trading Before Takeover Announcements8 Management Science, Articles in Advance, pp. 1–24, © 2018 INFORMS
engage in OTM call transactions but also sell ITM puts.8
The weaker evidence that informed traders may alsoengage in writing ITM put options may be due to theriskyness of writing naked (especially ITM) puts, as thefailure of deal negotiations could lead to a sharp stockprice drop. Selling naked puts also requires largemargins, which may impose binding capital constraintson traders.
We verify our results using alternative tests androbustness checks. The results agree with the previousfindings, yielding either similar or stronger results,both qualitatively and quantitatively. We discuss thedetails of these additional tests in the online appendixSection A-II.
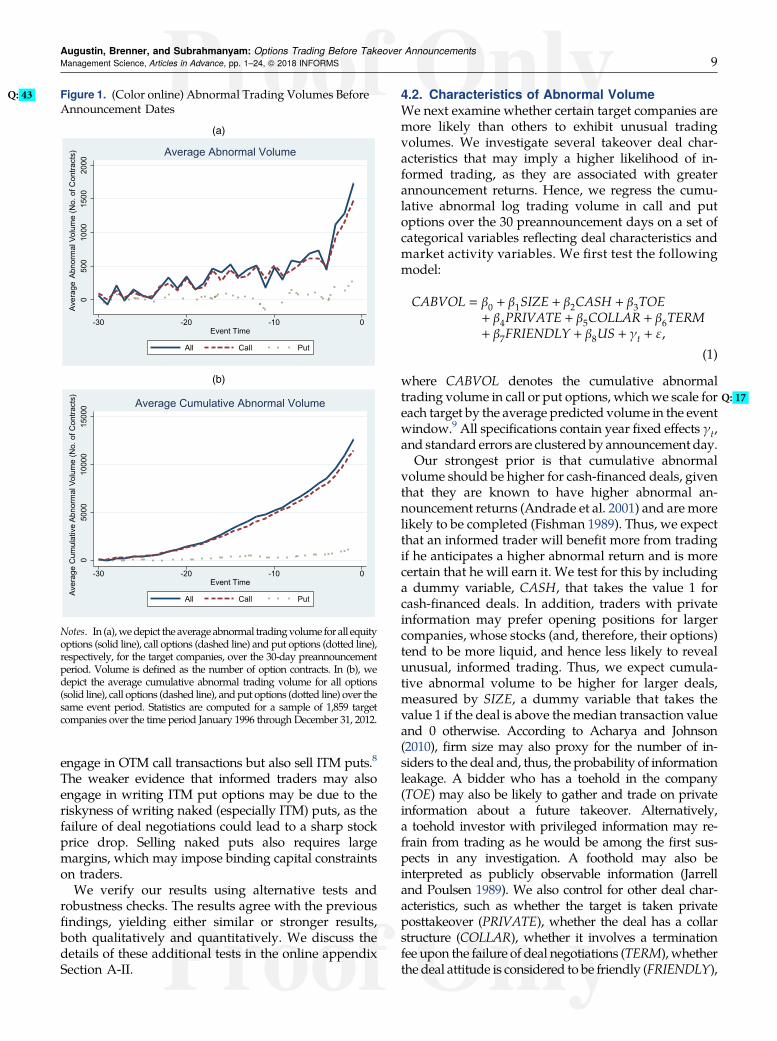
4.2. Characteristics of Abnormal VolumeWe next examine whether certain target companies aremore likely than others to exhibit unusual tradingvolumes. We investigate several takeover deal char-acteristics that may imply a higher likelihood of in-formed trading, as they are associated with greaterannouncement returns. Hence, we regress the cumu-lative abnormal log trading volume in call and putoptions over the 30 preannouncement days on a set ofcategorical variables reflecting deal characteristics andmarket activity variables. We first test the followingmodel:
CABVOL � β0 + β1SIZE + β2CASH + β3TOE+ β4PRIVATE + β5COLLAR + β6TERM+ β7FRIENDLY + β8US + γt + ε,
(1)
where CABVOL denotes the cumulative abnormaltrading volume in call or put options Q: 17, which we scale foreach target by the average predicted volume in the eventwindow.9 All specifications contain year fixed effects γt,and standard errors are clustered by announcement day.Our strongest prior is that cumulative abnormal
volume should be higher for cash-financed deals, giventhat they are known to have higher abnormal an-nouncement returns (Andrade et al. 2001) and are morelikely to be completed (Fishman 1989). Thus, we expectthat an informed trader will benefit more from tradingif he anticipates a higher abnormal return and is morecertain that he will earn it. We test for this by includinga dummy variable, CASH, that takes the value 1 forcash-financed deals. In addition, traders with privateinformation may prefer opening positions for largercompanies, whose stocks (and, therefore, their options)tend to be more liquid, and hence less likely to revealunusual, informed trading. Thus, we expect cumula-tive abnormal volume to be higher for larger deals,measured by SIZE, a dummy variable that takes thevalue 1 if the deal is above themedian transaction valueand 0 otherwise. According to Acharya and Johnson(2010), firm size may also proxy for the number of in-siders to the deal and, thus, the probability of informationleakage. A bidder who has a toehold in the company(TOE) may also be likely to gather and trade on privateinformation about a future takeover. Alternatively,a toehold investor with privileged information may re-frain from trading as he would be among the first sus-pects in any investigation. A foothold may also beinterpreted as publicly observable information (Jarrelland Poulsen 1989). We also control for other deal char-acteristics, such as whether the target is taken privateposttakeover (PRIVATE), whether the deal has a collarstructure (COLLAR), whether it involves a terminationfee upon the failure of deal negotiations (TERM), whetherthe deal attitude is considered to be friendly (FRIENDLY),
Figure 1. (Color online) AbnormalQ: 43 Trading Volumes BeforeAnnouncement Dates
Notes. In (a),wedepict theaverage abnormal tradingvolume for all equityoptions (solid line), call options (dashed line) and put options (dotted line),respectively, for the target companies, over the 30-day preannouncementperiod. Volume is defined as the number of option contracts. In (b), wedepict the average cumulative abnormal trading volume for all options(solid line), call options (dashed line), and put options (dotted line) over thesame event period. Statistics are computed for a sample of 1,859 targetcompanies over the time period January 1996 through December 31, 2012.
Augustin, Brenner, and Subrahmanyam: Options Trading Before Takeover AnnouncementsManagement Science, Articles in Advance, pp. 1–24, © 2018 INFORMS 9
and whether the bidder is a U.S.-headquartered com-pany (US).
The results for the benchmark regressions of cu-mulative abnormal volume in the target call options arereported in column (1) of Table 4. We find that firm sizeis a significant positive predictor of abnormal optionsvolume. This evidence is consistent with the view thatinformed trading in target call options is greater forlarger, more liquid companies, for which it is easier tohide informed trading, and when there is a greater
probability of information leakage (Acharya andJohnson 2010). Our results are similar if we proxyfirm size using company sales. We also examined thenumber of target and acquirer advisors as a proxy forinformation leakage, but the results are not statisticallysignificant, similar to the findings of Heitzman andKlasa (2016). This may be due to insufficient variationin the number of advisors for publicly traded firms(91.2% of the sample has fewer than five advisors, andthe median is two), whereas Acharya and Johnson
Table 4. Characteristics of Cumulative Abnormal Call Volume
Variable CABVOLC CABVOLC CABVOLC I (CABVOLC) I (CABVOLC)
SIZE 3.32** 2.44* 3.31** 0.23** 0.21*(1.34) (1.29) (1.33) (1.26) (1.24)
CASH 6.37*** 5.49*** 5.15*** 0.42*** 0.43***(1.53) (1.54) (1.59) (1.52) (1.53)
TOE −5.58* -3.38 −4.82* -0.33 -0.27(2.94) (2.71) (2.92) (0.72) (0.76)
PRIVATE 0.12 0.06 0.88 -0.09 −0.13(1.97) (1.91) (2.00) (0.91) (0.88)
COLLAR 7.23** 6.47** 6.52** 0.41* 0.43**(2.94) (2.85) (2.95) (1.50) (1.54)
TERM 5.65*** 4.57** 4.93*** 0.20 0.21(1.83) (1.80) (1.83) (1.22) (1.23)
FRIENDLY 3.04 1.91 2.85 0.14 0.06(2.36) (2.30) (2.37) (1.15) (1.06)
US −2.45 −1.71 −2.54 -0.35** −0.31**(1.91) (1.88) (1.92) (0.70) (0.74)
TRUNUP 24.30*** 1.01***(2.88) (2.75)
TANNRET 0.57 0.74(4.56) (2.10)
TTPRET1 −7.84* −1.15**(4.08) (0.32)
ARUNUP −4.52 4.21 -0.97**(4.27) (4.36) (0.38)
MKTVOL −3.85** -1.91 −0.06(1.95) (2.02) (0.94)
TOT_PREMIUM 4.24**(1.75)
Constant −1.37 15.25* 5.68 −0.82** −0.62(2.79) (8.66) (9.01) (0.44) (0.54)
Observations 1,859 1,859 1,859 1,859 1,859adj.R2/ps.R2 0.056 0.123 0.060 0.035 0.054YEAR FE YES YES YES YES YES
Notes. In columns (1) and (2), we report generalized least squares regression results from the projection of cumulative abnormal call option log-volume (CABVOLC, standardized by the average predicted volume during the event window) on a set of takeover characteristics and marketactivity measures. Columns (3) and (4) report logit coefficients (odds ratios in parentheses) from logistic regression results where the dependentvariable takes the value 1 if the cumulative abnormal call options trading volume during the 30 preannouncement days is statistically significantat the 5% level and 0 otherwise. The variable SIZE quantifies the takeover deal value. The variableCASH is a categorical value taking the value 1 ifthe deal is a cash-financed takeover and 0 otherwise, TOE has the value 1 if a bidder already has a toehold in the target company,PRIVATE equals1 if the acquirer privatizes the target postacquisition, COLLAR takes the value 1 for transactions with a collar structure, TERM equals 1 for dealsthat have a termination fee that applies if the takeover negotiations fail, FRIENDLY has the value 1 if the deal attitude is considered to be friendly,and US equals 1 if the bidder is a U.S.-based company and 0 otherwise. We denote by TRUNUP the preannouncement cumulative abnormalstock return for the target and TANNRET the target’s announcement abnormal return; TTPRET1 refers to the target’s postannouncementcumulative abnormal return, and ARUNUP is the abnormal stock return for the acquirer before the announcement day.MKTVOL is the marketvolume on the day before the announcement. Each regression contains year fixed effects (“YEAR FE”), and standard errors are clustered byannouncement day. We report the number of observations (“Observations”) and the adjusted R2.Q: 48
***, **, and * denote statistical significance at the 1%, 5%, and 10% levels, respectively.
Augustin, Brenner, and Subrahmanyam: Options Trading Before Takeover Announcements10 Management Science, Articles in Advance, pp. 1–24, © 2018 INFORMS
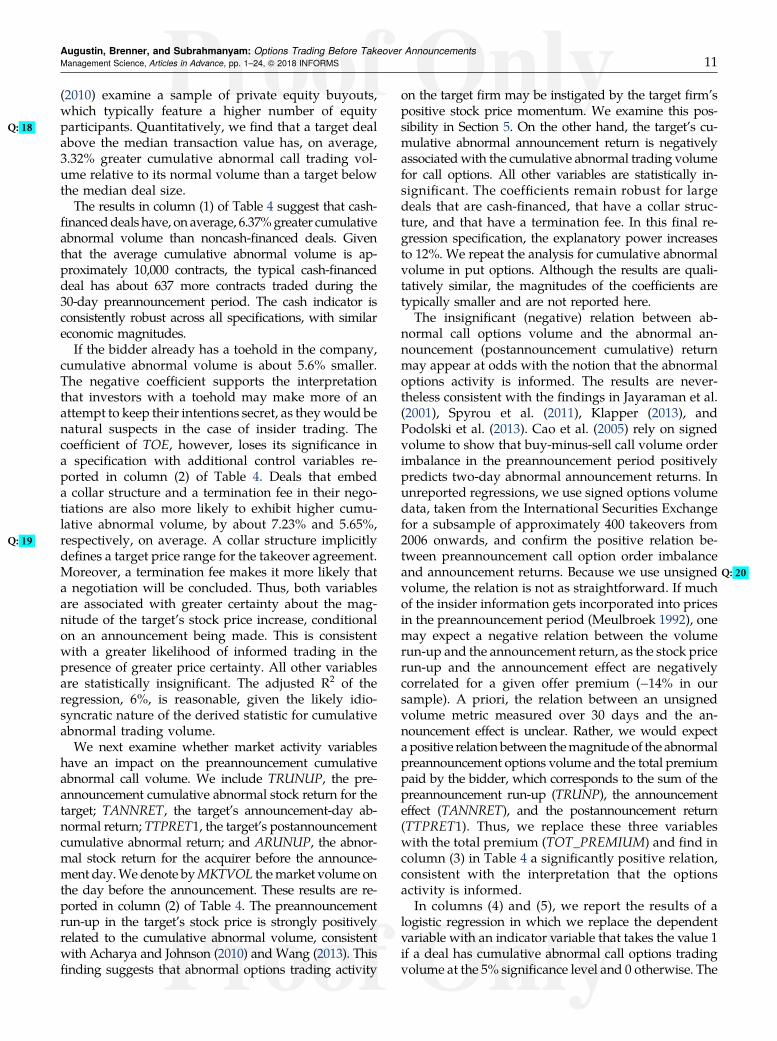
(2010) examine a sample of private equity buyouts,which typically feature a higher number of equityparticipants. QuantitativelyQ: 18 , we find that a target dealabove the median transaction value has, on average,3.32% greater cumulative abnormal call trading vol-ume relative to its normal volume than a target belowthe median deal size.
The results in column (1) of Table 4 suggest that cash-financeddeals have, on average, 6.37%greater cumulativeabnormal volume than noncash-financed deals. Giventhat the average cumulative abnormal volume is ap-proximately 10,000 contracts, the typical cash-financeddeal has about 637 more contracts traded during the30-day preannouncement period. The cash indicator isconsistently robust across all specifications, with similareconomic magnitudes.
If the bidder already has a toehold in the company,cumulative abnormal volume is about 5.6% smaller.The negative coefficient supports the interpretationthat investors with a toehold may make more of anattempt to keep their intentions secret, as theywould benatural suspects in the case of insider trading. Thecoefficient of TOE, however, loses its significance ina specification with additional control variables re-ported in column (2) of Table 4. Deals that embeda collar structure and a termination fee in their nego-tiations are also more likely to exhibit higher cumu-lative abnormal volume, by about 7.23% and 5.65%,respectivelyQ: 19 , on average. A collar structure implicitlydefines a target price range for the takeover agreement.Moreover, a termination fee makes it more likely thata negotiation will be concluded. Thus, both variablesare associated with greater certainty about the mag-nitude of the target’s stock price increase, conditionalon an announcement being made. This is consistentwith a greater likelihood of informed trading in thepresence of greater price certainty. All other variablesare statistically insignificant. The adjusted R2 of theregression, 6%, is reasonable, given the likely idio-syncratic nature of the derived statistic for cumulativeabnormal trading volume.
We next examine whether market activity variableshave an impact on the preannouncement cumulativeabnormal call volume. We include TRUNUP, the pre-announcement cumulative abnormal stock return for thetarget; TANNRET, the target’s announcement-day ab-normal return; TTPRET1, the target’s postannouncementcumulative abnormal return; and ARUNUP, the abnor-mal stock return for the acquirer before the announce-ment day.We denote byMKTVOL themarket volume onthe day before the announcement. These results are re-ported in column (2) of Table 4. The preannouncementrun-up in the target’s stock price is strongly positivelyrelated to the cumulative abnormal volume, consistentwith Acharya and Johnson (2010) and Wang (2013). Thisfinding suggests that abnormal options trading activity
on the target firm may be instigated by the target firm’spositive stock price momentum. We examine this pos-sibility in Section 5. On the other hand, the target’s cu-mulative abnormal announcement return is negativelyassociatedwith the cumulative abnormal trading volumefor call options. All other variables are statistically in-significant. The coefficients remain robust for largedeals that are cash-financed, that have a collar struc-ture, and that have a termination fee. In this final re-gression specification, the explanatory power increasesto 12%. We repeat the analysis for cumulative abnormalvolume in put options. Although the results are quali-tatively similar, the magnitudes of the coefficients aretypically smaller and are not reported here.The insignificant (negative) relation between ab-
normal call options volume and the abnormal an-nouncement (postannouncement cumulative) returnmay appear at odds with the notion that the abnormaloptions activity is informed. The results are never-theless consistent with the findings in Jayaraman et al.(2001), Spyrou et al. (2011), Klapper (2013), andPodolski et al. (2013). Cao et al. (2005) rely on signedvolume to show that buy-minus-sell call volume orderimbalance in the preannouncement period positivelypredicts two-day abnormal announcement returns. Inunreported regressions, we use signed options volumedata, taken from the International Securities Exchangefor a subsample of approximately 400 takeovers from2006 onwards, and confirm the positive relation be-tween preannouncement call option order imbalanceand announcement returns. Because Q: 20we use unsignedvolume, the relation is not as straightforward. If muchof the insider information gets incorporated into pricesin the preannouncement period (Meulbroek 1992), onemay expect a negative relation between the volumerun-up and the announcement return, as the stock pricerun-up and the announcement effect are negativelycorrelated for a given offer premium (−14% in oursample). A priori, the relation between an unsignedvolume metric measured over 30 days and the an-nouncement effect is unclear. Rather, we would expectapositive relation between themagnitude of the abnormalpreannouncement options volume and the total premiumpaid by the bidder, which corresponds to the sum of thepreannouncement run-up (TRUNP), the announcementeffect (TANNRET), and the postannouncement return(TTPRET1). Thus, we replace these three variableswith the total premium (TOT_PREMIUM) and find incolumn (3) in Table 4 a significantly positive relation,consistent with the interpretation that the optionsactivity is informed.In columns (4) and (5), we report the results of a
logistic regression in which we replace the dependentvariable with an indicator variable that takes the value 1if a deal has cumulative abnormal call options tradingvolume at the 5% significance level and 0 otherwise. The
Augustin, Brenner, and Subrahmanyam: Options Trading Before Takeover AnnouncementsManagement Science, Articles in Advance, pp. 1–24, © 2018 INFORMS 11

evidence corroborates the positive relation between theabnormal options activity in the preannouncementperiod and variables that are positively correlated witha higher probability of informed trading.
5. Informed vs. Insider TradingThere is a long-standing debate as to whether the stockprice run-up before M&A announcements is rationallyanticipated or whether it is the result of private in-formation. The preannouncement run-up in optionsvolume may be due to rational anticipation of up-coming takeover announcements, arising throughrumors about upcoming tender offers, speculation asa result of industry-specific merger waves, or simplybecause of the superior ability of certain investorsto forecast deal activity. Alternatively, it could arisethrough trading on private information. In this sec-tion, we assess the likelihood of the informed optionsactivity being illegal. To this end, we examine deal bydeal whether publicly available information may ex-plain the preannouncement run-up in options volume.
5.1. A Legal Definition of Insider TradingIn the United States, insider trading is regulated underthe Securities Exchange Act of 1934, and the respon-sibility for enforcement lies with the SEC.10 Regis-tered insiders are bound by the “classical” theoryimplicit in the antifraud provisions in the act, whichholds them liable if they have traded based on materialnonpublic information from their company and if theyhave violated their fiduciary duty. Outsiders to the firmmay legally infer a material “mosaic” conclusion bypiecing together multiple pieces of immaterial non-public information. However, they are bound by the“misappropriation” theory implicit in the act, whichprohibits trading based on information that is mis-appropriated from a third party to whom the investorowes a fiduciary duty.
The boundaries of illegal insider trading are blurry,at best, and the bar on identifying insider trading incourt is high.11 It is difficult to draw a clear and precisedistinction between a trade that is speculative, in-formed, and legal and one that is illegal. Thus, we focuson each deal, narrowing down the possibility that theunusual/abnormal preannouncement options activitymight be explained by publicly available information.
5.2. SpeculationMerger activity is procyclical and arrives in industry-specific waves (Andrade et al. 2001). The earlier find-ings for the sources of informed trading—namely, thatcumulative abnormal volumes are significantly relatedto the run-up in stock prices—may also suggest that theabnormal options activity may simply be the result ofpositive price momentum on the target’s stock. Thus,speculation may explain the preannouncement options
activity. Such a selection bias would be consistent withthe view that takeovers are anticipated.We examine this possibility by constructing several
control samples, matching them based on either theactivity in the underlying stock or firm characteristics.12
In other words, for each of the 1,859 takeover deals, atthe time of the takeover announcement, we look fora similar firm with traded options and which resemblesthe takeover firm in terms of either stockmarket activitymeasures for the underlying stock or firm characteris-tics. For the market-based control sample, we matchfirms based on three-month moving averages ofa firm’s stock return, stock return volatility using theexponential-weighted moving average model, stocktrading volume, percentage bid-ask spread to captureilliquidity, and three-month cumulative stock returnsto capture the momentum in a firm’s stock. We matchonly targets for completed deals based on the monthprior to the takeover announcement. We sample withreplacement and use the Mahalanobis distance metricto evaluate the “closeness” of the match. Table A-6 inthe online appendix documents the matching qualityfor both control samples. Most Q: 21variables are statisticallyindistinguishable between the treatment and controlgroups; those that are distinguishable resemble eachother closely in terms of economic magnitude.The findings reported in Table 5 suggest that the run-
up in options trading volume prior to the announce-ment is unlikely due to investors speculating in theoptions market after having observed (perhaps) in-formed trading activity in the underlying shares. Wereport results for aggregate options volume and sep-arately for the aggregate call and put volumes, usingthe MMV model, in which we control for the laggedvalues of both the dependent and independent vari-ables. The results in panel A of Table 5 suggest thatabout 25% of all deals in the treatment sample havepositive abnormal call options trading volume, witha lower frequency (16%) of unusual options activity forput options. The average cumulative abnormal totaloptions and call volume is 10,768 and 11,145 contracts,respectively. Both values are statistically significant atthe 1% level.In panel B of Table 5, we report the results for the
control groups using the first best (PS1) and the twofirst best (PS2) matches. The frequency of deals withstatistically significant cumulative abnormal volume atthe 5% significance level is lower than in the treatmentsample, ranging between 13% and 14%. For call op-tions, the average cumulative abnormal volume issignificantly lower in the two control groups than in thetreatment groups, as the average cumulative abnormalcall volume is only 1,011 and 764 contracts. Impor-tantly, none of the statistics is statistically significant.In panel C of Table 5, we report the average treat-
ment effects obtained from a regression of the
Augustin, Brenner, and Subrahmanyam: Options Trading Before Takeover Announcements12 Management Science, Articles in Advance, pp. 1–24, © 2018 INFORMS
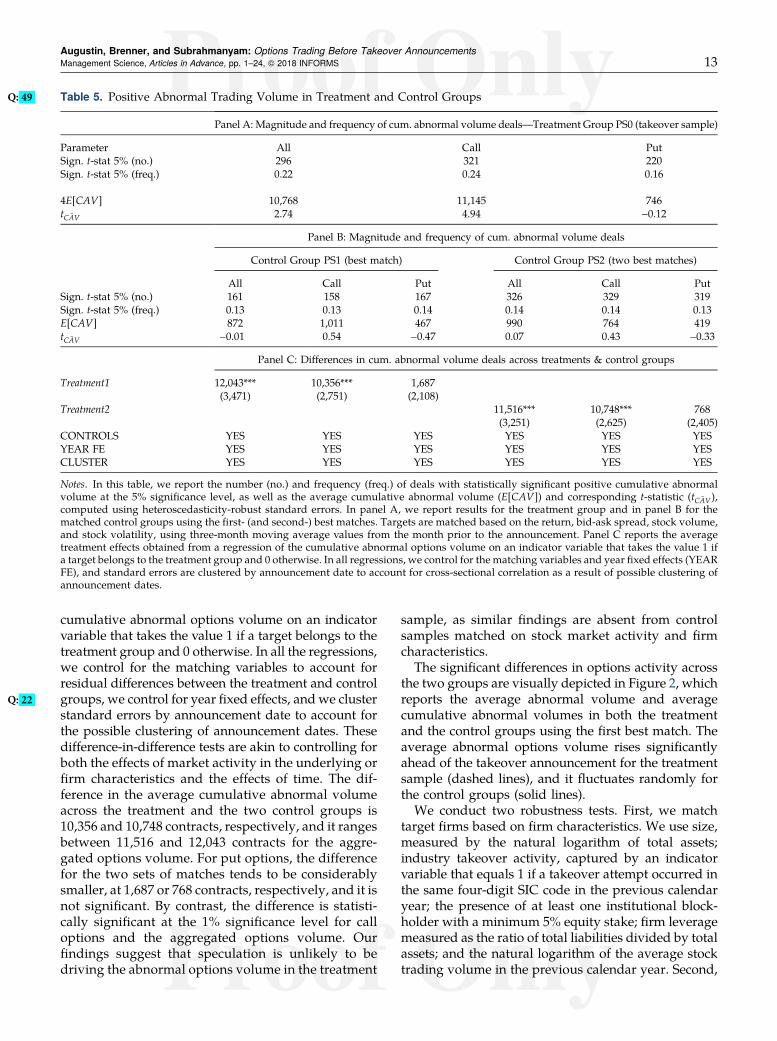
cumulative abnormal options volume on an indicatorvariable that takes the value 1 if a target belongs to thetreatment group and 0 otherwise. In all the regressions,we control for the matching variables to account forresidual differences between the treatment and controlgroups, weQ: 22 control for year fixed effects, and we clusterstandard errors by announcement date to account forthe possible clustering of announcement dates. Thesedifference-in-difference tests are akin to controlling forboth the effects of market activity in the underlying orfirm characteristics and the effects of time. The dif-ference in the average cumulative abnormal volumeacross the treatment and the two control groups is10,356 and 10,748 contracts, respectively, and it rangesbetween 11,516 and 12,043 contracts for the aggre-gated options volume. For put options, the differencefor the two sets of matches tends to be considerablysmaller, at 1,687 or 768 contracts, respectively, and it isnot significant. By contrast, the difference is statisti-cally significant at the 1% significance level for calloptions and the aggregated options volume. Ourfindings suggest that speculation is unlikely to bedriving the abnormal options volume in the treatment
sample, as similar findings are absent from controlsamples matched on stock market activity and firmcharacteristics.The significant differences in options activity across
the two groups are visually depicted in Figure 2, whichreports the average abnormal volume and averagecumulative abnormal volumes in both the treatmentand the control groups using the first best match. Theaverage abnormal options volume rises significantlyahead of the takeover announcement for the treatmentsample (dashed lines), and it fluctuates randomly forthe control groups (solid lines).We conduct two robustness tests. First, we match
target firms based on firm characteristics. We use size,measured by the natural logarithm of total assets;industry takeover activity, captured by an indicatorvariable that equals 1 if a takeover attempt occurred inthe same four-digit SIC code in the previous calendaryear; the presence of at least one institutional block-holder with a minimum 5% equity stake; firm leveragemeasured as the ratio of total liabilities divided by totalassets; and the natural logarithm of the average stocktrading volume in the previous calendar year. Second,
Table 5. PositiveQ: 49 Abnormal Trading Volume in Treatment and Control Groups
Panel A: Magnitude and frequency of cum. abnormal volume deals—Treatment Group PS0 (takeover sample)
Parameter All Call PutSign. t-stat 5% (no.) 296 321 220Sign. t-stat 5% (freq.) 0.22 0.24 0.16
4E[CAV] 10,768 11,145 746t ¯CAV 2.74 4.94 −0.12
Panel B: Magnitude and frequency of cum. abnormal volume deals
Control Group PS1 (best match) Control Group PS2 (two best matches)
All Call Put All Call PutSign. t-stat 5% (no.) 161 158 167 326 329 319Sign. t-stat 5% (freq.) 0.13 0.13 0.14 0.14 0.14 0.13E[CAV] 872 1,011 467 990 764 419t ¯CAV −0.01 0.54 −0.47 0.07 0.43 −0.33
Panel C: Differences in cum. abnormal volume deals across treatments & control groups
Treatment1 12,043*** 10,356*** 1,687(3,471) (2,751) (2,108)
Treatment2 11,516*** 10,748*** 768(3,251) (2,625) (2,405)
CONTROLS YES YES YES YES YES YESYEAR FE YES YES YES YES YES YESCLUSTER YES YES YES YES YES YES
Notes. In this table, we report the number (no.) and frequency (freq.) of deals with statistically significant positive cumulative abnormalvolume at the 5% significance level, as well as the average cumulative abnormal volume (E[CAV]) and corresponding t-statistic (t ¯CAV),computed using heteroscedasticity-robust standard errors. In panel A, we report results for the treatment group and in panel B for thematched control groups using the first- (and second-) best matches. Targets are matched based on the return, bid-ask spread, stock volume,and stock volatility, using three-month moving average values from the month prior to the announcement. Panel C reports the averagetreatment effects obtained from a regression of the cumulative abnormal options volume on an indicator variable that takes the value 1 ifa target belongs to the treatment group and 0 otherwise. In all regressions, we control for the matching variables and year fixed effects (YEARFE), and standard errors are clustered by announcement date to account for cross-sectional correlation as a result of possible clustering ofannouncement dates.
Augustin, Brenner, and Subrahmanyam: Options Trading Before Takeover AnnouncementsManagement Science, Articles in Advance, pp. 1–24, © 2018 INFORMS 13
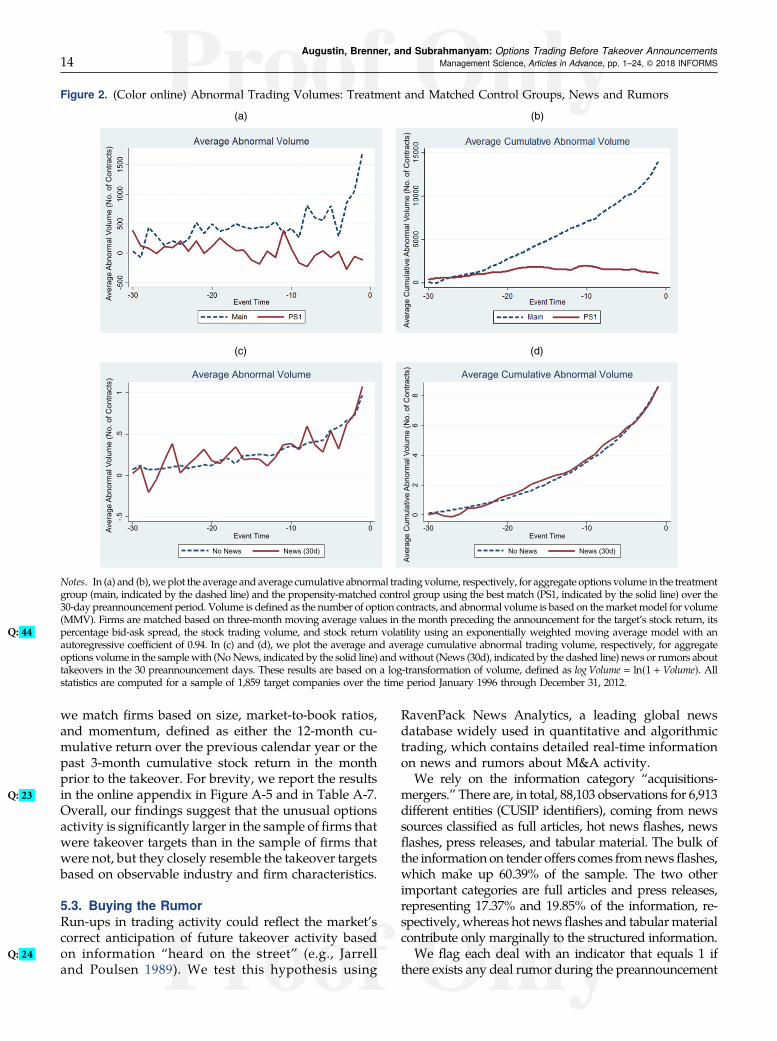
we match firms based on size, market-to-book ratios,and momentum, defined as either the 12-month cu-mulative return over the previous calendar year or thepast 3-month cumulative stock return in the monthprior to the takeover. For brevity, we report the resultsin the onlineQ: 23 appendix in Figure A-5 and in Table A-7.Overall, our findings suggest that the unusual optionsactivity is significantly larger in the sample of firms thatwere takeover targets than in the sample of firms thatwere not, but they closely resemble the takeover targetsbased on observable industry and firm characteristics.
5.3. Buying the RumorRun-ups in trading activity could reflect the market’scorrect anticipation of future takeover activity basedon information “Q: 24 heard on the street” (e.g., Jarrelland Poulsen 1989). We test this hypothesis using
RavenPack News Analytics, a leading global newsdatabase widely used in quantitative and algorithmictrading, which contains detailed real-time informationon news and rumors about M&A activity.We rely on the information category “acquisitions-
mergers.” There are, in total, 88,103 observations for 6,913different entities (CUSIP identifiers), coming from newssources classified as full articles, hot news flashes, newsflashes, press releases, and tabular material. The bulk ofthe information on tender offers comes fromnewsflashes,which make up 60.39% of the sample. The two otherimportant categories are full articles and press releases,representing 17.37% and 19.85% of the information, re-spectively, whereas hot newsflashes and tabularmaterialcontribute only marginally to the structured information.We flag each deal with an indicator that equals 1 if
there exists any deal rumor during the preannouncement
Figure 2. (Color online) Abnormal Trading Volumes: Treatment and Matched Control Groups, News and Rumors
Notes. In (a) and (b),weplot the average and average cumulative abnormal trading volume, respectively, for aggregate options volume in the treatmentgroup (main, indicated by the dashed line) and the propensity-matched control group using the best match (PS1, indicated by the solid line) over the30-day preannouncement period. Volume is defined as the number of option contracts, and abnormal volume is based on themarketmodel for volume(MMV). Firms are matched based on three-month moving average values in the month preceding the announcement for the target’s stock return, itspercentage bid-ask spread, the stock trading volume, and stock return volatility using an exponentiallQ: 44 y weighted moving average model with anautoregressive coefficient of 0.94. In (c) and (d), we plot the average and average cumulative abnormal trading volume, respectively, for aggregateoptions volume in the samplewith (NoNews, indicated by the solid line) andwithout (News (30d), indicated by the dashed line) news or rumors abouttakeovers in the 30 preannouncement days. These results are based on a log-transformation of volume, defined as logVolume � ln(1 + Volume). Allstatistics are computed for a sample of 1,859 target companies over the time period January 1996 through December 31, 2012.
Augustin, Brenner, and Subrahmanyam: Options Trading Before Takeover Announcements14 Management Science, Articles in Advance, pp. 1–24, © 2018 INFORMS

period and 0 if not. We find a rumor or news story on5,195 different deal-days, corresponding to 877 uniquedeals from our sample of 1,859 takeovers announcedbetween 1996 and 2012. Most of the news and rumorinformation appears on the announcement day itself,as shown in Table 6, which illustrates the total numberof observations and unique deals in different samplewindows. Rumors or news stories exist in the 30-day
preannouncement period for only 170 firms, whichcorresponds to approximately 9% of our sample, or13.72% on a proportional basis, given that 1,239takeovers were announced between January 2000 andAugust 2012. Most importantly, of the 467 takeoverannouncements with significant informed optionstrading, we associate only 8.57% (40 deals) with newsor rumors captured by RavenPack.
Table 6. Frequency of News Around Takeover Announcements
Time window [−150, −91] [−90 , −31] [−30, −21] [−20, −11] [−10, −6] [−5, −1] [0] [1,5] [5,10] [−150, −91] [−30, −1] [−90, −1]
Obs. 258 290 67 67 31 74 660 252 140 1839 239 529Deals 188 204 55 59 29 63 659 218 113 407 170 299
Notes. In this table, we report the frequency of news around takeover announcements. The information is from RavenPack News Analytics,which extracts textual information from major publishers, such as Dow Jones Newswires, the Wall Street Journal, Barron’s, regulatory and publicrelation feeds, andmore than 19,000 other traditional and social media sites. The company transforms the information into a structured data feedthat can be used in quantitative analysis. Using the data from January 2000 to August 2012, we report the number of news and rumor items(“Obs.”) and the corresponding number of takeover deals (“Deals”) recorded during different timewindows around the announcement day. Thewindow titled “[0]” relates to news and rumors on the announcement day. All other columns refer to different time windows in the pre- orpostannouncement period.
Table 7. SourcesQ: 50 of Informed Options Trading
Set No. % Cum% A B C D Description
Ω 1,859 100.00 100.00 3 3 3 3 Takeover sampleA 467 25.12 25.12 3 ✘ ✘ ✘ Abnormal options volume (A)Ω\A 1,392 74.87 100.00 ✘ 3 3 3 No abnormal options volumeB 170 9.14 9.14 ✘ 3 ✘ ✘ News and rumors (B)Ω\B 1,689 90.86 100.00 3 ✘ 3 3 No news or rumorsC 352 18.93 18.93 ✘ ✘ 3 ✘ Abnormal stock volume (C)Ω\C 1,507 81.07 100.00 3 3 ✘ 3 No abnormal stock volumeD 135 7.26 7.26 ✘ ✘ ✘ 3 Abnormal stock returns (D)Ω\D 1,724 92.74 100.00 3 3 3 ✘ No abnormal stock returns(A ∩ C ∩ D) \ B 427 22.97 22.97 3 ✘ 3 3 A, C, D; no BΩ\(A ∩ B ∩ C ∩ D) 1,036 55.73 55.73 ✘ ✘ ✘ ✘ No A, B, C, DA\(B ∪ C ∪ D) 236 12.69 68.42 3 ✘ ✘ ✘ A, C, D; no B
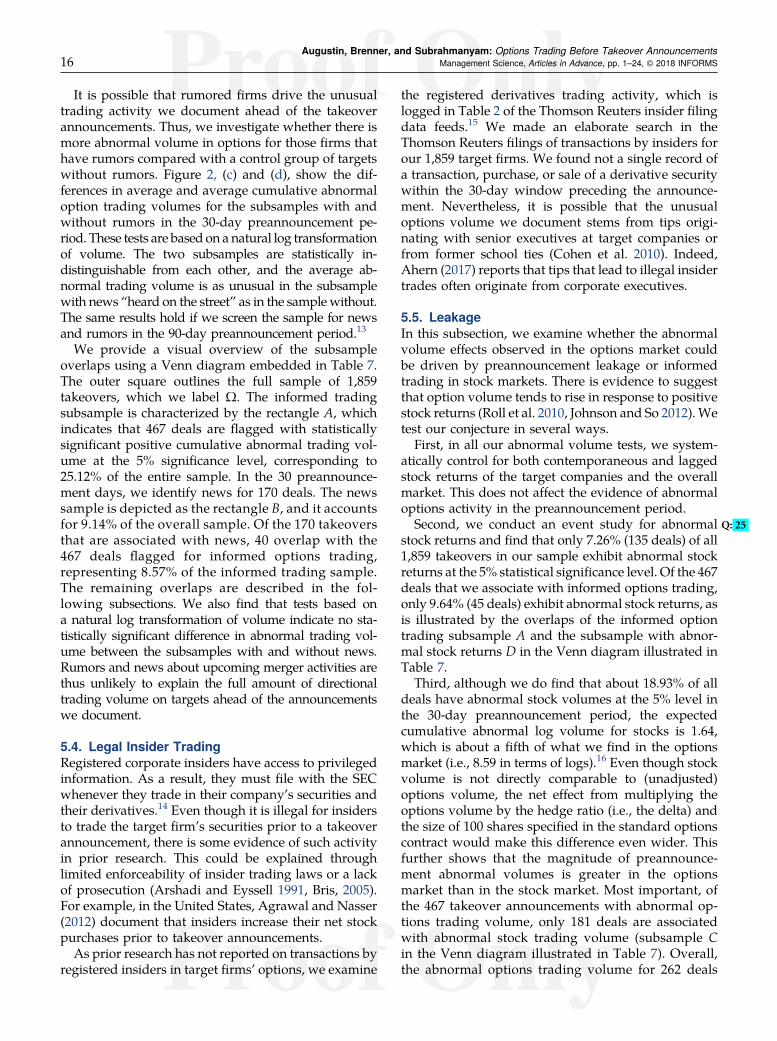
Notes. In this table, we document the sources of informed options trading for a sample of 1,859 takeovers from January 1996 to December 2012.Of the 1,859 takeovers, 467 (25.12, subset A) have abnormal options trading volume at the 5% significance level over the 30-daypreannouncement period. The sample of news and rumors amounts to 170 deals (9.14%, subset B); 352 of all deals (18.93%, subset C) haveabnormal stock trading volume in the run-up to the announcement, whereas 135 deals (7.26%, subsetD) have abnormal stock returns in the run-up to the announcement. In total, 427 of all deals (22.97%) have abnormal options trading volume ahead of the announcement as well asabnormal returns and volume in the underlying stock, without any news or rumors; 236 of all deals (13%, grey area) have only abnormal optionstrading volume and are difficult to associate with public sources of information.
Augustin, Brenner, and Subrahmanyam: Options Trading Before Takeover AnnouncementsManagement Science, Articles in Advance, pp. 1–24, © 2018 INFORMS 15
It is possible that rumored firms drive the unusualtrading activity we document ahead of the takeoverannouncements. Thus, we investigate whether there ismore abnormal volume in options for those firms thathave rumors compared with a control group of targetswithout rumors. Figure 2, (c) and (d), show the dif-ferences in average and average cumulative abnormaloption trading volumes for the subsamples with andwithout rumors in the 30-day preannouncement pe-riod. These tests are based on a natural log transformationof volume. The two subsamples are statistically in-distinguishable from each other, and the average ab-normal trading volume is as unusual in the subsamplewith news “heard on the street” as in the samplewithout.The same results hold if we screen the sample for newsand rumors in the 90-day preannouncement period.13
We provide a visual overview of the subsampleoverlaps using a Venn diagram embedded in Table 7.The outer square outlines the full sample of 1,859takeovers, which we label Ω. The informed tradingsubsample is characterized by the rectangle A, whichindicates that 467 deals are flagged with statisticallysignificant positive cumulative abnormal trading vol-ume at the 5% significance level, corresponding to25.12% of the entire sample. In the 30 preannounce-ment days, we identify news for 170 deals. The newssample is depicted as the rectangle B, and it accountsfor 9.14% of the overall sample. Of the 170 takeoversthat are associated with news, 40 overlap with the467 deals flagged for informed options trading,representing 8.57% of the informed trading sample.The remaining overlaps are described in the fol-lowing subsections. We also find that tests based ona natural log transformation of volume indicate no sta-tistically significant difference in abnormal trading vol-ume between the subsamples with and without news.Rumors and news about upcoming merger activities arethus unlikely to explain the full amount of directionaltrading volume on targets ahead of the announcementswe document.
5.4. Legal Insider TradingRegistered corporate insiders have access to privilegedinformation. As a result, they must file with the SECwhenever they trade in their company’s securities andtheir derivatives.14 Even though it is illegal for insidersto trade the target firm’s securities prior to a takeoverannouncement, there is some evidence of such activityin prior research. This could be explained throughlimited enforceability of insider trading laws or a lackof prosecution (Arshadi and Eyssell 1991, Bris, 2005).For example, in the United States, Agrawal and Nasser(2012) document that insiders increase their net stockpurchases prior to takeover announcements.
As prior research has not reported on transactions byregistered insiders in target firms’ options, we examine
the registered derivatives trading activity, which islogged in Table 2 of the Thomson Reuters insider filingdata feeds.15 We made an elaborate search in theThomson Reuters filings of transactions by insiders forour 1,859 target firms. We found not a single record ofa transaction, purchase, or sale of a derivative securitywithin the 30-day window preceding the announce-ment. Nevertheless, it is possible that the unusualoptions volume we document stems from tips origi-nating with senior executives at target companies orfrom former school ties (Cohen et al. 2010). Indeed,Ahern (2017) reports that tips that lead to illegal insidertrades often originate from corporate executives.
5.5. LeakageIn this subsection, we examine whether the abnormalvolume effects observed in the options market couldbe driven by preannouncement leakage or informedtrading in stock markets. There is evidence to suggestthat option volume tends to rise in response to positivestock returns (Roll et al. 2010, Johnson and So 2012).Wetest our conjecture in several ways.First, in all our abnormal volume tests, we system-
atically control for both contemporaneous and laggedstock returns of the target companies and the overallmarket. This does not affect the evidence of abnormaloptions activity in the preannouncement period.Second, Q: 25we conduct an event study for abnormal
stock returns and find that only 7.26% (135 deals) of all1,859 takeovers in our sample exhibit abnormal stockreturns at the 5% statistical significance level. Of the 467deals that we associate with informed options trading,only 9.64% (45 deals) exhibit abnormal stock returns, asis illustrated by the overlaps of the informed optiontrading subsample A and the subsample with abnor-mal stock returns D in the Venn diagram illustrated inTable 7.Third, although we do find that about 18.93% of all
deals have abnormal stock volumes at the 5% level inthe 30-day preannouncement period, the expectedcumulative abnormal log volume for stocks is 1.64,which is about a fifth of what we find in the optionsmarket (i.e., 8.59 in terms of logs).16 Even though stockvolume is not directly comparable to (unadjusted)options volume, the net effect from multiplying theoptions volume by the hedge ratio (i.e., the delta) andthe size of 100 shares specified in the standard optionscontract would make this difference even wider. Thisfurther shows that the magnitude of preannounce-ment abnormal volumes is greater in the optionsmarket than in the stock market. Most important, ofthe 467 takeover announcements with abnormal op-tions trading volume, only 181 deals are associatedwith abnormal stock trading volume (subsample Cin the Venn diagram illustrated in Table 7). Overall,the abnormal options trading volume for 262 deals
Augustin, Brenner, and Subrahmanyam: Options Trading Before Takeover Announcements16 Management Science, Articles in Advance, pp. 1–24, © 2018 INFORMS
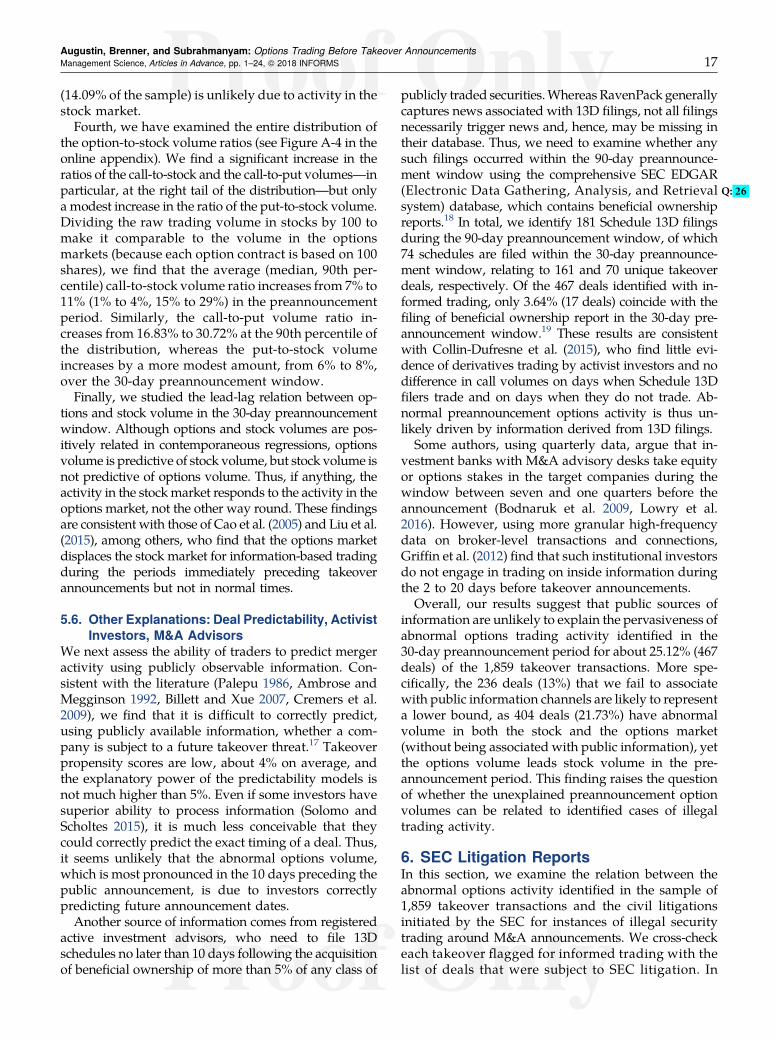
(14.09% of the sample) is unlikely due to activity in thestock market.
Fourth, we have examined the entire distribution ofthe option-to-stock volume ratios (see Figure A-4 in theonline appendix). We find a significant increase in theratios of the call-to-stock and the call-to-put volumes—inparticular, at the right tail of the distribution—but onlya modest increase in the ratio of the put-to-stock volume.Dividing the raw trading volume in stocks by 100 tomake it comparable to the volume in the optionsmarkets (because each option contract is based on 100shares), we find that the average (median, 90th per-centile) call-to-stock volume ratio increases from 7% to11% (1% to 4%, 15% to 29%) in the preannouncementperiod. Similarly, the call-to-put volume ratio in-creases from 16.83% to 30.72% at the 90th percentile ofthe distribution, whereas the put-to-stock volumeincreases by a more modest amount, from 6% to 8%,over the 30-day preannouncement window.
Finally, we studied the lead-lag relation between op-tions and stock volume in the 30-day preannouncementwindow. Although options and stock volumes are pos-itively related in contemporaneous regressions, optionsvolume is predictive of stock volume, but stock volume isnot predictive of options volume. Thus, if anything, theactivity in the stockmarket responds to the activity in theoptions market, not the other way round. These findingsare consistent with those of Cao et al. (2005) and Liu et al.(2015), among others, who find that the options marketdisplaces the stock market for information-based tradingduring the periods immediately preceding takeoverannouncements but not in normal times.
5.6. Other Explanations: Deal Predictability, ActivistInvestors, M&A Advisors
We next assess the ability of traders to predict mergeractivity using publicly observable information. Con-sistent with the literature (Palepu 1986, Ambrose andMegginson 1992, Billett and Xue 2007, Cremers et al.2009), we find that it is difficult to correctly predict,using publicly available information, whether a com-pany is subject to a future takeover threat.17 Takeoverpropensity scores are low, about 4% on average, andthe explanatory power of the predictability models isnot much higher than 5%. Even if some investors havesuperior ability to process information (Solomo andScholtes 2015), it is much less conceivable that theycould correctly predict the exact timing of a deal. Thus,it seems unlikely that the abnormal options volume,which is most pronounced in the 10 days preceding thepublic announcement, is due to investors correctlypredicting future announcement dates.
Another source of information comes from registeredactive investment advisors, who need to file 13Dschedules no later than 10 days following the acquisitionof beneficial ownership of more than 5% of any class of
publicly traded securities.Whereas RavenPack generallycaptures news associated with 13D filings, not all filingsnecessarily trigger news and, hence, may be missing intheir database. Thus, we need to examine whether anysuch filings occurred within the 90-day preannounce-ment window using the comprehensive SEC EDGAR(Electronic Q: 26Data Gathering, Analysis, and Retrievalsystem) database, which contains beneficial ownershipreports.18 In total, we identify 181 Schedule 13D filingsduring the 90-day preannouncement window, of which74 schedules are filed within the 30-day preannounce-ment window, relating to 161 and 70 unique takeoverdeals, respectively. Of the 467 deals identified with in-formed trading, only 3.64% (17 deals) coincide with thefiling of beneficial ownership report in the 30-day pre-announcement window.19 These results are consistentwith Collin-Dufresne et al. (2015), who find little evi-dence of derivatives trading by activist investors and nodifference in call volumes on days when Schedule 13Dfilers trade and on days when they do not trade. Ab-normal preannouncement options activity is thus un-likely driven by information derived from 13D filings.Some authors, using quarterly data, argue that in-
vestment banks with M&A advisory desks take equityor options stakes in the target companies during thewindow between seven and one quarters before theannouncement (Bodnaruk et al. 2009, Lowry et al.2016). However, using more granular high-frequencydata on broker-level transactions and connections,Griffin et al. (2012) find that such institutional investorsdo not engage in trading on inside information duringthe 2 to 20 days before takeover announcements.Overall, our results suggest that public sources of
information are unlikely to explain the pervasiveness ofabnormal options trading activity identified in the30-day preannouncement period for about 25.12% (467deals) of the 1,859 takeover transactions. More spe-cifically, the 236 deals (13%) that we fail to associatewith public information channels are likely to representa lower bound, as 404 deals (21.73%) have abnormalvolume in both the stock and the options market(without being associated with public information), yetthe options volume leads stock volume in the pre-announcement period. This finding raises the questionof whether the unexplained preannouncement optionvolumes can be related to identified cases of illegaltrading activity.
6. SEC Litigation ReportsIn this section, we examine the relation between theabnormal options activity identified in the sample of1,859 takeover transactions and the civil litigationsinitiated by the SEC for instances of illegal securitytrading around M&A announcements. We cross-checkeach takeover flagged for informed trading with thelist of deals that were subject to SEC litigation. In
Augustin, Brenner, and Subrahmanyam: Options Trading Before Takeover AnnouncementsManagement Science, Articles in Advance, pp. 1–24, © 2018 INFORMS 17
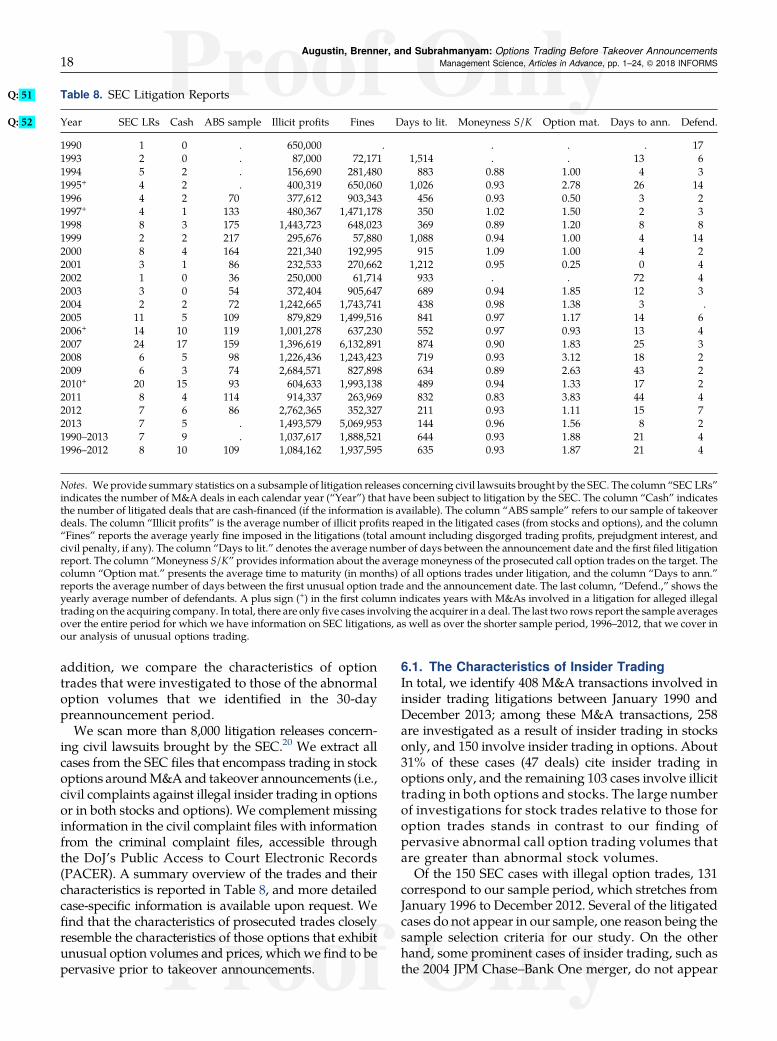
addition, we compare the characteristics of optiontrades that were investigated to those of the abnormaloption volumes that we identified in the 30-daypreannouncement period.
We scan more than 8,000 litigation releases concern-ing civil lawsuits brought by the SEC.20 We extract allcases from the SEC files that encompass trading in stockoptions aroundM&Aand takeover announcements (i.e.,civil complaints against illegal insider trading in optionsor in both stocks and options). We complement missinginformation in the civil complaint files with informationfrom the criminal complaint files, accessible throughthe DoJ’s Public Access to Court Electronic Records(PACER). A summary overview of the trades and theircharacteristics is reported in Table 8, and more detailedcase-specific information is available upon request. Wefind that the characteristics of prosecuted trades closelyresemble the characteristics of those options that exhibitunusual option volumes and prices, which we find to bepervasive prior to takeover announcements.
6.1. The Characteristics of Insider TradingIn total, we identify 408 M&A transactions involved ininsider trading litigations between January 1990 andDecember 2013; among these M&A transactions, 258are investigated as a result of insider trading in stocksonly, and 150 involve insider trading in options. About31% of these cases (47 deals) cite insider trading inoptions only, and the remaining 103 cases involve illicittrading in both options and stocks. The large numberof investigations for stock trades relative to those foroption trades stands in contrast to our finding ofpervasive abnormal call option trading volumes thatare greater than abnormal stock volumes.Of the 150 SEC cases with illegal option trades, 131
correspond to our sample period, which stretches fromJanuary 1996 to December 2012. Several of the litigatedcases do not appear in our sample, one reason being thesample selection criteria for our study. On the otherhand, some prominent cases of insider trading, such asthe 2004 JPM Chase–Bank One merger, do not appear
Table 8. SECQ: 51 Litigation Reports
Year SEC LRs Cash ABS sample IllicitQ: 52 profits Fines Days to lit. Moneyness S/K Option mat. Days to ann. Defend.
1990 1 0 . 650,000 . . . . 171993 2 0 . 87,000 72,171 1,514 . . 13 61994 5 2 . 156,690 281,480 883 0.88 1.00 4 31995+ 4 2 . 400,319 650,060 1,026 0.93 2.78 26 141996 4 2 70 377,612 903,343 456 0.93 0.50 3 21997+ 4 1 133 480,367 1,471,178 350 1.02 1.50 2 31998 8 3 175 1,443,723 648,023 369 0.89 1.20 8 81999 2 2 217 295,676 57,880 1,088 0.94 1.00 4 142000 8 4 164 221,340 192,995 915 1.09 1.00 4 22001 3 1 86 232,533 270,662 1,212 0.95 0.25 0 42002 1 0 36 250,000 61,714 933 . . 72 42003 3 0 54 372,404 905,647 689 0.94 1.85 12 32004 2 2 72 1,242,665 1,743,741 438 0.98 1.38 3 .2005 11 5 109 879,829 1,499,516 841 0.97 1.17 14 62006+ 14 10 119 1,001,278 637,230 552 0.97 0.93 13 42007 24 17 159 1,396,619 6,132,891 874 0.90 1.83 25 32008 6 5 98 1,226,436 1,243,423 719 0.93 3.12 18 22009 6 3 74 2,684,571 827,898 634 0.89 2.63 43 22010+ 20 15 93 604,633 1,993,138 489 0.94 1.33 17 22011 8 4 114 914,337 263,969 832 0.83 3.83 44 42012 7 6 86 2,762,365 352,327 211 0.93 1.11 15 72013 7 5 . 1,493,579 5,069,953 144 0.96 1.56 8 21990–2013 7 9 . 1,037,617 1,888,521 644 0.93 1.88 21 41996–2012 8 10 109 1,084,162 1,937,595 635 0.93 1.87 21 4
Notes. We provide summary statistics on a subsample of litigation releases concerning civil lawsuits brought by the SEC. The column “SEC LRs”indicates the number of M&A deals in each calendar year (“Year”) that have been subject to litigation by the SEC. The column “Cash” indicatesthe number of litigated deals that are cash-financed (if the information is available). The column “ABS sample” refers to our sample of takeoverdeals. The column “Illicit profits” is the average number of illicit profits reaped in the litigated cases (from stocks and options), and the column“Fines” reports the average yearly fine imposed in the litigations (total amount including disgorged trading profits, prejudgment interest, andcivil penalty, if any). The column “Days to lit.” denotes the average number of days between the announcement date and the first filed litigationreport. The column “Moneyness S/K” provides information about the average moneyness of the prosecuted call option trades on the target. Thecolumn “Option mat.” presents the average time to maturity (in months) of all options trades under litigation, and the column “Days to ann.”reports the average number of days between the first unusual option trade and the announcement date. The last column, “Defend.,” shows theyearly average number of defendants. A plus sign (+) in the first column indicates years with M&As involved in a litigation for alleged illegaltrading on the acquiring company. In total, there are only five cases involving the acquirer in a deal. The last two rows report the sample averagesover the entire period for which we have information on SEC litigations, as well as over the shorter sample period, 1996–2012, that we cover inour analysis of unusual options trading.
Augustin, Brenner, and Subrahmanyam: Options Trading Before Takeover Announcements18 Management Science, Articles in Advance, pp. 1–24, © 2018 INFORMS

in the SEC database. We have threeQ: 27 potential expla-nations for these discrepancies.
First, the SEC only reports civil litigations. If a case isdeemed criminal, then the DoJ will handle it, and it willusually not appear in the SEC records. We believe thisreason to be an unlikely cause, given that a case typicallydoes not come under criminal investigation without firstbeing investigated by the SEC.Our interpretation is basedon several discussions with securities law firms andprosecutors. It is also corroborated by Ahern (2017), whoidentifies only two cases among all (not just for M&As)the DoJ criminal complaints for insider trading that donot appear among the SEC civil litigation records. Sec-ond, the SEC may refrain from divulging the details ofa case to protect the identity of a whistleblower. In theseinstances, if the case is settled out of court, it will notappear in the public record. Third, the SEC is unlikely tolitigate if there is little chance of indictment. Despite thesebiases, 90 of the SEC litigation cases with illegal optiontrades are covered by our study; thisQ: 28 number becomes154 ifwe include those litigations of takeovers that featureonly illegal stock trades. Assuming that the publiclydisclosed deals represent all litigated cases, the publicrecords suggest that the SEC engaged in litigation inabout 8.28% of the 1,859 takeover deals in our sample (seethe informed trading subsample E in Table A-9 in theonline appendix). The four-dimensional Venn diagramon the top right figure of Table A-9 illustrates that, of the467 deals with informed options trading activity, 43 deals(9.21%) are litigated by the SEC/DoJ.Note also that SEC/DOJ initiated a litigation for only 10.21% (24 deals) of the236 transactions with informed options activity that isunlikely explained by public sources of information.
The statistics in Table 8 indicate that, for the take-overs available in the SEC litigation reports, 59.33% ofall cases are cash-financed transactions. Unreportedstatistics suggest that only 23.33% are purely stock-financed, whereas hybrid financing structures accountfor 12% of the litigation sample, and the financingstructure is unknown for the remaining 5.33% of thesample. Investors with private information are lesslikely to trade on stock-financed announcements, as theannouncement return is typically higher for cash deals.This is consistent with our finding of a greater cumu-lative abnormal call option volume for such transactions.The average profit reaped through “rogue trades” (inboth options and stocks) during our sample period isUSD 1.084 million. Meulbroek (1992) and Frino et al.(2013) report median insider profits of USD 24,673 andUSD 26,860, respectively, for illegal trading in stocks. Fortrades on the target firms, this profit arises from trans-actions that are almost exclusively purchases of OTM calloptions, at single or multiple strike prices.
The litigation reports reference put trades in only 6%of all cases. For 22 of these 25 put trades, we can identifythe trading direction, which suggests that these were all
sales of put options, consistent with the hypothesis thatinsiders would buy OTM calls and/or sell ITM puts.Table 8 shows that the average ratio of the stock price tothe strike price, in the case of call options purchased onthe target, is 93%. Only 25 observations (≈ 6%) haveamoneyness ratio above 1.05, the cutoff levelwedefinedfor ATM options. Of 25 put option trades on the targets,on the other hand, the average ratio of the stock price tothe strike price is 97.29%, which is within our definitionof ATM, but 12 of all these trades relate to sales of ITMput optionswith an average ratio of the stock price to thestrike price above 105%.Furthermore, the insider trades are primarily exe-
cuted in short-dated options, with an average time toexpiration of 1.87 months. We note that there is a largevariation in the timing of trades, the average insidetrader transacting 21 days before the announcementdate. However, the median trade occurs 11 days priorto the announcement. By contrast, Frino et al. (2013)document that insiders trade in target firms’ stocks onaverage 7 days before the announcement. This findingis supportive of the results discussed in Section 5.5,which suggest that options volume leads stock volumein the preannouncement period.It takes the SEC, on average, 644 days to publicly
announce its first litigation action in a given case. Thus,assuming that the litigation releases appear shortlyafter the actual initiation of investigations, it takes theSEC almost two years, on average, to prosecute a roguetrade. The fines, including disgorged trading profits,prejudgment interest, and civil penalty, if any, appearlarge enough to adequately recuperate illicit tradingprofits. The average fine is, at USD 1.889 million, aboutdouble the average rogue profit. This is, however,largely driven by cases related to 2007, which exhibita ratio of the average fine to the average profit of about4.39. Fines are also larger than those reported earlier forillegal trading in stocks. Themedian penalty reported byMeulbroek (1992) and Frino et al. (2013) is USD 21,000and USD 67,511, respectively. Finally, the typical insidertrade involves more than one person and is oftena network, as documented in detail by Ahern (2017).Wefind that the average number of defendants is four.To summarize, the bulk of the prosecuted trades relate
to purchases of plain vanilla, short-dated OTM calloptionswritten on target companies. The litigated tradesare, on average, approximately 7% OTM, executedwithin the 21-day period before the announcement, andmost frequently related to cash-financed deals. There issome indicative evidence of sales of ITM put options onthe target companies. The characteristics of allegedlyillegal trades closely resemble those of the abnormaloptions volumes of the 467 deals that we flag for in-formed trading among the 1,859 takeover transactions.These deals exhibit abnormal option trading volumes
Augustin, Brenner, and Subrahmanyam: Options Trading Before Takeover AnnouncementsManagement Science, Articles in Advance, pp. 1–24, © 2018 INFORMS 19
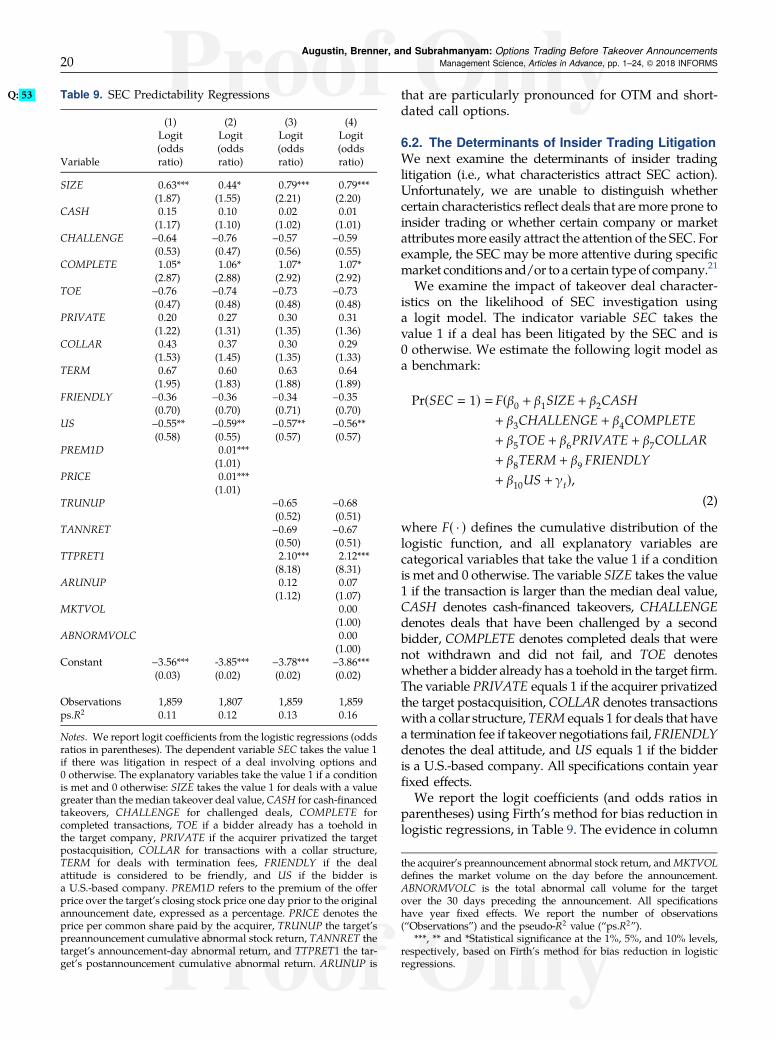
that are particularly pronounced for OTM and short-dated call options.
6.2. The Determinants of Insider Trading LitigationWe next examine the determinants of insider tradinglitigation (i.e., what characteristics attract SEC action).Unfortunately, we are unable to distinguish whethercertain characteristics reflect deals that are more prone toinsider trading or whether certain company or marketattributesmore easily attract the attention of the SEC. Forexample, the SEC may be more attentive during specificmarket conditions and/or to a certain type of company.21
We examine the impact of takeover deal character-istics on the likelihood of SEC investigation usinga logit model. The indicator variable SEC takes thevalue 1 if a deal has been litigated by the SEC and is0 otherwise. We estimate the following logit model asa benchmark:
Pr(SEC � 1) � F(β0 + β1SIZE + β2CASH
+ β3CHALLENGE + β4COMPLETE
+ β5TOE + β6PRIVATE + β7COLLAR
+ β8TERM + β9 FRIENDLY
+ β10US + γt),(2)
where F( · ) defines the cumulative distribution of thelogistic function, and all explanatory variables arecategorical variables that take the value 1 if a conditionis met and 0 otherwise. The variable SIZE takes the value1 if the transaction is larger than the median deal value,CASH denotes cash-financed takeovers, CHALLENGEdenotes deals that have been challenged by a secondbidder, COMPLETE denotes completed deals that werenot withdrawn and did not fail, and TOE denoteswhether a bidder already has a toehold in the target firm.The variable PRIVATE equals 1 if the acquirer privatizedthe target postacquisition, COLLAR denotes transactionswith a collar structure, TERM equals 1 for deals that havea termination fee if takeover negotiations fail, FRIENDLYdenotes the deal attitude, and US equals 1 if the bidderis a U.S.-based company. All specifications contain yearfixed effects.We report the logit coefficients (and odds ratios in
parentheses) using Firth’s method for bias reduction inlogistic regressions, in Table 9. The evidence in column
Table 9. SECQ: 53 Predictability Regressions
Variable
(1)Logit(oddsratio)
(2)Logit(oddsratio)
(3)Logit(oddsratio)
(4)Logit(oddsratio)
SIZE 0.63*** 0.44* 0.79*** 0.79***(1.87) (1.55) (2.21) (2.20)
CASH 0.15 0.10 0.02 0.01(1.17) (1.10) (1.02) (1.01)
CHALLENGE −0.64 −0.76 −0.57 −0.59(0.53) (0.47) (0.56) (0.55)
COMPLETE 1.05* 1.06* 1.07* 1.07*(2.87) (2.88) (2.92) (2.92)
TOE −0.76 −0.74 −0.73 −0.73(0.47) (0.48) (0.48) (0.48)
PRIVATE 0.20 0.27 0.30 0.31(1.22) (1.31) (1.35) (1.36)
COLLAR 0.43 0.37 0.30 0.29(1.53) (1.45) (1.35) (1.33)
TERM 0.67 0.60 0.63 0.64(1.95) (1.83) (1.88) (1.89)
FRIENDLY −0.36 −0.36 −0.34 −0.35(0.70) (0.70) (0.71) (0.70)
US −0.55** −0.59** −0.57** −0.56**(0.58) (0.55) (0.57) (0.57)
PREM1D 0.01***(1.01)
PRICE 0.01***(1.01)
TRUNUP −0.65 −0.68(0.52) (0.51)
TANNRET −0.69 −0.67(0.50) (0.51)
TTPRET1 2.10*** 2.12***(8.18) (8.31)
ARUNUP 0.12 0.07(1.12) (1.07)
MKTVOL 0.00(1.00)
ABNORMVOLC 0.00(1.00)
Constant −3.56*** -3.85*** −3.78*** −3.86***(0.03) (0.02) (0.02) (0.02)
Observations 1,859 1,807 1,859 1,859ps.R2 0.11 0.12 0.13 0.16
Notes. We report logit coefficients from the logistic regressions (oddsratios in parentheses). The dependent variable SEC takes the value 1if there was litigation in respect of a deal involving options and0 otherwise. The explanatory variables take the value 1 if a conditionis met and 0 otherwise: SIZE takes the value 1 for deals with a valuegreater than the median takeover deal value, CASH for cash-financedtakeovers, CHALLENGE for challenged deals, COMPLETE forcompleted transactions, TOE if a bidder already has a toehold inthe target company, PRIVATE if the acquirer privatized the targetpostacquisition, COLLAR for transactions with a collar structure,TERM for deals with termination fees, FRIENDLY if the dealattitude is considered to be friendly, and US if the bidder isa U.S.-based company. PREM1D refers to the premium of the offerprice over the target’s closing stock price one day prior to the originalannouncement date, expressed as a percentage. PRICE denotes theprice per common share paid by the acquirer, TRUNUP the target’spreannouncement cumulative abnormal stock return, TANNRET thetarget’s announcement-day abnormal return, and TTPRET1 the tar-get’s postannouncement cumulative abnormal return. ARUNUP is
the acquirer’s preannouncement abnormal stock return, andMKTVOLdefines the market volume on the day before the announcement.ABNORMVOLC is the total abnormal call volume for the targetover the 30 days preceding the announcement. All specificationshave year fixed effects. We report the number of observations(“Observations”) and the pseudo-R2 value (“ps.R2”).
***, ** and *Statistical significance at the 1%, 5%, and 10% levels,respectively, based on Firth’s method for bias reduction in logisticregressions.
Augustin, Brenner, and Subrahmanyam: Options Trading Before Takeover Announcements20 Management Science, Articles in Advance, pp. 1–24, © 2018 INFORMS

(1) suggests that the likelihood of SEC litigation ishigher for larger and completed deals that are initiatedby foreign bidders. A transaction with a deal valuegreater than themedian takeover deal value is 1.87 timesmore likely to face litigation. This evidence is consistentwith Podolski et al. (2013) and Wang (2013), who findsize to be an important predictor of SEC litigation. Thelog-odds ratio suggests that an acquisition undertakenby a foreign bidder is roughly twice as likely to beprosecuted as a takeover initiated by aU.S.-based bidder.Completed deals are positive predictors of options liti-gation, as a withdrawn or rumored deal is almost threetimes less likely to be investigated. The pseudo-R2 of theregression is reasonable, with a value of 11%. We furthertest for the importance of the offer premium (PREM1D)and the offer price (PRICE) in affecting the probability oflitigation. The results in column (2) indicate that both theoffer premiumand the offer price are positively related tothe probability of SEC litigation, although the magni-tudes of the odds ratios are just above 1.
Next,we testwhetherwe canpredict the SEC litigationsbased on the stock price behavior of the parties involvedin the transaction.We estimate an augmented logit modeland include TRUNUP, the target’s preannouncementcumulative abnormal stock return; TANNRET, the tar-get’s announcement-day abnormal return; TTPRET1, thetarget’s postannouncement cumulative abnormal return;and ARUNUP, the acquirer’s abnormal stock return be-fore the announcement day, and we report the results incolumn (3) of Table 9. Only the target’s postannounce-ment cumulative abnormal return is highly statisticallysignificant. The coefficient of 2.10 suggests that a targetwith a 1% higher cumulative abnormal postannounce-ment return is approximately eight timesmore likely to beinvestigated. This corresponds to a marginal effect of4.8%, keeping all other variables at their median levels.
We also check whether the market environment in thepreannouncement period has predictive ability for theSEC litigations. Thus, we augment the base model withMKTVOL, the market volume on the day before theannouncement, and ABNORMVOLC, the target’s totalabnormal call trading volume during the 30-day pre-announcement period, and report the results in column(4). None of these variables exhibits statistical significancein explaining the SEC civil litigations. This is surprising,as we do find that 25% of all deals in our sample featurean abnormal options volume that is difficult to associatewith public sources of information, andmany of these arenot litigated.22 In contrast to our results, Wang (2013)reports a positive relation between preannouncement calloptions volume and the probability of SEC litigation,without controlling for the influence of common varia-tion. In unreported results, we similarly find a significantpositive relation if we omit the year fixed effects. Thisevidence supports the conjecture that there may be timevariation in regulatory enforcement.
DeMarzo et al. (1998) suggest that it may be optimalto prosecute traders with inside information only afterlarge price moves or after large volume transactions,and not to penalize their small trades. Thus, it could becost effective and more impactful for a resource-constrained SEC to pursue illicit transactions relatingto the securities of larger-sized firms. On the one hand,our results provide support for DeMarzo et al. (1998),given that SEC litigation is more likely for deals withlarge transaction values, higher bid prices, and higheroffer premiums. It is difficult, however, to differentiatewhether traders with inside information prefer to tradeahead of transactions involving larger companies,which typically have more liquid options markets andprovide for greater opportunity to hide, or whether theSEC is more likely to go after large-scale deals that areeasier to detect and more broadly covered in the fi-nancial media. On the other hand, we do not findevidence that the odds of regulatory action are higherafter observing large abnormal options volumes. Fi-nally, we find that the odds of litigation are higher fordeals that are initiated by foreign acquirers. This mayindicate that rogue traders focus on foreign jurisdic-tions to gain and exploit their private information.Overall, the number of civil litigations initiated by theSEC because of illicit option trading ahead of takeoversappears modest in light of the pervasiveness of ab-normal options trading that we document for 25% ofthe takeover transactions in our sample.
7. ConclusionWe quantify the prevalence of informed trading activityin options of target firms ahead of unexpected takeoverannouncements in the United States from 1996 until2012. We find that 25% of all deals in our sample exhibitstatistically significant abnormal trading volumes inoptions and that this activity appears to be informed.Statistical tests suggest that the odds of the abnormalvolume arising out of chance are, at best, one in amillion.Our key contribution is the deal-by-deal examination
of the sources of informed trading to assess the like-lihood of the informed options activity being illegal.We show that the magnitude of this abnormal activityis unlikely explained by speculation, news and rumors,trading by registered insiders, stock market leakage, orinvestors’ ability to predict or time the takeover an-nouncement. Cross-checking the overlaps between allthese plausible explanations, we find that the activityfor a minimum of 13% of all deals in our sample isdifficult to associate with public sources of information.The prevalence of informed trading appears more
pervasive than would be expected based on the numberof prosecutions, as the SEC litigates illegal stock andoption trades for only 8.28% of takeovers and for only 43of the 467 deals in our sample that display signifi-cant informed options activity. Yet the characteristics of
Augustin, Brenner, and Subrahmanyam: Options Trading Before Takeover AnnouncementsManagement Science, Articles in Advance, pp. 1–24, © 2018 INFORMS 21

SEC-litigated insider trades in options ahead of takeoverannouncements closely resemble the characteristics ofthe (mostly unprosecuted) preannouncement optionsactivity that we flag as informed.
Guercio et al. (2017) argue that illegal insider trading inthe stock market has decreased in response to more ag-gressive enforcement. Our work, by contrast, suggeststhat it could have moved to the options market. This isthought-provoking, especially if there appears to besubstantial insider trading in many countries with lesssophisticated markets than the United States (Griffin et al.2011),which is the focus in our study. The characterizationof how and where informed investors trade is of interestnot only to economists studying the information structureof assetmarkets around takeover announcements but alsoto regulators and policy makers. Our findings call forfurther regulatory examination of abnormal option vol-umes ahead of takeover announcements.
AcknowledgmentsTheQ: 29 authors thank Kenneth Ahern, Yakov Amihud, LaurentBarras, Sebastien Betermier, Justin Birru, Rohit Deo,Benjamin Golez, John Griffin, Vic Khanna, Michael Neumann,Chayawat Ornthanalai, Sergei Sarkissian, Jan Schnitzler,Kenneth Singleton, Denis Schweizer, Anand Vijh, Ulf Von-Lilienfeld-Toal, Zvi Wiener, David Yermack, Xing Zhou,Fernando Zapatero, Bohui Zhang, two anonymous refereesand seminar participants at the 2013 OptionMetrics Re-search Conference, the New York University (NYU) SternCorporate Governance Luncheon, the Penn-NYU Confer-ence on Law and Finance, the CFA-JCF-Schulich Conferenceon Financial Market Misconduct, McGill University, theLuxembourg School of Finance, the 2014 Jerusalem FinanceConference, the 2014 European Finance Association AnnualMeeting, the Financial Management Association, SingaporeManagement University, Queen Mary University of London,the Chinese Finance Association (TCFA) Symposium atFordham University, the Columbia University–BloombergWorkshop on Machine Learning in Finance, the 2015Western Finance Association, the 2015 Northern FinanceAssociation, the Montreal Institute of Structured Productsand Derivatives (IFSID) 4th Conference on Derivatives, theFrankfurt School of Finance & Management, the NYU/NASDAQ-OMX Derivatives Research Project, the Univer-sity of Technology in Sydney, and the 2016 InternationalRisk Management Conference in Jerusalem for helpfulcomments and suggestions. The support of the InvestorResponsibility Research Centre Institute, the Chinese Fi-nance Association, and the Wharton Research DatabaseServices is greatly appreciated. The authors also thankNERA Economic Consulting and Morrison Foerster forsharing data and valuable discussions, and they are alsograteful to Yinglu Fu, Rodrigo Mayari, Zach Kahn, MathieuTaschereau, and Linxao Cong for outstanding research as-sistance. All errors remain the authors’ own.
Endnotes1We discuss other references on informed options trading prior totakeover announcements in Section 2 and summarize them in Table 1.
2We also find that ITM puts trade in abnormally larger volumes thanATM puts. This indicates that informed traders may possibly alsoengage in ITM put transactions or that the call trading generatesarbitrage-based put trading activity. We explicitly consider syntheticoptions strategies and show in the online appendix (Section A-I) thata wide variety of strategies for exploiting private information aboutan acquisition result in the trading of OTM calls or ITM puts.3For instance, Cao et al. (2005) and Wang (2013) document greaterabnormal options activity in short-term OTM and ATM options,respectively, whereas Chesney et al. (2015) find that abnormal vol-umes are greater for put options.4Wang (2013) finds no significant difference in abnormal optionsvolume for samples with and without media coverage. Klapper(2013) finds a greater stock price run-up for rumored deals. Again,by contrast, we use a novel high-frequency news database to revisitthe evidence and quantify the fraction of rumored deals.5Thus, 190 of the targets were involved in an unsuccessful merger oracquisition that was ultimately withdrawn. However, we includethese cases in our sample, because the withdrawal occurred after thetakeover announcement.6 In untabulated results, we find that, at the 1% significance level, thenumber of deals with positive abnormal trading volumes in the entiresample ranges from 275 for calls to 179 for puts, corresponding tofrequencies of 15% and 10%, respectively.7For statistical inference, we follow Campbell et al. (1996) andKothari and Warner (2007). We note that the predictive volumemodels account for lagged values of both dependent and independentvariables to purge serial correlation in the residuals at the firm level.Moreover, we show in the online appendix that the effects for optionvolumes do not arise in samples matched on randomized an-nouncement dates, on industry and firm characteristics, or ontakeover propensity scores. We also account for false positives inmultiple hypothesis testing, following the methodology in Barraset al. (2010). The frequency of mergers with statistically significantabnormal call option volume is still 24%, even thoughwe fail to adjustfor false negatives (i.e., the fact that we fail to reject the null hy-pothesis simply by chance), which leads to a downward bias in theproportion of anomalous trading we observe.8The expected cumulative abnormal volume for OTM put options isslightly higher than that for ITM put options. The difference of 433contracts is, nevertheless, small in unit terms, given that it isa cumulative measure taken over 30 days.9This analysis is based on a natural log transformation of volume.Hence, scaled cumulative abnormal log volume is comparable acrosscompanies and interpretable as a percentage relative to predictedvolume.10For details on insider trading regulations, see Bainbridge (2007),Crimmins (2013), and Morrison Foerster (2013).11The bar on identifying insider trading was raised in a 2014 decisionby the Second Circuit in United States v. Newman (773 Q: 30F.3d 438 (2dCir.2014)), ruling that it is necessary to show that (a) the trader knewthat the information was confidential and illegal and (b) that insideinformation was provided in exchange for a benefit of a pecuniary orsimilarly valuable natures. However, the Supreme Court rejected thisSecond Circuit’s requirement in December 2016, in Salman v. UnitedStates.12We explore different combinations of market variables and/or firmcharacteristics for the matching procedure using both raw volumeand natural log transformations of options volume. We also conducttests using takeover propensity score–matched samples following themethodology in Roberts and Whited (2012). All robustness tests arequantitatively and qualitatively consistent with the reported evi-dence, and they are therefore not reported.13Using the sentiment scores associated with RavenPack news for thesubsample of 170 deals with news and rumors, we confirm previous
Augustin, Brenner, and Subrahmanyam: Options Trading Before Takeover Announcements22 Management Science, Articles in Advance, pp. 1–24, © 2018 INFORMS

findings that sentiment explains abnormal volume (Han 2008).We notethat bullish signals lead to more abnormal trading in both calls andputs, whereas the strength of our previous findings of unusual optionsactivity ahead of takeover announcements was primarily confined tocalls. Thus, rumors and news trigger speculation and more tradingactivity overall but not necessarily directional trading on the target.14Corporate insiders are defined broadly as people who have “Q: 31 accessto non-public, material, insider information,” corporate officers, di-rectors, or large block-holders with a stake of 10% or more in thecompany. They are required to file SEC Forms 3, 4, and 5, and undercertain circumstances, Form 144, whenever they trade or intend totrade in their company’s securities.15We screen all open market derivative transactions, as well as in-formation on the exercise, award, and expiration of stock options,based on the Form 4 filings, which document a change in an insider’sownership position. We examine options, calls and puts, warrants,employee stock options, and group derivative security types withoption-embedded features, such as convertibles. We ignore optionexpirations and swap transactions, and we drop all records that areflaggedwith the cleansing codes S or A, indicating inaccuracies in thedata that are impossible to validate or are missing.16We find that about 24% of all deals have abnormal stock volumes atthe 5% level, if we use a natural log transformation of stock volume,which we compare with 33% of all deals that have cumulative ab-normal options volume using a natural log transformation. As therelative difference between deals with abnormal stock and optionsvolume is smaller for results using raw volume, we consider thesemagnitudes to be on the conservative side.17We report details on the takeover predictability model in the onlineappendix.18WeQ: 32 are indebted to Jan Schnitzler and Ulf Von-Lilienfeld-Toal forsharing these data with us.19 If we consider filings within 90 days before the announcement, 43deals have both abnormal options trading volume and 13D filings.We note that any options activity in response to such a filing duringthe 90 to 30 days before the announcement would introduce a biasagainst finding evidence of informed options trading, as this wouldincrease the predicted normal volume during the event window.Thus, we are primarily concerned with filings that occur during the30-day preannouncement window.20The litigation reports are publicly available on the SEC’s website,https://www.sec.gov/litigation/litreleases.shtml.Q: 3321Our discussions with the regulator suggest that the resource-constrained SEC is more likely to litigate cases that have a greaterchance of resulting in a conviction and that have generated sub-stantial illicit trading profits.22 In unreported tests, we examine whether there is any fundamentaldifference between those SEC cases that were pursued because ofalleged insider trading in options and those that were investigatedbecause of allegedly illicit trading in stocks. Our previous conclusionsremain largely unchanged.
ReferencesAcharya VV, Johnson TC (2010) More insiders, more insider trading:
Evidence from private-equity buyouts. J. Financial Econom. 98(3):500–523.
Agrawal A, Nasser T (2012) Insider trading in takeover targets.J. Corporate Finance 18(3):598–625.
Ahern KR (2017) Information networks: Evidence from illegal insidertrading tips. J. Financial Econom. 125(1):26–47.
Ambrose BW, Megginson WL (1992) The role of asset structure,ownership structure, and takeover defenses in determin-ing acquisition likelihood. J. Financial Quant. Anal. 27(4):575–589.
Andrade G, Mitchell M, Stafford E (2001) New evidence and per-spectives on mergers. J. Econom. Perspect. 15(2):103–120.
Arnold T, Erwin G, Nail L, Nixon T (2006) Do option marketssubstitute for stock markets? Evidence from trading on antici-pated tender offer announcements. Internat. Rev. Financial Anal.15(3):247–255.
Arshadi N (1998) Insider trading liability and enforcement strategy.Financial Management 27(2):70–84.
Arshadi N, Eyssell TH (1991) Regulatory deterrence and registeredinsider trading: The case of tender offers. Financial Management20(2):30–39.
Asquith P (1983) Merger bids, uncertainty, and stockholder returns.J. Financial Econom. 11(1–4):51–83.
Bainbridge SM (2007) Bainbridge’s Securities Law: Insider Trading, 2nded. (Foundation Press, New York).
Barras L, Scaillet O, Wermers R (2010) False discoveries in mutualfund performance:Measuring luck in estimated alphas. J. Finance65(1):179–216.
Bester A, Martinez VH, Rosu I (2011) Option pricing and the prob-ability of success of cash mergers. Working paper, University ofChicago. Q: 34
Bhattacharya U (2014) Insider trading controversies: A literaturereview. Annual Rev. Financial Econom. 6(1):385–403.
Billett M, Xue H (2007) The takeover deterrent effect of open marketshare repurchases. J. Finance 62(4):1827–1850.
Black F (1975) Fact and fantasy in use of options. Financial Analysts J.31(36–41):61–72.
Bodnaruk A, Massa M, Simonov A (2009) Investment banks as in-siders and the market for corporate control. Rev Financial Stud.22(12):4989–5026.
Bris A (2005) Do insider trading laws work? Eur. Financial Management11(3):267–312.
Campbell JY, Lo AW, MacKinlay AC (1996) The Econometrics of Fi-nancial Markets (Princeton University Press, Princeton, NJ).
Cao HH, Ou-Yang H (2009) Differences of opinion of public in-formation and speculative trading in stocks and options. Rev.Financial Stud. 22(1):299–335.
Cao C, Chen Z, Griffin JM (2005) Informational content of optionvolume prior to takeovers. J. Bus. 78(3):1073–1109.
Chakravarty S, McConnell JJ (1997) An analysis of prices, bid/askspreads, and bid and ask depths surrounding Ivan Boesky’sillegal trading in Carnation’s stock. Financial Management 26(2):18–34.
Chakravarty S, McConnell JJ (1999) Does insider trading really movestock prices? J. Financial Quant. Anal. 34(2):191–209.
Chan K, Ge L, Lin T-C (2015) Informational content of option tradingon acquirer announcement return. J. Financial Quant. Anal. 50(5):1057–1082.
Chesney M, Crameri R, Mancini L (2015) Detecting informedtrading activities in the options markets. J. Empirical Finance 33:263–275. Q: 35
Clements M, Singh H (2011) An analysis of trading in target stocksbefore successful takeover announcements. J. Multinational Fi-nancial Management 21(1):1–17.
Cohen L, Frazzini A, Malloy CJ (2010) Sell-side school ties. J. Finance65(4):1409–1437.
Cohen L, Malloy C, Pomorski L (2012) Decoding inside information.J. Finance 67(3):1009–1043.
Collin-Dufresne P, Fos V, Muravyev D (2015) Informed trading andoption prices: Theory and evidence from activist trading.Working paper, Ecole polytechnique fédérale de Lausanne,Lausanne, Switzerland. Q: 36
Cornell B, Sirri ER (1992) The reaction of investors and stock prices toinsider trading. J. Finance 47(3):1031–1059.
Cremers M, Weinbaum D (2010) Deviations from put-call parity andstock return predictability. J. Financial Quant. Anal. 45(2):335–367.
Augustin, Brenner, and Subrahmanyam: Options Trading Before Takeover AnnouncementsManagement Science, Articles in Advance, pp. 1–24, © 2018 INFORMS 23

CremersMKJ, Nair VB, John K (2009) Takeovers and the cross-sectionof returns. Rev. Financial Stud. 22(4):1409–1445.
Crimmins SJ (2013) Insider trading: Where is the line? Columbia Bus.Law Rev. 2(2013):330–368.Q: 37
DeMarzo PM, Fishman MJ, Hagerty KM (1998) The optimal en-forcement of insider trading regulations. J. Political Econom.106(3):602–632.
Dennis DK, McConnell JJ (1986) Corporate mergers and securityreturns. J. Financial Econom. 16(2):143–187.
Dodd P (1980) Merger proposals, management discretion andstockholder wealth. J. Financial Econom. 8(2):105–137.
Easley D, O’Hara M, Srinivas PS (1998) Option volume and stockprices: Evidence on where informed traders trade. J. Finance53(2):431–465.
Fishe RP, Robe MA (2004) The impact of illegal insider trading indealer and specialist markets: Evidence from a natural experi-ment. J. Financial Econom. 71(3):461–488.
FishmanMJ (1989) Preemptive bidding and the role of the medium ofexchange in acquisitions. J. Finance 44(1):41–57.
Frino A, Satchell S, Wong B, Zheng H (2013) How much does anillegal insider trade? Internat. Rev. Finance 13(2):241–263.
Griffin JM, Hirschey NH, Kelly PJ (2011) How important is the fi-nancial media in global markets? Rev. Financial Stud. 24(12):3941–3992.
Griffin JM, Shu T, Topaloglu S (2012) Examining the dark side offinancial markets: Do institutions trade on information frominvestment bank connections? Rev. Financial Stud. 25(7):2155–2188.
Guercio DD, Odders-White E, Ready M (2017) The deterrence effectof the securities and exchange commission’s enforcement in-tensity on illegal insider trading: Evidence from run-up beforenews events. J. Law and Econom. 60(2):269–307.
Han B (2008) Investor sentiment and option prices. Rev. FinancialStud. 21(1):387–414.
Heitzman S, Klasa S (2016) Informed trading reactions to new privateinformation: Evidence from nonpublic merger negotiations.SSRN Working Paper 1938436, University of Southern Cal-ifornia, Los Angeles.Q: 38
Hu J (2014) Does option trading convey stock price information?J. Financial Econom. 111(3):625–645.
Huang HC, Tung PS (2016) How does divergence of opinions affectthe relative trading activity and information content in optionand stock prior to takeover announcement? Quart. Rev. Econom.Finance 60(May):162–171.
Jarrell GA, Poulsen AB (1989) Stock trading before the announcementof tender offers: Insider trading or market anticipation? J. Law.Econom. Organ. 5(2):225–248.
Jayaraman N, Frye MB, Sabherwal S (2001) Informed trading aroundmerger announcements: An empirical test using transaction vol-ume and open interest in optionsmarket. Financial Rev. 36(2):45–74.
Jayaraman N, Mandelker G, Shastri K (1991) Market anticipation ofmerger activities: An empirical test. Managerial Decision Econom.12(6):439–448.
Jensen MC, Ruback RS (1983) The market for corporate control: Thescientific evidence. J. Financial Econom. 11(1–4):5–50.
Jin W, Livnat J, Zhang Y (2012) Option prices leading equity prices:Do option traders have an information advantage? J. AccountingRes. 50(2):401–432.
John K, Koticha A, Narayanan R, SubrahmanyamMG (2003) Marginrules, informed trading in derivatives and price dynamics. NYUWorking Paper FIN-01-038, New York University, New York.Q: 39
Johnson TL, So EC (2012) The option to stock volume ratio and futurereturns. J. Financial Econom. 106(2):262–286.
Kacperczyk MT, Pagnotta E (2016) Chasing private information. SSRNWorking Paper 2695197, Imperial College London, London.Q: 40
Kedia S, ZhouX (2014) Informed trading aroundacquisitions: Evidencefrom corporate bonds. J. Financial Markets 18(March):182–205.
Keown AJ, Pinkerton JM (1981) Merger announcements and insidertrading activity:An empirical investigation. J. Finance 36(4):855–869.
Klapper M (2013) The Nature of Informed Option Trading: Evidence fromthe Takeover Market (Anchor Academic Publishing, Hamburg,Germany).
Kothari SP, Warner JB (2007) Econometrics of event studies. EspenEckbo B, ed. Handbook of Corporate Finance: Empirical CorporateFinance, Vol. 1 (Elsevier, Amsterdam), 3–36.
Levy H, Yoder JA (1993) The behavior of option implied standarddeviations around merger and acquisition announcements. Fi-nancial Rev. 28(2):261–272.
Liu D, Lung PP, Lallemand J (2015) Anticipation of takeovers in stockand options markets. Internat. Rev. Econom. Finance 39(September):19–35.
Lowry M, Rossi M, Zhu Z (2016) Informed trading by adviser banks?A look at options holdings ahead of mergers. SSRN WorkingPaper 2579463, Drexel University, Philadelphia. Q: 41
Mandelker G (1974) Risk and return: The case of merging firms,J. Financial Econom. 1(4):303–335.
Meulbroek LK (1992) An empirical analysis of illegal insider trading.J. Finance 47(5):1661–1699.
Meulbroek LK, Hart C (1997) The effect of illegal insider trading ontakeover premia. Eur. Finance Rev. 1(1):51–80.
Morrison-Foerster (2013) Insider trading Annual review. Report,Morrison & Foerster, San Francisco.
Ordu U, Schweizer D (2015) Executive compensation and informedtrading in acquiring firms around merger announcements.J. Banking Finance 55(June):260–280.
Palepu KG (1986) Predicting takeover targets: A methodological andempirical analysis. J. Accounting Econom. 8(1):3–35.
Pan J, Poteshman AM (2006) The information in option volume forfuture stock prices. Rev. Financial Stud. 19(3):871–908.
Podolski EJ, Truong C, Veeraraghavan M (2013) Informed optionstrading prior to takeovers: Does the regulatory environmentmatter? J. Internat. Financial Markets Institutions Money27(December):286–305.
Poteshman AM (2006) Unusual option market activity andthe terrorist attacks of September 11, 2001. J. Bus. 79(4):1703–1726.
Roberts MR, Whited TM (2012) Endogeneity in empirical corporatefinance, Harris M, Stulz R, eds. Handbook of the Economics ofFinance, Vol. 2B (Elsevier, Oxford, UK), 493–572.
Roll R, Schwartz E, SubrahmanyamA (2010) O/S: The relative tradingactivity in options and stock. J. Financial Econom. 96(1):1–17.
Sanders RW, Zdanowicz JS (1992) Target firm abnormal returns andtrading volume around the initiation of change in controltransactions. J. Financial Quant. Anal. 27(1):109–129.
Schwert G (1996) Markup pricing in mergers and acquisitions,J. Financial Econom. 41(2):153–192.
Shafer M (2012) The option-to-stock volume ratio and acquisitiontargets. SSRN Electronic Working Paper 2060339, ProvidenceCollege School of Business, Providence, RI. Q: 42
Solomo D, Scholtes E (2015) What are we meeting for? The conse-quences of private meetings with investors. J. Law Econom. 58(2):325–355.
Spyrou S, Tsekrekos A, Siougle G (2011) Informed trading aroundmerger and acquisition announcements: Evidence from the UKequity and options markets. J. Futures Markets 31(8):703–726.
Subramanian A (2004) Option pricing on stocks in mergers and ac-quisitions. J. Finance 59(2):795–829.
Tse-Chun L, Xiaolong L (2015) Why do option prices predict stockreturns? J. Banking Finance 52(March):17–28.
Wang X (2013) What does the SEC choose to investigate? J. Econom.Bus. 65(January–February):14–32.
Xing Y, Zhang X, Zhao R (2010) What does the individual optionvolatility smirk tell us about future equity returns? J. FinancialQuant. Anal. 45(3):641–662.
Augustin, Brenner, and Subrahmanyam: Options Trading Before Takeover Announcements24 Management Science, Articles in Advance, pp. 1–24, © 2018 INFORMS

AUTHOR QUERIESDATE 7/26/2018
JOB NAME MNSC
ARTICLE 20183122
QUERIES FOR AUTHOR Augustin, Brenner, and Subrahmanyam
THIS QUERY FORM MUST BE RETURNED WITH ALL PROOFS FOR CORRECTIONS
Q: 1_Please provide all funding information, if applicable, including the names of the in-stitutions as well as any grant numbers associated with the funding, or confirm that nofunding was received.
Q: 2_Color figures will be converted to grayscale for the print version unless color in print hasbeen requested and paid for. Authors have the responsibility to check that the figures aresufficiently clear in both the online color and print black and white versions.
Q: 3_Please confirm that the short title in the running head, article title, author names, affili-ations, and email addresses are set correctly. If applicable, please provide ORCID numbersfor Brenner and Subrahmanyam.
Q: 4_Please confirm funding footnote is OK as set.
Q: 5_Please confirm that keywords are correct as set.
Q: 6_Please confirm that heading levels are correct as set.
Q: 7_Please verify that all displayed equations and in-text math notations are set correctly.
Q: 8_Reword “robustness tests, which support” to “robustness tests that support”?
Q: 9_Added “Schedule” before “13D” OK?
Q: 10_Please confirm/correct edits to the sentence beginning “The characteristics. . ..”
Q: 11_Added “First” before “in this paper” OK?
Q: 12_Please confirm added definition of IV at first mention.
Q: 13_The abbreviation CEO was used only once in text and has been written out, per style.
Q: 14_Reword “study the relation between” to “study the relationship between”?
Q: 15_Please confirm “from January 1996. . .through December 2012” meant; if so, should“between. . .and” constructions used above be changed?Note that the former includes thestart and end dates cited; the latter does not.
Q: 16_Hypothesis 1 (H1) has been reformatted per style; please confirm/correct edits here and toin-text citations, and check similar edits to Hypothesis 2 below.
Q: 17_The use of the word “respectively” usually indicates a one-to –one relationship betweentwo or more items in a sentence; because the relationship was unclear here, it has beenremoved. Please confirm or clarify original.
NUMBER 1 OF 3

Q: 18_Reword “Quantitatively” to “From a quantitative perspective”?
Q: 19_Added “respectively” after “7.23% and 5.65%” OK?
Q: 20_Reworded “As we used unsigned volume” to “Because we use unsigned volume” OK?Also, should “relation” be “relationship”? Please confirm/correct wording here and insimilar instances throughout.
Q: 21_Please confirm/correct edits to the sentence beginning “Most variables. . ..”
Q: 22_Added “we control for” before “year fixed effects” OK, for parallel list structure?
Q: 23_Note “Internet” has been reworded to “online” for consistency in ecompanion citations;please confirm.
Q: 24_If “heard on the street” is a direct quotation from Jarrell and Poulsen 1989, please providepage number.
Q: 25_OK to have “Second, we conduct. . .” start its own paragraph, for consistency with theother list items.
Q: 26_Please confirm added definition of EDGAR.
Q: 27_Unclear what the third potential explanation is; please clarify. If in a paragraph other thanthe one that starts with “First, the SEC only. . .” consider setting each explanation in itsown paragraph (i.e., set “Second, the SEC may. . .” as a new paragraph).
Q: 28_Reworded “and” to “this number becomes” OK?
Q: 29_Please confirm edits to the acknowledgments. If financial support is meant in the sentencebeginning “The support of. . .” please move this to the funding footnote on the first page.
Q: 30_Please confirm added decision information to United States v. Newman. Can a similarcitation be added for Salman v. United States below?
Q: 31_Please provide source of quotation in Endnote 14.
Q: 32_Consider moving Endnote 18 text to the Acknowledgments.
Q: 33_Please provide URL access date.
Q: 34_Please update Bester et al. 2011, if possible.
Q: 35_Please provide issue number for Chesney et al. 2015.
Q: 36_Please update Collin-Dufresne et al. 2015, if possible.
Q: 37_For Crimmins 2013, please confirm volume and issue numbers.
Q: 38_Please update Heitzman and Klasa 2016, if possible.
Q: 39_Please update John et al. 2013, if possible.
Q: 40_Please update Kacperczyk and Pagnotta 2016, if possible.
Q: 41_Please update Lowry et al. 2016, if possible.
NUMBER 2 OF 3

Q: 42_Please update Shafer 2012, if possible.
Q: 43_Please check that all tables and figures, including their titles and notes (whichmay containedits) are set correctly.
Q: 44_EWMA used only once in text and written out, per style. Please confirm written-outversion.
Q: 45_Please clarify meaning of “. . .” in Table 1.
Q: 46_Reword “between January 1996 through December 31, 2012” to “from January 1996through” or “between January 1996 and”?
Q: 47_In Table 3, please define dashes as used in the table body. Note SE is a standard ab-breviation and definition removed.
Q: 48_Define ps.-R2 and TOT_PREMIUM in Table 4 footnotes.
Q: 49_In Table 5, please confirm that “4E[CAV]” is as meant in panel A. Also, please providecolumn headers for panel C if different from those of panel B.
Q: 50_In Table 7, does “No A, B, C, D” mean none of them, or just no A? Please clarify.
Q: 51_In Table 8, the dashed lines under 1995 and above 2013 were removed, per journal style.Please confirm; if a demarcation is needed, consider adjusting the font style (e.g., italicizetext above and text belowwhere dashed lines would be) instead and explain significance.
Q: 52_ Include ($) under “Illicit profits” and “Fines”?
Q: 53_In Table 9, please consider explaining what differs among columns (1) to (4).
Q: 54_Please spell out all abbreviations throughout tables.
NUMBER 3 OF 3