Embed Size (px)
Citation preview
International Institute for Applied Systems AnalysisSchlossplatz 1 • A-2361 Laxenburg • Austria
Telephone: ( 43 2236) 807 342 • Fax: ( 43 2236) 71313E-mail: [email protected] • Internet: www.iiasa.ac.at
Interim Report IR-99-17
Towards New Energy Infrastructures in Eurasia: a backgroundpaperGer Klaassen ([email protected])Arnulf Grubler ([email protected])Leo Schrattenholzer ([email protected])
Approved by
Gordon J. MacDonald ([email protected])Director, IIASA
December 1999
Interim Reports on work of the International Institute for Applied Systems Analysis receive only limitedreview. Views or opinions expressed herein do not necessarily represent those of the Institute, its NationalMember Organizations, or other organizations supporting the work.
– ii –
Contents
1 Introduction 1
2 Overview of Current and FutureEnergy Developments 22.1 Introduction . . . . . . . . . . . . . . . . . . . . . . . . . . . . . . . . 22.2 Global perspectives . . . . . . . . . . . . . . . . . . . . . . . . . . . . 22.3 Prospects for Eurasia . . . . . . . . . . . . . . . . . . . . . . . . . . . 5
3 Environmental Impacts of These Developments 9
4 Illustrative Sketch of New EurasianEnergy Infrastructures 124.1 Energy integration . . . . . . . . . . . . . . . . . . . . . . . . . . . . 124.2 Gas pipeline infrastructures planned . . . . . . . . . . . . . . . . . . 144.3 Electricity infrastructure . . . . . . . . . . . . . . . . . . . . . . . . . 174.4 Capital requirements in relation to energy investments . . . . . . . . 194.5 The challenge of financing . . . . . . . . . . . . . . . . . . . . . . . . 21
5 Provisional Quantification of Gas Trade Flows 23
6 Illustrative Environmental Benefits 25
7 Conclusions 27
– iii –
Abstract
This study explores the concept of new energy infrastructures (in particular gaspipelines) in Eurasia and discusses its implications on future energy systems, gastrade, and the environment. Overall resource availability is not expected to be a realconstraint in meeting growing energy demand within the next 100 years, but thegeographical concentration of resources is. The expected increase in the use of do-mestic energy sources (coal) in Asia is associated with severe adverse environmentalimpacts causing significant damage to human health and the natural environment.In contrast, natural gas could offer an ideal bridge to the post fossil era, but requiresthe development of new Eurasian energy networks. Up-front investment in gas tran-sit pipelines may constitute a significant portion of future energy investments. Thefinancial risks appear significant and depend on factors such as demand and supplydevelopment, technological progress, geographical and political environments andprevailing regulatory regimes. Timely investments and associated cost reductions inthe necessary infrastructure could create the potential for FSU gas exports becomingten-fold as high in 2050 as otherwise would be the case. This would have signifi-cant positive impacts on the global, regional and local environment and also entailsignificant positive economic impacts. In addition, supply diversification would bepromoted.

– iv –
Acknowledgements
Financial support from the New Energy and Industrial Technology DevelopmentOrganization (NEDO), Japan, for this study is gratefully acknowledged.
– 1 –
Towards New Energy Infrastructures in Eurasia:
a background paper
Ger KlaassenArnulf Grubler
Leo Schrattenholzer
1 Introduction
Authoritative long-term energy development scenarios such as those developed byIIASA in collaboration with WEC (Nakicenovic et al., 1998) indicate substantialgrowth in Asian energy demand in the decades to come. Primary energy demand inAsia could overtake that of a larger Europe (Western and Eastern Europe, includingthe Former Soviet Union) as early as 2020, and by 2050 could be as high as 8.7 Gtoe(Gigatons oil equivalent). At present most of the Asian energy supply is based ontraditional biomass uses and domestic coal production. Both pose a serious threatto local, regional and global environment. Coal emits sulfur leading to acidifica-tion, as well as CO2 emissions causing climate change. Decarbonizing (reducing thecarbon intensity) Asian energy systems could offer significant economic as well asenvironmental benefits in the long-term. But, decarbonization requires that new en-ergy technologies and, foremost, new energy infrastructures, are available to matchthe potential supply of clean energy (natural gas and electricity), with the rapidlygrowing demand centers in Asia.The objective of this report is to explore the concept of new energy infrastruc-
tures (in particular gas pipelines) in Eurasia. Such new infrastructures should extendand link anew the gigantic hydrocarbon energy resources in the Caspian region andin Siberia with the consumption centers in Western and Central Europe, Japan,China, India and the rest of Asia. The energy regions of a larger Europe and ofAsia could mesh into a new “energy Eurasia” in which new infrastructures increaseaccess to energy as well as promote environmentally sound development through fur-ther decarbonization of energy systems, particularly in Asia. The report illustratessome impacts of new Eurasian energy infrastructures on future energy systems, gastrade, and the improvement of the local and regional (i.e., sulfur) as well as globalenvironment (i.e., CO2 emissions).The report has the following structure. Section 2 gives an overview of expected
global and Asian energy developments and Section 3 sketches the environmentalimplications of these developments. Section 4 outlines possible new energy infras-tructures and the associated investments and costs. Possible gas trade flows arequantified in Section 5. The illustrative environmental benefits of such expandedgas flows are discussed in Section 6. Section 7 concludes.
– 2 –
2 Overview of Current and Future
Energy Developments
2.1 Introduction
In collaboration with the World Energy Council (WEC), IIASA explored long-termglobal and world regional energy prospects.The joint IIASA-WEC study analyzed the prospects for improving the availabil-
ity and quality of energy services, and the wider implications these improvementsmay have. The study explored a broad range of global energy developments andtheir consequences, such as likely financing needs and environmental impacts. Thestudy’s findings were presented in the joint IIASA-WEC report (Grubler et al.,1995) and a number of related publications (Nakicenovic, et al., 1995; Grubler etal., 1996; Nakicenovic and Rogner, 1996; and Grubler and McDonald, 1995). Thestudy findings were also extensively reviewed and evaluated by ten WEC regionalexpert groups. The final results were published in Nakicenovic et al., (1998). Thissection summarizes the global outlook presented in the IIASA-WEC scenarios andsketches the implications for Asia in particular.
2.2 Global perspectives
The IIASA-WEC study explored three cases (A, B and C) of future social, economicand technological development for 11 world regions. Case A represents a high growthfuture in terms of vigorous economic development and unprecedented rapid tech-nology improvements; it includes three scenario variants reflecting alternative per-spectives on resource availability and directions of technological progress.1 Case Brepresents a middle course, with intermediate economic growth and more modesttechnology improvements. Case C is ecologically driven, incorporating challengingpolicies to simultaneously protect the environment and enhance North-South eco-nomic equity (Case C includes two scenario variants with alternative developmentsconcerning nuclear power).The key underlying elements that affect the outcome of the respective scenarios
are the following: population and economic growth, energy intensity, technologicaladvance and the energy resource base. These four clusters are usually exogenousassumptions that are combined in a consistent way in IIASA’s integrated scenarioassessment methodology. According to the scenarios, world population doubles bythe middle of the 21st century, reaching 12 billion by 2100. The world economywould expand three- to five-fold from 1990 to 2050 and 10- to 15-fold by 2100.In all scenarios, substantial reductions of energy intensities occur and economic
development outpaces the increase in energy demand. As individual technologiesprogress, and as inefficient technologies are retired in favor of more efficient ones,the amount of primary energy needed per unit of gross domestic product (GDP) –the energy intensity – decreases. All other factors being equal, the faster economicgrowth, the higher the turnover of capital, and the greater the energy intensity im-
1The three Case A scenarios include: A1, ample oil and gas; A2, return to coal; and A3,non-fossil (bio-nuclear) future, in which natural gas provides for the transitional fuel of choice.
– 3 –
� �
� �
� �
� �
� �
�
� � � � � � � � � � � � � � � � � � � � � � � �
��
�
�
�
� � � � � � � � � � � � � � �� � � � � � � �
� �
� �
�
�
�
�
�
� � � � � � � � � � � � � � � � � � � � � � � �
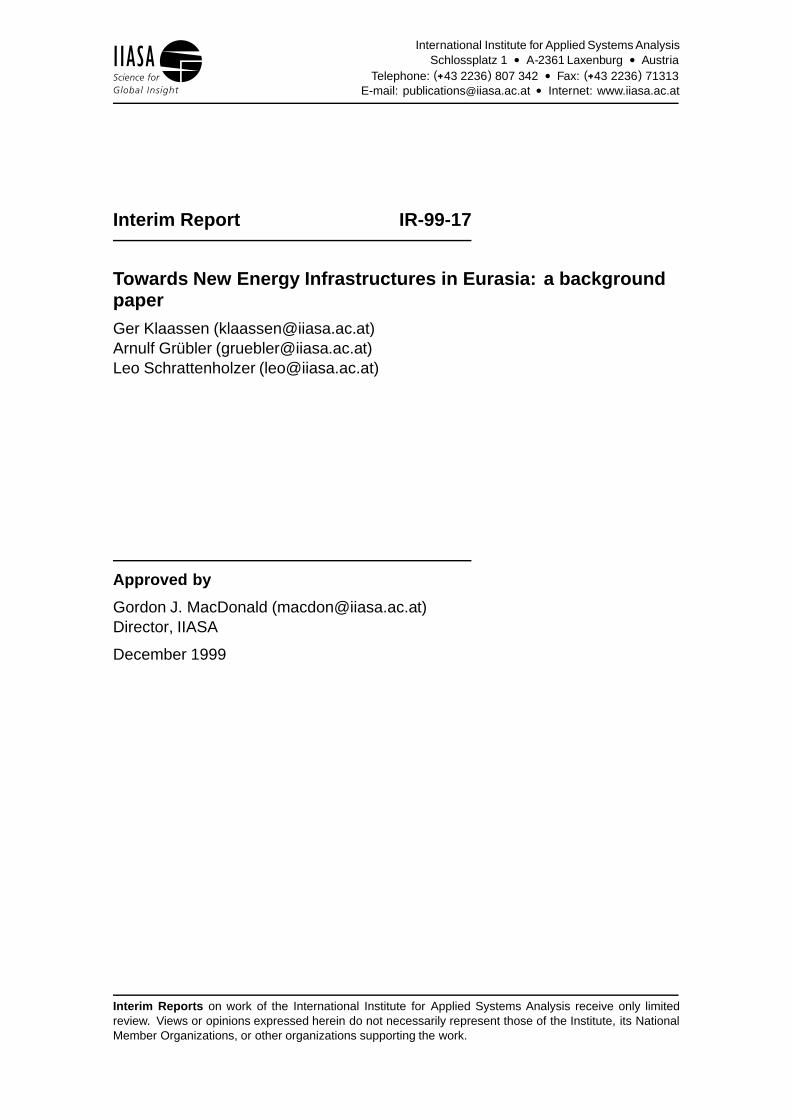
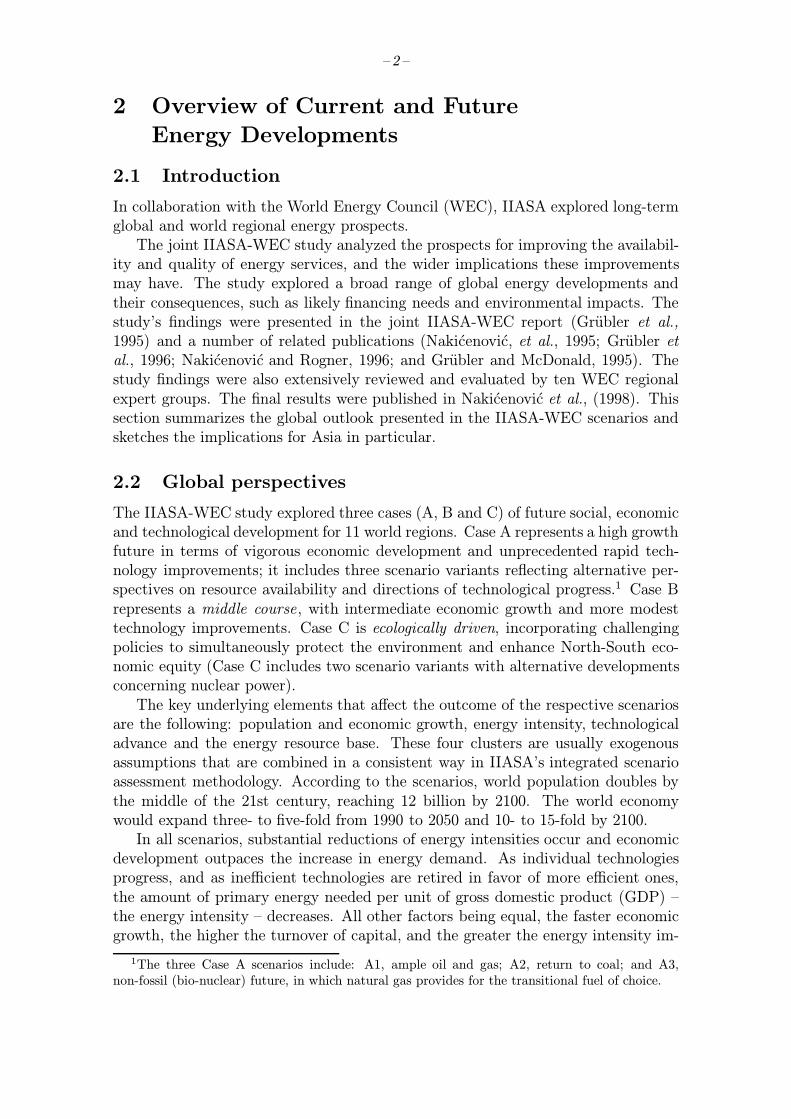
Figure 1. Global primary energy use, 1850 to present, and in the three IIASA-WEC Cases to 2100, in Gtoe. The insert shows global population growth, 1850 topresent, and the central projection to 2100 (Bos et al., 1992), in billion (109) people.Source: Nakicenovic et al. (1998)
provements. Improvements in individual technologies were varied across a rangederived from historical trends and current literature about future technology char-acteristics. Combined with the economic growth patterns of the different scenarios,the overall global average energy intensity reductions vary from about 0.8 to 1.0percent per year (Case B, respectively case A), to a high figure of 1.4 percent peryear (Case C). These figures bracket the historical rate experienced by more in-dustrialized countries during the last hundred years, which was approximately onepercent per year as the long-term average. Efficiency improvements are significantlyhigher in some regions, especially over shorter periods of time.The IIASA-WEC study envisages a 1.5- to three-fold increase in global primary
energy use by 2050, and a two- to five-fold increase by 2100. The six scenarios aregrouped into three different levels of primary energy consumption covering this widerange of alternative developments (see Figure 1 ).A consistent finding across all scenarios, is the progressive shift of future energy
demand towards the rapidly growing “south”. Whereas in 1990 developing countriesaccounted for 34 percent of global primary energy use, their share is expected topass 50 percent between 2020 and 2030 in all scenarios and reaches between 70 to82 percent by the end of the 21st century. This shift in the geographical center ofenergy use is particularly visible when assessing the prospective developments in Asia(see discussion below). This shift also explains the need to explore technological,
– 4 –
infrastructural, and investment strategies for a clean development of the anticipatedrapid energy growth in developing countries.The rates of technological change and the availability of energy resources also
vary in a consistent manner across the scenarios in the IIASA-WEC study. Forexample, the high rates of economic growth are associated with rapid technologicaladvance, ample resource availability and high rates of energy intensity improvement.Low rates of economic growth result in a more limited expansion of energy resources,lower rates of technological innovation in general, and lower rates of reduction inenergy intensities.The geophysical availability of energy resources is not a major constraint per se.
Instead, the availability of energy resources and the rates at which they are convertedinto reserves are a function of the envisaged development strategies themselves.Key trends are resource exploration and production efforts, technological advance,and investments into energy infrastructures. Which, and how much resources thusbecome available for future energy systems is by and large a function of interveningdevelopment strategies and investment choices leading to different patterns of energysupply in the long-term. Part of the divergence in the structures of future energysystems also depends on policy choices. For example, the two Case C scenarios thatassume successful international cooperation focused on environmental protectionand international economic equity use much less fossil fuels than the other scenarios.The IIASA-WEC scenarios indicate the possibilities for a wide range of energy
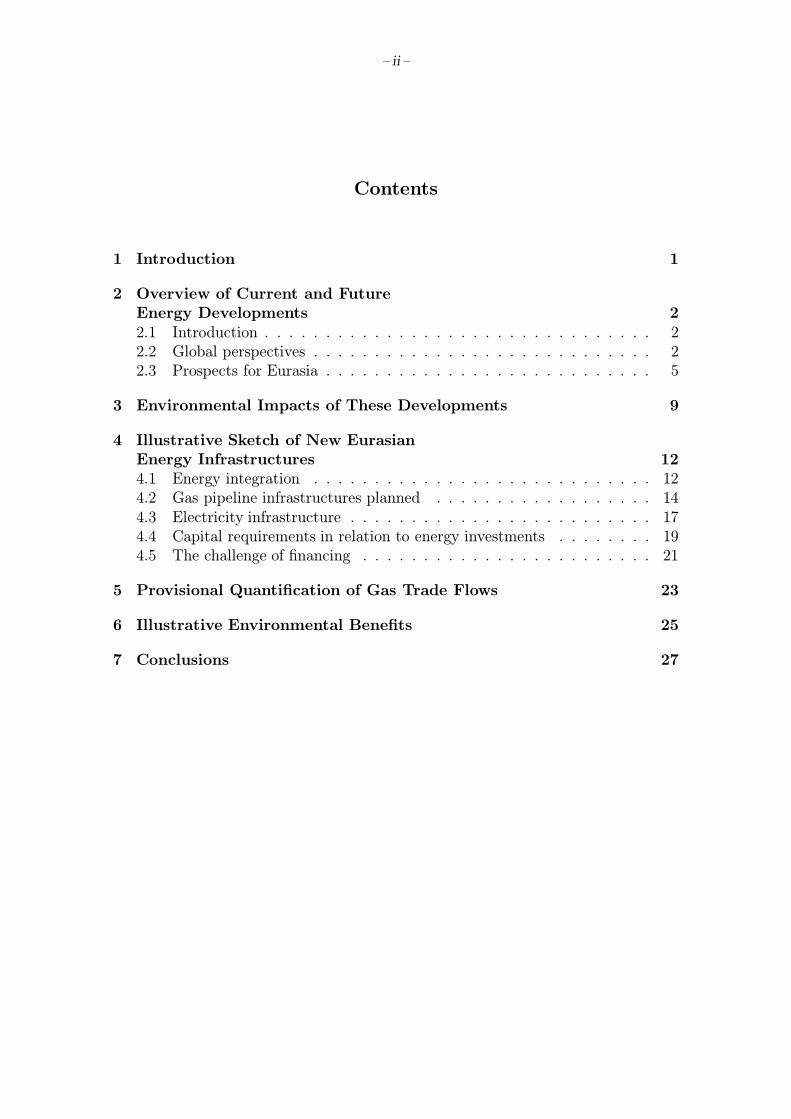
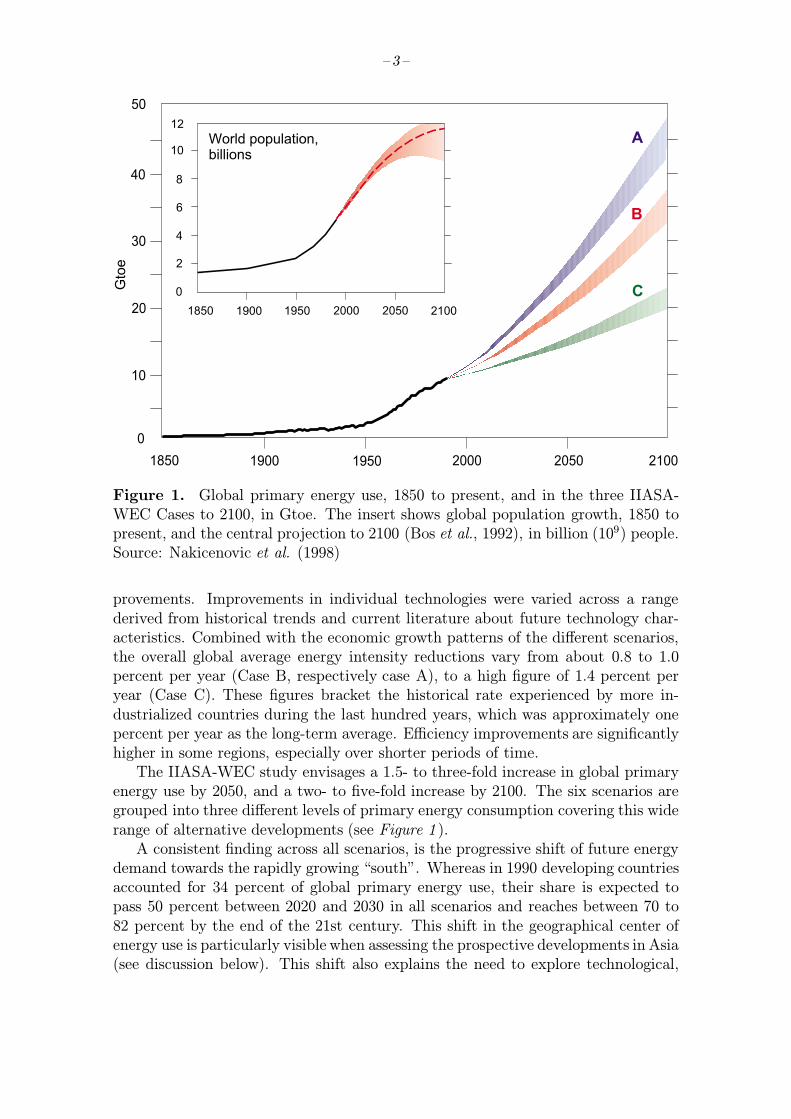
supply alternatives, from a tremendous expansion of, to strict limits on, coal pro-duction from a phaseout of nuclear energy to a substantial increase in its use, fromcarbon emissions in 2100 that are only one-third of today’s levels to emission in-creases of more than a factor of three. In spite of all the variations explored in thealternative scenarios, all manage to match the likely continuing push by consumersfor more flexible, more convenient and cleaner forms of energy as incomes rise (Fig-ure 2 ). Energy is thus increasingly transformed and converted into quality carrierssuch as electricity, liquids and energy gases. Hence, the issue of matching demandfor high quality energy carriers with available supply and a diversified energy port-folio (including imports), assumes a growing importance for future energy systems.Because of rapid demand growth, the required changes will be most pronounced inAsia.Alternative structures of future energy systems are capable of meeting these
stringent demands for higher-quality energy end use and services. Despite all thevariations, the scenarios look quite similar through 2020, and all still rely to a largeextent on fossil fuels. However, after 2020 the scenarios start to diverge. Somebecome coal-intensive, replicating the “conventional wisdom” scenario for Asia on aglobal scale (Scenario A2, and with lower economic and energy demand growth alsoin Case B). In others, like the high-growth Scenario A3, gas provides the transitionalfuel for a long-term structural shift towards post-fossil alternatives, or unconven-tional oil and gas resources allow an extension of the fossil fuel age well into the21st century (Scenario A1). The ecologically driven scenarios of Case C are morerenewable and nuclear intensive, albeit due to enhanced conservation efforts at lowerlevels of energy demand.
– 5 –
� � � � � � � � � � � �
�
� �
� �
� �
� �
� � �������
�
�
�
�
�
�
� � � �� � � � � � � � � � � � � � � � �
� � � � � � � � � � � � � � � � � !
" � � � � �� � � � � � � � � � # � � � !
$ � % � � � �� � � � � � � � � � � � �
# � � � � � � & � � � � � � !
Figure 2. World supply of final energy by form: solids (coal and biomass), liquids(oil products and methanol/ethanol), and grids (gas, district heat, electricity, andhydrogen). Overlapping shaded areas indicate variations across the three Cases ofthe IIASA-WEC Study. Source: Nakicenovic et al. (1998)
2.3 Prospects for Eurasia
The prospects for Eurasia2 are ultimately determined by GDP increases, energyintensity changes, technology dynamics and resource availability. A summary of themain scenario results from the two illustrative high growth scenarios (A2 and A3)of the IIASA-WEC study is given in Table 1 .For all scenarios, percent GDP increases in Asia are, in general, a factor two
to three times higher than the world average. Economic growth in a world re-gion as inhomogeneous as Eurasia is difficult to adequately characterize in a fewwords. Overall growth in Eurasia is determined by adding the output of economiesin transition, highly developed industrial countries, and rapidly growing developingcountries. Doing this for Case A results in a more than five-fold increase of GDP inEurasia between 1990 and 2050. The fastest growing economy within the region isChina with a factor of almost 30 during these 60 years. This overall growth corre-sponds to average annual rates of 5.6 percent for China and 3.0 percent for Eurasiaas a whole. The corresponding rates in Case B are 4.4 percent (China) and 2.3 per-cent (Eurasia). The FSU (Former Soviet Union) and Central and Eastern Europe(EEU) reach similarly high values after 2020.
2Eurasia consists of the following 6 out of 11 WEC study regions: CPA (Centrally Planned Asiaand China), SAS (South Asia), and PAS (Other Pacific Asia) which together form ASIA as wellas EEU (Central and Eastern Europe), FSU (Former Soviet Union), and WEU (Western Europe)which are called EUROPE.
– 6 –
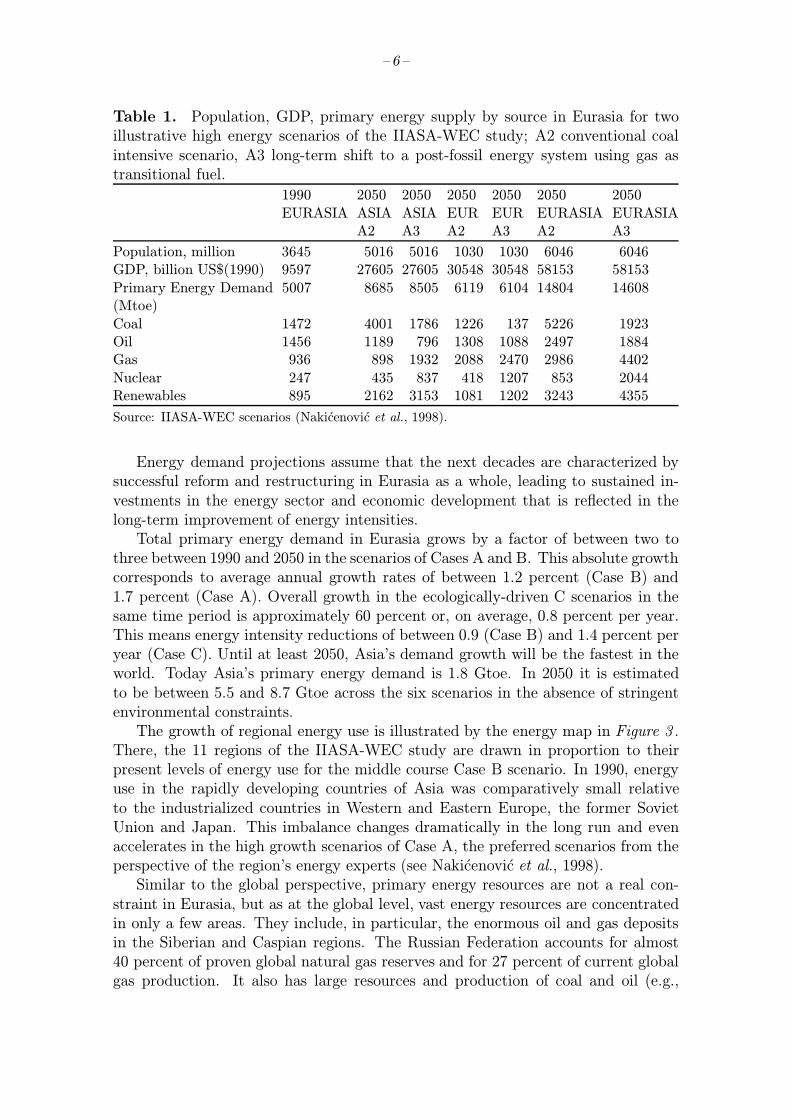
Table 1. Population, GDP, primary energy supply by source in Eurasia for twoillustrative high energy scenarios of the IIASA-WEC study; A2 conventional coalintensive scenario, A3 long-term shift to a post-fossil energy system using gas astransitional fuel.
1990 2050 2050 2050 2050 2050 2050EURASIA ASIA ASIA EUR EUR EURASIA EURASIA
A2 A3 A2 A3 A2 A3
Population, million 3645 5016 5016 1030 1030 6046 6046GDP, billion US$(1990) 9597 27605 27605 30548 30548 58153 58153Primary Energy Demand 5007 8685 8505 6119 6104 14804 14608(Mtoe)Coal 1472 4001 1786 1226 137 5226 1923Oil 1456 1189 796 1308 1088 2497 1884Gas 936 898 1932 2088 2470 2986 4402Nuclear 247 435 837 418 1207 853 2044Renewables 895 2162 3153 1081 1202 3243 4355
Source: IIASA-WEC scenarios (Nakicenovic et al., 1998).
Energy demand projections assume that the next decades are characterized bysuccessful reform and restructuring in Eurasia as a whole, leading to sustained in-vestments in the energy sector and economic development that is reflected in thelong-term improvement of energy intensities.Total primary energy demand in Eurasia grows by a factor of between two to
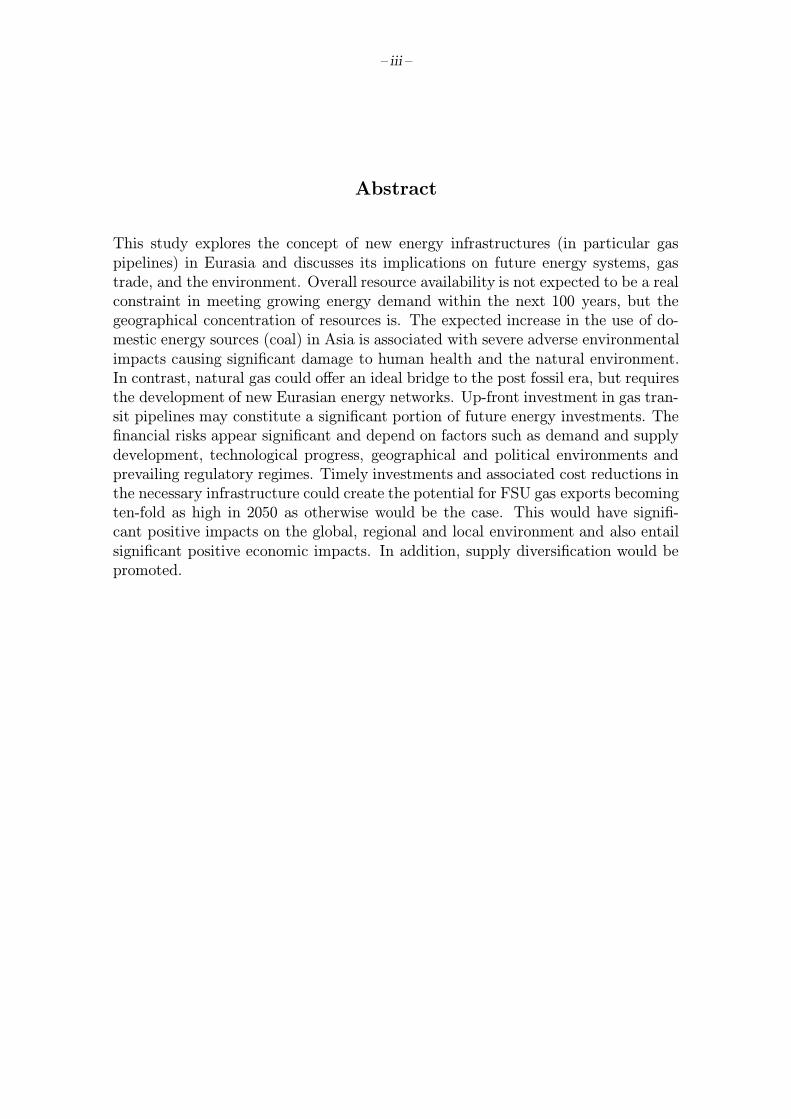
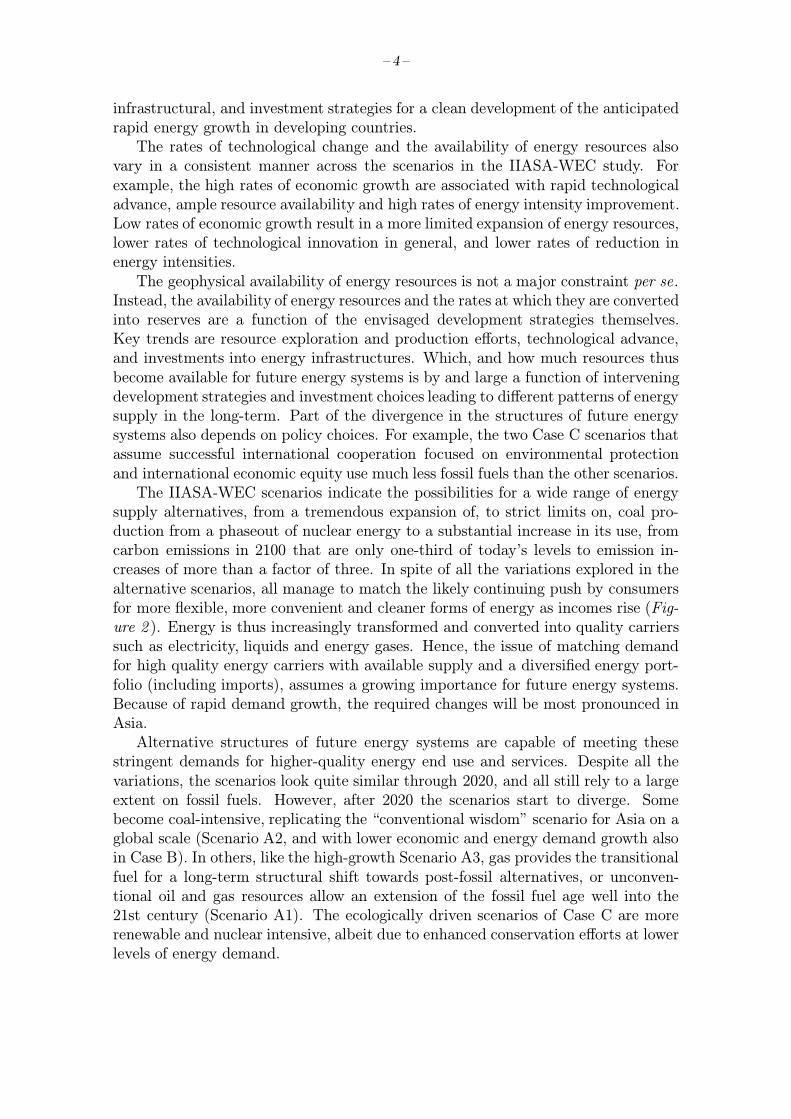
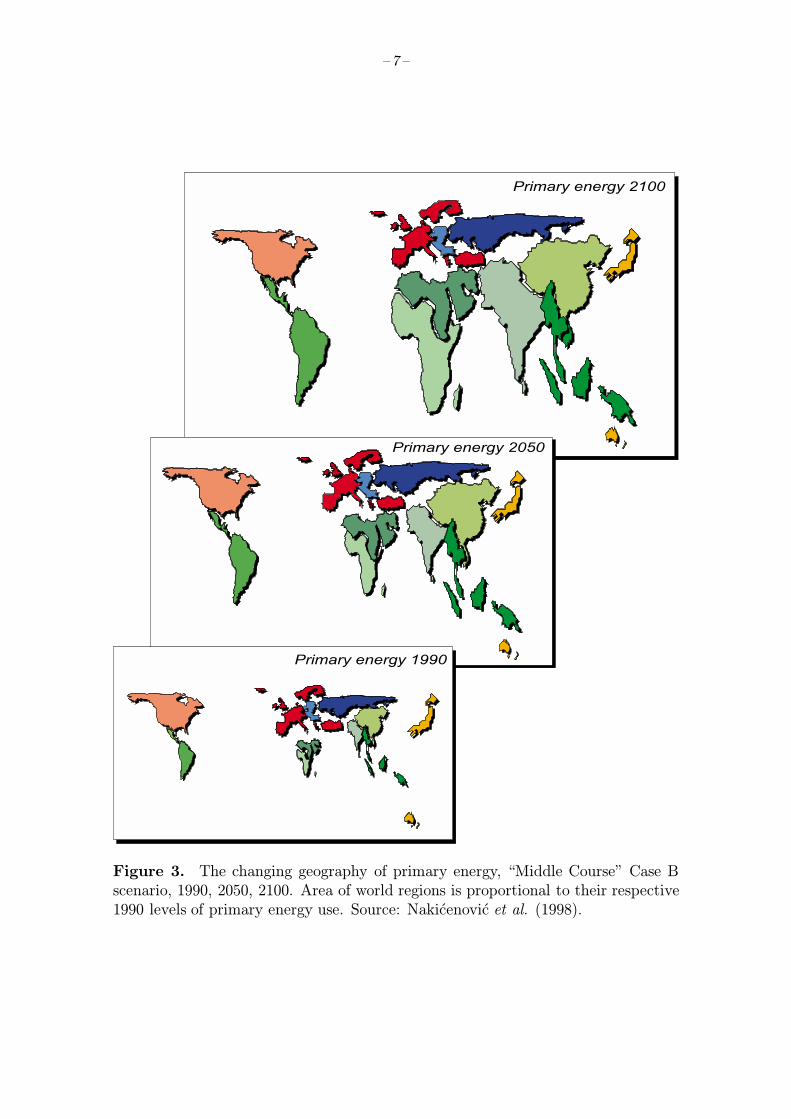
three between 1990 and 2050 in the scenarios of Cases A and B. This absolute growthcorresponds to average annual growth rates of between 1.2 percent (Case B) and1.7 percent (Case A). Overall growth in the ecologically-driven C scenarios in thesame time period is approximately 60 percent or, on average, 0.8 percent per year.This means energy intensity reductions of between 0.9 (Case B) and 1.4 percent peryear (Case C). Until at least 2050, Asia’s demand growth will be the fastest in theworld. Today Asia’s primary energy demand is 1.8 Gtoe. In 2050 it is estimatedto be between 5.5 and 8.7 Gtoe across the six scenarios in the absence of stringentenvironmental constraints.The growth of regional energy use is illustrated by the energy map in Figure 3 .
There, the 11 regions of the IIASA-WEC study are drawn in proportion to theirpresent levels of energy use for the middle course Case B scenario. In 1990, energyuse in the rapidly developing countries of Asia was comparatively small relativeto the industrialized countries in Western and Eastern Europe, the former SovietUnion and Japan. This imbalance changes dramatically in the long run and evenaccelerates in the high growth scenarios of Case A, the preferred scenarios from theperspective of the region’s energy experts (see Nakicenovic et al., 1998).Similar to the global perspective, primary energy resources are not a real con-
straint in Eurasia, but as at the global level, vast energy resources are concentratedin only a few areas. They include, in particular, the enormous oil and gas depositsin the Siberian and Caspian regions. The Russian Federation accounts for almost40 percent of proven global natural gas reserves and for 27 percent of current globalgas production. It also has large resources and production of coal and oil (e.g.,
– 7 –
� � � � � � � � � � � � � � �
� � � � � � � � � � � � � � �
� � � � � � � � � � � � � � � �
Figure 3. The changing geography of primary energy, “Middle Course” Case Bscenario, 1990, 2050, 2100. Area of world regions is proportional to their respective1990 levels of primary energy use. Source: Nakicenovic et al. (1998).
– 8 –
Rogner, 1997; Ebel, 1997). This concentration of global and regional energy re-serves and resources indicates the need for expanded energy trade and increasingenergy interdependence in Eurasia. For Eurasia, the key future development issuefor energy systems is how to bridge the increasing demand for clean and flexible en-ergy forms (electricity and natural gas) with resources either available in the region,or being developed through increasing energy systems integration as well as throughtechnological innovation.By far the least attractive scenario is that of limited integration and limited
energy supply diversification through new technology. By and large, this meansa continuation of the coal-intensive development path for Asia, as illustrated bythe A2 scenario of the IIASA-WEC study. Its negative environmental impacts areoutlined in the next section.An attractive alternative of progressive energy systems decarbonization is illus-
trated by Scenario A3. There, gas is the transitional clean fuel of choice enabling atechnology-led transition to a post-fossil energy system in the second half of the 21stcentury. By the middle of the next century, the biggest relative and absolute naturalgas use of all six IIASA-WEC scenarios is projected therefore for the A3 scenario:natural gas demand in Eurasia could exceed 5300 bcm (4400 Mtoe) in the year 2050.This is close to a factor three larger than current global gas use, and about 100 timeslarger than the capacity of the giant Yamal gas pipeline (approximately 60–80 bcmper year). Evidently, the infrastructure requirements of such a scenario are substan-tial. Assumptions on natural-gas conversion technologies are also reflected in theshare of natural gas in total primary energy. The highest natural-gas share in Eura-sia in 2050 is 30 percent (in the A3 scenario), a value lower than that of the SovietUnion in 1990. This means that even the most gas-intensive of the six IIASA-WECscenarios has room for still higher gas shares. The prime candidate for still highergas demand is the power sector but the transportation sector could also absorb sub-stantial amounts of natural gas as illustrated by the example of Pakistan. There,a fleet of 100,000 CNG vehicles keeps growing further. The high share of naturalgas in A3 is the result of the significant technological progress and cost reductionsassumed in extracting, transporting and using natural gas.Between 1990 and 2050 electricity demand in Eurasia is expected to increase by
a factor of five in Asia and by nearly a factor of three in the European part (FSU,EEU and WEU). In 2100, electricity demand is expected to be even a factor 12higher than 1990 in the A3 scenario in Asia, and nearly five times higher in Europe.The challenge therefore is to match the rich energy resources of Eurasia to grow-
ing demands. Resources and demands must be matched geographically throughtrade, transportation networks and energy grids. They must be matched financiallythrough investment flows and reforms designed to attract those investment flows.And they must be matched in terms of flexibility, convenience and cleanliness.Eurasia has substantial energy resources, and substantial technological and fi-
nancial expertise will be needed to match the rapidly expanding energy needs withthe required energy supply. For instance, with rising incomes, high-quality fuelssuch as gas and electricity will need to expand faster than the energy sector as anaverage. Yet, with the exception of Western Europe (and LNG imports in Japan),grid connections and therefore trade possibilities for gas and electricity are largely
– 9 –
undeveloped. The key question is therefore how best to apply available expertiseand resources (technological, financial) to mobilize Eurasia’s energy resources foreconomic and social development.The IIASA-WEC study indicates that coal will remain largely a domestic or
regional resource with its markets increasingly confined to the upstream conversionsector (electricity and, in the long-term, synfuels). Oil and natural gas with theirassociated versatility and, in the case of gas, cleanliness are both premium end-usefuels (for transport, services, and households) as well as premium industry feedstocks(for petrochemicals). With rapid developments in the economics and efficiency ofgas turbines, natural gas is also becoming increasingly attractive in the power plantsector.Thus, balancing supply and demand for oil and natural gas will constitute the
main political, infrastructural, technological, and financial challenge in the decadesto come. This problem is of particular importance for developing the vast hydro-carbon resources of the Caspian region and Siberia.
3 Environmental Impacts of These Developments
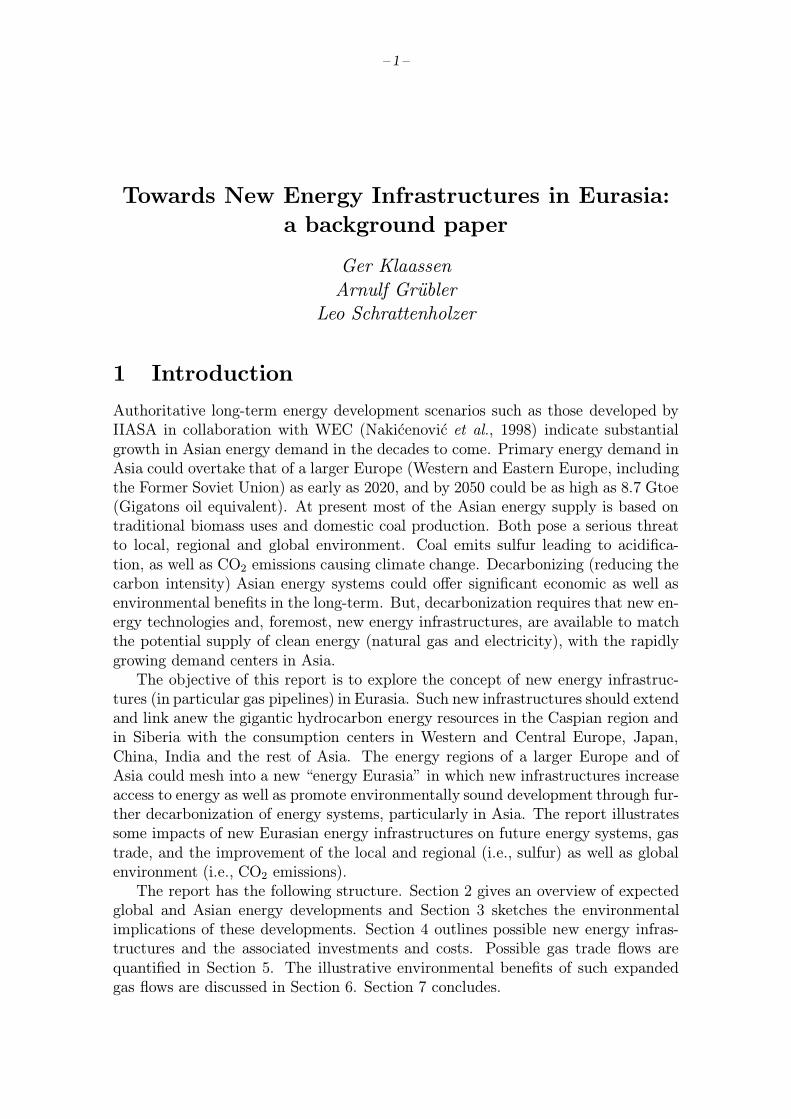
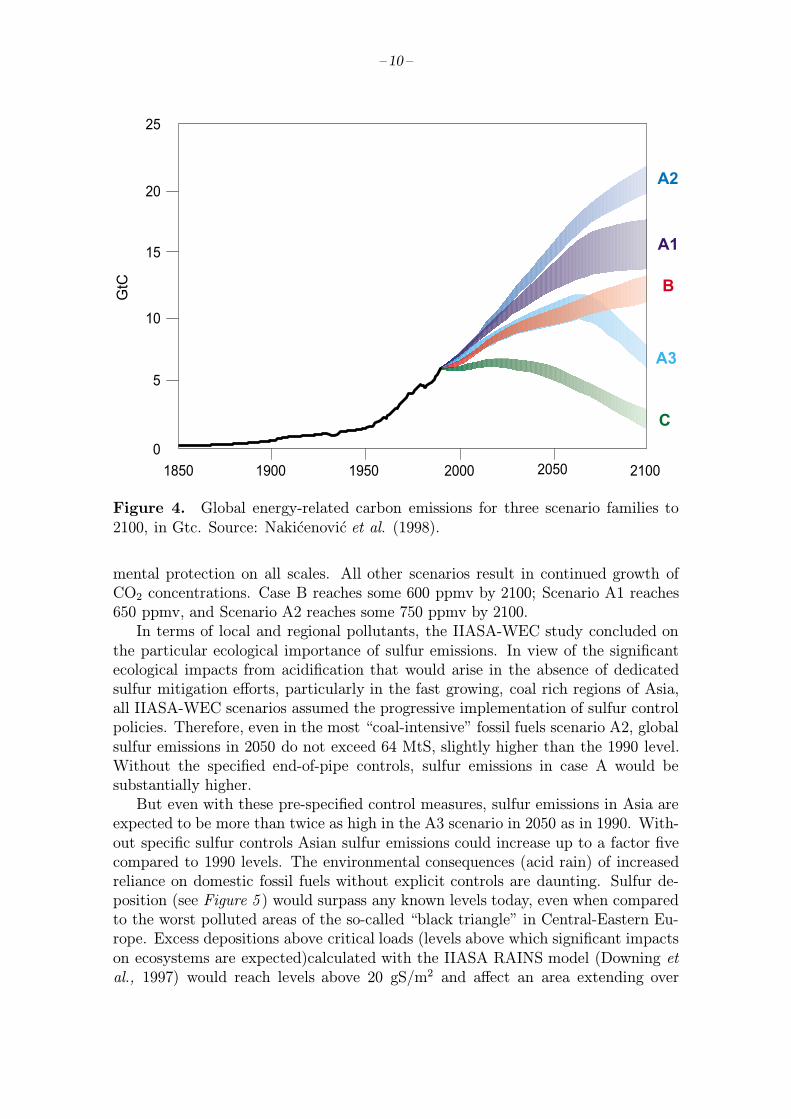
The IIASA-WEC study dealt with a number of environmental issues ranging fromlocal and regional to global scales. The scenarios provide details on these environ-mental issues including for instance non-commercial energy use (as a potential sourcefor local environmental degradation and deforestation) or sulfur emissions (potentialsource of acidification impacts, particularly pronounced in Asia). For each of the sixscenarios, CO2 emissions, as the dominant greenhouse gas, are determined by theirlevel of energy consumption and the structure of energy supply. Figure 4 showsthe results and illustrates the environmental impacts of alternative primary energyroads of the three Case A scenarios.CO2 emissions vary substantially between the scenarios. In the coal-intensive
Scenario A2 they reach 20 GtC (gigatons carbon emissions) in 2100, in Scenario A1,14 GtC, but in Scenario A3 significant structural change in the energy system reducesthe figure to 6 GtC. The latter is about the same level as current global energy-related carbon emissions, in spite of the fact that the energy consumption wouldhave risen five-fold. Case B’s emissions are comparable to those of Scenario A3 upto 2070, but are nearly double relative to 1990 by 2100. The two scenarios of Case Cwere constrained to stabilize emissions at current levels by 2050, in order to achievean emission ceiling of 2 GtC (one-third their current level) by 2100.The atmospheric CO2 concentrations and surface temperature warming that
might result from the scenario emissions were calculated using a carbon cycle andclimate model developed by Wigley et al. (1994). The calculations also includednon-energy sector greenhouse gases (GHG) emissions (taken from the IPCC IS92scenario series, cf. Pepper et al., 1992). By 2100 the two Case C scenarios achieve astabilization of atmospheric CO2 concentration below 450 ppmv (parts per millionby volume). Scenario A3 is consistent with CO2 concentration stabilization at 550ppmv, assuming that the declining emission trends continue post 2100. Thus, itis the only high growth scenario that leads to stabilization of CO2 concentrations,illustrating strategies of reconciling economic development aspirations with environ-
– 10 –
�
�
� �
� �
� �
� �
� � � � � � � � � � � � � � � � � � � � � � � �
'
� �
� �
�
�
� �
Figure 4. Global energy-related carbon emissions for three scenario families to2100, in Gtc. Source: Nakicenovic et al. (1998).
mental protection on all scales. All other scenarios result in continued growth ofCO2 concentrations. Case B reaches some 600 ppmv by 2100; Scenario A1 reaches650 ppmv, and Scenario A2 reaches some 750 ppmv by 2100.In terms of local and regional pollutants, the IIASA-WEC study concluded on
the particular ecological importance of sulfur emissions. In view of the significantecological impacts from acidification that would arise in the absence of dedicatedsulfur mitigation efforts, particularly in the fast growing, coal rich regions of Asia,all IIASA-WEC scenarios assumed the progressive implementation of sulfur controlpolicies. Therefore, even in the most “coal-intensive” fossil fuels scenario A2, globalsulfur emissions in 2050 do not exceed 64 MtS, slightly higher than the 1990 level.Without the specified end-of-pipe controls, sulfur emissions in case A would besubstantially higher.But even with these pre-specified control measures, sulfur emissions in Asia are
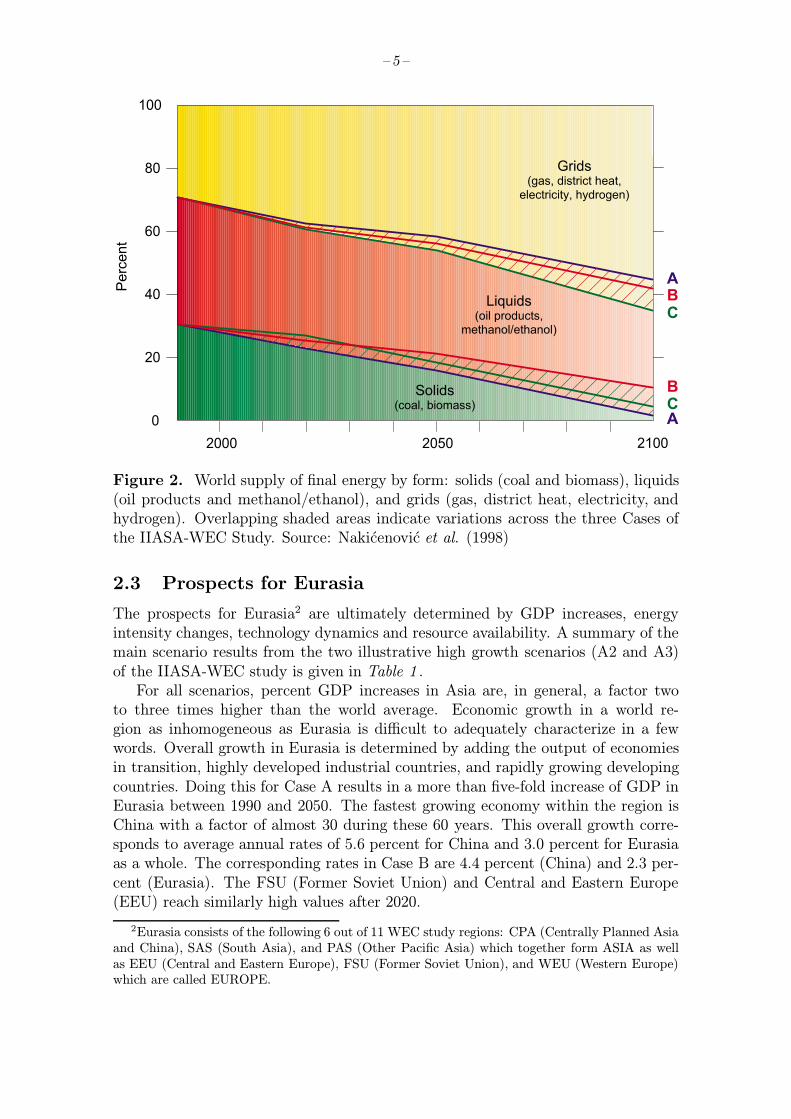
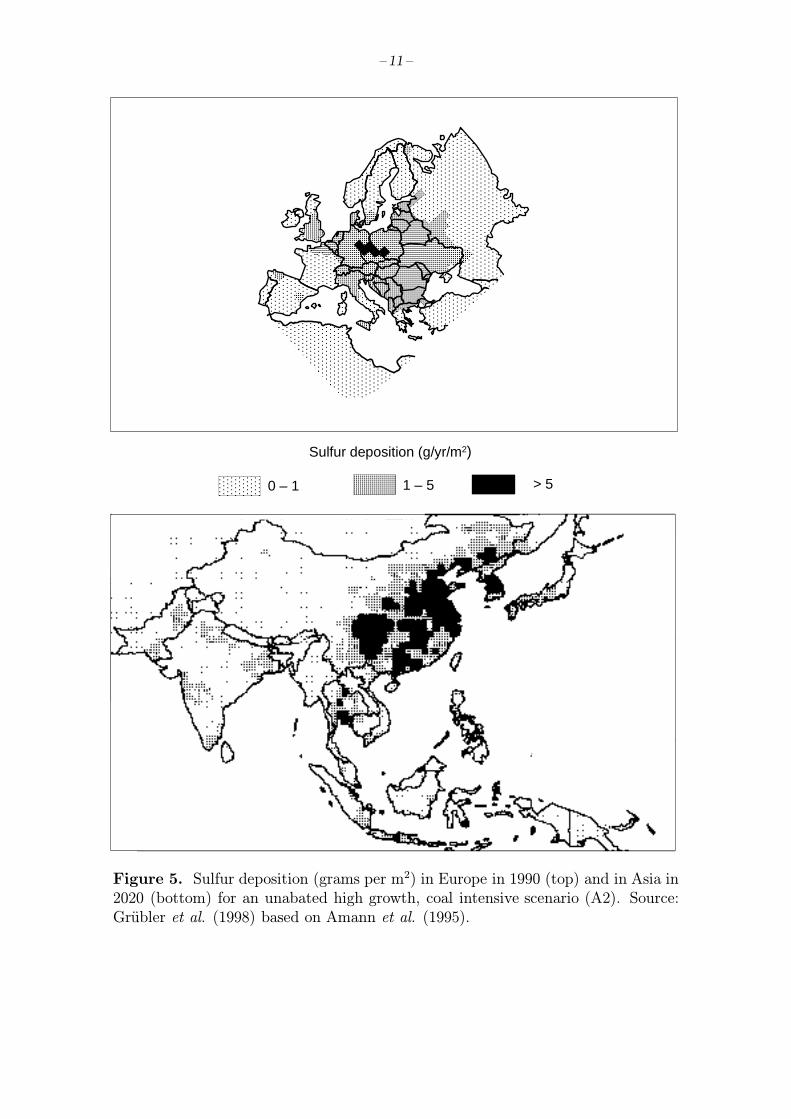
expected to be more than twice as high in the A3 scenario in 2050 as in 1990. With-out specific sulfur controls Asian sulfur emissions could increase up to a factor fivecompared to 1990 levels. The environmental consequences (acid rain) of increasedreliance on domestic fossil fuels without explicit controls are daunting. Sulfur de-position (see Figure 5 ) would surpass any known levels today, even when comparedto the worst polluted areas of the so-called “black triangle” in Central-Eastern Eu-rope. Excess depositions above critical loads (levels above which significant impactson ecosystems are expected)calculated with the IIASA RAINS model (Downing etal., 1997) would reach levels above 20 gS/m2 and affect an area extending over
– 11 –
Sulfur deposition (g/yr/m2)
0 – 1 1 – 5 > 5
Figure 5. Sulfur deposition (grams per m2) in Europe in 1990 (top) and in Asia in2020 (bottom) for an unabated high growth, coal intensive scenario (A2). Source:Grubler et al. (1998) based on Amann et al. (1995).
– 12 –
200,000 km2 in China alone. Critical loads would also be exceeded in NortheastIndia by more than 7 gS/m2. Evidently, such high levels of acidic deposition implyecological disaster for most natural ecosystems and also for economically importantfoodcrops. Analysis with an agricultural model (Fischer and Rosenzweig, 1996) fora similar scenario estimate that crop production in China would be reduced by up toone third over large parts of China threatening adequate food supply for a popula-tion reaching two billion people by the mid-21st century. On top of this, significantnegative impacts for human health can be expected.
4 Illustrative Sketch of New Eurasian
Energy Infrastructures
4.1 Energy integration
One of the important results of the IIASA-WEC study is the need for further en-ergy integration in Eurasia to achieve the twin goals of supplying the energy servicesneeded for economic development and reducing the adverse impacts on the environ-ment at all scales. Clean fossil fuels would continue to be an important source ofthese energy services and would lead to further decarbonization of energy. This,however, requires the emergence of large-scale interconnected energy grids in Eura-sia. Such developments could dramatically improve the match between demand andsupply for cleaner hydrocarbons (oil and gas) and, in the long term, promote thefurther integration of Europe and Asia, e.g., through gas and electricity networks.Historically, energy infrastructures have evolved radially through interconnec-
tions between a few large centers of energy demand and yet fewer centers of energysupply, as exemplified by the gas transport infrastructure between Urengoy andWestern Europe, or the LNG route from Indonesia to Japan. At least from thedemand side, a newly emerging “polycentric” structure could offer numerous advan-tages: enlarged resource availability, diversified supply, improved economics, and acleaner environment.The radial patterns of the evolution of energy infrastructures are primarily a
result of differences in spatial energy demand densities. By and large, infrastruc-tures “grow” from large spatial concentrations of supply (oil and gas fields) to largespatial concentrations of demand (e.g., urban agglomerations, city clusters). Withlow energy demand densities, the economics of building large, capital-intensive in-frastructures simply do not exist. The mere existence of infrastructures can in turnstimulate energy demand growth.Concepts and models of spatial energy demand densities have been developed at
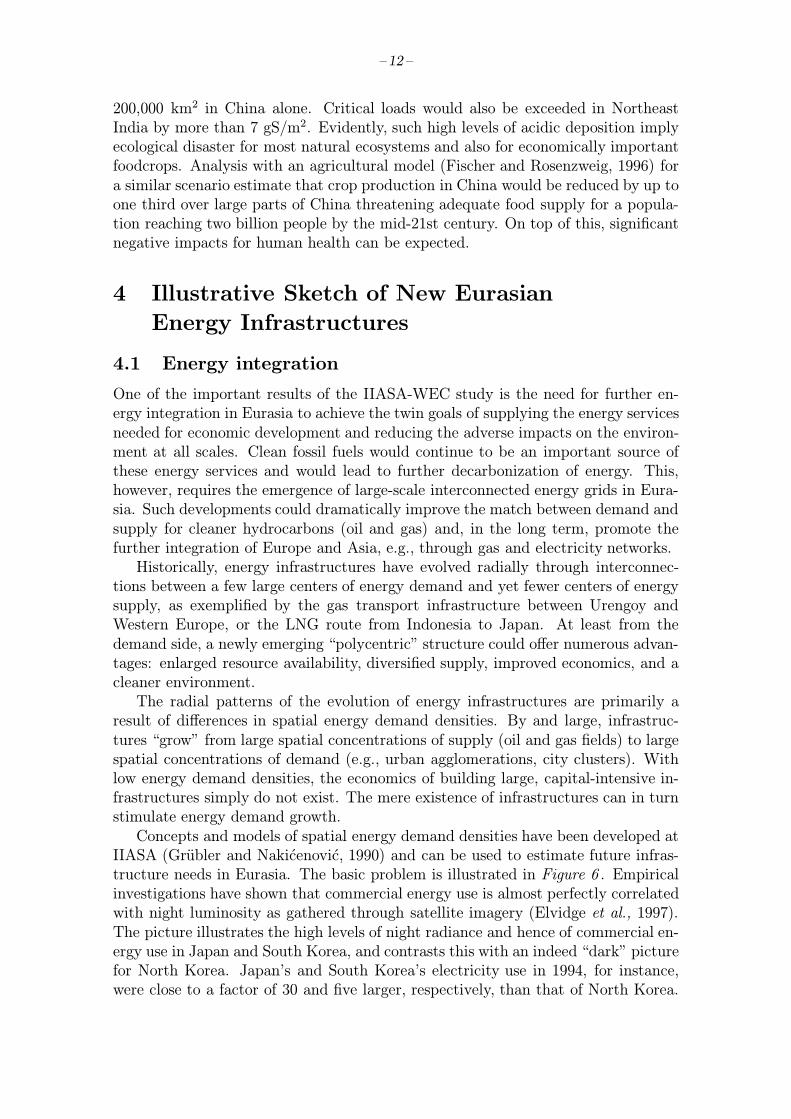
IIASA (Grubler and Nakicenovic, 1990) and can be used to estimate future infras-tructure needs in Eurasia. The basic problem is illustrated in Figure 6 . Empiricalinvestigations have shown that commercial energy use is almost perfectly correlatedwith night luminosity as gathered through satellite imagery (Elvidge et al., 1997).The picture illustrates the high levels of night radiance and hence of commercial en-ergy use in Japan and South Korea, and contrasts this with an indeed “dark” picturefor North Korea. Japan’s and South Korea’s electricity use in 1994, for instance,were close to a factor of 30 and five larger, respectively, than that of North Korea.
– 13 –
With such low demand densities as those prevailing in North Korea, construction ofa new dedicated infrastructure network to, or even passing through, the country willnot be economically feasible. Construction of infrastructures would, in turn, becomeeconomically feasible if main trunk pipelines could be erected to high consumptiondensity areas. In turn, these trunklines could provide the backbone for future net-work extensions, giving access to clean energy forms to other regions/countries also.The potential configuration of such future evolutionary infrastructure system devel-opment can be evaluated based on methods and data sets available at IIASA thathave to date been applied to Europe and North America.
Figure 6. Night radiance intensities shown by a night satellite picture. Source:NOAA DMSP nocturnal visible near infrared emission data. Data courtesy of C.D.Elvidge, NOAA, Boulder, Colorado, USA.
The remainder of this section gives an overview of gas pipelines already plannedin Eurasia and the possibilities to estimate associated investment outlays and costs.A similar approach is then made for electricity grids. This is followed by a discussionof the technical and economic requirements of such new infrastructure plans, and therelationship between the expected investments to overall investments in the energysector over the coming decades.
– 14 –
4.2 Gas pipeline infrastructures planned
Currently, gas transit from the FSU to Europe totals nearly 210 bcm (in 1996)(Energy Charter, 1998). The majority of this (130 bcm) is transported from Russiato Western Europe. The total capacity available for transit through Ukraine, theCzech Republic and Slovakia amounts to around 260 bcm. Turkmenistan is thesecond largest supplier with 23 bcm in 1996 mainly towards other FSU countries.The remaining sources of gas for Western Europe are Algeria, Norway and theNetherlands.At present, data suggest that worldwide the construction of nearly 12,400 miles of
gas pipelines was foreseen to be finalized in 1998 (True, 1998). Of this amount 3,600miles were under construction in the Asian-Pacific region (including the eastern partof the FSU) and 3,800 miles in Europe (including that part of the FSU west of theUral). On the basis of average USA data a rough estimate indicates that the totalinvestments involved in the Eurasian gas pipelines in 1998 was around 13 billionUS$ (True, 1998). In 1999, gas pipeline construction to be finished will be a factor2.5 higher than in 1998: a total of 29,000 miles is being constructed of which nearly14,000 miles are in Eurasia. The associated investments in the Eurasian region areroughly estimated at around 35 billion US$ for 1999 only (True, 1998).For the coming decades a large number of gas pipelines is being proposed or
planned in the Eurasian regions (see Table 2 for a preliminary overview). Thesenew pipelines are intended to transport large volumes over long distances and con-sequently are expected to have high costs. Most of the potential pipelines will orig-inate from the Caspian Sea region and the Middle East. The Yamal pipeline, forexample, is foreseen to transport 60 to 80 bcm of gas each year from Siberia throughPoland and Belarus over a distance of more than 4,000 km to meet West-Europeandemands. The estimated costs are US$25–30 billion (Energy Charter, 1998). TheIrkutsk-Japan gas pipeline is supposed to cross a stretch of over 2,300 miles fromKovykytinskoye in Russia, through Mongolia, China, South-Korea to Japan at acost of $10 billion (Asian Energy News, 1997).The nuclei of supplies are to be found in Siberia and the Middle East. In 1996,
the FSU accounted for 30 percent of world gas production. The Middle East stilltakes the lead in supplying oil, and the construction of energy infrastructures inEurasia presents an opportunity for oil importing Asian countries to import MiddleEast oil and to diversify this supply by additional gas imports. Centers of demandare especially to be found in WEU, CPA (Centrally Planned Asia and China), PAO(including Japan), and the Indian Subcontinent (SAS).Data on natural gas reserves in relation to production make it clear that the long-
term future of gas supply belongs to the FSU and MEA since they account for 35 and30 percent, respectively, of proven recoverable and estimated additional reserves ofconventional natural gas (Rogner, 1997; Skagen, 1997). The sum of conventional, aswell as unconventional, natural gas reserves and resources are estimated to amountto 4,517 Gtoe in the FSU; more than 2,500 times world gas consumption in 1990(Rogner, 1997).At this stage it is not possible to give an accurate estimate of the expected
investments in gas transit over the next century. More detailed information will be
– 15 –
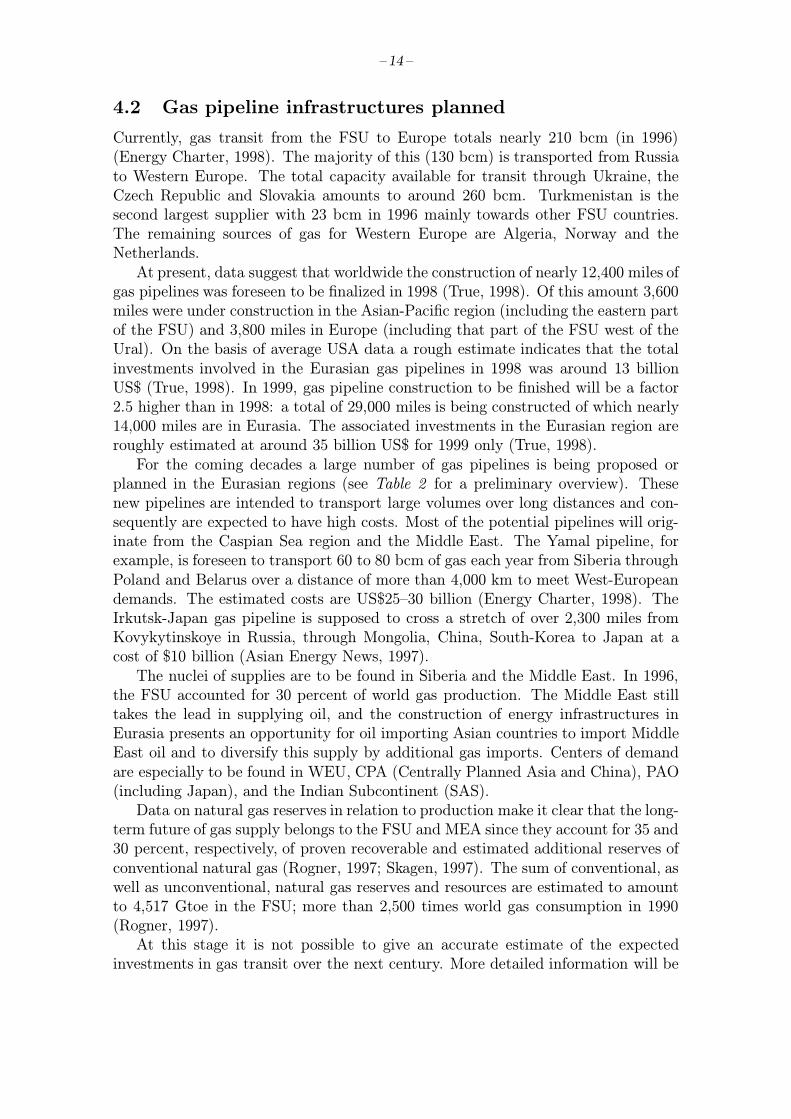
Table 2. Proposed/planned interregional gas pipeline projects in Eurasia.
Source Destination Length Capacity Capital Cost Source(km) (Bcm/year) (billion US$ of 1995)
Yamal-Russia Europe 4,170 60-80 25-28 Energy Charter (1998),CEDIGAZ (1995)
Barentssea Finland/Russia 3,450 25 10-12 CEDIGAZ (1995)North Sea-UK Niechorze-Poland 1,200 5-10 3 CEDIGAZ (1995)Shatlyk- Erzerum-Turkey 2,700 31 3 OGJ (1999)Turkmenistan
Libya Italy 550 8-10 1 CEDIGAZ (1995)Russia Turkey 400 17 2 OGJ (1999)Syria Turkey 200 1.5 CEDIGAZ (1995)Qatar Europe 4,900 30 12 CEDIGAZ (1995)Iran Europe 4570 32 15 McMahon (1997)
CEDIGAZ (1995)Turkmenistan China, Japan, 6,000- 28 11 McMahon (1997)
S.Korea 8,000 WR (1999)Yakutsk-Russia China,Korea,Japan 3,900 20 24 CEDIGAZ (1995)Irkutsk-Russia China, Japan or 3700-China 32 7 Sagers & Nicoud (1997)
South Korea 1200-Japan Paik & Choi (1997)Sakhalin-Russia Niigata-Japan 2,225 n.a. 2 CEDIGAZ (1995)
Zhao (1999)Dauletabad-Turkmenistan Lultan-Pakistan 1,271 20 2 True (1998)Dauletabad-Turkmenistan Multan-Pakistan 1,500 n.a. 3 WR (1999)Vietnam Thailand 700 5.2-8.3 n.a. Zhao (1999)ASEAN countries China, Taiwan, 4,300 n.a. 5 AEN (1998)
Japan, S.KoreaTrans-ASEAN: Philippines, 6,000 n.a. 10 CEDIGAZ (1995)Malaysia Singapore,
ThailandOman India 1,500 18 4 CEDIGAZ (1995)Iran Armenia 160 1-3 0.09 CEDIGAZ (1995)Iran Pakistan 1,600 8-10 4 CEDIGAZ (1995)Iran India 2,000 18-20 5-11 AEN (1997),
CEDIGAZ (1995)Qatar Pakistan 1,600 25 3 CEDIGAZ (1995)
Total >385-421 >151-162
Notes: n.a.=not available; AEN=Asian Energy News; WR=World Reporter; OGJ=Oil & Gas Journal.Interregional implies from one WEC region to another WEC world region.Bcm=Billion cubic meters.
needed to account for the central factors that determine actual construction costs(IEA, 1994), for example:
• the length of the pipeline;
• the maximum flow required for a day of peak demand;
• pipeline diameter and the number of compressor stations;
• roughness of terrain, rights of way, etc.
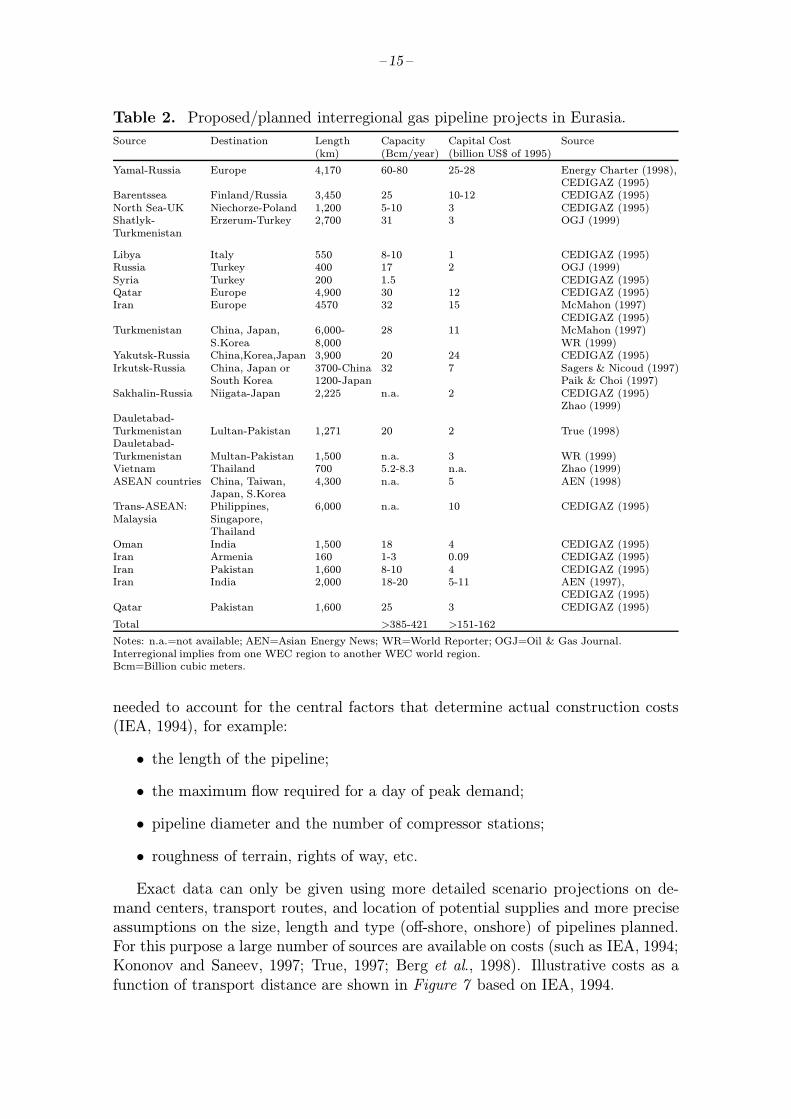
Exact data can only be given using more detailed scenario projections on de-mand centers, transport routes, and location of potential supplies and more preciseassumptions on the size, length and type (off-shore, onshore) of pipelines planned.For this purpose a large number of sources are available on costs (such as IEA, 1994;Kononov and Saneev, 1997; True, 1997; Berg et al., 1998). Illustrative costs as afunction of transport distance are shown in Figure 7 based on IEA, 1994.
– 16 –
0
50
100
150
200
250
0 800 1600 2400 3200 4000 4800 5600 6400 7200 8000
km
US
$/10
00 m
3
Gas pipeline Offshore Gas pipeline Onshore LNG
Figure 7. Gas delivery costs by alternative transport routes (onshore and offshorepipelines, LNG) as a function of transport distances, in US$ per 1000 m3. Source:IEA (1994).
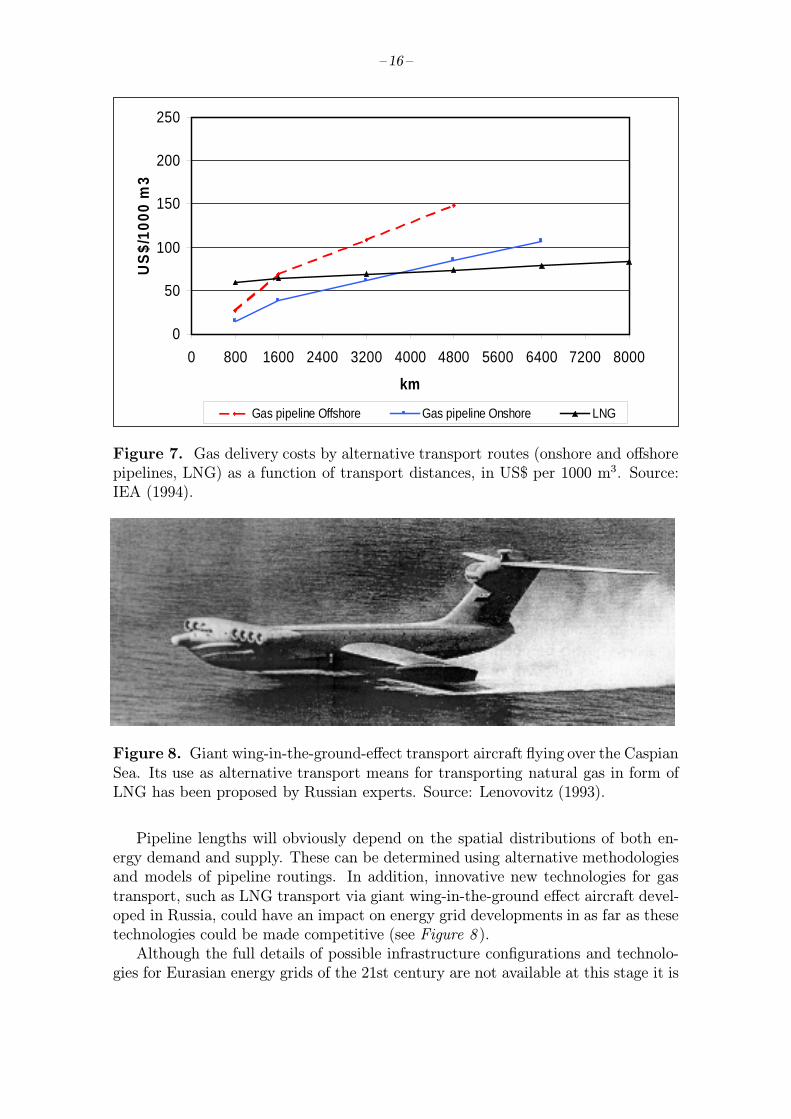
Figure 8. Giant wing-in-the-ground-effect transport aircraft flying over the CaspianSea. Its use as alternative transport means for transporting natural gas in form ofLNG has been proposed by Russian experts. Source: Lenovovitz (1993).
Pipeline lengths will obviously depend on the spatial distributions of both en-ergy demand and supply. These can be determined using alternative methodologiesand models of pipeline routings. In addition, innovative new technologies for gastransport, such as LNG transport via giant wing-in-the-ground effect aircraft devel-oped in Russia, could have an impact on energy grid developments in as far as thesetechnologies could be made competitive (see Figure 8 ).Although the full details of possible infrastructure configurations and technolo-
gies for Eurasian energy grids of the 21st century are not available at this stage it is
– 17 –
possible nonetheless to give an estimate of the order of magnitude of the expectedinvestment associated with an expansion of natural gas use and pipeline systems inEurasia.The IIASA-WEC scenarios sketch widely diverging energy futures with different
results for gas export and import flows. The next section elaborates on the associatedgas trade flows in detail. Here, only a rough calculation of the investment outlaysfor gas pipeline infrastructure in Eurasia for two scenarios is given. The WECA2 “conventional wisdom” (coal-intensive) scenario is contrasted with a scenario,termed here “bright gas future”, that is a variant of the IIASA-WEC A3 scenario.In the latter, timely investments in gas transit routes from FSU to Asia are made.In the bright gas future scenario, piped gas exports from the FSU amount to over1,025 bcm in the year 2050 and 3,700 bcm in 2100. The amount to be exportedin 2050 would require nearly 20 pipelines of the capacity of the Yamal pipeline.In scenario A2 the exported volumes of gas would be more modest and amount to480 bcm (in 2050) and 325 bcm (in 2100). On the basis of average data (see True,1998; IEA, 1994, and Table 2 ), assuming an average length of 3,500 km, a size of20–30 bcm per year per pipeline, and investments of 10–20 billion US$ per pipeline,overall investment outlays can be estimated. The result is an investment of 0.5 to1.0 trillion US$ for the period up to 2050 and 1.8 to 3.6 trillion US$ up to the year2100 for the FSU only. These tentative numbers indicate the gigantic size of thepotential investments required. But they also indicate the size of the correspondingmarket opportunities for investors and equipment manufacturers (e.g., in Japan),and gas exporters, as they are indicative of the corresponding advantages to Asianenergy consumers and the environment, once clean energy becomes available.
4.3 Electricity infrastructure
Currently, regional electricity exchanges resulting from optimizing grid operationsare relatively small. In 1996, around 2.5 percent of total world electricity produc-tion was traded (Energy Charter, 1998). Of world gas production some 18.5 percentwas traded internationally in 1996. The need for trade is smaller with electric-ity. Electricity is not a primary source of energy and the location of generation(with the exception of hydropower) is more flexible. Nowadays, electricity transitresults more from the optimization of grid and capacity utilization than from delib-erate trade patterns. In addition, self-sufficiency and supply security are the mainreasons why many countries have relied on sufficient domestic production capacitywhile allowing for adequate spare capacity. The interconnected electricity grid ofthe FSU, the Unified Power System (UPS), is now confronted with a significantover-capacity. This over-capacity is a direct result of the fall in demand in theeconomies in transition. Transportation of electricity is expensive, and over longdistances (over 1,000 km) is at present thought to be more costly than transportingthe corresponding volume of energy as gas. International electricity trade statisticsdo not allow accurate statements on electricity transit (from one country though oneor more other countries) since trade flows are only registered between neighboringcountries. In addition, these flows are often reversed. Within the interconnected sys-tem in Europe, electricity exchanges accounted for 137 TWh in 1996 (around eightpercent of net production). In the FSU, long-distance electricity transport is more
– 18 –
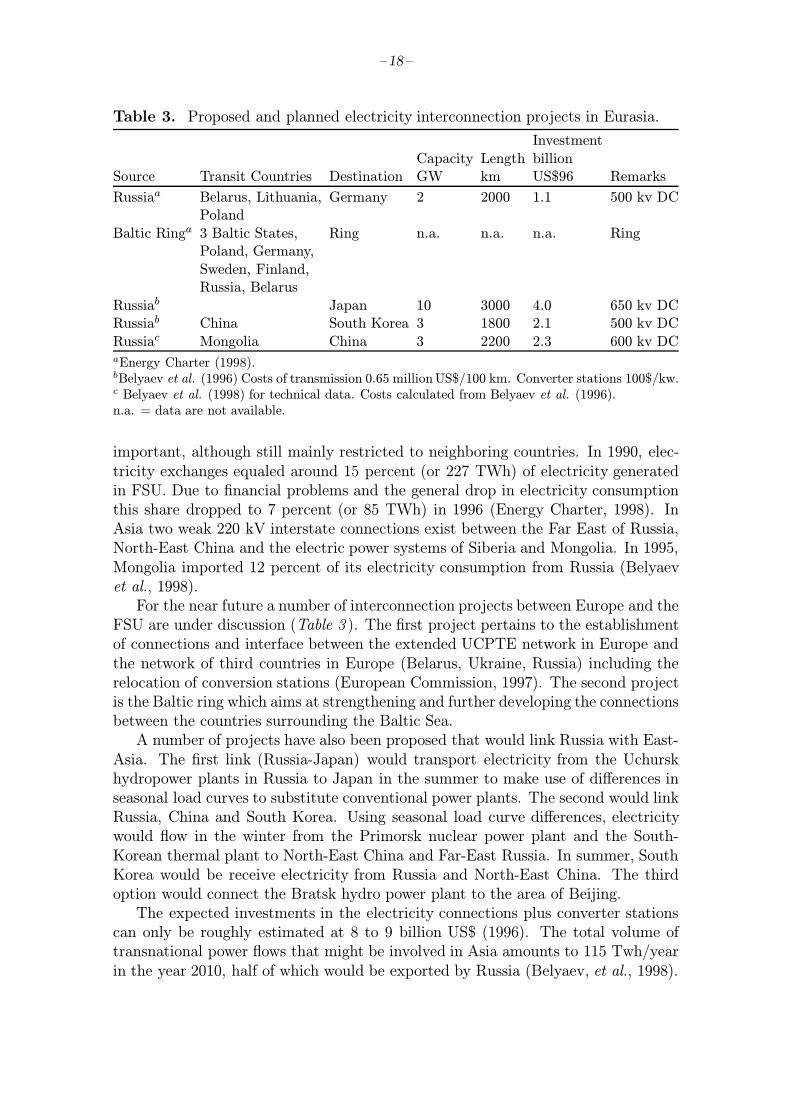
Table 3. Proposed and planned electricity interconnection projects in Eurasia.
InvestmentCapacity Length billion
Source Transit Countries Destination GW km US$96 Remarks
Russiaa Belarus, Lithuania, Germany 2 2000 1.1 500 kv DCPoland
Baltic Ringa 3 Baltic States, Ring n.a. n.a. n.a. RingPoland, Germany,Sweden, Finland,Russia, Belarus
Russiab Japan 10 3000 4.0 650 kv DCRussiab China South Korea 3 1800 2.1 500 kv DCRussiac Mongolia China 3 2200 2.3 600 kv DCaEnergy Charter (1998).bBelyaev et al. (1996) Costs of transmission 0.65 millionUS$/100 km. Converter stations 100$/kw.c Belyaev et al. (1998) for technical data. Costs calculated from Belyaev et al. (1996).n.a. = data are not available.
important, although still mainly restricted to neighboring countries. In 1990, elec-tricity exchanges equaled around 15 percent (or 227 TWh) of electricity generatedin FSU. Due to financial problems and the general drop in electricity consumptionthis share dropped to 7 percent (or 85 TWh) in 1996 (Energy Charter, 1998). InAsia two weak 220 kV interstate connections exist between the Far East of Russia,North-East China and the electric power systems of Siberia and Mongolia. In 1995,Mongolia imported 12 percent of its electricity consumption from Russia (Belyaevet al., 1998).For the near future a number of interconnection projects between Europe and the
FSU are under discussion (Table 3 ). The first project pertains to the establishmentof connections and interface between the extended UCPTE network in Europe andthe network of third countries in Europe (Belarus, Ukraine, Russia) including therelocation of conversion stations (European Commission, 1997). The second projectis the Baltic ring which aims at strengthening and further developing the connectionsbetween the countries surrounding the Baltic Sea.A number of projects have also been proposed that would link Russia with East-
Asia. The first link (Russia-Japan) would transport electricity from the Uchurskhydropower plants in Russia to Japan in the summer to make use of differences inseasonal load curves to substitute conventional power plants. The second would linkRussia, China and South Korea. Using seasonal load curve differences, electricitywould flow in the winter from the Primorsk nuclear power plant and the South-Korean thermal plant to North-East China and Far-East Russia. In summer, SouthKorea would be receive electricity from Russia and North-East China. The thirdoption would connect the Bratsk hydro power plant to the area of Beijing.The expected investments in the electricity connections plus converter stations
can only be roughly estimated at 8 to 9 billion US$ (1996). The total volume oftransnational power flows that might be involved in Asia amounts to 115 Twh/yearin the year 2010, half of which would be exported by Russia (Belyaev, et al., 1998).
– 19 –
The overall investment picture is slightly different. For the Russia-Japan connec-tion, overall investment might add up to 20–21 billion US$ if investments in newhydropower plants were included. On the positive side, investments in thermal powerplants (and CO2 emissions) in Japan and Russia could be avoided thus reducing in-vestment outlays by 13 to 16 billion US$. This leads to a net investment increase offive to seven billion US$. For the second connection between Russia-China-South,total investments including those for a new nuclear power plant would add up tonearly five billion US$. The investment savings in spare capacities and thermalpower plants cuts investments by nearly nine billion US$ so that on balance invest-ments might decline by four billion US$. Over both projects, net investment outlaysmight add up to one to three billion US$. Although these might not be all possibleconnections, the investments in electricity grids would clearly be significantly lowerthan the possible investments (of 50 to 100 billion US$) in gas infrastructures dis-cussed above. Over the long-term, however, the potential for large scale electricityexchanges via superconducting cables (electricity pipelines) should be kept in mind.The financial viability of the electricity projects is difficult to judge at this
stage. Preliminary estimates suggest that both projects (Russia-Japan, Russia-China-South-Korea) might lead to net cost savings because they reduce reservecapacity (Belyaev et al., 1998). The extent of the cost savings will, however, dependon the rate of return (or the discount rate) required, the order of magnitude of theinvestments in transit and as well as in power plant capacity saved, as well as fuelprices. This requires further detailed analysis of the exact grid structure and under-lying data as well as the extent to which (spare) capacities can really be saved takinginto account the wish of governments to remain to a large degree self-sufficient inpower supply. In the case of restricted financial resources the question also needsto addressed of whether alternative projects (such as combined cycle gas turbines)could earn higher rates of return also in view of electricity market liberalizationthat puts pressure on electricity prices. In addition, market liberalization leads toincreased risk and higher discount rates, leading to a tendency away from capitalintensive modes of production such as new nuclear power or hydro power.From the environmental side, increased electricity interconnection is expected to
have positive effects since it decreases the demand for fossil fuel. The Russia-Japanand the Russia-China-South-Korea connections substitute 8.1 million tce/year andwould reduce carbon emissions by 5.2 million ton/year (compared with net car-bon emissions in 1990 in CPA of around 690 million ton carbon). The impact ofthese electricity connections is, however, an order of magnitude lower, both in termsof financial requirements and environmental benefits, than the gas infrastructuressketched out above.
4.4 Capital requirements in relation to energy investments
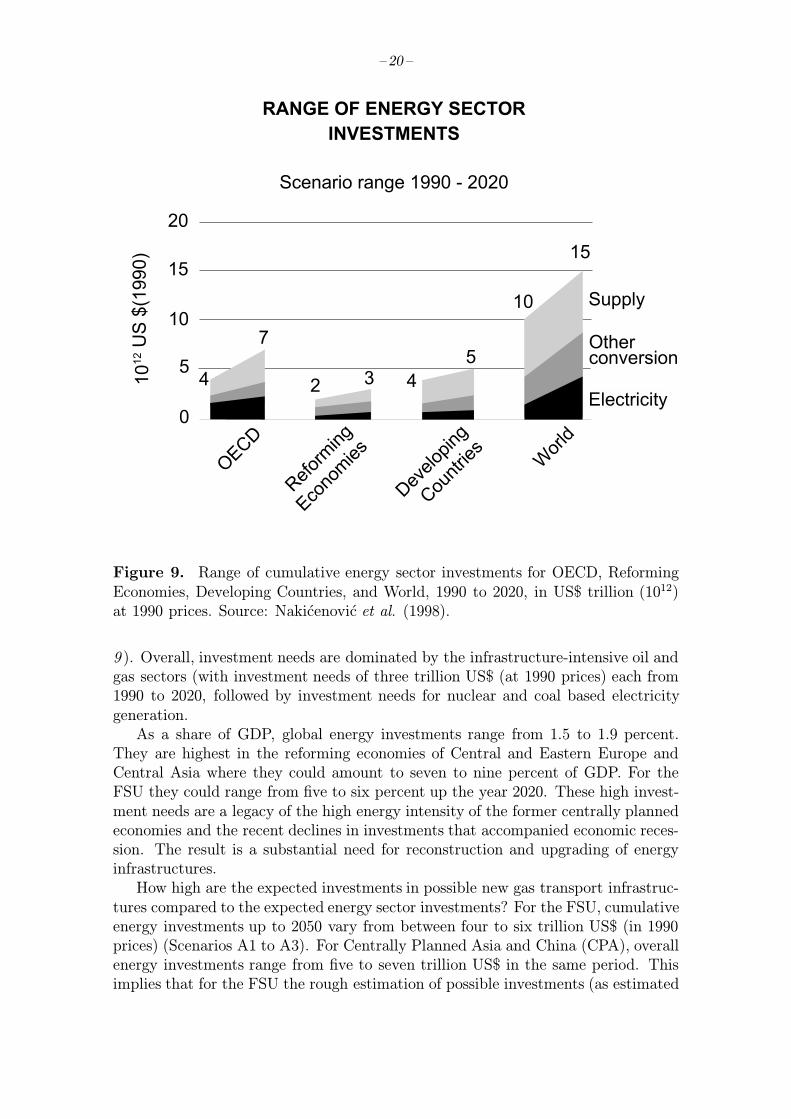
A comparison of the energy infrastructure investment with total energy investmentsexpected under the IIASA-WEC scenarios is useful to obtain an idea of their financialfeasibility. Capital requirements for the energy sector are projected to be large,but not infeasible (growing less fast than GDP). Over the three decades up to2020, global energy sector capital requirements across the IIASA-WEC scenariosare estimated to range between 10 to 15 trillion US$ (1012) at 1990 prices (Figure
– 20 –
() '*
������ +"�,�����!
( � � � �� � � - � � � � � �
) � � � � � � �
� � � � � � � � � � � � � � �
� � � � � � � � �
" � � � � � � � � � � � � � � � � � � � . � � � � �
� �� �
*� -� �� �� ��
'� �� � � ��
/� 0� �#� �� �
) �� �� #� ��
�
�
� �
� �
� �
" � � � �
�
1
� � �
�
� �
� �
Figure 9. Range of cumulative energy sector investments for OECD, ReformingEconomies, Developing Countries, and World, 1990 to 2020, in US$ trillion (1012)at 1990 prices. Source: Nakicenovic et al. (1998).
9 ). Overall, investment needs are dominated by the infrastructure-intensive oil andgas sectors (with investment needs of three trillion US$ (at 1990 prices) each from1990 to 2020, followed by investment needs for nuclear and coal based electricitygeneration.As a share of GDP, global energy investments range from 1.5 to 1.9 percent.
They are highest in the reforming economies of Central and Eastern Europe andCentral Asia where they could amount to seven to nine percent of GDP. For theFSU they could range from five to six percent up the year 2020. These high invest-ment needs are a legacy of the high energy intensity of the former centrally plannedeconomies and the recent declines in investments that accompanied economic reces-sion. The result is a substantial need for reconstruction and upgrading of energyinfrastructures.How high are the expected investments in possible new gas transport infrastruc-
tures compared to the expected energy sector investments? For the FSU, cumulativeenergy investments up to 2050 vary from between four to six trillion US$ (in 1990prices) (Scenarios A1 to A3). For Centrally Planned Asia and China (CPA), overallenergy investments range from five to seven trillion US$ in the same period. Thisimplies that for the FSU the rough estimation of possible investments (as estimated
– 21 –
in the previous section) in gas infrastructures of 0.5 to one trillion US$ could, de-pending on the scenario, make up 10 to 25 percent of overall energy investments. Ifthe investments would be covered by both CPA and FSU the share of gas transitinfrastructures would be roughly five percent to ten percent of the overall energyinvestments in the two regions combined.
4.5 The challenge of financing
Financing gas infrastructure investments will be a challenging problem. The firstchallenge will be that an increasing fraction of the capital requirements will need tobe raised from the private sector, where energy needs will face stiffer competitionand return on investment criteria. Second, most of the investments that must bemade are in the developing countries, where currently both international develop-ment capital and private investment capital are often scarce. The situation in thereforming economies of Europe and Central Asia are equally difficult. Third, asfor all infrastructure investments, returns on investments (financially, socially andenvironmental) accrue in the long-term. Infrastructure investments are thereforecurrently often viewed as a too high a price to pay in markets where optimiza-tion of short-term share-holder value takes precedence over long-term sustainabledevelopment objectives. Below, private financial viability is examined, followed byan overall economic assessment (looking at impacts on other investments) and anbroader socio-economic assessment that also includes environmental benefits.When looking at private financial viability, the IIASA-WEC study concluded
that the most important bottlenecks in energy sector investments in Eurasia are theperceived risks to investors both in the Caspian region and in the Russian Federa-tion, as well as the long pay-back times required in building up a capital-intensivetranscontinental gas transport infrastructure. Roberts (1996) mentions that bring-ing Caspian gas and oil to the market remains a controversial subject since decisionsbecome entangled in political and security grounds rather than being taken on es-sentially economic grounds. Appraisal of gas and oil reserves, validation of theirsignificance to the supply of gas, as well as assurance that supply commitmentscan be made are other aspects relevant for the feasibility of pipeline projects (Paikand Choi, 1997). Geographical isolation (e.g., of Kazakstan) implies that potentialexport routes depend on the political approval of the countries through which ex-ports will take place. Ibrahim (1995) finds that the substantial capital investmentinvolved demands long-term commitment between suppliers and consumers aliketo overcome vast geographical, political and legal hurdles. Yet, it is also impor-tant to emphasize that historically, the interconnections between Russian gas fieldsand Western European gas demand could be achieved even in periods of politicaltensions. Sagers and Nicoud (1997) conclude that the economic feasibility of theexport stage of the East Siberia-China gas pipeline is questionable because of thehigh costs involved, the uncertainty of the reserves and the need to meet regional(Irkutsk) demands as well. The International Energy Agency (IEA, 1998) adds thatthe routing options for most new pipelines are fraught with technical, financial, le-gal or political difficulties. Multiple export routes could increase energy security forboth exporters and importers by making deliveries less vulnerable. Improved en-ergy security will have to be balanced by economic feasibility, since a larger number
– 22 –
of pipelines would mean smaller economies of scale. Bergmann (1996) notes thatdifficult climatic conditions and the great distances involved might require new andexpensive infrastructures such as the Yamal-Europe project. These increased costsmight not be matched by higher prices since increasing competition tends to pushprices down making it more difficult to finance projects. In addition, regional do-mestic supply at the market might be sufficient for the medium term. A first roughestimate of the costs of the Russia-China pipeline suggest that this might involve acost-price of exports of 110 to 120 US$ per 1,000 m3, if based on a discount rate ofseven percent (Merenkov et al., 1997). This would be in between the gas price levelsexpected in the various IIASA-WEC scenarios. A close detailed examination of theunderlying assumptions and the sensitivity of the associated costs of gas-pipelinesand an assessment of alternative options, such as LNG, is therefore needed in orderto be able to make sound statements on their financial viability.From an overall economic perspective, the fact that energy investments as part of
GDP are expected to decrease in the IIASA-WEC scenarios makes financing easier.In addition, several IIASA-WEC scenarios conclude that overall energy investmentscould be lowered through increased use of natural gas by perhaps up to 0.5 tril-lion US$. The stepped-up investments in gas production facilities, and especiallytranscontinental gas infrastructures (pipelines and LNG facilities), could then (par-tially or fully) be compensated by reduced investment in other parts of the energychain (e.g., the lower capital investment needs of combined cycle gas turbines com-pared to their coal or nuclear alternatives). From a macro-economic perspective,cost savings are also possible in terms of reduced outlays on traditional end-of-pipetechnologies such as flue-gas desulfurization. This is so in case these investmentswould otherwise be required under existing legislation or would have to be madeto fulfill emission objectives. That is, the environmental externalities they addresswould have to be at least partially internalized. The next section shows that suchcost savings might indeed be significant.A possible, but speculative, initial financing arrangement might involve global
carbon dioxide trading schemes. Should the Kyoto emissions reduction agreement ora similar scheme be ratified for the so-called Annex I countries that include OECDcountries and the reforming economies in Europe, the Russian Federation is likelyto acquire a large “emissions bubble” by 2010. Tentative estimates made at IIASAindicate that the “bubble” might be as large as 300 MtC in 2010 (Victor et al.,1998). These excess emission rights could be sold to Europe and North America, asthese regions will be severely limited by the agreed emissions reductions (of aboutfive percent by 2010 for the whole Annex I region compared to the reference year1990). Revenues from the Russian “bubble” could be invested to further sustainabledevelopment throughout Eurasia while reducing the long-term emissions. Shortlyafter 2010 this “bubble” is likely to disappear as energy consumption increases inthe Russian Federation. In the meantime, it could provide a steady financing sourcefor longer-term potential economic and environmental benefits from the Eurasianenergy grids. For example, at about 50 US$ per tC (ton of carbon), a “bubble” of300 MtC/year would generate annual financial flows of up to 15 billion US$ (Victoret al., 1998).
– 23 –
In contrast to the short-term problems flagged above, long-term perspectivessuggest a more sound and robust future. The IIASA-WEC scenarios indicate sub-stantial economic and environmental returns from an extended Eurasian gas pipelinesystem that in the long-term may become interconnected and pave the way forsimilar developments for electricity. The economic robustness of pipeline construc-tion is underpinned by continued short term growth in demand (McMahon, 1997;Bergmann, 1996) although the sectors that drive the demand for gas might differfrom country-to-country. New pipeline infrastructure will give more and easier ac-cess to additional sources of gas. It also will open the way to diversification in powergeneration and the industrial and manufacturing sector and even in the domesticsector. In addition, the environmental benefits are not only significant but will alsoimply reductions in damage to food crops, human health and ecosystems, which canonly partially be expressed in monetary terms.In summary, in order to give a sound assessment, pure financial feasibility argu-
ments need closer scrutiny taking into account the sensitivity for different assump-tions. Such an analysis needs to be complemented by a more systemic macroeco-nomic evaluation which looks at the impacts in terms of reductions in other (energy)investments and in terms of environmental benefits as well.Before turning to an assessment of the environmental impacts, estimates of the
orders of magnitude of possible gas trade flows in Eurasia are given.
5 Provisional Quantification of Gas Trade Flows
Crude oil and oil products currently dominate international energy trade. Through2050 they also remain the most traded energy commodities in the IIASA-WECscenarios, although the spread across scenarios is quite large. However, trade inpiped natural gas and LNG increases substantially, and by 2050 gas becomes thekey traded energy commodity. In general, global energy trade patterns shift fromprimary energy to secondary energy, which improves trade flexibility and therebylowers geopolitical concerns.The most striking result from the IIASA-WEC study is the persistent growth in
Eurasian import needs outside the Russian Federation and the Caspian region. Thisis due to comparatively low oil and gas resource endowments in Western Europe andJapan plus growing demand in the developing economies of Asia. Overall, annualimports of oil and gas into the region could increase to between 1.7 and 3 Gtoe,with gas trade accounting for more than 1 Gtoe.These projected trade flows into Eurasia approximate or exceed the global trade
in oil (1.9 Gtoe) and gas (0.4 Gtoe by pipeline and LNG) in 1996. The largest playersin terms of export capabilities remain the Middle East for oil, and the Siberian andCaspian regions for gas.
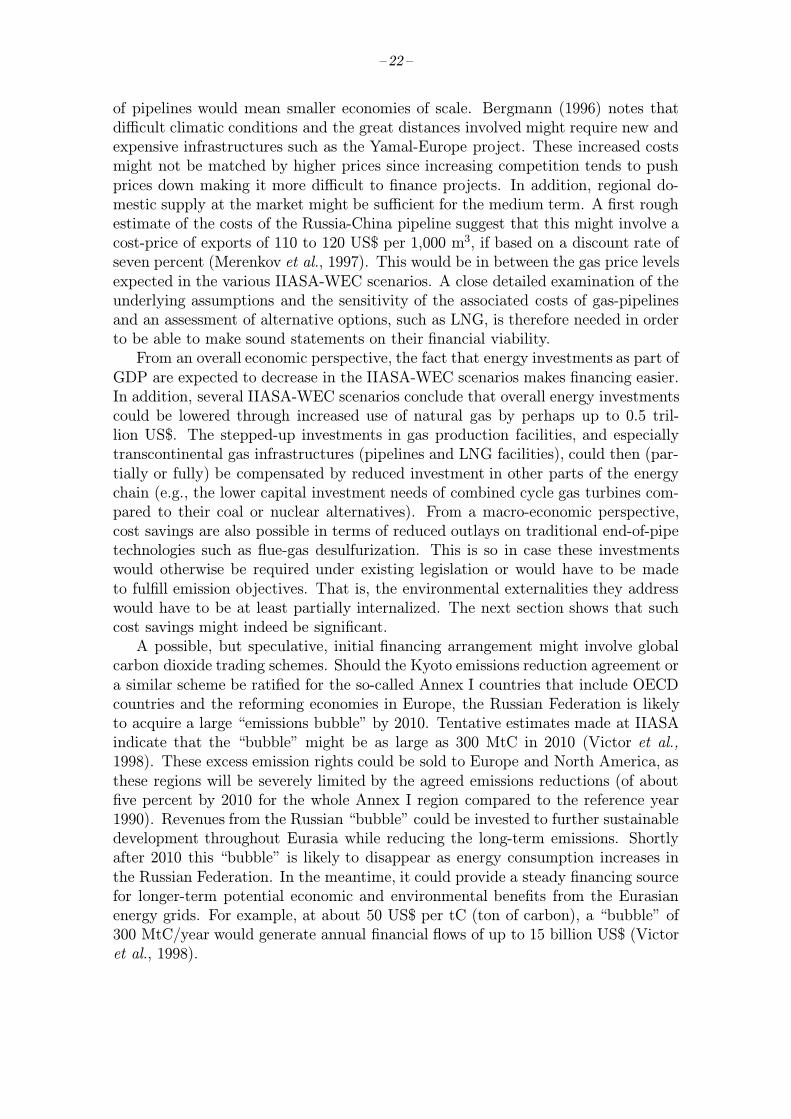
Figure 10 shows gas export versus prices and resulting total export revenues forthe former Soviet Union for the IIASA-WEC scenarios. The dashed lines in thefigure are isoquants reflecting constant export revenues. A consistent finding is thatthrough 2020 gas exports always increase to at least 300 billion cubic meters peryear with export revenues increasing to at least 50 billion US$, i.e., five times 1996values. After 2020 gas export prospects from the region could bifurcate. The most
– 24 –
1975
-199
6: R
eal g
as p
rice
US
(199
0)$/
m3
201
0-20
50:
Sh
ado
w p
rice
US
(199
0)$/
m3
FSU exports (billion m3/year)
0
0.05
0.1
0.15
0.2
0.25
0 100 200 300 400 500 600 700
1975
1980 1990
2050
2020A1
B
1982
1989
2020C2
1996
C12050
2050
2050
2050
A2
A3
10 5
20
40
110
60
30
50
90
7080
100
Iso
qu
ants
of
con
stan
t ex
po
rt r
even
ues
Bill
ion
US
(199
0)$/
year
Figure 10. Natural gas export quantities and revenues of former Soviet Union, 1975to 1996 and for export from the Siberian and Caspian regions in the six IIASA-WECscenarios to 2050. Source: Nakicenovic et al. (1998).
likely scenarios suggest growth will continue because alternatives are not developedquickly enough (Scenarios A2 and B) or because gas is favored by environmentalpolicies (Scenario C1). In cases where more rapid technological progress makes itpossible to tap unconventional gas resources outside the region, non-fossil energytechnologies to massively penetrate energy markets, or domestic FSU demand in-creases significantly, long-term export potentials are reduced (Scenarios A1, and A3in particular). However, revenues from gas export are unlikely to fall below 30 billionUS$ per year.
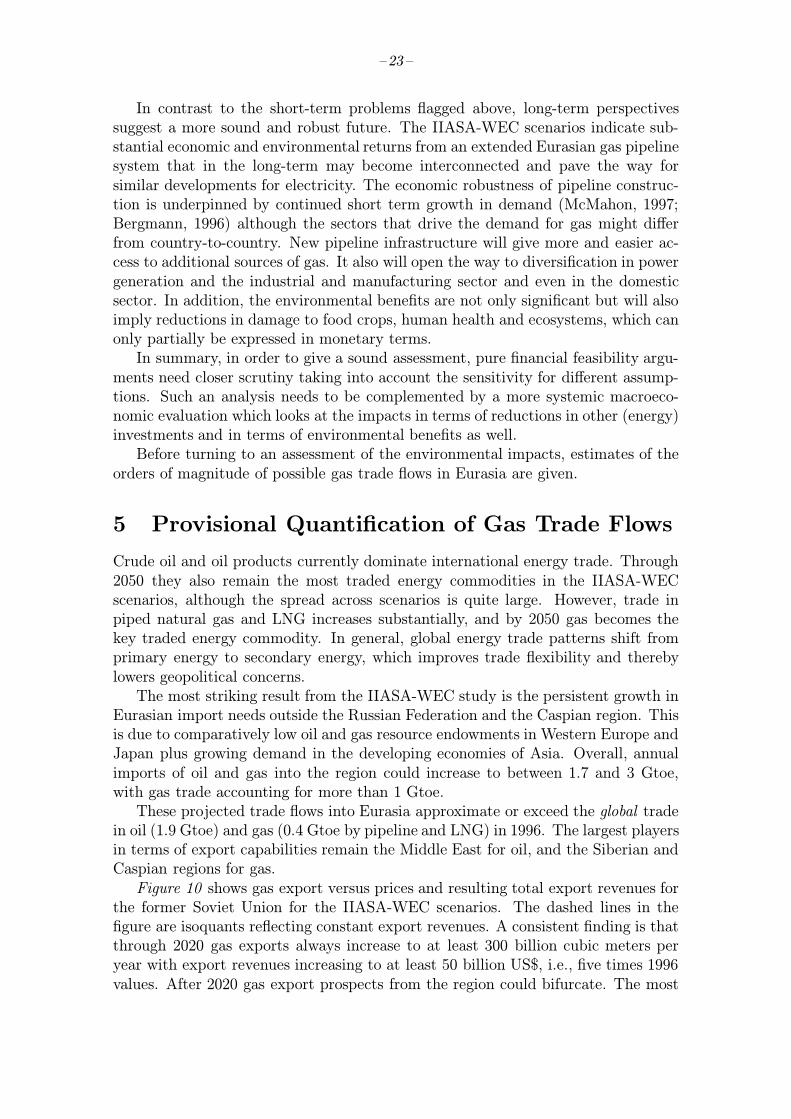
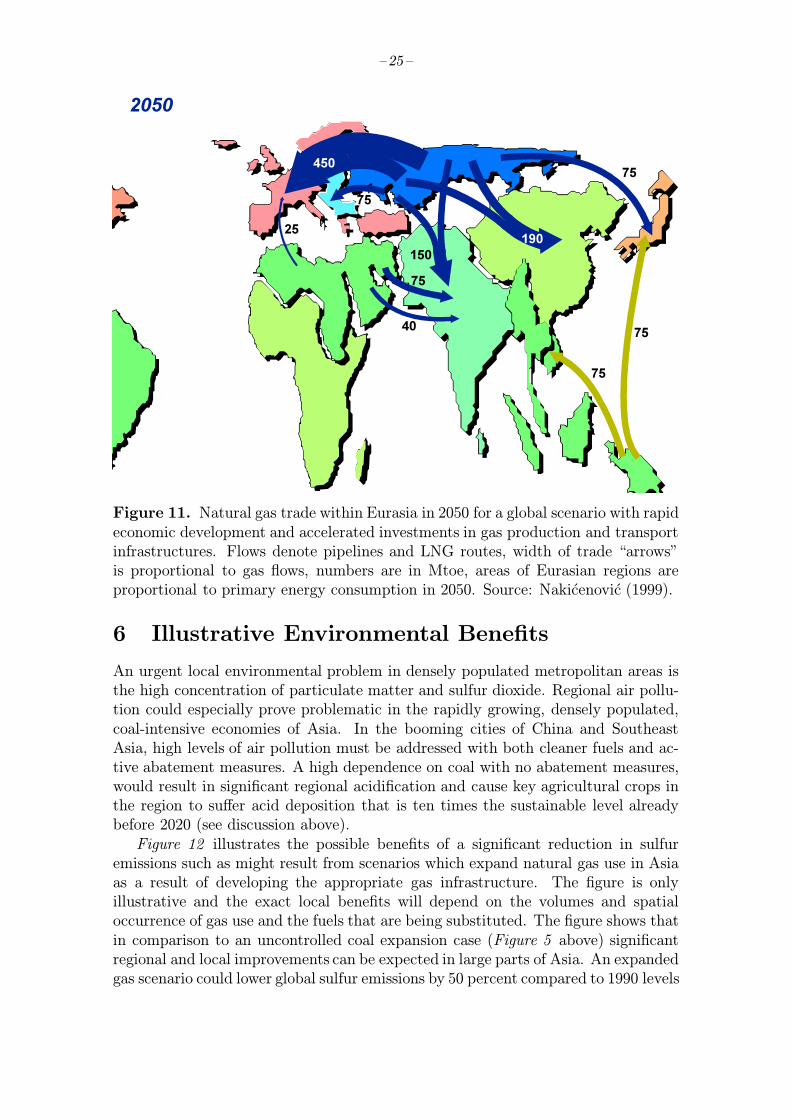
Figure 11 shows natural gas flows for a scenario not part of the IIASA-WECstudy. This global scenario labeled bright gas future is one with rapid economicdevelopment (similar to the Case A scenarios in the IIASA-WEC study) while as-suming that timely investments are made in gas infrastructures leading to significantreductions in costs (Nakicenovic, 1999). Even larger networks would be required forlowering the contribution of domestic coal in rapidly developing parts of China andSoutheast Asia. A more ambitious gas trade within Eurasia could involve gas flowsto Asia that would nearly match those going to Europe. Such ambitious Eurasianenergy grids would bring large economic benefits to gas (and energy) exportingRegions. They would enable healthier economic development throughout Eurasiaby the provision of cleaner and more flexible energy services but their economicfeasibility and their environmental benefits require a more detailed assessment.
– 25 –
��
��
��
������
��
��
��
���
����
��
Figure 11. Natural gas trade within Eurasia in 2050 for a global scenario with rapideconomic development and accelerated investments in gas production and transportinfrastructures. Flows denote pipelines and LNG routes, width of trade “arrows”is proportional to gas flows, numbers are in Mtoe, areas of Eurasian regions areproportional to primary energy consumption in 2050. Source: Nakicenovic (1999).
6 Illustrative Environmental Benefits
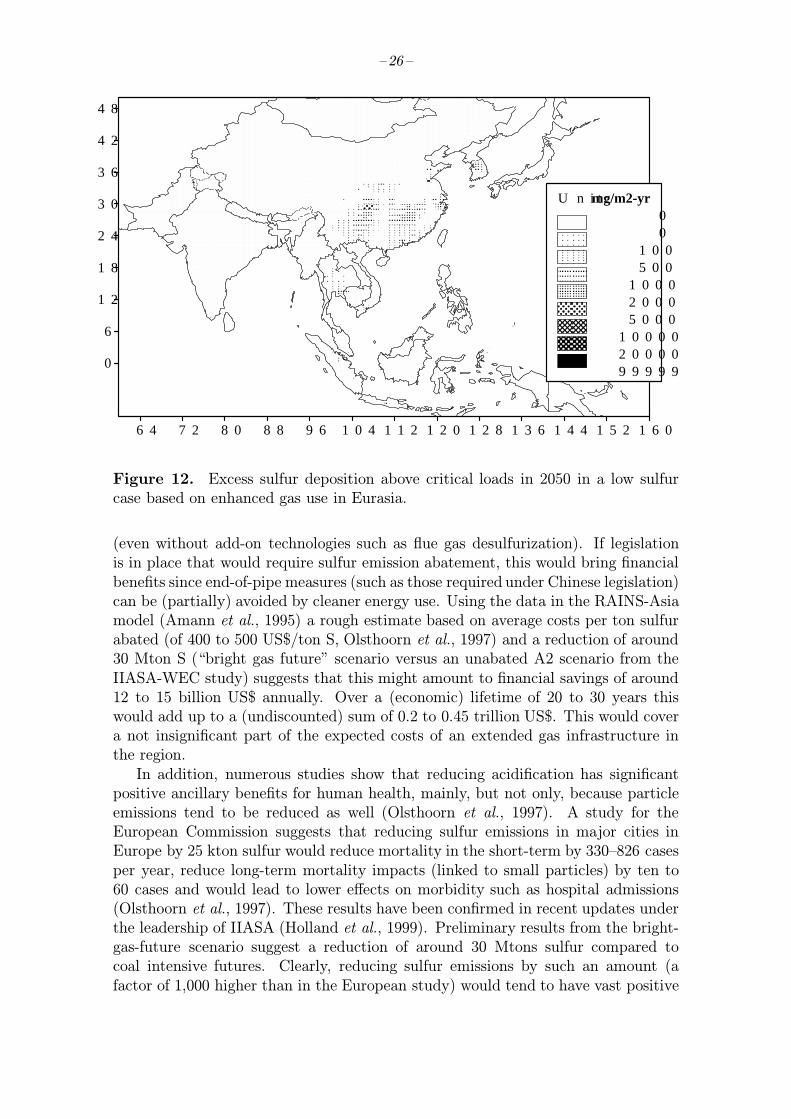
An urgent local environmental problem in densely populated metropolitan areas isthe high concentration of particulate matter and sulfur dioxide. Regional air pollu-tion could especially prove problematic in the rapidly growing, densely populated,coal-intensive economies of Asia. In the booming cities of China and SoutheastAsia, high levels of air pollution must be addressed with both cleaner fuels and ac-tive abatement measures. A high dependence on coal with no abatement measures,would result in significant regional acidification and cause key agricultural crops inthe region to suffer acid deposition that is ten times the sustainable level alreadybefore 2020 (see discussion above).
Figure 12 illustrates the possible benefits of a significant reduction in sulfuremissions such as might result from scenarios which expand natural gas use in Asiaas a result of developing the appropriate gas infrastructure. The figure is onlyillustrative and the exact local benefits will depend on the volumes and spatialoccurrence of gas use and the fuels that are being substituted. The figure shows thatin comparison to an uncontrolled coal expansion case (Figure 5 above) significantregional and local improvements can be expected in large parts of Asia. An expandedgas scenario could lower global sulfur emissions by 50 percent compared to 1990 levels
– 26 –
6 4 7 2 8 0 8 8 9 6 1 0 4 1 1 2 1 2 0 1 2 8 1 3 6 1 4 4 1 5 2 1 6 0
0
6
1 2
1 8
2 4
3 0
3 6
4 2
4 8
0 0
1 0 0 5 0 0
1 0 0 0 2 0 0 0 5 0 0 0
1 0 0 0 0 2 0 0 0 0 9 9 9 9 9
U n i t :mg/m2-yr
Figure 12. Excess sulfur deposition above critical loads in 2050 in a low sulfurcase based on enhanced gas use in Eurasia.
(even without add-on technologies such as flue gas desulfurization). If legislationis in place that would require sulfur emission abatement, this would bring financialbenefits since end-of-pipe measures (such as those required under Chinese legislation)can be (partially) avoided by cleaner energy use. Using the data in the RAINS-Asiamodel (Amann et al., 1995) a rough estimate based on average costs per ton sulfurabated (of 400 to 500 US$/ton S, Olsthoorn et al., 1997) and a reduction of around30 Mton S (“bright gas future” scenario versus an unabated A2 scenario from theIIASA-WEC study) suggests that this might amount to financial savings of around12 to 15 billion US$ annually. Over a (economic) lifetime of 20 to 30 years thiswould add up to a (undiscounted) sum of 0.2 to 0.45 trillion US$. This would covera not insignificant part of the expected costs of an extended gas infrastructure inthe region.In addition, numerous studies show that reducing acidification has significant
positive ancillary benefits for human health, mainly, but not only, because particleemissions tend to be reduced as well (Olsthoorn et al., 1997). A study for theEuropean Commission suggests that reducing sulfur emissions in major cities inEurope by 25 kton sulfur would reduce mortality in the short-term by 330–826 casesper year, reduce long-term mortality impacts (linked to small particles) by ten to60 cases and would lead to lower effects on morbidity such as hospital admissions(Olsthoorn et al., 1997). These results have been confirmed in recent updates underthe leadership of IIASA (Holland et al., 1999). Preliminary results from the bright-gas-future scenario suggest a reduction of around 30 Mtons sulfur compared tocoal intensive futures. Clearly, reducing sulfur emissions by such an amount (afactor of 1,000 higher than in the European study) would tend to have vast positive
– 27 –
implications for human health in Asia. Of course, the exact order of magnitude ofthese impacts will depend on the location of emission reductions, the atmospherictransport, close-response functions and the population at risk of excessive exposure.Nonetheless, the order of magnitude of these impacts is highly significant, especiallyin view of the fact that shifts to natural gas will also entail a reduction of particulatematter emissions. In contrast to the situation in Europe, no modeling tools seem tobe available at the moment that are able to quantify these human-health impactsfor Asia, but their significance can be derived from the above order of magnitudecalculations.In addition to conforming with local environmental and energy objectives, ex-
panded gas use also lessens the possible global warming implications of increasedfossil energy use. Of all fossil fuels, gas has the lowest CO2 emissions per unit en-ergy and thus the lowest global warming impact (provided methane leakages arecontrolled). In general, the shift to higher quality fuels results in the continued de-carbonization of the energy system, and decarbonization means lower adverse envi-ronmental impacts (including reduced CO2 emissions) per unit of energy consumed,independent of any active policies specifically designed to protect the environment.Energy investments and energy strategies should be chosen in anticipation of
uncertain environmental constraints. What can be concluded from the IIASA-WECstudy and subsequent work at IIASA is that some constraints (e.g., on carbon emis-sions) are more uncertain than others (e.g., on sulfur emissions) and that in theface of uncertainty some strategies (e.g., accelerating technological progress, moreemphasis on clean energy supplies such as natural gas, and enhanced cooperationin international energy technology R&D, nuclear safety, and energy infrastructures)are more robust than others. They constitute appropriate contingency strategies forthe energy sector in the face of future uncertainties that are capable of generatingprogress across the diverse domains of energy demand, technology, and environmen-tal policy.
7 Conclusions
The objective of this report was to explore the concept of new energy infrastructures(in particular gas pipelines) in Eurasia and to illustrate the order of magnitude ofsome impacts on future energy systems, on gas trade, and the improvement of localand regional as well as global environment.The report, building on the IIASA-WEC study on global energy perspectives
suggest the following conclusions:
• In all IIASA-WEC scenarios Eurasia becomes the largest energy consumer ofthe world.
• Resource availability is not expected to be a real constraint in meeting demand,but the concentration of resources in a limited number of areas is. The Siberianand Caspian regions are endowed with enormous gas resources. Natural gascould offer an ideal bridge to the post fossil era, but to achieve this, newEurasian energy networks need to be planned and eventually developed.
– 28 –
• Expected increases in the use of domestic energy sources in Asia (coal) areassociated with severe adverse environmental impacts at local, regional andglobal levels causing significant damage to human health and the natural en-vironment.
• Up-front investment in gas transit pipelines may constitute a significant por-tion of the expected investment in the energy sector in Asia. The level ofinvestments will depend on exact network design, but innovative financingschemes could become available under international agreements such as theKyoto Protocol to the Framework Convention on Climate Change (FCCC).
• Financial risks are significant and will depend on intricate factors such as de-mand and supply development, technological progress, geographical and polit-ical environments and prevailing regulatory regimes (increase in competitionin the gas market due to deregulation and transit price policies).
• Timely investments in the necessary infrastructure could imply that FSU gasexports could be ten-fold as high in 2050 as would be the case in business-as-usual type of scenarios.
• Building of the required infrastructure could have significant positive impactson the global, regional and local environment and also imply significant posi-tive economic impacts. In addition, supply diversification would be promoted.
Sufficient data and methodological resources appear to be available to conducta more detailed study on the feasibility, costs and environmental benefits of newenergy infrastructures in Eurasia. Such a study would be both timely and policyrelevant in view of the above conclusions.
– 29 –
References
Amann, M., J. Cofala, P. Dorfner, F. Gyarfas and W. Schopp (1995), Impacts of En-ergy Scenarios on Regional Acidification, report to the World Energy CouncilProject 4 on Environment, International Institute for Applied Systems Anal-ysis, Laxenburg, Austria.
Asian Energy News (1997), Asia’s Oil and Gas Pipeline Projects, December 1997,p.9.
Asian Energy News (1998), News in Brief, November 1998, p. 1.
Belyaev, L., G. Kovalev and S. Podkovalnikov (1996), Efficiency assessment of“Russia-China-South Korea” electric ties with power export from Primoryernuclear power plants, The first international World Energy Systems Confer-ence, June 19–21, 1996, Toronto, Canada.
Belyaev, L., G. Kovalev and S. Podkovalnikov (1998), Interstate electricity ties inthe Northern Pacific region, International Journal of Global Energy Issues,11(1/2):00–00.
Berg, E., P. Boug and S. Kverndokk (1998), Norwegian gas sales and the impactson European CO2 emissions, Working Paper 9.98, FEEM, Milan, Italy.
Bergmann, B. (1996), Russian Gas in western Europe, the potential for growth,Petroleum Economist , 63(5):50–55.
Bos, E., M.T. Vu, A. Leven and R.A. Bulatao (1992), World Population Projections1992–1993 , Johns Hopkins University Press, Baltimore, MD, USA.
CEDIGAZ (1995), Planned gas pipelines around the world, CEDIGAZ, Paris, France.
Downing, R., R. Ramankutty and J. Shah (1997), RAINS-ASIA an AssessmentModel for Acid Deposition in Asia. The World Bank, Washington DC.
Ebel, R. (1997), Energy choices and the near abroad: the haves and have-nots facethe future, The Center for Strategic and International Studies, Washington,DC, USA.
Elvidge, C.D., K.E. Baugh, V.R. Hobson et al. (1997), Satellite inventory of humansettlements using nocturnal radiation emissions: a contribution for the globaltoolchest, Global Change Biology 3:387-395.
European Commission (1997), Trans-European Energy Networks, European Com-mission, DGXVII, Brussels, Belgium.
Energy Charter (1998), Energy transit, the multilateral challenge, Energy Chartersecretariat, Brussels, Belgium.
Fischer, G. and C. Rosenzweig (1996), The Impacts of Climate Change, CO2, andSO2 on Agricultural Supply and Trade: An Integrated Assessment, WP-96-05,International Institute for Applied Systems Analysis, Laxenburg, Austria.
Grubler, A., and N. Nakicenovic (1990), Economic Map of Europe: Transport,Communication and Energy Infrastructures in a Wider Europe, InternationalInstitute for Applied Systems Analysis, Laxenburg, Austria.
– 30 –
Grubler, A., and A. McDonald (1995), The drive to cleaner energy, Options, Fall/Winter, International Institute for Applied Systems Analysis, Laxenburg, Aus-tria.
Grubler, A., M. Jefferson, A. McDonald, S. Messner, N. Nakicenovic, H.-H. Rognerand L. Schrattenholzer (1995), Global Energy Perspectives to 2050 and Be-yond , International Institute for Applied Systems Analysis (IIASA) and WorldEnergy Council (WEC), WEC, London, UK.
Grubler, A., M. Jefferson and N. Nakicenovic (1996), Global energy perspectives:A summary of the joint study by the International Institute for Applied Sys-tems Analysis and World Energy Council, Technological Forecasting and SocialChange: An International Journal , 51(3):237–264.
Grubler, A., S. Messner, N. Nakicenovic, M. Strubegger, K. Riahi, and A. Rohrl(1998), Integrated Assessment Modeling of Global Environment Policies andDecisions Patterns, Final Report to CNRS, International Institute for AppliedSystems Analysis, Laxenburg, Austria.
Holland, M., D. Forster, K. King, H. Haworth and P.Watkiss (1999), Economic Eval-uation of Proposals for Emission Ceilings for Atmospheric Pollutants, Interimreport for DGXI of the European Commission, AEA Technology, Harwell, UK.
Ibrahim, H. (1995), Trans-continental transport of natural gas in Asia: project andprospects, Revue de l’Energie, 470:557–562.
IEA (1994), Natural gas transportation; organisation and regulation, OECD, Paris,France.
IEA (1998), Caspian oil and gas: the supply potential of Central Asia and Tran-scaucasia, IEA, Paris, France.
Kononov, Y. and B. Saneev (1997), Role of Siberia in interstate gas-supply systemsfor the Asian-Pacific region, Proceedings of the 7th Economic Forum of theAsia-Pacific region, Ulan-Bator, Mongolia.
Lenovovitz, J.M., (1993), Russians completing new ground-effect vehicle. Aviationweek & Space Technology, April 26, 62-63.
McMahon, B. (1997), Strong demand for gas set to drive construction boom, PetroleumEconomist , 64(5):18–22.
Merenkov, A, N. Ilkevich, Y. Kononov and B. Saneev (1997), Problems in creation ofinterstate gas-supplying systems for the Asian-Pacific region with attractionof gas resources from Siberia and Far-East, Proceedings of the 1996 WorldEnergy Conference, Toronto, Canada, 1997.
Nakicenovic, N., M. Amann and G. Fischer (1995), Integrated assessment, Options,Fall/Winter, International Institute for Applied Systems Analysis, Laxenburg,Austria.
Nakicenovic, N. and H.-H. Rogner, (1996), Financing global energy perspectives to2050, OPEC Review , XX(1):1–24.
Nakicenovic, N. (1999), Energy Perspectives for Eurasia and the Kyoto Protocol,Section II Chapter 5 in The Sustainable Future of the Global System II, Fu-chen Lo, K. Matsushita and H. Takagi (eds), Proceedings of the International
– 31 –
Conference on Sustainable Future of the Global System, 23-24 February, Tokyo,Japan, 71-92.
Nakicenovic, N, A. Grubler and A. Mcdonald (eds.) (1998) Global Energy Perspec-tives, IIASA-WEC, Cambridge University Press, Cambridge, UK.
OJG (1999), Azeris must hurry to supply gas to Turkey, Oil and Gas Journal,October 18, p.26.
Olsthoorn, A., K. Dorland, H. Jansen, M. van Drunen, A, Bartanova, J. Clench-Aas, C. Guerreiro, J. Hendriksen, S. Larssen and M. Amann (1997), EconomicEvaluation of air quality targets for sulphur dioxide, nitrogen dioxide, fineand suspended particulate matter and lead, European Commission, DGXI,Brussels, Belgium.
Paik, K.-W. and J.-Y. Choi (1997), Pipeline gas trade between Asian Russia, North-east Asia gets fresh look, Oil and Gas Journal , 96(6):41–44.
Pepper, W., J. Leggett, R. Swart, J. Wasson, J. Edmonds, and I. Mintzer (1992),Emission Scenarios for the IPCC. An Update: Assumptions, Methodology, andResults, Paper prepared for IPCC Working Group I, Geneva, Switzerland.
Roberts, J. (1996), Caspian pipelines, Royal Institute for International Affairs, Lon-don, UK.
Rogner, H.-H. (1997), As assessment of world hydrocarbon resources, Annual Reviewof Energy and the Environment , 22:217–262.
Sagers, M. and J. Nicoud (1997), Development East Siberian gas field and pipelineto China: A research communication, Post-Soviet Geography and Economics,38(5):288–295.
Skagen, O. (1997), Caspian gas, reserves, markets and opportunities, Royal Institutefor International Affairs, London, UK.
True, W. (1997) Construction Plans Jump: Operations Skid (Pipeline EconomicsOGJ Special) Oil and Gas Journal , August 4:37–44.
True, W. (1998), Robust pipeline construction plans threatened by spreading AsianCrisis, Oil and Gas Journal , 96(6):37–44.
Victor, D., N. Nakicenovic and N. Victor (1998), The Kyoto Protocol Carbon Bub-ble: Implications for Russia, Ukraine and Emission Trading, IR-98-094, Inter-national Institute for Applied Systems Analysis, Laxenburg, Austria.
Wigley, T.M.L., M. Salmon and S.C.B. Raper (1994), Model for the Assessment ofGreenhouse-gas Induced Climate Change, Version 1.2, Climate Research Unit,University of East Anglia, UK.
World reporter (1999), Dialog file data results, Laxenburg, Austria.
Zhao, J., (1999), The Diffusion and Costs of Natural Gas Infrastructures, DraftSeptember, International Institute for Applied Systems Analysis, Laxenburg,Austria (forthcoming).