Embed Size (px)
Citation preview

International Stormwater Best Management Practices (BMP) Database Pollutant Category Statistical Summary
Report
Solids, Bacteria, Nutrients, and Metals
Prepared by
Geosyntec Consultants, Inc. Wright Water Engineers, Inc.
Under Support From
Water Environment Research Foundation Federal Highway Administration
Environment and Water Resources Institute of the American Society of Civil Engineers
December 2014
International Stormwater BMP Database
Pollutant Category Statistical Summary Report Page ii December 2014
Disclaimer The BMP Database (“Database”) was developed as an account of work sponsored by the Water Environment Research Foundation (WERF), the American Society of Civil Engineers (ASCE)/Environmental and Water Resources Institute (EWRI), the American Public Works Association (APWA), the Federal Highway Administration (FHWA), and U.S. Environmental Protection Agency (USEPA) (collectively, the “Sponsors”). The Database is intended to provide a consistent and scientifically defensible set of data on Best Management Practice (“BMP”) designs and related performance. Although the individuals who completed the work on behalf of the Sponsors (“Project Team”) made an extensive effort to assess the quality of the data entered for consistency and accuracy, the Database information and/or any analysis results are provided on an “AS-IS” basis and use of the Database, the data information, or any apparatus, method, or process disclosed in the Database is at the user’s sole risk. The Sponsors and the Project Team disclaim all warranties and/or conditions of any kind, express or implied, including, but not limited to any warranties or conditions of title, non-infringement of a third party’s intellectual property, merchantability, satisfactory quality, or fitness for a particular purpose. The Project Team does not warrant that the functions contained in the Database will meet the user’s requirements or that the operation of the Database will be uninterrupted or error free, or that any defects in the Database will be corrected.
UNDER NO CIRCUMSTANCES, INCLUDING CLAIMS OF NEGLIGENCE, SHALL THE SPONSORS OR THE PROJECT TEAM MEMBERS BE LIABLE FOR ANY DIRECT, INDIRECT, INCIDENTAL, SPECIAL, OR CONSEQUENTIAL DAMAGES INCLUDING LOST REVENUE, PROFIT OR DATA, WHETHER IN AN ACTION IN CONTRACT OR TORT ARISING OUT OF OR RELATING TO THE USE OF OR INABILITY TO USE THE DATABASE, EVEN IF THE SPONSORS OR THE PROJECT TEAM HAVE BEEN ADVISED OF THE POSSIBILITY OF SUCH DAMAGES.
The Project Team’s tasks have not included, and will not include in the future, recommendations of one BMP type over another. However, the Project Team's tasks have included reporting on the performance characteristics of BMPs based upon the entered data and information in the Database, including peer reviewed performance assessment techniques. Use of this information by the public or private sector is beyond the Project Team’s influence or control. The intended purpose of the Database is to provide a data exchange tool that permits characterization of BMPs solely upon their measured performance using consistent protocols for measurements and reporting information.
The Project Team does not endorse any BMP over another and any assessments of performance by others should not be interpreted or reported as the recommendations of the Project Team or the Sponsors.
International Stormwater BMP Database
Pollutant Category Statistical Summary Report Page iii December 2014
Acknowledgements
Report Preparation1 Primary Authors:
Marc Leisenring, P.E., Geosyntec Consultants, Inc. Jane Clary, Wright Water Engineers, Inc. Paul Hobson, Geosyntec Consultants, Inc.
Reviewers:
Eric Strecker, P.E., Geosyntec Consultants, Inc. Jonathan Jones, P.E., D.WRE, Wright Water Engineers, Inc.
Project Information WERF Project Director: Theresa Connor, P.E., Water Environment Research Foundation Principal Investigators: Eric Strecker, P.E., Geosyntec Consultants, Inc. Jonathan Jones, P.E., D.WRE, Wright Water Engineers, Inc. Project Steering Committee: Susan Jones, P.E., Federal Highway Administration Christopher Kloss, P.E., Office of Water/Office of Science & Technology, U.S. Environmental
Protection Agency Brian Parsons, P.E., Environmental and Water Resources Institute of American Society of Civil
Engineers Marcel Tchaou, Ph.D., P.E., P.H., MBA, Federal Highway Administration Office of Project
Development and Environmental Review Courtney Thompson, American Public Works Association
Project Subcommittee: Michael E. Barrett, Ph.D., P.E., D.WRE, Center for Research in Water Resources, University of
Texas Bob Carr, P.E., Gresham, Smith and Partners David R. Graves, CPESC, Environmental Science Bureau, New York State Dept. of
Transportation Gregory E. Granato, U.S. Geological Survey Jesse Pritts, P.E., Engineering and Analysis Division Office of Water/Office of Science &
Technology, U.S. Environmental Protection Agency
1 Contact Jane Clary ([email protected]) or Marc Leisenring ([email protected]) with questions regarding this summary.
International Stormwater BMP Database
Pollutant Category Statistical Summary Report Page iv December 2014
Table of Contents 1 INTRODUCTION .......................................................................................................... 1
2 DATA SUMMARY APPROACH ...................................................................................... 2
2.1 BMPS ANALYZED AND DATA SCREENING APPROACH .................................................... 2 2.2 GRAPHICAL SUMMARIES ................................................................................................ 3 2.3 TABULAR SUMMARIES .................................................................................................... 3
3 SOLIDS ....................................................................................................................... 6
3.1 TOTAL SUPENDED SOLIDS ............................................................................................... 6 3.2 TOTAL DISSOLVED SOLIDS............................................................................................... 7
4 BACTERIA ................................................................................................................... 8
4.1 ENTEROCOCCUS .............................................................................................................. 8 4.2 ESCHERICHIA COLI ........................................................................................................... 9 4.3 FECAL COLIFORM .......................................................................................................... 10
5 METALS .................................................................................................................... 11
5.1 ARSENIC......................................................................................................................... 11 5.2 CADMIUM ..................................................................................................................... 13 5.3 CHROMIUM ................................................................................................................... 15 5.4 COPPER ......................................................................................................................... 17 5.5 IRON .............................................................................................................................. 19 5.6 LEAD .............................................................................................................................. 21 5.7 NICKEL ........................................................................................................................... 23 5.8 ZINC ............................................................................................................................... 25
6 NUTRIENTS ............................................................................................................... 27
6.1 PHOSPHORUS ................................................................................................................ 27 6.2 NITROGEN ..................................................................................................................... 30
7 REFERENCES ............................................................................................................. 35
8 ATTACHMENTS ......................................................................................................... 35
Attachment 1. Solids Statistical Summary Report Attachment 2. Bacteria Statistical Summary Report Attachment 3. Metals Statistical Summary Report Attachment 4. Nutrients Statistical Summary Report
International Stormwater BMP Database
Pollutant Category Statistical Summary Report Page 1 December 2014
1 INTRODUCTION In 2010-2011, the Water Environment Research Foundation (WERF), Federal Highway Administration (FHWA), and the American Society of Civil Engineers’ Environmental and Water Resources Institute (EWRI) co-sponsored a comprehensive stormwater best management practice (BMP) performance analysis technical paper series relying on data contained in the International Stormwater BMP Database (BMPDB) .2 This series included papers for solids, bacteria, nutrients, and metals, with each paper summarizing the regulatory context of the constituent category, primary sources, fate and transport processes, removal mechanisms, and statistical summaries of BMP performance for data contained in the BMPDB. In 2012, an update of the statistical summaries provided in that series was prepared to include the data from over 50 new studies added to the database in late 2011. This 2014 report is yet another update of the statistical summaries that includes additional study data entered into the database in 2013 and 2014. This report is not intended to replace the discussion and context provided in the previous technical papers; instead, this report provides updated statistical summaries only. Constituents summarized in this report are listed in Table 1.
Table 1. Constituents Summarized by Pollutant Category Pollutant Category Summarized Constituent Solids Total suspended solids (TSS)
Total dissolved solids (TDS) Bacteria Fecal coliform
Escherichia coli (E. coli) Enterococcus
Metals Arsenic (total and dissolved) Cadmium (total and dissolved) Chromium (total and dissolved) Copper (total and dissolved) Iron (total and dissolved) Lead (total and dissolved) Nickel (total and dissolved) Zinc (total and dissolved)
Nutrients Total phosphorus Orthophosphate Dissolved phosphorus Total nitrogen Total Kjeldahl nitrogen (TKN) Nitrate (NO3) Nitrate plus nitrite (NO3 + NO2) Nitrate and Nitrate plus nitrite (NOx)
2 The BMP Database is a long-term project that began in 1994 through the vision of members active in the Urban Water Resources Research Council of ASCE and the leadership of EPA. Funded for many years by EPA, the project is now supported by a coalition of partners including WERF, FHWA, EWRI and the American Public Works Association (APWA). The technical reports can be downloaded from www.bmpdatabase.org/BMPPerformance.htm.
International Stormwater BMP Database
Pollutant Category Statistical Summary Report Page 2 December 2014
2 DATA SUMMARY APPROACH The BMP performance analyses provided in this report are based on the BMP performance data for selected pollutants in the BMPDB as of December 16, 2014. The analyses are based upon the distributions of influent and effluent water quality sample concentration data for individual events by BMP category, thereby providing greater weight to those BMPs for which there are a larger number of data points reported. In other words, the performance analysis presented in this technical summary is “storm-weighted,” as opposed to “BMP weighted.”3 This update does not include BMP weighted analyses (i.e., analyses of individual study site central tendencies). A summary of the BMPs analyzed and data screening approach is provided below followed by descriptions of the graphical and tabular summaries provided in this report. The statistical attachments provide additional detailed analysis organized by constituent and BMP type for the three main constituent categories: Solids, Bacteria, Metals, and Nutrients. Data for other pollutants not included in this report may also be available and can be obtained from www.bmpdatabase.org.
2.1 BMPs Analyzed and Data Screening Approach The BMP categories included in this analysis are grass strips, bioretention, bioswales, composite/treatment train BMPs, detention basins (surface/grass-lined), media filters (mostly sand filters), porous pavement, retention ponds (surface pond with a permanent pool), wetland basins (basins with open water surface), a combined category including both retention ponds and wetland basins, and wetland channels (swales and channels with wetland vegetation). The effectiveness and range of unit treatment processes present in a particular BMP may vary depending on the BMP design. Several other BMP categories and sub-classes are included in the database, but these have been excluded from this analysis due to limited data sets available for meaningful categorical comparisons. Additionally, the BMPDB contains approximately 100 manufactured devices, which are no longer provided as a general BMP category for analysis in this report because of the wide range of unit treatment processes present among various manufactured devices. Green roof data sets have also been excluded from this report due to relatively small numbers of comparable data sets and significant variation in monitoring program designs. Individual BMP performance analysis reports can be viewed and downloaded from www.bmpdatabase.org for manufactured devices, green roofs, and other BMP types not included in this summary report. For example, see http://www.bmpdatabase.org/map.html to view monitoring locations with other BMP types not included in this report. To be included in this category-level summary, at least three BMP studies must be included in the BMP category, with each BMP study having influent and effluent data for at least three storms for the pollutant of interest. Additional data screening include the exclusion of base flow samples from BMP studies, exclusion of grab samples for BMPs without permanent pools (i.e., 3 There are several viable approaches to evaluating data in the BMP Database. Two general approaches that have been presented in the past (Geosyntec Consultants and Wright Water Engineers, 2008) are the “BMP-weighted” and “storm-weighted” approaches. The BMP-weighted approach represents each BMP with one value representing the central tendency and variability of each individual BMP study, whereas the storm-weighted approach combines all of the storm events for the BMPs in each category and analyzes the overall storm-based data set. The storm-weighted approach has been selected for this report because it provides a much larger data set for analysis.
International Stormwater BMP Database
Pollutant Category Statistical Summary Report Page 3 December 2014
only event mean concentrations (EMCs) are used except for retention ponds and wetland basins), and exclusion of studies with a gross imbalance in the number of inflow and outflow sample results. A variety of additional screening criteria are applied for purposes of category-level analysis to make sure that the data sets and BMP designs are reasonably representative, as documented in the “Monitoring Station” table of the BMP Database, which can be downloaded from www.bmpdatabase.org. Poor performance of a BMP is not a reason for data exclusion.
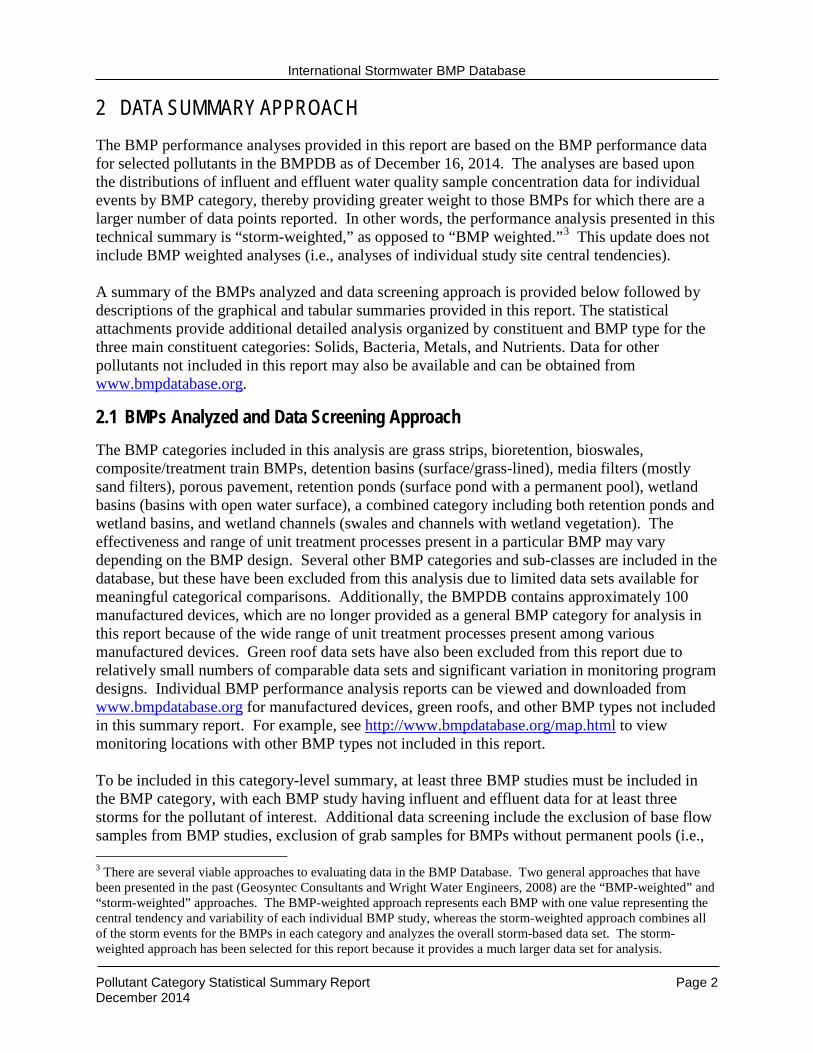
2.2 Graphical Summaries In the subsections below, side-by-side box plots for the various BMPs measurements have been generated using the influent and effluent concentrations from the studies. For each BMP category, the influent box plots are provided on the left and the effluent box plots are provided on the right. A key to the box plots is provided in Figure 1.
Figure 1. Box Plot Key
2.3 Tabular Summaries In addition to the box plots, tables of influent/effluent medians, 25th and 75th percentiles, and number of studies and data points are provided, along with 95% confidence intervals about the medians. The median and interquartile ranges were selected as descriptive statistics for BMP performance because they are non-parametric (do not require distributional assumptions for the underlying data set) and are less affected by extreme values than means and standard deviations. Additionally, the median is less affected by assumptions regarding values below detection limits and varying detection limits for studies conducted by independent parties over many years.
International Stormwater BMP Database
Pollutant Category Statistical Summary Report Page 4 December 2014
Since confidence intervals about the median can still be affected by outliers if simple substitution is used, a robust regression-on-order statistics (ROS) method as described by Helsel and Cohn (1988) was utilized to provide probabilistic estimates of non-detects before computing descriptive statistics. Despite use of this robust method, conclusions regarding BMP performance should carefully consider the influence of large percentages of non-detects. For example, pollutant removals may be found to be statistically insignificant for a BMP, but that BMP may still provide removals at higher influent concentrations. The number of influent and effluent non-detects should be reviewed before making conclusions, particularly for dissolved metals where non-detects are most prevalent. The number of non-detects are tabulated for each BMP/constituent combination in the associated attachments. For more information on the influence of non-detects on dissolved metals data in the BMP Database, see the discussion in the Metals Technical Summary (Wright Water Engineers and Geosyntec, 2011), accessible at www.bmpdatabase.org). Confidence intervals in the boxplots and tables were generated using the bias corrected and accelerated (BCa) bootstrap method described by Efron and Tibishirani (1993). This method is a robust approach for computing confidence intervals that is resistant to outliers and does not require any restrictive distributional assumptions.4 Comparison of the confidence intervals about the influent and effluent medians can be used to roughly identify statistically significant differences between the central tendencies of the data. However, non-parametric hypothesis tests, such as the Mann-Whitney rank sum test or the Wilcoxon signed-rank test, can provide additional and more robust results for evaluating significant differences between medians. The Mann-Whitney test applies to independent data sets, whereas the Wilcoxon test applies to paired data sets (Helsel and Hirsch, 1992). Results of these tests are provided in the attached statistical summary reports for solids, bacteria, metals, and nutrients. In some cases, the Mann-Whitney and Wilcoxon hypothesis test results produce conflicting conclusions regarding statistically significant differences. Such cases are more likely to occur where there are imbalances in the number of influent and effluent samples for a particular data set because the Mann-Whitney test operates on the entire data set whereas the Wilcoxon test only operates on data pairs. For BMPs with short residence times and limited storage, the Wilcoxon hypothesis test results may be more reliable for evaluating whether concentration reductions are statistically significant because the test operates on the individual paired differences of influent and effluent storm event mean (EMC) concentrations. For BMPs with long residence times and/or permanent pools (e.g., wet ponds), the paired storm event hypothesis test results relying on the Wilcoxon test may be less reliable than the Mann-Whitney test because of variations in sampling program designs for collection of influent and effluent samples that may not enable accurate event-based pairing of monitoring data. For example, inflow for a storm event on a particular date may mix with water from a previous event that has been stored since the previous storm. Thus, in cases where the Mann-Whitney and Wilcoxon test results conflict for BMPs with permanent pools, the Mann-Whitney results may provide a better indicator of pollutant removal performance. In the summary tables which follow, effluent values in bold green indicate the upper 95% confidence interval of the effluent median is less than the lower 95% confidence interval of the 4 Due to random statistical sampling that is conducted as part of the BCa method, insignificant variations in the calculated statistical result values may occur, causing minor inconsistencies between the values presented in the attachments relative to the tables presented in the main body of the report.
International Stormwater BMP Database
Pollutant Category Statistical Summary Report Page 5 December 2014
influent median. Effluent values in red bold italics indicate the lower 95% confidence interval of the effluent median is greater than the upper 95% confidence interval of the influent median. Values are also footnoted to indicate whether the hypothesis test results presented in the attachments indicate statistically significant differences. Be aware that for some BMP types, a statistically significant difference between influent and effluent concentrations may not be present, but the effluent concentrations achieved by the BMP are relatively low and may be comparable to the performance of other BMPs that have statistically significant differences between inflow and outflow. For example, data sets that have low influent concentrations and similarly low effluent concentration (i.e., clean water in = clean water out) may not show statistically significant differences. However this does not necessarily imply that the BMP would not have been effective at higher influent concentrations. Lastly, this report focuses soley on influent and effluent concentrations and does not characterize influent and effluent loads. For BMPs that provide significant volume reduction, load reductions may still occur in the absence of concentration reductions. Volume-related data can also be retrieved from the BMPDB and have been evaluated in detail for some BMP categories. For example, see International Stormwater Best Management Practices (BMP) Database Addendum 1 to Volume Reduction Technical Summary (January 2011) Expanded Analysis of Volume Reduction in Bioretention BMPs (Geosyntec and Wright Water Engineers 2012), accessible at www.bmpdatabase.org.
International Stormwater BMP Database
Pollutant Category Statistical Summary Report Page 6 December 2014
3 SOLIDS
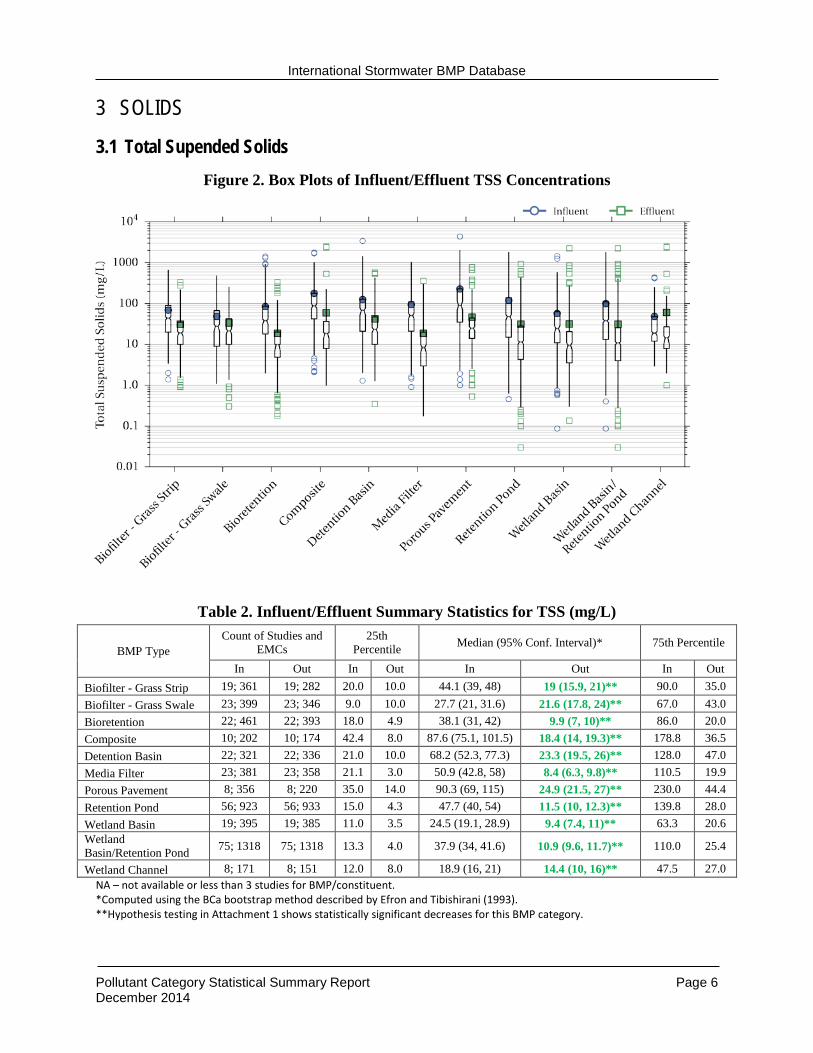
3.1 Total Supended Solids Figure 2. Box Plots of Influent/Effluent TSS Concentrations
Table 2. Influent/Effluent Summary Statistics for TSS (mg/L)
BMP Type Count of Studies and
EMCs 25th
Percentile Median (95% Conf. Interval)* 75th Percentile
In Out In Out In Out In Out Biofilter - Grass Strip 19; 361 19; 282 20.0 10.0 44.1 (39, 48) 19 (15.9, 21)** 90.0 35.0 Biofilter - Grass Swale 23; 399 23; 346 9.0 10.0 27.7 (21, 31.6) 21.6 (17.8, 24)** 67.0 43.0 Bioretention 22; 461 22; 393 18.0 4.9 38.1 (31, 42) 9.9 (7, 10)** 86.0 20.0 Composite 10; 202 10; 174 42.4 8.0 87.6 (75.1, 101.5) 18.4 (14, 19.3)** 178.8 36.5 Detention Basin 22; 321 22; 336 21.0 10.0 68.2 (52.3, 77.3) 23.3 (19.5, 26)** 128.0 47.0 Media Filter 23; 381 23; 358 21.1 3.0 50.9 (42.8, 58) 8.4 (6.3, 9.8)** 110.5 19.9 Porous Pavement 8; 356 8; 220 35.0 14.0 90.3 (69, 115) 24.9 (21.5, 27)** 230.0 44.4 Retention Pond 56; 923 56; 933 15.0 4.3 47.7 (40, 54) 11.5 (10, 12.3)** 139.8 28.0 Wetland Basin 19; 395 19; 385 11.0 3.5 24.5 (19.1, 28.9) 9.4 (7.4, 11)** 63.3 20.6 Wetland Basin/Retention Pond 75; 1318 75; 1318 13.3 4.0 37.9 (34, 41.6) 10.9 (9.6, 11.7)** 110.0 25.4
Wetland Channel 8; 171 8; 151 12.0 8.0 18.9 (16, 21) 14.4 (10, 16)** 47.5 27.0 NA – not available or less than 3 studies for BMP/constituent. *Computed using the BCa bootstrap method described by Efron and Tibishirani (1993). **Hypothesis testing in Attachment 1 shows statistically significant decreases for this BMP category.
International Stormwater BMP Database
Pollutant Category Statistical Summary Report Page 7 December 2014
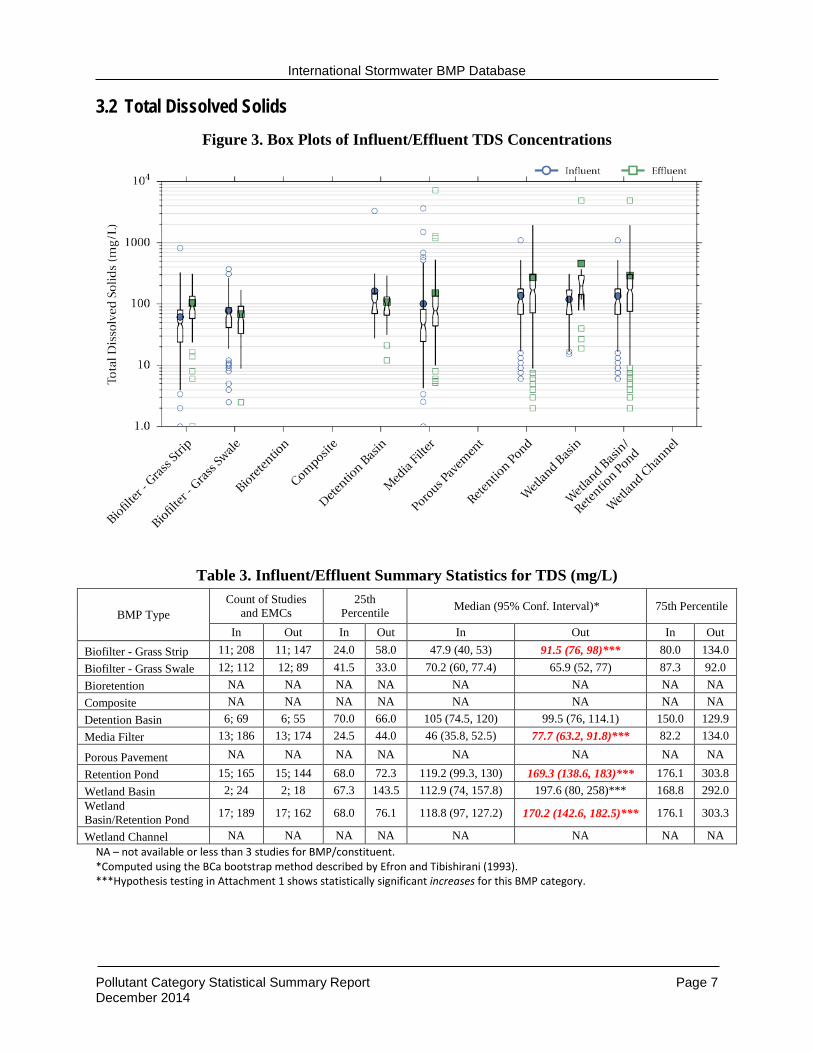
3.2 Total Dissolved Solids Figure 3. Box Plots of Influent/Effluent TDS Concentrations
Table 3. Influent/Effluent Summary Statistics for TDS (mg/L)
BMP Type Count of Studies
and EMCs 25th
Percentile Median (95% Conf. Interval)* 75th Percentile
In Out In Out In Out In Out Biofilter - Grass Strip 11; 208 11; 147 24.0 58.0 47.9 (40, 53) 91.5 (76, 98)*** 80.0 134.0 Biofilter - Grass Swale 12; 112 12; 89 41.5 33.0 70.2 (60, 77.4) 65.9 (52, 77) 87.3 92.0 Bioretention NA NA NA NA NA NA NA NA Composite NA NA NA NA NA NA NA NA Detention Basin 6; 69 6; 55 70.0 66.0 105 (74.5, 120) 99.5 (76, 114.1) 150.0 129.9 Media Filter 13; 186 13; 174 24.5 44.0 46 (35.8, 52.5) 77.7 (63.2, 91.8)*** 82.2 134.0
Porous Pavement NA NA NA NA NA NA NA NA
Retention Pond 15; 165 15; 144 68.0 72.3 119.2 (99.3, 130) 169.3 (138.6, 183)*** 176.1 303.8 Wetland Basin 2; 24 2; 18 67.3 143.5 112.9 (74, 157.8) 197.6 (80, 258)*** 168.8 292.0 Wetland Basin/Retention Pond 17; 189 17; 162 68.0 76.1 118.8 (97, 127.2) 170.2 (142.6, 182.5)*** 176.1 303.3
Wetland Channel NA NA NA NA NA NA NA NA NA – not available or less than 3 studies for BMP/constituent. *Computed using the BCa bootstrap method described by Efron and Tibishirani (1993). ***Hypothesis testing in Attachment 1 shows statistically significant increases for this BMP category.
International Stormwater BMP Database
Pollutant Category Statistical Summary Report Page 8 December 2014
4 BACTERIA
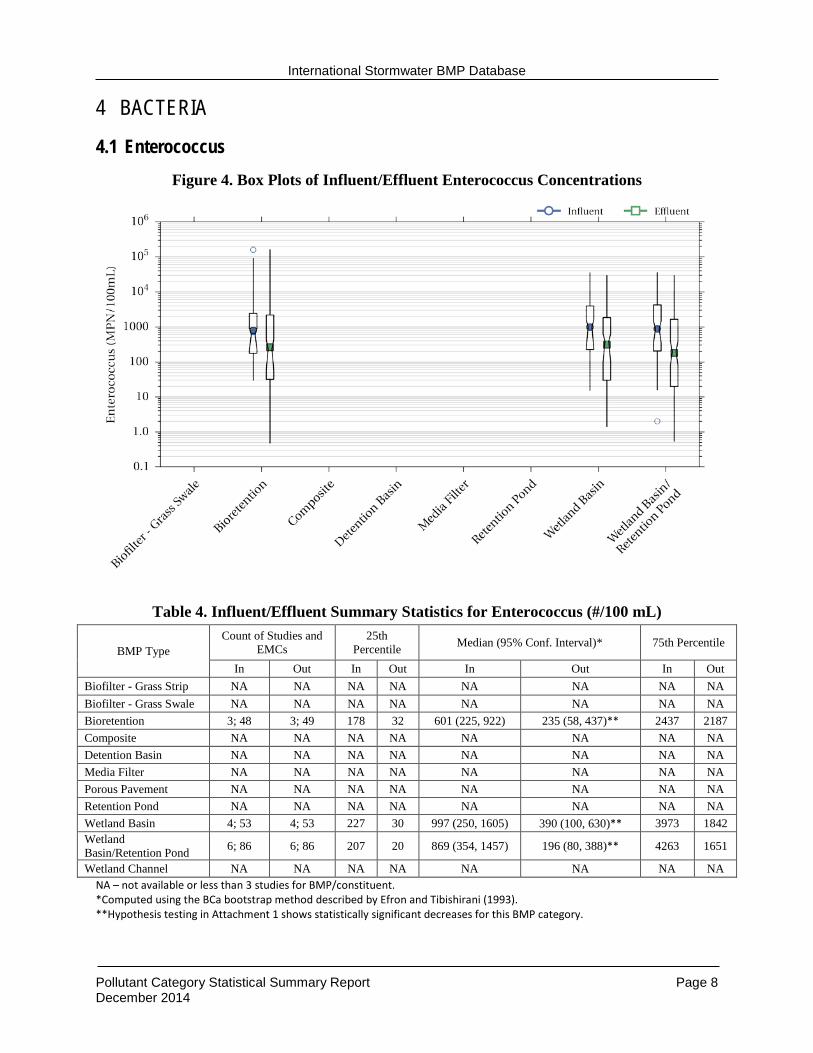
4.1 Enterococcus Figure 4. Box Plots of Influent/Effluent Enterococcus Concentrations
Table 4. Influent/Effluent Summary Statistics for Enterococcus (#/100 mL)
BMP Type Count of Studies and
EMCs 25th
Percentile Median (95% Conf. Interval)* 75th Percentile
In Out In Out In Out In Out Biofilter - Grass Strip NA NA NA NA NA NA NA NA Biofilter - Grass Swale NA NA NA NA NA NA NA NA Bioretention 3; 48 3; 49 178 32 601 (225, 922) 235 (58, 437)** 2437 2187 Composite NA NA NA NA NA NA NA NA Detention Basin NA NA NA NA NA NA NA NA Media Filter NA NA NA NA NA NA NA NA Porous Pavement NA NA NA NA NA NA NA NA Retention Pond NA NA NA NA NA NA NA NA Wetland Basin 4; 53 4; 53 227 30 997 (250, 1605) 390 (100, 630)** 3973 1842 Wetland Basin/Retention Pond 6; 86 6; 86 207 20 869 (354, 1457) 196 (80, 388)** 4263 1651
Wetland Channel NA NA NA NA NA NA NA NA NA – not available or less than 3 studies for BMP/constituent. *Computed using the BCa bootstrap method described by Efron and Tibishirani (1993). **Hypothesis testing in Attachment 1 shows statistically significant decreases for this BMP category.
International Stormwater BMP Database
Pollutant Category Statistical Summary Report Page 9 December 2014
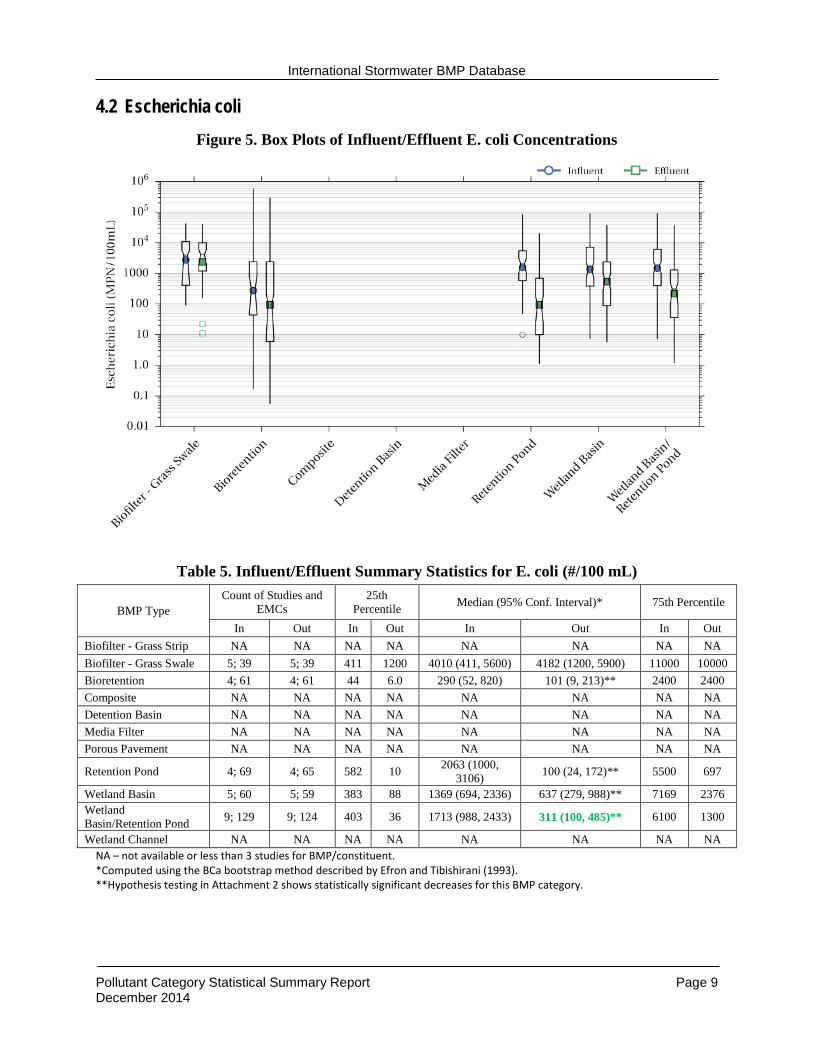
4.2 Escherichia coli Figure 5. Box Plots of Influent/Effluent E. coli Concentrations
Table 5. Influent/Effluent Summary Statistics for E. coli (#/100 mL)
BMP Type Count of Studies and
EMCs 25th
Percentile Median (95% Conf. Interval)* 75th Percentile
In Out In Out In Out In Out Biofilter - Grass Strip NA NA NA NA NA NA NA NA Biofilter - Grass Swale 5; 39 5; 39 411 1200 4010 (411, 5600) 4182 (1200, 5900) 11000 10000 Bioretention 4; 61 4; 61 44 6.0 290 (52, 820) 101 (9, 213)** 2400 2400 Composite NA NA NA NA NA NA NA NA Detention Basin NA NA NA NA NA NA NA NA Media Filter NA NA NA NA NA NA NA NA Porous Pavement NA NA NA NA NA NA NA NA
Retention Pond 4; 69 4; 65 582 10 2063 (1000, 3106) 100 (24, 172)** 5500 697
Wetland Basin 5; 60 5; 59 383 88 1369 (694, 2336) 637 (279, 988)** 7169 2376 Wetland Basin/Retention Pond 9; 129 9; 124 403 36 1713 (988, 2433) 311 (100, 485)** 6100 1300
Wetland Channel NA NA NA NA NA NA NA NA NA – not available or less than 3 studies for BMP/constituent. *Computed using the BCa bootstrap method described by Efron and Tibishirani (1993). **Hypothesis testing in Attachment 2 shows statistically significant decreases for this BMP category.
International Stormwater BMP Database
Pollutant Category Statistical Summary Report Page 10 December 2014
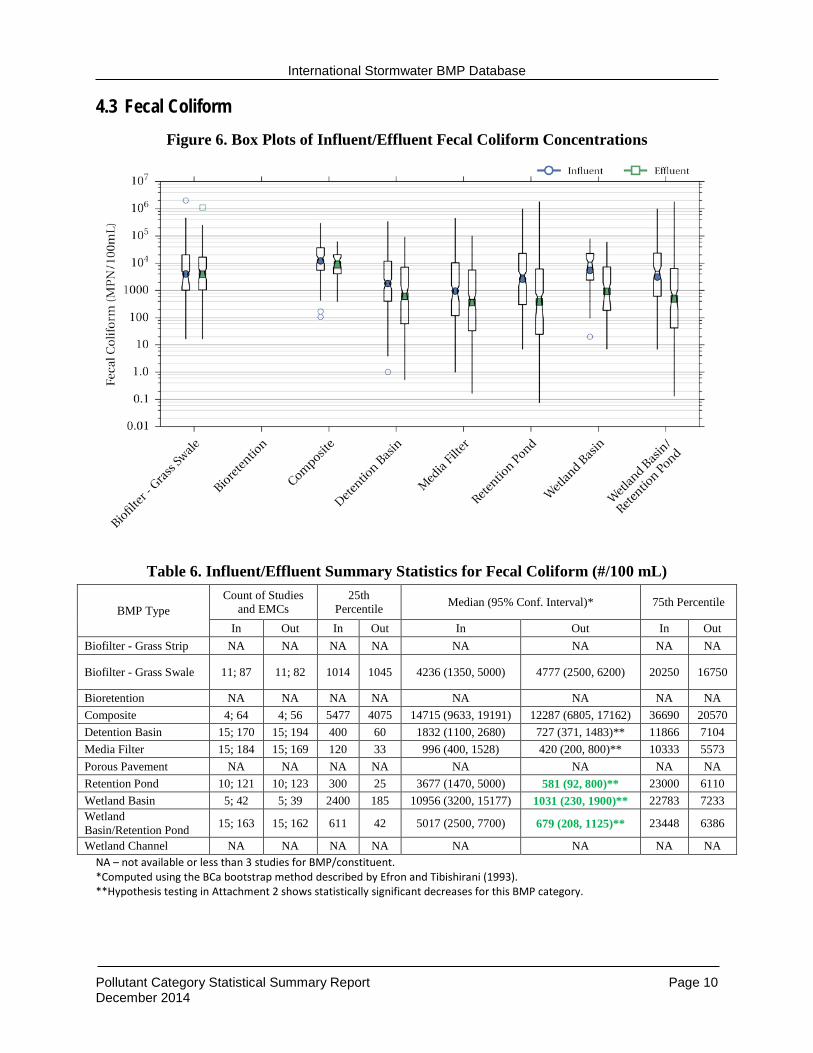
4.3 Fecal Coliform Figure 6. Box Plots of Influent/Effluent Fecal Coliform Concentrations
Table 6. Influent/Effluent Summary Statistics for Fecal Coliform (#/100 mL)
BMP Type Count of Studies
and EMCs 25th
Percentile Median (95% Conf. Interval)* 75th Percentile
In Out In Out In Out In Out Biofilter - Grass Strip NA NA NA NA NA NA NA NA
Biofilter - Grass Swale 11; 87 11; 82 1014 1045 4236 (1350, 5000) 4777 (2500, 6200) 20250 16750
Bioretention NA NA NA NA NA NA NA NA Composite 4; 64 4; 56 5477 4075 14715 (9633, 19191) 12287 (6805, 17162) 36690 20570 Detention Basin 15; 170 15; 194 400 60 1832 (1100, 2680) 727 (371, 1483)** 11866 7104 Media Filter 15; 184 15; 169 120 33 996 (400, 1528) 420 (200, 800)** 10333 5573 Porous Pavement NA NA NA NA NA NA NA NA Retention Pond 10; 121 10; 123 300 25 3677 (1470, 5000) 581 (92, 800)** 23000 6110 Wetland Basin 5; 42 5; 39 2400 185 10956 (3200, 15177) 1031 (230, 1900)** 22783 7233 Wetland Basin/Retention Pond 15; 163 15; 162 611 42 5017 (2500, 7700) 679 (208, 1125)** 23448 6386
Wetland Channel NA NA NA NA NA NA NA NA NA – not available or less than 3 studies for BMP/constituent. *Computed using the BCa bootstrap method described by Efron and Tibishirani (1993). **Hypothesis testing in Attachment 2 shows statistically significant decreases for this BMP category.
International Stormwater BMP Database
Pollutant Category Statistical Summary Report Page 11 December 2014
5 METALS
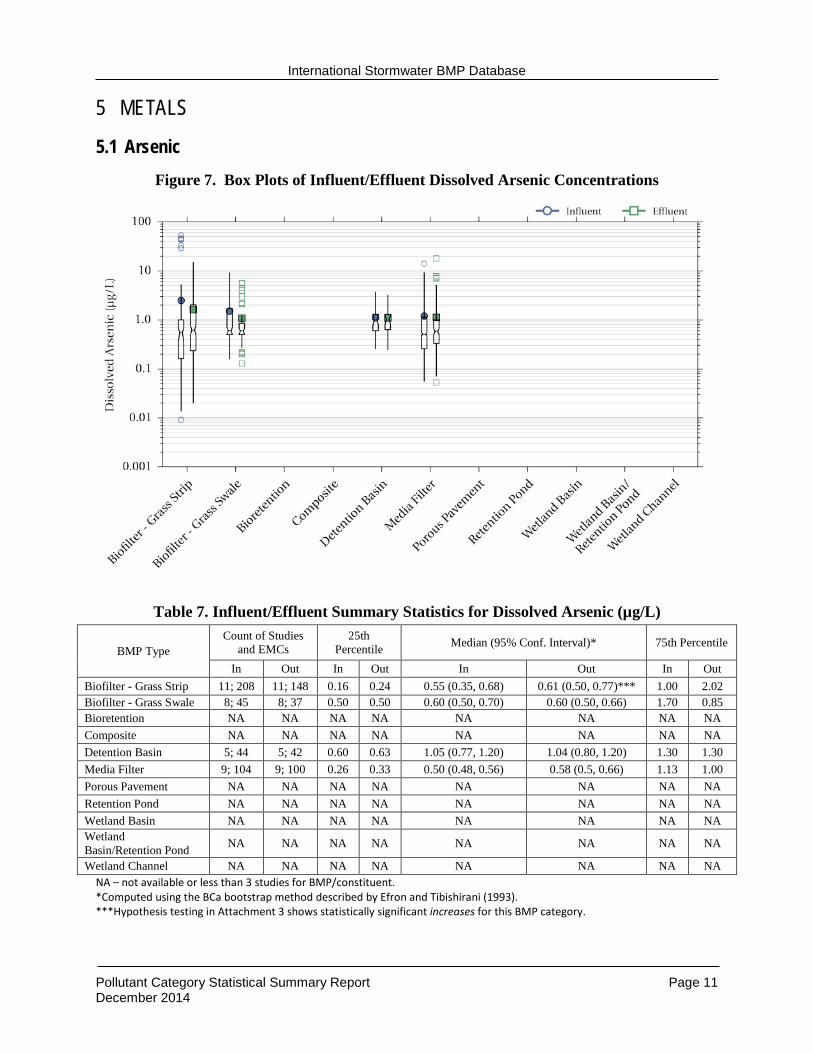
5.1 Arsenic Figure 7. Box Plots of Influent/Effluent Dissolved Arsenic Concentrations
Table 7. Influent/Effluent Summary Statistics for Dissolved Arsenic (µg/L)
BMP Type Count of Studies
and EMCs 25th
Percentile Median (95% Conf. Interval)* 75th Percentile
In Out In Out In Out In Out Biofilter - Grass Strip 11; 208 11; 148 0.16 0.24 0.55 (0.35, 0.68) 0.61 (0.50, 0.77)*** 1.00 2.02 Biofilter - Grass Swale 8; 45 8; 37 0.50 0.50 0.60 (0.50, 0.70) 0.60 (0.50, 0.66) 1.70 0.85 Bioretention NA NA NA NA NA NA NA NA Composite NA NA NA NA NA NA NA NA Detention Basin 5; 44 5; 42 0.60 0.63 1.05 (0.77, 1.20) 1.04 (0.80, 1.20) 1.30 1.30 Media Filter 9; 104 9; 100 0.26 0.33 0.50 (0.48, 0.56) 0.58 (0.5, 0.66) 1.13 1.00 Porous Pavement NA NA NA NA NA NA NA NA Retention Pond NA NA NA NA NA NA NA NA Wetland Basin NA NA NA NA NA NA NA NA Wetland Basin/Retention Pond NA NA NA NA NA NA NA NA
Wetland Channel NA NA NA NA NA NA NA NA NA – not available or less than 3 studies for BMP/constituent. *Computed using the BCa bootstrap method described by Efron and Tibishirani (1993). ***Hypothesis testing in Attachment 3 shows statistically significant increases for this BMP category.
International Stormwater BMP Database
Pollutant Category Statistical Summary Report Page 12 December 2014
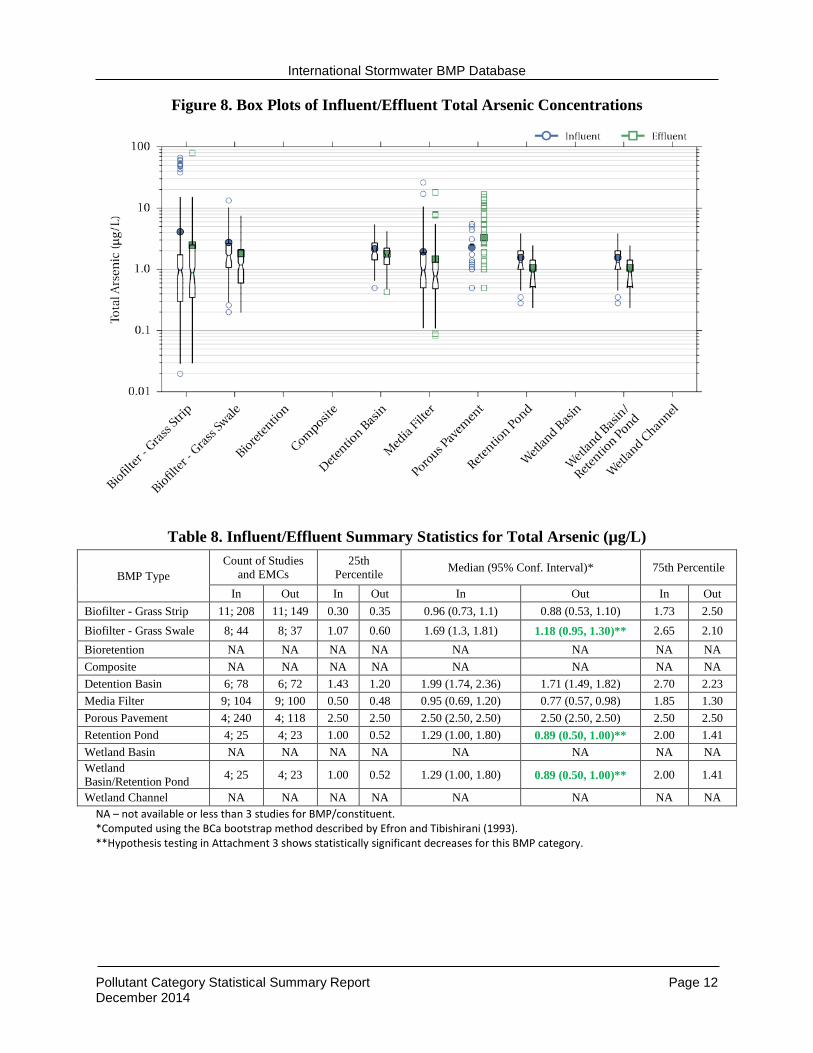
Figure 8. Box Plots of Influent/Effluent Total Arsenic Concentrations
Table 8. Influent/Effluent Summary Statistics for Total Arsenic (µg/L)
BMP Type Count of Studies
and EMCs 25th
Percentile Median (95% Conf. Interval)* 75th Percentile
In Out In Out In Out In Out Biofilter - Grass Strip 11; 208 11; 149 0.30 0.35 0.96 (0.73, 1.1) 0.88 (0.53, 1.10) 1.73 2.50 Biofilter - Grass Swale 8; 44 8; 37 1.07 0.60 1.69 (1.3, 1.81) 1.18 (0.95, 1.30)** 2.65 2.10 Bioretention NA NA NA NA NA NA NA NA Composite NA NA NA NA NA NA NA NA Detention Basin 6; 78 6; 72 1.43 1.20 1.99 (1.74, 2.36) 1.71 (1.49, 1.82) 2.70 2.23 Media Filter 9; 104 9; 100 0.50 0.48 0.95 (0.69, 1.20) 0.77 (0.57, 0.98) 1.85 1.30 Porous Pavement 4; 240 4; 118 2.50 2.50 2.50 (2.50, 2.50) 2.50 (2.50, 2.50) 2.50 2.50 Retention Pond 4; 25 4; 23 1.00 0.52 1.29 (1.00, 1.80) 0.89 (0.50, 1.00)** 2.00 1.41 Wetland Basin NA NA NA NA NA NA NA NA Wetland Basin/Retention Pond 4; 25 4; 23 1.00 0.52 1.29 (1.00, 1.80) 0.89 (0.50, 1.00)** 2.00 1.41
Wetland Channel NA NA NA NA NA NA NA NA NA – not available or less than 3 studies for BMP/constituent. *Computed using the BCa bootstrap method described by Efron and Tibishirani (1993). **Hypothesis testing in Attachment 3 shows statistically significant decreases for this BMP category.
International Stormwater BMP Database
Pollutant Category Statistical Summary Report Page 13 December 2014
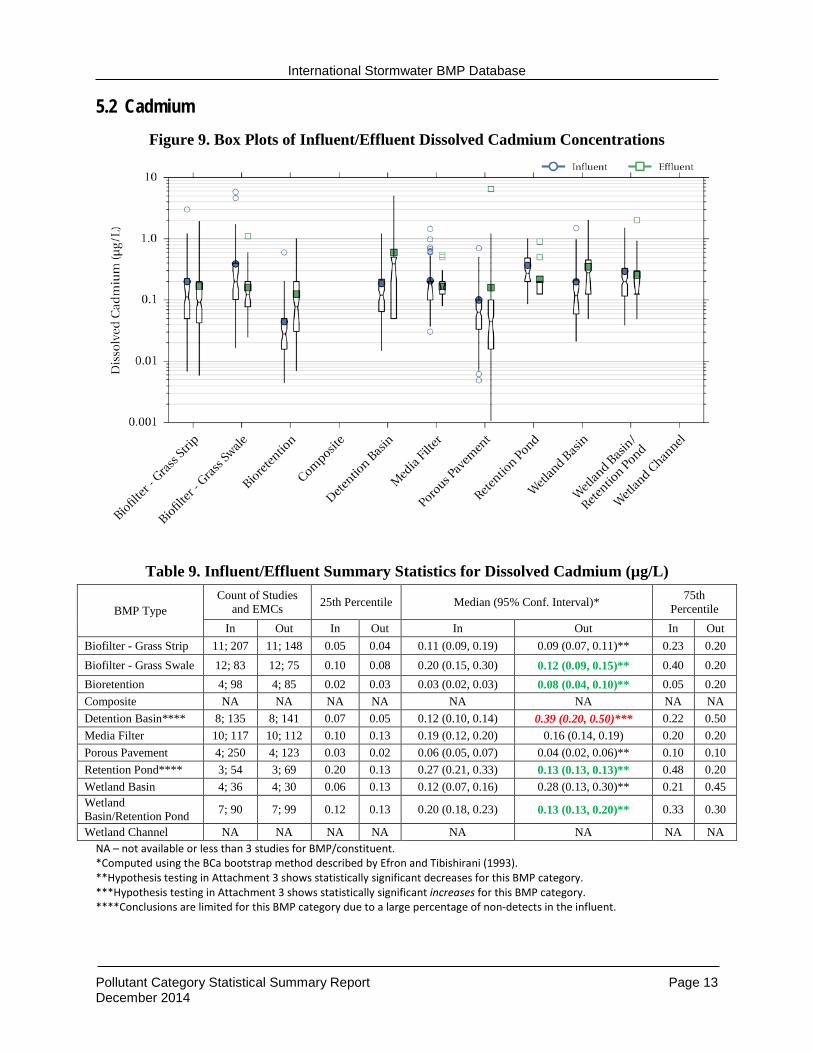
5.2 Cadmium Figure 9. Box Plots of Influent/Effluent Dissolved Cadmium Concentrations
Table 9. Influent/Effluent Summary Statistics for Dissolved Cadmium (µg/L)
BMP Type Count of Studies
and EMCs 25th Percentile Median (95% Conf. Interval)* 75th Percentile
In Out In Out In Out In Out Biofilter - Grass Strip 11; 207 11; 148 0.05 0.04 0.11 (0.09, 0.19) 0.09 (0.07, 0.11)** 0.23 0.20 Biofilter - Grass Swale 12; 83 12; 75 0.10 0.08 0.20 (0.15, 0.30) 0.12 (0.09, 0.15)** 0.40 0.20 Bioretention 4; 98 4; 85 0.02 0.03 0.03 (0.02, 0.03) 0.08 (0.04, 0.10)** 0.05 0.20 Composite NA NA NA NA NA NA NA NA Detention Basin**** 8; 135 8; 141 0.07 0.05 0.12 (0.10, 0.14) 0.39 (0.20, 0.50)*** 0.22 0.50 Media Filter 10; 117 10; 112 0.10 0.13 0.19 (0.12, 0.20) 0.16 (0.14, 0.19) 0.20 0.20 Porous Pavement 4; 250 4; 123 0.03 0.02 0.06 (0.05, 0.07) 0.04 (0.02, 0.06)** 0.10 0.10 Retention Pond**** 3; 54 3; 69 0.20 0.13 0.27 (0.21, 0.33) 0.13 (0.13, 0.13)** 0.48 0.20 Wetland Basin 4; 36 4; 30 0.06 0.13 0.12 (0.07, 0.16) 0.28 (0.13, 0.30)** 0.21 0.45 Wetland Basin/Retention Pond 7; 90 7; 99 0.12 0.13 0.20 (0.18, 0.23) 0.13 (0.13, 0.20)** 0.33 0.30
Wetland Channel NA NA NA NA NA NA NA NA NA – not available or less than 3 studies for BMP/constituent. *Computed using the BCa bootstrap method described by Efron and Tibishirani (1993). **Hypothesis testing in Attachment 3 shows statistically significant decreases for this BMP category. ***Hypothesis testing in Attachment 3 shows statistically significant increases for this BMP category. ****Conclusions are limited for this BMP category due to a large percentage of non-detects in the influent.
International Stormwater BMP Database
Pollutant Category Statistical Summary Report Page 14 December 2014
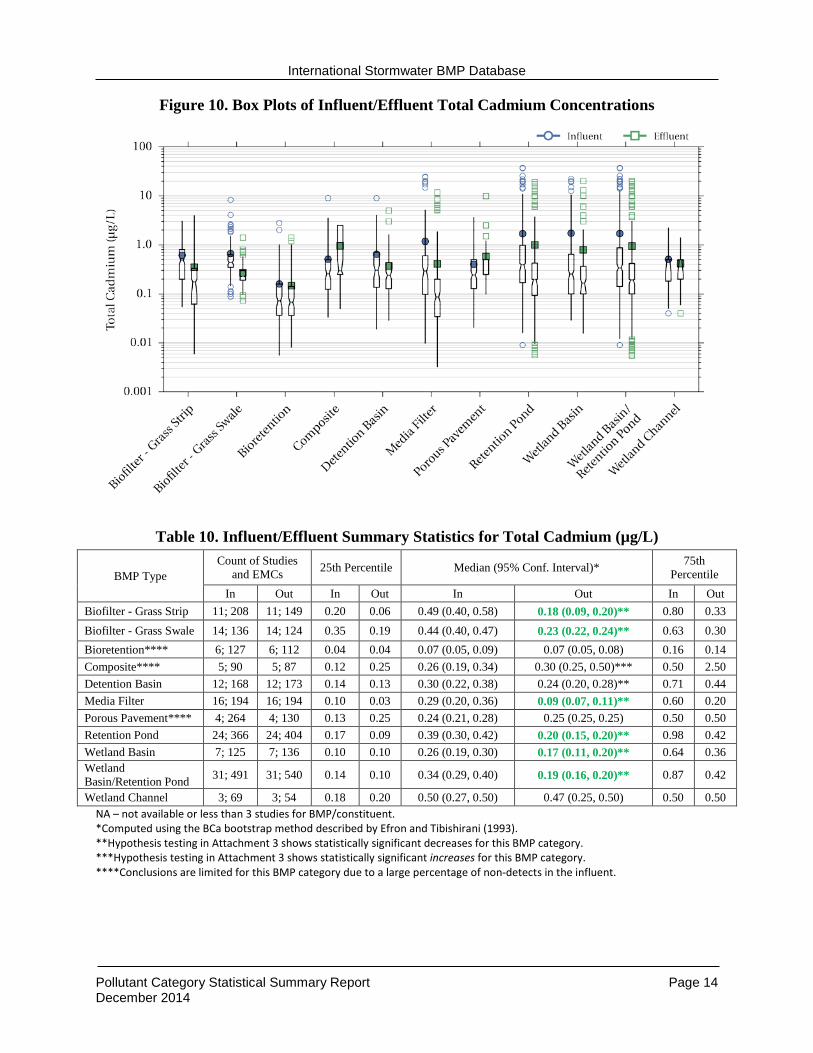
Figure 10. Box Plots of Influent/Effluent Total Cadmium Concentrations
Table 10. Influent/Effluent Summary Statistics for Total Cadmium (µg/L)
BMP Type Count of Studies
and EMCs 25th Percentile Median (95% Conf. Interval)* 75th Percentile
In Out In Out In Out In Out Biofilter - Grass Strip 11; 208 11; 149 0.20 0.06 0.49 (0.40, 0.58) 0.18 (0.09, 0.20)** 0.80 0.33 Biofilter - Grass Swale 14; 136 14; 124 0.35 0.19 0.44 (0.40, 0.47) 0.23 (0.22, 0.24)** 0.63 0.30 Bioretention**** 6; 127 6; 112 0.04 0.04 0.07 (0.05, 0.09) 0.07 (0.05, 0.08) 0.16 0.14 Composite**** 5; 90 5; 87 0.12 0.25 0.26 (0.19, 0.34) 0.30 (0.25, 0.50)*** 0.50 2.50 Detention Basin 12; 168 12; 173 0.14 0.13 0.30 (0.22, 0.38) 0.24 (0.20, 0.28)** 0.71 0.44 Media Filter 16; 194 16; 194 0.10 0.03 0.29 (0.20, 0.36) 0.09 (0.07, 0.11)** 0.60 0.20 Porous Pavement**** 4; 264 4; 130 0.13 0.25 0.24 (0.21, 0.28) 0.25 (0.25, 0.25) 0.50 0.50 Retention Pond 24; 366 24; 404 0.17 0.09 0.39 (0.30, 0.42) 0.20 (0.15, 0.20)** 0.98 0.42 Wetland Basin 7; 125 7; 136 0.10 0.10 0.26 (0.19, 0.30) 0.17 (0.11, 0.20)** 0.64 0.36 Wetland Basin/Retention Pond 31; 491 31; 540 0.14 0.10 0.34 (0.29, 0.40) 0.19 (0.16, 0.20)** 0.87 0.42
Wetland Channel 3; 69 3; 54 0.18 0.20 0.50 (0.27, 0.50) 0.47 (0.25, 0.50) 0.50 0.50 NA – not available or less than 3 studies for BMP/constituent. *Computed using the BCa bootstrap method described by Efron and Tibishirani (1993). **Hypothesis testing in Attachment 3 shows statistically significant decreases for this BMP category. ***Hypothesis testing in Attachment 3 shows statistically significant increases for this BMP category. ****Conclusions are limited for this BMP category due to a large percentage of non-detects in the influent.
International Stormwater BMP Database
Pollutant Category Statistical Summary Report Page 15 December 2014
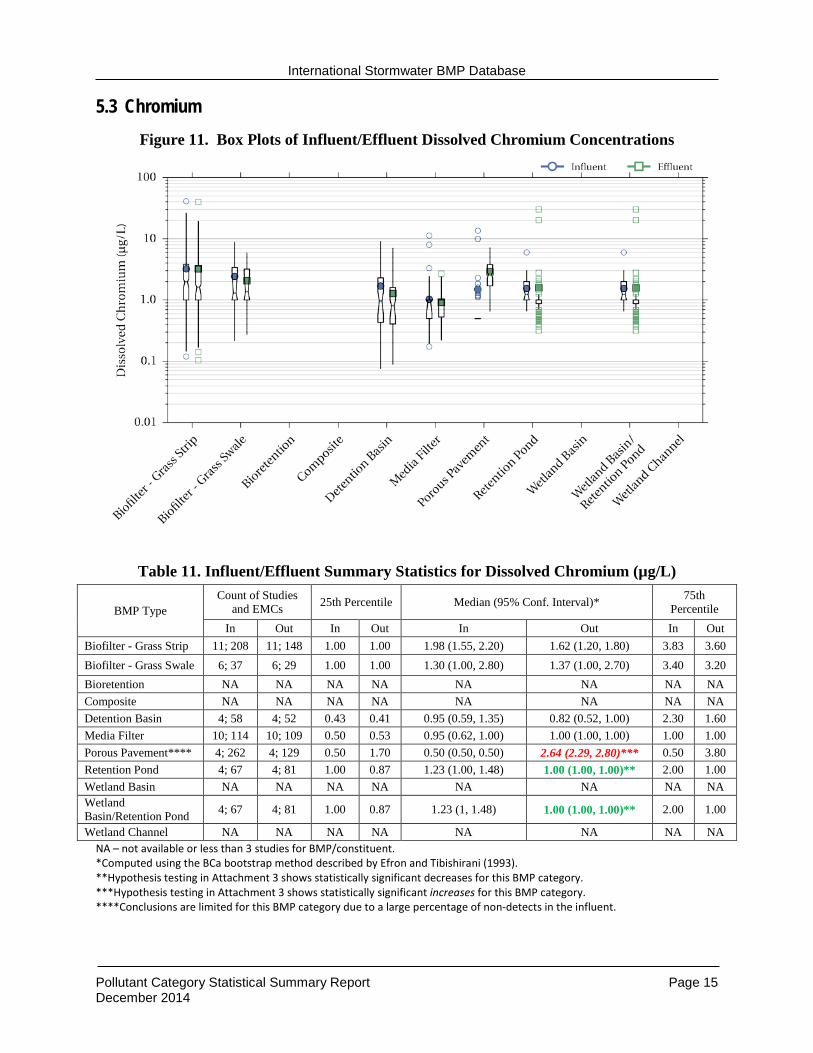
5.3 Chromium Figure 11. Box Plots of Influent/Effluent Dissolved Chromium Concentrations
Table 11. Influent/Effluent Summary Statistics for Dissolved Chromium (µg/L)
BMP Type Count of Studies
and EMCs 25th Percentile Median (95% Conf. Interval)* 75th Percentile
In Out In Out In Out In Out Biofilter - Grass Strip 11; 208 11; 148 1.00 1.00 1.98 (1.55, 2.20) 1.62 (1.20, 1.80) 3.83 3.60 Biofilter - Grass Swale 6; 37 6; 29 1.00 1.00 1.30 (1.00, 2.80) 1.37 (1.00, 2.70) 3.40 3.20 Bioretention NA NA NA NA NA NA NA NA Composite NA NA NA NA NA NA NA NA Detention Basin 4; 58 4; 52 0.43 0.41 0.95 (0.59, 1.35) 0.82 (0.52, 1.00) 2.30 1.60 Media Filter 10; 114 10; 109 0.50 0.53 0.95 (0.62, 1.00) 1.00 (1.00, 1.00) 1.00 1.00 Porous Pavement**** 4; 262 4; 129 0.50 1.70 0.50 (0.50, 0.50) 2.64 (2.29, 2.80)*** 0.50 3.80 Retention Pond 4; 67 4; 81 1.00 0.87 1.23 (1.00, 1.48) 1.00 (1.00, 1.00)** 2.00 1.00 Wetland Basin NA NA NA NA NA NA NA NA Wetland Basin/Retention Pond 4; 67 4; 81 1.00 0.87 1.23 (1, 1.48) 1.00 (1.00, 1.00)** 2.00 1.00
Wetland Channel NA NA NA NA NA NA NA NA NA – not available or less than 3 studies for BMP/constituent. *Computed using the BCa bootstrap method described by Efron and Tibishirani (1993). **Hypothesis testing in Attachment 3 shows statistically significant decreases for this BMP category. ***Hypothesis testing in Attachment 3 shows statistically significant increases for this BMP category. ****Conclusions are limited for this BMP category due to a large percentage of non-detects in the influent.
International Stormwater BMP Database
Pollutant Category Statistical Summary Report Page 16 December 2014
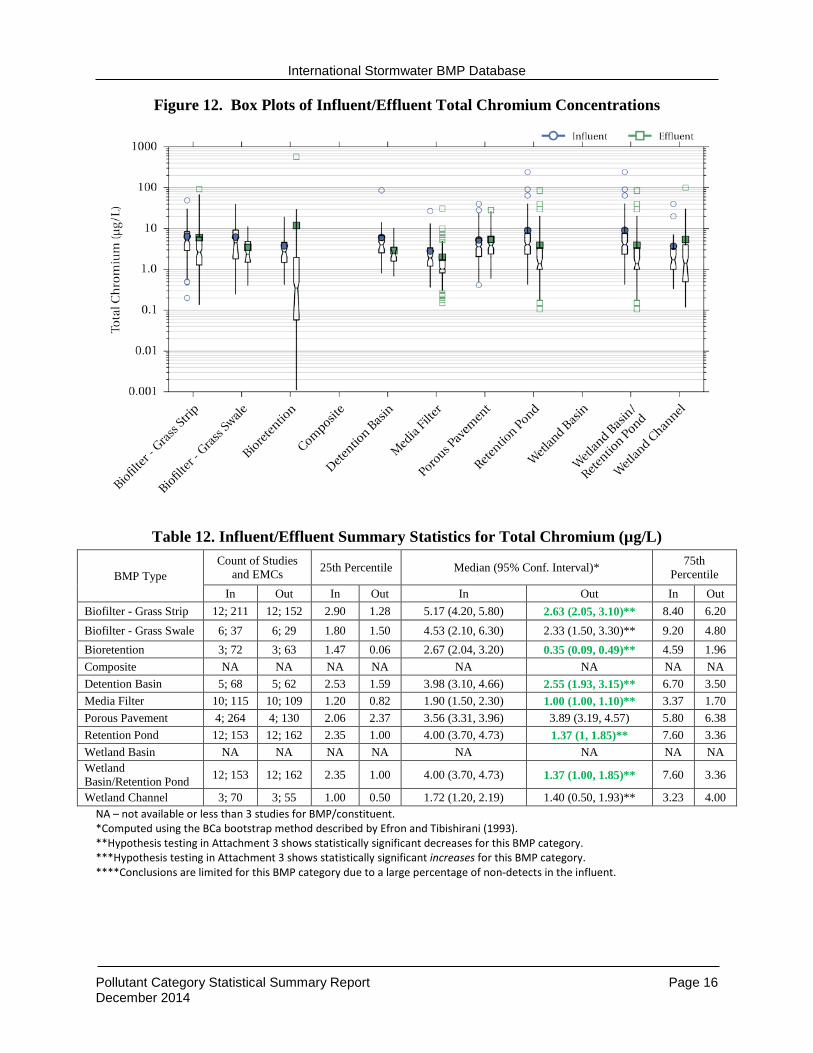
Figure 12. Box Plots of Influent/Effluent Total Chromium Concentrations
Table 12. Influent/Effluent Summary Statistics for Total Chromium (µg/L)
BMP Type Count of Studies
and EMCs 25th Percentile Median (95% Conf. Interval)* 75th Percentile
In Out In Out In Out In Out Biofilter - Grass Strip 12; 211 12; 152 2.90 1.28 5.17 (4.20, 5.80) 2.63 (2.05, 3.10)** 8.40 6.20 Biofilter - Grass Swale 6; 37 6; 29 1.80 1.50 4.53 (2.10, 6.30) 2.33 (1.50, 3.30)** 9.20 4.80 Bioretention 3; 72 3; 63 1.47 0.06 2.67 (2.04, 3.20) 0.35 (0.09, 0.49)** 4.59 1.96 Composite NA NA NA NA NA NA NA NA Detention Basin 5; 68 5; 62 2.53 1.59 3.98 (3.10, 4.66) 2.55 (1.93, 3.15)** 6.70 3.50 Media Filter 10; 115 10; 109 1.20 0.82 1.90 (1.50, 2.30) 1.00 (1.00, 1.10)** 3.37 1.70 Porous Pavement 4; 264 4; 130 2.06 2.37 3.56 (3.31, 3.96) 3.89 (3.19, 4.57) 5.80 6.38 Retention Pond 12; 153 12; 162 2.35 1.00 4.00 (3.70, 4.73) 1.37 (1, 1.85)** 7.60 3.36 Wetland Basin NA NA NA NA NA NA NA NA Wetland Basin/Retention Pond 12; 153 12; 162 2.35 1.00 4.00 (3.70, 4.73) 1.37 (1.00, 1.85)** 7.60 3.36
Wetland Channel 3; 70 3; 55 1.00 0.50 1.72 (1.20, 2.19) 1.40 (0.50, 1.93)** 3.23 4.00 NA – not available or less than 3 studies for BMP/constituent. *Computed using the BCa bootstrap method described by Efron and Tibishirani (1993). **Hypothesis testing in Attachment 3 shows statistically significant decreases for this BMP category. ***Hypothesis testing in Attachment 3 shows statistically significant increases for this BMP category. ****Conclusions are limited for this BMP category due to a large percentage of non-detects in the influent.
International Stormwater BMP Database
Pollutant Category Statistical Summary Report Page 17 December 2014
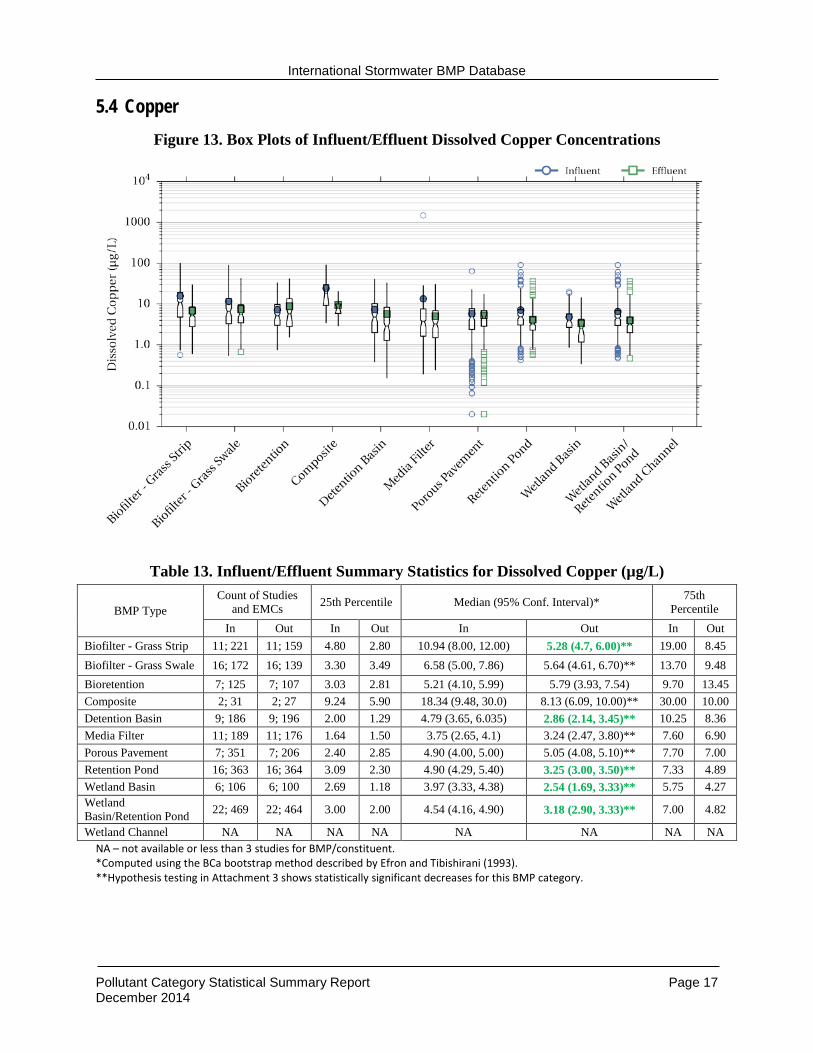
5.4 Copper Figure 13. Box Plots of Influent/Effluent Dissolved Copper Concentrations
Table 13. Influent/Effluent Summary Statistics for Dissolved Copper (µg/L)
BMP Type Count of Studies
and EMCs 25th Percentile Median (95% Conf. Interval)* 75th Percentile
In Out In Out In Out In Out Biofilter - Grass Strip 11; 221 11; 159 4.80 2.80 10.94 (8.00, 12.00) 5.28 (4.7, 6.00)** 19.00 8.45 Biofilter - Grass Swale 16; 172 16; 139 3.30 3.49 6.58 (5.00, 7.86) 5.64 (4.61, 6.70)** 13.70 9.48 Bioretention 7; 125 7; 107 3.03 2.81 5.21 (4.10, 5.99) 5.79 (3.93, 7.54) 9.70 13.45 Composite 2; 31 2; 27 9.24 5.90 18.34 (9.48, 30.0) 8.13 (6.09, 10.00)** 30.00 10.00 Detention Basin 9; 186 9; 196 2.00 1.29 4.79 (3.65, 6.035) 2.86 (2.14, 3.45)** 10.25 8.36 Media Filter 11; 189 11; 176 1.64 1.50 3.75 (2.65, 4.1) 3.24 (2.47, 3.80)** 7.60 6.90 Porous Pavement 7; 351 7; 206 2.40 2.85 4.90 (4.00, 5.00) 5.05 (4.08, 5.10)** 7.70 7.00 Retention Pond 16; 363 16; 364 3.09 2.30 4.90 (4.29, 5.40) 3.25 (3.00, 3.50)** 7.33 4.89 Wetland Basin 6; 106 6; 100 2.69 1.18 3.97 (3.33, 4.38) 2.54 (1.69, 3.33)** 5.75 4.27 Wetland Basin/Retention Pond 22; 469 22; 464 3.00 2.00 4.54 (4.16, 4.90) 3.18 (2.90, 3.33)** 7.00 4.82
Wetland Channel NA NA NA NA NA NA NA NA NA – not available or less than 3 studies for BMP/constituent. *Computed using the BCa bootstrap method described by Efron and Tibishirani (1993). **Hypothesis testing in Attachment 3 shows statistically significant decreases for this BMP category.
International Stormwater BMP Database
Pollutant Category Statistical Summary Report Page 18 December 2014
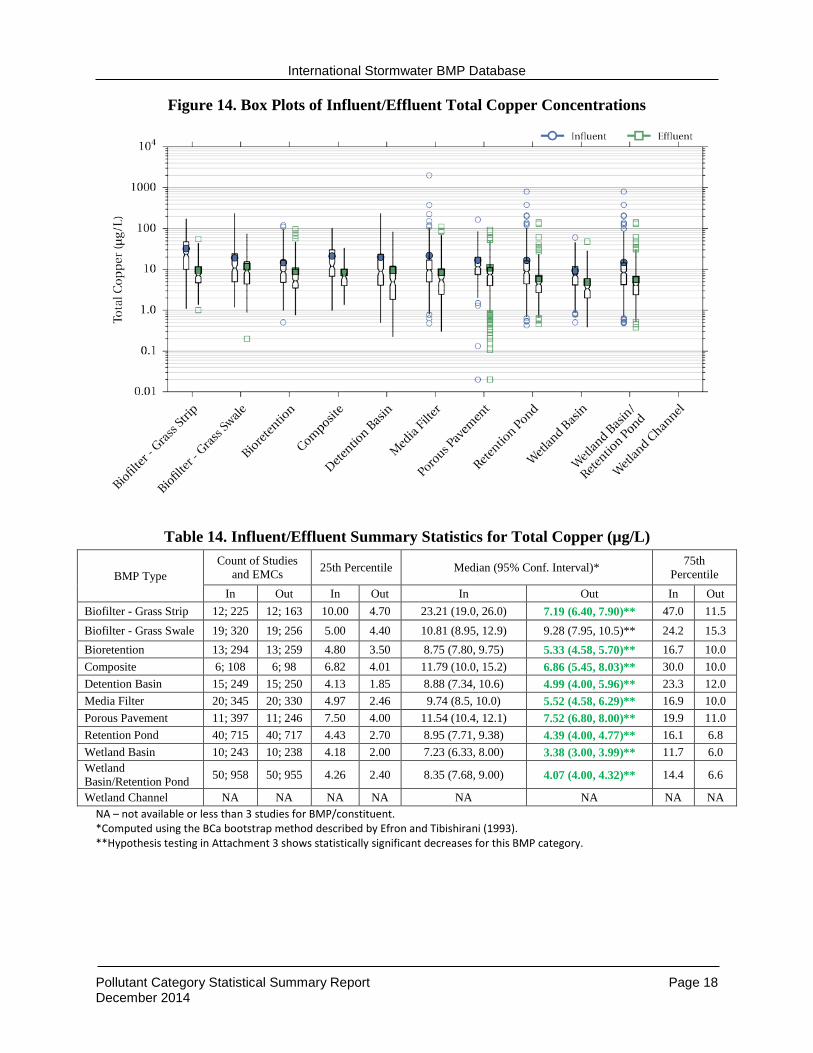
Figure 14. Box Plots of Influent/Effluent Total Copper Concentrations
Table 14. Influent/Effluent Summary Statistics for Total Copper (µg/L)
BMP Type Count of Studies
and EMCs 25th Percentile Median (95% Conf. Interval)* 75th Percentile
In Out In Out In Out In Out Biofilter - Grass Strip 12; 225 12; 163 10.00 4.70 23.21 (19.0, 26.0) 7.19 (6.40, 7.90)** 47.0 11.5 Biofilter - Grass Swale 19; 320 19; 256 5.00 4.40 10.81 (8.95, 12.9) 9.28 (7.95, 10.5)** 24.2 15.3 Bioretention 13; 294 13; 259 4.80 3.50 8.75 (7.80, 9.75) 5.33 (4.58, 5.70)** 16.7 10.0 Composite 6; 108 6; 98 6.82 4.01 11.79 (10.0, 15.2) 6.86 (5.45, 8.03)** 30.0 10.0 Detention Basin 15; 249 15; 250 4.13 1.85 8.88 (7.34, 10.6) 4.99 (4.00, 5.96)** 23.3 12.0 Media Filter 20; 345 20; 330 4.97 2.46 9.74 (8.5, 10.0) 5.52 (4.58, 6.29)** 16.9 10.0 Porous Pavement 11; 397 11; 246 7.50 4.00 11.54 (10.4, 12.1) 7.52 (6.80, 8.00)** 19.9 11.0 Retention Pond 40; 715 40; 717 4.43 2.70 8.95 (7.71, 9.38) 4.39 (4.00, 4.77)** 16.1 6.8 Wetland Basin 10; 243 10; 238 4.18 2.00 7.23 (6.33, 8.00) 3.38 (3.00, 3.99)** 11.7 6.0 Wetland Basin/Retention Pond 50; 958 50; 955 4.26 2.40 8.35 (7.68, 9.00) 4.07 (4.00, 4.32)** 14.4 6.6
Wetland Channel NA NA NA NA NA NA NA NA NA – not available or less than 3 studies for BMP/constituent. *Computed using the BCa bootstrap method described by Efron and Tibishirani (1993). **Hypothesis testing in Attachment 3 shows statistically significant decreases for this BMP category.
International Stormwater BMP Database
Pollutant Category Statistical Summary Report Page 19 December 2014
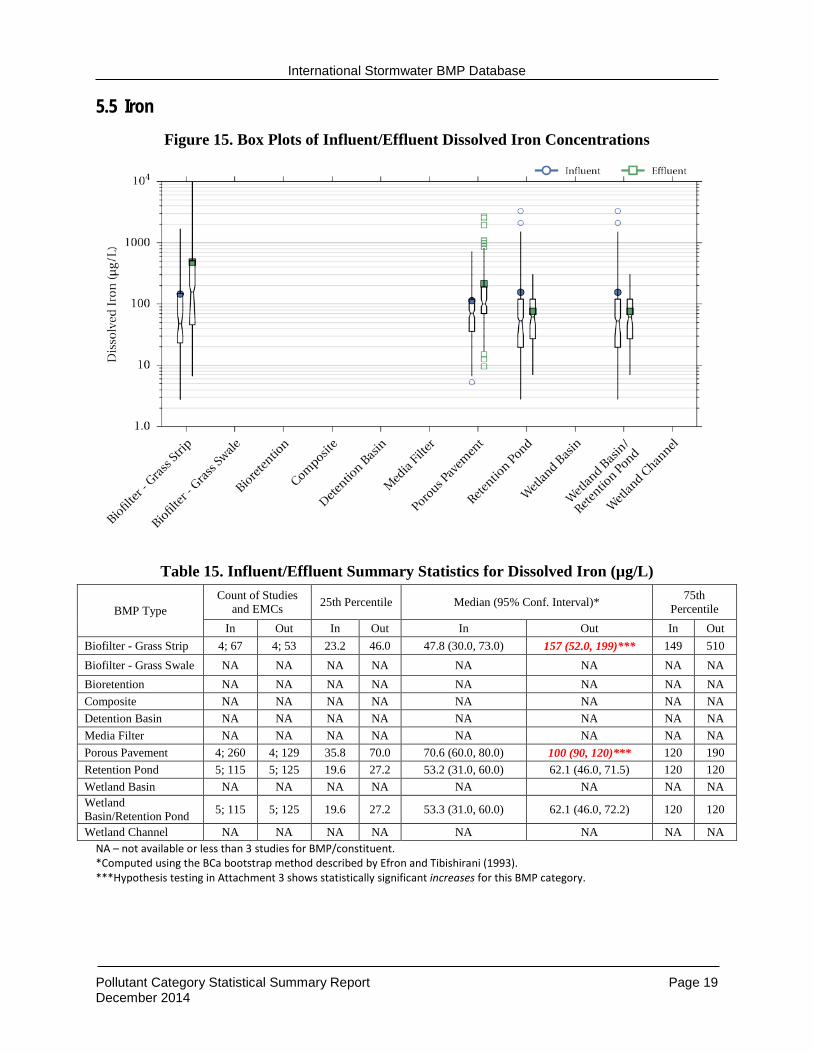
5.5 Iron Figure 15. Box Plots of Influent/Effluent Dissolved Iron Concentrations
Table 15. Influent/Effluent Summary Statistics for Dissolved Iron (µg/L)
BMP Type Count of Studies
and EMCs 25th Percentile Median (95% Conf. Interval)* 75th Percentile
In Out In Out In Out In Out Biofilter - Grass Strip 4; 67 4; 53 23.2 46.0 47.8 (30.0, 73.0) 157 (52.0, 199)*** 149 510 Biofilter - Grass Swale NA NA NA NA NA NA NA NA Bioretention NA NA NA NA NA NA NA NA Composite NA NA NA NA NA NA NA NA Detention Basin NA NA NA NA NA NA NA NA Media Filter NA NA NA NA NA NA NA NA Porous Pavement 4; 260 4; 129 35.8 70.0 70.6 (60.0, 80.0) 100 (90, 120)*** 120 190 Retention Pond 5; 115 5; 125 19.6 27.2 53.2 (31.0, 60.0) 62.1 (46.0, 71.5) 120 120 Wetland Basin NA NA NA NA NA NA NA NA Wetland Basin/Retention Pond 5; 115 5; 125 19.6 27.2 53.3 (31.0, 60.0) 62.1 (46.0, 72.2) 120 120
Wetland Channel NA NA NA NA NA NA NA NA NA – not available or less than 3 studies for BMP/constituent. *Computed using the BCa bootstrap method described by Efron and Tibishirani (1993). ***Hypothesis testing in Attachment 3 shows statistically significant increases for this BMP category.
International Stormwater BMP Database
Pollutant Category Statistical Summary Report Page 20 December 2014
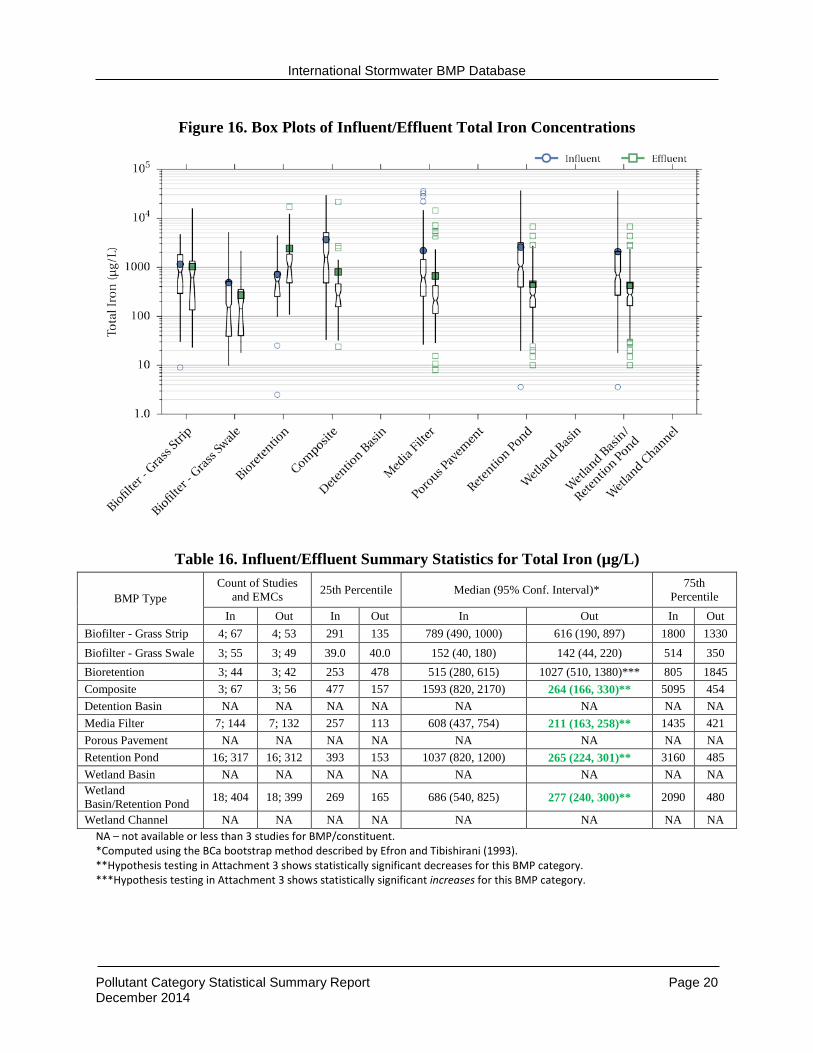
Figure 16. Box Plots of Influent/Effluent Total Iron Concentrations
Table 16. Influent/Effluent Summary Statistics for Total Iron (µg/L)
BMP Type Count of Studies
and EMCs 25th Percentile Median (95% Conf. Interval)* 75th Percentile
In Out In Out In Out In Out Biofilter - Grass Strip 4; 67 4; 53 291 135 789 (490, 1000) 616 (190, 897) 1800 1330 Biofilter - Grass Swale 3; 55 3; 49 39.0 40.0 152 (40, 180) 142 (44, 220) 514 350 Bioretention 3; 44 3; 42 253 478 515 (280, 615) 1027 (510, 1380)*** 805 1845 Composite 3; 67 3; 56 477 157 1593 (820, 2170) 264 (166, 330)** 5095 454 Detention Basin NA NA NA NA NA NA NA NA Media Filter 7; 144 7; 132 257 113 608 (437, 754) 211 (163, 258)** 1435 421 Porous Pavement NA NA NA NA NA NA NA NA Retention Pond 16; 317 16; 312 393 153 1037 (820, 1200) 265 (224, 301)** 3160 485 Wetland Basin NA NA NA NA NA NA NA NA Wetland Basin/Retention Pond 18; 404 18; 399 269 165 686 (540, 825) 277 (240, 300)** 2090 480
Wetland Channel NA NA NA NA NA NA NA NA NA – not available or less than 3 studies for BMP/constituent. *Computed using the BCa bootstrap method described by Efron and Tibishirani (1993). **Hypothesis testing in Attachment 3 shows statistically significant decreases for this BMP category. ***Hypothesis testing in Attachment 3 shows statistically significant increases for this BMP category.
International Stormwater BMP Database
Pollutant Category Statistical Summary Report Page 21 December 2014
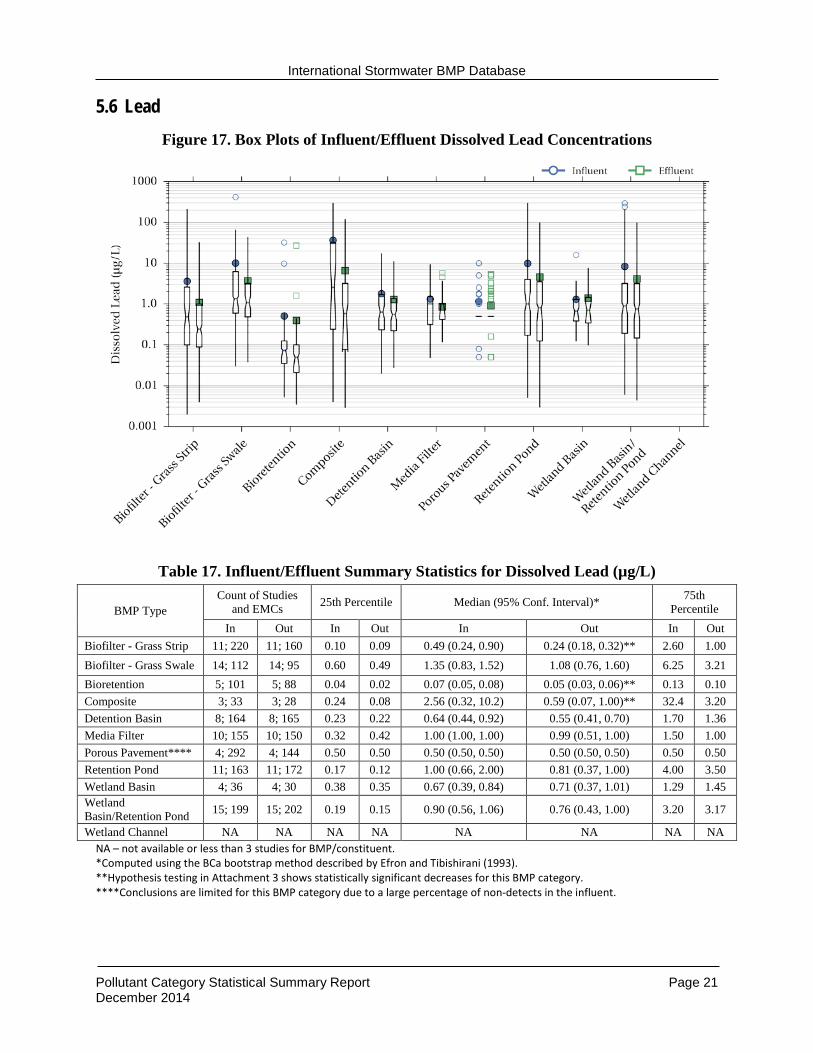
5.6 Lead Figure 17. Box Plots of Influent/Effluent Dissolved Lead Concentrations
Table 17. Influent/Effluent Summary Statistics for Dissolved Lead (µg/L)
BMP Type Count of Studies
and EMCs 25th Percentile Median (95% Conf. Interval)* 75th Percentile
In Out In Out In Out In Out Biofilter - Grass Strip 11; 220 11; 160 0.10 0.09 0.49 (0.24, 0.90) 0.24 (0.18, 0.32)** 2.60 1.00 Biofilter - Grass Swale 14; 112 14; 95 0.60 0.49 1.35 (0.83, 1.52) 1.08 (0.76, 1.60) 6.25 3.21 Bioretention 5; 101 5; 88 0.04 0.02 0.07 (0.05, 0.08) 0.05 (0.03, 0.06)** 0.13 0.10 Composite 3; 33 3; 28 0.24 0.08 2.56 (0.32, 10.2) 0.59 (0.07, 1.00)** 32.4 3.20 Detention Basin 8; 164 8; 165 0.23 0.22 0.64 (0.44, 0.92) 0.55 (0.41, 0.70) 1.70 1.36 Media Filter 10; 155 10; 150 0.32 0.42 1.00 (1.00, 1.00) 0.99 (0.51, 1.00) 1.50 1.00 Porous Pavement**** 4; 292 4; 144 0.50 0.50 0.50 (0.50, 0.50) 0.50 (0.50, 0.50) 0.50 0.50 Retention Pond 11; 163 11; 172 0.17 0.12 1.00 (0.66, 2.00) 0.81 (0.37, 1.00) 4.00 3.50 Wetland Basin 4; 36 4; 30 0.38 0.35 0.67 (0.39, 0.84) 0.71 (0.37, 1.01) 1.29 1.45 Wetland Basin/Retention Pond 15; 199 15; 202 0.19 0.15 0.90 (0.56, 1.06) 0.76 (0.43, 1.00) 3.20 3.17
Wetland Channel NA NA NA NA NA NA NA NA NA – not available or less than 3 studies for BMP/constituent. *Computed using the BCa bootstrap method described by Efron and Tibishirani (1993). **Hypothesis testing in Attachment 3 shows statistically significant decreases for this BMP category. ****Conclusions are limited for this BMP category due to a large percentage of non-detects in the influent.
International Stormwater BMP Database
Pollutant Category Statistical Summary Report Page 22 December 2014
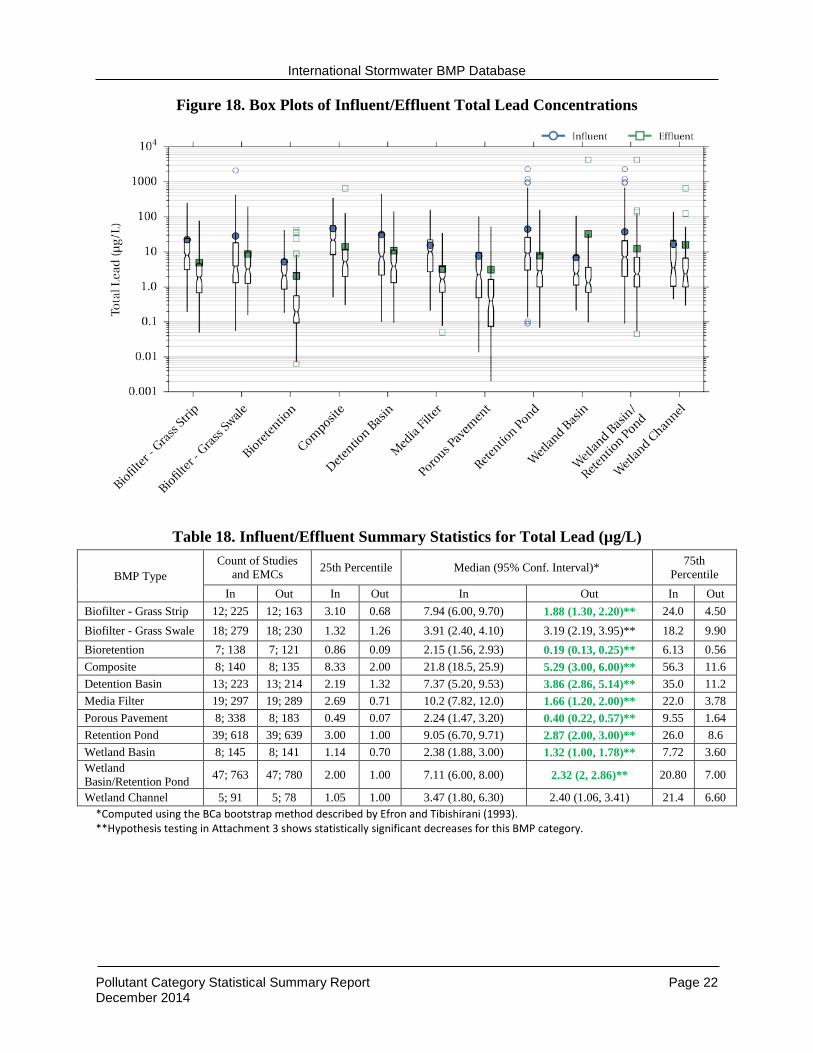
Figure 18. Box Plots of Influent/Effluent Total Lead Concentrations
Table 18. Influent/Effluent Summary Statistics for Total Lead (µg/L)
BMP Type Count of Studies
and EMCs 25th Percentile Median (95% Conf. Interval)* 75th Percentile
In Out In Out In Out In Out Biofilter - Grass Strip 12; 225 12; 163 3.10 0.68 7.94 (6.00, 9.70) 1.88 (1.30, 2.20)** 24.0 4.50 Biofilter - Grass Swale 18; 279 18; 230 1.32 1.26 3.91 (2.40, 4.10) 3.19 (2.19, 3.95)** 18.2 9.90 Bioretention 7; 138 7; 121 0.86 0.09 2.15 (1.56, 2.93) 0.19 (0.13, 0.25)** 6.13 0.56 Composite 8; 140 8; 135 8.33 2.00 21.8 (18.5, 25.9) 5.29 (3.00, 6.00)** 56.3 11.6 Detention Basin 13; 223 13; 214 2.19 1.32 7.37 (5.20, 9.53) 3.86 (2.86, 5.14)** 35.0 11.2 Media Filter 19; 297 19; 289 2.69 0.71 10.2 (7.82, 12.0) 1.66 (1.20, 2.00)** 22.0 3.78 Porous Pavement 8; 338 8; 183 0.49 0.07 2.24 (1.47, 3.20) 0.40 (0.22, 0.57)** 9.55 1.64 Retention Pond 39; 618 39; 639 3.00 1.00 9.05 (6.70, 9.71) 2.87 (2.00, 3.00)** 26.0 8.6 Wetland Basin 8; 145 8; 141 1.14 0.70 2.38 (1.88, 3.00) 1.32 (1.00, 1.78)** 7.72 3.60 Wetland Basin/Retention Pond 47; 763 47; 780 2.00 1.00 7.11 (6.00, 8.00) 2.32 (2, 2.86)** 20.80 7.00
Wetland Channel 5; 91 5; 78 1.05 1.00 3.47 (1.80, 6.30) 2.40 (1.06, 3.41) 21.4 6.60 *Computed using the BCa bootstrap method described by Efron and Tibishirani (1993). **Hypothesis testing in Attachment 3 shows statistically significant decreases for this BMP category.
International Stormwater BMP Database
Pollutant Category Statistical Summary Report Page 23 December 2014
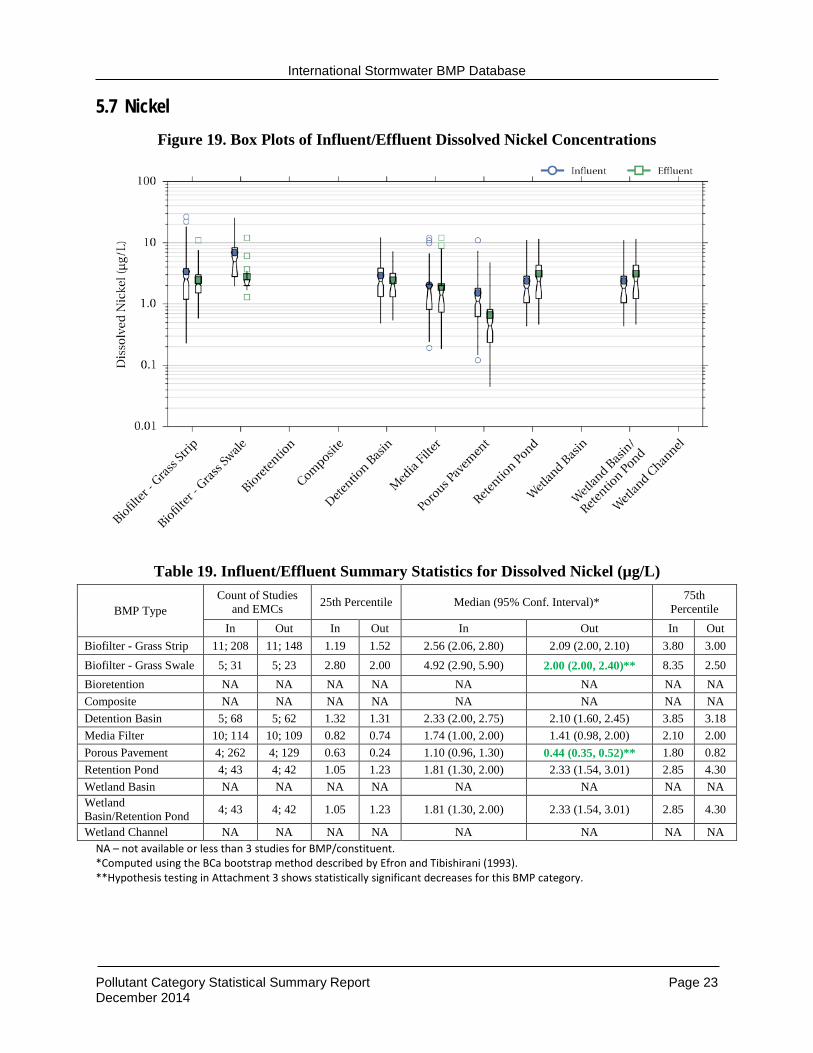
5.7 Nickel Figure 19. Box Plots of Influent/Effluent Dissolved Nickel Concentrations
Table 19. Influent/Effluent Summary Statistics for Dissolved Nickel (µg/L)
BMP Type Count of Studies
and EMCs 25th Percentile Median (95% Conf. Interval)* 75th Percentile
In Out In Out In Out In Out Biofilter - Grass Strip 11; 208 11; 148 1.19 1.52 2.56 (2.06, 2.80) 2.09 (2.00, 2.10) 3.80 3.00 Biofilter - Grass Swale 5; 31 5; 23 2.80 2.00 4.92 (2.90, 5.90) 2.00 (2.00, 2.40)** 8.35 2.50 Bioretention NA NA NA NA NA NA NA NA Composite NA NA NA NA NA NA NA NA Detention Basin 5; 68 5; 62 1.32 1.31 2.33 (2.00, 2.75) 2.10 (1.60, 2.45) 3.85 3.18 Media Filter 10; 114 10; 109 0.82 0.74 1.74 (1.00, 2.00) 1.41 (0.98, 2.00) 2.10 2.00 Porous Pavement 4; 262 4; 129 0.63 0.24 1.10 (0.96, 1.30) 0.44 (0.35, 0.52)** 1.80 0.82 Retention Pond 4; 43 4; 42 1.05 1.23 1.81 (1.30, 2.00) 2.33 (1.54, 3.01) 2.85 4.30 Wetland Basin NA NA NA NA NA NA NA NA Wetland Basin/Retention Pond 4; 43 4; 42 1.05 1.23 1.81 (1.30, 2.00) 2.33 (1.54, 3.01) 2.85 4.30
Wetland Channel NA NA NA NA NA NA NA NA NA – not available or less than 3 studies for BMP/constituent. *Computed using the BCa bootstrap method described by Efron and Tibishirani (1993). **Hypothesis testing in Attachment 3 shows statistically significant decreases for this BMP category.
International Stormwater BMP Database
Pollutant Category Statistical Summary Report Page 24 December 2014
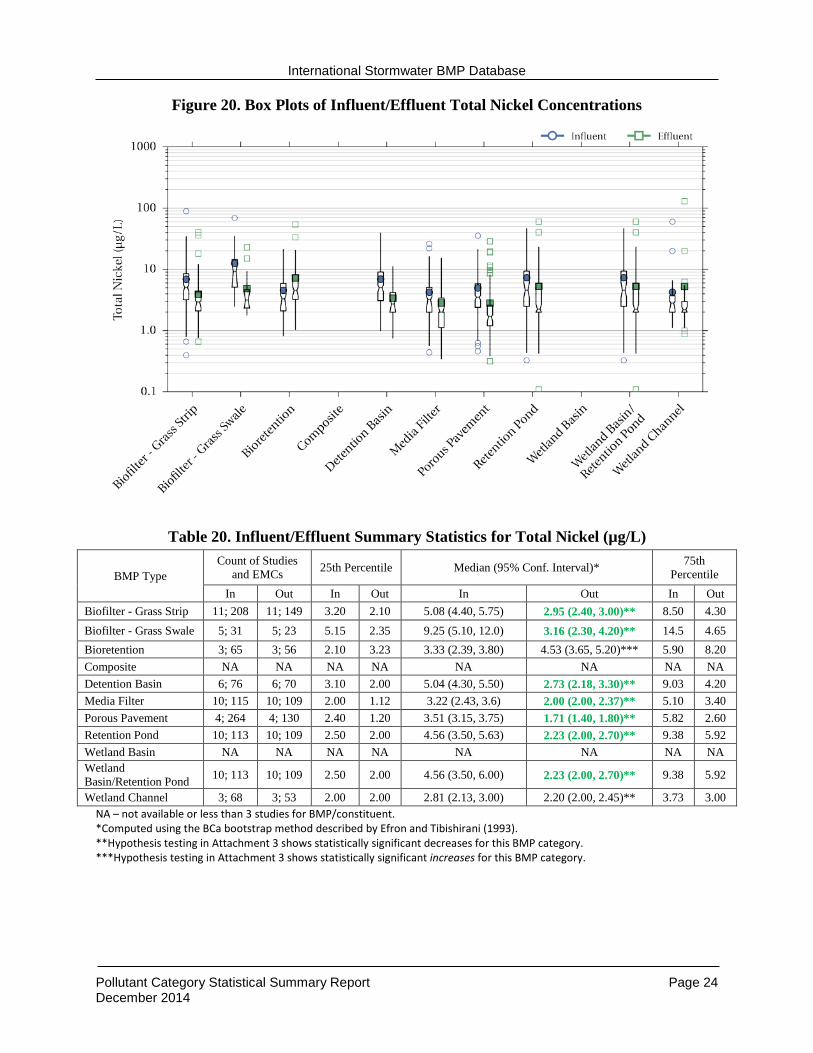
Figure 20. Box Plots of Influent/Effluent Total Nickel Concentrations
Table 20. Influent/Effluent Summary Statistics for Total Nickel (µg/L)
BMP Type Count of Studies
and EMCs 25th Percentile Median (95% Conf. Interval)* 75th Percentile
In Out In Out In Out In Out Biofilter - Grass Strip 11; 208 11; 149 3.20 2.10 5.08 (4.40, 5.75) 2.95 (2.40, 3.00)** 8.50 4.30 Biofilter - Grass Swale 5; 31 5; 23 5.15 2.35 9.25 (5.10, 12.0) 3.16 (2.30, 4.20)** 14.5 4.65 Bioretention 3; 65 3; 56 2.10 3.23 3.33 (2.39, 3.80) 4.53 (3.65, 5.20)*** 5.90 8.20 Composite NA NA NA NA NA NA NA NA Detention Basin 6; 76 6; 70 3.10 2.00 5.04 (4.30, 5.50) 2.73 (2.18, 3.30)** 9.03 4.20 Media Filter 10; 115 10; 109 2.00 1.12 3.22 (2.43, 3.6) 2.00 (2.00, 2.37)** 5.10 3.40 Porous Pavement 4; 264 4; 130 2.40 1.20 3.51 (3.15, 3.75) 1.71 (1.40, 1.80)** 5.82 2.60 Retention Pond 10; 113 10; 109 2.50 2.00 4.56 (3.50, 5.63) 2.23 (2.00, 2.70)** 9.38 5.92 Wetland Basin NA NA NA NA NA NA NA NA Wetland Basin/Retention Pond 10; 113 10; 109 2.50 2.00 4.56 (3.50, 6.00) 2.23 (2.00, 2.70)** 9.38 5.92
Wetland Channel 3; 68 3; 53 2.00 2.00 2.81 (2.13, 3.00) 2.20 (2.00, 2.45)** 3.73 3.00 NA – not available or less than 3 studies for BMP/constituent. *Computed using the BCa bootstrap method described by Efron and Tibishirani (1993). **Hypothesis testing in Attachment 3 shows statistically significant decreases for this BMP category. ***Hypothesis testing in Attachment 3 shows statistically significant increases for this BMP category.
International Stormwater BMP Database
Pollutant Category Statistical Summary Report Page 25 December 2014
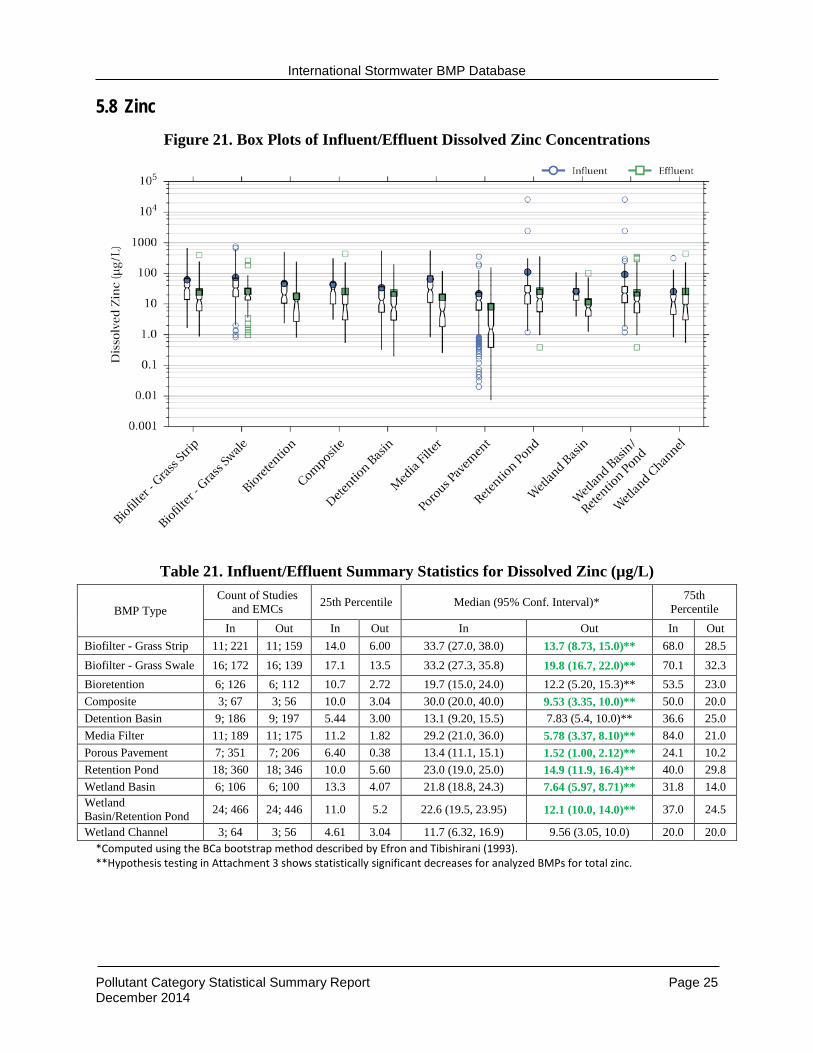
5.8 Zinc Figure 21. Box Plots of Influent/Effluent Dissolved Zinc Concentrations
Table 21. Influent/Effluent Summary Statistics for Dissolved Zinc (µg/L)
BMP Type Count of Studies
and EMCs 25th Percentile Median (95% Conf. Interval)* 75th Percentile
In Out In Out In Out In Out Biofilter - Grass Strip 11; 221 11; 159 14.0 6.00 33.7 (27.0, 38.0) 13.7 (8.73, 15.0)** 68.0 28.5 Biofilter - Grass Swale 16; 172 16; 139 17.1 13.5 33.2 (27.3, 35.8) 19.8 (16.7, 22.0)** 70.1 32.3 Bioretention 6; 126 6; 112 10.7 2.72 19.7 (15.0, 24.0) 12.2 (5.20, 15.3)** 53.5 23.0 Composite 3; 67 3; 56 10.0 3.04 30.0 (20.0, 40.0) 9.53 (3.35, 10.0)** 50.0 20.0 Detention Basin 9; 186 9; 197 5.44 3.00 13.1 (9.20, 15.5) 7.83 (5.4, 10.0)** 36.6 25.0 Media Filter 11; 189 11; 175 11.2 1.82 29.2 (21.0, 36.0) 5.78 (3.37, 8.10)** 84.0 21.0 Porous Pavement 7; 351 7; 206 6.40 0.38 13.4 (11.1, 15.1) 1.52 (1.00, 2.12)** 24.1 10.2 Retention Pond 18; 360 18; 346 10.0 5.60 23.0 (19.0, 25.0) 14.9 (11.9, 16.4)** 40.0 29.8 Wetland Basin 6; 106 6; 100 13.3 4.07 21.8 (18.8, 24.3) 7.64 (5.97, 8.71)** 31.8 14.0 Wetland Basin/Retention Pond 24; 466 24; 446 11.0 5.2 22.6 (19.5, 23.95) 12.1 (10.0, 14.0)** 37.0 24.5
Wetland Channel 3; 64 3; 56 4.61 3.04 11.7 (6.32, 16.9) 9.56 (3.05, 10.0) 20.0 20.0 *Computed using the BCa bootstrap method described by Efron and Tibishirani (1993). **Hypothesis testing in Attachment 3 shows statistically significant decreases for analyzed BMPs for total zinc.
International Stormwater BMP Database
Pollutant Category Statistical Summary Report Page 26 December 2014
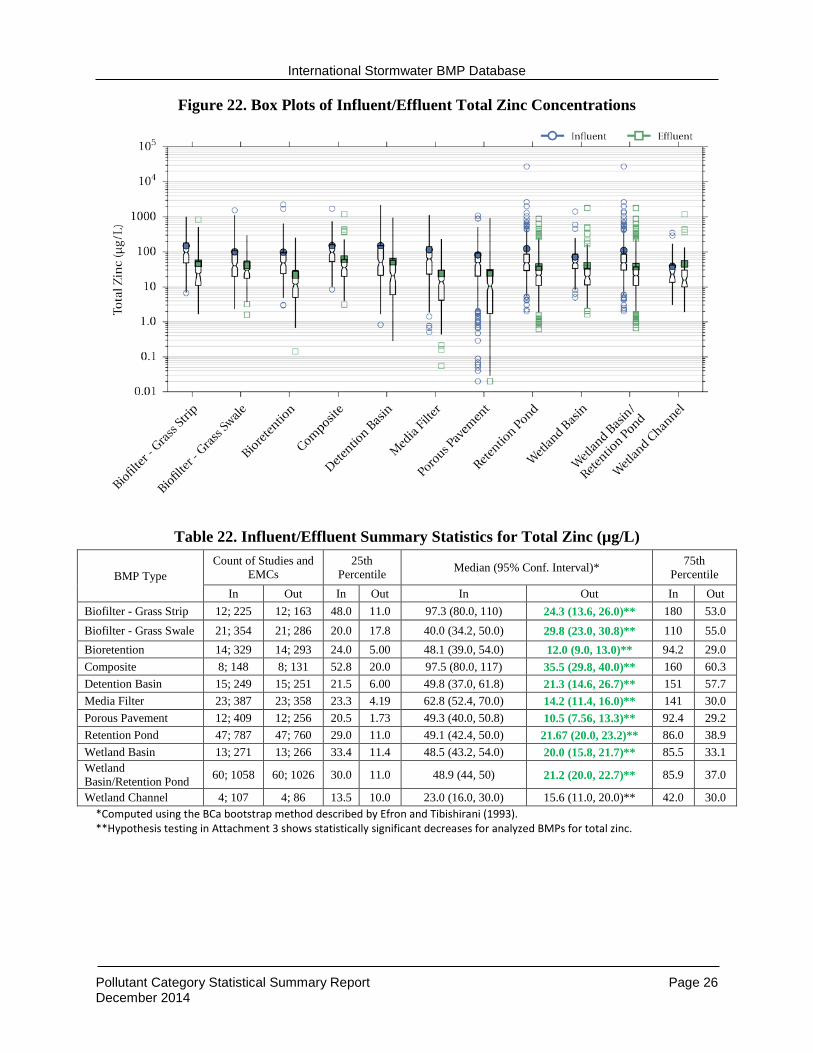
Figure 22. Box Plots of Influent/Effluent Total Zinc Concentrations
Table 22. Influent/Effluent Summary Statistics for Total Zinc (µg/L)
BMP Type Count of Studies and
EMCs 25th
Percentile Median (95% Conf. Interval)* 75th Percentile
In Out In Out In Out In Out Biofilter - Grass Strip 12; 225 12; 163 48.0 11.0 97.3 (80.0, 110) 24.3 (13.6, 26.0)** 180 53.0 Biofilter - Grass Swale 21; 354 21; 286 20.0 17.8 40.0 (34.2, 50.0) 29.8 (23.0, 30.8)** 110 55.0 Bioretention 14; 329 14; 293 24.0 5.00 48.1 (39.0, 54.0) 12.0 (9.0, 13.0)** 94.2 29.0 Composite 8; 148 8; 131 52.8 20.0 97.5 (80.0, 117) 35.5 (29.8, 40.0)** 160 60.3 Detention Basin 15; 249 15; 251 21.5 6.00 49.8 (37.0, 61.8) 21.3 (14.6, 26.7)** 151 57.7 Media Filter 23; 387 23; 358 23.3 4.19 62.8 (52.4, 70.0) 14.2 (11.4, 16.0)** 141 30.0 Porous Pavement 12; 409 12; 256 20.5 1.73 49.3 (40.0, 50.8) 10.5 (7.56, 13.3)** 92.4 29.2 Retention Pond 47; 787 47; 760 29.0 11.0 49.1 (42.4, 50.0) 21.67 (20.0, 23.2)** 86.0 38.9 Wetland Basin 13; 271 13; 266 33.4 11.4 48.5 (43.2, 54.0) 20.0 (15.8, 21.7)** 85.5 33.1 Wetland Basin/Retention Pond 60; 1058 60; 1026 30.0 11.0 48.9 (44, 50) 21.2 (20.0, 22.7)** 85.9 37.0
Wetland Channel 4; 107 4; 86 13.5 10.0 23.0 (16.0, 30.0) 15.6 (11.0, 20.0)** 42.0 30.0 *Computed using the BCa bootstrap method described by Efron and Tibishirani (1993). **Hypothesis testing in Attachment 3 shows statistically significant decreases for analyzed BMPs for total zinc.
International Stormwater BMP Database
Pollutant Category Statistical Summary Report Page 27 December 2014
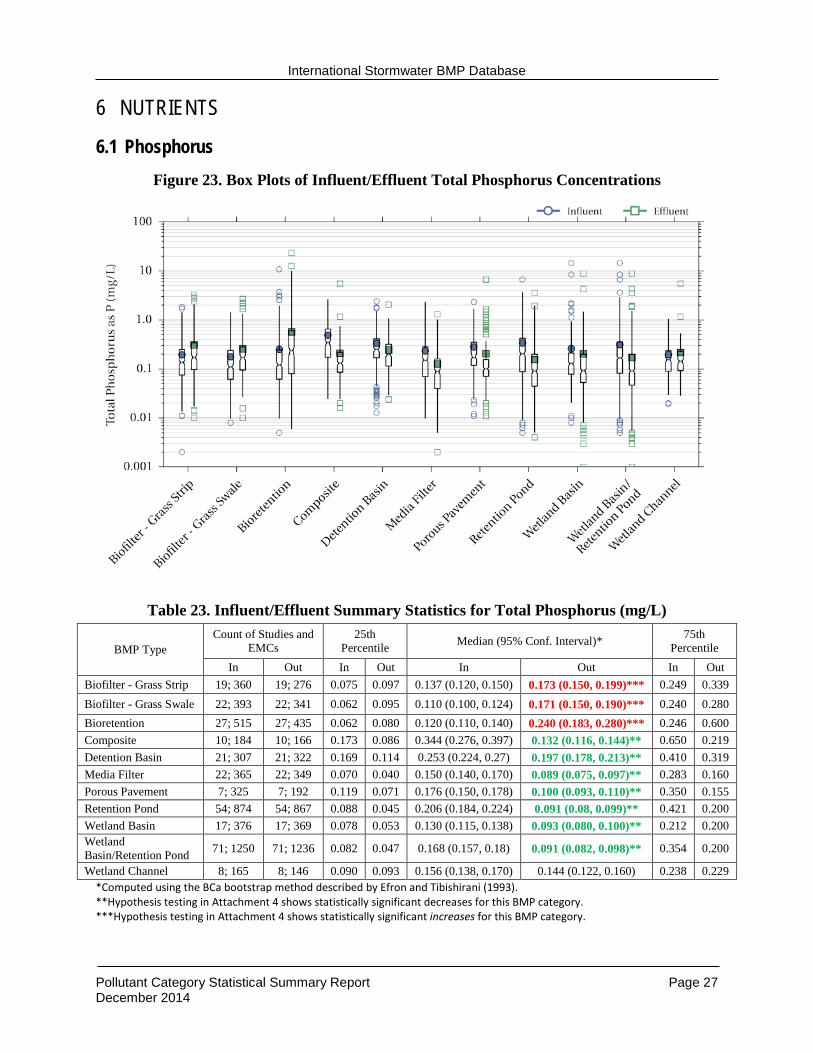
6 NUTRIENTS
6.1 Phosphorus Figure 23. Box Plots of Influent/Effluent Total Phosphorus Concentrations
Table 23. Influent/Effluent Summary Statistics for Total Phosphorus (mg/L)
BMP Type Count of Studies and
EMCs 25th
Percentile Median (95% Conf. Interval)* 75th Percentile
In Out In Out In Out In Out Biofilter - Grass Strip 19; 360 19; 276 0.075 0.097 0.137 (0.120, 0.150) 0.173 (0.150, 0.199)*** 0.249 0.339 Biofilter - Grass Swale 22; 393 22; 341 0.062 0.095 0.110 (0.100, 0.124) 0.171 (0.150, 0.190)*** 0.240 0.280 Bioretention 27; 515 27; 435 0.062 0.080 0.120 (0.110, 0.140) 0.240 (0.183, 0.280)*** 0.246 0.600 Composite 10; 184 10; 166 0.173 0.086 0.344 (0.276, 0.397) 0.132 (0.116, 0.144)** 0.650 0.219 Detention Basin 21; 307 21; 322 0.169 0.114 0.253 (0.224, 0.27) 0.197 (0.178, 0.213)** 0.410 0.319 Media Filter 22; 365 22; 349 0.070 0.040 0.150 (0.140, 0.170) 0.089 (0.075, 0.097)** 0.283 0.160 Porous Pavement 7; 325 7; 192 0.119 0.071 0.176 (0.150, 0.178) 0.100 (0.093, 0.110)** 0.350 0.155 Retention Pond 54; 874 54; 867 0.088 0.045 0.206 (0.184, 0.224) 0.091 (0.08, 0.099)** 0.421 0.200 Wetland Basin 17; 376 17; 369 0.078 0.053 0.130 (0.115, 0.138) 0.093 (0.080, 0.100)** 0.212 0.200 Wetland Basin/Retention Pond 71; 1250 71; 1236 0.082 0.047 0.168 (0.157, 0.18) 0.091 (0.082, 0.098)** 0.354 0.200
Wetland Channel 8; 165 8; 146 0.090 0.093 0.156 (0.138, 0.170) 0.144 (0.122, 0.160) 0.238 0.229 *Computed using the BCa bootstrap method described by Efron and Tibishirani (1993). **Hypothesis testing in Attachment 4 shows statistically significant decreases for this BMP category. ***Hypothesis testing in Attachment 4 shows statistically significant increases for this BMP category.
International Stormwater BMP Database
Pollutant Category Statistical Summary Report Page 28 December 2014
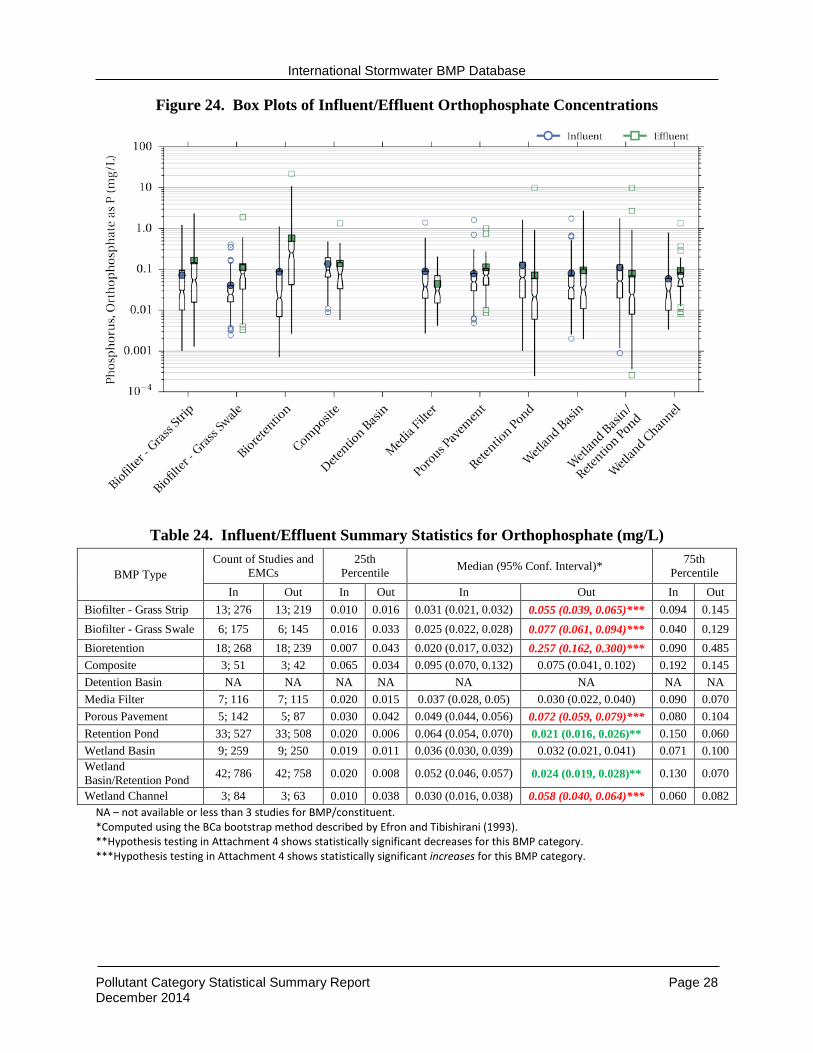
Figure 24. Box Plots of Influent/Effluent Orthophosphate Concentrations
Table 24. Influent/Effluent Summary Statistics for Orthophosphate (mg/L)
BMP Type Count of Studies and
EMCs 25th
Percentile Median (95% Conf. Interval)* 75th Percentile
In Out In Out In Out In Out Biofilter - Grass Strip 13; 276 13; 219 0.010 0.016 0.031 (0.021, 0.032) 0.055 (0.039, 0.065)*** 0.094 0.145 Biofilter - Grass Swale 6; 175 6; 145 0.016 0.033 0.025 (0.022, 0.028) 0.077 (0.061, 0.094)*** 0.040 0.129 Bioretention 18; 268 18; 239 0.007 0.043 0.020 (0.017, 0.032) 0.257 (0.162, 0.300)*** 0.090 0.485 Composite 3; 51 3; 42 0.065 0.034 0.095 (0.070, 0.132) 0.075 (0.041, 0.102) 0.192 0.145 Detention Basin NA NA NA NA NA NA NA NA Media Filter 7; 116 7; 115 0.020 0.015 0.037 (0.028, 0.05) 0.030 (0.022, 0.040) 0.090 0.070 Porous Pavement 5; 142 5; 87 0.030 0.042 0.049 (0.044, 0.056) 0.072 (0.059, 0.079)*** 0.080 0.104 Retention Pond 33; 527 33; 508 0.020 0.006 0.064 (0.054, 0.070) 0.021 (0.016, 0.026)** 0.150 0.060 Wetland Basin 9; 259 9; 250 0.019 0.011 0.036 (0.030, 0.039) 0.032 (0.021, 0.041) 0.071 0.100 Wetland Basin/Retention Pond 42; 786 42; 758 0.020 0.008 0.052 (0.046, 0.057) 0.024 (0.019, 0.028)** 0.130 0.070
Wetland Channel 3; 84 3; 63 0.010 0.038 0.030 (0.016, 0.038) 0.058 (0.040, 0.064)*** 0.060 0.082 NA – not available or less than 3 studies for BMP/constituent. *Computed using the BCa bootstrap method described by Efron and Tibishirani (1993). **Hypothesis testing in Attachment 4 shows statistically significant decreases for this BMP category. ***Hypothesis testing in Attachment 4 shows statistically significant increases for this BMP category.
International Stormwater BMP Database
Pollutant Category Statistical Summary Report Page 29 December 2014
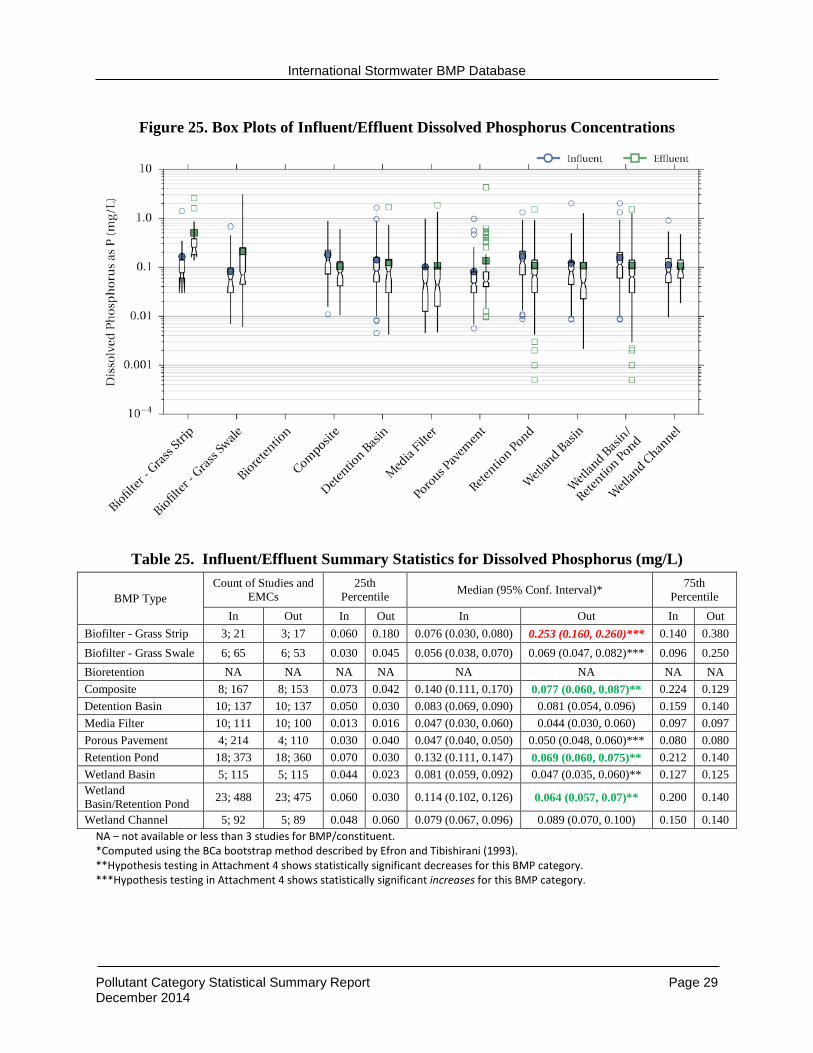
Figure 25. Box Plots of Influent/Effluent Dissolved Phosphorus Concentrations
Table 25. Influent/Effluent Summary Statistics for Dissolved Phosphorus (mg/L)
BMP Type Count of Studies and
EMCs 25th
Percentile Median (95% Conf. Interval)* 75th Percentile
In Out In Out In Out In Out Biofilter - Grass Strip 3; 21 3; 17 0.060 0.180 0.076 (0.030, 0.080) 0.253 (0.160, 0.260)*** 0.140 0.380 Biofilter - Grass Swale 6; 65 6; 53 0.030 0.045 0.056 (0.038, 0.070) 0.069 (0.047, 0.082)*** 0.096 0.250 Bioretention NA NA NA NA NA NA NA NA Composite 8; 167 8; 153 0.073 0.042 0.140 (0.111, 0.170) 0.077 (0.060, 0.087)** 0.224 0.129 Detention Basin 10; 137 10; 137 0.050 0.030 0.083 (0.069, 0.090) 0.081 (0.054, 0.096) 0.159 0.140 Media Filter 10; 111 10; 100 0.013 0.016 0.047 (0.030, 0.060) 0.044 (0.030, 0.060) 0.097 0.097 Porous Pavement 4; 214 4; 110 0.030 0.040 0.047 (0.040, 0.050) 0.050 (0.048, 0.060)*** 0.080 0.080 Retention Pond 18; 373 18; 360 0.070 0.030 0.132 (0.111, 0.147) 0.069 (0.060, 0.075)** 0.212 0.140 Wetland Basin 5; 115 5; 115 0.044 0.023 0.081 (0.059, 0.092) 0.047 (0.035, 0.060)** 0.127 0.125 Wetland Basin/Retention Pond 23; 488 23; 475 0.060 0.030 0.114 (0.102, 0.126) 0.064 (0.057, 0.07)** 0.200 0.140
Wetland Channel 5; 92 5; 89 0.048 0.060 0.079 (0.067, 0.096) 0.089 (0.070, 0.100) 0.150 0.140 NA – not available or less than 3 studies for BMP/constituent. *Computed using the BCa bootstrap method described by Efron and Tibishirani (1993). **Hypothesis testing in Attachment 4 shows statistically significant decreases for this BMP category. ***Hypothesis testing in Attachment 4 shows statistically significant increases for this BMP category.
International Stormwater BMP Database
Pollutant Category Statistical Summary Report Page 30 December 2014
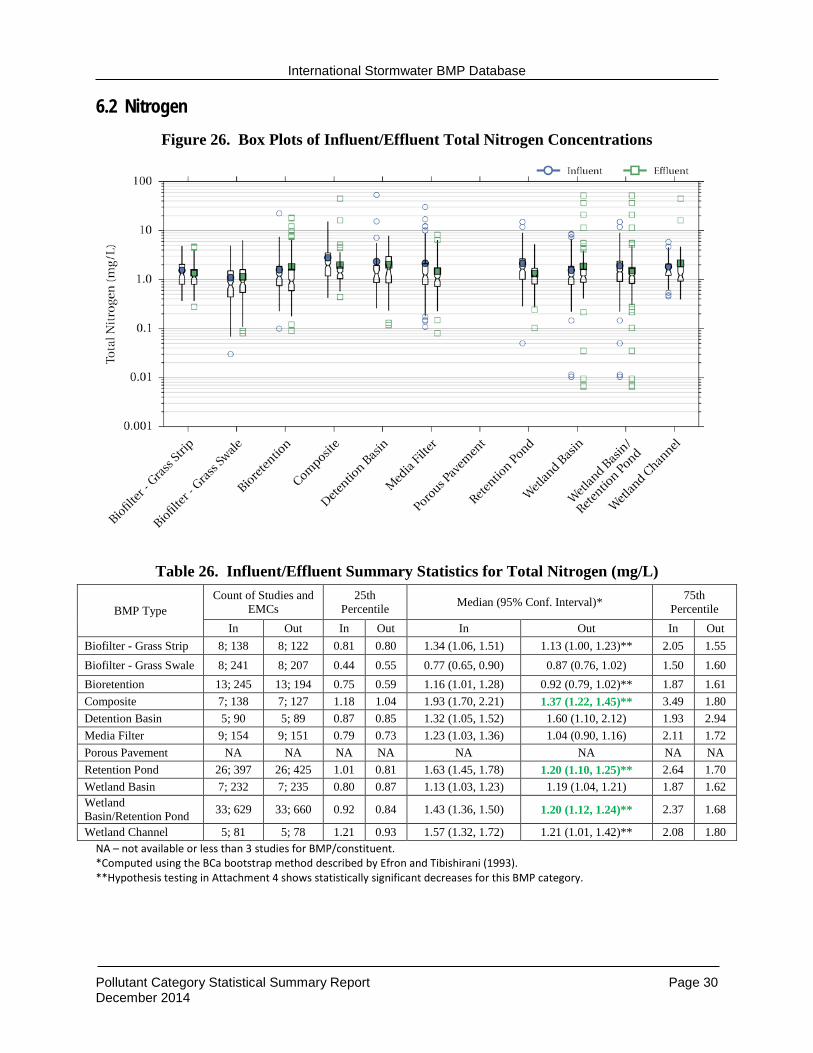
6.2 Nitrogen Figure 26. Box Plots of Influent/Effluent Total Nitrogen Concentrations
Table 26. Influent/Effluent Summary Statistics for Total Nitrogen (mg/L)
BMP Type Count of Studies and
EMCs 25th
Percentile Median (95% Conf. Interval)* 75th Percentile
In Out In Out In Out In Out Biofilter - Grass Strip 8; 138 8; 122 0.81 0.80 1.34 (1.06, 1.51) 1.13 (1.00, 1.23)** 2.05 1.55 Biofilter - Grass Swale 8; 241 8; 207 0.44 0.55 0.77 (0.65, 0.90) 0.87 (0.76, 1.02) 1.50 1.60 Bioretention 13; 245 13; 194 0.75 0.59 1.16 (1.01, 1.28) 0.92 (0.79, 1.02)** 1.87 1.61 Composite 7; 138 7; 127 1.18 1.04 1.93 (1.70, 2.21) 1.37 (1.22, 1.45)** 3.49 1.80 Detention Basin 5; 90 5; 89 0.87 0.85 1.32 (1.05, 1.52) 1.60 (1.10, 2.12) 1.93 2.94 Media Filter 9; 154 9; 151 0.79 0.73 1.23 (1.03, 1.36) 1.04 (0.90, 1.16) 2.11 1.72 Porous Pavement NA NA NA NA NA NA NA NA Retention Pond 26; 397 26; 425 1.01 0.81 1.63 (1.45, 1.78) 1.20 (1.10, 1.25)** 2.64 1.70 Wetland Basin 7; 232 7; 235 0.80 0.87 1.13 (1.03, 1.23) 1.19 (1.04, 1.21) 1.87 1.62 Wetland Basin/Retention Pond 33; 629 33; 660 0.92 0.84 1.43 (1.36, 1.50) 1.20 (1.12, 1.24)** 2.37 1.68
Wetland Channel 5; 81 5; 78 1.21 0.93 1.57 (1.32, 1.72) 1.21 (1.01, 1.42)** 2.08 1.80 NA – not available or less than 3 studies for BMP/constituent. *Computed using the BCa bootstrap method described by Efron and Tibishirani (1993). **Hypothesis testing in Attachment 4 shows statistically significant decreases for this BMP category.
International Stormwater BMP Database
Pollutant Category Statistical Summary Report Page 31 December 2014
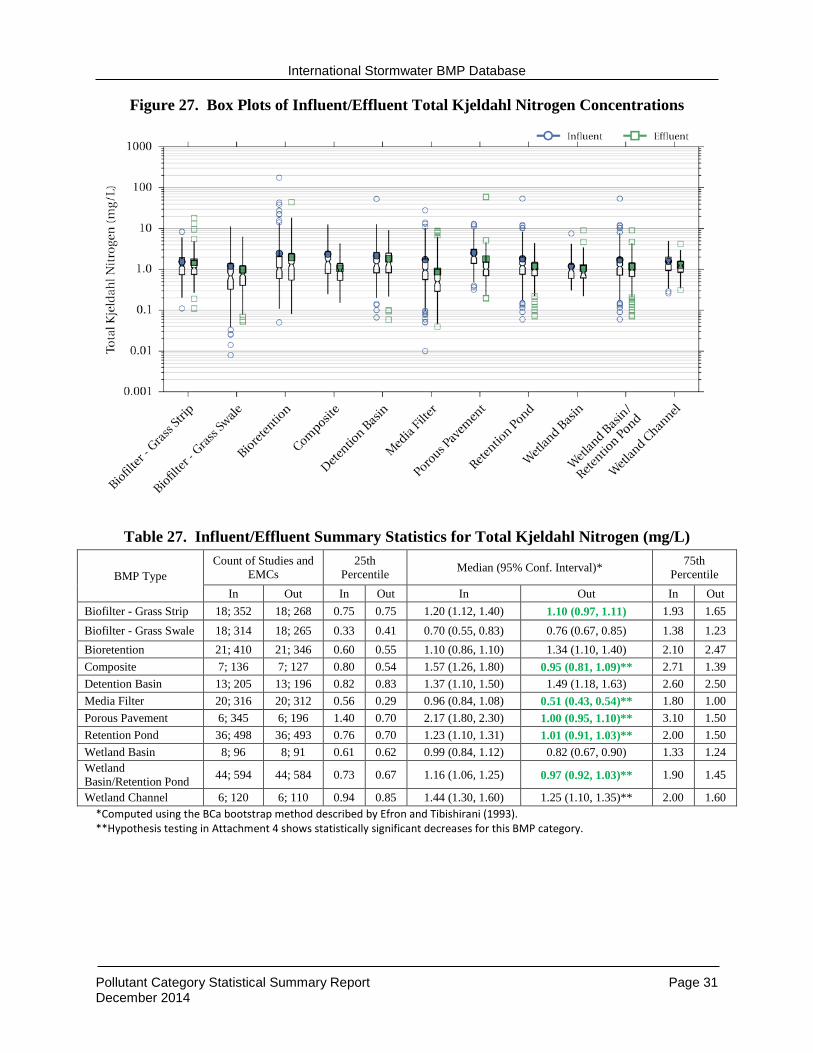
Figure 27. Box Plots of Influent/Effluent Total Kjeldahl Nitrogen Concentrations
Table 27. Influent/Effluent Summary Statistics for Total Kjeldahl Nitrogen (mg/L)
BMP Type Count of Studies and
EMCs 25th
Percentile Median (95% Conf. Interval)* 75th Percentile
In Out In Out In Out In Out Biofilter - Grass Strip 18; 352 18; 268 0.75 0.75 1.20 (1.12, 1.40) 1.10 (0.97, 1.11) 1.93 1.65 Biofilter - Grass Swale 18; 314 18; 265 0.33 0.41 0.70 (0.55, 0.83) 0.76 (0.67, 0.85) 1.38 1.23 Bioretention 21; 410 21; 346 0.60 0.55 1.10 (0.86, 1.10) 1.34 (1.10, 1.40) 2.10 2.47 Composite 7; 136 7; 127 0.80 0.54 1.57 (1.26, 1.80) 0.95 (0.81, 1.09)** 2.71 1.39 Detention Basin 13; 205 13; 196 0.82 0.83 1.37 (1.10, 1.50) 1.49 (1.18, 1.63) 2.60 2.50 Media Filter 20; 316 20; 312 0.56 0.29 0.96 (0.84, 1.08) 0.51 (0.43, 0.54)** 1.80 1.00 Porous Pavement 6; 345 6; 196 1.40 0.70 2.17 (1.80, 2.30) 1.00 (0.95, 1.10)** 3.10 1.50 Retention Pond 36; 498 36; 493 0.76 0.70 1.23 (1.10, 1.31) 1.01 (0.91, 1.03)** 2.00 1.50 Wetland Basin 8; 96 8; 91 0.61 0.62 0.99 (0.84, 1.12) 0.82 (0.67, 0.90) 1.33 1.24 Wetland Basin/Retention Pond 44; 594 44; 584 0.73 0.67 1.16 (1.06, 1.25) 0.97 (0.92, 1.03)** 1.90 1.45
Wetland Channel 6; 120 6; 110 0.94 0.85 1.44 (1.30, 1.60) 1.25 (1.10, 1.35)** 2.00 1.60 *Computed using the BCa bootstrap method described by Efron and Tibishirani (1993). **Hypothesis testing in Attachment 4 shows statistically significant decreases for this BMP category.
International Stormwater BMP Database
Pollutant Category Statistical Summary Report Page 32 December 2014
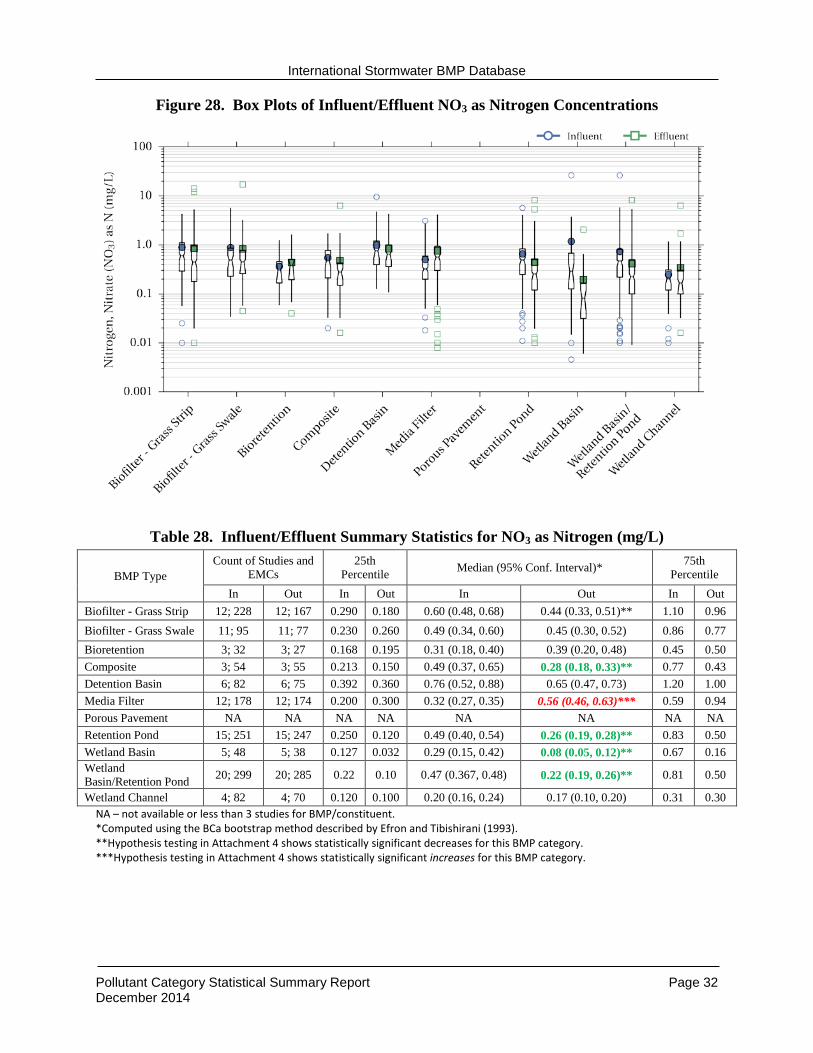
Figure 28. Box Plots of Influent/Effluent NO3 as Nitrogen Concentrations
Table 28. Influent/Effluent Summary Statistics for NO3 as Nitrogen (mg/L)
BMP Type Count of Studies and
EMCs 25th
Percentile Median (95% Conf. Interval)* 75th Percentile
In Out In Out In Out In Out Biofilter - Grass Strip 12; 228 12; 167 0.290 0.180 0.60 (0.48, 0.68) 0.44 (0.33, 0.51)** 1.10 0.96 Biofilter - Grass Swale 11; 95 11; 77 0.230 0.260 0.49 (0.34, 0.60) 0.45 (0.30, 0.52) 0.86 0.77 Bioretention 3; 32 3; 27 0.168 0.195 0.31 (0.18, 0.40) 0.39 (0.20, 0.48) 0.45 0.50 Composite 3; 54 3; 55 0.213 0.150 0.49 (0.37, 0.65) 0.28 (0.18, 0.33)** 0.77 0.43 Detention Basin 6; 82 6; 75 0.392 0.360 0.76 (0.52, 0.88) 0.65 (0.47, 0.73) 1.20 1.00 Media Filter 12; 178 12; 174 0.200 0.300 0.32 (0.27, 0.35) 0.56 (0.46, 0.63)*** 0.59 0.94 Porous Pavement NA NA NA NA NA NA NA NA Retention Pond 15; 251 15; 247 0.250 0.120 0.49 (0.40, 0.54) 0.26 (0.19, 0.28)** 0.83 0.50 Wetland Basin 5; 48 5; 38 0.127 0.032 0.29 (0.15, 0.42) 0.08 (0.05, 0.12)** 0.67 0.16 Wetland Basin/Retention Pond 20; 299 20; 285 0.22 0.10 0.47 (0.367, 0.48) 0.22 (0.19, 0.26)** 0.81 0.50
Wetland Channel 4; 82 4; 70 0.120 0.100 0.20 (0.16, 0.24) 0.17 (0.10, 0.20) 0.31 0.30 NA – not available or less than 3 studies for BMP/constituent. *Computed using the BCa bootstrap method described by Efron and Tibishirani (1993). **Hypothesis testing in Attachment 4 shows statistically significant decreases for this BMP category. ***Hypothesis testing in Attachment 4 shows statistically significant increases for this BMP category.
International Stormwater BMP Database
Pollutant Category Statistical Summary Report Page 33 December 2014
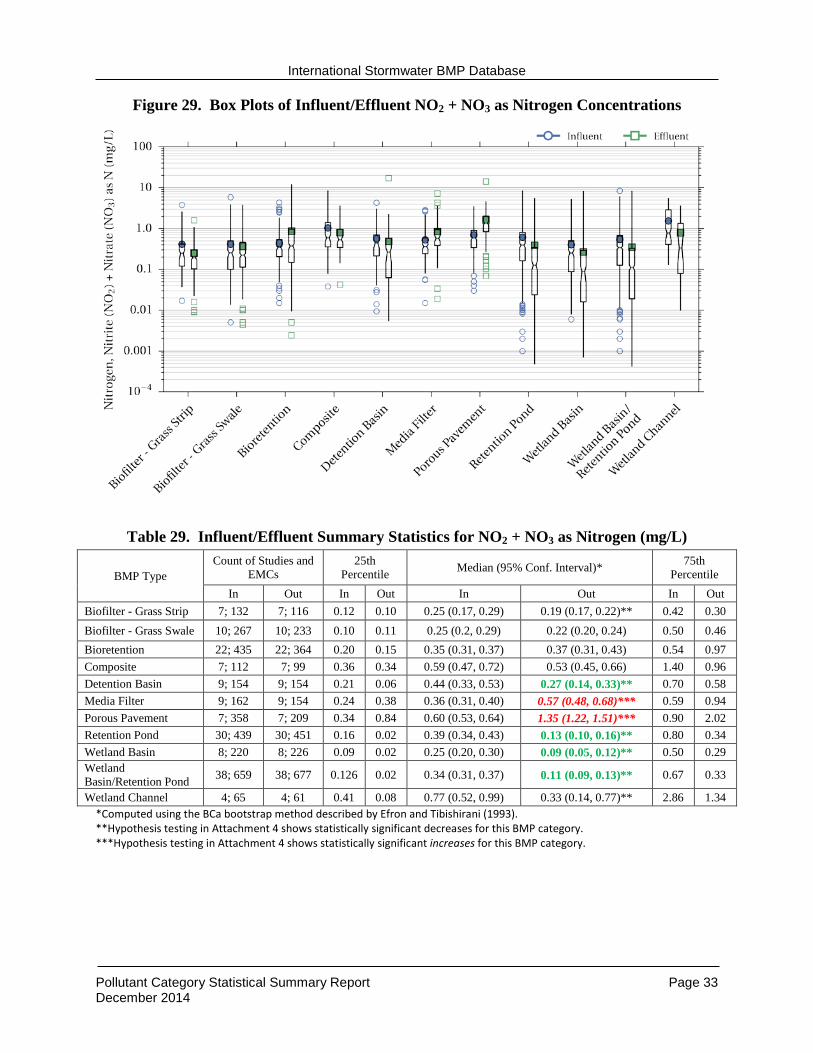
Figure 29. Box Plots of Influent/Effluent NO2 + NO3 as Nitrogen Concentrations
Table 29. Influent/Effluent Summary Statistics for NO2 + NO3 as Nitrogen (mg/L)
BMP Type Count of Studies and
EMCs 25th
Percentile Median (95% Conf. Interval)* 75th Percentile
In Out In Out In Out In Out Biofilter - Grass Strip 7; 132 7; 116 0.12 0.10 0.25 (0.17, 0.29) 0.19 (0.17, 0.22)** 0.42 0.30 Biofilter - Grass Swale 10; 267 10; 233 0.10 0.11 0.25 (0.2, 0.29) 0.22 (0.20, 0.24) 0.50 0.46 Bioretention 22; 435 22; 364 0.20 0.15 0.35 (0.31, 0.37) 0.37 (0.31, 0.43) 0.54 0.97 Composite 7; 112 7; 99 0.36 0.34 0.59 (0.47, 0.72) 0.53 (0.45, 0.66) 1.40 0.96 Detention Basin 9; 154 9; 154 0.21 0.06 0.44 (0.33, 0.53) 0.27 (0.14, 0.33)** 0.70 0.58 Media Filter 9; 162 9; 154 0.24 0.38 0.36 (0.31, 0.40) 0.57 (0.48, 0.68)*** 0.59 0.94 Porous Pavement 7; 358 7; 209 0.34 0.84 0.60 (0.53, 0.64) 1.35 (1.22, 1.51)*** 0.90 2.02 Retention Pond 30; 439 30; 451 0.16 0.02 0.39 (0.34, 0.43) 0.13 (0.10, 0.16)** 0.80 0.34 Wetland Basin 8; 220 8; 226 0.09 0.02 0.25 (0.20, 0.30) 0.09 (0.05, 0.12)** 0.50 0.29 Wetland Basin/Retention Pond 38; 659 38; 677 0.126 0.02 0.34 (0.31, 0.37) 0.11 (0.09, 0.13)** 0.67 0.33
Wetland Channel 4; 65 4; 61 0.41 0.08 0.77 (0.52, 0.99) 0.33 (0.14, 0.77)** 2.86 1.34 *Computed using the BCa bootstrap method described by Efron and Tibishirani (1993). **Hypothesis testing in Attachment 4 shows statistically significant decreases for this BMP category. ***Hypothesis testing in Attachment 4 shows statistically significant increases for this BMP category.
International Stormwater BMP Database
Pollutant Category Statistical Summary Report Page 34 December 2014
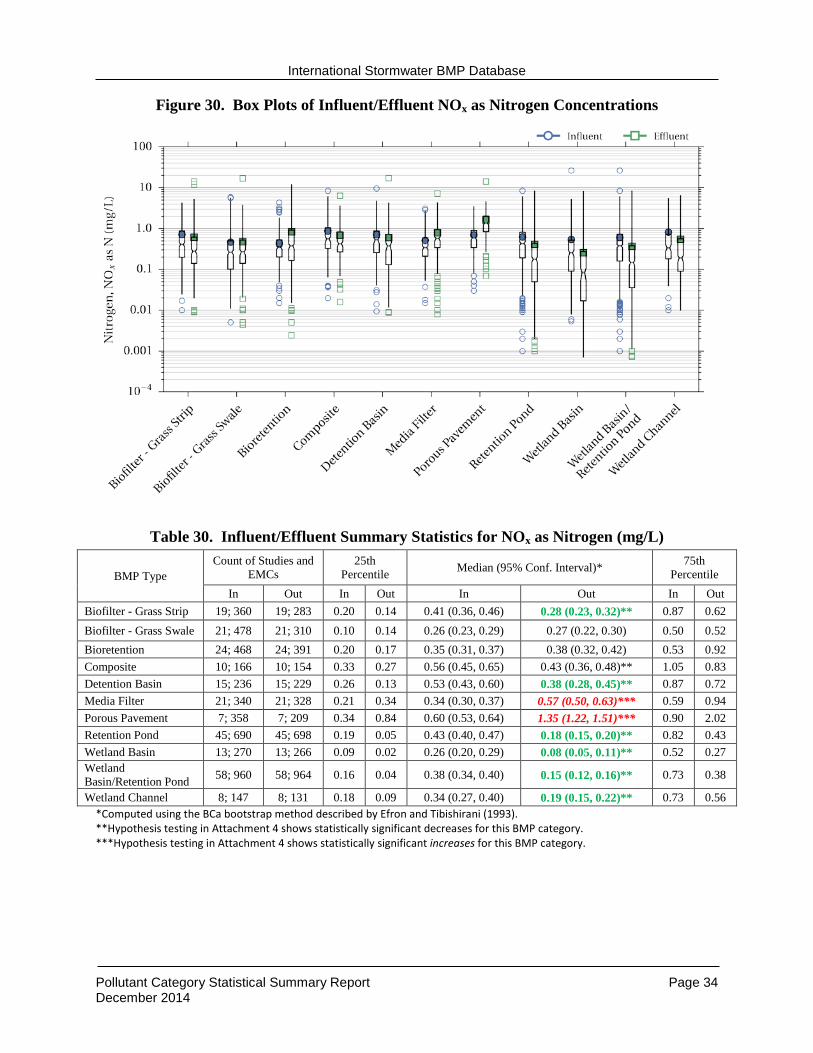
Figure 30. Box Plots of Influent/Effluent NOx as Nitrogen Concentrations
Table 30. Influent/Effluent Summary Statistics for NOx as Nitrogen (mg/L)
BMP Type Count of Studies and
EMCs 25th
Percentile Median (95% Conf. Interval)* 75th Percentile
In Out In Out In Out In Out Biofilter - Grass Strip 19; 360 19; 283 0.20 0.14 0.41 (0.36, 0.46) 0.28 (0.23, 0.32)** 0.87 0.62 Biofilter - Grass Swale 21; 478 21; 310 0.10 0.14 0.26 (0.23, 0.29) 0.27 (0.22, 0.30) 0.50 0.52 Bioretention 24; 468 24; 391 0.20 0.17 0.35 (0.31, 0.37) 0.38 (0.32, 0.42) 0.53 0.92 Composite 10; 166 10; 154 0.33 0.27 0.56 (0.45, 0.65) 0.43 (0.36, 0.48)** 1.05 0.83 Detention Basin 15; 236 15; 229 0.26 0.13 0.53 (0.43, 0.60) 0.38 (0.28, 0.45)** 0.87 0.72 Media Filter 21; 340 21; 328 0.21 0.34 0.34 (0.30, 0.37) 0.57 (0.50, 0.63)*** 0.59 0.94 Porous Pavement 7; 358 7; 209 0.34 0.84 0.60 (0.53, 0.64) 1.35 (1.22, 1.51)*** 0.90 2.02 Retention Pond 45; 690 45; 698 0.19 0.05 0.43 (0.40, 0.47) 0.18 (0.15, 0.20)** 0.82 0.43 Wetland Basin 13; 270 13; 266 0.09 0.02 0.26 (0.20, 0.29) 0.08 (0.05, 0.11)** 0.52 0.27 Wetland Basin/Retention Pond 58; 960 58; 964 0.16 0.04 0.38 (0.34, 0.40) 0.15 (0.12, 0.16)** 0.73 0.38
Wetland Channel 8; 147 8; 131 0.18 0.09 0.34 (0.27, 0.40) 0.19 (0.15, 0.22)** 0.73 0.56 *Computed using the BCa bootstrap method described by Efron and Tibishirani (1993). **Hypothesis testing in Attachment 4 shows statistically significant decreases for this BMP category. ***Hypothesis testing in Attachment 4 shows statistically significant increases for this BMP category.
International Stormwater BMP Database
Pollutant Category Statistical Summary Report Page 35 December 2014
7 REFERENCES Efron, B. and Tibishirani, R. (1993). An Introduction to the Bootstrap. Chapman & Hall, New
York.
Helsel, D.R. and Cohn, T.A. (1988). “Estimation of Descriptive Statistics for Multiply Censored Water Quality Data.” Wat. Res. Research, 24(12): 1997-2004.
Helsel, D.R. and Hirsch, R.M. (1992). Statistical Methods in Water Resources. Studies in Enivironmental Science. Elsevier, N.Y.
Geosyntec and Wright Water Engineers (2012). International Stormwater Best Management Practices (BMP) Database Addendum 1 to Volume Reduction Technical Summary (January 2011) Expanded Analysis of Volume Reduction in Bioretention BMPs. Prepared under Support from WERF, FHWA, EWRI/ASCE and EPA.
Wright Water Engineers and Geosyntec and (2011). International Stormwater Best Management Practices (BMP) Database Technical Summary: Metals. Prepared under Support from WERF, FHWA, EWRI/ASCE and EPA. August.
8 ATTACHMENTS Attachment 1. Solids Statistical Summary Report Attachment 2. Bacteria Statistical Summary Report Attachment 3. Metals Statistical Summary Report Attachment 4. Nutrients Statistical Summary Report