Embed Size (px)
Citation preview
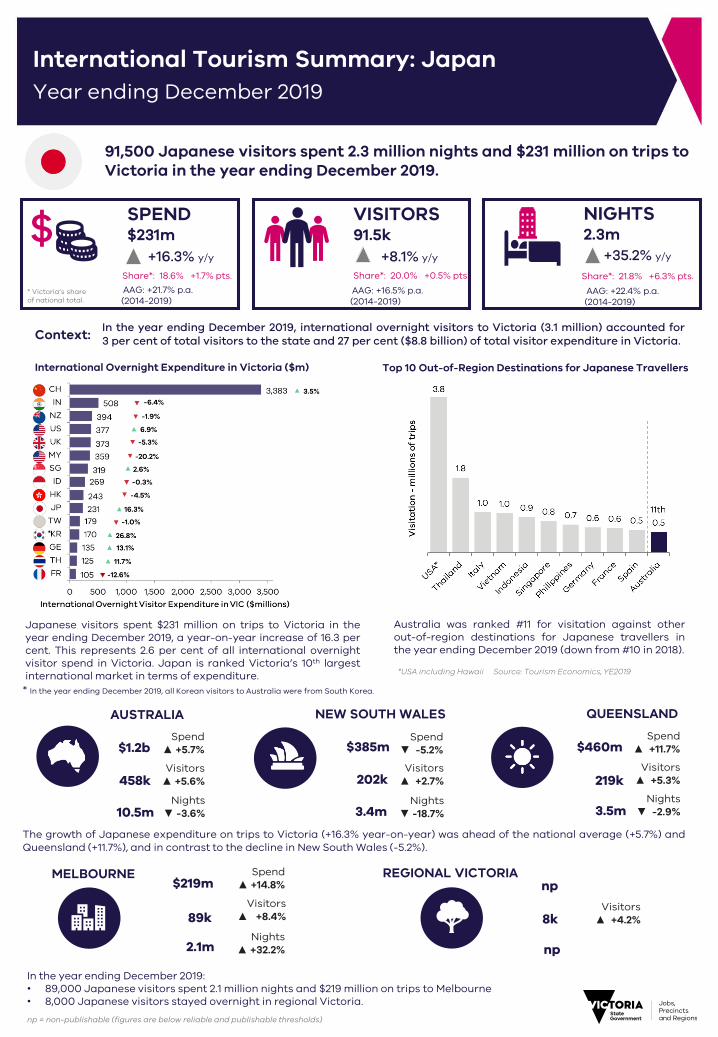
International Tourism Summary: JapanYear ending December 2019
91,500 Japanese visitors spent 2.3 million nights and $231 million on trips to Victoria in the year ending December 2019.
SPEND$231m
+16.3% y/yShare*: 20.0% +0.5% pts.
VISITORS91.5k
+8.1% y/yShare*: 21.8% +6.3% pts.
+35.2% y/y
NIGHTS2.3m
AAG: +21.7% p.a. (2014-2019)
AAG: +16.5% p.a. (2014-2019)
AAG: +22.4% p.a. (2014-2019)
AUSTRALIA NEW SOUTH WALES QUEENSLAND
The growth of Japanese expenditure on trips to Victoria (+16.3% year-on-year) was ahead of the national average (+5.7%) andQueensland (+11.7%), and in contrast to the decline in New South Wales (-5.2%).
Share*: 18.6% +1.7% pts.
Spend▲ +5.7%
Visitors▲ +5.6%
Nights▼ -3.6%
$1.2b
458k
10.5m
Spend▼ -5.2%
Visitors▲ +2.7%
Nights▼ -18.7%
$385m
202k
3.4m
Spend▲ +11.7%
Visitors▲ +5.3%
Nights▼ -2.9%
$460m
219k
3.5m
Japanese visitors spent $231 million on trips to Victoria in theyear ending December 2019, a year-on-year increase of 16.3 percent. This represents 2.6 per cent of all international overnightvisitor spend in Victoria. Japan is ranked Victoria’s 10th largestinternational market in terms of expenditure.
Australia was ranked #11 for visitation against otherout-of-region destinations for Japanese travellers inthe year ending December 2019 (down from #10 in 2018).
MELBOURNE Spend▲ +14.8%
Visitors▲ +8.4%
Nights▲ +32.2%
$219m
89k
2.1m
REGIONAL VICTORIA
Visitors▲ +4.2%
np
8k
np
In the year ending December 2019:• 89,000 Japanese visitors spent 2.1 million nights and $219 million on trips to Melbourne• 8,000 Japanese visitors stayed overnight in regional Victoria.
Top 10 Out-of-Region Destinations for Japanese TravellersInternational Overnight Expenditure in Victoria ($m)
*USA including Hawaii Source: Tourism Economics, YE2019
In the year ending December 2019, international overnight visitors to Victoria (3.1 million) accounted for3 per cent of total visitors to the state and 27 per cent ($8.8 billion) of total visitor expenditure in Victoria.Context:
$* Victoria’s share of national total.
np = non-publishable (figures are below reliable and publishable thresholds)
* In the year ending December 2019, all Korean visitors to Australia were from South Korea.
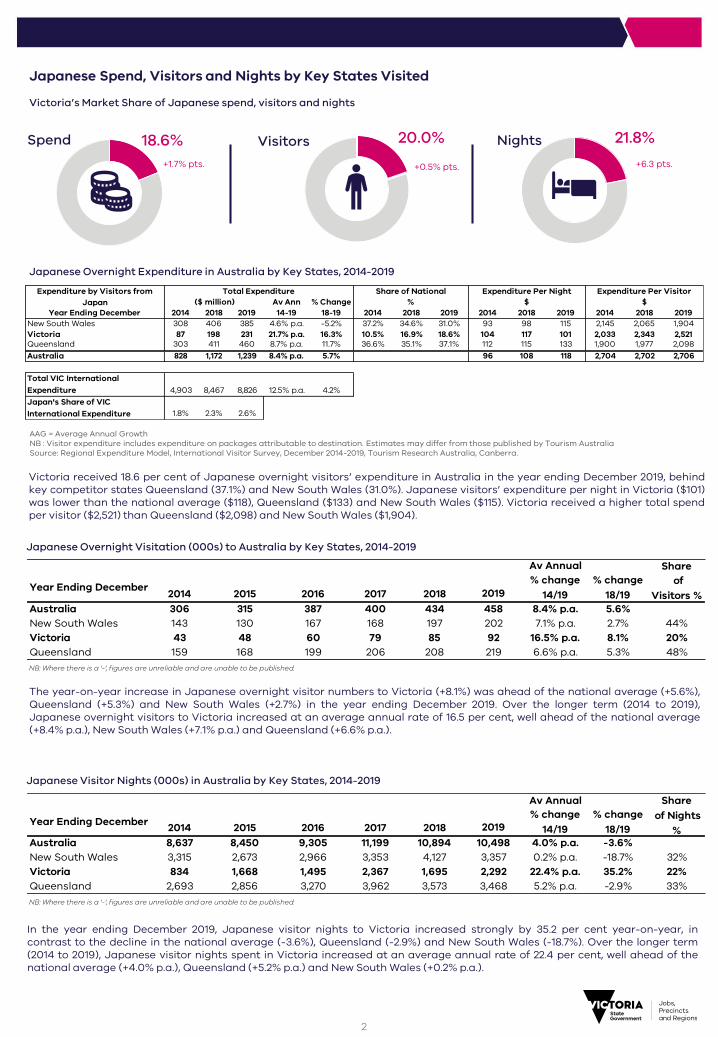
Japanese Spend, Visitors and Nights by Key States Visited
Victoria received 18.6 per cent of Japanese overnight visitors’ expenditure in Australia in the year ending December 2019, behindkey competitor states Queensland (37.1%) and New South Wales (31.0%). Japanese visitors’ expenditure per night in Victoria ($101)was lower than the national average ($118), Queensland ($133) and New South Wales ($115). Victoria received a higher total spendper visitor ($2,521) than Queensland ($2,098) and New South Wales ($1,904).
In the year ending December 2019, Japanese visitor nights to Victoria increased strongly by 35.2 per cent year-on-year, incontrast to the decline in the national average (-3.6%), Queensland (-2.9%) and New South Wales (-18.7%). Over the longer term(2014 to 2019), Japanese visitor nights spent in Victoria increased at an average annual rate of 22.4 per cent, well ahead of thenational average (+4.0% p.a.), Queensland (+5.2% p.a.) and New South Wales (+0.2% p.a.).
Japanese Overnight Expenditure in Australia by Key States, 2014-2019
The year-on-year increase in Japanese overnight visitor numbers to Victoria (+8.1%) was ahead of the national average (+5.6%),Queensland (+5.3%) and New South Wales (+2.7%) in the year ending December 2019. Over the longer term (2014 to 2019),Japanese overnight visitors to Victoria increased at an average annual rate of 16.5 per cent, well ahead of the national average(+8.4% p.a.), New South Wales (+7.1% p.a.) and Queensland (+6.6% p.a.).
Japanese Visitor Nights (000s) in Australia by Key States, 2014-2019
AAG = Average Annual GrowthNB : Visitor expenditure includes expenditure on packages attributable to destination. Estimates may differ from those published by Tourism AustraliaSource: Regional Expenditure Model, International Visitor Survey, December 2014-2019, Tourism Research Australia, Canberra.
Japanese Overnight Visitation (000s) to Australia by Key States, 2014-2019
2
Victoria’s Market Share of Japanese spend, visitors and nights
21.8%18.6% 20.0%Spend Visitors Nights
+0.5% pts. +6.3 pts.+1.7% pts.
Expenditure by Visitors fromJapan Av Ann % Change
Year Ending December 2014 2018 2019 14-19 18-19 2014 2018 2019 2014 2018 2019 2014 2018 2019New South Wales 308 406 385 4.6% p.a. -5.2% 37.2% 34.6% 31.0% 93 98 115 2,145 2,065 1,904Victoria 87 198 231 21.7% p.a. 16.3% 10.5% 16.9% 18.6% 104 117 101 2,033 2,343 2,521Queensland 303 411 460 8.7% p.a. 11.7% 36.6% 35.1% 37.1% 112 115 133 1,900 1,977 2,098Australia 828 1,172 1,239 8.4% p.a. 5.7% 96 108 118 2,704 2,702 2,706
Total VIC International Expenditure 4,903 8,467 8,826 12.5% p.a. 4.2%Japan's Share of VIC International Expenditure 1.8% 2.3% 2.6%
Total Expenditure Share of National Expenditure Per Night Expenditure Per Visitor ($ million) % $ $
Av Annual Share
Year Ending December 2014 2015 2016 2017 2018 2019% change
14/19% change
18/19 of
Visitors %Australia 306 315 387 400 434 458 8.4% p.a. 5.6%New South Wales 143 130 167 168 197 202 7.1% p.a. 2.7% 44%Victoria 43 48 60 79 85 92 16.5% p.a. 8.1% 20%Queensland 159 168 199 206 208 219 6.6% p.a. 5.3% 48%NB: Where there is a '-', figures are unreliable and are unable to be published.
Av Annual Share
Year Ending December 2014 2015 2016 2017 2018 2019% change
14/19% change
18/19 of Nights
%Australia 8,637 8,450 9,305 11,199 10,894 10,498 4.0% p.a. -3.6%New South Wales 3,315 2,673 2,966 3,353 4,127 3,357 0.2% p.a. -18.7% 32%Victoria 834 1,668 1,495 2,367 1,695 2,292 22.4% p.a. 35.2% 22%Queensland 2,693 2,856 3,270 3,962 3,573 3,468 5.2% p.a. -2.9% 33%NB: Where there is a '-', figures are unreliable and are unable to be published.
Market Share by Key States1
Japanese Overnight Visitors to AustraliaYear ending December 2019 – Market Share by Key States
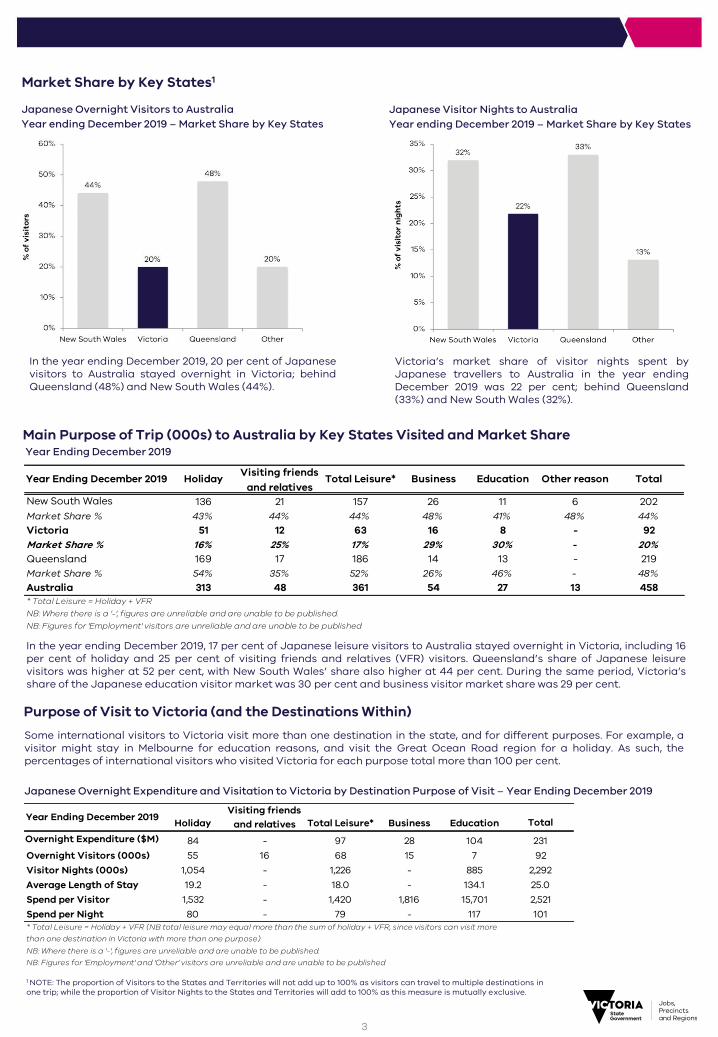
In the year ending December 2019, 20 per cent of Japanesevisitors to Australia stayed overnight in Victoria; behindQueensland (48%) and New South Wales (44%).
Purpose of Visit to Victoria (and the Destinations Within)
Japanese Overnight Expenditure and Visitation to Victoria by Destination Purpose of Visit – Year Ending December 2019
Japanese Visitor Nights to AustraliaYear ending December 2019 – Market Share by Key States
Victoria’s market share of visitor nights spent byJapanese travellers to Australia in the year endingDecember 2019 was 22 per cent; behind Queensland(33%) and New South Wales (32%).
Some international visitors to Victoria visit more than one destination in the state, and for different purposes. For example, avisitor might stay in Melbourne for education reasons, and visit the Great Ocean Road region for a holiday. As such, thepercentages of international visitors who visited Victoria for each purpose total more than 100 per cent.
1 NOTE: The proportion of Visitors to the States and Territories will not add up to 100% as visitors can travel to multiple destinations in one trip; while the proportion of Visitor Nights to the States and Territories will add to 100% as this measure is mutually exclusive.
Main Purpose of Trip (000s) to Australia by Key States Visited and Market Share Year Ending December 2019
In the year ending December 2019, 17 per cent of Japanese leisure visitors to Australia stayed overnight in Victoria, including 16per cent of holiday and 25 per cent of visiting friends and relatives (VFR) visitors. Queensland’s share of Japanese leisurevisitors was higher at 52 per cent, with New South Wales’ share also higher at 44 per cent. During the same period, Victoria’sshare of the Japanese education visitor market was 30 per cent and business visitor market share was 29 per cent.
3
Year Ending December 2019 Holiday Visiting friends and relatives
Total Leisure* Business Education Other reason Total
New South Wales 136 21 157 26 11 6 202Market Share % 43% 44% 44% 48% 41% 48% 44%Victoria 51 12 63 16 8 - 92Market Share % 16% 25% 17% 29% 30% - 20%Queensland 169 17 186 14 13 - 219Market Share % 54% 35% 52% 26% 46% - 48%Australia 313 48 361 54 27 13 458* Total Leisure = Holiday + VFRNB: Where there is a '-', figures are unreliable and are unable to be published.NB: Figures for 'Employment' visitors are unreliable and are unable to be published
Year Ending December 2019 HolidayVisiting friends
and relatives Total Leisure* Business Education TotalOvernight Expenditure ($M) 84 - 97 28 104 231Overnight Visitors (000s) 55 16 68 15 7 92Visitor Nights (000s) 1,054 - 1,226 - 885 2,292Average Length of Stay 19.2 - 18.0 - 134.1 25.0Spend per Visitor 1,532 - 1,420 1,816 15,701 2,521Spend per Night 80 - 79 - 117 101
NB: Where there is a '-', figures are unreliable and are unable to be published.NB: Figures for 'Employment' and 'Other' visitors are unreliable and are unable to be published
* Total Leisure = Holiday + VFR (NB total leisure may equal more than the sum of holiday + VFR, since visitors can visit more than one destination in Victoria with more than one purpose)
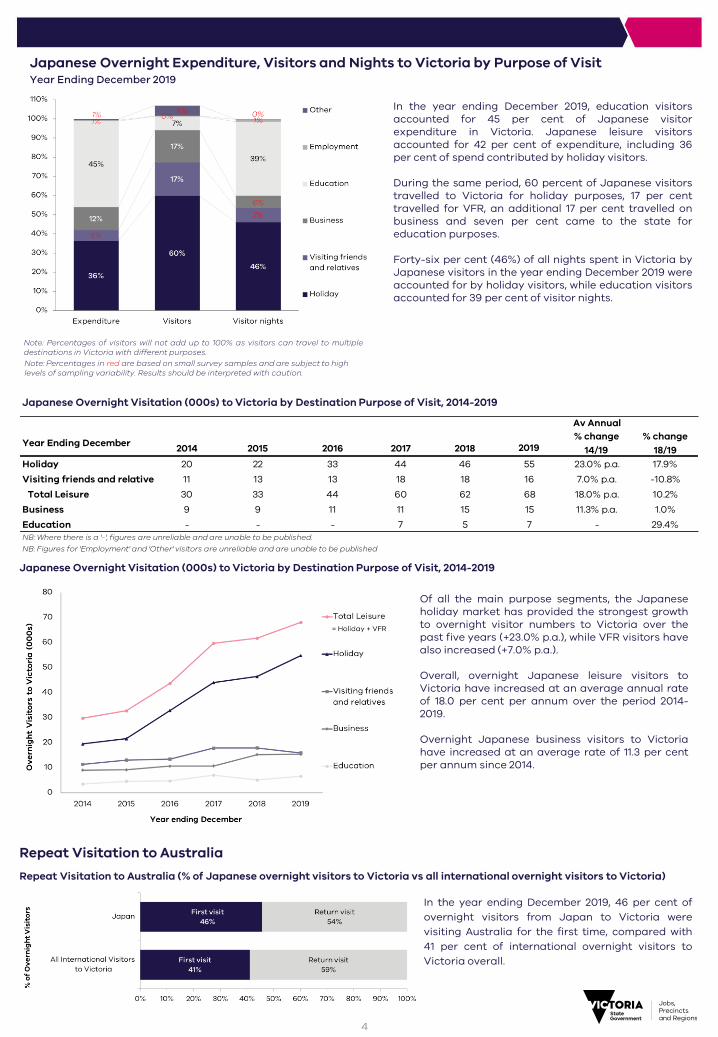
Of all the main purpose segments, the Japaneseholiday market has provided the strongest growthto overnight visitor numbers to Victoria over thepast five years (+23.0% p.a.), while VFR visitors havealso increased (+7.0% p.a.).
Overall, overnight Japanese leisure visitors toVictoria have increased at an average annual rateof 18.0 per cent per annum over the period 2014-2019.
Overnight Japanese business visitors to Victoriahave increased at an average rate of 11.3 per centper annum since 2014.
Japanese Overnight Visitation (000s) to Victoria by Destination Purpose of Visit, 2014-2019
Japanese Overnight Visitation (000s) to Victoria by Destination Purpose of Visit, 2014-2019
In the year ending December 2019, education visitorsaccounted for 45 per cent of Japanese visitorexpenditure in Victoria. Japanese leisure visitorsaccounted for 42 per cent of expenditure, including 36per cent of spend contributed by holiday visitors.
During the same period, 60 percent of Japanese visitorstravelled to Victoria for holiday purposes, 17 per centtravelled for VFR, an additional 17 per cent travelled onbusiness and seven per cent came to the state foreducation purposes.
Forty-six per cent (46%) of all nights spent in Victoria byJapanese visitors in the year ending December 2019 wereaccounted for by holiday visitors, while education visitorsaccounted for 39 per cent of visitor nights.
Japanese Overnight Expenditure, Visitors and Nights to Victoria by Purpose of VisitYear Ending December 2019
Repeat Visitation to AustraliaRepeat Visitation to Australia (% of Japanese overnight visitors to Victoria vs all international overnight visitors to Victoria)
In the year ending December 2019, 46 per cent ofovernight visitors from Japan to Victoria werevisiting Australia for the first time, compared with41 per cent of international overnight visitors toVictoria overall.
4
Note: Percentages of visitors will not add up to 100% as visitors can travel to multipledestinations in Victoria with different purposes.Note: Percentages in red are based on small survey samples and are subject to high levels of sampling variability. Results should be interpreted with caution.
Av Annual
Year Ending December 2014 2015 2016 2017 2018 2019% change
14/19% change
18/19Holiday 20 22 33 44 46 55 23.0% p.a. 17.9%Visiting friends and relatives 11 13 13 18 18 16 7.0% p.a. -10.8%
Total Leisure 30 33 44 60 62 68 18.0% p.a. 10.2%Business 9 9 11 11 15 15 11.3% p.a. 1.0%Education - - - 7 5 7 - 29.4%NB: Where there is a '-', figures are unreliable and are unable to be published.NB: Figures for 'Employment' and 'Other' visitors are unreliable and are unable to be published
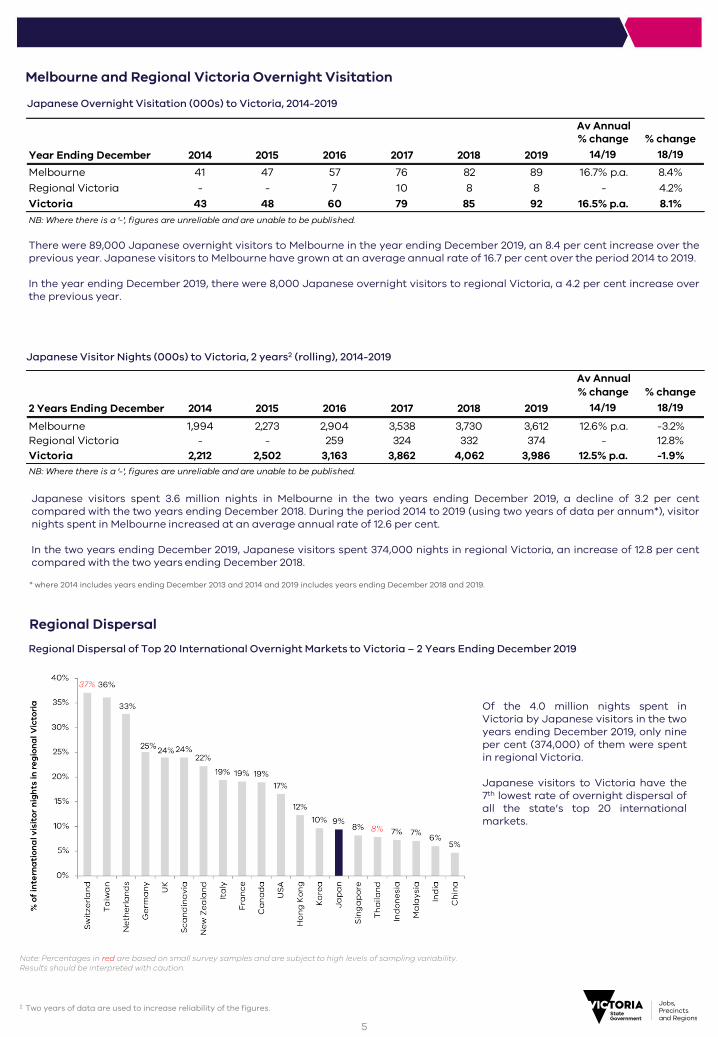
Of the 4.0 million nights spent inVictoria by Japanese visitors in the twoyears ending December 2019, only nineper cent (374,000) of them were spentin regional Victoria.
Japanese visitors to Victoria have the7th lowest rate of overnight dispersal ofall the state’s top 20 internationalmarkets.
Regional Dispersal of Top 20 International Overnight Markets to Victoria – 2 Years Ending December 2019
Japanese Overnight Visitation (000s) to Victoria, 2014-2019
There were 89,000 Japanese overnight visitors to Melbourne in the year ending December 2019, an 8.4 per cent increase over theprevious year. Japanese visitors to Melbourne have grown at an average annual rate of 16.7 per cent over the period 2014 to 2019.
In the year ending December 2019, there were 8,000 Japanese overnight visitors to regional Victoria, a 4.2 per cent increase overthe previous year.
Melbourne and Regional Victoria Overnight Visitation
Japanese Visitor Nights (000s) to Victoria, 2 years2 (rolling), 2014-2019
Japanese visitors spent 3.6 million nights in Melbourne in the two years ending December 2019, a decline of 3.2 per centcompared with the two years ending December 2018. During the period 2014 to 2019 (using two years of data per annum*), visitornights spent in Melbourne increased at an average annual rate of 12.6 per cent.
In the two years ending December 2019, Japanese visitors spent 374,000 nights in regional Victoria, an increase of 12.8 per centcompared with the two years ending December 2018.
Regional Dispersal
2 Two years of data are used to increase reliability of the figures.
Note: Percentages in red are based on small survey samples and are subject to high levels of sampling variability. Results should be interpreted with caution.
5
Av Annual
Year Ending December 2014 2015 2016 2017 2018 2019% change
14/19% change
18/19Melbourne 41 47 57 76 82 89 16.7% p.a. 8.4%Regional Victoria - - 7 10 8 8 - 4.2%Victoria 43 48 60 79 85 92 16.5% p.a. 8.1%NB: Where there is a '-', figures are unreliable and are unable to be published.
Av Annual
2 Years Ending December 2014 2015 2016 2017 2018 2019% change
14/19% change
18/19Melbourne 1,994 2,273 2,904 3,538 3,730 3,612 12.6% p.a. -3.2%Regional Victoria - - 259 324 332 374 - 12.8%Victoria 2,212 2,502 3,163 3,862 4,062 3,986 12.5% p.a. -1.9%NB: Where there is a '-', figures are unreliable and are unable to be published.
* where 2014 includes years ending December 2013 and 2014 and 2019 includes years ending December 2018 and 2019.
Places Visited in Regional Victoria – Year Ending December 2019
In the year ending December 2018, 22 per cent ofJapanese overnight visitors to Victoria spenttime (daytrip or overnight) in the Great OceanRoad/Twelve Apostles region. This region is verypopular generally, with 33 per cent of allinternational overnight visitors to Victoriatravelling there.
Fourteen per cent (14%) of Japanese overnightvisitors to Victoria went to the Phillip Island/Penguin Parade area (compared with 17 per centof international overnight visitors to Victoriaoverall) and 11 per cent visited the Yarra Valleyregion (compared with 12 per cent ofinternational overnight visitors to Victoriaoverall).
Places Visited in Regional Victoria and Melbourne Attractions
Aviation3
Melbourne Attractions Visited – Year Ending December 2019
The most visited Melbourne attractions byJapanese overnight visitors to Victoria were theCBD shopping precinct (78 per cent comparedwith 63 per cent of international visitors overall)and Queen Victoria Market (53 per cent ofJapanese overnight visitors compared with 44per cent of international visitors overall).
Other attractions that Japanese visitors weremore likely to visit compared to internationalvisitors overall included St Kilda (30 per cent ofJapanese overnight visitors compared with 28per cent of international overnight visitorsoverall), Melbourne Museum (25 per centcompared with 16 per cent of internationalovernight visitors overall) and the NGV (22 percent compared with 17 per cent of internationalovernight visitors to Victoria overall).
3 Note: Aviation capacity is measured by “available seats”, which includes international visitors and Australian residents returning home.
6
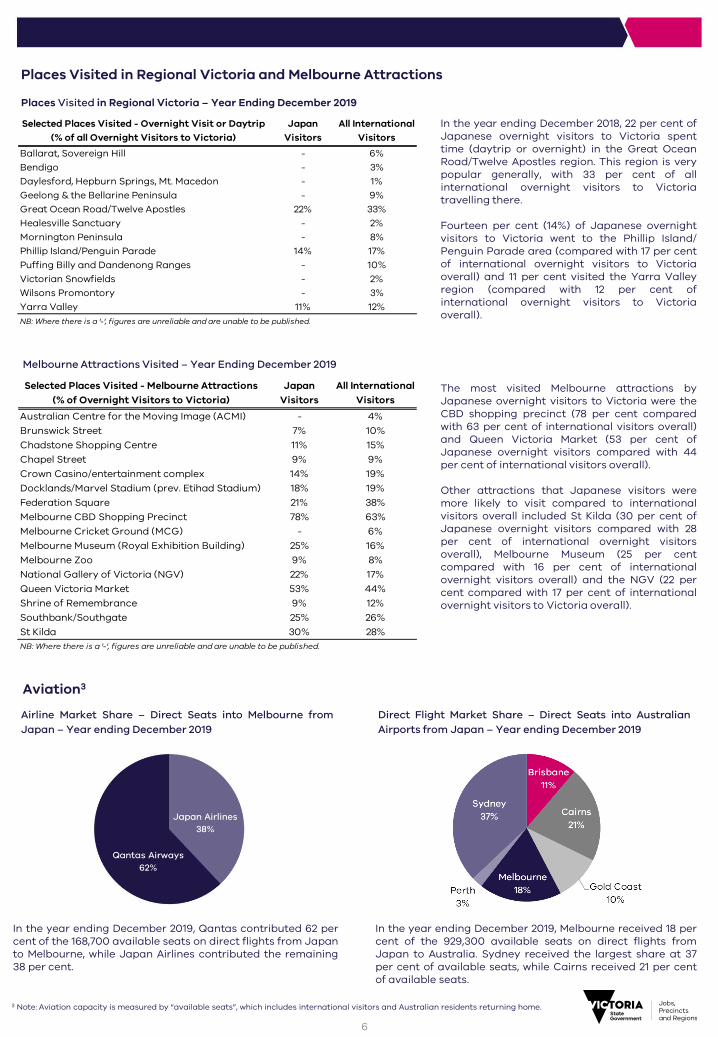
In the year ending December 2019, Qantas contributed 62 percent of the 168,700 available seats on direct flights from Japanto Melbourne, while Japan Airlines contributed the remaining38 per cent.
Airline Market Share – Direct Seats into Melbourne fromJapan – Year ending December 2019
In the year ending December 2019, Melbourne received 18 percent of the 929,300 available seats on direct flights fromJapan to Australia. Sydney received the largest share at 37per cent of available seats, while Cairns received 21 per centof available seats.
Direct Flight Market Share – Direct Seats into AustralianAirports from Japan – Year ending December 2019
Selected Places Visited - Overnight Visit or Daytrip(% of all Overnight Visitors to Victoria)
Japan Visitors
All International Visitors
Ballarat, Sovereign Hill - 6%Bendigo - 3%Daylesford, Hepburn Springs, Mt. Macedon - 1%Geelong & the Bellarine Peninsula - 9%Great Ocean Road/Twelve Apostles 22% 33%Healesville Sanctuary - 2%Mornington Peninsula - 8%Phillip Island/Penguin Parade 14% 17%Puffing Billy and Dandenong Ranges - 10%Victorian Snowfields - 2%Wilsons Promontory - 3%Yarra Valley 11% 12%NB: Where there is a '-', figures are unreliable and are unable to be published.
Selected Places Visited - Melbourne Attractions (% of Overnight Visitors to Victoria)
Japan Visitors
All International Visitors
Australian Centre for the Moving Image (ACMI) - 4%Brunswick Street 7% 10%Chadstone Shopping Centre 11% 15%Chapel Street 9% 9%Crown Casino/entertainment complex 14% 19%Docklands/Marvel Stadium (prev. Etihad Stadium) 18% 19%Federation Square 21% 38%Melbourne CBD Shopping Precinct 78% 63%Melbourne Cricket Ground (MCG) - 6%Melbourne Museum (Royal Exhibition Building) 25% 16%Melbourne Zoo 9% 8%National Gallery of Victoria (NGV) 22% 17%Queen Victoria Market 53% 44%Shrine of Remembrance 9% 12%Southbank/Southgate 25% 26%St Kilda 30% 28%NB: Where there is a '-', figures are unreliable and are unable to be published.
Sources:
– International Visitor Survey (IVS), years ending December 2014-2019, Tourism Research Australia (data released 8 April2020)
– Regional Expenditure Model (REX) 2014-2019, Tourism Research Australia (data released 8 April 2020)– Tourism Australia Consumer Demand Project, Tourism Economics, April 2020– International Airlines Operated Flights and Seats, year ending December 2019, Department of Infrastructure and
Regional Development (BITRE)– Visitor Arrivals and Departures, year ending December 2019, Tourism Research Australia
Base for IVS and Expenditure data: Only those trips where International visitors aged 15 years or over who have stayed inAustralia for less than 12 months are in scope. Expenditure includes package expenditure.
Figures that are unreliable and unable to be published are represented by ‘-‘. Figures might not add up due to rounding.
To view the full suite of 15 International Tourism Summaries (Victoria’s top 15 international markets in terms ofexpenditure, visitors and nights), see https://www.business.vic.gov.au/tourism-industry-resources/research/international-research
For further information on IVS and Expenditure data sources used please refer to our Guide to Tourism Data Sources andDefinitions document found here: https://www.business.vic.gov.au/tourism-industry-resources/research/teve-research
For further information on Tourism Australia’s Consumer Demand Project, seehttp://www.tourism.australia.com/en/markets-and-research/reports/consumer-research.html
Further information on international visitor statistics: https://www.tra.gov.au/international;http://www.tourism.australia.com/en/markets-and-research/market-regions.html
Factsheet produced by the TEVE Research Unit, May 2020.Due care is taken in the production of this factsheet, however DJPR accepts no responsibility for the use of thisinformation.
7