Embed Size (px)
Citation preview

Interplay of charge order and superconductivity in a ¼-filled quasi-2D organic conductor
Natalia Drichko
Stefan Kaiser, Yaxiu Sun, Martin Dressel University Stuttgart, Germany
John Schlueter Aragonne National Lab, USA
Toomas Rõõm, Urmas Nagel National Institute of Chemical Physics and Biophysics Tallinn Estonia
DPMC Geneva University Switzerland

Strongly correlated electronic systems: closeness of an ordered state and superconductivity
3D: heavy fermions
2D: transitional metal oxidesorganic conductors
HTSC Organic conductors
chargespinorbitallattice
degrees of freedomcharge spinlattice“intrasite”: intramolecular
degrees of freedom
conductance band formed by Cu and O orbitals
comparatively simple electronic structure: conductance band formed by molecular π-orbitals:
ordered state metalreached by doping
ordered state metalreached by change of doping andelectron-electron correlations

Crystal structure of BEDT-TTF- based 2D organic conductors:
anion layer: charge reservoir
cation layer: conducting layer
high conductivity
lowconductivity
anisotropy within the plane σb/ σc ~ 0.5perpendicular to the plane σb/ σa ~ 10000
Lattice site=one molecule

• band width depends on overlap intergrals between the neighboring molecules: W=8tW is about 1eV for these compounds
• on-site (U) and intersite (V) electronic correlations: depend on the moleculeeffective U is about 0.5eV
strong influence of electron-electron correlations
• band filling depends on stoichiometry:no additional disorder in the conducting layer
conductivity within the BEDT-TTF layers is defined by:

Quasi-two-dimensional organic conductors (BEDT-TTF)2X
Proposed for ¼ filled materials: calculations on the extended Hubbard model
V / W
Tuning parameters: _____________________________________bandwidth W
electronic correlations (on-site U, inter-site V)
J. Merino et al. PRL 87, 237002 (2001)
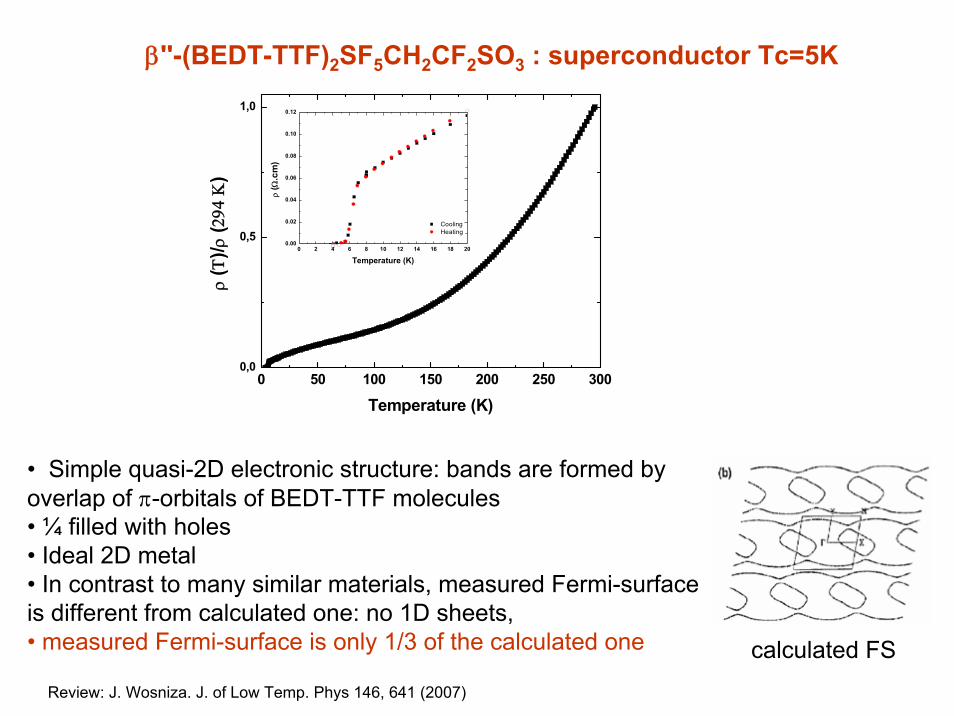
β''-(BEDT-TTF)2SF5CH2CF2SO3 : superconductor Tc=5K
• Simple quasi-2D electronic structure: bands are formed by overlap of π-orbitals of BEDT-TTF molecules • ¼ filled with holes• Ideal 2D metal • In contrast to many similar materials, measured Fermi-surface is different from calculated one: no 1D sheets, • measured Fermi-surface is only 1/3 of the calculated one
Review: J. Wosniza. J. of Low Temp. Phys 146, 641 (2007)
0 50 100 150 200 250 3000,0
0,5
1,0
0 2 4 6 8 10 12 14 16 18 200.00
0.02
0.04
0.06
0.08
0.10
0.12
ρ (Ω
.cm
)Temperature (K)
Cooling Heating
ρ (Τ
)/ρ (2
94 Κ
)
Temperature (K)
calculated FS

30-700 cm-1 Bruker113v+bolo 4.2 and 1.4 K + exchange gas cryostat down to 2 K
50-700 cm-1 Bruker66v+bolo4.2K Coldfinger He flow cryostat@ 300 and 150 K in-situ gold evaporation
MIR and NIR : Bruker66v + Microscope: measurements of absolute reflectivity of surfaces down to 0.1-0.05 mm possibleColdfinger cryostat down to 10 K
Submillimeter spectrometer 30-11 cm-1
Exchange gas cryostat down to 1.8K
“Tesla” spectrometer 5-40 cm-1
Down to 2.6 K, magnetic field up to 7 TIn collaboration with T. Room, Tallinn, Estonia
our optical study:

characterization of charge order by molecular spectroscopy:
1400 1420 1440 1460 1480 15000
20
40
60 004K 050K 100K 150K 200K 300Kσ(
Ω−1
cm-1
)
Wavenumber (cm-1)
1
ν27(B1u)
intramolecular vibrationfrequency linearly dependent on charge
• charge disproportionationbetween the sites:Δn ≅ 0.2edevelops at about 150 K
• no corresponding feature in d.c.conductivity
T. Yamamoto et al. J. Phys. Chem. B, 109 (2005)

In-plane conductivity: short range charge order
0,0
0,2
0,4
0,6
0,8
1,0
1000 2000 3000 4000 5000 6000 70000
1000
2000
σ(Ω
-1cm
-1)
Wavenumber (cm-1)
300 K 200 K 150 K 125 K 100 K 50 K 10 K
Ref
lect
ivity
10 100 10000
500
1000
1500
σ(Ω
-1cm
-1)
• Most of the spectral weight is in the MIR-band.
• MIR spectral weight shifts down on cooling, forming a band at 200 cm-1 below about 150 K
•Drude-response is below 10% of spectral weight at 10 K

1000 2000 30000
1000
2000
σ(Ω
-1cm
-1)
Wavenumber (cm-1)
10 100 10000
500
1000
1500
300 K 200 K 150 K 125 K 100 K 50 K 10 Kσ(
Ω-1
cm-1
)
In-plane conductivity: charge order fluctuations
band at 200 cm-1 gets well-shaped below 150 K, in the CO state
band predicted to appeardue to short range CO
“every quasi-particle carries localized spectral weight”
J. Merino et al. Phys Rev B, 68, 245121(2003)
e
Calculation: extended Hubbard modelsquare lattice T=0 K
Band at MIR: transitions between molecular sites in the sort-range ordered pattern

coherent carriers response
• A narrow coherent charge carriers response appears at T<200 K: typical for organic conductors
•Drude response is below 10% of spectral weight at 10 K
•The rest of the spectral weight is in the MIR-band: agreement with SdH data –only 1/3 of the predicted square of the FS was found.
• Spectral weight of the Drude-like response increases on cooling. At lowest temperatures it happens at the expense of the CO band.
• This is in contrast to stripes in HTcs and CDW/SC competition
10 100 10000
500
1000
1500
300 K 200 K 150 K 125 K 100 K 10 K
Wavenumber (cm-1)
σ(Ω
-1cm
-1)
0 50 100 150 200-800
-600
-400
-200
0
200
300 K 200K 100 K 50 K 10 K
ε 1
Wavenumber (cm-1)

coherent carriers response
Theoretical prediction: On cooling we “get away” from the charge ordered state
Experiment: Spectral weight of coherent carriers increase
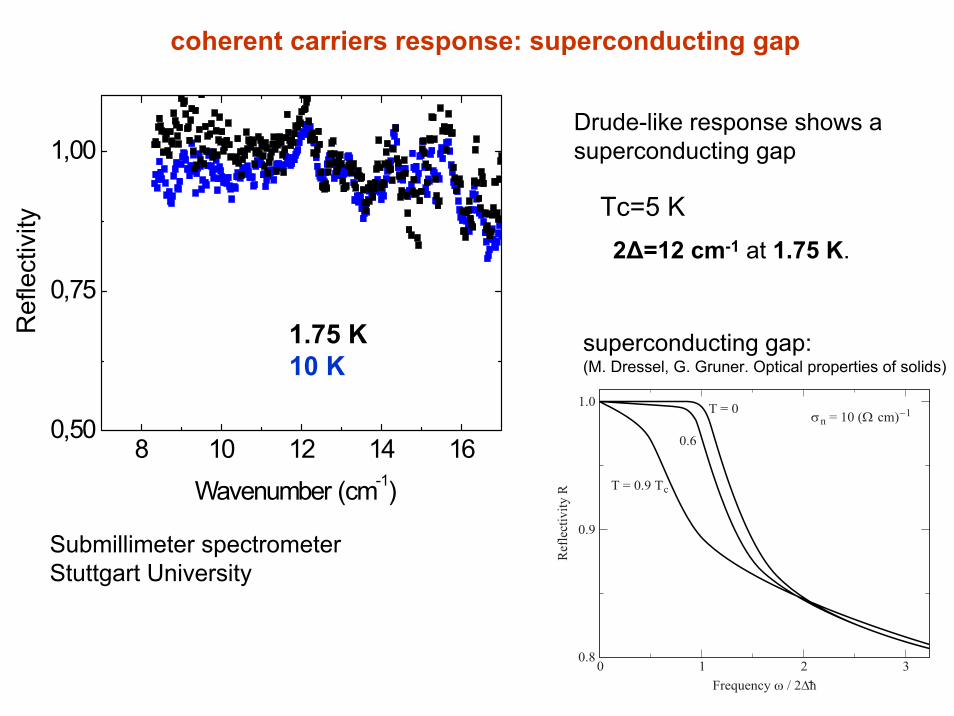
coherent carriers response: superconducting gap
Drude-like response shows a superconducting gap
2Δ=12 cm-1 at 1.75 K.
8 10 12 14 160,50
0,75
1,00
Ref
lect
ivity
Wavenumber (cm-1)
1.75 K10 K
Tc=5 K
Submillimeter spectrometerStuttgart University
superconducting gap: (M. Dressel, G. Gruner. Optical properties of solids)

Superconducting gap: temperature and field dependence
Collaboration with T. Rõõm,Tallinn, Estonia
2Δ=12 cm-1 at 3.6 K.
8 10 12 14 16 18 20
1,00
1,01
1,02
1,03
Tc=5 K
0T/4T 1T/4T 0.4T/4T
RS(0
T)/R
(B)
Wavenumber (cm-1)
T=3.6 K
8 10 12 14 16 18 201,010
1,015
1,020
1,025
1,030
1,035
1,040 6 K 5 K 4 K 3 K 2.4 K
R(T
)/R(1
5K)
Wavenumber (cm-1)

β''-(BEDT-TTF)2SF5CH2CF2SO3: superconductivity mediated by charge fluctuations?
• CO and SC conductivity co-exist but do not compete
• A SC with the highest Tc we studied + the most narrow Drude and the strongest CO-band observed
V / W
J. Wosnitsa. PRB (2003)
250
200
1506
4
2
00 5
p (kbar)
T(K
)
metal
SC
our IR studies of chemical pressure:CO suppressed, metallic behavior
D.c. measurements show, that under pressure superconducting transition is suppressed above 10 kbar. The compound becomes metallic. CO suppressed?

Conclusions:
• Using vibrational spectroscopy we detect charge order inquasi-2D ¼ filled superconductor β’’-(BEDT-TTF)2SF5CH2CF2SO3 at temperatures below 150 K.
• On cooling below 200 K a coherent carriers response and a band at 200 cm-1
appear and increase on cooling. We assign the band at 200 cm-1 to charge order fluctuations
•Below Tc=5K we see an opening of a superconducting gap.At T=3.6 K 2Δ=12 cm-1.

0
500
1000
1500
2000
R
efle
lctiv
ity
0
100
200
300
400
500
1/τ(
ω)
20 40 60 80 100 120 140 160 180 2000
2
4 300 K 200 K 150 K 100 K 50 K 30 K 10 K
m*/m
b
Frequency (cm-1)
mef
f

8 10 12 14 16 18 20
1,00
1,01
1,02
1,03
0T/4T 1T/4T 0.4T/4T
RS(0
T)/R
(B)
Wavenumber (cm-1)
T=3.6 K
8 10 12 14 16 18 201,010
1,015
1,020
1,025
1,030
1,035
1,040 6 K 5 K 4 K 3 K 2.4 K
R(T
)/R(1
5K)
Wavenumber (cm-1)

50 100 1500
1
2
3
4
10 K 50 K 100 K
E
ffect
ive
mas
s
Temperature (K)
SdHmass
effective mass

Extended Drude analysis: scattering on charge order?
200 400 600 800 1000 1200 1400 1600 1800 2000
500
1000
1500
2000
2500
3000
original
σ
Wavenumber (cm-1)
20 40 60 80 100 120 140 1600
50
100
150
200
2500
50
100
150
200
20 40 60 80 100 120 140 1600
1000
2000
original
σ
Wavenumber (cm-1)
γ
other components extracted
200 K 30 K
γ
original
other components extracted
s
200 K above CO30 K below CO
scattering rate goes linear with frequency: scattering of charge carriers on the CO?

Work is done thanks to:
Stefan Kaiser
Yaxiu Sun
Martin Dressel
John Schlueter
Toomas Room,

Molecular vibrationsEach site is a molecule: charge-dependent molecular vibrations can give information on the charge-redistribution in the charge –ordered state.
0.0 0.5 1.0 1.5 2.0
1350
1400
1450
1500
1550
Average charge per BEDT-TTF molecule (+e)
ν3(Ag)
ν2(Ag)
Vibr
atio
nal f
requ
ency
(cm
-1)
Dependance of the modes frequency
on the charge on BEDT-TTF:
ν3 = 1487.5 cm−1
ν2 = 1554.2 cm−1
Raman: was used for charge order characterisation
1
IR active molecular vibrations are intensive only in E ⊥ conducting layers
1000 2000 3000 4000 50000.0
0.2
0.4
0.6
0.8
1.0
Ref
lect
ivity
Wavewnumber (cm-1)
A(ν3)
A(ν4)
B1u(ν27)

1. Physikalisches Institut, Universität Stuttgart, Germany
1/5-Filled System: β′′- (BEDO-TTF)5[CsHg(SCN)4]2
N. Drichko et al. Phys. Rev. B 72, 024524 (2005).
• More spectral weight in Drude part; at 300 K the pseudogap is at about 300 cm-1
in both directions.
• With decreasing temperature the gap feature shifts to lower frequencies;the Drude component increases.
1000 2000 3000 40000
400
300 K 200 K 100 K 6 K
Con
duct
ivity
(Ω-1
cm-1
)
Wavenumber (cm-1)
0.0
0.2
0.4
0.6
0.8
1.0
Ref
lect
ivity
0.0 1.0 2.0 3.0 4.0 5.0 6.0 7.0 8.0 9.0 10.0 11.0 12.0ω/t
0.00
0.01
0.02
σ(ω)
/(2πe
2 )
V=1.6tV=2.3t
0.0 1.0 2.0 3.0 4.0 5.0V/t
0.00
0.10
0.20
D/(2
πe2 )
1/4
1/5
1/5 filling,U = 20t, different V/texact diagonalisation calculations on an extended Hubbard modelDrude peak for any V

β’’-(BEDT-TTF)2SF5CH2CF2SO3: pressure dependent transport measurements
structural change
metal
insulatorSC
J. Wosnitsa. PRB (2003)
D.c. measurements show, that under pressure superconducting transition is suppressed above 10 kbar
Proposed for ¼ filled materials:
V / W
pressure