Embed Size (px)
Citation preview

Providing consultancy and research in health economics for the NHS, pharmaceutical and health care industries since 1986
YORKSHIRE AND HUMBER ACADEMIC HEALTH SCIENCE NETWORKFaecal Calprotectin Screening in Primary Care
Final Report
HAYDEN HOLMES, Senior Research Consultant
18 December 2017

ContentsPage No.
Acknowledgements
Executive Summary
Section 1: Introduction 11.1 Context 11.2 Methodologies 2
Section 2: The Model 42.1 Model Outline 42.2 Description of Intervention and Intervention Pathway 52.3 Description of Comparators and Comparator Pathways 62.4 Model Schematic of Patient Pathways 82.5 Effectiveness 112.6 Costs 112.7 Outputs 12
Section 3: Results 133.1 Summary 133.2 Intervention Compared with ESR and CRP 143.3 Intervention Compared with NICE GP Pathway 153.4 Intervention Compared with Standard Cut-Off 163.5 Intervention Compared with Published Data 1 173.6 Intervention Compared with Published Data 2 183.7 Published Data Used By NICE Compared with Standard Cut-Off 19
Section 4: Sensitivity Analysis 204.1 Sensitivity Analysis 20
Section 5: Discussion 225.1 Summary 22
All reasonable precautions have been taken by YHEC to verify the information contained in this publication. However, the published material is being distributed without warranty of any kind, either expressed or implied. The responsibility for the interpretation and use of the material lies with the reader. In no event shall YHEC be liable for damages arising from its use.

Acknowledgements
I would like to thank the following people who have either been directly involved in helping to develop this model and report and to former YHEC staff whose 2010 work has been used as the basis for this updated model and report.
James Turvill – York HospitalVictoria Hilton – Yorkshire and Humber Academic Health Science Network (YHAHSN)Sarah Whitehead – York Health Economics ConsortiumJohn Hutton – York Health Economics ConsortiumMatthew Taylor – York Health Economics ConsortiumVicki Pollit – York Health Economics Consortium
i

Executive Summary
INTRODUCTION
Patients often see their GPs with lower gastrointestinal symptoms. These are challenging to deal with because different diseases can cause similar symptoms. Many patients will have irritable bowel syndrome (IBS). More rarely the symptoms are caused by inflammatory bowel disease (IBD). This disease affects one in 250 and urgent specialist investigation and treatment is required.
Calprotectin is a stable protein released from white blood cells during inflammation. When the lower gastrointestinal tract is inflamed elevated levels of calprotectin are detected in the stool. A normal faecal calprotectin (FC) strongly predicts for IBS and a raised FC increases the likelihood of IBD1.
NICE have assessed FC testing in various scenarios and have published formal guidance for its use2. However, most studies investigated FC testing in secondary care, not primary care. In primary care, a raised calprotectin test result is less accurate at predicting IBD than a normal test result is for predicting IBS.
In the Yorkshire and Humber region, the NICE guidelines are not widely implemented. This is because FC testing is not available in some areas and other local guidelines have been introduced. A new FC pathway has been developed with the intention that it could be universally adopted to reduce the number of unnecessary referrals to secondary care and unnecessary colonoscopies.
This report describes the modelling approach used to assess the new pathway and the results of the economic model.
1 Faecal calprotectin testing for differentiating amongst inflammatory and non-inflammatory bowel diseases: systematic review and economic evaluation. Health Technology Assessment, No. 17.55. N Waugh, E Cummins, P Royle, N-B Kandala, D Shyangdan, R Arasaradnam, C Clar, and R Johnston.
2 National Institute for Health and Care Excellence (NICE), Clinical Guideline [CG61], irritable bowel syndrome in adults: diagnosis and management https://www.nice.org.uk/guidance/cg61.
i
METHODS
York Health Economics Consortium (YHEC) and the Yorkshire and Humber Academic Health Science Network (YHAHSN) came together to develop the framework for an economic model and agreed on the development of a cost-consequence model to measure the following clinically meaningful outputs:
Total cost for cohort; Correctly diagnosed IBS cases; Correctly diagnosed IBD cases; Unnecessary colonoscopies (false positives); Outpatient gastroenterology appointments.
YHEC staff undertook a targeted literature search to determine the effectiveness of the current patient pathway. Two key evidence sources were identified. The first was data from Tibble et al (2002)3 which was used to inform a 2010 report for the NHS Centre for Evidence-based Purchasing (CEP) report; Value of calprotectin in screening out irritable bowel syndrome4. The second key evidence source was a systematic review of faecal calprotectin testing for differentiating between IBS and IBD by Waugh et al (2003)5. The Waugh et al systematic review was used by NICE to inform its diagnostic guidance for faecal calprotectin6.
The YHAHSN provided observational data from a pilot of the new pathway conducted by a selection of general practices in the York region. The York data included both, the sensitivity and specificity of the observed patients from the new pathway and a projected sensitivity and specificity of the observed cohort if they had followed the NICE guidance (using a referral cut-off of >50ug/g to a single stool sample).
This enabled us to develop a model for the following comparators:
1. Non FC pathway informed by Tibble et al2. Non FC pathway informed by Waugh et al3. Projected results of the York cohort following the >50ug/g cut-off4. >50 ug/g cut-off informed by Tibble et al5. >50 ug/g cut-off informed by Waugh et al
3 Tibble JA, Sigthorsson G, Foster R, Forgacs I, Bjarnason I. Use of surrogate markers of inflammation and Rome criteria to distinguish organic from nonorganic intestinal disease. Gastroenterology. 2002 Aug;123(2):450-60. PubMed PMID: 12145798.
4 Department of Health, Centre for Evidence-base Purchasing, CEP09041 http://nhscep.useconnect.co.uk/CEPProducts/Catalogue.aspx
5 Waugh N, Cummins E, Royle P, Kandala NB, Shyangdan D, Arasaradnam R, Clar C, Johnston R. Faecal Calprotectin testing for differentiating amongst inflammatory and non-inflammatory bowel diseases: systematic review and economic evaluation. Health Technol Assess. 2013 Nov;17(55):xv-xix, 1-211. doi: 10.3310/hta17550. Review. PubMed PMID: 24286461; PubMed Central PMCID: PMC4781415.
6 NICE diagnostic guidance 11: Faecal calprotectin diagnostic tests for inflammatory diseases of the bowel. 2013. www.nice.org.uk/guidance/dg11.
ii

A decision tree model was developed with a separate tree for the intervention and the five comparator pathways. Costs and outcomes were calculated for each of the decision trees and incremental costs were calculated and reported on separate results sheets.
RESULTS
Tibble et al – No FCFor the new pathway, the model estimates a saving of over £100,000 per 1,000 patients, while diagnosing an additional 175 IBS cases, (therefore, avoiding 175 unnecessary colonoscopies) and avoiding 162 gastroenterology outpatient visits.
Waugh et al – No FCFor the new pathway, the model estimates a cost saving of approximately £67,000 per 1,000 patients. The intervention arm also correctly diagnoses more IBS and avoids over 100 colonoscopies and gastroenterology outpatient appointments. However, there is a trade off with diagnosing 4-5 fewer cases of IBD due to the higher referral rates in the comparator arm.
York projected dataWhen comparing the new pathway with projected data for the >50ug/g cut-off used on a single stool sample, the model returns the most dominant result of all the comparators with a £160,000 saving and greater than 250 more correctly diagnosed IBS cases. The intervention arm avoids an unnecessary colonoscopy and gastroenterology outpatient referral for every four patients seen in primary care.
Tibble >50ug/g cut-offWhen compared to Tibble et al published data for >50ug/g cut-off, the intervention arm dominates with both a saving and clinical benefit. The intervention arm diagnoses more than 100 additional IBS cases in primary care and an additional 3-4 IBD cases. The intervention arm avoids >100 gastroenterology outpatient referrals and unnecessary colonoscopies
Waugh et al >50ug/g cut-offWhen comparing the intervention pathway with the Waugh et al published data for the >50ug/g cut-off, the model estimates that the intervention arm is more costly incurring an additional £25,000 it is also less effective at diagnosing IBS cases but does diagnose slightly more IBD cases per 1,000 patients at a cost of £20,937 per diagnosed IBD case. The intervention pathway does have slightly fewer gastroenterology referrals but higher unnecessary colonoscopies.
DISCUSSION
When compared to four of the five comparators used in the model, the model predicts the intervention arm is a cost-saving strategy. It is dominant when compared to Tibble et al in both the no FC and >50ug/g cut-off strategies. It is cost saving but diagnoses fewer cases of IBD when compared with the Waugh et al data for the no FC pathway.
iii
The one comparator that the intervention arm did not have dominance was from the >50ug/g cut-off from the Waugh et al systematic review. Nearly all studies used in the Waugh et al systematic review came from secondary care studies7. This could be interpreted that the sensitivity and specificity from that pooled analysis is reflective of FC testing in an optimum environment as it essentially uses a population that has already undergone primary care screening. It is noted in the text of Waugh that Jellema et al8 had reservations about applying results from specialist care to primary care.
We also ran a separate scenario comparing the published data from Waugh et al for the >50 ug/g cut-off, which was used by NICE, with the projected data for the >50ug/g cut-off from the York data. The model predicted the Waugh et al arm would be £170,000 less expensive per 1,000 patients and would diagnose 300 more cases of IBS in primary care than the York projections using the same pathway.
This comparison shows the vast gulf between using FC in an optimal environment and using FC in primary care for low risk patients who exhibit no red flags upon presentation. There is the potential that using the current NICE guidelines and assuming the optimal sensitivity and specificity data could actually be costing the NHS significantly in terms of patient outcomes, wait times for treatment and longer waitlists for gastroenterology outpatient appointments that are being taken up by unnecessary referrals. We would recommend that there needs to be further study on FC in a primary care environment using a range of FC cut-offs.
7 Waugh N, Cummins E, Royle P, et al. Faecal calprotectin testing for differentiating amongst inflammatory and non-inflammatory bowel diseases: systematic review and economic evaluation. Southampton (UK): NIHR Journals Library; 2013 Nov. (Health Technology Assessment, No. 17.55.) Chapter 2, Results of clinical effectiveness review.
8 Jellema P, van Tulder MW, van der Horst HE, Florie J, Mulder CJ, van der Windt DA. Inflammatory bowel disease: a systematic review on the value of diagnostic testing in primary care. Colorectal Dis 2011;13:239–54. 10.1111/j.1463-1318.2009.02131.x.
iv

Section 1: Introduction
1.1 CONTEXT
Patients often see their GPs with lower gastrointestinal symptoms. These are challenging to deal with because different diseases can cause similar symptoms. Many patients will have irritable bowel syndrome (IBS). IBS affects 10-20% of the population and is a condition characterised by disordered function in the absence of inflammation910. NICE guidance exists to help GPs manage patients with IBS11. Therefore, if the GP can make the diagnosis positively, then the patient will not need to be referred to secondary care for expensive, invasive investigations (colonoscopy and CT scans)12. More rarely the symptoms are caused by inflammatory bowel disease (IBD). This disease affects one in 250 and urgent specialist investigation and treatment is required.
Calprotectin is a stable protein released from white blood cells during inflammation. When the lower gastrointestinal tract is inflamed elevated levels of calprotectin are detected in the stool. A normal faecal calprotectin (FC) strongly predicts for IBS and a raised FC increases the likelihood of IBD13.
Because it is difficult to distinguish the one from the other, unnecessary referrals to specialist care for patients with IBS and late referrals for patients with IBD are made. Calprotectin tests have been developed to help distinguish between IBD and non-inflammatory bowel diseases. NICE have assessed FC testing in various scenarios and have published formal guidance for its use14. However, most studies investigated FC testing in secondary care, not primary care. In primary care, a raised calprotectin test result is less accurate at predicting IBS than a normal test result is for predicting IBD. Often the FC is falsely raised and so there is a risk of inundating secondary care with inappropriate referrals at increased cost and risk for patients.
9 Stone et al, Prevalence and management of IBD: a cross-sectional study from central England, Eur J Gastroenterol Hepatol 2003.
10 National Institute for Health and Care Excellence (NICE), Clinical Guideline [CG61], irritable bowel syndrome in adults: diagnosis and management https://www.nice.org.uk/guidance/cg61.
11 National Institute for Health and Care Excellence (NICE), Clinical Guideline [CG61], irritable bowel syndrome in adults: diagnosis and management https://www.nice.org.uk/guidance/cg61.
12 National Institute for Health and Care Excellence (NICE), Clinical Guideline [CG61], irritable bowel syndrome in adults: diagnosis and management https://www.nice.org.uk/guidance/cg61.
13 Faecal calprotectin testing for differentiating amongst inflammatory and non-inflammatory bowel diseases: systematic review and economic evaluation. Health Technology Assessment, No. 17.55. N Waugh, E Cummins, P Royle, N-B Kandala, D Shyangdan, R Arasaradnam, C Clar, and R Johnston.
14 NICE diagnostic guidance 11: Faecal calprotectin diagnostic tests for inflammatory diseases of the bowel. 2013. www.nice.org.uk/guidance/dg11.
Section 1 1

Clinical advice indicates that in addition to the reduced accuracy in the real world setting, there is also poor uptake of the NICE guidance for the use of FC testing. Clinical experts consider this is because uncertainties exist at primary care level about its implementation and because GPs consider they are already effective at distinguishing between IBS and IBD.
1.2 METHODOLOGIES
The Yorkshire and Humber Academic Health Science Network (YHAHSN) has asked YHEC to construct an economic model to test the cost effectiveness of the use of faecal calprotectin testing as a risk assessment tool for use in primary care for patients presenting with lower gastrointestinal symptoms in line with NICE DG11.
The project was broken down into stages:
1. A project initiation stage;2. Model development
stage;3. Literature search stage;4. Model population stage.
Project Initiation
We had an initial project initiation meeting between the YHAHSN and YHEC to discuss the project and potential ways to show the data. It was agreed that a cost-consequence model should be developed. The model should compare costs and outcomes for the new intervention patient pathway (the intervention) when compared with current practice. It was noted that in 2010, YHEC had developed a cost-consequence model for the Department of Health, NHS Purchasing and Supply Agency, Centre for Evidence-based Purchasing (CEP)15. It was agreed that this would make a good foundation for future models.
Model Development Stage
A cost-consequence model framework was developed. The YHAHSN then tested the model to determine if it was fit for purpose to display the information required by the YHAHSN. A follow up meeting between the YHAHSN and YHEC was used to go through the model in more detail and for YHEC to receive feedback on its functionality. We also used this session to gain expert clinical advice from Dr James Turvill on patient pathways and treatments.
15 Department of Health, Centre for Evidence-base Purchasing, CEP09041 http://nhscep.useconnect.co.uk/CEPProducts/Catalogue.aspx
Section 1 2

Literature Search Stage
We undertook a targeted literature search to identify what the most appropriate comparators were for evaluation. We used published data to inform appropriate sensitivity and specificity data for the comparator arms used in the model. The York Faecal Calprotectin Care Pathway (YFCCP) provided data to inform the sensitivity and specificity of the intervention arm. A range of resources were used to inform the costs used in the model. We noted that NICE had undertaken a review of its FC guidance (DG11)16 in May 2017 and had decided to move this guidance to the static list, indicating that there had been no significant new evidence since it was last reviewed by NICE in 2013. Taking this into consideration we were generally satisfied that the NICE evidence review of 2013 was still a good source for the most up to date evidence.
Model Population Stage
We then updated the model inputs for user testing. The model was again reviewed by the YHAHSN with the updated data. YHEC and the YHAHSN had a follow up meeting to discuss the capabilities of the model. The range of comparisons was agreed and the preliminary results of the model discussed. 6-month follow up data from the YFCCP was used to populate the model. Sensitivity analysis was built into the model to test different scenarios. YHEC then ran an internal quality assurance process of the model whereby a senior consultant who had not been involved in the development of the model pressure tested the model using model validation checklists. The model was then finalised.
16 NICE diagnostic guidance11: Faecal calprotectin diagnostic tests for inflammatory diseases of the bowel, Evidence, review decision https://www.nice.org.uk/guidance/dg11/evidence/review-decision-may-2017-4474871533?tab=evidence
Section 1 3

Section 2: The Model
2.1 MODEL OUTLINE
The patient population used in the model is patients presenting in primary care with lower gastrointestinal symptoms suggestive of IBS and who are exhibiting no red flag symptoms or signs for suspected cancer. Patients exhibiting red flag symptoms would go down a different patient pathway and are not included in this analysis. Some people with IBS may not present at the GP and may opt for over the counter treatments. The prevalence data for the model comes from observed data from the YFCCP; therefore, patients who do not present at their GP are not included in this model.
We developed a decision tree model to determine the cost-effectiveness of different evidence pathways with different sensitivity and specificity in the diagnosis of IBS and IBD. We used a simplifying assumption that all patients entering the model will have either IBS or IBD. IBS is used as a proxy for all non-IBD outcomes and IBD is the only organic disease outcome used in the model. This is consistent with other similar models used to assess the cost effectiveness of FC as a risk assessment tool for IBD and IBS1718. The prevalence of IBD in the model is informed by observed prevalence of IBD in the YFCCP. Each pathway of the decision tree leads to different costs as a result of different patient experience, for example; patients will have a different number of GP visits, specialist referrals or different medication.
The probabilities of moving down different pathways are determined by the prevalence of IBD in the cohort and the sensitivity and specificity of each of the evidence pathways. The model then calculates the total costs and total patient outcomes for each of the evidence pathways. The model compares the different pathways and calculates the incremental change in costs and outcomes, which are reported on separate results sheets.
The model was developed in Excel and used a cohort of 1,000 hypothetical patients. This cohort number can be varied by the user to simulate an estimated local patient cohort. This analysis was taken from the perspective of the payer, in this case, the NHS and as such only costs that would be incurred by the NHS are included. The model does not have an explicit time horizon, the time horizon is the time taken to reach a defined clinical endpoint of positive IBS or positive IBD. There is no discounting used in the model due to the short time horizon.
17 NICE, Diagnostic Guidance 11, evidence overview DAP12, https://www.nice.org.uk/guidance/dg11/documents/faecal-calprotectin-diagnostic-tests-for-inflammatory-diseases-of-the-bowel-evidence-overview-dap122
18 Department of Health, Centre for Evidence-base Purchasing, CEP09041 http://nhscep.useconnect.co.uk/CEPProducts/Catalogue.aspx
Section 2 4

2.2 DESCRIPTION OF INTERVENTION AND INTERVENTION PATHWAY
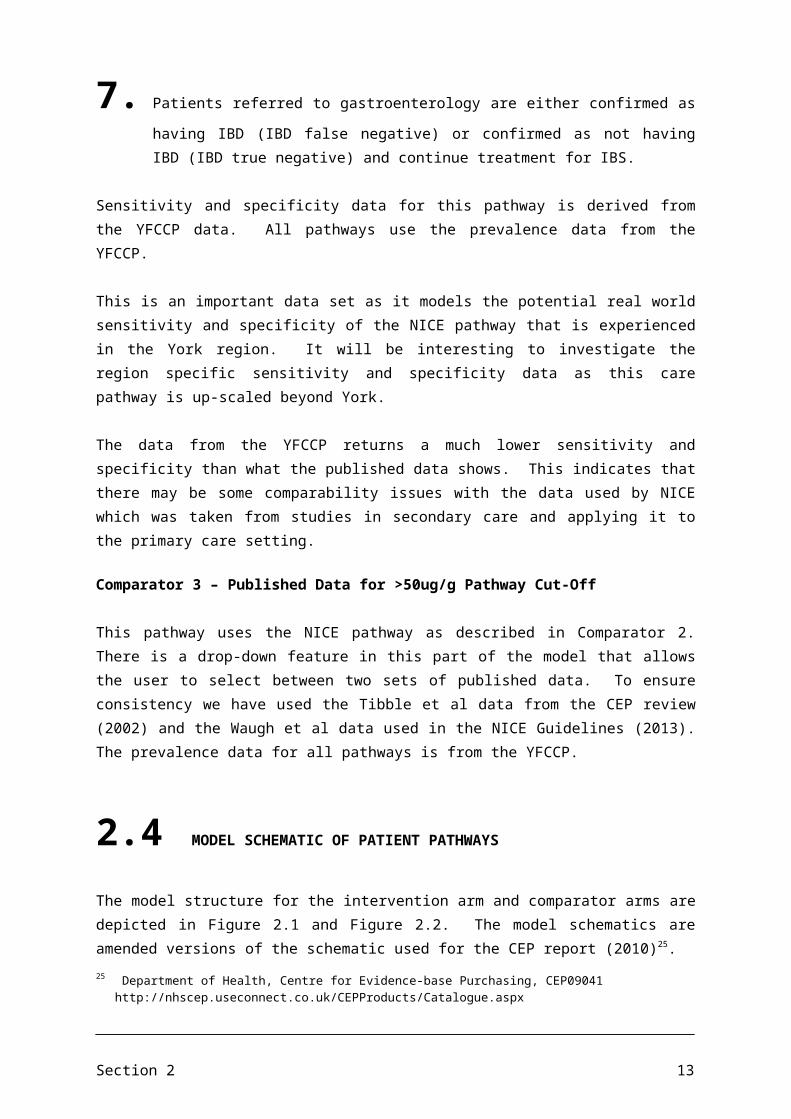
Each of the pathways used in the model are risk assessment pathways essentially used to screen for IBD. Clinical expert advice is that the current NICE guidance for FC screening are not widely implemented across Yorkshire and Humber. This is because in some areas there is no access to FC testing and in others, a local guideline has been introduced. The intervention care pathway has been developed using a higher FC cut-off than the current NICE guidance and includes a follow-up FC test to confirm the next steps for primary care. The intervention pathway is described as follows (a model schematic illustrating this pathway is provided below; Figure 2.1, Section 2.4):
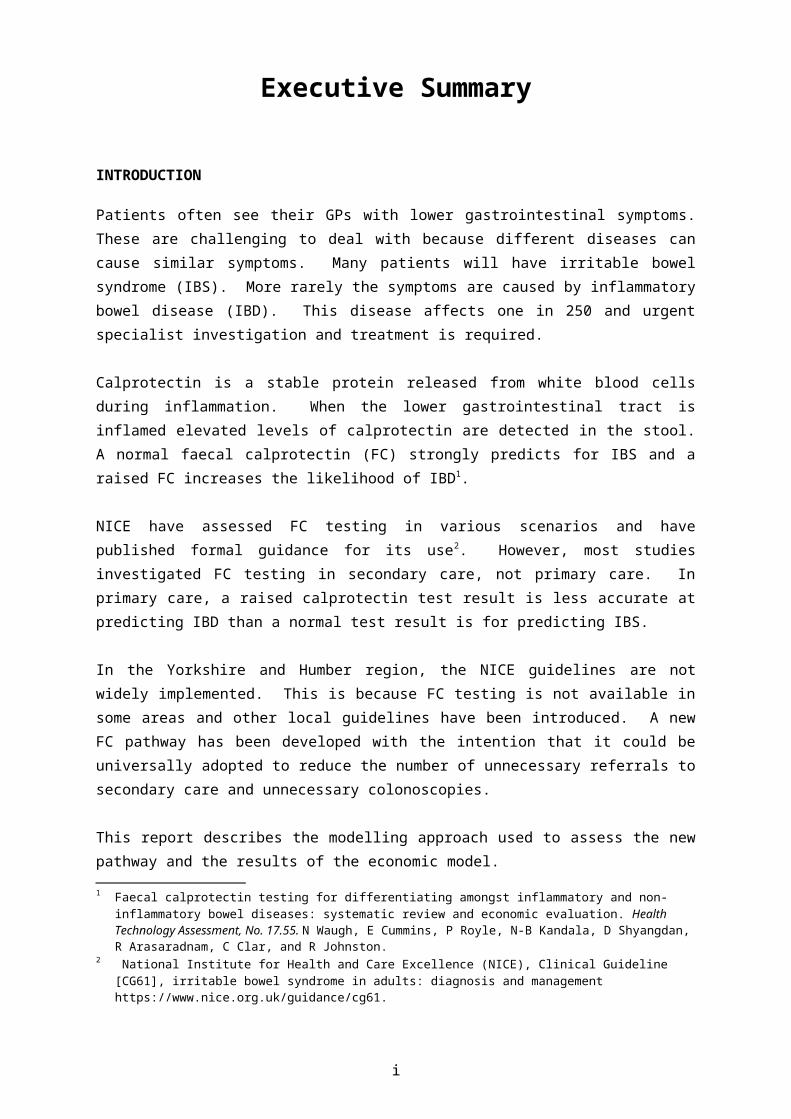
1. Patient presents to GP with lower gastrointestinal symptoms suggestive of IBS or IBD but there is diagnostic uncertainty; cancer is not suspected. After appropriate baseline investigations patient receives diagnostic FC test to detect inflammation in conjunction with assessment of patient history and physical examination;
2. Patients return to GP, those with an FC >100 receive a second FC test to detect inflammation. Those with an FC <100 are treated for IBS;
3. Patients with a second FC test of >100 are then referred on to gastroenterology. Those with an FC >250 are referred urgently. Those with an FC<100 on the second FC test treated for IBS;
4. Those referred to gastroenterology are either confirmed as having IBD (IBD true positive) or confirmed as not having IBD (IBD false positive) and are treated for IBS;
5. Those treated for IBS will either have their symptoms adequately controlled (IBD true negative) or will remain symptomatic;
6. Those that remain symptomatic will have further testing by their GP and may be started on second-line IBS medication. These patients will either have their symptoms adequately controlled (IBD true negative) or will remain symptomatic;
7. Those that continue to have unresolved symptoms will be referred on to gastroenterology for further assessment;
8. Patients referred to gastroenterology are either confirmed as having IBD (IBD false negative) or confirmed as not having IBD (IBD true negative) and continue treatment for IBS.
The intervention pathway uses prevalence, sensitivity and specificity data from the YFCCP. Clinical advice was used to form assumptions for the proportion of patients being prescribed medication and second-line medication for IBS.
There is functionality built into the model that not all GPs will adhere with the intervention pathway. Data from the YFCCP indicates that approximately 90% of GPs are adhering with the intervention pathway. We have used 100% adherence in our base-case estimates to illustrate the potential benefits of this pathway when fully utilised. This is consistent with other published studies used in the NICE guidance where GP adherence was not considered, therefore, implicitly using a 100% adherence rate. We have also reported results using a conservative estimate that 85% of GPs will adhere with the pathway in the results section. The 15% that do not adhere to the pathway are assumed to have the same sensitivity and specificity as the non-FC testing comparator pathway.
Section 2 5

2.3 DESCRIPTION OF COMPARATORS AND COMPARATOR PATHWAYS
Comparator 1: Non-FC Testing Pathway
The model includes a drop-down function here to select between two sets of published data for the Non-FC testing pathway. The first is the published data Tibble et al (2002)19 which gives the sensitivity and specificity for ESR and CRP testing to identify IBD in a low-risk patient population. This is the reference which was used for the NHS Centre for Evidence-based Purchasing (CEP) report in 201020. We did not use the high-risk patient population data from the Tibble paper, as we have assumed the high-risk cohort would follow a different patient pathway. The alternative set of published data is from a systematic review by Waugh et al (2013)21 which was used in the NICE guidance for Faecal Calprotectin testing (DG11)22. The sensitivity and specificity data for primary care with no FC testing are much higher in the Waugh data. This may be because GPs are good at diagnosing IBS and use ESR and CRP testing as part of the complete diagnostic toolkit. This means they may be more accurate at referring patients than if they had relied on ESR and CRP testing alone23.
The treatment pathway for Comparator 1 is detailed below (a model schematic illustrating this pathway is provided below; Figure 2.2 Section 2.4):
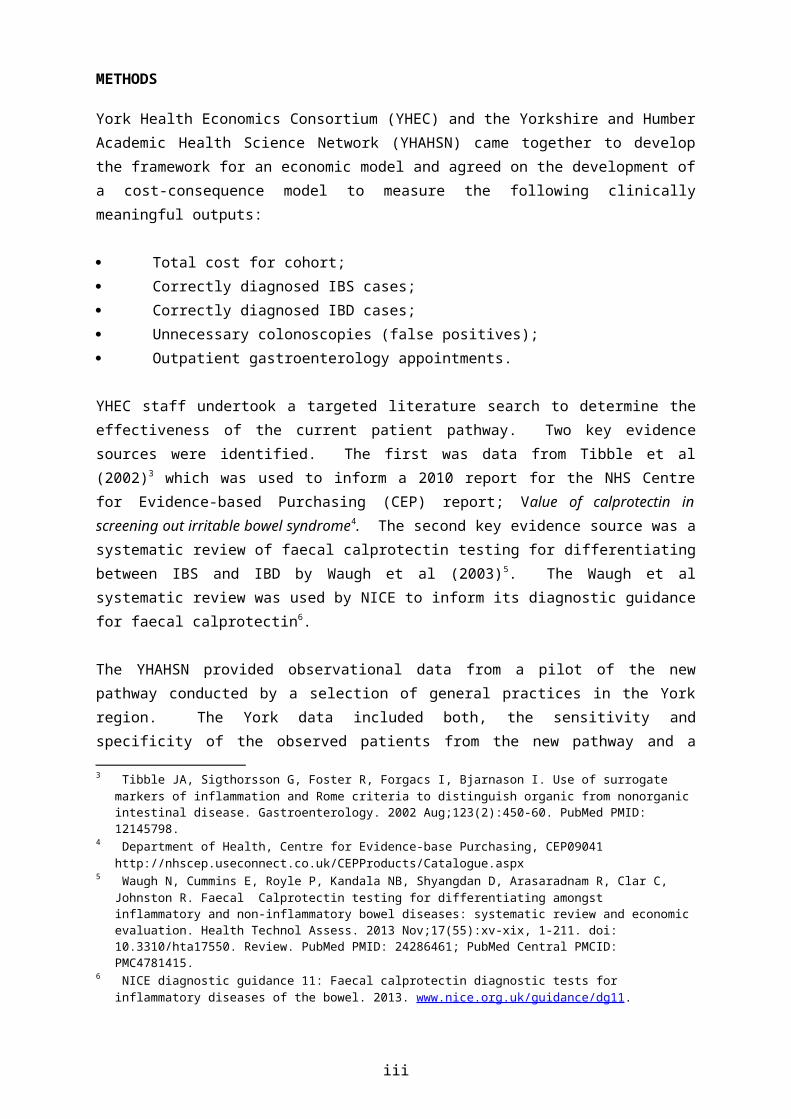
1. Patient presents to GP with lower gastrointestinal symptoms suggestive of IBS or IBD but there is diagnostic uncertainty; cancer is not suspected. Patient receives diagnostic ESR and CRP tests in conjunction with assessment of patient history and physical examination;
2. Patients return to their GP where the GP will make as assessment as to whether to refer to gastroenterology or treat for IBS;
3. Those referred to gastroenterology are either confirmed as having IBD (IBD true positive) or confirmed as not having IBD (IBD false positive) and are treated for IBS;
4. Those treated for IBS will either have their symptoms adequately controlled (IBD true negative) or will remain symptomatic;
5. Those that remain symptomatic will have further testing by their GP and may be started on second-line IBS medication. These patients will either have their symptoms adequately controlled (IBD true negative) or will remain symptomatic;
19 Tibble JA, Sigthorsson G, Foster R, Forgacs I, Bjarnason I. Use of surrogate markers of inflammation and Rome criteria to distinguish organic from nonorganic intestinal disease. Gastroenterology. 2002 Aug;123(2):450-60. PubMed PMID: 12145798.
20 Department of Health, Centre for Evidence-base Purchasing, CEP09041 http://nhscep.useconnect.co.uk/CEPProducts/Catalogue.aspx
21 Waugh N, Cummins E, Royle P, Kandala NB, Shyangdan D, Arasaradnam R, Clar C, Johnston R. Faecal Calprotectin testing for differentiating amongst inflammatory and non-inflammatory bowel diseases: systematic review and economic evaluation. Health Technol Assess. 2013 Nov;17(55):xv-xix, 1-211. doi: 10.3310/hta17550. Review. PubMed PMID: 24286461; PubMed Central PMCID: PMC4781415.
22 NICE, Diagnostic Guidance 11, evidence overview DAP12, https://www.nice.org.uk/guidance/dg11/documents/faecal-calprotectin-diagnostic-tests-for-inflammatory-diseases-of-the-bowel-evidence-overview-dap122
23 Waugh N, Cummins E, Royle P, Kandala NB, Shyangdan D, Arasaradnam R, Clar C, Johnston R. Faecal Calprotectin testing for differentiating amongst inflammatory and non-inflammatory bowel diseases: systematic review and economic evaluation. Health Technol Assess. 2013 Nov;17(55):xv-xix, 1-211. doi: 10.3310/hta17550. Review. PubMed PMID: 24286461; PubMed Central PMCID: PMC4781415.
Section 2 6

6. Those that continue to have unresolved symptoms will be referred on to gastroenterology for further assessment;
7. Patients referred to gastroenterology are either confirmed as having IBD (IBD false negative) or confirmed as not having IBD (IBD true negative) and continue treatment for IBS.
Sensitivity and specificity data for this pathway is informed by Tibble et al or Waugh et al as described above. All pathways use the prevalence data from the YFCCP.
Comparator 2 – NICE Pathway Cut-Off
This pathway assumes the GP has assessed the patient using the suggested FC cut-off in the current NICE guidance DG1124. The observed patient data from the YFCCP has been analysed and the sensitivity and specificity has been calculated based on what would have happened, had this cohort been referred according to the NICE pathway instead of using the intervention pathway. The NICE pathway is detailed below:
1. Patient presents to GP with lower gastrointestinal symptoms suggestive of IBS or IBD but there is diagnostic uncertainty; cancer is not suspected. After appropriate baseline investigations patient receives diagnostic FC test to detect inflammation in conjunction with assessment of patient history and physical examination;
2. Patients return to their GP, those with an FC >50 are referred on to gastroenterology and those with an FC<50 are treated for IBS;
3. Those referred to gastroenterology are either confirmed as having IBD (IBD true positive) or confirmed as not having IBD (IBD false positive) and are treated for IBS;
4. Those treated for IBS will either have their symptoms adequately controlled (IBD true negative) or will remain symptomatic;
5. Those that remain symptomatic will have further testing by their GP and may be started on second-line IBS medication. These patients will either have their symptoms adequately controlled (IBD true negative) or will remain symptomatic;
6. Those that continue to have unresolved symptoms will be referred on to gastroenterology for further assessment;
7. Patients referred to gastroenterology are either confirmed as having IBD (IBD false negative) or confirmed as not having IBD (IBD true negative) and continue treatment for IBS.
Sensitivity and specificity data for this pathway is derived from the YFCCP data. All pathways use the prevalence data from the YFCCP.
This is an important data set as it models the potential real world sensitivity and specificity of the NICE pathway that is experienced in the York region. It will be interesting to investigate the region specific sensitivity and specificity data as this care pathway is up-scaled beyond York.
24 NICE Diagnostic Guidance DG11, Faecal Calprotectin diagnostic tests for inflammatory diseases of the bowel. Published October 2013, updated May 2017. https://www.nice.org.uk/guidance/dg11
Section 2 7

The data from the YFCCP returns a much lower sensitivity and specificity than what the published data shows. This indicates that there may be some comparability issues with the data used by NICE which was taken from studies in secondary care and applying it to the primary care setting.
Comparator 3 – Published Data for >50ug/g Pathway Cut-Off
This pathway uses the NICE pathway as described in Comparator 2. There is a drop-down feature in this part of the model that allows the user to select between two sets of published data. To ensure consistency we have used the Tibble et al data from the CEP review (2002) and the Waugh et al data used in the NICE Guidelines (2013). The prevalence data for all pathways is from the YFCCP.
2.4 MODEL SCHEMATIC OF PATIENT PATHWAYS
The model structure for the intervention arm and comparator arms are depicted in Figure 2.1 and Figure 2.2. The model schematics are amended versions of the schematic used for the CEP report (2010)25.
25 Department of Health, Centre for Evidence-base Purchasing, CEP09041 http://nhscep.useconnect.co.uk/CEPProducts/Catalogue.aspx
Section 2 8
Figure 2.1: Intervention pathway
Section 2 9
Symptoms adequately controlled
Symptoms inadequately controlled - more
intensive management (further tests &
medication prescribed)
Patients presents with:- lower gastrointestinal (suspected IBS) symptoms - 'red flags' absent
Refer to gastroenterology /
colonoscopy
Return to GP for results: FC>100
Return to GP for results: FC<100
Undetermined - referred to
specialist for more tests, including
colonoscopy
Management of IBS
(dietary/lifestyle) for 2 months, then
return to GP
IBD false negativeIBS false positive
IBD true negativeIBS true positive
IBD true negativeIBS true positive
IBD true negativeIBS true positiveSymptoms adequately controlled - do not return to GP further
Positive
Negative
Positive
Negative
Return to GP for results: FC<100
Symptoms do not resolve: return to GP
Test for FC(initial GP visit)
Second test for FC
FC>100
IBD true positiveIBS true negative
IBD false positiveIBS false negative

Figure 2.2: Comparator pathway
Section 2 10
IBD false negative
IBD true negative
IBD true negative
IBD true negativeIBS true positive
IBD true positiveIBS true negative
IBD false positive
Negative
Positive
Undetermined - referred to
specialist for more tests, including
endoscopy
Patients presents with:- lower gastrointestinal (suspected IBS) symptoms - 'red flags' absent
Refer to gastroenterology / colonoscopy
Management of IBS
(dietary/lifestyle) for 2 months, then
return to GP
Return to GP for results: FC>50 (or ESR
/ CRP testing)
Return to GP for results: FC<50 (or GP diagnosis
of IBS)
Symptoms adequately controlled - do not return to GP further
Symptoms inadequately
controlled - more intensive
management (further tests &
medication prescribed)
Positive
Symptoms do not
resolve: return to
GP
Symptoms adequately controlled
Test for inflammation
(initial GP visit)
Negative IBS false negative
IBS true positive
IBS false positive
IBS true positive

2.5 EFFECTIVENESS
The effectiveness data used in the modelling is displayed in Table 2.1.
Table 2.1: Effectiveness data used in model
Test Sensitivity SpecificityIntervention (YFCCP data) 94% 92%No FC testing (ESR + CRP) (Tibble et al)26 35% 73%GP Pathway (Waugh et al)27 100% 79%Standard cut-off (YFCCP data) 94% 61%Published FC testing (Tibble et al)28 90% 80%Published FC testing (Waugh et al)29 93% 94%
2.6 COSTS
The costs used in the model are displayed in Table 2.2.
Table 2.2: Costs used in model
Description of event Unit Cost SourceGP Visit £65 Personal Social Services Research Unit30
ESR + CRP test £9.28 NICE Faecal Calprotectin costing template31
Faecal Calprotectin test £23 NICE Faecal Calprotectin costing template32
IBS medication 1st line £26 Drug tariff July 201733
IBS second line £76 Drug tariff July 201734
Outpatient gastroenterology £141 NHS reference costs35
Colonoscopy £499 NHS reference costs36
26 Tibble JA, Sigthorsson G, Foster R, Forgacs I, Bjarnason I. Use of surrogate markers of inflammation and Rome criteria to distinguish organic from nonorganic intestinal disease. Gastroenterology. 2002 Aug;123(2):450-60. PubMed PMID: 12145798.
27 NICE, Diagnostic Guidance 11, evidence overview DAP12, https://www.nice.org.uk/guidance/dg11/documents/faecal-calprotectin-diagnostic-tests-for-inflammatory-diseases-of-the-bowel-evidence-overview-dap122
28 Tibble JA, Sigthorsson G, Foster R, Forgacs I, Bjarnason I. Use of surrogate markers of inflammation and Rome criteria to distinguish organic from nonorganic intestinal disease. Gastroenterology. 2002 Aug;123(2):450-60. PubMed PMID: 12145798.
29 NICE, Diagnostic Guidance 11, evidence overview DAP12, https://www.nice.org.uk/guidance/dg11/documents/faecal-calprotectin-diagnostic-tests-for-inflammatory-diseases-of-the-bowel-evidence-overview-dap122
30 PSSRU unit costs, http://www.pssru.ac.uk/project-pages/unit-costs/31 NICE DG11, Faecal calprotectin diagnostic tests for inflammatory diseases of the bowel, resources, costing
template. https://www.nice.org.uk/guidance/dg11/resources32 NICE DG11, Faecal calprotectin diagnostic tests for inflammatory diseases of the bowel, resources, costing
template. https://www.nice.org.uk/guidance/dg11/resources33 Drug Tariff, http://www.drugtariff.nhsbsa.nhs.uk/#/00462733-DA_1/DA00462451/Part VIIIA products L34 Drug Tariff, http://www.drugtariff.nhsbsa.nhs.uk/#/00462733-DA_1/DA00462451/Part VIIIA products L35 National schedule of reference costs: the main schedule, https://www.gov.uk/government/publications/nhs-
reference-costs-2015-to-201636 National schedule of reference costs: the main schedule, https://www.gov.uk/government/publications/nhs-
reference-costs-2015-to-2016
Section 2 11

The costs for first line IBS medication were made up of two month’s supply of loperamide, mebeverine and ispaghula husk37. The cost for second line IBS medication were made up of 2 month’s supply of amitriptyline hydrochloride and linaclotide38.
The following assumptions were used to calculate the proportion of patients receiving each treatment. These assumptions were informed by expert clinical advice.
Assumptions:
For patients screened positive for IBD 100% will have a specialist visit and colonoscopy. Therefore, false positives incur the same system costs as true positives;
For patients screened negative for IBD and do not have IBD:o 20% will have further testing (either FC or ESR + CRP);o 50% will be prescribed first line IBS treatment;o 20% will have unresolved symptoms after first line IBS treatment and will visit
their GP;o 65% of those patients who had unresolved symptoms from first line treatment
will have second line IBS treatment;o 7.5% of all patients screened negative for IBD will be referred to
gastroenterologyo 38% of those screened negatively and referred to gastroenterology will have a
colonoscopy. For patients screened negative for IBD but actually have IBD:
o 100% will return to their GP, 50% will be started on first line IBS medication;o 100% of patients will remain symptomatic and will return to their GP, 65% of
those patients that started first line IBS treatment will be prescribed second line IBS treatment;
o 100% will have further testing (either FC or ESR + CRP);o 100% will remain symptomatic and be referred to gastroenterology;o 100% will have a colonoscopy.
2.7 OUTPUTS
The model reported the following outputs:
Total cost for cohort; Correctly diagnosed IBS cases; Correctly diagnosed IBD cases; Unnecessary colonoscopies (false positives); Outpatient gastroenterology appointments.
37 NICE Diagnostic Guidance DG11, Faecal Calprotectin diagnostic tests for inflammatory diseases of the bowel. Published October 2013, updated May 2017. https://www.nice.org.uk/guidance/dg11
38 NICE Diagnostic Guidance DG11, Faecal Calprotectin diagnostic tests for inflammatory diseases of the bowel. Published October 2013, updated May 2017. https://www.nice.org.uk/guidance/dg11
Section 2 12

Using the above data, the model calculates the following:
Incremental cost; Incremental correctly diagnosed IBS cases; Incremental correctly diagnosed IBD cases; Incremental unnecessary colonoscopies (false positives); Incremental outpatient gastroenterology appointments; Number needed to treat (NNT) to avoid an unnecessary colonoscopy; NNT to avoid an outpatient gastroenterology referral.
Section 2 13

Section 3: Results
3.1 SUMMARY
Using data from the first 950 patients with up to 9 months follow up for the YFCCP the IBD prevalence is predicted at 8.1% and the sensitivity and specificity for the intervention cohort was 94% and 92%.
When compared to four of the five comparators used in the model, the model predicts the intervention arm is a cost-saving strategy. It is dominant when compared to Tibble et al in both the no FC and >50ug/g cut-off strategies. It is cost saving but diagnoses fewer cases of IBD when compared with the Waugh et al data for the no FC pathway.
The YFCCP pathway achieves very similar clinical outcomes when compared with the Waugh et al systematic review for the >50ug/g cut-off. This indicates that the intervention pathway is approaching parity with the secondary care published data that was used by NICE in their assessment of the FC pathway using the Waugh et al39 systematic review. However, the YFCCP pathway was cost incurring due to the second round of FC testing.
Clinical experts consider the Waugh et al data may not be comparable because the studies used to inform the data were from a secondary care setting and in ideal clinical conditions. This means the patients are potentially quite different from the population we would expect to see in primary care in the UK40.
The results of the model are displayed in Tables 3.1 to 3.11. We have presented the data in separate tables for the intervention arm assuming 100% and 85% GP adherence with the pathway.
39 Waugh N, Cummins E, Royle P, Kandala NB, Shyangdan D, Arasaradnam R, Clar C, Johnston R. Faecal Calprotectin testing for differentiating amongst inflammatory and non-inflammatory bowel diseases: systematic review and economic evaluation. Health Technol Assess. 2013 Nov;17(55):xv-xix, 1-211. doi: 10.3310/hta17550. Review. PubMed PMID: 24286461; PubMed Central PMCID: PMC4781415
40 Jellema P, van Tulder MW, van der Horst HE, Florie J, Mulder CJ, van der Windt DA. Inflammatory bowel disease: a systematic review on the value of diagnostic testing in primary care. Colorectal Dis 2011;13:239–54. 10.1111/j.1463-1318.2009.02131.x.
Section 3 14

3.2 INTERVENTION COMPARED WITH ESR AND CRP
Table 3.1: Summary results for intervention compared to no FC assuming 100% GP adherence with the intervention pathway and using Tibble et al as the evidence source for the comparator
Intervention No FC (ESR + CRP) Incremental NNTTotal costs £311,159 £421,642 -£110,483Correctly diagnosed IBS cases 845 671 175Correctly diagnosed IBD cases 76 28 47Unnecessary colonoscopies (i.e. false +ves) 74 248 -175 5.7Outpatient appointments 218 379 -162 6.2
Table 3.2: Summary results for intervention compared to no FC assuming 85% GP adherence with the intervention pathway and using Tibble et al as the evidence source for the comparator
Intervention No FC (ESR + CRP) Incremental NNTTotal costs £324,298 £421,642 -£97,223Correctly diagnosed IBS cases 819 671 148Correctly diagnosed IBD cases 69 28 40Unnecessary colonoscopies (i.e. false +ves) 100 248 -148 6.7Outpatient appointments 185 379 -194 5.1
The data in the tables above shows that the intervention is cost saving and of clinical benefit when compared to the published data for ESR and CRP testing. When we assume a lower level of GP adherence with the pathway, the model still returns a dominant result.
Section 3 15

3.3 INTERVENTION COMPARED WITH NICE GP PATHWAY
Table 3.3: Summary results for intervention compared to no FC assuming 100% GP adherence with the intervention pathway and using the NICE pathway as the evidence source for the comparator
Intervention No FC (ESR + CRP) Incremental NNTTotal costs £311,159 £378,881 -£67,723Correctly diagnosed IBS cases 845 726 119Correctly diagnosed IBD cases 76 81 -5Unnecessary colonoscopies (i.e. false +ves) 74 193 -119 8.4Outpatient appointments 218 328 -111 9.0
Table 3.4: Summary results for intervention compared to no FC assuming 85% GP adherence with the intervention pathway and using the NICE pathway as the evidence source for the comparator
Intervention No FC (ESR + CRP) Incremental NNTTotal costs £318,298 £378,881 -£60,583Correctly diagnosed IBS cases 828 726 102Correctly diagnosed IBD cases 77 81 -4Unnecessary colonoscopies (i.e. false +ves) 91 193 -102 9.8Outpatient appointments 185 328 -143 7.0
When compared to the GP pathway using the pooled data from the NICE commissioned analysis the intervention arm is cost saving by approximately £67,000 per 1,000 patients. The intervention arm also correctly diagnoses more IBS and avoids over 100 colonoscopies and gastroenterology outpatient appointments. However, there is a trade off with the NICE GP pathway diagnosing an additional 4-5 case of IBD due to the 100% sensitivity in the comparator arm. The results are very similar when we assume a reduced GP adherence with the intervention pathway.
Section 3 16
3.4 INTERVENTION COMPARED WITH STANDARD CUT-OFF
Table 3.5: Summary results for intervention compared to FC >50ug/g cut-off in a single stool sample using YFCCP data projections and assuming 100% GP adherence with the intervention pathway
Intervention Standard cut-off Incremental NNTTotal costs £311,159 £471,158 -£159,999Correctly diagnosed IBS cases 845 557 289Correctly diagnosed IBD cases 76 76 0Unnecessary colonoscopies (i.e. false +ves) 74 362 -289 3.5Outpatient appointments 218 485 -267 3.7
Table 3.6: Summary results for intervention compared to FC >50ug/g cut-off in a single stool sample using YFCCP data projections and assuming 85% GP adherence with the intervention pathway
Intervention Standard cut-off Incremental NNTTotal costs £318,298 £471,158 -£152,859Correctly diagnosed IBS cases 828 557 271Correctly diagnosed IBD cases 77 76 1Unnecessary colonoscopies (i.e. false +ves) 91 362 -271 3.7Outpatient appointments 185 485 -300 3.3
When comparing the YFCCP data from the intervention arm with the projected data where the >50ug/g cut-off has been used, the model returns the most dominant result of all the comparators with a £160,000 saving and greater than 250 more correctly diagnosed IBS cases. The intervention arm avoids an unnecessary colonoscopy and gastroenterology outpatient referral for every four patients seen in primary care.
Section 3 17

3.5 INTERVENTION COMPARED WITH PUBLISHED DATA 1
Table 3.7: Summary results for intervention compared to FC >50ug/g cut-off in a single stool sample using published data when assuming 100% GP adherence and using Tibble et al as the evidence source for the comparator
Intervention Published data Incremental NNTTotal costs £311,159 £368,298 -£50,140Correctly diagnosed IBS cases 845 735 110Correctly diagnosed IBD cases 76 73 3Unnecessary colonoscopies (i.e. false +ves) 74 184 -110 9.1Outpatient appointments 218 320 -102 9.8
Table 3.8: Summary results for intervention compared to FC >50ug/g cut-off in a single stool sample using published data when assuming 85% GP adherence and using Tibble et al as the evidence source for the comparator
Intervention Published data Incremental NNTTotal costs £318,298 £368,298 -£50,000Correctly diagnosed IBS cases 828 735 92Correctly diagnosed IBD cases 77 73 4Unnecessary colonoscopies (i.e. false +ves) 91 184 -92 10.8Outpatient appointments 185 320 -135 7.4
In this scenario with the intervention compared to the published data for >50ug/g cut-off, the intervention arm dominates with both a saving and clinical benefit. The intervention arm diagnoses more than 100 additional IBS cases in primary care and an additional 3-4 IBD cases. The intervention arm avoids >100 gastroenterology outpatient referrals and unnecessary colonoscopies. The result remains dominant when a reduced GP adherence of 85% is assumed.
Section 3 18

3.6 INTERVENTION COMPARED WITH PUBLISHED DATA 2
Table 3.9: Summary results for intervention compared to FC >50ug/g cut-off in a single stool sample using published data when assuming 100% GP adherence and using the NICE pathway as the evidence source for the comparator
Intervention Published data Incremental NNTTotal costs £311,159 £293,290 £17,869Correctly diagnosed IBS cases 845 864 -18Correctly diagnosed IBD cases 76 75 0Unnecessary colonoscopies (i.e. false +ves) 74 55 18 -54.4Outpatient appointments 218 201 -16 -58.8
Table 3.10: Summary results for intervention compared to FC >50ug/g cut-off in a single stool sample using published data when assuming 85% GP adherence and using the NICE pathway as the evidence source for the comparator
Intervention Published data Incremental NNTTotal costs £318,298 £293,290 £25,014Correctly diagnosed IBS cases 828 864 -36Correctly diagnosed IBD cases 77 75 1Unnecessary colonoscopies (i.e. false +ves) 91 55 36 -27.5Outpatient appointments 185 201 -16 -63.7
When comparing the intervention pathway with the NICE published data for the >50ug/g cut-off, the model estimates that the intervention arm is more costly incurring an additional £18,000. It is also less effective at diagnosing IBS cases but does diagnose slightly more IBD cases per 1,000 patients at a cost of £20,937 per diagnosed IBD case. The intervention pathway does have slightly fewer gastroenterology referrals but higher unnecessary colonoscopies.
The difference in sensitivity and specificity for these two arms is not statistically significant. This means we could expect clinically similar outcomes in each arm. However, there would be an additional cost in the intervention arm due to the second round of FC testing.
Section 3 19

This report has previously discussed some of the potential issues when using the data from the NICE pathway as a comparator. The main issue being that the NICE pathway uses evidence from secondary care and applies it to a primary care setting.
3.7 PUBLISHED DATA USED BY NICE COMPARED WITH STANDARD CUT-OFF
Table 3.11: Summary results for published data (NICE) compared to FC >50ug/g cut-off in a single stool sample using YFCCP data projections
Published data Standard cut-offIncremental published data -v- standard cut-
offStandard cut-off -v-
published data
Total costs £293,164 £471,076 -£177,912 £177,912Correctly diagnosed IBS cases 864 557 307 -307Correctly diagnosed IBD cases 75 76 -1 1Unnecessary colonoscopies (i.e. false +ves) 55 362 -307 307
This scenario compares the published data for the >50ug/g cut-off in a single stool sample using the NICE published data with the YFCCP projected data for the >50ug/g cut-off. This shows the NICE published data estimates a saving of £180,000 per 1,000 patients mainly through the greater than 300 false positives that are referred on from primary care which actually have IBS. This shows a significant gap in what is being experienced in the NHS system at York for gastrointestinal presentations when compared with those predicted in the NICE guidelines.
Section 3 20

Section 4: Sensitivity Analysis
4.1 SENSITIVITY ANALYSIS
We developed the model with the main comparator being published data for primary care in a setting where FC is not being used. This is the most similar scenario to what is being experienced in primary care across Yorkshire and Humber. The sensitivity analysis only looks at the intervention arm when compared to the no FC arm (which can be toggled between Tibble et al and NICE data). All sensitivity analysis was univariate (we changed one variable at a time and held all others at their base-case value) and deterministic (the model variable we were adjusting are manually changed rather than through probabilistic computer generation).
We set up sensitivity analysis to assess the impact of the prevalence of IBD, the GP uptake of the intervention and the effectiveness of the intervention arm. The results are reported using a format of incremental cost per correctly diagnosed IBD, incremental cost per correctly diagnosed IBS and incremental cost per unnecessary colonoscopy avoided.
Prevalence of IBD
For the prevalence of IBD, we varied the range from 0% to 20%. The intervention arm was dominant (cost saving and better health benefits) across all outcomes except at a prevalence of 0% for the incremental cost per IBD patient where at this setting there would be no IBD. In a scenario where IBD did not exist in the patient population the intervention would still be cost saving but there would be no IBD to detect so it would save money due to its greater efficacy at predicting IBS. It is important to note that the 95% confidence interval for prevalence from the YFCCP data is 6.5% - 10%. The intervention arm is dominant across all outcomes within the 95% confidence interval range.
GP Adherence
We varied GP adherence with the intervention arm between 0 and 100%. At 0%, we assume that all GPs are ignoring the new pathway and using current practice as determined by the NICE published data to predict IBD and IBS. This means that at 0% adherence both arms are identical. As soon as we reach 1% the intervention arm dominates (cost saving with better health benefits) the comparator. The intervention arm remains dominant from 1% to 100% meaning that as soon as one GP starts to use the intervention pathway, the model predicts a saving and more accurate diagnosis.
Section 4 21

Effectiveness
We varied sensitivity and specificity in the intervention arm between 50% and 100% to test a range of scenarios. It is important to note that the 95% confidence interval for the intervention arm based on the YFCCP data is sensitivity 85%-98% and specificity 90%-94%.
The intervention arm is dominant at all levels of specificity above 75% if specificity drops below 75% then the intervention arm starts to incur cost due to the increase in false positives being treated in secondary care. For IBS and unnecessary colonoscopies avoided, the comparator arm would dominate the intervention arm (the intervention arm incurs more cost and is less effective). However, the intervention arm would still be more effective at diagnosing IBD. At a sensitivity and specificity of 70% and 70%, the cost per IBD correctly diagnosed would be £469. As stated earlier when the 95% confidence intervals are used as our sensitivity ranges, the intervention arm is dominant for all outcome measures when compared to the projected data from the YFCCP.
Section 4 22

Section 5: Discussion
5.1 SUMMARY
When compared to four of the five comparators used in the model, the model predicts the intervention arm is a cost-saving strategy. It is dominant when compared to Tibble et al in both the no FC and >50ug/g cut-off strategies. It is cost saving but diagnoses fewer cases of IBD when compared with the NICE data for the no FC pathway. The one comparator that the intervention arm did not have dominance was in the NICE data from the Waugh et al systematic review, which had a sensitivity and specificity of 93% and 94% respectively. Nearly all studies used in the Waugh et al systematic review came from secondary care studies41. This could be interpreted that the sensitivity and specificity from that pooled analysis is reflective of FC testing in an optimum environment as it essentially uses a population that has already undergone primary care screening. It is noted in the text of Waugh et al that Jellema et al42 had reservations about applying results from specialist care to primary care.
It is important to note that the 95% confidence intervals for the YFCCP pathway and the Waugh et al systematic review overlap enormously as displayed in Table 5.1:
Table 5.1: 95% confidence intervals for YFCCP and Waugh et al
Source Sensitivity Lower Upper Specificity Lower UpperYFCCP 94% 85% 98% 92% 90% 94%Waugh et al 93% 83% 97% 94% 73% 99%
The above table illustrates that there is no statistical significance between the two pathways although there would be an additional cost in the YFCCP arm due to the second round of FC testing. The additional cost is illustrated in Table 3.9 above.
We also ran a separate scenario comparing the published data from Waugh et al for the >50 ug/g cut-off, which was used by NICE, with the projected data for the >50ug/g cut-off single stool sample from the YFCCP. The model predicted the Waugh et al arm would be £170,000 less expensive per 1,000 patients and would diagnose 300 more cases of IBS in primary care than the YFCCP real world observational data predicts.
41 Waugh N, Cummins E, Royle P, et al. Faecal calprotectin testing for differentiating amongst inflammatory and non-inflammatory bowel diseases: systematic review and economic evaluation. Southampton (UK): NIHR Journals Library; 2013 Nov. (Health Technology Assessment, No. 17.55.) Chapter 2, Results of clinical effectiveness review.
42 Jellema P, van Tulder MW, van der Horst HE, Florie J, Mulder CJ, van der Windt DA. Inflammatory bowel disease: a systematic review on the value of diagnostic testing in primary care. Colorectal Dis 2011;13:239–54. 10.1111/j.1463-1318.2009.02131.x.
Section 5 23

This comparison shows the vast gulf between using FC in an optimal environment and using FC in primary care for low risk patients who exhibit no red flags upon presentation. There is the potential that using the current NICE guidelines and assuming the optimal sensitivity and specificity data could actually be costing the NHS significantly in terms of patient outcomes, wait times for treatment and longer waitlists for gastroenterology outpatient appointments that are being taken up by unnecessary referrals. We would recommend that there needs to be further study on FC in a primary care environment using a range of FC cut-offs.
/tt/file_convert/5c457f9893f3c34c5a3878b1/document.docx CF/18.12.17
Section 4 24


![[Irmãs Royle 03] - Como casar com um príncipe - Kathryn Caskie](https://img.pdfslide.net/doc/110x75/577d20031a28ab4e1e91cbb9/irmas-royle-03-como-casar-com-um-principe-kathryn-caskie.jpg)