Embed Size (px)
Citation preview

How to Identify Opioid Intervention Opportunities in the UDS Mapper
www.udsmapper.org

How to Identify Opioid Intervention Opportunities in the UDS Mapper 2
Acronyms Used in This Lesson
Acronym What It Stands ForAIMS Access Increases in Mental Health and Substance Abuse Services CDC Centers for Disease Control and PreventionCMS Centers for Medicare and Medicaid ServicesFORHP Federal Office of Rural Health PolicyHCP Health Center ProgramHRSA Health Resources and Services AdministrationMAT Medication-Assisted TreatmentSAMHSA Substance Abuse and Mental Health Services AdministrationUDS Uniform Data SystemZCTA ZIP Code Tabulation Area
www.udsmapper.org

How to Identify Opioid Intervention Opportunities in the UDS Mapper 3
Mapping Areas of Priority (MAP) for Medication-Assisted Treatment (MAT)MAP for MAT is a UDS Mapper enhancement designed to assist in identifying areas of high need and existing servicesMAP for MAT data include:
• Health facilities providing opioid-related services, including HRSA-funded awardees such as:
– Substance use disorder treatment facilities– MAT Waivered Providers
• Population Indicators Tool focuses on opioid-related data such as:– Drug poisoning mortality – Opioid dispensing/prescribing rates
www.udsmapper.org
How to Identify Opioid Intervention Opportunities in the UDS Mapper 4
MAP for MAT Health Facilities
Available within Explore Health Related Facilities tool Includes facility name, address, and type Includes additional information about health centers including number of providers with MAT waiver and number of patients receiving MAT services
www.udsmapper.org

How to Identify Opioid Intervention Opportunities in the UDS Mapper 5
Available MAP for MAT Health Facilities
Data from SAMHSA:• Substance Abuse and Addiction Treatment Facilities• Mental Health Facilities• MAT Waivered Providers
Data from HRSA:• HCP Health Centers with MAT Provider• AIMS Awardees• FORHP Rural Health Opioid Program Awardees• FORHP Substance Abuse Treatment Telehealth Awardees
www.udsmapper.org

How to Identify Opioid Intervention Opportunities in the UDS Mapper 6
How to Open MAP for MAT Health Facilities DataClick on the ExploreHealth Related Facilities tool icon (looks like a cross) in the Tool Box in the upper right corner of the map If you only see a blue bar with a few tool buttons, click the white, downward-pointing arrow to reveal the tools
www.udsmapper.org

How to Identify Opioid Intervention Opportunities in the UDS Mapper 7
Substance Abuse and Mental Health Facilities
Displays facilities from the SAMHSA Behavioral Health Treatment Facility Locator
Information Card provides name of location, address, and facility type
www.udsmapper.org

How to Identify Opioid Intervention Opportunities in the UDS Mapper 8
MAT Waivered Providers
Displays MAT Waivered Providers (data acquired from SAMHSA)
• Physicians• Physician Assistants• Nurse Practitioners
Information Card provides name of location and address
www.udsmapper.org

How to Identify Opioid Intervention Opportunities in the UDS Mapper 9
Health Centers with MAT Provider
Displays Health Centers with MAT Provider
Information Card provides:• Name of location• Address• Number of MAT providers• Number of patients receiving
MAT services, if any
www.udsmapper.org

How to Identify Opioid Intervention Opportunities in the UDS Mapper 10
AIMS Awardees
Displays AIMS Awardees
Information Card provides name of location, address, and program
www.udsmapper.org

How to Identify Opioid Intervention Opportunities in the UDS Mapper 11
Rural Health Opioid Program Awardees
Displays HRSA FORHP Rural Health Opioid Program Awardees
Information Card provides name of location, address, and program
www.udsmapper.org

How to Identify Opioid Intervention Opportunities in the UDS Mapper 12
Substance Abuse Treatment Telehealth Awardees
Displays HRSA FORHP Substance Abuse Treatment Telehealth Awardees
Information Card provides name of location, address, and program
www.udsmapper.org

How to Identify Opioid Intervention Opportunities in the UDS Mapper 13
MAP for MAT Population Indicators
Enables you to find high need areas based on opioid-epidemic related data
• High need is determined by the user
About the data:• See https://www.udsmapper.org/knowledge-base.cfm for the
most current data source dates• All data are displayed by county
www.udsmapper.org

How to Identify Opioid Intervention Opportunities in the UDS Mapper 14
Available MAP for MAT Population Indicators Data
Data from CDC:• Drug Poisoning Mortality• Retail Opioid Dispensing Rate
Data from CMS:• Part D Opioid Prescribing Rate
Data from SAMHSA:• MAT Waivered Provider Rate• Number of MAT Waivered Providers
www.udsmapper.org

How to Identify Opioid Intervention Opportunities in the UDS Mapper 15
Clear Colored Layers from the Map
MAP for MAT Population Indicators data are best visualized with a clear map background Before displaying any population data on the map, you should remove other colorful data layers including the Main Maps
• Open the Main Maps tool, click No Main Map Selected
www.udsmapper.org
How to Identify Opioid Intervention Opportunities in the UDS Mapper 16
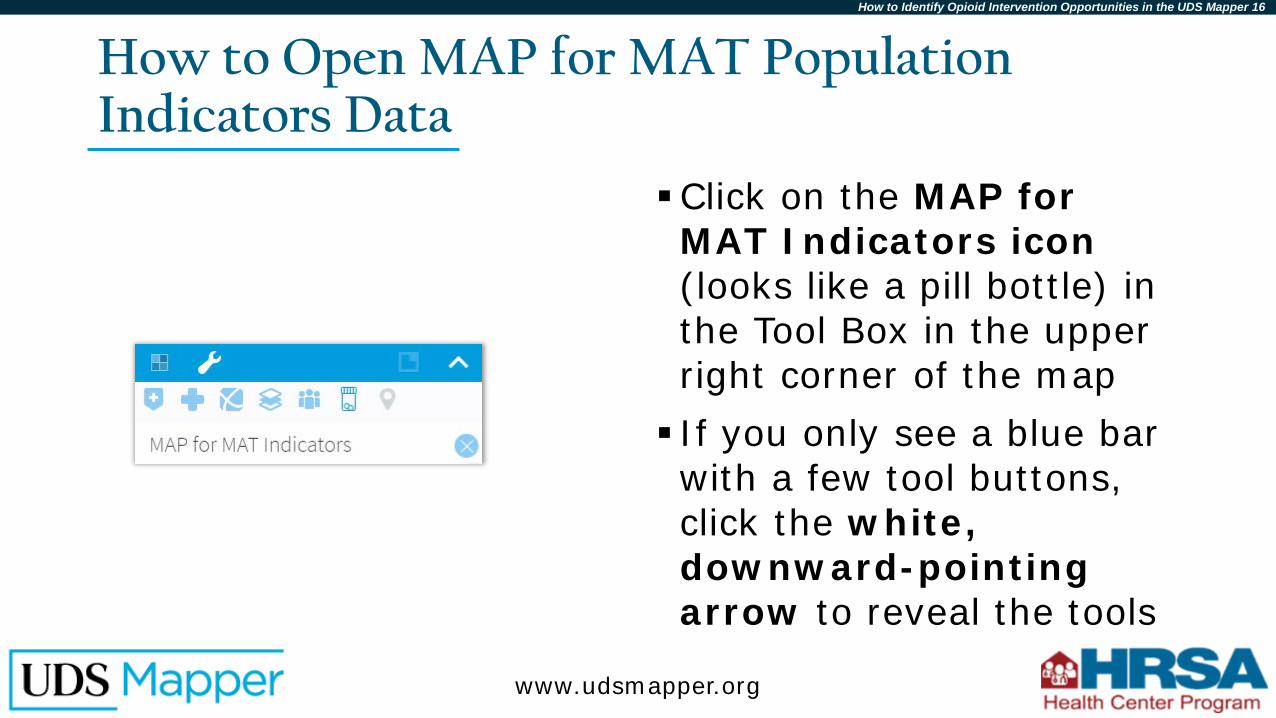
How to Open MAP for MAT Population Indicators Data
Click on the MAP for MAT Indicators icon (looks like a pill bottle) in the Tool Box in the upper right corner of the map If you only see a blue bar with a few tool buttons, click the white, downward-pointing arrow to reveal the tools
www.udsmapper.org

How to Identify Opioid Intervention Opportunities in the UDS Mapper 17
Zoom Level to Use the MAP for MATPopulation Indicators Tool
You must be close to the map in order to activate the indicators If starting at the default level, zoom in once
How to Identify Opioid Intervention Opportunities in the UDS Mapper 18
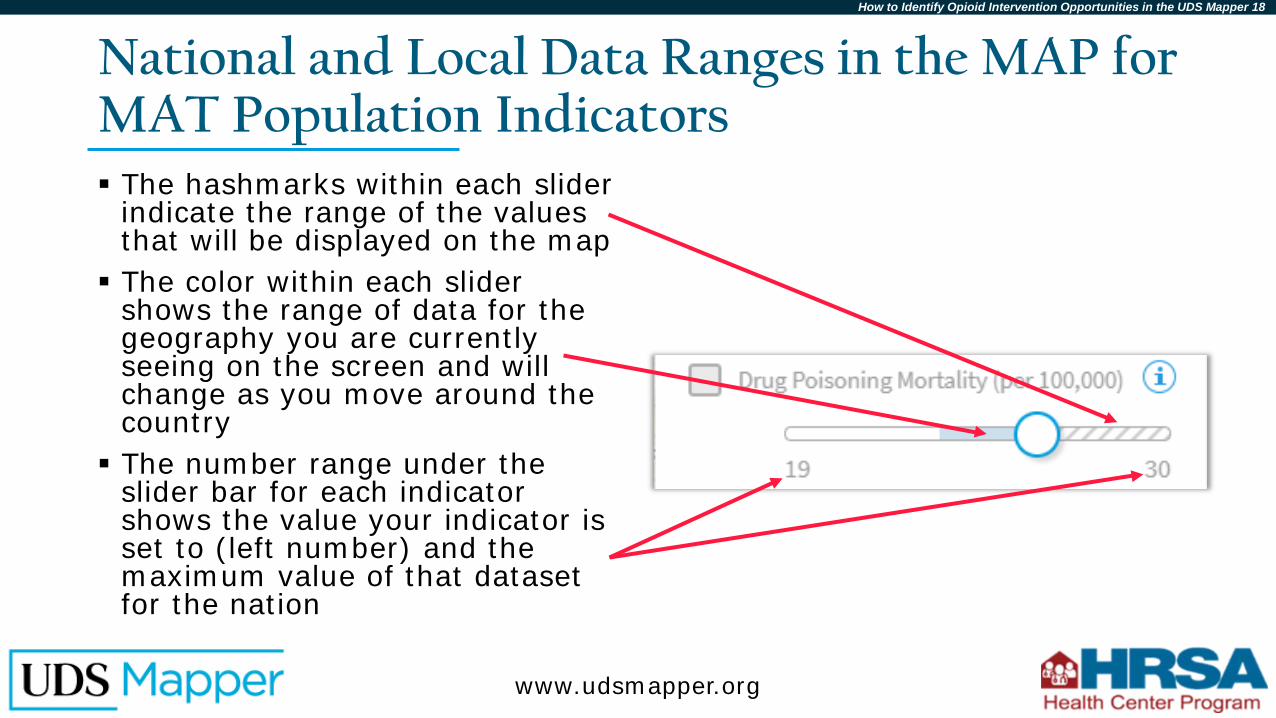
National and Local Data Ranges in the MAP for MAT Population Indicators The hashmarks within each slider
indicate the range of the values that will be displayed on the map The color within each slider
shows the range of data for the geography you are currently seeing on the screen and will change as you move around the country The number range under the
slider bar for each indicator shows the value your indicator is set to (left number) and the maximum value of that dataset for the nation
www.udsmapper.org

How to Identify Opioid Intervention Opportunities in the UDS Mapper 19
Turn on a MAP for MAT Population Indicator
Every indicator’s sliding circle is automatically set to the national average for that indicator
When you turn on an indicator, the colored areas are counties with values indicating higher need than counties at the national average

How to Identify Opioid Intervention Opportunities in the UDS Mapper 20
Use Reasonable Benchmarks
Because you can set your own values in this tool, it is important to use reasonable benchmarks when looking for “high” need
• By default, the indicator is set to the national average
Otherwise, saying that an area has high need may be false – it must be compared to something tangible rather than just a user selected number
www.udsmapper.org

How to Identify Opioid Intervention Opportunities in the UDS Mapper 21
Where to Find Benchmarks
Benchmarks other than the national average include state averagesWhile you can use any benchmark you want, the state rates for drug poisoning mortality, retail opioid dispensing, and Part D opioid prescribing are available on the UDS Mapper site https://www.udsmapper.org/benchmarks.cfm
www.udsmapper.org

How to Identify Opioid Intervention Opportunities in the UDS Mapper 22
Population Indicator Benchmark (1)
Set appropriate benchmark Indiana has a
retail opioid dispensing rate of 84 prescriptions per 100 people This is higher
than the national average of 66

How to Identify Opioid Intervention Opportunities in the UDS Mapper 23
Population Indicator Benchmark (2)
Turn off the retail opioid dispensing rate and turn on drug poisoning mortality Indiana has a
drug poisoning mortality rate of 24 deaths per 100,000 people

How to Identify Opioid Intervention Opportunities in the UDS Mapper 24
Compare IndicatorsTurn the opioid dispensing rate indicator back on and look for overlap to find cold spots of need based on multiple indicators
Green areas: retail opioid dispensing rate of at least 84
Blue areas: drug poisoning mortality of at least 24
Blended areas: retail opioid dispensing rate of at least 84 and drug poisoning mortality of at least 24
Because blended colors will not appear in the legend, we recommend you not turn on more than two indicators at a time, as colors will blend and start to become confusing

How to Identify Opioid Intervention Opportunities in the UDS Mapper 25
Show Providers and Areas of Need
Example: Turn on
Substance Abuse and Mental Health Facilities and MAT Waivered Providers Turn on Drug
Poisoning Mortality Determine
potential areas of unmet need

How to Identify Opioid Intervention Opportunities in the UDS Mapper 26
Downloading MAP for MAT Data
The MAP for MAT Population Indicators cannot currently be downloaded from the UDS Mapper
• You can save or print your map• For more detailed information see How to Save or Print Maps
and Data in the Tutorials & Resources section of the UDS Mapper website
To visually determine data in a specific county, gradually move the slider button and note when the area becomes unfilled
• For example, if you move the slider setting for drug poisoning mortality from 16 to 17, and you see Vermillion County become unfilled, you know that the drug poisoning mortality rate in Vermillion County is 16 deaths per 100,000 people
www.udsmapper.org
How to Identify Opioid Intervention Opportunities in the UDS Mapper 27
MAP for MAT Data Limitations
Remember that MAP for MAT Population Indicators are presented at the county level so you will be looking at data for different geography levels This means that in a county with a high drug poisoning mortality rate, turning on a ZCTA-level Population Indicator like Pop: Low-Income (%) may create blended areas.However, you cannot infer that the drug poisoning mortality rate is high in an individual ZCTA as it is only reported at the county level. The county as a whole may be high, but it may not be in that ZCTA. For more detailed information, see How to Use the
Population Indicators Tool in the UDS Mapper in the Tutorials & Resources section of the UDS Mapper website
www.udsmapper.org

How to Identify Opioid Intervention Opportunities in the UDS Mapper 28
Other Data in the UDS Mapper
Any other tool within the UDS Mapper may be used with MAP for MAT layers Learn more in the Tutorials & Resources section of the UDS Mapper website
• Population Indicators– See How to Use the Population Indicators Tool in the UDS Mapper
• Health Related Facilities– See How to Add Health Related Facilities to the Map and Create a
Report • Main Maps
– See How to Use the Main Maps Tool • Map My Data
– See How to Use the Map My Data Tool to Upload Your Own Address Data
www.udsmapper.org

How to Identify Opioid Intervention Opportunities in the UDS Mapper 29
End of Lesson
Proceed to the next lesson to continue learning how to use the UDS Mapper
www.udsmapper.org