Embed Size (px)
Citation preview

Int.J.Curr.Microbiol.App.Sci (2019) 8(9): 839-850
839
Original Research Article https://doi.org/10.20546/ijcmas.2019.809.101
Genetic Diversity and Principal Component Analysis for Grain Quality and
Productivity Traits in Sorghum [Sorghum bicolor (L.) Moench]
Ashwini Karadi1* and S.T. Kajjidoni
2
1Indian Institute of Horticultural Research, Banglore-560089,
(Karnataka), India 2University of Agricultural Science, Dharwad- 580005(Karnataka), India
*Corresponding author
A B S T R A C T
Introduction
Sorghum [Sorghum bicolour (L.) Moench] is
one of the important cereal crop in the world,
which is grown in Africa, Asia, USA,
Australia and Latin America. It is the fourth
most important cereal crop following rice,
wheat, maize and staple food in the same
central parts of the world. Worldwide, it is
cultivated on 41.07 million ha area with
production of 58.42 million tones in the year
approx., 2019-20 (Anonymous 2019a). In
India, sorghum having 5.00 million ha area
with 4.5 million tones production and 900
kg/ha productivity in the year 2019-20
(Anonymous 2019b). Sorghum shows extreme
genetic diversity (Sanchez et al., 2002) and is
predominantly self-pollinating, with varying
International Journal of Current Microbiology and Applied Sciences ISSN: 2319-7706 Volume 8 Number 09 (2019) Journal homepage: http://www.ijcmas.com
An investigation was carried out to assess nature and magnitude of genetic diversity for
grain quality traits and productivity traits in mini core collection of sorghum. Mini core
accessions were grouped into 15 clusters, where in cluster III had largest with 21
accessions whereas cluster XIII had minimum with 5 accessions. Plant height contributed
maximum divergence with 46.2%. The inter cluster distance D2 value ranged widely with
minimum values of (D2=197.61) and maximum value (D
2=5541.42) indicating high
diversity among mini core and it was desirable to select mini core from clusters showing
high inter cluster distance. Diversity among cluster varied from (D2=255.25) to
(D2=4906.5) inter cluster distance. Principal component analysis revealed that, three out of
nine principal components with eigenvalues > 1 were extracted. These three components
contributed 58.29% of the total variation among the mini core. Principal components first
three contributed, 22.73%, 17.99%, and 15.50%, respectively toward the variation
observed among accessions. Variation relative to the first component was associated with
seed yield per plant, 100 seed weight, seed volume, bulk density, seed size. The second
principal component was associated with plant height, ear head length, ear head width,
seed yield per plant, 100 seed weight, seed volume and seed size. The third principle
component was associated with ear head width, 100 seed weight, seed yield per plant and
seed size.
K e y w o r d s
Sorghum, Diversity,
Principal
component, Mini
core, Cluster
Accepted:
15 August 2019
Available Online: 10 September 2019
Article Info

Int.J.Curr.Microbiol.App.Sci (2019) 8(9): 839-850
840
levels of outcrossing. Sorghum grown in rabi
season is characterized by its excellent grain
quality, exclusively utilized for human
consumption and hence fetches higher market
price as compared to kharif.
Understanding of genetic diversity of a species
is fundamental in any crop improvement
programme. For such species, in general the
parents with more genetic divergence are
expected to yield heterotic hybrids in addition
to generating a broad spectrum of variability
in segregating generations. The D2 statistic is a
useful multivariate statistical tool for effective
discrimination among various genotypes on
the basis of genetic divergence (Murty and
Arunachalam, 1966; Sonawane and Patil,
1991). Diversity analysis provides information
on deciding choice of parents from distantly
related clusters to secure yield improvement in
sorghum. A better understanding of genetic
diversity in sorghum will facilitate crop
improvement (Jayarama Chandran et al.,
2011). Diversity in germplasm is important for
any breeding program, since it directly affects
the potential for genetic gain through selection
(Kotal et al., 2010). Genetic diversity among
the genotypes serves as a way to adapt to
changing environments and their utilization in
crop improvement programme. However,
reports on genetic diversity among the rabi
sorghum is very limited. Therefore there is a
need to evaluate the available accessions for
genetic diversity.
Principal component analysis is a multivariate
technique for examining the relationships
among several quantitative variables (Johnson
2012). It is the most common technique used
in variability studies and numerical
classification; it is useful in grouping varieties
based on their similarities (Bello 2004).
Principal component analysis is an important
breeding tool commonly used by breeders to
identify traits that could be used to
discriminate crop genotypes (Das 2000; Yan
and Kang 2003). Establishing suitable
selection criteria for identifying genotypes
with desirable traits is useful in developing
improved varieties. Analysis of variability
among traits and knowledge of associations
among traits contributing to yield would be of
great importance in planning a successful
breeding program (Mary and Gopalan 2006).
To date, in Niger, no study has been carried
out with the objective to assess diversity in
sorghum based on traits mentioned above by
using multivariate analysis. Therefore, the
objective of this study is to determine genetic
diversity of sorghum inbred lines, which
would be helpful in enhancing the efficiency
of sorghum breeding program.
Suitable selection criteria for the identification
of genotypes with desirable traits are essential
for successful varietal improvement programs.
Analysis of variability among traits and the
identification of associations among various
traits contributing to yield would facilitate
successful development of high yielding
varieties (Mary and Gopalan 2006). However,
selecting only for grain yield may not be
efficient for developing varieties for adoption
by farmers; selection, which integrates yield
and farmer-preferred traits, should provide
more appropriate varieties (Alvi et al., 2003).
The identification of yield-related traits could
result in more effective selection for yield and
farmer-preferred traits. The high level of
genetic diversity and characterization of
accessions integrated into world collections is
essential in order to classify, mange exotic
germplasm, collect and ultimately utilize the
different genetic improvement of the crop.
Materials and Methods
The present investigation was carried out
during rabi season 2011-12 at AICSIP, UAS,
Dharwad. The plant material for this
experiment comprised of 208 accessions of
mini core collection obtained from DSR

Int.J.Curr.Microbiol.App.Sci (2019) 8(9): 839-850
841
Hyderabad. The experiment was laid out in
medium deep black soil under rain fed
condition. The randomized block design was
followed separately with two replications and
each entry was sown in four rows of 4 m
length with inter row spacing of 45 cm and
intra row spacing of 15 cm. Observations on
all quantitative characters like plant height
(cm), panicle length (cm), panicle width (cm),
seed yield per plot (g), 100 seed weight (g),
seed volume (ml), bulk density (g/ml), true
density (g/ml) and seed size (mm).
Seed size was measured by using Vernier
Callipers where length, breadth and thickness
of seeds were recorded. Seed density
classified into two types viz., true density and
bulk density. Seed bulk density was measured
by hundred gram of seeds were weighed and
volume was recorded in a measuring jars.
Whereas, seed true density was observed by
known weight of seeds placed in a measuring
jar containing known quantity of toluene.
Increase in volume was recorded after pouring
seeds in measuring jar. Seed volume was
noted with countable numbers of seeds were
placed in a measuring jar. Grain quality
characters like seed luster, seed color, seed
shape and seed hardness was recorded by
measuring the grinding time required to obtain
a fixed volume of flour from the grains. Mean
of five plants for each entry was worked out
and used for statistical analysis. Genetic
diversity was studied using Mahalanobis D²
statistic and clustering was done following
Tocher’s method described by Rao (1952) for
determining group constellation. Average inter
and intra cluster distances were estimated as
per the procedure outlined by Singh and
Choudhary (1977).
The analysis of variance for the individual
character and analysis of covariance for
character pairs were carried out as described
by Cochran and Cox (1957). Divergence was
estimated by the multivariate analysis using
Mahalanobis’s (1936) and D2 statistic as
described by Rao (1952). On the basis of D2
values obtained, the variables were grouped
into different clusters by employing Tocher’s
method (Rao, 1952). The percent contribution
of each character to the total divergence was
calculated by ranking each character on the
basis of transformed uncorrelated values.
Finally, the percent contribution for each
character was calculated by taking total
number of ranks of all the characters to
hundred. The data were analyzed statistically
using the software WINDOSTAT, developed
by INDOSTAT services Ltd. Hyderabad,
India.
Results and Discussion
The analysis of variance showed highly
significant differences among the accessions
for all the characters studied indicating the
presence of considerable variability in the
experimental material. Nature and magnitude
of genetic diversity exists in the crop species
will be utilized for formulating breeding
programme. Mahalanobis’ D2
statistics is used
to quantify the degree of divergence. It is
based on second degree statistics and pattern
obtained by D2
does not change with number
of characters. Based on D2
statistics and tocher
method 208 accessions were grouped into 15
clusters with variable number of entries
revealing the presence of considerable amount
of genetic diversity in the material. Among
them, cluster III had largest with 21 accessions
whereas cluster XIII had minimum with 5
accessions reflecting narrow genetic diversity
among them. Cluster VIII with 19 accessions,
Whereas, three cluster namely IV, V and XIV
had 17 accessions followed by Cluster VI and
X with 16 accessions, cluster I and XV with
15 accessions, cluster II and IX had 12
accessions each. Whereas, cluster VII had 11
accessions, cluster XI had 8 accessions and
cluster XII had 7 accessions, respectively
(Table-1). The narrow genetic diversity may
Int.J.Curr.Microbiol.App.Sci (2019) 8(9): 839-850
842
be attributed to similarity in the base material
from which they have been evolved.
Among nine quantitative traits studied, the
highest contribution towards the divergence
was by plant height (46.2%).Similar results
were reported by Kukadia et al., (1981),
Sisodia et al., (1983), Dabholkar et al., (1983)
and Mehendiratta and Sindhy (1972).
Interestingly grain quality traits like seed size
contributed 23.49% followed by bulk density
(12.03%), seed volume (6.65%), true density
(5.44%) including seed yield per plant
(5.77%), which indicates that grain quality
traits also contributing for diversity. However,
the characters like ear head width (0.39%), ear
head length (0.02%) and 100 seed weight
(0.01%) indicated narrow range of diversity
among the mini core under study (Table-2).`
The average intra (diagonal) and inter cluster
(off diagonal) D2
values are presented in the
table-5. The inter cluster distance D2 value
ranged widely with minimum values of
(D2=197.61) and maximum value
(D2=5541.42) indicating high diversity among
mini core and it was desirable to select mini
core from clusters showing high inter cluster
distance. Diversity among cluster varied from
(D2=255.25) to (D
2=4906.5) inter cluster
distance (Table-3). Higher intra cluster
distance indicates that genotypes in the
respective clusters and the higher inter cluster
distances have wider genetic distances
between the genotypes which could be used in
hybridization programme.
In the present investigation, the inter cluster
distance was higher than intra cluster distance
which indicated substantial diversity among
the mini core accessions and there may be a
greater opportunity for obtaining the rare but
superior segregants from crosses between
more divergent accessions. Similar results
were also obtained by earlier investigators
(Swami et al., 2015; Jain and Patel, 2013; and
Mohanraj et al., 2006).
The maximum inter cluster distance observed
was between cluster XI and XIII (5541.42)
followed by cluster XI and XII (4942.89),
cluster IX and XIII (4225.12) and cluster VII
and XI (4225.12). Intra cluster distance D2
ranged from 0 to 596.24 which was followed
by cluster V (D2=570.19). The most of intra
cluster distance was zero. The intra cluster
distance D2 value ranged widely with
minimum value of 0 were observed between
most of the clusters followed by (230.13)
cluster I and I and cluster I and II was
(247.31).
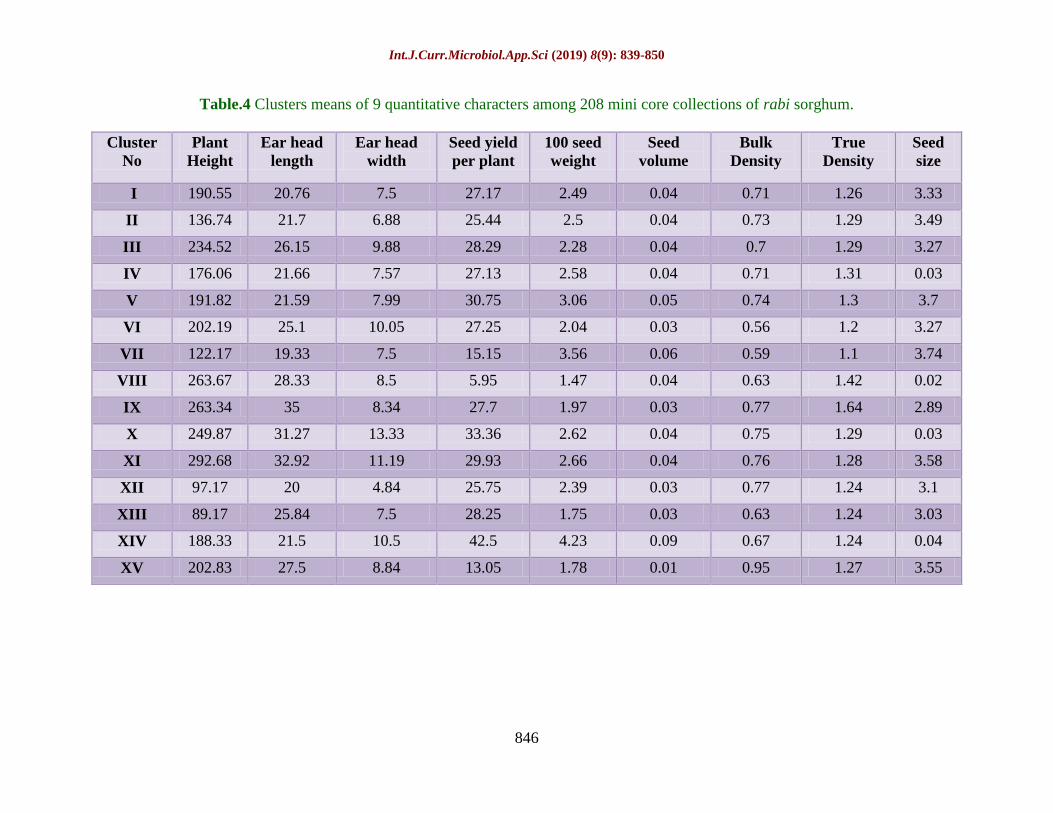
Cluster mean analysis was calculated using
Tocher’s method for nine yield and its
attributing traits and presented in Table 4.
Higher cluster mean for plant height was
observed in cluster XI (292.68) followed by
cluster VIII (263.67) and cluster IX (263.34).
Whereas, lower cluster mean was recorded in
cluster XIII (98.17). For ear head length
cluster mean was recorded in cluster IX (35)
followed by cluster XI (32.92) and cluster X
(31.27). However, lower cluster mean in
cluster VII (19.33). For earhead width the
highest cluster mean was recorded in cluster X
(13.33) and lowest were recorded in cluster I,
cluster VII and cluster XII (7.5). Highest and
lowest cluster mean for seed yield per plant
was recorded in cluster XIV (42.5) and cluster
VIII (5.95), respectively.
Based on overall score across nine traits, the
cluster were ranked. Accordingly, cluster XIII
with overall scores of 38 across XV clusters
secured first rank followed by cluster XII,
cluster VII, cluster I and cluster IV are the top
clusters, indicating the presence of most
promising accessions in them and can be
extensively used for further breeding
programme to generate new material.
The purpose of principal component analysis
is to reduce the volume of data. Watson and
Eyzaguirre (2002) also reported that PCA of
morphological characterization results could

Int.J.Curr.Microbiol.App.Sci (2019) 8(9): 839-850
843
identify a few key or minimum descriptors
that effectively account for the majority of the
diversity observed, saving time and effort for
future characterization efforts. Principal
components approach is very helpful in
deciding which agronomic traits of crop
contributing most to yield, subsequently, these
agronomic traits should be emphasized in the
breeding program (Jain et al., 2016).
Figure.1 The mini core accession by trait biplots of rabi sorghum
Table.1 Per cent contribution of characters towards divergence 208 mini core collections of rabi
sorghum
SI Source Contribution %
1 Plant height 46.2°/
2 Ear head length 0.02°/
3 Ear head width 0.39°/
4 Seed yield per plant 5.77°/
5 100 seed weight 0.01°/
6 Seed volume 6.65%
7 Bulk density 12.03%
8 True density 5.44%
9 Seed size 23.49°/

Int.J.Curr.Microbiol.App.Sci (2019) 8(9): 839-850
844
Table.2 Distribution of 208 mini core collections of rabi sorghum into different cluster
Cluster
No
No. of
mini core
Within
SS
Cluster members
1 15 0.6330 IS-602, IS-1233, IS-2389, IS-2413, IS-2426, IS-3971, IS-4060, IS-4951, IS-8012, IS-9177, IS-24453, IS-
26749, IS-29714, IS-30572, IS-33353
2 12 0.7812 IS-473, IS-1004, IS-4515, IS-6351, IS-10302, IS-10757, IS-12302, IS-13893, IS-14779, IS-25089, IS-27034,
IS-28449
3 21 1.2792 IS-1041, IS-2864, IS-4360, IS-4698, IS-6354, IS-8916, IS-9108, IS-12735, IS-12883, IS-14010, IS-15466,
IS-15744, IS- 24953, IS-29241, IS-15466, IS-15744, IS-24953, IS-29241, IS-29269, IS-29565, IS-29568, IS-
29606, IS-29654, IS-30383, IS-30443
4 17 1.5104 IS-2382, IS-7131, IS-305, IS-11919, IS-13782, IS-16382, IS-19153, IS-19445, IS-28849, IS-29239, IS-
29468, IS-29914, IS-30079, IS-30417
5 17 2.1486 IS-995, IS-10867, IS-13294, IS-13549, IS-25910, IS-25989, IS-26222, IS-27887, IS-29233, IS-29392, IS-
29304, IS-29733, IS-30092, IS-30400, IS-30838, IS-31043, IS-31557, IS-33023
6 16 0.4695 IS-1219, IS-4631, IS-5094, IS- 5301, IS-6421, IS-13971, IS-14290, IS-15478, IS-18038, IS-25732, IS-
26737, IS-29187, IS-29627, IS-30451, IS-30507, IS-31651
7 11 0.6991 IS-4092, IS-12447, IS-14090, IS-19676, IS-24348, IS-24462, IS-27912, IS-28141, IS-29358, IS-29392, IS-
29582
8 19 3.4635 IS-20298,IS-20679, IS-20697, IS-20727, IS-21512, IS-21645, IS-21863, IS-22239, IS-22609, IS-22720, IS-
22986, IS-23514, IS-23521, IS-23579, IS-23583, IS-23590, IS-23684, IS-23891
9 12 5.4003 IS-20625, IS-20632, IS-20740, IS-20743, IS-21083, IS-22294, IS-22626, IS-23216, IS-23992, IS-24139
10 16 0.8129 IS-603,IS-608, IS-995, IS-1212, IS-5295, IS-5919, IS-12945, IS-19389, IS-24939, IS-25548, IS-26694, IS-
29314, IS-30460, IS-30536, IS-31186
11 8 0.7865 IS-7987, IS-15931, IS-15945, IS-19975, IS-26025, IS-26484, IS-28451, IS-28614
12 7 1.4604 IS-7250, IS-7310, IS-7679, IS-25242, IS-25301, IS-26046, IS-28747
13 5 0.8236 IS-2397, IS-2872, IS-3158, IS-19262, IS-29950
14 17 0.6332 IS-2379, IS-4581, IS-4613, IS-6421, IS-9113, IS-12937, IS-16151, IS-17980, IS-24463, IS-24492, IS-26701,
IS-29326, IS-29335, IS-29689, IS-29772, IS-30450
15 15 0.9438 IS-2902, IS-8774, IS-12706, IS-13919, IS-14861, IS-15170, IS-19450, IS-19859, IS-25836, IS-28313, IS-
29441, IS-29519, IS-30538, IS-31714

Int.J.Curr.Microbiol.App.Sci (2019) 8(9): 839-850
845
Table.3 Average D² values of intra and inter cluster distances among 208 mini core collections of rabi sorghum
Cluster Cluster
I
Cluster
II
Cluster
III
Cluster
IV
Cluster
V
Cluster
VI
Cluster
VII
Cluster
VIII
Cluster
IX
Cluster
X
Cluster
XI
Cluster
XII
Cluster
XIII
Cluster
XIV
Cluster
XV
Cluster
I
230.13 583.66 516.19 1053.52 459.46 455.31 949.28 1225.29 1126.62 1561.84 1693.2 1221.3 1468.32 1381.21 829.85
Cluster
II
247.31 1449.25 1362.04 785.64 1026.81 449.02 2191.09 2428.62 2811.28 3330.21 373.93 575.67 1799.39 1299.95
Cluster
III
323.5 1417.27 760.53 599.27 2008.31 1034.7 545.11 1121.36 886.14 2504.93 2815.12 1690.87 947.62
Cluster
IV
373.65 1442.88 1231.76 1731.23 602.41 1944.02 1067.37 2893.72 1768.22 1910.46 649.15 1922.73
Cluster
V
5770.19 839.51 1162.22 1690.12 1350.38 1930.15 1832.08 1522.88 1881.72 1509.75 1040.33
Cluster
VI
260.9 1080.54 1072.24 1355.03 1615.05 1811.89 1812.28 1687.81 1526.97 1598.48
Cluster
VII
0 2602.62 3561.47 3575.37 4225.12 601.67 435.73 1783.18 2462.68
Cluster
VIII
0 1142.4 509.4 1931.98 3113.22 3166.75 900.84 2131.91
Cluster
IX
0 1053.95 629.13 3725.28 4290.56 2460.67 1033.13
Cluster
X
480.5 1521.27 3883.24 4247.78 1244.99 1945.98
Cluster
XI
596.24 4942.89 5541.42 2982.2 1650.1
Cluster
XII
0 197.61 2567.58 1820.74
Cluster
XIII
0 2638.1 2710.63
Cluster
XIV
0 2871.46
Cluster
XV
0
Int.J.Curr.Microbiol.App.Sci (2019) 8(9): 839-850
846
Table.4 Clusters means of 9 quantitative characters among 208 mini core collections of rabi sorghum.
Cluster
No
Plant
Height
Ear head
length
Ear head
width
Seed yield
per plant
100 seed
weight
Seed
volume
Bulk
Density
True
Density
Seed
size
I 190.55 20.76 7.5 27.17 2.49 0.04 0.71 1.26 3.33
II 136.74 21.7 6.88 25.44 2.5 0.04 0.73 1.29 3.49
III 234.52 26.15 9.88 28.29 2.28 0.04 0.7 1.29 3.27
IV 176.06 21.66 7.57 27.13 2.58 0.04 0.71 1.31 0.03
V 191.82 21.59 7.99 30.75 3.06 0.05 0.74 1.3 3.7
VI 202.19 25.1 10.05 27.25 2.04 0.03 0.56 1.2 3.27
VII 122.17 19.33 7.5 15.15 3.56 0.06 0.59 1.1 3.74
VIII 263.67 28.33 8.5 5.95 1.47 0.04 0.63 1.42 0.02
IX 263.34 35 8.34 27.7 1.97 0.03 0.77 1.64 2.89
X 249.87 31.27 13.33 33.36 2.62 0.04 0.75 1.29 0.03
XI 292.68 32.92 11.19 29.93 2.66 0.04 0.76 1.28 3.58
XII 97.17 20 4.84 25.75 2.39 0.03 0.77 1.24 3.1
XIII 89.17 25.84 7.5 28.25 1.75 0.03 0.63 1.24 3.03
XIV 188.33 21.5 10.5 42.5 4.23 0.09 0.67 1.24 0.04
XV 202.83 27.5 8.84 13.05 1.78 0.01 0.95 1.27 3.55

Int.J.Curr.Microbiol.App.Sci (2019) 8(9): 839-850
847
Table.5 Principal component analysis of measured traits in 208 mini core accessions of rabi sorghum
Plant
height
Earhead
length
Earhead
width
Seed yield
per plant
100 seed
weight
seed
volume
Bulk
density
True
density
Seed size
eigenvalue 2.01 1.9 1.34 1.05 0.9 0.63 0.55 0.43 0.2
variance.percent 22.31 21.12 14.86 11.66 10 7.03 6.1 4.75 2.18
cumulative.variance.percent 22.31 43.43 58.29 69.94 79.95 86.98 93.07 97.82 100
Table.6 Factor loadings of the study traits of the first three principal components (PCs)
Traits Mini core
PC1 PC2 PC3
PH -0.3390 0.4228 -0.0093
EL -0.4392 0.3813 -0.1143
EW -0.4030 0.4218 0.1124
SE/P 0.4949 0.4089 -0.2060
100 SW 0.1322 0.3566 0.0709
SV 0.4660 0.4217 -0.0953
BD 0.0022 -0.0248 -0.7121
TD -0.1997 -0.1234 -0.6403
SS 0.1015 0.0997 0.0252

Int.J.Curr.Microbiol.App.Sci (2019) 8(9): 839-850
848
A screen plot is a simple line segment plot
that shows the fraction of total variance in the
data. It is a plot, in descending order of
magnitude, of the eigen values of a
correlation matrix. According to Chatfied and
Collins (1980), components with an
eigenvalue of <1 should be eliminated so that
fewer components are dealt with. Sharma
(1998) reported that PCA reflects the
importance of the largest contributor to the
total variation at each axis of differentiation.
It was further reported by Fenty (2004) that
PCA reduces a large set of variables to come
up with smaller sets of components those
summaries the correlations. The Screen plot
of the PCA (Fig. 1) shows that the first three
eigenvalues correspond to the whole
percentage of the variance in the dataset.
Three out of nine principal components with
eigenvalues > 1 were extracted. These three
components contributed 58.29% of the total
variation among the germplasm. Principal
components 1, 2, and 3 contributed,
respectively, 22.73%, 17.99%, and 15.50%
toward the variation observed among
genotypes (Table-5). The aim of principal
component analysis is to resolve the total
variation of a set of traits into linear,
independent composite traits, which
successively maximize variability in the data
(Johnson 2012). Sample traits are generally
inter-correlated to varying degrees and hence
not all principal components are needed to
summarize the data adequately. In this study,
the first three principal components
represented a sizeable amount of diversity
among the genotypes investigated. This
implied that several traits were involved in
explaining the variation among the genotypes.
Ayana and Bekele (1999) reported
significance of first five PCs in the total
variability of different agro-morphological
traits in sorghum. The first four principal
components, with eigenvalues greater than
one, were also documented in 25 forage and
45 grain sorghum genotypes for dual purpose
(Chikuta et al., 2015). Abraha et al., (2015)
reported four principal components with
eigenvalues greater than one, which explained
> 75% of the total variation for grain yield,
biomass, stay-green, leaf area, peduncle
exertion, days to flowering, and maturity.
Around 44%, 17%, and 15% variation
attributed to first, second, and third principal
components, respectively, was reported by
Chikuta et al., (2015). Several studies on
principal component analysis of different
agro-morphological traits in sorghum have
been documented. Abraha et al., (2015)
concluded that grain yield, biomass, stay-
green, leaf area, peduncle exertion, days to
flowering, and maturity were the most
important traits for genetic variability in
landrace sorghums. On the other hand, head
width, head weight, grain yield per plant, and
fresh and dry shoot weight were found to be
the most important traits for drought tolerance
in grain sorghum (Ali et al., 2011).
The phenotypic diversity observed in this
study was attributable to several traits (Table-
6). Variation relative to the first component
was associated with seed yield per plant,100
seed weight, seed volume, bulk density, seed
size. The second principal component was
associated with plant height, ear head length,
ear head width, seed yield per plant, 100 seed
weight, seed volume and seed size. The third
principle component was associated with ear
head width, 100 seed weight, seed yield per
plant and seed size. Distribution of
biometrical traits in first two components is
sown in loading plot (Fig. 1). The loading plot
clearly showed that plant height, panicle
length, panicle width, seed yield per plot, 100
seed weight, seed volume, bulk density, true
density and seed size contributed traits
towards diversity. In this study, concluded
that significant diversity existed among mini
core accessions of sorghum for the traits
studied. Efficient exploitation of this diversity

Int.J.Curr.Microbiol.App.Sci (2019) 8(9): 839-850
849
is helpful in identifying sorghum parental
lines for hybrid breeding program. Inter-
crossing between accessions from diverse
clusters will provide segregating sorghum
progeny for yield; thereby, leading to the
development of high-yielding varieties.
Acknowledgement
The senior author is greatful to DSR
Hyderabad for providing mini core collection.
References
Anonymous. World Agricultural production,
2019a, 21.
Anonymous. World Agricultural production,
2019b, 21
Abraha, T., Githiri, S. M. Kasili, R. Araia, W.
and Nyende. A. B. (2015). “Genetic
variation among sorghum (Sorghum
bicolor (L.) Moench) landraces from
eritrea under postflowering drought
stress conditions.” American Journal of
Plant Sciences. 6 (09): 1410.
doi:10.4236/ajps.2015.69141
Ali, M. A., Jabran, K., Awan, S. I., Abbas,
A., Zulkiffal, M., Acet, T. and Rehman,
A. (2011). “Morpho-physiological
diversity and its implications for
improving drought tolerance in grain
sorghum at different growth stages.”
Australian Journal of Crop Science. 5
(3): 311.
Ayana, A. and Bekele, E. (1999).
“Multivariate analysis of morphological
variation in sorghum (Sorghum bicolor
(L.) Moench) germplasm from ethiopia
and eritrea.” genetic resources and crop
evolution. 46 (3): 273–84.
doi:10.1023/A:1008657120946.
Bello, D. (2004). “Genetic variability and
inter-relationship of traits in local
sorghum (Sorghum bicolor (L.)
Moench) in adamawa state.”
unpublished M.Sc. Thesis, Yola:
Federal University of Technology.
Chikuta, S., Odong, T., Kabi, F. and
Rubaihayo, P. (2015). “Phenotypic
diversity of selected dual purpose
forage and grain sorghum genotypes.”
American Journal of Experimental
Agriculture 9: 6.
doi:10.9734/AJEA/2015/20577.
Cochran, W.C. and Cox, G.M. (1957).
Experimental designs. John Wiley and
Sons, N.Y. London, pp. 82-90.
Das, L. V. (2000). Problems facing plant
breeding. New Delhi: CBS.
Jain, S.K. and Patel, P.R. (2013). Multivariate
analyses in sorghum [Sorghum bicolor
(L.) Moench] for fodder yield and their
attributes. Agric. Sci. Digest. 33(3):215-
218.
Johnson, D. E. (2012). Applied multivariate
methods for data analysis. New York:
Duxbury Press.
Kotal, B. D., Das, A. and Choudry, B. K.
(2010). Genetic variability and
association of characters in wheat
(Triticum aestivumL.). Asian J. Crop
Sci. 2:155–160.
Mahalanobis, P.C. (1936). On the generalized
distance in statistics. Proceedings of
National Institute of Sciences, India.
2:49-55
Mary, S. S. and Gopalan, A. (2006).
“Dissection of genetic attributes yield
traits of fodder cowpea in F3 and F4.”
Journal Applications Sciences
Researcher.2 (6): 805–08.
Mohanraj, K., Gopalan, A. and
Shanmuganathan, M. (2006). Genetic
diversity in sorghum [Sorghum bicolor
(L.) Moench].The Journal of
Agricultural Sciences, 2 (2):06-11.
Murty, B.R. and Arunachalam, V.(1966). The
nature and divergence in relation to
breeding systems in some crop plants.
Indian Journal of Genetics. 22:66-80
Rao, C.R. (1952). Advanced statistical
methods in biometrical research. New

Int.J.Curr.Microbiol.App.Sci (2019) 8(9): 839-850
850
York, USA. John Wiley and Sons Inc.
Sanchez, A., Subudhi, P. Rosenow, D. and H.
Nguyen, 2002. Mapping QTLs
associated with drought resistance in
sorghum (Sorghum SW (L.) Moench).
Plant molecular biology, 48(5-6): 713-
726
Sonawane, M.N., and Patil. F.B. (1991).
Genetic divergence in cowpea. Journal
of Maharashtra Agricultural University.
6: 167-169.
Swami, S.S., Chaudhary, S.B. and Kute, N.S.
(2015). Genetic diversity studies in rabi
sorghum [Sorghum bicolor (L.)
Moench]. Journal of Agricultural
Research Technology. 40(2): 203-207.
Watson, J.W. and Eyzaguirre, P.P.B. (2002).
Homegardens and in situ conservation
of plant genetic resources in farming
systems. Proceedings of the second
international home gardens workshop,
17-19th July 2001, Witzenhausen,
Federal Republic of Germany.
International Plant Genetic Resources
Institute, Rome, Italy.
Yan, W. and Kang. M. S. (2003). GGE Biplot
Analysis: A graphical tool for breeders,
Geneticists, and Agronomists. Boca
Raton, FL: CRC Press.
How to cite this article:
Ashwini Karadi and Kajjidoni, S.T. 2019. Genetic Diversity and Principal Component Analysis
for Grain Quality and Productivity Traits in Sorghum [Sorghum bicolor (L.) Moench].
Int.J.Curr.Microbiol.App.Sci. 8(09): 839-850. doi: https://doi.org/10.20546/ijcmas.2019.809.101