Embed Size (px)
Citation preview
Mission
WorldatWork Journal strives to:
❚ Advance the theory, knowledge and practice
of total rewards management.
❚ Contribute to business-strategy development that
leads to superior organizational performance.
❚ Provide an outlet for scholarly total rewards writing
and research.
Executive Committee of the Board of Directors
Chair I Sara R. McAuley, CCP
Executive Vice President & CHRO, Tygris Commercial
Finance Group Inc.
Vice Chair I David Smith, CCP
Vice President, Human Resources, AGL Resources
Secretary/Treasurer I Mark Wainger
Senior Vice President, Global Compensation & Benefits,
Time Warner Inc.
Past Chair I Tracy J.O. Kofski, CCP
Vice President, Compensation & Benefits, General Mills
Member I Anne C. Ruddy, CCP, CPCU
President, WorldatWork
Editorial
Publisher I Anne C. Ruddy, CCP, CPCU
Executive Editor I Ryan M. Johnson, CCP
Managing Editor I Jean Christofferson
Editor I Robert E. King, [email protected]
Contributing Editor I Michelle Kowalski
Review Coordinator/Permissions Editor I Marie Finke
Design
Senior Manager, Marketing, Communications
and Creative Services I Barry Oleksak
Art Director I Jamie Hernandez
Creative Services Manager I Rebecca Williams Ficker
Senior Graphic Designer I Kris Sotelo
Graphic Designers I Melissa Neubauer, Hanna Norris
Circulation
Circulation Manager I Barbara Krebaum
Fan
cy P
ho
tog
rap
hy
This publication is a special benefit of membership in:
Global Headquarters: In Canada:
WorldatWork P.O. Box 4520
14040 N. Northsight Blvd. Postal Station A
Scottsdale, AZ 85260 USA Toronto, ON M5W 4M4
Phone: 480-922-2020; Toll-free: 877-951-9191
Fax: 480-483-8352; Toll-free fax: 866-816-2962
E-mail: [email protected]
Web site: www.worldatwork.org
WorldatWork Journal (ISSN 1529-9457) is published
quarterly by WorldatWork, 14040 N. Northsight Blvd.,
Scottsdale, AZ 85260, as a benefit to members, who
receive an annual subscription with their membership.
Subscriptions in the United States and United States
possessions are $130 per year; in other countries
sub scriptions are $165 per year. Periodicals postage-
paid at Scottsdale, AZ 85251 and at additional offices.
POSTMASTER: Send address changes to WorldatWork
Journal, 14040 N. Northsight Blvd., Scottsdale, AZ 85260;
480/951-9191. Canada Post (CPC) publication #40823004.
WorldatWork neither endorses any of the products,
services or companies ref er enced in this publication nor
does it attest to their quality. The views ex pressed in this
pub li ca tion are those of the authors and should not be
as cribed to the officers, mem bers or other spon sors of
WorldatWork or its staff. Noth ing herein is to be construed
as an at tempt to aid or hinder the adoption of any pending
legislation, regulation or in ter pre tive rule, or as legal,
ac count ing, actuarial or oth er such pro fes sion al ad vice.
Copyright © 2009 WorldatWork. All rights reserved.
WorldatWork: Registered Trademark ® Marca Registrada.
Printed in U.S.A. No portion of this publication may be
reproduced in any form without express written permis-
sion from WorldatWork.
Rejection Rate: In 2008, the rejection rate for papers
submitted to WorldatWork Journal was 53.7 percent.
Reprints: For bulk reprints contact: Gail Hallman at
800-352-2210, Ext. 8175, or [email protected].
Manuscripts: WorldatWork Journal welcomes manuscripts.
See guidelines and review process at www.worldatwork.org,
or contact any member of the editorial staff.
Letters: Readers are invited to submit letters for publi-
cation. Letters are pub lished as space permits and are
subject to editing.
E-mail Preferences: To change your e-mail preferences
and make sure you are receiving workspan weekly and
other WorldatWork membership benefits via e-mail:
❚ Log in to www.worldatwork.org.
❚ Click “My Profile.”
❚ Select “Update my e-mail preferences.”
❚ Check the “Please send all e-mails in text format” box.
Ensure WorldatWork e-mail communications are delivered
directly to your inbox and avoid company blocks and filters.
Ask your technology department to allow WorldatWork
communications to reach you. For more information call
toll free, 877-951-9191.
WorldatWork (www.worldatwork.org)
is a global human resources asso-
ciation focused on compensation,
benefits, work-life and integrated
total rewards to attract, motivate and retain a talented
workforce. Founded in 1955, WorldatWork provides a
network of more than 30,000 members and professionals
in 75 countries with training, certification, research, confer-
ences and community. It has offices in Scottsdale, Arizona,
and Washington, D.C.
The WorldatWork group of registered marks includes: WorldatWork®,
workspan®, Certified Compensation Professional or CCP®, Certified
Benefits Professional® or CBP, Global Remuneration Professional
or GRP®, Work-Life Certified Professional or WLCPTM, WorldatWork
Society of Certified Professionals®, and Alliance for Work-Life
Progress® or AWLP®. WorldatWork Journal, WorldatWork Press and
Telework Advisory Group are part of the WorldatWork family.
WorldatWork Management Team
President I Anne C. Ruddy, CCP, CPCU
Vice President, Publishing and Community
Ryan M. Johnson, CCP
Vice President, Professional Development
Bonnie Kabin, CCP
Director, Human Resources I Kip Kipley, CBP, SPHR
Executive Director, AWLP I Kathie Lingle, WLCP
Vice President and CFO I Greg Nelson, CCP, CPA
General Manager, Washington, D.C. I Paul Rowson
Vice President, Marketing and Channel Management
Betty Scharfman
Director, Business Systems I Jennifer Strauel, CCP
Director, Public Policy I Cara Woodson Welch
WorldatWork Advisory Board Chairs
WorldatWork advisory boards identify current and future
strategic issues and topics in compensation, benefits and
the work experience. Their suggestions, as well as input
from other sources, help determine the technical content of
WorldatWork products and programs such as conferences,
forums, seminars and publications.
Benefits Advisory Board I Debra A. Weafer, CCP, CBP
Vice President, Compensation & Benefits,
BlueCross BlueShield of Massachusetts
Compensation Advisory Board I John Bremen
Practice Leader, Watson Wyatt
Executive Rewards Advisory Board I Randolph W. Keuch
Vice President, Total Rewards, H.J. Heinz
WorldatWork Local Networks I Robin D. Bernstein, CCP
Director of Compensation, Premier Inc.
Global Advisory Board I Mark Hudson
Reward Director IST, BP Oil International Ltd.
Reviewers
WorldatWork Journal thanks the following individuals
for reviewing manuscripts during the editorial cycle for
the Second Quarter 2009 issue. Subject-matter experts,
including members of WorldatWork’s advisory boards,
review all manuscripts.
Ken Abosch I Hewitt Associates
Nathan Aycock, CCP I ESPN Inc.
Supriya Bahri, CCP I California Institute of Technology
David Brown, CCP, CBP I Kaiser Permanente
Roy Cureton, CCP, CEBS, SPHR I Cureton & Associates
Tammy DeHaai, CCP I The Principal Financial Group
Sean Delaney I Microsoft
Michael Denson, CCP, GRP I Chico’s FAS Inc
Challie Dunn, CCP, GRP, SPHR I RiskMetrics
Mark Englizian, CCP, GRP I Microsoft
James Gandurski, CCP I Grant Thornton LLP
Kevin Garrett, CCP I Deloitte Services
Susan Ginsberg, Ed.D. I Work & Family Life
Steve Gross I Mercer
Regina Hack, CCP I Motorola
Angela Keller, CCP I Cox Communications
Melissa Kellione, CCP I Colorado Springs Utilities
Randy Keuch I HJ Heinz
Kevin Kramer, Ph.D., CCP I Accenture
Maya Kroumova I NYIT
Luke Malloy, CCP I UnitedHealth Group
Mercedes McBride-Walker, CCP I Panasonic Avionics Corp.
Ronnie Moholane, GRP I Anglogold
Marie Mohammed, CCP I University of British Columbia
John Munoz, CCP I Total Rewards Strategies
Cathy Peffen, CCP, PHR I Marriott Vacation Club International
Daniel Purushotham, Ph.D., CCP, CBP I
University of Connecticut
Dow Scott, Ph.D. I Loyola University
Thomas Sondergeld I Hewitt Associates
Carolyn Wiley, Ph.D., SPHR I Roosevelt University
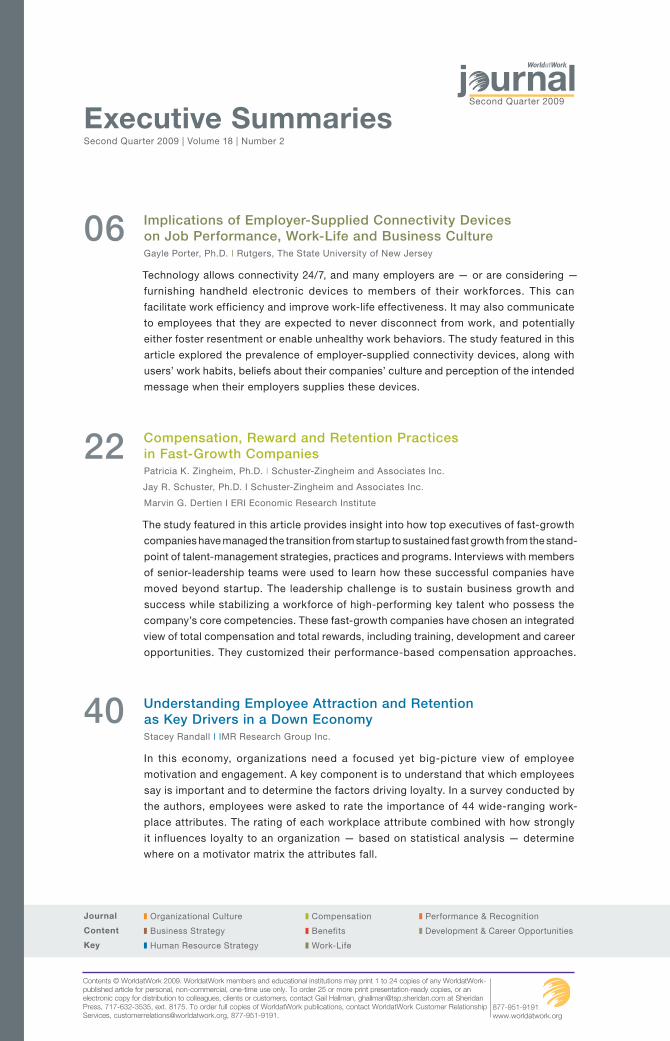
Implications of Employer-Supplied Connectivity Devices
on Job Performance, Work-Life and Business Culture
Gayle Porter, Ph.D. I Rutgers, The State University of New Jersey
Technology allows connectivity 24/7, and many employers are — or are considering —
furnishing handheld electronic devices to members of their workforces. This can
facilitate work efficiency and improve work-life effectiveness. It may also communicate
to employees that they are expected to never disconnect from work, and potentially
either foster resentment or enable unhealthy work behaviors. The study featured in this
article explored the prevalence of employer-supplied connectivity devices, along with
users’ work habits, beliefs about their companies’ culture and perception of the intended
message when their employers supplies these devices.
Compensation, Reward and Retention Practices
in Fast-Growth Companies
Patricia K. Zingheim, Ph.D. I Schuster-Zingheim and Associates Inc.
Jay R. Schuster, Ph.D. I Schuster-Zingheim and Associates Inc.
Marvin G. Dertien I ERI Economic Research Institute
The study featured in this article provides insight into how top executives of fast-growth
companies have managed the transition from startup to sustained fast growth from the stand-
point of talent-management strategies, practices and programs. Interviews with members
of senior-leadership teams were used to learn how these successful companies have
moved beyond startup. The leadership challenge is to sustain business growth and
success while stabilizing a workforce of high-performing key talent who possess the
company’s core competencies. These fast-growth companies have chosen an integrated
view of total compensation and total rewards, including training, development and career
opportunities. They customized their performance-based compensation approaches.
Understanding Employee Attraction and Retention
as Key Drivers in a Down Economy
Stacey Randall I IMR Research Group Inc.
In this economy, organizations need a focused yet big-picture view of employee
motivation and engagement. A key component is to understand that which employees
say is important and to determine the factors driving loyalty. In a survey conducted by
the authors, employees were asked to rate the importance of 44 wide-ranging work-
place attributes. The rating of each workplace attribute combined with how strongly
it influences loyalty to an organization — based on statistical analysis — determine
where on a motivator matrix the attributes fall.
06
Executive SummariesSecond Quarter 2009 | Volume 18 | Number 2
❚ Organizational Culture ❚ Compensation ❚ Performance & Recognition
❚ Business Strategy ❚ Benefits ❚ Development & Career Opportunities
❚ Human Resource Strategy ❚ Work-Life
Journal
Content
Key
22
40
877-951-9191www.worldatwork.org
Contents © WorldatWork 2009. WorldatWork members and educational institutions may print 1 to 24 copies of any WorldatWork-published article for personal, non-commercial, one-time use only. To order 25 or more print presentation-ready copies, or an electronic copy for distribution to colleagues, clients or customers, contact Gail Hallman, [email protected] at Sheridan Press, 717-632-3535, ext. 8175. To order full copies of WorldatWork publications, contact WorldatWork Customer Relationship Services, [email protected], 877-951-9191.
Second Quarter 2009
5 Second Quarter | 2009
Using an Analytical Approach to Increase Retention in
High-Growth Countries: An Example in India
Fermin A. Diez, CCP, SPHR I Mercer
Freescale’s India business was experiencing high turnover and needed to reduce
the turnover rate. In this case study, the authors discuss how HR debunked several
myths, which allowed it to make changes to increase retention. Part of the organiza-
tion’s success came from coupling the quantitative data with a deep understanding
of the qualitative data. Its analysis was filtered through not only human resources and
management, but it was well rooted in employee feedback on what makes someone
stay or leave the company.
CFOs See Business Impacts of Work-Life Flexibility,
But They Can’t Execute for Strategic Benefit
Cali Williams Yost I Work+Life Fit Inc.
In an era of rapid change, work-life flexibility becomes a strategic imperative, not just
a perk. The author’s company co-sponsored a study, which found that CFOs — the
front-line financial decision-makers — do see work-life flexibility as a strategic lever to
achieve broad business impacts. In addition, more than one-half have increased their
personal use of work-life flexibility. However, a wide gap emerged between CFO aware-
ness and the organizational culture and strategic infrastructure required to execute a
coordinated strategy.
Holistic Pay Modeling: Getting the Complete Executive Pay Picture
Melissa L. Means, CCP I Pearl Meyer & Partners
Often missing from a compensation-oversight tool kit is a more far-reaching and
specific line of sight into what a particular executive has the potential to earn. A holistic,
or dynamic, pay analysis can model how the individual elements of complex executive
compensation programs will behave singly and cumulatively during the short- and long-
term for a wide range of stock prices and company financial performance outcomes.
Such an analysis helps executives, HR leaders and directors evaluate and better under-
stand the total potential payouts of an executive compensation program.
78 Published Research in Total Rewards
84 Facts & Figures
Also
on the
Inside
48
59
68
Increasingly, technology has redefined work
relationships by creating more options for doing
work anytime, anyplace. The connectivity of a home
computer and Internet access first made it easier to work
from home. Proliferation of cell phones then allowed
new mobility without being “out of touch.” Handheld
devices (like RIM’s BlackBerry, Palm’s Treo and Apple’s
iPhone) offer remote capabilities of telephone and
Internet access, as well as schedule maintenance and
entertainment features.
Anecdotal evidence suggests an increasing number of
employers are amenable to employee use of these devices;
some expect their employees will use them and may even
supply them. Technology cost is high enough that receiving
an employer-supplied device (and paid connection service)
may be viewed as a highly valued benefit to individual
employees while still being a relatively inexpensive
investment for organizations compared to other benefits.
However, despite the potential that these devices could
serve as a support for work-life effectiveness, their use
does not ensure they will lead to work-life effectiveness.
Rather than facilitate work-life effectiveness by offering
flexibility, the same device could increase the degree
of job interference through nonwork activities due to
perceived organizational norms.
Implications of Employer-
Supplied Connectivity Devices
on Job Performance, Work-Life
and Business Culture
Gayle Porter, Ph.D.
Rutgers, The State University of New Jersey
❚ Work-Life
877-951-9191www.worldatwork.org
Contents © WorldatWork 2009. WorldatWork members and educational institutions may print 1 to 24 copies of any WorldatWork-published article for personal, non-commercial, one-time use only. To order 25 or more print presentation-ready copies, or an electronic copy for distribution to colleagues, clients or customers, contact Gail Hallman, [email protected] at Sheridan Press, 717-632-3535, ext. 8175. To order full copies of WorldatWork publications, contact WorldatWork Customer Relationship Services, [email protected], 877-951-9191.
Second Quarter 2009
7 Second Quarter | 2009
The study featured in this article was undertaken as a step into an area not
receiving much research attention. Technology is changing the nature of work,
and it is time to advance more thoughtful considerations of how specific changes
in employer practices, such as supplying handheld devices to employees, are
perceived by individuals being asked to interact with technology. While this study
represents an initial exploration, it is a starting point to set direction for future,
more in-depth research.
The project’s goal was to begin looking at employer-promoted use of hand-
held devices and, specifically, how this promotion is viewed by employees from
a variety of companies, industries and work situations. A portion of the study is
an exploration into the prevalence of using devices and of employers supplying
devices by looking at type and size of company, total-rewards-related policies and
a sampling of employee attitudes about device use.
Beyond these generalities, a variety of specific expectations arose about how
individuals assess usefulness of connectivity devices. Results are offered in
relation to each expectation and surrounding perceptions and attitudes. In addition
to informing future research, practical applications are referenced at times in the
discussion of results and elaborated on in the conclusion.
Within this study’s survey instrument, the terminology “company-supplied”
appears in items, rather than “employer-supplied.” In this report, those two
references mean that the organization absorbed device expense, rather than the
individual. “Company,” “employer” and “organization” are used interchangeably.
Similarly, to accurately extend previous research, measurement items include refer-
ence to the balance of work with other life interests. This report references those
items as written, while recognizing in general discussion that the trend in business
usage is toward terms such as “work-life effectiveness” that carry less implication
of equal weighting than “work-life balance.”
METHODOLOGY
An online survey asked respondents for information about their employers’ reward-
related practices (Heneman 2007); the functional area of their job; their responsibility
level; and certain personal demographics including age, race, gender, education,
marital status, number of children and number of divorces. Other items pertained
to each individual’s personal use of a handheld connectivity device, referred
to as a “device” and described as one that allows for multiple functions, such as
telephone, e-mail and scheduling capacity. The survey also included questions
on whether employers supplied such devices, how employees learned the expec-
tations connected to accepting a device, the message they believed the company
sent by providing (or not providing) such devices, and how device use affected
their job performance and ability to balance work with other life interests.
A list of items on which respondents could check their level of agreement (a five-
point, Likert-type response format ranging from strongly disagree to strongly agree)
8 WorldatWork Journal
allowed for aggregation into scales representing (a) the extent to which they view
their work environment as a high-pressure culture and (b) segmentation preference
(clear boundaries between work time and nonwork time) (Kreiner 2006).
The survey was distributed in two data-collection waves. The first was a broad
distribution to university alumni, resulting in 312 usable responses. The second
wave was a targeted panel distribution through the survey software provider,
which reached an additional 315 respondents prescreened only to be working
full time with at least a bachelor’s degree to correspond generally to the alumni
sample. Together, these data collections yielded 627 survey respondents.
Surveys were supplemented by eight individual interviews of subjects who had
not participated in the survey but were similar in education and professional status
to the larger sample. These people viewed the survey’s preliminary results on five
sets of charts and were invited to comment on any portion they found of interest
or to which they had a reaction that might help with results interpretation.
A more complete overview of the methodology and demographics (as well
as the findings) can be obtained by reading Implications of Employer-Supplied
Connectivity Devices (Porter 2009).
RESULTS
Two hundred seventy-one people (43 percent) reported currently being users of
a handheld device as defined in this study; 351 said they were nonusers. The 351
nonusers were asked if they were “thinking of becoming a user within the next
6-12 months,” to which 38 percent replied “yes.”
The correlation between gender and device use was insignificant. Regarding
marital status, 39 percent of single people reported being users, along with
44 percent of married people and 65 percent of those in domestic-partner
relationships. Sixty-five percent of people with children were users, compared to
40 percent of those who reported having no children. No significant correlation or
notable trend exists when comparing education and being a current user.
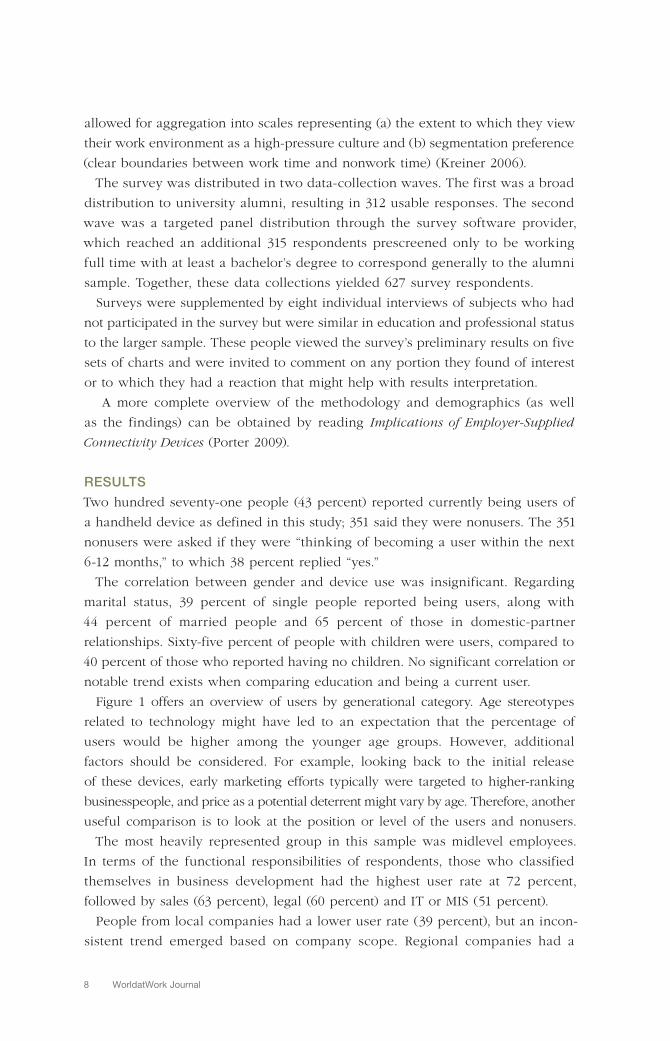
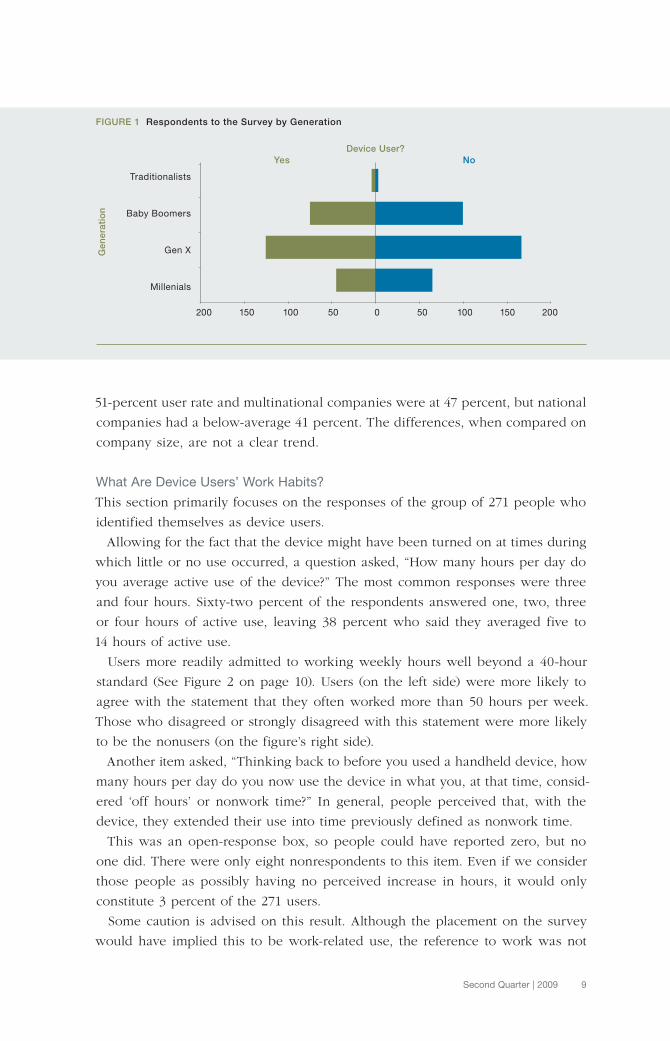
Figure 1 offers an overview of users by generational category. Age stereotypes
related to technology might have led to an expectation that the percentage of
users would be higher among the younger age groups. However, additional
factors should be considered. For example, looking back to the initial release
of these devices, early marketing efforts typically were targeted to higher-ranking
businesspeople, and price as a potential deterrent might vary by age. Therefore, another
useful comparison is to look at the position or level of the users and nonusers.
The most heavily represented group in this sample was midlevel employees.
In terms of the functional responsibilities of respondents, those who classified
themselves in business development had the highest user rate at 72 percent,
followed by sales (63 percent), legal (60 percent) and IT or MIS (51 percent).
People from local companies had a lower user rate (39 percent), but an incon-
sistent trend emerged based on company scope. Regional companies had a
9 Second Quarter | 2009
51-percent user rate and multinational companies were at 47 percent, but national
companies had a below-average 41 percent. The differences, when compared on
company size, are not a clear trend.
What Are Device Users’ Work Habits?
This section primarily focuses on the responses of the group of 271 people who
identified themselves as device users.
Allowing for the fact that the device might have been turned on at times during
which little or no use occurred, a question asked, “How many hours per day do
you average active use of the device?” The most common responses were three
and four hours. Sixty-two percent of the respondents answered one, two, three
or four hours of active use, leaving 38 percent who said they averaged five to
14 hours of active use.
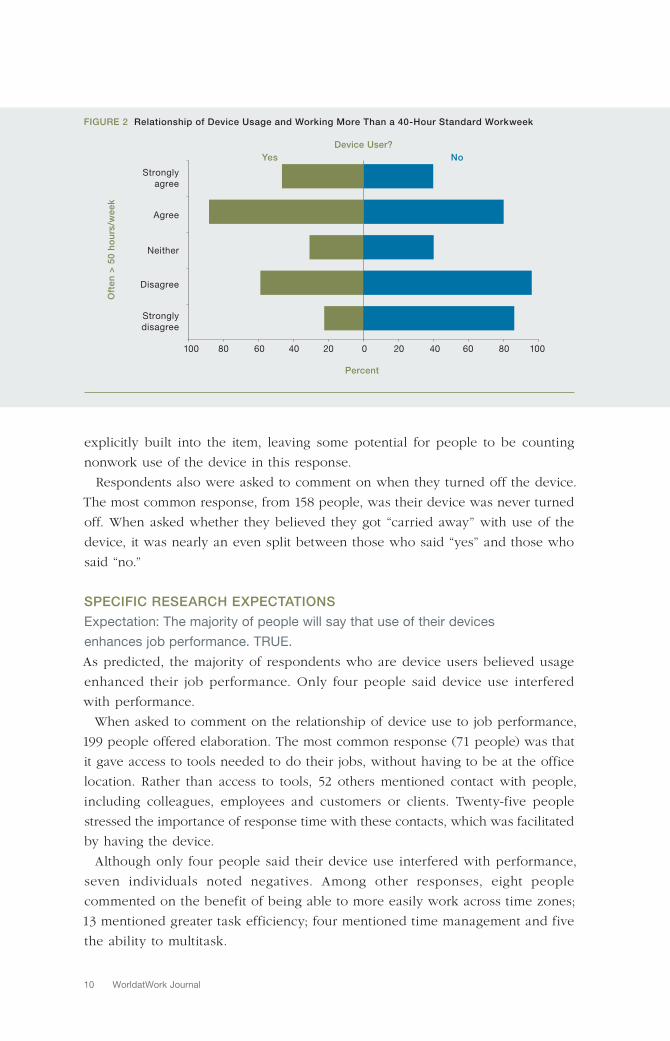
Users more readily admitted to working weekly hours well beyond a 40-hour
standard (See Figure 2 on page 10). Users (on the left side) were more likely to
agree with the statement that they often worked more than 50 hours per week.
Those who disagreed or strongly disagreed with this statement were more likely
to be the nonusers (on the figure’s right side).
Another item asked, “Thinking back to before you used a handheld device, how
many hours per day do you now use the device in what you, at that time, consid-
ered ‘off hours’ or nonwork time?” In general, people perceived that, with the
device, they extended their use into time previously defined as nonwork time.
This was an open-response box, so people could have reported zero, but no
one did. There were only eight nonrespondents to this item. Even if we consider
those people as possibly having no perceived increase in hours, it would only
constitute 3 percent of the 271 users.
Some caution is advised on this result. Although the placement on the survey
would have implied this to be work-related use, the reference to work was not
FIGURE 1 Respondents to the Survey by Generation
Device User?
Ge
ne
rati
on
Traditionalists
Baby Boomers
Gen X
Millenials
Yes No
200 150 100 50 0 50 100 150 200
10 WorldatWork Journal
explicitly built into the item, leaving some potential for people to be counting
nonwork use of the device in this response.
Respondents also were asked to comment on when they turned off the device.
The most common response, from 158 people, was their device was never turned
off. When asked whether they believed they got “carried away” with use of the
device, it was nearly an even split between those who said “yes” and those who
said “no.”
SPECIFIC RESEARCH EXPECTATIONS
Expectation: The majority of people will say that use of their devices
enhances job performance. TRUE.
As predicted, the majority of respondents who are device users believed usage
enhanced their job performance. Only four people said device use interfered
with performance.
When asked to comment on the relationship of device use to job performance,
199 people offered elaboration. The most common response (71 people) was that
it gave access to tools needed to do their jobs, without having to be at the office
location. Rather than access to tools, 52 others mentioned contact with people,
including colleagues, employees and customers or clients. Twenty-five people
stressed the importance of response time with these contacts, which was facilitated
by having the device.
Although only four people said their device use interfered with performance,
seven individuals noted negatives. Among other responses, eight people
commented on the benefit of being able to more easily work across time zones;
13 mentioned greater task efficiency; four mentioned time management and five
the ability to multitask.
FIGURE 2 Relationship of Device Usage and Working More Than a 40-Hour Standard Workweek
Device User?
Oft
en
> 5
0 h
ou
rs/w
ee
k
Strongly
agree
Agree
Neither
Disagree
Strongly
disagree
Yes No
100 80 60 40 20 0 20 40 60 80 100
Percent
11 Second Quarter | 2009
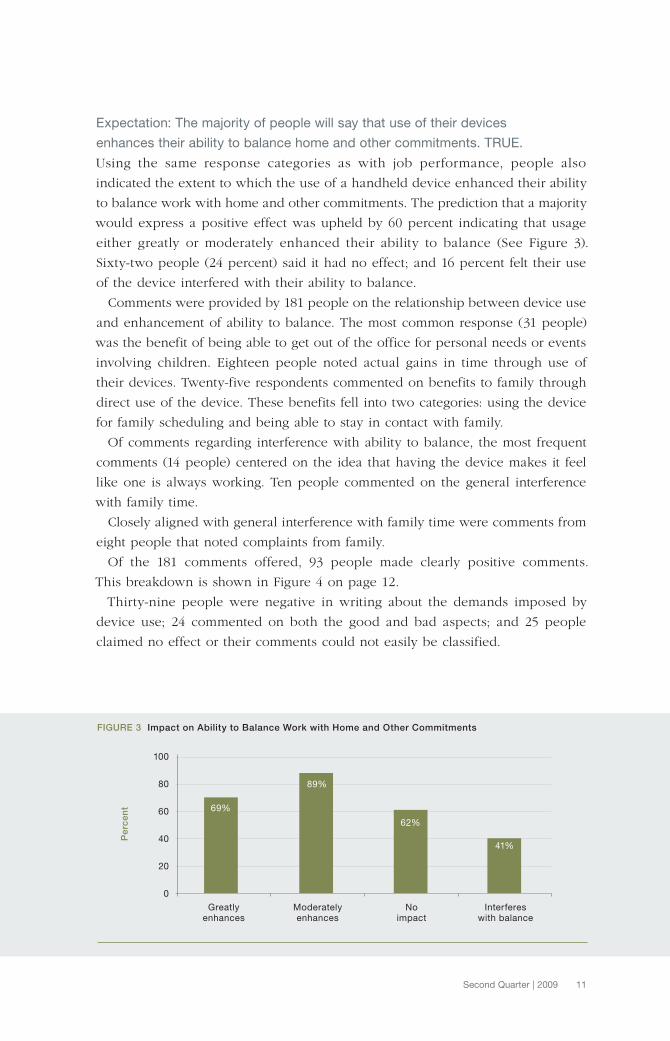
Expectation: The majority of people will say that use of their devices
enhances their ability to balance home and other commitments. TRUE.
Using the same response categories as with job performance, people also
indicated the extent to which the use of a handheld device enhanced their ability
to balance work with home and other commitments. The prediction that a majority
would express a positive effect was upheld by 60 percent indicating that usage
either greatly or moderately enhanced their ability to balance (See Figure 3).
Sixty-two people (24 percent) said it had no effect; and 16 percent felt their use
of the device interfered with their ability to balance.
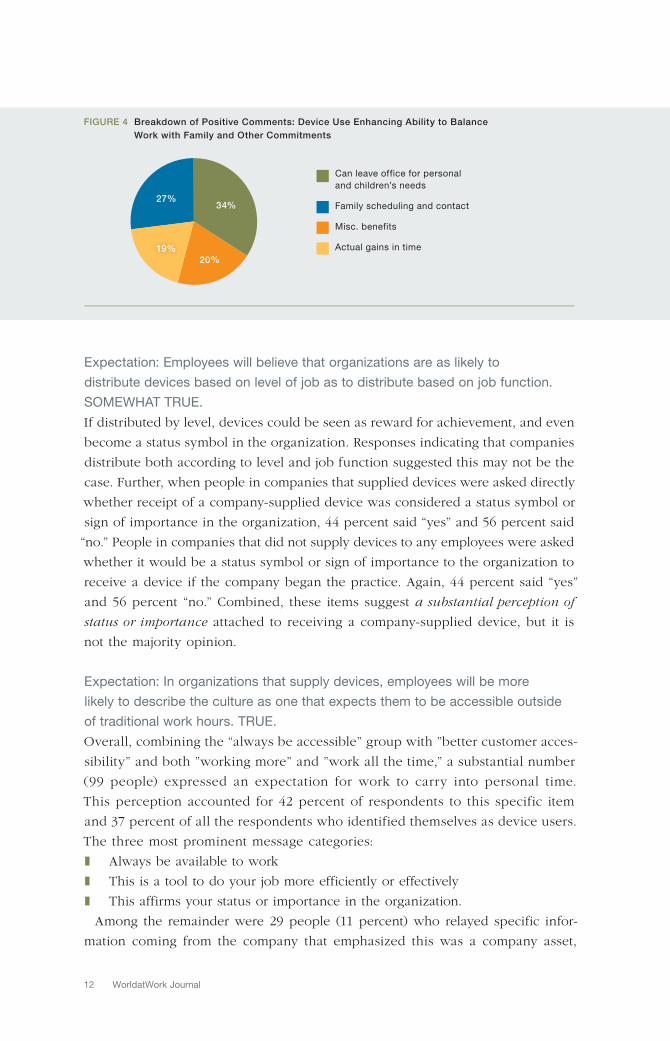
Comments were provided by 181 people on the relationship between device use
and enhancement of ability to balance. The most common response (31 people)
was the benefit of being able to get out of the office for personal needs or events
involving children. Eighteen people noted actual gains in time through use of
their devices. Twenty-five respondents commented on benefits to family through
direct use of the device. These benefits fell into two categories: using the device
for family scheduling and being able to stay in contact with family.
Of comments regarding interference with ability to balance, the most frequent
comments (14 people) centered on the idea that having the device makes it feel
like one is always working. Ten people commented on the general interference
with family time.
Closely aligned with general interference with family time were comments from
eight people that noted complaints from family.
Of the 181 comments offered, 93 people made clearly positive comments.
This breakdown is shown in Figure 4 on page 12.
Thirty-nine people were negative in writing about the demands imposed by
device use; 24 commented on both the good and bad aspects; and 25 people
claimed no effect or their comments could not easily be classified.
FIGURE 3 Impact on Ability to Balance Work with Home and Other Commitments
100
80
60
40
20
0
Greatly enhances
Moderately enhances
Noimpact
Interferes with balance
Pe
rce
nt 69%
89%
62%
41%
12 WorldatWork Journal
Expectation: Employees will believe that organizations are as likely to
distribute devices based on level of job as to distribute based on job function.
SOMEWHAT TRUE.
If distributed by level, devices could be seen as reward for achievement, and even
become a status symbol in the organization. Responses indicating that companies
distribute both according to level and job function suggested this may not be the
case. Further, when people in companies that supplied devices were asked directly
whether receipt of a company-supplied device was considered a status symbol or
sign of importance in the organization, 44 percent said “yes” and 56 percent said
“no.” People in companies that did not supply devices to any employees were asked
whether it would be a status symbol or sign of importance to the organization to
receive a device if the company began the practice. Again, 44 percent said “yes”
and 56 percent “no.” Combined, these items suggest a substantial perception of
status or importance attached to receiving a company-supplied device, but it is
not the majority opinion.
Expectation: In organizations that supply devices, employees will be more
likely to describe the culture as one that expects them to be accessible outside
of traditional work hours. TRUE.
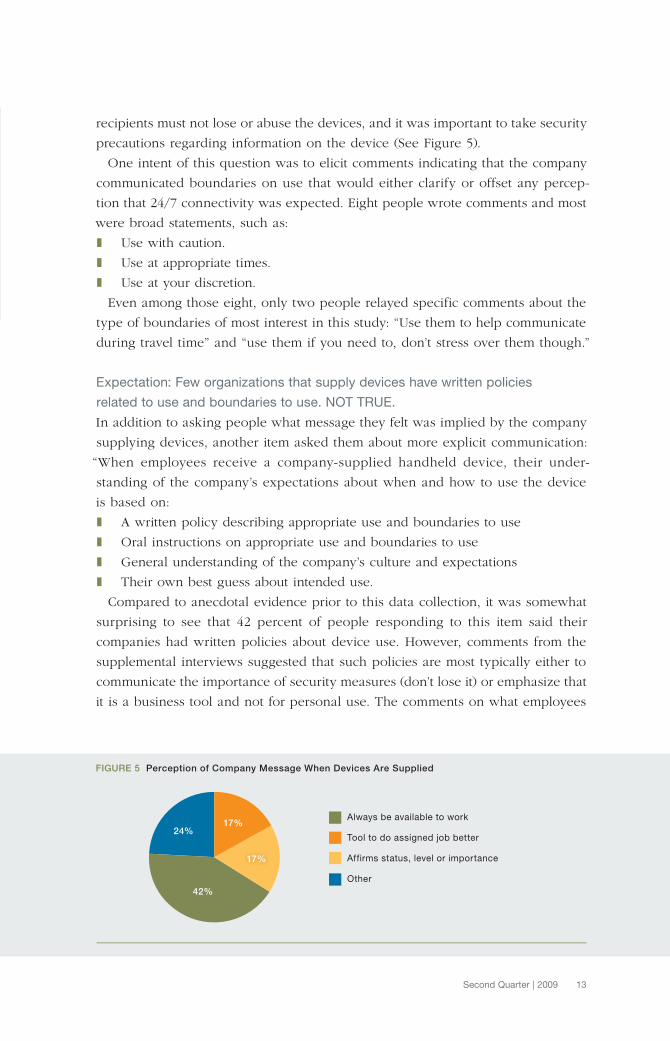
Overall, combining the “always be accessible” group with ”better customer acces-
sibility” and both ”working more” and ”work all the time,” a substantial number
(99 people) expressed an expectation for work to carry into personal time.
This perception accounted for 42 percent of respondents to this specific item
and 37 percent of all the respondents who identified themselves as device users.
The three most prominent message categories:
Always be available to work❚
This is a tool to do your job more efficiently or effectively❚
This affirms your status or importance in the organization.❚
Among the remainder were 29 people (11 percent) who relayed specific infor-
mation coming from the company that emphasized this was a company asset,
FIGURE 4 Breakdown of Positive Comments: Device Use Enhancing Ability to Balance
Work with Family and Other Commitments
Can leave office for personal
and children’s needs
Family scheduling and contact
Misc. benefits
Actual gains in time
34%
19%
27%
20%
13 Second Quarter | 2009
recipients must not lose or abuse the devices, and it was important to take security
precautions regarding information on the device (See Figure 5).
One intent of this question was to elicit comments indicating that the company
communicated boundaries on use that would either clarify or offset any percep-
tion that 24/7 connectivity was expected. Eight people wrote comments and most
were broad statements, such as:
Use with caution.❚
Use at appropriate times.❚
Use at your discretion.❚
Even among those eight, only two people relayed specific comments about the
type of boundaries of most interest in this study: “Use them to help communicate
during travel time” and “use them if you need to, don’t stress over them though.”
Expectation: Few organizations that supply devices have written policies
related to use and boundaries to use. NOT TRUE.
In addition to asking people what message they felt was implied by the company
supplying devices, another item asked them about more explicit communication:
“When employees receive a company-supplied handheld device, their under-
standing of the company’s expectations about when and how to use the device
is based on:
A written policy describing appropriate use and boundaries to use❚
Oral instructions on appropriate use and boundaries to use❚
General understanding of the company’s culture and expectations❚
Their own best guess about intended use.❚
Compared to anecdotal evidence prior to this data collection, it was somewhat
surprising to see that 42 percent of people responding to this item said their
companies had written policies about device use. However, comments from the
supplemental interviews suggested that such policies are most typically either to
communicate the importance of security measures (don’t lose it) or emphasize that
it is a business tool and not for personal use. The comments on what employees
FIGURE 5 Perception of Company Message When Devices Are Supplied
Always be available to work
Tool to do assigned job better
Affirms status, level or importance
Other
42%
24%17%
17%
14 WorldatWork Journal
perceived as the message given when supplied devices seemed to support the
idea that written policies were not setting other types of boundaries (for example,
“We expect you to turn this off to allow blocks of uninterrupted family time in the
evenings and on weekends” or “If you need to make a phone call while driving,
pull off the road before placing your call”).
This data collection did not secure information about the content of the written
policies referenced by these 153 people. Although the expectation that “few” orga-
nizations would supply written policies was not upheld, the author suspects these
policies do not reflect the type of content that formed the basis for this expectation,
and research is needed to determine the actual content of these policies.
Option to Decline a Device. In those cases when a connectivity device was a
help in job performance and could enhance ability to balance work with family
and other commitments, the employer’s practice of supplying such devices would
likely be seen as a positive feature of that organization’s culture — an indica-
tion of company support. Yet, those situations did not cover every respondent.
The question that arises is whether a person who was offered a device could
decline without penalty. If someone anticipated that use of the device would
be detrimental to either job performance or work-life balance, could that indi-
vidual simply say “no thank you” and still be considered serious about the job?
Would declining the device cause lower potential for promotion?
A total of 379 people said their companies supplied devices to some employees.
Most of these respondents also gave some response to the question of whether
an employee could decline without jeopardizing either their current job or their
promotion potential (373 and 371 respondents, respectively).
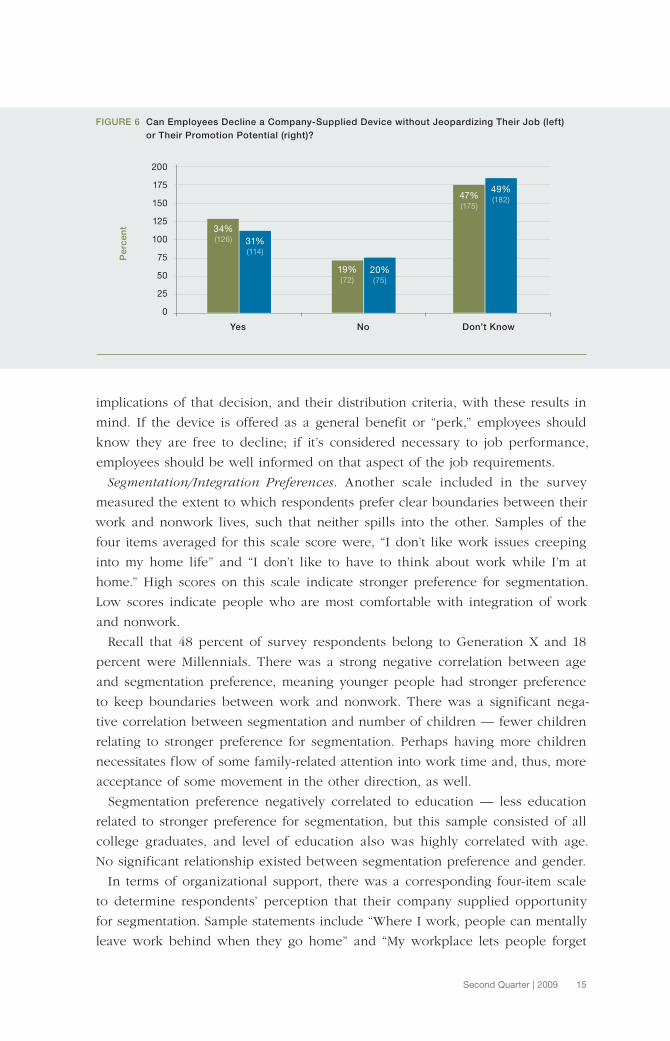
About one-fifth of the respondents for each question were convinced that people
could not decline a device without penalty, whereas around one-third indicated
no jeopardy in declining a device in their companies. The relative importance of
these proportions, and the large “I don’t know” group, may be a “glass half full
or glass half empty” type of question. An optimistic interpretation would say that
four-fifths of respondents — a sizeable majority — did not see the declination of a
device as harming job or promotion potential. The pessimistic interpretation would
be that two-thirds of respondents — again a majority — did not feel confident
that declining a device was an OK choice (See Figure 6).
Differences between current job consideration and promotion potential were
slight but consistent in the trend away from a “yes” answer. This hints that declining
might have been more of a factor for advancing in the organization than for simply
staying employed. The overall result on these two questions seemed to align with
the perceived tendency to supply devices based on status or level in the organi-
zation such that declining was seen as failure to conform to the image or actual
responsibilities attached to advancing in the company.
Perhaps of most concern were the “I don’t know” responses. Employers supplying
devices, or thinking of this practice for the future, might want to consider the
15 Second Quarter | 2009
implications of that decision, and their distribution criteria, with these results in
mind. If the device is offered as a general benefit or “perk,” employees should
know they are free to decline; if it’s considered necessary to job performance,
employees should be well informed on that aspect of the job requirements.
Segmentation/Integration Preferences. Another scale included in the survey
measured the extent to which respondents prefer clear boundaries between their
work and nonwork lives, such that neither spills into the other. Samples of the
four items averaged for this scale score were, “I don’t like work issues creeping
into my home life” and “I don’t like to have to think about work while I’m at
home.” High scores on this scale indicate stronger preference for segmentation.
Low scores indicate people who are most comfortable with integration of work
and nonwork.
Recall that 48 percent of survey respondents belong to Generation X and 18
percent were Millennials. There was a strong negative correlation between age
and segmentation preference, meaning younger people had stronger preference
to keep boundaries between work and nonwork. There was a significant nega-
tive correlation between segmentation and number of children — fewer children
relating to stronger preference for segmentation. Perhaps having more children
necessitates flow of some family-related attention into work time and, thus, more
acceptance of some movement in the other direction, as well.
Segmentation preference negatively correlated to education — less education
related to stronger preference for segmentation, but this sample consisted of all
college graduates, and level of education also was highly correlated with age.
No significant relationship existed between segmentation preference and gender.
In terms of organizational support, there was a corresponding four-item scale
to determine respondents’ perception that their company supplied opportunity
for segmentation. Sample statements include “Where I work, people can mentally
leave work behind when they go home” and “My workplace lets people forget
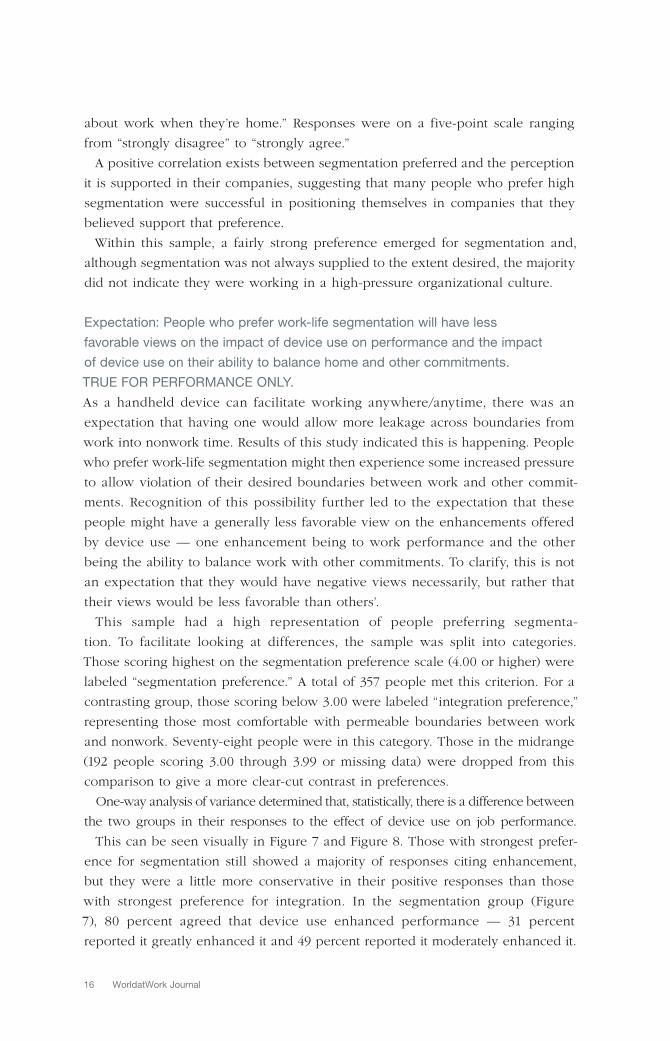
FIGURE 6 Can Employees Decline a Company-Supplied Device without Jeopardizing Their Job (left)
or Their Promotion Potential (right)?
200
175
150
125
100
75
50
25
0
Yes No Don’t Know
Pe
rce
nt 34%
(126) 31%(114)
19%(72)
20%(75)
47%(175)
49%(182)
16 WorldatWork Journal
about work when they’re home.” Responses were on a five-point scale ranging
from “strongly disagree” to “strongly agree.”
A positive correlation exists between segmentation preferred and the perception
it is supported in their companies, suggesting that many people who prefer high
segmentation were successful in positioning themselves in companies that they
believed support that preference.
Within this sample, a fairly strong preference emerged for segmentation and,
although segmentation was not always supplied to the extent desired, the majority
did not indicate they were working in a high-pressure organizational culture.
Expectation: People who prefer work-life segmentation will have less
favorable views on the impact of device use on performance and the impact
of device use on their ability to balance home and other commitments.
TRUE FOR PERFORMANCE ONLY.
As a handheld device can facilitate working anywhere/anytime, there was an
expectation that having one would allow more leakage across boundaries from
work into nonwork time. Results of this study indicated this is happening. People
who prefer work-life segmentation might then experience some increased pressure
to allow violation of their desired boundaries between work and other commit-
ments. Recognition of this possibility further led to the expectation that these
people might have a generally less favorable view on the enhancements offered
by device use — one enhancement being to work performance and the other
being the ability to balance work with other commitments. To clarify, this is not
an expectation that they would have negative views necessarily, but rather that
their views would be less favorable than others’.
This sample had a high representation of people preferring segmenta-
tion. To facilitate looking at differences, the sample was split into categories.
Those scoring highest on the segmentation preference scale (4.00 or higher) were
labeled “segmentation preference.” A total of 357 people met this criterion. For a
contrasting group, those scoring below 3.00 were labeled “integration preference,”
representing those most comfortable with permeable boundaries between work
and nonwork. Seventy-eight people were in this category. Those in the midrange
(192 people scoring 3.00 through 3.99 or missing data) were dropped from this
comparison to give a more clear-cut contrast in preferences.
One-way analysis of variance determined that, statistically, there is a difference between
the two groups in their responses to the effect of device use on job performance.
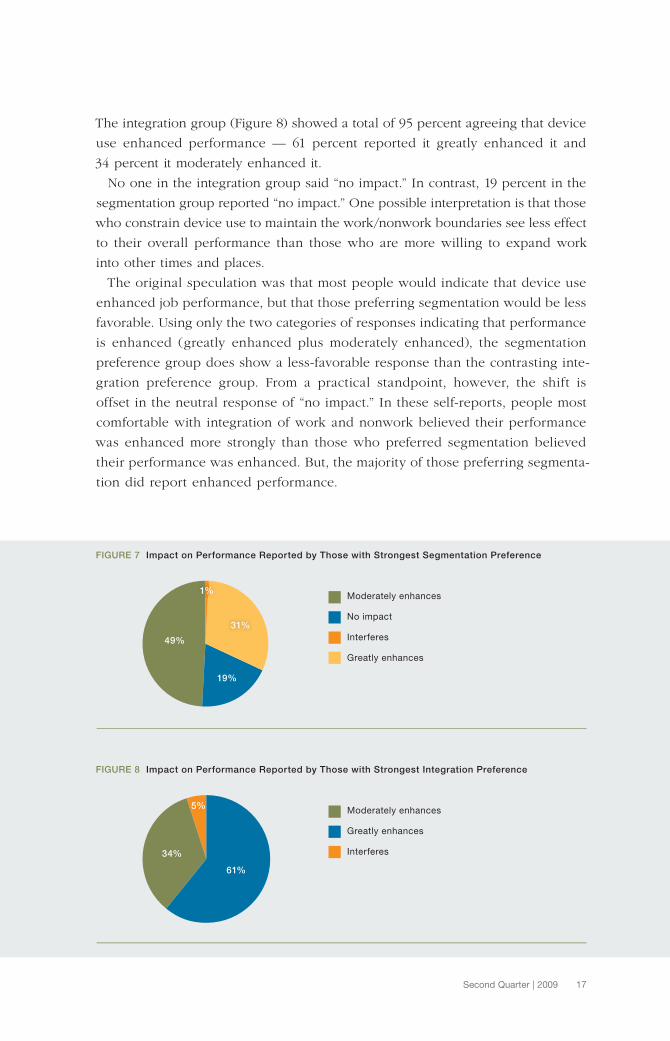
This can be seen visually in Figure 7 and Figure 8. Those with strongest prefer-
ence for segmentation still showed a majority of responses citing enhancement,
but they were a little more conservative in their positive responses than those
with strongest preference for integration. In the segmentation group (Figure
7), 80 percent agreed that device use enhanced performance — 31 percent
reported it greatly enhanced it and 49 percent reported it moderately enhanced it.
17 Second Quarter | 2009
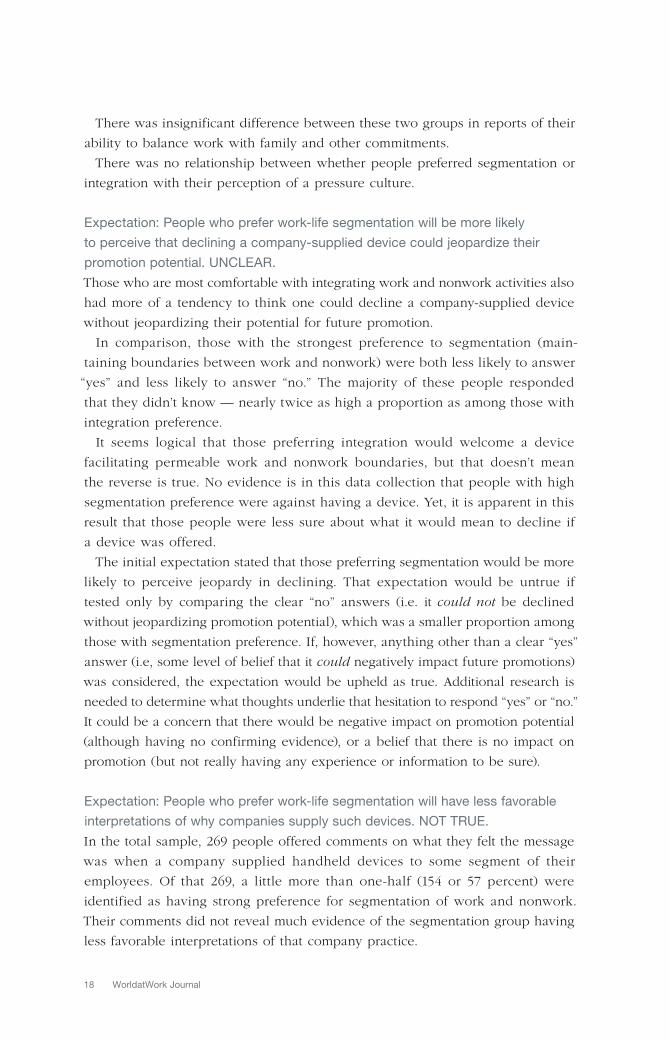
The integration group (Figure 8) showed a total of 95 percent agreeing that device
use enhanced performance — 61 percent reported it greatly enhanced it and
34 percent it moderately enhanced it.
No one in the integration group said “no impact.” In contrast, 19 percent in the
segmentation group reported “no impact.” One possible interpretation is that those
who constrain device use to maintain the work/nonwork boundaries see less effect
to their overall performance than those who are more willing to expand work
into other times and places.
The original speculation was that most people would indicate that device use
enhanced job performance, but that those preferring segmentation would be less
favorable. Using only the two categories of responses indicating that performance
is enhanced (greatly enhanced plus moderately enhanced), the segmentation
preference group does show a less-favorable response than the contrasting inte-
gration preference group. From a practical standpoint, however, the shift is
offset in the neutral response of “no impact.” In these self-reports, people most
comfortable with integration of work and nonwork believed their performance
was enhanced more strongly than those who preferred segmentation believed
their performance was enhanced. But, the majority of those preferring segmenta-
tion did report enhanced performance.
FIGURE 7 Impact on Performance Reported by Those with Strongest Segmentation Preference
Moderately enhances
No impact
Interferes
Greatly enhances
31%
1%
19%
49%
FIGURE 8 Impact on Performance Reported by Those with Strongest Integration Preference
Moderately enhances
Greatly enhances
Interferes
5%
61%
34%
18 WorldatWork Journal
There was insignificant difference between these two groups in reports of their
ability to balance work with family and other commitments.
There was no relationship between whether people preferred segmentation or
integration with their perception of a pressure culture.
Expectation: People who prefer work-life segmentation will be more likely
to perceive that declining a company-supplied device could jeopardize their
promotion potential. UNCLEAR.
Those who are most comfortable with integrating work and nonwork activities also
had more of a tendency to think one could decline a company-supplied device
without jeopardizing their potential for future promotion.
In comparison, those with the strongest preference to segmentation (main-
taining boundaries between work and nonwork) were both less likely to answer
“yes” and less likely to answer “no.” The majority of these people responded
that they didn’t know — nearly twice as high a proportion as among those with
integration preference.
It seems logical that those preferring integration would welcome a device
facilitating permeable work and nonwork boundaries, but that doesn’t mean
the reverse is true. No evidence is in this data collection that people with high
segmentation preference were against having a device. Yet, it is apparent in this
result that those people were less sure about what it would mean to decline if
a device was offered.
The initial expectation stated that those preferring segmentation would be more
likely to perceive jeopardy in declining. That expectation would be untrue if
tested only by comparing the clear “no” answers (i.e. it could not be declined
without jeopardizing promotion potential), which was a smaller proportion among
those with segmentation preference. If, however, anything other than a clear “yes”
answer (i.e, some level of belief that it could negatively impact future promotions)
was considered, the expectation would be upheld as true. Additional research is
needed to determine what thoughts underlie that hesitation to respond “yes” or “no.”
It could be a concern that there would be negative impact on promotion potential
(although having no confirming evidence), or a belief that there is no impact on
promotion (but not really having any experience or information to be sure).
Expectation: People who prefer work-life segmentation will have less favorable
interpretations of why companies supply such devices. NOT TRUE.
In the total sample, 269 people offered comments on what they felt the message
was when a company supplied handheld devices to some segment of their
employees. Of that 269, a little more than one-half (154 or 57 percent) were
identified as having strong preference for segmentation of work and nonwork.
Their comments did not reveal much evidence of the segmentation group having
less favorable interpretations of that company practice.
19 Second Quarter | 2009
PRACTICAL IMPLICATIONS
AND SUMMARY COMMENTS
Using components of the WorldatWork
Total Rewards Model, this study’s
results have implications for reward
policies and practices.
Business Strategy
The business strategy must include
a decision on the importance of
connectivity for times and places
other than the standard workday and
work site. This decision extends to
the possibility of supplying devices
allowing for such connectivity and
then determining who gets them.
Vast differences exist in the message
employees construe relative to
whether their company is currently
supplying devices to some group of
employees. In this study, the individ-
uals are from different companies, so
different messages might be accurate.
However, with a high number of people having to infer the message rather than
receiving a written policy (and the content of those policies in question), it’s likely
that a sample within one organization would also show wide variations. There
is strong support — as least as self-reported by respondents — that use of these
devices enhances performance. If the practice of supplying devices is adopted for
performance enhancement or any other reason that aligns with company strategy,
the only way to ensure that employees will grasp the true intent is to communicate
it. Whether people are receiving a device or simply are aware that others receive
them, they should understand the rationale for that practice in terms that link to
strategic objectives.
Work-Life
Work-life interface issues are a major consideration in supplying devices and
communicating expected use. This factor is woven into the organization’s culture
and through HR and total rewards strategies. The organization’s prevailing culture
will shape employees’ beliefs as to how new technology is to be incorporated
into work patterns when no explicit explanation is offered (or, perhaps, when
one is offered but unsupported by the cultural norms). This study did not find
all the expected variation-based preferences for segmentation versus integration.
RESOURCES PLUS
For more information related to this paper:
www.worldatwork.org
Type in any or all of the following keywords
or phrases on the search line:
❚ Connectivity
❚ Hand-held device
❚ Culture.
www.worldatwork.org/bookstore
❚ Employee Engagement Fundamentals —
A Guide for Managers and Supervisors
❚ Battling to Be the Best — Why Companies
Compete for Best-Place-to-Work Lists
❚ Culture at Work — Building a Robust
Work Environment to Help Drive Your
Total Rewards Strategy.
www.worldatwork.org/education
❚ W2: The Flexible Workplace — Strategies for
Your Organization, Certification Course
❚ W4: Organizational Culture Change —
A Work-Life Perspective, Certification Course
❚ T4: Strategic Communication in Total Rewards
Certification Course.
20 WorldatWork Journal
Yet, although respondents did not typically identify their organizations as high
pressure, 42 percent in this sample believed the message in receiving a device was
to always be available. In companies professing support for work-life effectiveness,
it is even more important that a clear message is given on how (and how much)
technology is to be used in what traditionally was considered personal time.
Performance and Recognition
This survey’s results highlight that employer-supplied devices do have a role in
the company’s reward strategy, and these results may help in considering possible
perceptions among those who do not receive devices.
Engagement and Satisfaction
Engagement and satisfaction are recognized as important for talent retention.
For those individuals who find that handheld devices help them perform better and
balance life demands (or believe they would do so, if they had one), employer-
supplied devices are having a positive effect. Conversely, an employee who feels
overtly pressured for 24/7 connectivity would likely feel less satisfaction, particu-
larly if the device is imposed.
Motivation and Retention
There is evidence of variation in reactions reported in this study, including the
tendency of people who prefer work-life segmentation to have a more conserva-
tive view of the performance enhancement through having a device. If there is
latitude in requirements for doing the job, an organization might be wise to assess
in advance whether people would view a supplied device as a tool for engage-
ment versus a demand for sacrifice of personal time. Further, employees should
know whether it is OK to decline a connectivity device without jeopardy to job
and/or promotion potential.
This study offers initial information to help avoid negative potentials for employers
that provide or plan to provide handheld connectivity devices to employees.
To the extent that employee perspectives differ on desirability of these devices,
the employer could formulate practices allowing for differences or, certainly,
to accurately relay the intent when differences are not easily accommodated.
The study also gives some indication of how employees are receiving informa-
tion about expectations for use of connectivity devices. Although there was higher
evidence than expected of written policies, related comments highlight further
questions about those policies’ content. The importance of prevailing organiza-
tional culture is emphasized as an important information source through which
expectations are interpreted.
This research included a cross-section of employees from a range of compa-
nies, industries and work situations to provide a general overview of the issues.
Where significant patterns and trends exist, it suggests important commonality of
21 Second Quarter | 2009
Heneman, Robert L. 2007. SHRM Foundation’s Effective Practice Guideline Series. Implementing Total Rewards
Strategies: A Guide to Successfully Planning and Implementing a Total Rewards System. Alexandria, Va.:
Society for Human Resource Management.
Kreiner, Glen E. 2006. “Consequences of work-home segmentation or integration: a person-environment fit
perspective.” Journal of Organizational Behavior, June: 485-507.
Porter, Gayle. 2009. Implications of Employer-Sponsored Connectivity Devices. Scottsdale, Ariz.: WorldatWork.
WorldatWork. 2009. “What is total rewards?” http://www.worldatwork.org/waw/aboutus/html/aboutus-whatis.html.
Viewed: Feb. 18, 2009.
REFERENCES
AUTHOR
Gayle Porter, Ph.D., is a professor of management
at Rutgers, The State University of New Jersey, and
an author and consultant on topics of workplace
performance. Before beginning an academic career,
her industry experience included technical work in
the oil and gas production industry, and finance and
accounting positions with a Fortune 500 company.
Since shifting to a human-capital focus, she has
designed and conducted organizational training
programs and employee-development seminars for
audiences across multiple industries in service and
manufacturing environments. Dr. Porter received her
Ph.D. in management and human resources from The
Ohio State University. Among other recognitions for
high-quality instruction, she received the Lindback
Distinguished Teaching Award, given for lifetime
contributions to teaching. In addition to her member-
ship in WorldatWork, Dr. Porter is active in the Society
for Human Resource Management (SHRM) and the
Academy of Management.
perceptions in a broad population. It still remains for each reader to judge whether
those results would apply in his/her organization.
The study results, however, do provide a starting point for discussion of why
the company might (or might not) want to consider providing devices, things to
consider about implementation to ensure it is seen as a positive option in the
total rewards program, and specific concerns of clear communication regarding
expectations for use. The purpose of this research is not to prescribe what an
employer’s strategy should be on furnishing electronic connectivity devices to its
employees. Rather, it is to put data into the discussion. ❚
WEB EXTRA
To review the full report titled “Implications of Employer-Sponsored Connec-
tivity Devices,” go to the WorldatWork Journal page: www.worldatwork.org.
worldatworkjournal.
Read the full WorldatWork sponsored research report, “Implications of
Employer-Sponsored Connectivity Devices”
http://www.worldatwork.org/waw/adimLink?id=32005&nonav=yes
from Author Gayle Porter, Ph.D.

How do executives reengineer HR practices to
adapt to changes in company goals and needs?
The study featured in this article is based on
interviews with CEOs and other leaders of fast-growth
companies about the “how and why” of talent manage-
ment during challenging times. Most companies have
a strategy to grow their business. But companies that
are evolving from startup to solid full-fledged growth
companies, like those in this study, often face chal-
lenges. This paper shows how a group of companies in
the United States evolved their compensation, reward
and retention practices while they successfully made
this transition. Practices and lessons learned from
executive interviews have applicability not only to
companies that are attempting such a fast-growth curve
but also to midsized companies similar in size to the
survey participants.
Results from this study show that during rapid growth,
executive leaders are willing and able to make changes
to adapt to different challenges and opportunities as
they move from startup to sustained growth. The results
of this study describe these changes and provide testi-
mony to leaders diagnosing and responding to the need
Compensation, Reward
and Retention Practices
in Fast-Growth Companies
Patricia K. Zingheim, Ph.D.
Schuster-Zingheim and Associates Inc.
Jay R. Schuster, Ph.D.
Schuster-Zingheim and Associates Inc.
Marvin G. Dertien
ERI Economic Research Institute
❚ Compensation
877-951-9191www.worldatwork.org
Contents © WorldatWork 2009. WorldatWork members and educational institutions may print 1 to 24 copies of any WorldatWork-published article for personal, non-commercial, one-time use only. To order 25 or more print presentation-ready copies, or an electronic copy for distribution to colleagues, clients or customers, contact Gail Hallman, [email protected] at Sheridan Press, 717-632-3535, ext. 8175. To order full copies of WorldatWork publications, contact WorldatWork Customer Relationship Services, [email protected], 877-951-9191.
Second Quarter 2009
23 Second Quarter | 2009
to be agile in managing and treating essential talent as they move to sustain
their business success.
In fact, executive leaders in the surveyed companies have dramatically adapted
compensation, reward and retention practices to match changing talent-manage-
ment needs. They abandoned practices that provided value during the startup
phase but were no longer providing value and shifted to solutions that deliver
a workforce with the capability to add value and that can grow to meet the
company’s evolving needs as a full-fledged, solid fast-growth company.
Schuster-Zingheim and Associates Inc. studied a convenience sample of
20 fast-growth West Coast U.S. companies selected from ERI Economic Research
Institute’s database of 4,628 companies based on fast growth in revenue.
These 20 companies had HR and line executives who were willing to be tele-
phonically interviewed in depth for an extended period, answer the authors’
questions based on a patterned interview, and provide the detailed information
needed for a thorough understanding of the changes they made to compensa-
tion, reward and retention practices as they journeyed from a startup to a solid,
full-fledged growth company. Criteria for inclusion were a history of fast growth
as well as the willingness to have their CEOs, CFOs, chief operations executives
and HR leaders participate in extensive structured interviews using the survey
instrument in the Appendix on page 38.
In the authors’ experience, direct interviews with senior members of the execu-
tive team provide the best opportunity to learn the “what, why and how” of
fashioning a successful workforce model through strategies, practices and leader-
ship actions that work. While this type of study does not provide the large samples
that Internet or mailed questionnaires can generate, this methodology does ensure
that the input provided is from the people who actually lead the companies,
formulate the strategies and champion, implement and evaluate those strategies
to ensure they are working as expected.
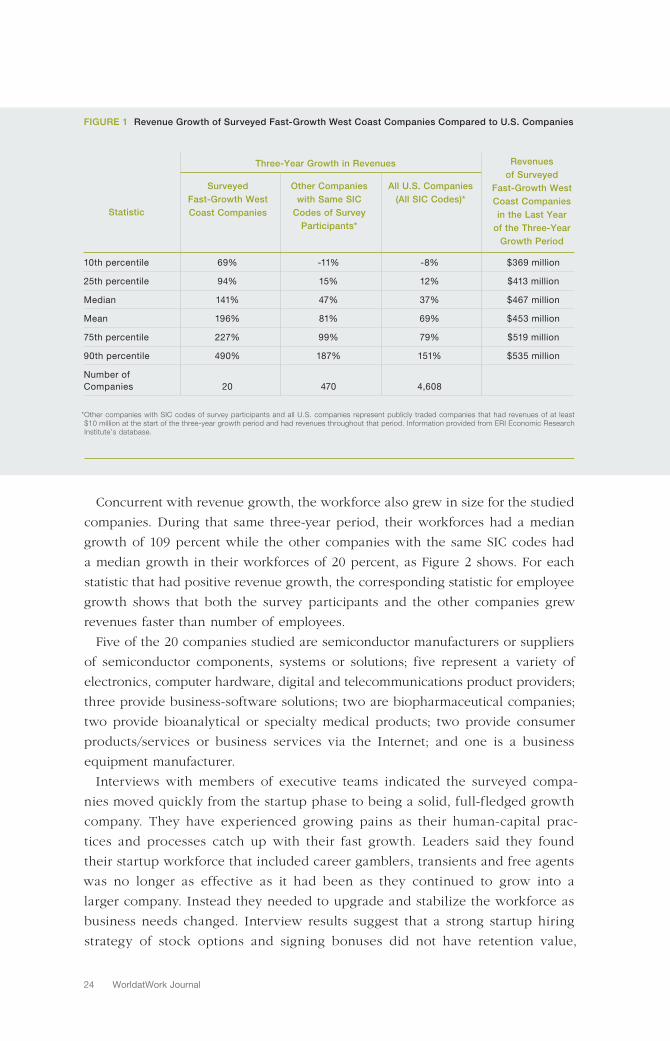
The 20 companies studied are fast-growth West Coast companies compared
to other U.S. companies. Median revenue for the surveyed companies was
$467 million in the last year of the three-year growth period. Figure 1 on page 24
shows a comparison of the percent increase in revenue growth during the same
three-year period between the studied companies and other companies with the
Standard Industrial Classification (SIC) codes of survey participants and all U.S.
companies with all SIC codes, using ERI Economic Research Institute’s database.
The median revenue growth of the 20 surveyed companies was 141 during the
three-year growth period compared to 47 percent for 470 companies with the same
SIC codes as the survey participants and 37 percent for the 4,608 U.S. compa-
nies (publicly traded companies that had revenues of at least $10 million at the
start of the three-year growth period and had revenues throughout that period).
This means that the survey participants were fast-growth compared to not only all
other companies but also to other companies most similar to them.
24 WorldatWork Journal
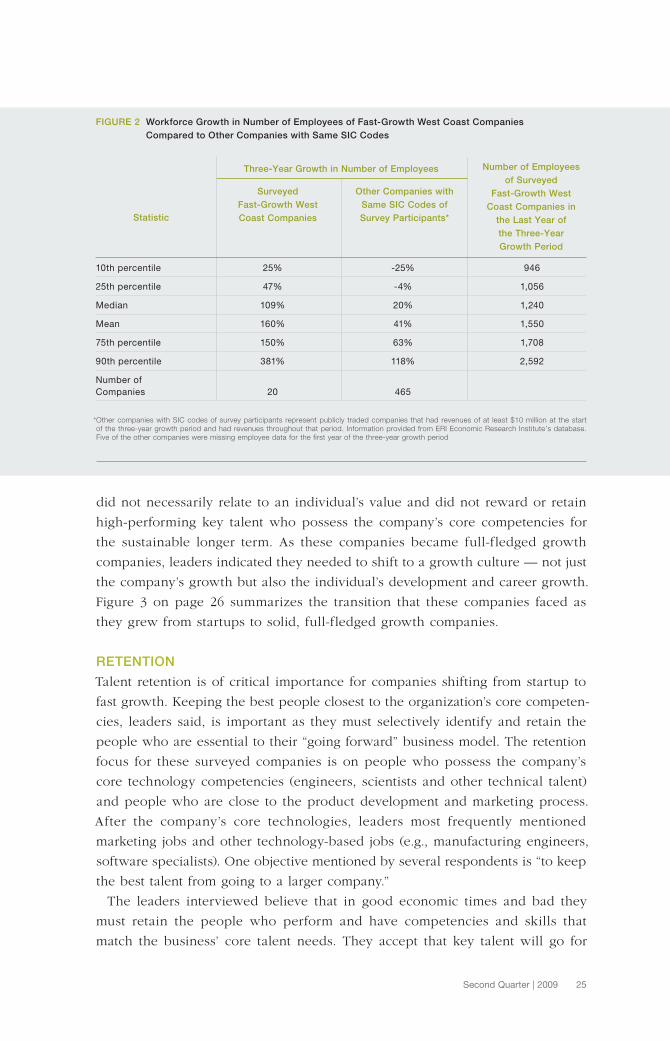
Concurrent with revenue growth, the workforce also grew in size for the studied
companies. During that same three-year period, their workforces had a median
growth of 109 percent while the other companies with the same SIC codes had
a median growth in their workforces of 20 percent, as Figure 2 shows. For each
statistic that had positive revenue growth, the corresponding statistic for employee
growth shows that both the survey participants and the other companies grew
revenues faster than number of employees.
Five of the 20 companies studied are semiconductor manufacturers or suppliers
of semiconductor components, systems or solutions; five represent a variety of
electronics, computer hardware, digital and telecommunications product providers;
three provide business-software solutions; two are biopharmaceutical companies;
two provide bioanalytical or specialty medical products; two provide consumer
products/services or business services via the Internet; and one is a business
equipment manufacturer.
Interviews with members of executive teams indicated the surveyed compa-
nies moved quickly from the startup phase to being a solid, full-fledged growth
company. They have experienced growing pains as their human-capital prac-
tices and processes catch up with their fast growth. Leaders said they found
their startup workforce that included career gamblers, transients and free agents
was no longer as effective as it had been as they continued to grow into a
larger company. Instead they needed to upgrade and stabilize the workforce as
business needs changed. Interview results suggest that a strong startup hiring
strategy of stock options and signing bonuses did not have retention value,
FIGURE 1 Revenue Growth of Surveyed Fast-Growth West Coast Companies Compared to U.S. Companies
10th percentile 69% -11% -8% $369 million
25th percentile 94% 15% 12% $413 million
Median 141% 47% 37% $467 million
Mean 196% 81% 69% $453 million
75th percentile 227% 99% 79% $519 million
90th percentile 490% 187% 151% $535 million
Number of
Companies 20 470 4,608
Statistic
Surveyed
Fast-Growth West
Coast Companies
Other Companies
with Same SIC
Codes of Survey
Participants*
All U.S. Companies
(All SIC Codes)*
Revenues
of Surveyed
Fast-Growth West
Coast Companies
in the Last Year
of the Three-Year
Growth Period
Three-Year Growth in Revenues
* Other companies with SIC codes of survey participants and all U.S. companies represent publicly traded companies that had revenues of at least $10 million at the start of the three-year growth period and had revenues throughout that period. Information provided from ERI Economic Research Institute’s database.
25 Second Quarter | 2009
did not necessarily relate to an individual’s value and did not reward or retain
high-performing key talent who possess the company’s core competencies for
the sustainable longer term. As these companies became full-fledged growth
companies, leaders indicated they needed to shift to a growth culture — not just
the company’s growth but also the individual’s development and career growth.
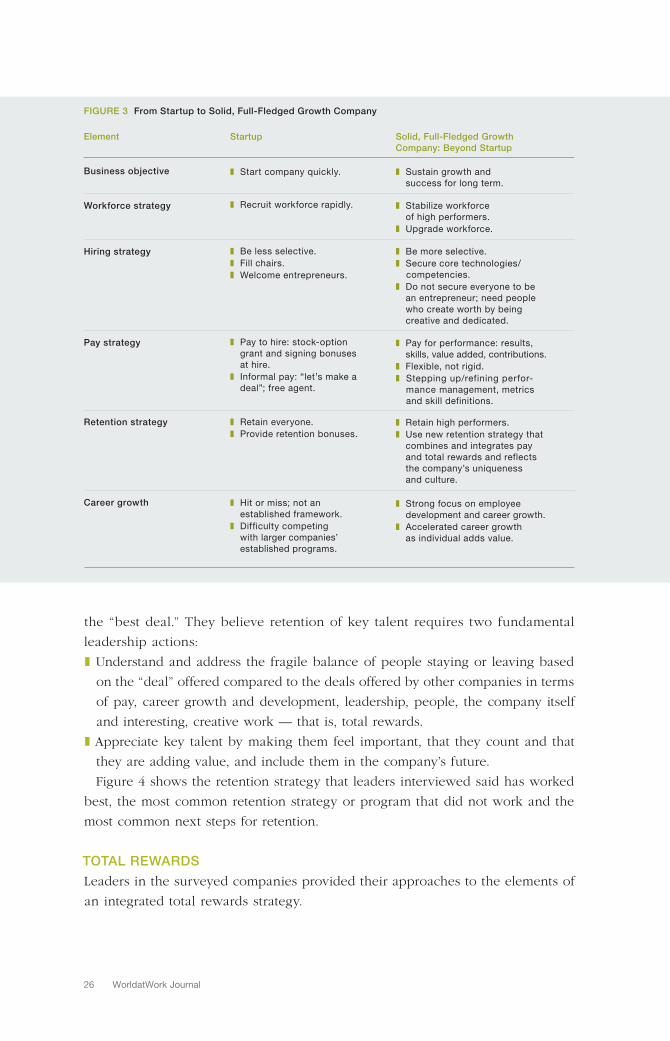
Figure 3 on page 26 summarizes the transition that these companies faced as
they grew from startups to solid, full-fledged growth companies.
RETENTION
Talent retention is of critical importance for companies shifting from startup to
fast growth. Keeping the best people closest to the organization’s core competen-
cies, leaders said, is important as they must selectively identify and retain the
people who are essential to their “going forward” business model. The retention
focus for these surveyed companies is on people who possess the company’s
core technology competencies (engineers, scientists and other technical talent)
and people who are close to the product development and marketing process.
After the company’s core technologies, leaders most frequently mentioned
marketing jobs and other technology-based jobs (e.g., manufacturing engineers,
software specialists). One objective mentioned by several respondents is “to keep
the best talent from going to a larger company.”
The leaders interviewed believe that in good economic times and bad they
must retain the people who perform and have competencies and skills that
match the business’ core talent needs. They accept that key talent will go for
FIGURE 2 Workforce Growth in Number of Employees of Fast-Growth West Coast Companies
Compared to Other Companies with Same SIC Codes
10th percentile 25% -25% 946
25th percentile 47% -4% 1,056
Median 109% 20% 1,240
Mean 160% 41% 1,550
75th percentile 150% 63% 1,708
90th percentile 381% 118% 2,592
Number of
Companies 20 465
Statistic
Surveyed
Fast-Growth West
Coast Companies
Other Companies with
Same SIC Codes of
Survey Participants*
Number of Employees
of Surveyed
Fast-Growth West
Coast Companies in
the Last Year of
the Three-Year
Growth Period
Three-Year Growth in Number of Employees
* Other companies with SIC codes of survey participants represent publicly traded companies that had revenues of at least $10 million at the start of the three-year growth period and had revenues throughout that period. Information provided from ERI Economic Research Institute’s database. Five of the other companies were missing employee data for the first year of the three-year growth period
26 WorldatWork Journal
the “best deal.” They believe retention of key talent requires two fundamental
leadership actions:
Understand and address the fragile balance of people staying or leaving based ❚
on the “deal” offered compared to the deals offered by other companies in terms
of pay, career growth and development, leadership, people, the company itself
and interesting, creative work — that is, total rewards.
Appreciate key talent by making them feel important, that they count and that ❚
they are adding value, and include them in the company’s future.
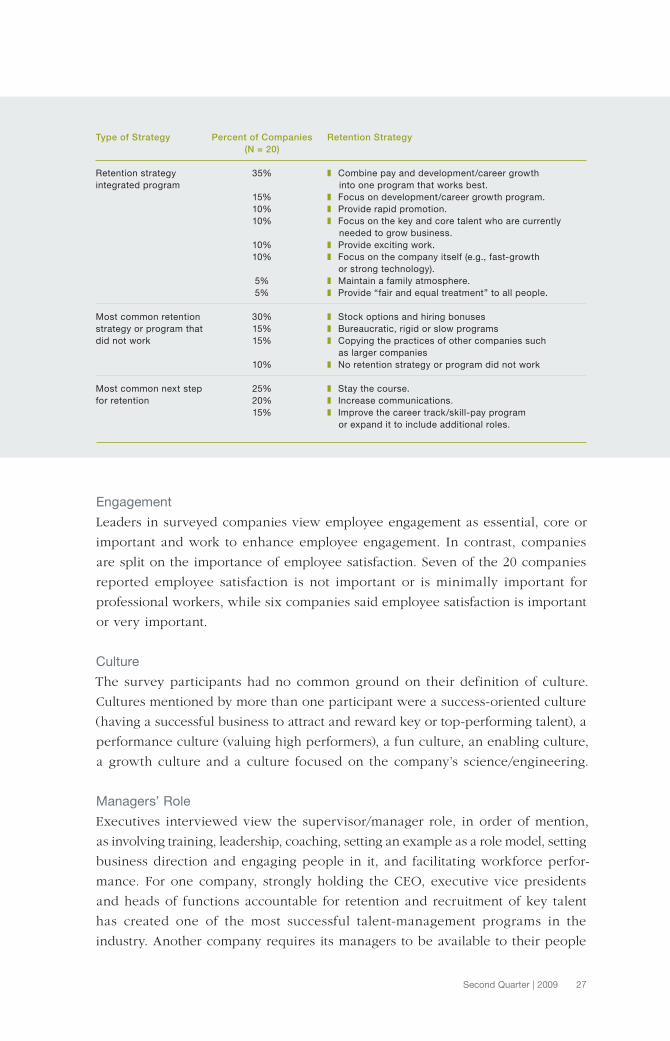
Figure 4 shows the retention strategy that leaders interviewed said has worked
best, the most common retention strategy or program that did not work and the
most common next steps for retention.
TOTAL REWARDS
Leaders in the surveyed companies provided their approaches to the elements of
an integrated total rewards strategy.
FIGURE 3 From Startup to Solid, Full-Fledged Growth Company
Startup
❚ Start company quickly.
❚ Recruit workforce rapidly.
❚ Be less selective.
❚ Fill chairs.
❚ Welcome entrepreneurs.
❚ Pay to hire: stock-option
grant and signing bonuses
at hire.
❚ Informal pay: “let’s make a
deal”; free agent.
❚ Retain everyone.
❚ Provide retention bonuses.
❚ Hit or miss; not an
established framework.
❚ Difficulty competing
with larger companies’
established programs.
Solid, Full-Fledged Growth
Company: Beyond Startup
❚ Sustain growth and
success for long term.
❚ Stabilize workforce
of high performers.
❚ Upgrade workforce.
❚ Be more selective.
❚ Secure core technologies/
competencies.
❚ Do not secure everyone to be
an entrepreneur; need people
who create worth by being
creative and dedicated.
❚ Pay for performance: results,
skills, value added, contributions.
❚ Flexible, not rigid.
❚ Stepping up/refining perfor-
mance management, metrics
and skill definitions.
❚ Retain high performers.
❚ Use new retention strategy that
combines and integrates pay
and total rewards and reflects
the company’s uniqueness
and culture.
❚ Strong focus on employee
development and career growth.
❚ Accelerated career growth
as individual adds value.
Element
Business objective
Workforce strategy
Hiring strategy
Pay strategy
Retention strategy
Career growth
27 Second Quarter | 2009
Engagement
Leaders in surveyed companies view employee engagement as essential, core or
important and work to enhance employee engagement. In contrast, companies
are split on the importance of employee satisfaction. Seven of the 20 companies
reported employee satisfaction is not important or is minimally important for
professional workers, while six companies said employee satisfaction is important
or very important.
Culture
The survey participants had no common ground on their definition of culture.
Cultures mentioned by more than one participant were a success-oriented culture
(having a successful business to attract and reward key or top-performing talent), a
performance culture (valuing high performers), a fun culture, an enabling culture,
a growth culture and a culture focused on the company’s science/engineering.
Managers’ Role
Executives interviewed view the supervisor/manager role, in order of mention,
as involving training, leadership, coaching, setting an example as a role model, setting
business direction and engaging people in it, and facilitating workforce perfor-
mance. For one company, strongly holding the CEO, executive vice presidents
and heads of functions accountable for retention and recruitment of key talent
has created one of the most successful talent-management programs in the
industry. Another company requires its managers to be available to their people
Type of Strategy Percent of Companies Retention Strategy
(N = 20)
Retention strategy 35% ❚ Combine pay and development/career growth
integrated program into one program that works best.
15% ❚ Focus on development/career growth program.
10% ❚ Provide rapid promotion.
10% ❚ Focus on the key and core talent who are currently
needed to grow business.
10% ❚ Provide exciting work.
10% ❚ Focus on the company itself (e.g., fast-growth
or strong technology).
5% ❚ Maintain a family atmosphere.
5% ❚ Provide “fair and equal treatment” to all people.
Most common retention 30% ❚ Stock options and hiring bonuses
strategy or program that 15% ❚ Bureaucratic, rigid or slow programs
did not work 15% ❚ Copying the practices of other companies such
as larger companies
10% ❚ No retention strategy or program did not work
Most common next step 25% ❚ Stay the course.
for retention 20% ❚ Increase communications.
15% ❚ Improve the career track/skill-pay program
or expand it to include additional roles.
28 WorldatWork Journal
all the time, but not oppressively so. One leader interviewed for this study said,
“I’m accountable for talent retention, motivation and development and willing to
play this role to the hilt.”
Training and Development
Leaders in the study companies said training and development are important,
particularly for professionals or people in technology jobs. Objectives are to
keep the company’s core competencies or technologies current and fresh and
to retain key talent. Surveyed companies either provide training and devel-
opment opportunities and let the individual take the initiative or provide as
much training and development as the individual wants. In addition to more
work-related skills such as new products, customer service or selling principles,
training may involve paying for advanced degrees (master’s degrees and Ph.D.s),
and classes in fields important to the company may be held on company prem-
ises. Only two survey participants mentioned that they review training results,
(e.g., results of the growth of talent compared to the expenditures on individual
and companywide bases). Several companies mentioned integrating training,
development, goals and pay.
Career Opportunities
These companies are not only fast-growth in company revenues but also fast
growth in providing career opportunities, as several believe this is why the
best people come and why the best leave. Several provide an accelerated and
concentrated career path for the technology and marketing professions. Most of
these companies accelerate careers as people add value and take on new account-
abilities and responsibilities. One company has a strategy to keep one career step
ahead of its competitors and shows job candidates a detailed comparison of its
career-growth opportunities compared to that of its two largest competitors and
demonstrates specifically how career growth at any level is several times faster
than that at the large competitors.
The surveyed companies provide parallel career paths to the manager role,
particularly in core technologies or competencies. Job rotation is important for six
surveyed companies as a part of career development or to periodically provide
fresh opportunities.
Communications
Some key communications messages senior leaders use include: “Reinvent your-
self every year” (in terms of growth), “Change is a way of life” and “Make
innovation a way of life.” Communication is constant, open, clear, complete and
welcoming. These companies are linking messages — communication involves
not only updates on the company’s performance but also how people can influ-
ence it and gain from it as well as how an individual is doing. The most common
29 Second Quarter | 2009
medium for communication is the intranet, followed by manager-employee face-
to-face communication.
TOTAL COMPENSATION PRACTICES
One CEO said, “If we don’t pay for performance to grow our business, what do
you suggest we pay for?” Nineteen of the 20 surveyed companies reported they
pay for performance or results — one described it as paying for creativity and
innovation that generate business results. Three reported paying strongly for
performance/results, with three encouraging poor performers to leave. Figure 5
summarizes the surveyed companies’ compensation and benefits practices.
Survey participants typically said they have an integrated view of their pay
and rewards programs. The majority described their most successful program as
an integrated program — either total compensation or total cash compensation.
One-fourth of the companies said none of their pay and rewards programs did not
work, likely because these companies view individual compensation programs as
contributing to an integrated rewards and retention program.
Pay Competitiveness
Competitive base pay is seen as a core element but not the whole picture.
It is important, along with career opportunities, to recruit key talent. Adjectives
surveyed companies added in front of competitive base pay include “reasonable,”
“fair,” “fully” and “remaining.” Fourteen of the 20 companies pay above market
for their key talent.
Variable Pay
All but one of the surveyed companies have some form of short-term and/or long-
term variable pay (excluding recognition programs). Eighteen of the 20 companies
have variable pay of some form for the professional workforce.
Cash incentives are the most frequent form; two companies plan to add a cash
incentive in the future — one because stock options have run their course and
the other to supplement the performance share plan. Eight mentioned having all
employees incentive-eligible as it is essential to bond people to the company and
to link people to performance results.
Cash incentives are tied to performance metrics — some combination of compa-
nywide, individual, functional or team-performance metrics. Depending on the
company, incentive opportunity may have significant upside to reward the high-
performing key talent.
Of the 14 companies providing some form of stock below managers, most use
these programs to reward high-performing key talent strongly and vary award size
based on individual performance and organizational level. Companies typically
provide direct stock grants or stock options annually or regularly, although one
provides stock options for retention and another at promotion.
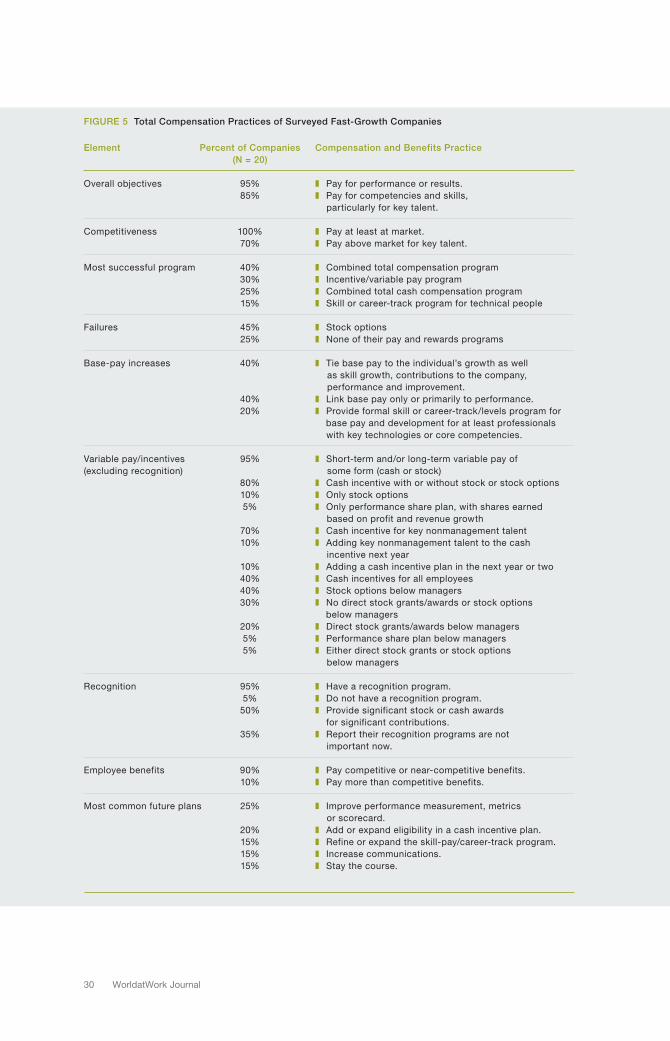
30 WorldatWork Journal
FIGURE 5 Total Compensation Practices of Surveyed Fast-Growth Companies
Element Percent of Companies Compensation and Benefits Practice
(N = 20)
Overall objectives 95% ❚ Pay for performance or results.
85% ❚ Pay for competencies and skills,
particularly for key talent.
Competitiveness 100% ❚ Pay at least at market.
70% ❚ Pay above market for key talent.
Most successful program 40% ❚ Combined total compensation program
30% ❚ Incentive/variable pay program
25% ❚ Combined total cash compensation program
15% ❚ Skill or career-track program for technical people
Failures 45% ❚ Stock options
25% ❚ None of their pay and rewards programs
Base-pay increases 40% ❚ Tie base pay to the individual’s growth as well
as skill growth, contributions to the company,
performance and improvement.
40% ❚ Link base pay only or primarily to performance.
20% ❚ Provide formal skill or career-track/levels program for
base pay and development for at least professionals
with key technologies or core competencies.
Variable pay/incentives 95% ❚ Short-term and/or long-term variable pay of
(excluding recognition) some form (cash or stock)
80% ❚ Cash incentive with or without stock or stock options
10% ❚ Only stock options
5% ❚ Only performance share plan, with shares earned
based on profit and revenue growth
70% ❚ Cash incentive for key nonmanagement talent
10% ❚ Adding key nonmanagement talent to the cash
incentive next year
10% ❚ Adding a cash incentive plan in the next year or two
40% ❚ Cash incentives for all employees
40% ❚ Stock options below managers
30% ❚ No direct stock grants/awards or stock options
below managers
20% ❚ Direct stock grants/awards below managers
5% ❚ Performance share plan below managers
5% ❚ Either direct stock grants or stock options
below managers
Recognition 95% ❚ Have a recognition program.
5% ❚ Do not have a recognition program.
50% ❚ Provide significant stock or cash awards
for significant contributions.
35% ❚ Report their recognition programs are not
important now.
Employee benefits 90% ❚ Pay competitive or near-competitive benefits.
10% ❚ Pay more than competitive benefits.
Most common future plans 25% ❚ Improve performance measurement, metrics
or scorecard.
20% ❚ Add or expand eligibility in a cash incentive plan.
15% ❚ Refine or expand the skill-pay/career-track program.
15% ❚ Increase communications.
15% ❚ Stay the course.
31 Second Quarter | 2009
Stock Options
Nine of the surveyed companies reported that their stock option program did not
effectively work. Three companies mentioned that their hiring bonuses did not
work. A key human-capital issue during the transition from startup to full-fledged
growth company was the impact of stock options and signing bonuses for the
following reasons:
Often the best people would leave the company to reload or get new stock ❚
options and a new signing bonus at another company.
The value of the hiring package depends on when the individual was hired ❚
(especially if the stock was volatile) and not on the individual’s value to the
business.
Some employees who had valuable stock options became entitled. ❚
Stock options at startup create a gambling mentality, which does not match a ❚
full-fledged growth company’s mentality.
The value of stock options is unpredictable, as their value is based on not only ❚
company performance but also the performance of the company’s industry and
the general economic climate.
Company growth may not continue at its startup or current pace, and setbacks ❚
may occur.
As the company continues to grow, fewer stock options per person are available. ❚
The companies that moved from stock options have shifted to an integrated
compensation and rewards program, including individual growth and development
as well as direct stock awards, a stronger emphasis on cash incentives or, in one
company, a performance share plan.
Recognition
Of the 19 companies with a recognition program, seven reported that their recogni-
tion program is not important now as either recognition does not fit the culture or
the company has moved away from earlier recognition programs. Nine companies
with recognition programs, however, provided significant stock or cash awards
for significant contributions. These recognition programs reward, for example,
breakthroughs, unexpected contributions to income growth, inventions, significant
contributions, new clients and new projects. For one company, the award for an
invention that adds business value or for unexpected contributions to income
growth is $100,000 at a minimum and has been $300,000 in stock and cash.
Benefits
Employee benefits, especially health care, are considered a basic and important
foundational element but are not a defining or determining factor in attracting or
retaining talent as competitors for talent also offer employee benefits.
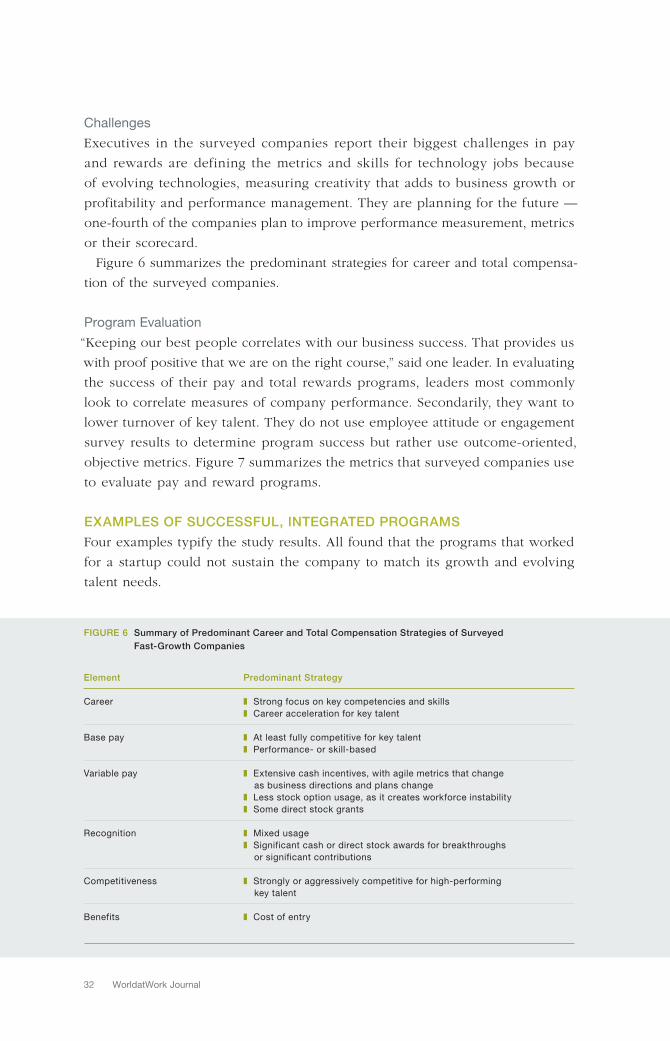
32 WorldatWork Journal
Challenges
Executives in the surveyed companies report their biggest challenges in pay
and rewards are defining the metrics and skills for technology jobs because
of evolving technologies, measuring creativity that adds to business growth or
profitability and performance management. They are planning for the future —
one-fourth of the companies plan to improve performance measurement, metrics
or their scorecard.
Figure 6 summarizes the predominant strategies for career and total compensa-
tion of the surveyed companies.
Program Evaluation
“Keeping our best people correlates with our business success. That provides us
with proof positive that we are on the right course,” said one leader. In evaluating
the success of their pay and total rewards programs, leaders most commonly
look to correlate measures of company performance. Secondarily, they want to
lower turnover of key talent. They do not use employee attitude or engagement
survey results to determine program success but rather use outcome-oriented,
objective metrics. Figure 7 summarizes the metrics that surveyed companies use
to evaluate pay and reward programs.
EXAMPLES OF SUCCESSFUL, INTEGRATED PROGRAMS
Four examples typify the study results. All found that the programs that worked
for a startup could not sustain the company to match its growth and evolving
talent needs.
FIGURE 6 Summary of Predominant Career and Total Compensation Strategies of Surveyed
Fast-Growth Companies
Element Predominant Strategy
Career ❚ Strong focus on key competencies and skills
❚ Career acceleration for key talent
Base pay ❚ At least fully competitive for key talent
❚ Performance- or skill-based
Variable pay ❚ Extensive cash incentives, with agile metrics that change
as business directions and plans change
❚ Less stock option usage, as it creates workforce instability
❚ Some direct stock grants
Recognition ❚ Mixed usage
❚ Significant cash or direct stock awards for breakthroughs
or significant contributions
Competitiveness ❚ Strongly or aggressively competitive for high-performing
key talent
Benefits ❚ Cost of entry
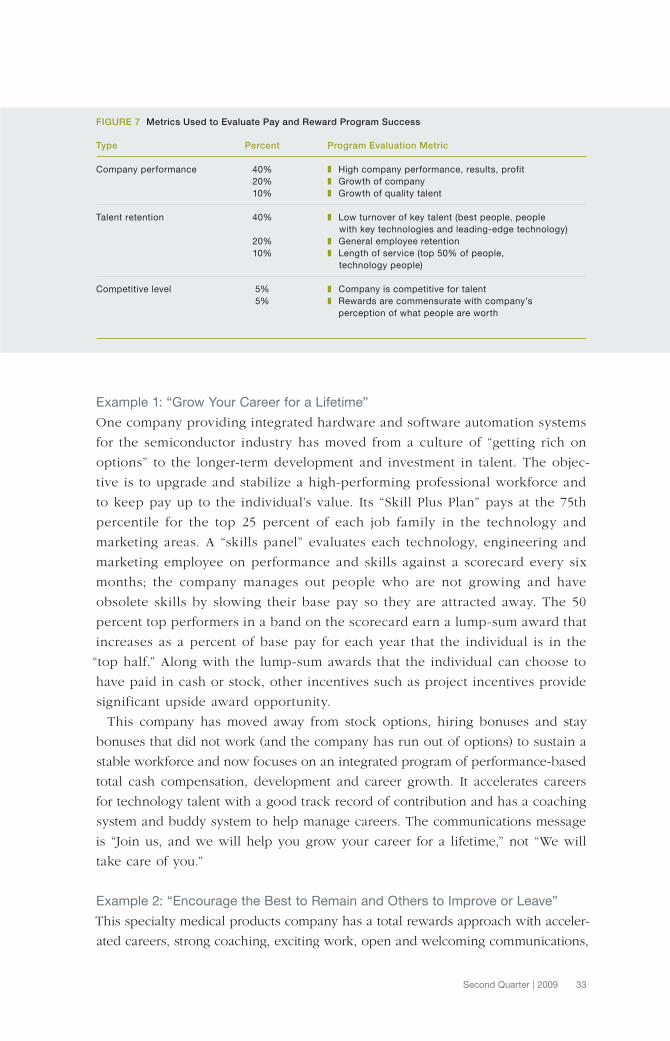
33 Second Quarter | 2009
Example 1: “Grow Your Career for a Lifetime”
One company providing integrated hardware and software automation systems
for the semiconductor industry has moved from a culture of “getting rich on
options” to the longer-term development and investment in talent. The objec-
tive is to upgrade and stabilize a high-performing professional workforce and
to keep pay up to the individual’s value. Its “Skill Plus Plan” pays at the 75th
percentile for the top 25 percent of each job family in the technology and
marketing areas. A “skills panel” evaluates each technology, engineering and
marketing employee on performance and skills against a scorecard every six
months; the company manages out people who are not growing and have
obsolete skills by slowing their base pay so they are attracted away. The 50
percent top performers in a band on the scorecard earn a lump-sum award that
increases as a percent of base pay for each year that the individual is in the
“top half.” Along with the lump-sum awards that the individual can choose to
have paid in cash or stock, other incentives such as project incentives provide
significant upside award opportunity.
This company has moved away from stock options, hiring bonuses and stay
bonuses that did not work (and the company has run out of options) to sustain a
stable workforce and now focuses on an integrated program of performance-based
total cash compensation, development and career growth. It accelerates careers
for technology talent with a good track record of contribution and has a coaching
system and buddy system to help manage careers. The communications message
is “Join us, and we will help you grow your career for a lifetime,” not “We will
take care of you.”
Example 2: “Encourage the Best to Remain and Others to Improve or Leave”
This specialty medical products company has a total rewards approach with acceler-
ated careers, strong coaching, exciting work, open and welcoming communications,
FIGURE 7 Metrics Used to Evaluate Pay and Reward Program Success
Type Percent Program Evaluation Metric
Company performance 40% ❚ High company performance, results, profit
20% ❚ Growth of company
10% ❚ Growth of quality talent
Talent retention 40% ❚ Low turnover of key talent (best people, people
with key technologies and leading-edge technology)
20% ❚ General employee retention
10% ❚ Length of service (top 50% of people,
technology people)
Competitive level 5% ❚ Company is competitive for talent
5% ❚ Rewards are commensurate with company’s
perception of what people are worth
34 WorldatWork Journal
and a pay, incentive and stock-ownership program encouraging the best to stay and
others to leave or improve. It believes that pay must be reasonable but aggressive and
employee engagement is critical and uses its exciting science and reputation to attract
talent. The top 25 percent of key talent earn large salary increases, cash and stock
awards and promotion to higher-impact roles (not necessarily management roles).
About 20 percent of the workforce work in the long-term nature of product
research and development, so performance may not be realized for several years,
and the company is betting on their contributions. For these people, the company
provides progressing” base-pay adjustments, progressing incentive awards and
progressing direct stock grants based on the individual’s contribution to date and
in expectation of project success. All employees are eligible for an annual incentive
based one-third on company income, one-third on division profit contribution and
one-third on individual goals set by the manager. Recognition is limited to a cash
or direct stock award, with a ceremony for “making a difference.”
Example 3: “People Are 50 Percent of Our Cost and 100 Percent of Our Success”
This semiconductor manufacturer’s compensation program is called “Great Prod-
ucts for Great Customers.” The objective is to pay the senior technology people
well and develop everyone in the company. Everyone has the opportunity to
grow, and rapid promotions occur at an accelerated rate by keeping one step
ahead of the competition and looking for opportunities to move individuals into
more responsible and developmental roles. This company has career tracks for
its broadbanded jobs based on the labor market; a scorecard is used to review
salaries, with increases that occur as often as a manager suggests and are signifi-
cant for exceptional results. An annual incentive bases incentive opportunity on
the potential to influence the company’s performance and is based one-third on
company, one-third on organizational unit and one-third on individual results.
In addition to hiring stock options, this third company annually provides a direct
stock award (based on a combination of the individual’s role and performance) to
all employees except the top executives, as the direct stock award grant has more
predictable value than a stock-option grant. This company views the core of paying
people as significant direct stock grants for significant contributions and also has what
it terms a “Super Contribution Award” that is paid in direct stock for significant busi-
ness contributions on projects, new products, new customers, etc., typically to sales,
marketing and engineering individuals. The CEO and an executive panel recommend
this important annual award and the awards are subject to board approval. The CEO’s
view is that it is essential to get great people and keep them regardless of the cost.
Example 4: “Fast Growth Means Great People Paid in a Combination
of Development and Job Performance”
This specialized electronic systems and components company’s objective is to have
a stable professional workforce and a longer-term perspective on talent management
35 Second Quarter | 2009
not only by communicating that the
company wants people for the longer
term and wants to develop them but
also by trying to lock them into the
company. Its “People First Program”
combines development, career
growth, performance management
and pay and replaces stock options
and signing bonuses that created
workforce instability. This company
provides technical, marketing and
sales employees with individualized,
written “employment agreements”
that provide benefits and features
for one year and are renegotiated
the next year.
These agreements delineate the
obligations of the company and the
individual in terms of goals, skills
and rewards; commit a manager to
an individual for one year for training,
developing and coaching each month
with write-ups; provide contingent
base-pay adjustments based on goal, project and other performance metrics; have
an “out” for the company if business performance or economics substantially change,
so it is not a contract; and define incentive eligibility and metrics for the year.
The individual chooses whether the incentive award is to be paid in cash or stock.
Most often key talent receives two salary increases per year; if not, the message is
to look for another job, as the company is trying to manage out the poor performers
to the marginally average performers by managing base pay relative to the competi-
tion. With the cash incentive, the top 75 percent of the workforce is paid at the 75th
percentile of the labor market, with the rest paid considerably lower.
SUCCESSFUL PRACTICES
Leaders from the study companies described a variety of pay and total rewards
practices that have been successful in retaining key talent, with the following
being typical:
A focus on career growth, including career opportunities for all employees, career ❚
acceleration for key talent, and technical career-tracks and skill-pay programs
that communicate development and pay in one package. When people become
a number and the company does not focus on their development and career
growth, they leave.
RESOURCES PLUS
For more information related to this paper:
www.worldatwork.org
Type in any or all of the following keywords
or phrases on the search line:
❚ Fast + growth
❚ High-performing talent
❚ Talent retention.
www.worldatwork.org/bookstore
❚ High Performance Pay —
Fast Forward to Business Success
❚ Incentive Pay —
Creating a Competitive Advantage
❚ The WorldatWork Handbook of
Compensation, Benefits & Total Rewards —
A Comprehensive Guide for HR Professionals.
www.worldatwork.org/education
❚ C17: Market Pricing — Conducting a
Competitive Pay Analysis, Certification Course
❚ C11: Performance Management — Strategy,
Design and Implementation, Certification Course
❚ Pricing Critical Skills and Unique Positions
(Competitive Market Pay), Seminar.
36 WorldatWork Journal
Sharing the company’s success with people to make them feel part of the ❚
organization and its momentum.
Moving off stock options and retention bonuses that destabilize the workforce ❚
and do not sustain the organization for the long term although they put out the
initial startup fire.
Providing integrated pay and total rewards programs customized to the workforce ❚
segment (core technology talent, sales/marketing talent, other talent).
Ensuring compensation keeps pace with career growth. Pay key talent well; pay ❚
the most for the best talent — they are worth the investment.
Hiring for creativity, the potential for creativity and “idea people,” and rewarding ❚
those people well.
Focusing on the company’s core technologies — for example, the company is ❚
run by technology people, not finance or lawyers; the company values science
and does its own research and development, manufacturing and quality control.
Business success and hiring great people serving as a magnet for attracting other ❚
key talent.
LESSONS LEARNED
Executives interviewed gave advice about program design, including:
Identify and focus principally on high performers and key talent who have ❚
essential competencies and skills and who make a measurable difference to the
business. Develop a pay and rewards program that retains them longer.
Plan for the stabilization of the workforce for the long term as the company grows ❚
or if the company has a temporary downturn.
Implement an understandable, not complex, integrated retention, pay and rewards ❚
program, as the company’s fast growth can create confusion. Evolve and refine
the program as needs change. Remain agile as it relates to human-capital prac-
tices.
Capitalize on company growth by taking advantage of the company’s image as ❚
a new player in the marketplace and by going where other companies (likely
larger and/or slower-growth companies) are not.
Do not make commitments to “early people,” as a fast-growth company most likely ❚
will outgrow them and hope they move on. Actively manage the poor performers
to improve or leave, using compensation to facilitate the individual’s decision.
Accept that people go for a better deal, so make the deal most effective for ❚
both the company and the talent who the company most wants to retain.
The company must also gain something in the deal — people must continue
to develop skills and increase their value added to the business if the company
pays a premium.
37 Second Quarter | 2009
CONCLUSIONS
This study provides insight into how the top executives of fast-growth companies
on the West Coast of the United States have managed the transition from startup
to sustained fast growth from the standpoint of talent-management strategies,
practices and programs. Candid interviews with members of senior-leadership
team, not questionnaires, were used to learn how these successful companies
have moved beyond startup.
The leadership challenge is to sustain business growth and success while stabi-
lizing a workforce of high-performing key talent who possess the company’s core
competencies. To do this, these fast-growth companies have chosen an integrated
view of total compensation and total rewards, including training, development and
career opportunities. They have customized their performance-based compensa-
tion approaches. But their objective is the same — to retain high-performing key
talent by providing significant pay and rewards, making certain that pay and
rewards keep up with an individual’s value and accelerating career growth based
on an individual’s development and track record of solid contributions. ❚
AUTHORS
Patricia K. Zingheim, Ph.D., and Jay R. Schuster, Ph.D.,
are partners in Schuster-Zingheim and Associates
Inc., a globally recognized pay and rewards consulting
firm located in Los Angeles and founded in 1985.
They consult with a wide range of companies throughout
the world on the development of total rewards, incen-
tives and other pay solutions. Dr. Schuster and
Dr. Zingheim received the Keystone Award from
WorldatWork in 2006. They were selected as pay and
motivation gurus in The Guru Guide, and are authors
of three rewards books: High-Performance Pay: Fast
Forward to Business Success (WorldatWork 2007),
Pay People Right! Breakthrough Reward Strategies
to Create Great Companies (Jossey-Bass 2000) and
The New Pay: Linking Employee and Organizational
Performance (Jossey-Bass 1996). They are also authors
of more than 300 papers in business magazines on the
subjects of rewards and organizational effectiveness.
Both are contributors to publications such as Fortune,
Across the Board, The Wall Street Journal, Working
Woman and BusinessWeek. They have appeared on
many television, cable and radio programs including
CNBC, CNN, NBC and CBS. They speak throughout
the world to leadership audiences interested in creating
a high-performance workplace through people.
Their Web site is www.paypeopleright.com.
Marvin G. Dertien is a member of the ERI Economic
Research Institute staff. ERI Economic Research
Institute was founded in 1987 to provide compensa-
tion, benefits and HR research for private and public
organizations in the form of reports and software
database products. ERI research is widely used by
more than 10,000 client organization and subscribers.
Dertien has more than 40 years of experience in
compensation and human resources and is trained
in multiple programming code languages and statis-
tical analysis. He has published articles in Personnel
Journal, WorldatWork Journal and Compensation and
Benefit Review.

38 WorldatWork Journal
Schuster-Zingheim and Associates Inc.
would like to understand how your company
does the following:
1 | What are your current challenges and strategies
related to retention and also pay and rewards
for employees?
2 | What practices have been successful, and
what have been less successful in helping
accelerate or maintain business growth?
3 | To what extent does your company pay for
performance? How does it work? What have
been the results?
4 | What next steps or actions do you plan to take?
5 | What suggestions and recommendations do you
have for other companies seeking fast growth?
6 | What has been especially successful relative
to communications and gaining workforce
understanding, acceptance and engagement?
RETENTION
7 | What workforce-retention strategies and
practices have proven most valuable to your
business growth? Please describe your compa-
ny’s most pressing talent-retention challenges.
8 | What has been your experience relative to why
employees leave or stay with the company?
9 | Please describe your company’s strategy
related to talent retention.
10 | What skills and competencies are critical
to your company to retain and why?
11 | What role do you believe the following play
in workforce retention?
❚ Overall employee satisfaction
❚ Employee engagement
❚ Organizational culture
❚ Supervisor/manager/leadership relations
❚ Work environment
❚ Communications
❚ Training and development
❚ Career opportunity
❚ Base pay
❚ Incentives/bonuses
❚ Recognition and recognition awards
(cash or noncash)
❚ Employee benefits (e.g., health insurance,
retirement, PTO)
❚ Work-life benefits (e.g., flexible hours,
job sharing, job rotation)
❚ Other (explain).
APPENDIXFocused Interview Guide for Study of Workforce Retention, Pay and Rewards in a Sample
of Fast-Growth West Coast U.S. Companies
Schuster-Zingheim and Associates Inc. is exploring strategies, practice and evaluative experiences and
comments regarding workforce retention, pay and other rewards for employees, particularly hard-to-retain
employees. We have selected a sample of fast growth, West Coast companies for this study to gauge the
impact talent-management strategies and practices related to retention, pay and rewards have on business-
growth performance. We are studying how the West Coast’s fastest-growth companies address critical
HR management issues, including the workforce retention challenges and solutions, and pay and rewards
(which includes paying for performance).
Our objective, if you are willing, is to gain insight into your practices, why you follow them, what the results
are, and what you have learned about these workforce issues as a result of using these workforce practices.
The companies studied will not be listed, and individual input will not be attributed to you in any way.
39 Second Quarter | 2009
12 | What practices have worked best for
retention? Why?
13 | What practices have not worked well
for retention? Why?
14 | What is the next action you plan to improve
retention? Why?
15 | What is the role of the executive team and
managers in talent retention?
16 | How do you evaluate the effectiveness of your
company’s retention strategy and practices?
PAY AND REWARDS
17 | What pay and reward strategies and practices
have proven most valuable to your business
growth? Please describe your company’s most
pressing pay and reward challenges.
18 | Please describe your company’s strategy
related pay and rewards for the workforce.
For hard-to-retain employees?
19 | To what extent does your company pay
for performance for the workforce? Why has
your company adopted this strategy?
❚ Not a strategy
❚ Not truly pay for performance —
although say we pay for performance
❚ Pay market
❚ Pay for competencies and skills
❚ Pay for performance and results
❚ Pay very strongly for performance and
results — with strong pay differentiation
based on performance
❚ Some combination (what combination?).
20 | What has been challenging and what has
been successful in measuring employee
performance? Competencies and skills?
21 | If your company pays for performance for
the workforce, please describe how pay for
performance works in your company. What is
the program? How would you evaluate
the program’s success?
22 | What pay and reward practices and programs
have worked most successfully? Why?
23 | What pay and reward practices and programs
have not worked well? Why?
24 | What is the next action you plan for pay
and rewards? Why?
25 | How do you evaluate the effectiveness of
your company’s pay and rewards strategy
and practices?
26 | What has been particularly effective in
communicating pay and rewards for employee
understanding, acceptance and engagement?
SUMMARY
27 | What are your company’s lessons learned about:
❚ The role of workforce retention, pay and
rewards in your accelerated business growth
❚ Retaining employees
❚ Pay and rewards, including paying for
performance if your company pays employees
for performance.
Thank you very much for your participation.
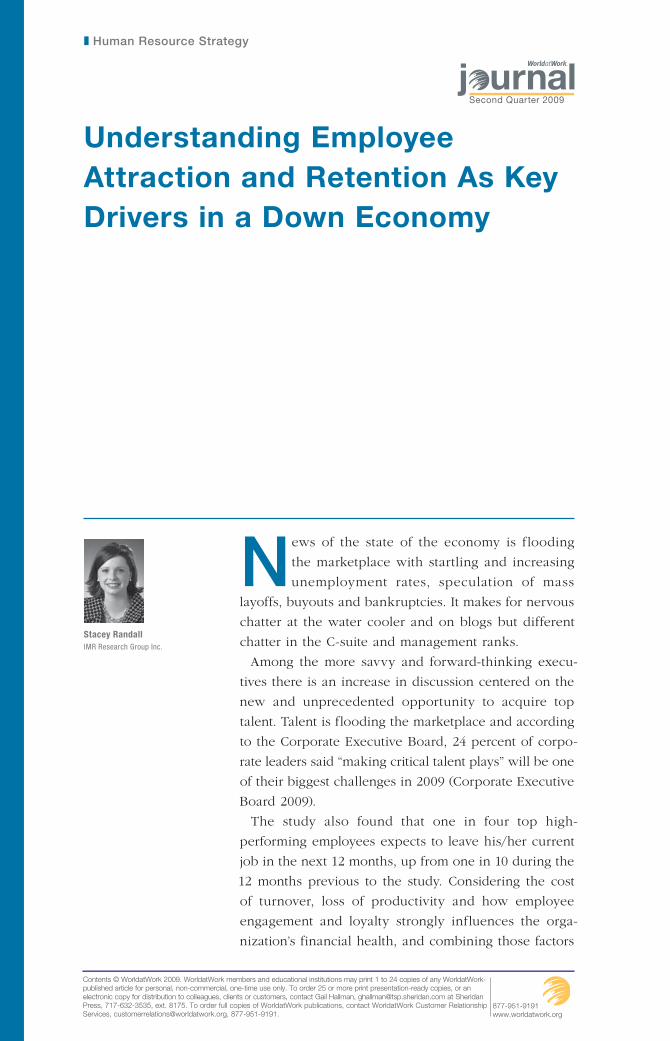
N ews of the state of the economy is flooding
the marketplace with startling and increasing
unemployment rates, speculation of mass
layoffs, buyouts and bankruptcies. It makes for nervous
chatter at the water cooler and on blogs but different
chatter in the C-suite and management ranks.
Among the more savvy and forward-thinking execu-
tives there is an increase in discussion centered on the
new and unprecedented opportunity to acquire top
talent. Talent is flooding the marketplace and according
to the Corporate Executive Board, 24 percent of corpo-
rate leaders said “making critical talent plays” will be one
of their biggest challenges in 2009 (Corporate Executive
Board 2009).
The study also found that one in four top high-
performing employees expects to leave his/her current
job in the next 12 months, up from one in 10 during the
12 months previous to the study. Considering the cost
of turnover, loss of productivity and how employee
engagement and loyalty strongly influences the orga-
nization’s financial health, and combining those factors
Understanding Employee
Attraction and Retention As Key
Drivers in a Down Economy
Stacey Randall
IMR Research Group Inc.
❚ Human Resource Strategy
877-951-9191www.worldatwork.org
Contents © WorldatWork 2009. WorldatWork members and educational institutions may print 1 to 24 copies of any WorldatWork-published article for personal, non-commercial, one-time use only. To order 25 or more print presentation-ready copies, or an electronic copy for distribution to colleagues, clients or customers, contact Gail Hallman, [email protected] at Sheridan Press, 717-632-3535, ext. 8175. To order full copies of WorldatWork publications, contact WorldatWork Customer Relationship Services, [email protected], 877-951-9191.
Second Quarter 2009
41 Second Quarter | 2009
with the need for an organization to be able to emerge stronger from this economic
downturn, understanding employee motivation becomes critical.
The economic recession is uncovering a unique opportunity to garner top talent
and is placing retention efforts at the forefront of forward-thinking management
discussions. Management, including total rewards professionals, must be careful to
avoid the thought that the recession “will finally make those employees feel lucky
to have a job and remove their sense of entitlement.” Assuming the employees
will “fall in line” is a dangerous and slippery slope managers and/or leaders can
easily find themselves sliding down, with negative consequences. An organization
or its management with this attitude, may find that the best employees are biding
their time until the economy improves and they exit the organization. According
to a 2008 Leadership IQ study, 47 percent of top performers are actively looking
for a job, but only 18 percent of low performers are.
Based on a survey by IMR Research Group Inc. (2008) of more than 1,900
full-time employees in the United States, the key to understanding employee
motivation lies in an analysis of both what employees say is important in the
workplace as well as what drives employee loyalty. IMR Research Group uses
multitiered assessment of employee loyalty through a model called the Employee
Motivator Matrix (EMM).
UNDERSTANDING THE MODEL
Looking at what employees say is important as well as determining the factors
that actually drive loyalty gives organizations a focused, yet big-picture view of
employee motivation and engagement. In the IMR survey, employees were asked
to rate the importance of the 44 workplace attributes, ranging from “a high degree
of trust between management and employees” to “creativity and independent
thinking is valued” to “a relaxed work environment.” The rating of each workplace
attribute combined with how strongly it influences loyalty to an organization
(based on statistical analysis) determines where on the EMM the attributes fall.
While the information is used by the authors’ company for its EMM tool, the ratings
provide solid input for organizational evaluation of loyalty.
Figure 1 on page 42 provides two dimensions. “Stated importance” (the bottom
axis) reflects what employees explicitly indicate is important to them when rating
the workplace attributes (i.e., articulated, on-the-surface motivators). “‘Derived
importance” or unarticulated importance (the left axis) is determined using
statistical analysis, obtained by computing the degree of correlation between
the attributes with the “likelihood of recommending the company to others as a
good place to work” — an attribute that the authors consider the best measure
of loyalty. Attributes in each quadrant are important to understand, but focusing
resources on the workplace attributes in the top right quadrant, which are high
in “stated” importance as well as strongly correlated with loyalty, will effectively
increase loyalty and reduce turnover.
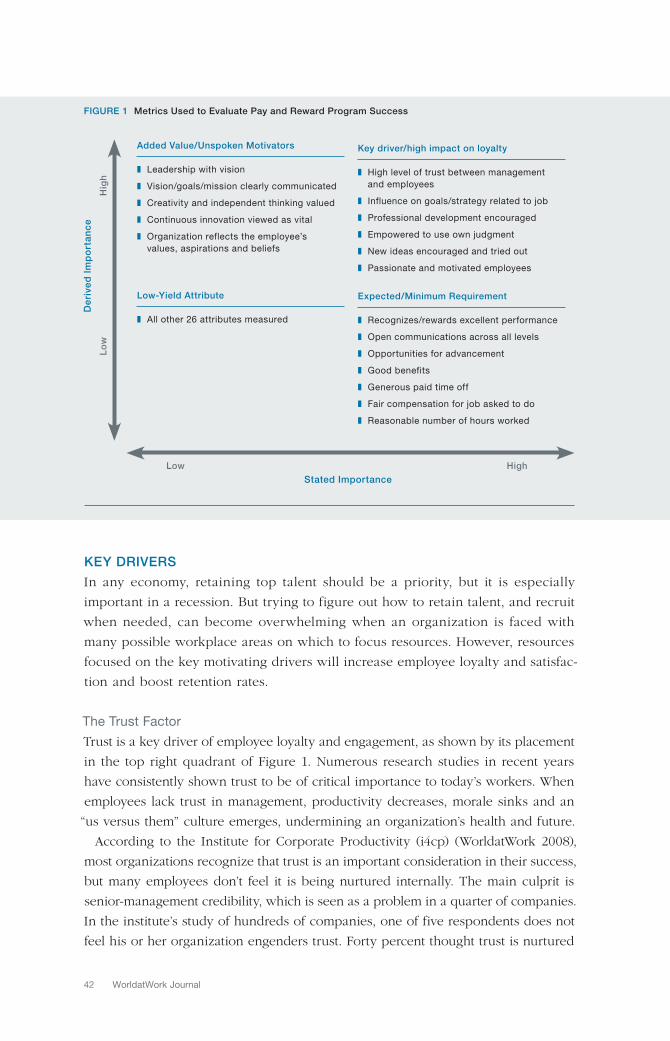
42 WorldatWork Journal
KEY DRIVERS
In any economy, retaining top talent should be a priority, but it is especially
important in a recession. But trying to figure out how to retain talent, and recruit
when needed, can become overwhelming when an organization is faced with
many possible workplace areas on which to focus resources. However, resources
focused on the key motivating drivers will increase employee loyalty and satisfac-
tion and boost retention rates.
The Trust Factor
Trust is a key driver of employee loyalty and engagement, as shown by its placement
in the top right quadrant of Figure 1. Numerous research studies in recent years
have consistently shown trust to be of critical importance to today’s workers. When
employees lack trust in management, productivity decreases, morale sinks and an
“us versus them” culture emerges, undermining an organization’s health and future.
According to the Institute for Corporate Productivity (i4cp) (WorldatWork 2008),
most organizations recognize that trust is an important consideration in their success,
but many employees don’t feel it is being nurtured internally. The main culprit is
senior-management credibility, which is seen as a problem in a quarter of companies.
In the institute’s study of hundreds of companies, one of five respondents does not
feel his or her organization engenders trust. Forty percent thought trust is nurtured
FIGURE 1 Metrics Used to Evaluate Pay and Reward Program Success
Added Value/Unspoken Motivators
❚ Leadership with vision
❚ Vision/goals/mission clearly communicated
❚ Creativity and independent thinking valued
❚ Continuous innovation viewed as vital
❚ Organization reflects the employee’s
values, aspirations and beliefs
Lo
w
Hig
h
Low-Yield Attribute
❚ All other 26 attributes measured
Key driver/high impact on loyalty
❚ High level of trust between management
and employees
❚ Influence on goals/strategy related to job
❚ Professional development encouraged
❚ Empowered to use own judgment
❚ New ideas encouraged and tried out
❚ Passionate and motivated employees
Expected/Minimum Requirement
❚ Recognizes/rewards excellent performance
❚ Open communications across all levels
❚ Opportunities for advancement
❚ Good benefits
❚ Generous paid time off
❚ Fair compensation for job asked to do
❚ Reasonable number of hours worked
Low High
Stated Importance
De
rive
d I
mp
ort
an
ce
43 Second Quarter | 2009
only to a moderate extent. When segmented between low- and high-performing
companies, the difference is starker: Forty percent of low-performing companies
feel their organizations do not nurture trust, while only 16 percent of respondents
from high-performing companies feel the same.
A solid strategy to increase trust, and reduce time wasted, rests in providing an open
and transparent working environment that strengthens the organization, as employees
spend less time engaging in distracting chatter and more time in productive work.
Other Key Drivers
Employees also indicate that they need to influence goals and strategy; feel
empowered to use their own judgment; and find that new ideas are encour-
aged. One way to know if the organization’s employees feel empowered and
influence their work is how they express opinions of their work. For example,
do they use the word “own” or portray ownership in referencing their projects
and responsibilities? Employee opinion surveys are also significant in this area.
Another key driver is offering professional development, and organizations
making professional development a high priority and an ongoing endeavor will
capitalize on strengthening employee loyalty.
Addressing the key motivation drivers will result in more motivated employees.
IMR’s research indicates that — in this economy — focus is renewed on working
with passionate and motivated employees, as this affects the day-to-day life within
an organization and directly influences the happiness and focus of employees. It has
become imperative for organizations to keep an eye on the morale of their workforce
and work to keep it positive through effective communication about the state of the
organization, the industry and the employee’s role in the organization.
Unspoken Motivators
The key drivers previously discussed are articulated by employees as important.
Equally insightful are the unarticulated or unspoken attributes (Figure 1: top left
quadrant). These attributes are unique in that they can provide employers with
an opportunity to delight recruits and employees and further the organization’s
competitive positioning for the best talent.
Two of the top five unspoken motivators relate to creativity and innovation.
America’s economic future may rest on the ability to innovate, and if workers under-
stand how brainstorming and other creative-thinking sessions can contribute to
the organization’s bottom line, they will feel their input is valued. Other unspoken
motivators relate to the organization itself and its leadership. Employees desire
to work for a leader with vision and an organization reflecting their (employees’)
values, aspirations and beliefs. These unspoken motivators have a low-stated
importance according to employees but a high-derived importance, which means
they don’t stand out as critically important in the employee’s mind, but efforts to
improve these will greatly affect attraction and retention.
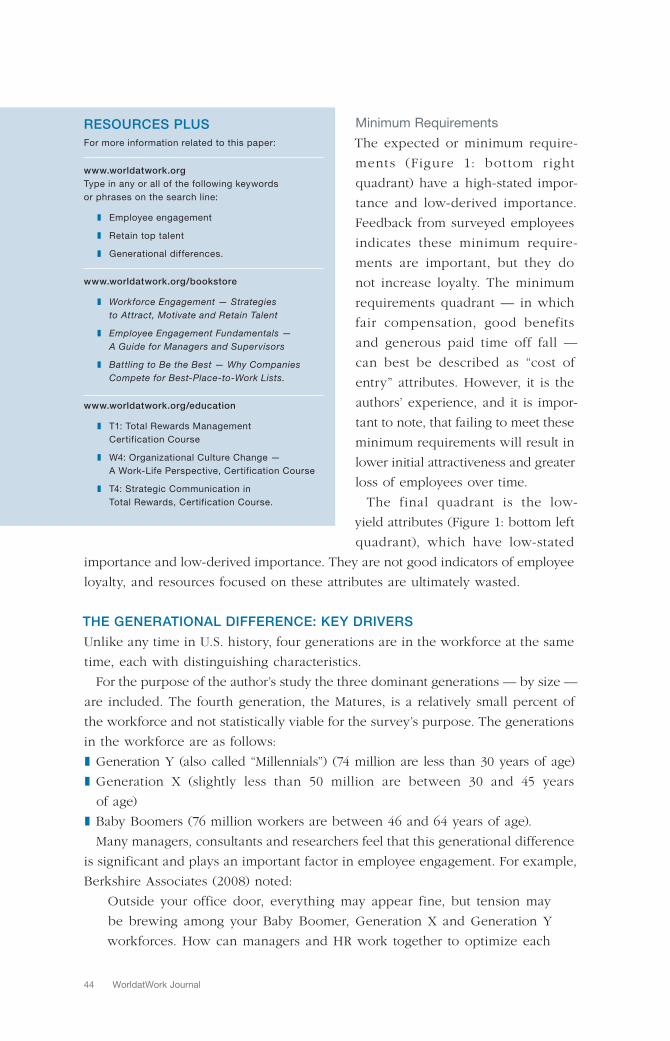
44 WorldatWork Journal
Minimum Requirements
The expected or minimum require-
ments (Figure 1: bot tom r ight
quadrant) have a high-stated impor-
tance and low-derived importance.
Feedback from surveyed employees
indicates these minimum require-
ments are important, but they do
not increase loyalty. The minimum
requirements quadrant — in which
fair compensation, good benefits
and generous paid time off fall —
can best be described as “cost of
entry” attributes. However, it is the
authors’ experience, and it is impor-
tant to note, that failing to meet these
minimum requirements will result in
lower initial attractiveness and greater
loss of employees over time.
The final quadrant is the low-
yield attributes (Figure 1: bottom left
quadrant), which have low-stated
importance and low-derived importance. They are not good indicators of employee
loyalty, and resources focused on these attributes are ultimately wasted.
THE GENERATIONAL DIFFERENCE: KEY DRIVERS
Unlike any time in U.S. history, four generations are in the workforce at the same
time, each with distinguishing characteristics.
For the purpose of the author’s study the three dominant generations — by size —
are included. The fourth generation, the Matures, is a relatively small percent of
the workforce and not statistically viable for the survey’s purpose. The generations
in the workforce are as follows:
Generation Y (also called “Millennials”) (74 million are less than 30 years of age) ❚
Generation X (slightly less than 50 million are between 30 and 45 years ❚
of age)
Baby Boomers (76 million workers are between 46 and 64 years of age). ❚
Many managers, consultants and researchers feel that this generational difference
is significant and plays an important factor in employee engagement. For example,
Berkshire Associates (2008) noted:
Outside your office door, everything may appear fine, but tension may
be brewing among your Baby Boomer, Generation X and Generation Y
workforces. How can managers and HR work together to optimize each
RESOURCES PLUS
For more information related to this paper:
www.worldatwork.org
Type in any or all of the following keywords
or phrases on the search line:
❚ Employee engagement
❚ Retain top talent
❚ Generational differences.
www.worldatwork.org/bookstore
❚ Workforce Engagement — Strategies
to Attract, Motivate and Retain Talent
❚ Employee Engagement Fundamentals —
A Guide for Managers and Supervisors
❚ Battling to Be the Best — Why Companies
Compete for Best-Place-to-Work Lists.
www.worldatwork.org/education
❚ T1: Total Rewards Management
Certification Course
❚ W4: Organizational Culture Change —
A Work-Life Perspective, Certification Course
❚ T4: Strategic Communication in
Total Rewards, Certification Course.
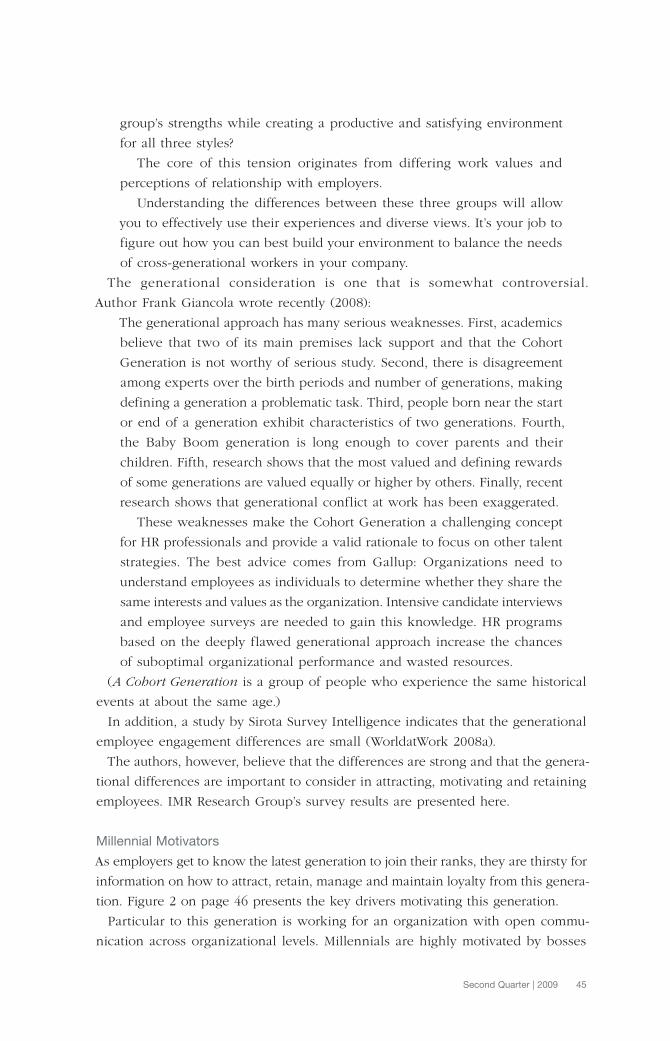
45 Second Quarter | 2009
group’s strengths while creating a productive and satisfying environment
for all three styles?
The core of this tension originates from differing work values and
perceptions of relationship with employers.
Understanding the differences between these three groups will allow
you to effectively use their experiences and diverse views. It’s your job to
figure out how you can best build your environment to balance the needs
of cross-generational workers in your company.
The generational consideration is one that is somewhat controversial.
Author Frank Giancola wrote recently (2008):
The generational approach has many serious weaknesses. First, academics
believe that two of its main premises lack support and that the Cohort
Generation is not worthy of serious study. Second, there is disagreement
among experts over the birth periods and number of generations, making
defining a generation a problematic task. Third, people born near the start
or end of a generation exhibit characteristics of two generations. Fourth,
the Baby Boom generation is long enough to cover parents and their
children. Fifth, research shows that the most valued and defining rewards
of some generations are valued equally or higher by others. Finally, recent
research shows that generational conflict at work has been exaggerated.
These weaknesses make the Cohort Generation a challenging concept
for HR professionals and provide a valid rationale to focus on other talent
strategies. The best advice comes from Gallup: Organizations need to
understand employees as individuals to determine whether they share the
same interests and values as the organization. Intensive candidate interviews
and employee surveys are needed to gain this knowledge. HR programs
based on the deeply flawed generational approach increase the chances
of suboptimal organizational performance and wasted resources.
(A Cohort Generation is a group of people who experience the same historical
events at about the same age.)
In addition, a study by Sirota Survey Intelligence indicates that the generational
employee engagement differences are small (WorldatWork 2008a).
The authors, however, believe that the differences are strong and that the genera-
tional differences are important to consider in attracting, motivating and retaining
employees. IMR Research Group’s survey results are presented here.
Millennial Motivators
As employers get to know the latest generation to join their ranks, they are thirsty for
information on how to attract, retain, manage and maintain loyalty from this genera-
tion. Figure 2 on page 46 presents the key drivers motivating this generation.
Particular to this generation is working for an organization with open commu-
nication across organizational levels. Millennials are highly motivated by bosses
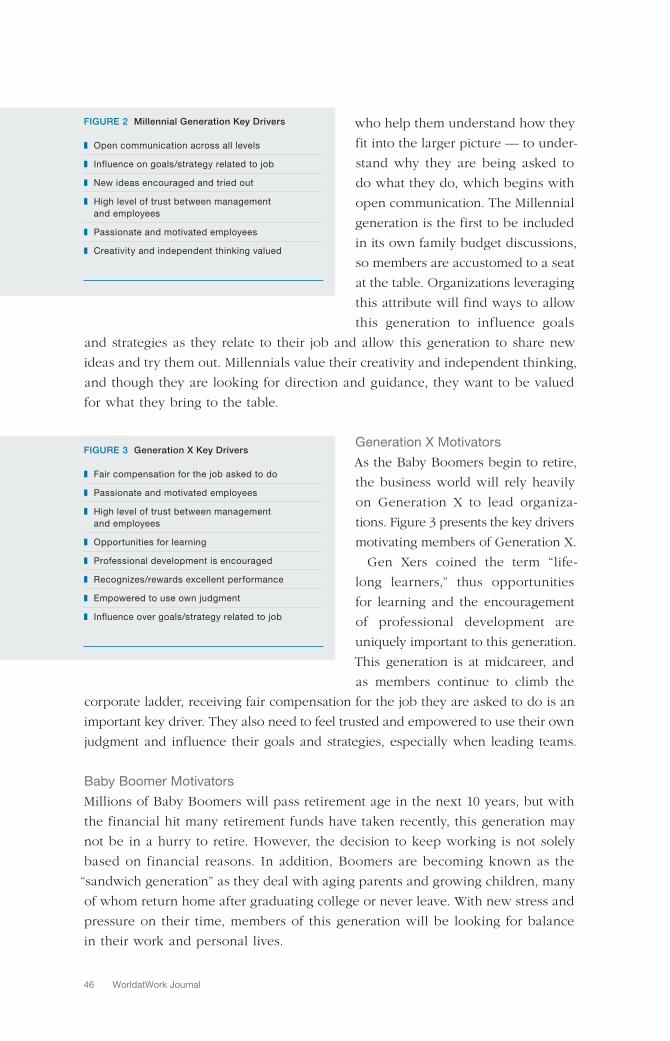
46 WorldatWork Journal
who help them understand how they
fit into the larger picture — to under-
stand why they are being asked to
do what they do, which begins with
open communication. The Millennial
generation is the first to be included
in its own family budget discussions,
so members are accustomed to a seat
at the table. Organizations leveraging
this attribute will find ways to allow
this generation to influence goals
and strategies as they relate to their job and allow this generation to share new
ideas and try them out. Millennials value their creativity and independent thinking,
and though they are looking for direction and guidance, they want to be valued
for what they bring to the table.
Generation X Motivators
As the Baby Boomers begin to retire,
the business world will rely heavily
on Generation X to lead organiza-
tions. Figure 3 presents the key drivers
motivating members of Generation X.
Gen Xers coined the term “life-
long learners,” thus opportunities
for learning and the encouragement
of professional development are
uniquely important to this generation.
This generation is at midcareer, and
as members continue to climb the
corporate ladder, receiving fair compensation for the job they are asked to do is an
important key driver. They also need to feel trusted and empowered to use their own
judgment and influence their goals and strategies, especially when leading teams.
Baby Boomer Motivators
Millions of Baby Boomers will pass retirement age in the next 10 years, but with
the financial hit many retirement funds have taken recently, this generation may
not be in a hurry to retire. However, the decision to keep working is not solely
based on financial reasons. In addition, Boomers are becoming known as the
“sandwich generation” as they deal with aging parents and growing children, many
of whom return home after graduating college or never leave. With new stress and
pressure on their time, members of this generation will be looking for balance
in their work and personal lives.
FIGURE 3 Generation X Key Drivers
❚ Fair compensation for the job asked to do
❚ Passionate and motivated employees
❚ High level of trust between management
and employees
❚ Opportunities for learning
❚ Professional development is encouraged
❚ Recognizes/rewards excellent performance
❚ Empowered to use own judgment
❚ Influence over goals/strategy related to job
FIGURE 2 Millennial Generation Key Drivers
❚ Open communication across all levels
❚ Influence on goals/strategy related to job
❚ New ideas encouraged and tried out
❚ High level of trust between management
and employees
❚ Passionate and motivated employees
❚ Creativity and independent thinking valued
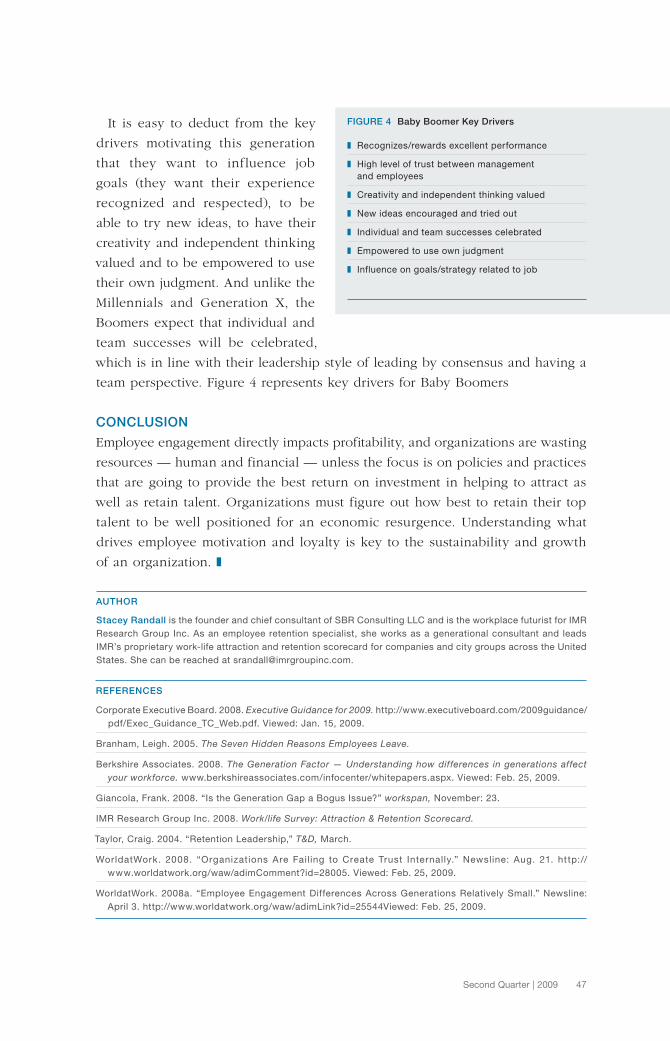
47 Second Quarter | 2009
It is easy to deduct from the key
drivers motivating this generation
that they want to influence job
goals (they want their experience
recognized and respected), to be
able to try new ideas, to have their
creativity and independent thinking
valued and to be empowered to use
their own judgment. And unlike the
Millennials and Generation X, the
Boomers expect that individual and
team successes will be celebrated,
which is in line with their leadership style of leading by consensus and having a
team perspective. Figure 4 represents key drivers for Baby Boomers
CONCLUSION
Employee engagement directly impacts profitability, and organizations are wasting
resources — human and financial — unless the focus is on policies and practices
that are going to provide the best return on investment in helping to attract as
well as retain talent. Organizations must figure out how best to retain their top
talent to be well positioned for an economic resurgence. Understanding what
drives employee motivation and loyalty is key to the sustainability and growth
of an organization. ❚
FIGURE 4 Baby Boomer Key Drivers
❚ Recognizes/rewards excellent performance
❚ High level of trust between management
and employees
❚ Creativity and independent thinking valued
❚ New ideas encouraged and tried out
❚ Individual and team successes celebrated
❚ Empowered to use own judgment
❚ Influence on goals/strategy related to job
Corporate Executive Board. 2008. Executive Guidance for 2009. http://www.executiveboard.com/2009guidance/
pdf/Exec_Guidance_TC_Web.pdf. Viewed: Jan. 15, 2009.
Branham, Leigh. 2005. The Seven Hidden Reasons Employees Leave.
Berkshire Associates. 2008. The Generation Factor — Understanding how differences in generations affect
your workforce. www.berkshireassociates.com/infocenter/whitepapers.aspx. Viewed: Feb. 25, 2009.
Giancola, Frank. 2008. “Is the Generation Gap a Bogus Issue?” workspan, November: 23.
IMR Research Group Inc. 2008. Work/life Survey: Attraction & Retention Scorecard.
Taylor, Craig. 2004. “Retention Leadership,” T&D, March.
WorldatWork. 2008. “Organizations Are Failing to Create Trust Internally.” Newsline: Aug. 21. http://
www.worldatwork.org/waw/adimComment?id=28005. Viewed: Feb. 25, 2009.
WorldatWork. 2008a. “Employee Engagement Differences Across Generations Relatively Small.” Newsline:
April 3. http://www.worldatwork.org/waw/adimLink?id=25544Viewed: Feb. 25, 2009.
REFERENCES
AUTHOR
Stacey Randall is the founder and chief consultant of SBR Consulting LLC and is the workplace futurist for IMR
Research Group Inc. As an employee retention specialist, she works as a generational consultant and leads
IMR’s proprietary work-life attraction and retention scorecard for companies and city groups across the United
States. She can be reached at [email protected].
It is difficult to keep productivity levels up when faced
with high levels of employee turnover. However, it
is generally the feeling that these levels of turnover
are a necessary cost of doing business in high-growth
countries. Historically, turnover has been perceived to be
mainly a pay issue, as market levels increase much faster
than inflation, thus making it hard to keep up with the pay
increases offered by some competitors. Therefore, most
answers to this problem typically, yet incompletely in the
author’s view, have had pay solutions at their core.
That had certainly been Freescale Semiconductor’s expe-
rience to date in India, where the company has two design
centers with a combined population of close to 1,600.
The company’s turnover rate in India in 2007 exceeded
its historical range. Turnover was highest in some segments
of the individual contributor (IC) population. Thus, when
looking at ways to lower the turnover rates in India,
attention was focused on the entry-level professionals
(IC-1),and the next two levels above (IC-2 and IC-3).
In the past, the company tried a variety of market-
driven, pay-related solutions. In other words, in keeping
with the company market-positioning philosophy, the
company followed what others did in terms of increases
and retention packages. Midpoints to a carefully derived
market sample were painstakingly pegged out, and
Using an Analytical Approach
to Increase Retention in
High-Growth Countries:
An Example in India
Fermin A. Diez, CCP, SPHR
Mercer
❚ Human Resource Strategy
877-951-9191www.worldatwork.org
Contents © WorldatWork 2009. WorldatWork members and educational institutions may print 1 to 24 copies of any WorldatWork-published article for personal, non-commercial, one-time use only. To order 25 or more print presentation-ready copies, or an electronic copy for distribution to colleagues, clients or customers, contact Gail Hallman, [email protected] at Sheridan Press, 717-632-3535, ext. 8175. To order full copies of WorldatWork publications, contact WorldatWork Customer Relationship Services, [email protected], 877-951-9191.
Second Quarter 2009
49 Second Quarter | 2009
Freescale followed closely the advice of consultants in terms of expected market
salary movements. Competitors were benchmarked in terms of retention packages
and deferred cash was given, equivalent to a substantial portion of annual base,
to those employees who stayed with the company for three years. Turnover rates
were in line with other companies in the industry.
Yet benchmarking just to keep up with the market was not the answer; the
company wanted to be below others in its turnover, or more precisely, Freescale
wanted to be above others in its labor productivity. Being as good as the competi-
tion was not acceptable. For the HR team to “walk the talk” and be a true business
partner, it needed to add value and differentiate Freescale from its competitors. HR
needed to do something, not just different but also better, than the competitors
to achieve this objective.
Using a comprehensive approach, the company analyzed its practices around
recruiting, pay and development, which management thought could potentially
impact turnover rates.
From the beginning, it was established that a level of zero turnover was not
only unattainable, but perhaps unhealthy. Freescale operates on a forced curve
performance management philosophy, and it wanted turnover to be roughly in
line with the expected percentage of lowest performers. Thus it embarked on a
quest to not only reduce turnover in India by 25 percent, but also reduce turnover
at the highest levels of performance to as close to zero as possible.
As a starting point, the company carried out an in-depth analysis of turnover
and retention at the India Design Centers (IDC). In doing so, these principles
were followed:
Support business strategy: It was necessary to ensure current and proposed HR ❚
practices supported IDC’s strategy by improving productivity due to increased
retention. It is difficult, by its nature of being a design center, to precisely
measure productivity at IDC. Management decided to use a proxy whereby the
number of resources allocated to each successful project was measured, as was
whether the project was delivered on time. In those projects where the team
experienced a minimum of turnover during the three- to six-month period a
project usually takes, the likelihood of timely success was greater. Admittedly,
this is a crude measure, but one that the entire IDC leadership team could relate
to and agree with.
Understand turnover drivers: It was critical to understand what was driving ❚
unwanted turnover in the organization. From the beginning, HR went beyond
the pay-related hypothesis and considered many of the reasons for turnover
that management passed along or learned from exit interviews. The focus of
analysis started here, and these anecdotal data were either discarded or turned
into theories through this process.
Be data-driven: To diagnose retention issues, HR analyzed detailed 2007 data ❚
from the Noida and Bangalore operations. Specifically, HR wanted to ensure that
50 WorldatWork Journal
the debate was focused on data rather than opinions. For example, a belief held
by a portion of the management team was that turnover among female employees
was higher than among male employees, while others believed the opposite.
Another typical example was the debate on whether employees from tier one
educational institutions had a higher probability of success. HR sought to end
the “my-opinion-is-better-than-yours” discussions by bringing in unequivocal data.
Use a systems view: HR analyzed a variety of factors affecting retention to ❚
determine the best, most sustainable, solutions. Specifically, the linkages among
human-resources policies were sought. This investigation asked:
Does the pay system support career-development plans? -
Are entry-level salaries tied to turnover results? -
Are recruiting profiles adequately linked to work-life balance findings? -
By examining these links HR wanted to find the keys necessary to achieve its
goals of doing things differently and better.
Measure impact: Employee opinion survey results were not by themselves adequate. ❚
The company felt the need to measure and track retention impact at the manager
level, and to hold the managers — not just human resources — accountable.
TURNOVER DRIVERS
HR examined a comprehensive list of known and potential drivers of turnover
according to the results of interviews with managers as well as with HR staff.
The results of exit interviews, which had been routinely carried out to date,
were also included. This first level of analysis yielded three categories of drivers:
external drivers, organizational drivers and individual drivers. The breakdown of
each of the drivers follows.
External drivers: ❚
Pay levels -
Competition -
Overseas opportunities. -
Organizational drivers: ❚
Job profiles -
Involuntary resignations -
Performance ratings -
Dissatisfaction with manager -
Promotion opportunities. -
Individual drivers: ❚
Higher education -
Relocation -
Low performance -
Educational institution -
Tenure -
Gender. -
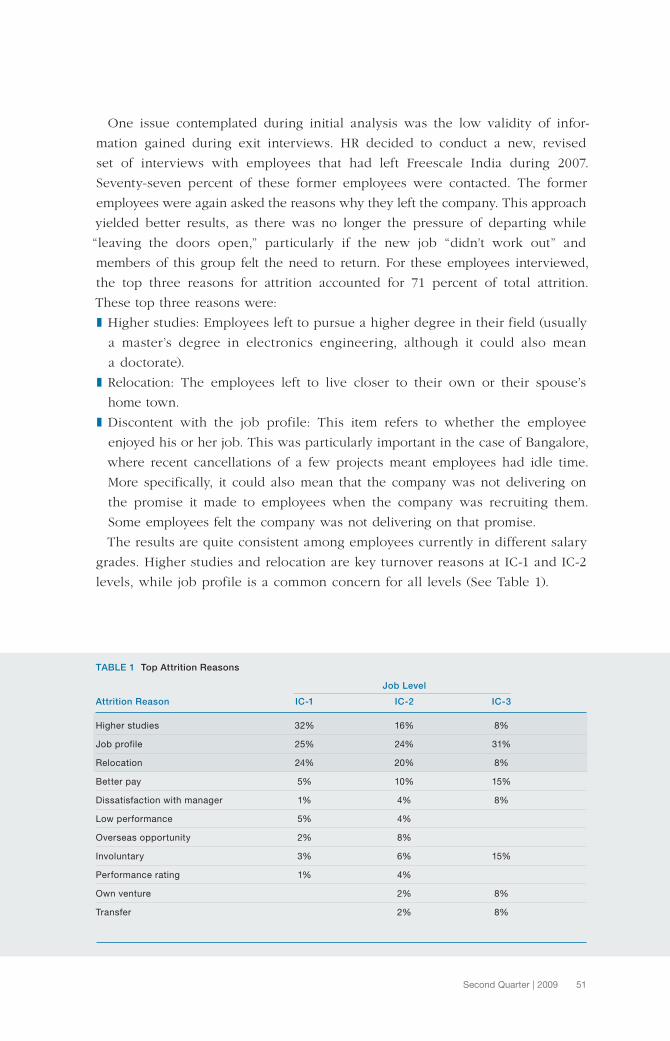
51 Second Quarter | 2009
One issue contemplated during initial analysis was the low validity of infor-
mation gained during exit interviews. HR decided to conduct a new, revised
set of interviews with employees that had left Freescale India during 2007.
Seventy-seven percent of these former employees were contacted. The former
employees were again asked the reasons why they left the company. This approach
yielded better results, as there was no longer the pressure of departing while
“leaving the doors open,” particularly if the new job “didn’t work out” and
members of this group felt the need to return. For these employees interviewed,
the top three reasons for attrition accounted for 71 percent of total attrition.
These top three reasons were:
Higher studies: Employees left to pursue a higher degree in their field (usually ❚
a master’s degree in electronics engineering, although it could also mean
a doctorate).
Relocation: The employees left to live closer to their own or their spouse’s ❚
home town.
Discontent with the job profile: This item refers to whether the employee ❚
enjoyed his or her job. This was particularly important in the case of Bangalore,
where recent cancellations of a few projects meant employees had idle time.
More specifically, it could also mean that the company was not delivering on
the promise it made to employees when the company was recruiting them.
Some employees felt the company was not delivering on that promise.
The results are quite consistent among employees currently in different salary
grades. Higher studies and relocation are key turnover reasons at IC-1 and IC-2
levels, while job profile is a common concern for all levels (See Table 1).
TABLE 1 Top Attrition Reasons
Job Level
Attrition Reason IC-1 IC-2 IC-3
Higher studies 32% 16% 8%
Job profile 25% 24% 31%
Relocation 24% 20% 8%
Better pay 5% 10% 15%
Dissatisfaction with manager 1% 4% 8%
Low performance 5% 4%
Overseas opportunity 2% 8%
Involuntary 3% 6% 15%
Performance rating 1% 4%
Own venture 2% 8%
Transfer 2% 8%
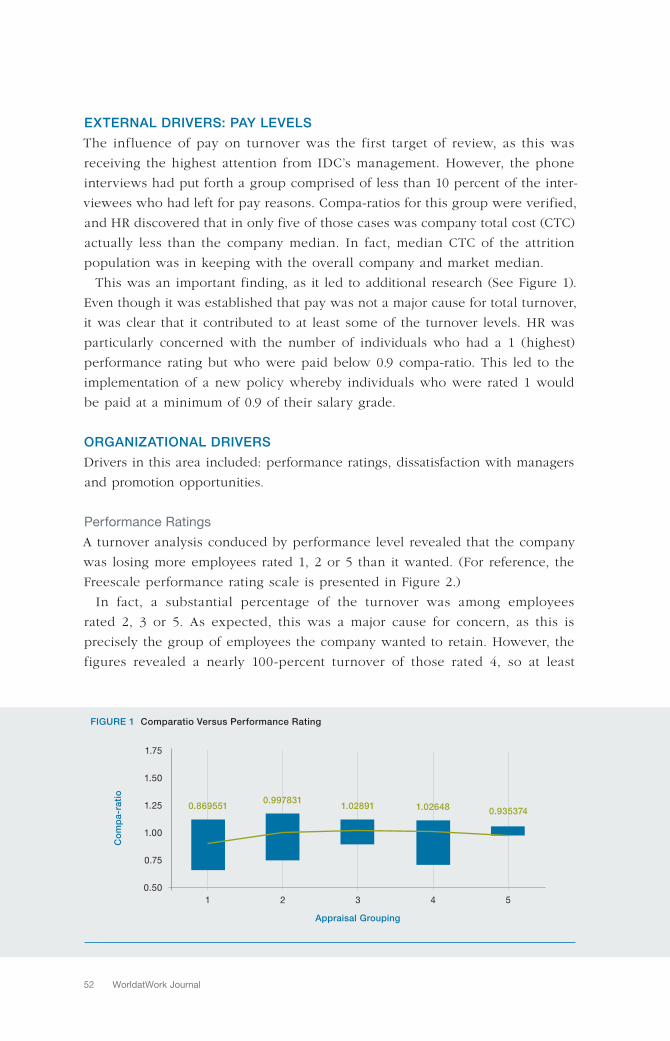
52 WorldatWork Journal
EXTERNAL DRIVERS: PAY LEVELS
The influence of pay on turnover was the first target of review, as this was
receiving the highest attention from IDC’s management. However, the phone
interviews had put forth a group comprised of less than 10 percent of the inter-
viewees who had left for pay reasons. Compa-ratios for this group were verified,
and HR discovered that in only five of those cases was company total cost (CTC)
actually less than the company median. In fact, median CTC of the attrition
population was in keeping with the overall company and market median.
This was an important finding, as it led to additional research (See Figure 1).
Even though it was established that pay was not a major cause for total turnover,
it was clear that it contributed to at least some of the turnover levels. HR was
particularly concerned with the number of individuals who had a 1 (highest)
performance rating but who were paid below 0.9 compa-ratio. This led to the
implementation of a new policy whereby individuals who were rated 1 would
be paid at a minimum of 0.9 of their salary grade.
ORGANIZATIONAL DRIVERS
Drivers in this area included: performance ratings, dissatisfaction with managers
and promotion opportunities.
Performance Ratings
A turnover analysis conduced by performance level revealed that the company
was losing more employees rated 1, 2 or 5 than it wanted. (For reference, the
Freescale performance rating scale is presented in Figure 2.)
In fact, a substantial percentage of the turnover was among employees
rated 2, 3 or 5. As expected, this was a major cause for concern, as this is
precisely the group of employees the company wanted to retain. However, the
figures revealed a nearly 100-percent turnover of those rated 4, so at least
FIGURE 1 Comparatio Versus Performance Rating
1.75
1.50
1.25
1.00
0.75
0.50
1 2 3 4 5
Co
mp
a-r
ati
o
0.8695510.997831
1.02891 1.02648 0.935374
Appraisal Grouping
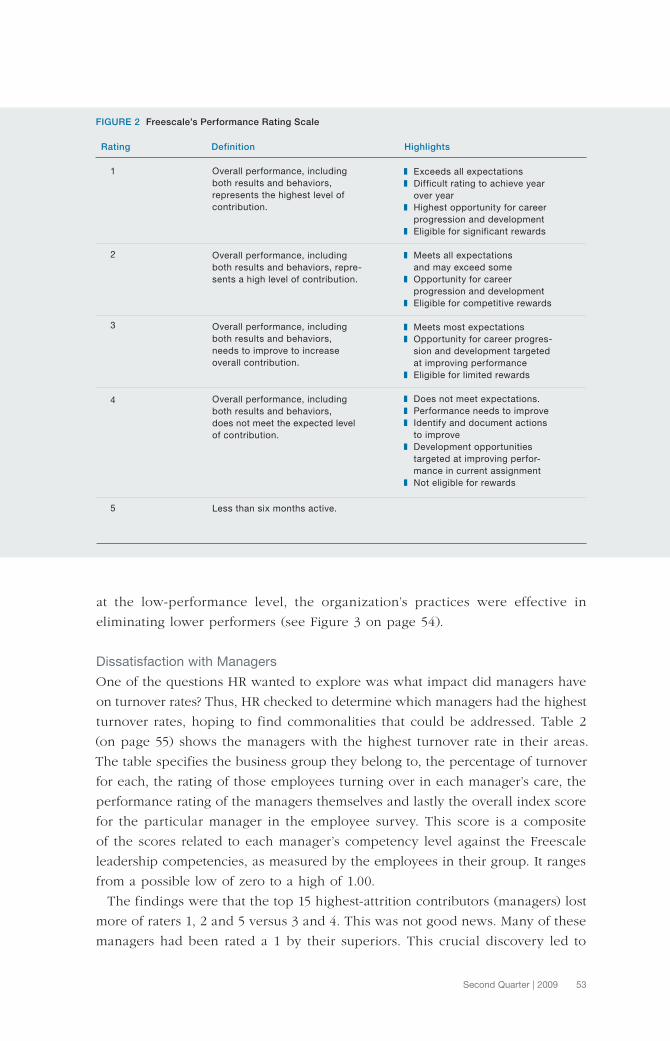
53 Second Quarter | 2009
at the low-performance level, the organization’s practices were effective in
eliminating lower performers (see Figure 3 on page 54).
Dissatisfaction with Managers
One of the questions HR wanted to explore was what impact did managers have
on turnover rates? Thus, HR checked to determine which managers had the highest
turnover rates, hoping to find commonalities that could be addressed. Table 2
(on page 55) shows the managers with the highest turnover rate in their areas.
The table specifies the business group they belong to, the percentage of turnover
for each, the rating of those employees turning over in each manager’s care, the
performance rating of the managers themselves and lastly the overall index score
for the particular manager in the employee survey. This score is a composite
of the scores related to each manager’s competency level against the Freescale
leadership competencies, as measured by the employees in their group. It ranges
from a possible low of zero to a high of 1.00.
The findings were that the top 15 highest-attrition contributors (managers) lost
more of raters 1, 2 and 5 versus 3 and 4. This was not good news. Many of these
managers had been rated a 1 by their superiors. This crucial discovery led to
FIGURE 2 Freescale’s Performance Rating Scale
Rating Definition Highlights
1
2
3
4
5
Overall performance, including
both results and behaviors,
represents the highest level of
contribution.
Overall performance, including
both results and behaviors, repre-
sents a high level of contribution.
Overall performance, including
both results and behaviors,
needs to improve to increase
overall contribution.
Overall performance, including
both results and behaviors,
does not meet the expected level
of contribution.
Less than six months active.
❚ Exceeds all expectations
❚ Difficult rating to achieve year
over year
❚ Highest opportunity for career
progression and development
❚ Eligible for significant rewards
❚ Meets all expectations
and may exceed some
❚ Opportunity for career
progression and development
❚ Eligible for competitive rewards
❚ Meets most expectations
❚ Opportunity for career progres-
sion and development targeted
at improving performance
❚ Eligible for limited rewards
❚ Does not meet expectations.
❚ Performance needs to improve
❚ Identify and document actions
to improve
❚ Development opportunities
targeted at improving perfor-
mance in current assignment
❚ Not eligible for rewards
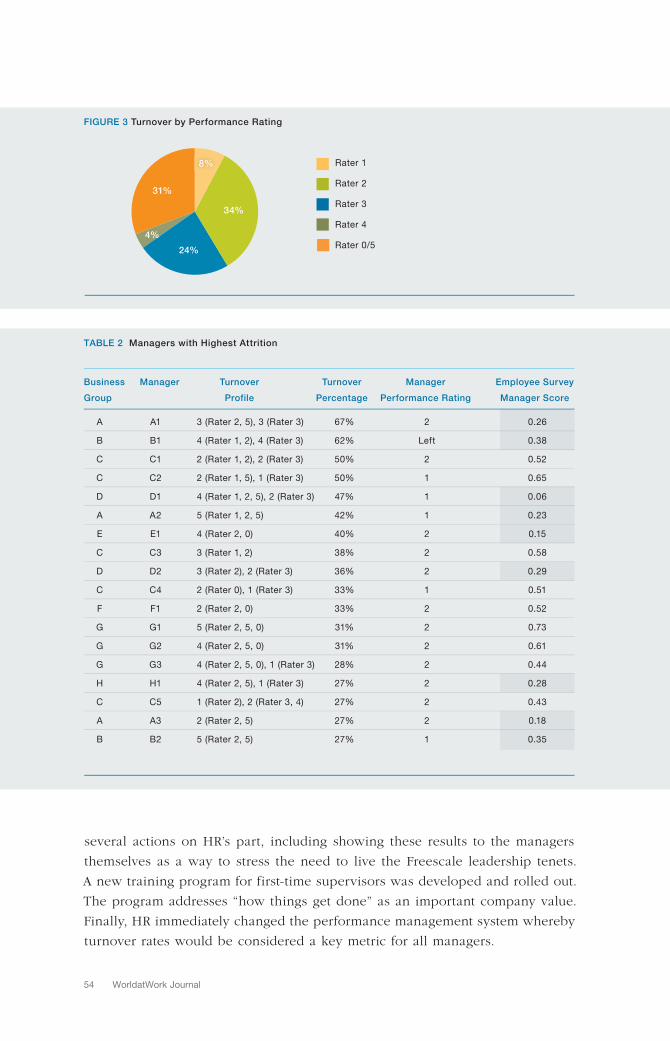
54 WorldatWork Journal
several actions on HR’s part, including showing these results to the managers
themselves as a way to stress the need to live the Freescale leadership tenets.
A new training program for first-time supervisors was developed and rolled out.
The program addresses “how things get done” as an important company value.
Finally, HR immediately changed the performance management system whereby
turnover rates would be considered a key metric for all managers.
FIGURE 3 Turnover by Performance Rating
Rater 1
Rater 2
Rater 3
Rater 4
Rater 0/5
34%
4%
8%
24%
31%
TABLE 2 Managers with Highest Attrition
Business Manager Turnover Turnover Manager Employee Survey
Group Profile Percentage Performance Rating Manager Score
A A1 3 (Rater 2, 5), 3 (Rater 3) 67% 2 0.26
B B1 4 (Rater 1, 2), 4 (Rater 3) 62% Left 0.38
C C1 2 (Rater 1, 2), 2 (Rater 3) 50% 2 0.52
C C2 2 (Rater 1, 5), 1 (Rater 3) 50% 1 0.65
D D1 4 (Rater 1, 2, 5), 2 (Rater 3) 47% 1 0.06
A A2 5 (Rater 1, 2, 5) 42% 1 0.23
E E1 4 (Rater 2, 0) 40% 2 0.15
C C3 3 (Rater 1, 2) 38% 2 0.58
D D2 3 (Rater 2), 2 (Rater 3) 36% 2 0.29
C C4 2 (Rater 0), 1 (Rater 3) 33% 1 0.51
F F1 2 (Rater 2, 0) 33% 2 0.52
G G1 5 (Rater 2, 5, 0) 31% 2 0.73
G G2 4 (Rater 2, 5, 0) 31% 2 0.61
G G3 4 (Rater 2, 5, 0), 1 (Rater 3) 28% 2 0.44
H H1 4 (Rater 2, 5), 1 (Rater 3) 27% 2 0.28
C C5 1 (Rater 2), 2 (Rater 3, 4) 27% 2 0.43
A A3 2 (Rater 2, 5) 27% 2 0.18
B B2 5 (Rater 2, 5) 27% 1 0.35
55 Second Quarter | 2009
Promotion Opportunities
A particularly worrisome bit of news was that a high percentage of exiting
employees were high performers with several years of experience. These were
employees who were potentially ready, or even overdue, for a promotion.
In high-growth markets, there is a dilemma about speed of promotions.
Does an organization promote employees in these markets before the employees
are ready and couple the promotion with additional training to help individuals
grow? The risk is of unprepared managers leading work groups, with perhaps
a loss of productivity. Or does an organization wait until employees are ready
to be promoted, at the risk that competitors will think the employees are ready
for a promotion, recruit the employees and thus create a higher turnover of
good employees? The company’s career-planning guidelines establish the number
of years that an employee should take to move from one level to the next.
The implication was that each year the company should be promoting no less
than 15 percent of employees at each level to maintain healthy levels of “build
versus buy” talent policies. Freescale’s promotion rates were lower than that.
This analysis led to a change in promotion guidelines and training programs
to better tie in with strategy. In the future, formal job-rotation programs will
support development policies.
In addition, HR learned that the market differentials between these three IC
levels were in the order of 50 percent to 75 percent. However, the market average
salary increase for last year was 13 percent to 16 percent in Freescale’s industry.
HR used this range to adjust its midpoints. Applying simple mathematics, if the
midpoints are moving roughly the same as the company is providing increases,
it would not be possible to move individuals up in the salary range. The impli-
cations were troubling: The organization was not promoting its employees
fast enough, which meant it needed to hire from the outside to cover gaps.
These employees from the outside were coming in at premiums above market.
The resulting differential in salary levels created additional problems that
management had heard before (“the best way to get a salary increase in this
company is to leave and come back”). In addition, it became apparent that the
organization needed to make changes in its compensation policies to solve this
problem. Among the actions contemplated were to hire at a higher market rate
(thus reducing midpoint differentials), provide above-market salary increases
and break these increases into two times a year to help retention and reduce
cash-flow issues.
INDIVIDUAL DRIVERS
Three of the individual drivers analyzed included (1) the educational institutions
that were the source of the company’s employees, (2) tenure and (3) gender.
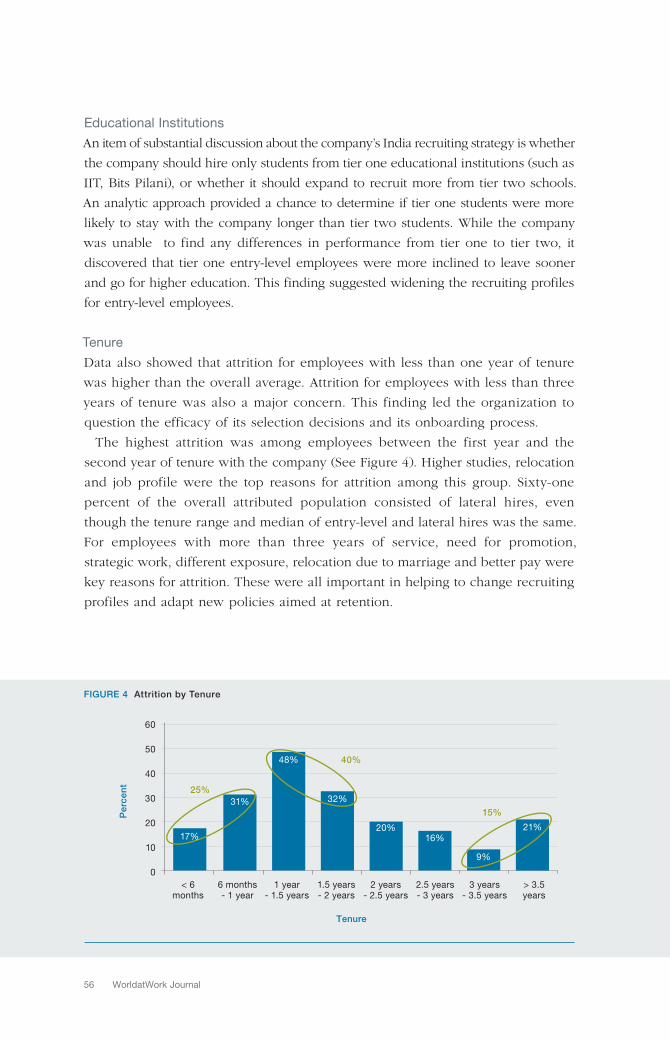
56 WorldatWork Journal
Educational Institutions
An item of substantial discussion about the company’s India recruiting strategy is whether
the company should hire only students from tier one educational institutions (such as
IIT, Bits Pilani), or whether it should expand to recruit more from tier two schools.
An analytic approach provided a chance to determine if tier one students were more
likely to stay with the company longer than tier two students. While the company
was unable to find any differences in performance from tier one to tier two, it
discovered that tier one entry-level employees were more inclined to leave sooner
and go for higher education. This finding suggested widening the recruiting profiles
for entry-level employees.
Tenure
Data also showed that attrition for employees with less than one year of tenure
was higher than the overall average. Attrition for employees with less than three
years of tenure was also a major concern. This finding led the organization to
question the efficacy of its selection decisions and its onboarding process.
The highest attrition was among employees between the first year and the
second year of tenure with the company (See Figure 4). Higher studies, relocation
and job profile were the top reasons for attrition among this group. Sixty-one
percent of the overall attributed population consisted of lateral hires, even
though the tenure range and median of entry-level and lateral hires was the same.
For employees with more than three years of service, need for promotion,
strategic work, different exposure, relocation due to marriage and better pay were
key reasons for attrition. These were all important in helping to change recruiting
profiles and adapt new policies aimed at retention.
FIGURE 4 Attrition by Tenure
60
50
40
30
20
10
0
< 6 months
6 months - 1 year
1 year - 1.5 years
1.5 years - 2 years
2 years - 2.5 years
2.5 years - 3 years
3 years - 3.5 years
> 3.5 years
Pe
rce
nt
17%20%
16%
9%
21%
31% 32%
48%
Tenure
25%
40%
15%
57 Second Quarter | 2009
Gender
Female attrition was slightly higher
than male attrition. Yet, although
female attrition was higher, their
median tenure was marginally better
than that of the male population.
This information will be used to
help in the efforts to make Freescale
a “best place to work” in India.
SUMMARY
Freescale’s India business was expe-
riencing high turnover. It was losing
nearly as many people as it was hiring
above entry level, and it was hiring
nearly as many people at level IC-2
as it was losing in the next lower
level. These were not healthy signs
and ones that motivated the company
in its search for data-driven solutions
that addressed turnover from a total
rewards standpoint.
HR’s study debunked several
myths, which allowed HR to make
several changes to increase retention. These included changes to recruiting profiles,
manager and employee-training programs, career-planning and development plans
and pay policies. HR also developed a dashboard shared between line manage-
ment and human resources to monitor the turnover rate as well as the impact on
turnover. To date, the results have been encouraging. Turnover is down by more
than one-third, which is better than the established target.
Part of the organization’s success came from coupling the quantitative data
with a deep understanding of the qualitative data. Its analysis was filtered was
through not only human resources and management. But it was well rooted in
employee feedback on what makes someone stay or leave the company.
In the end, the objective of helping improve productivity as a means to help the
business improve is on its way toward achievement. Having a set of metrics to
provide a guide is helpful, but it is an area in need of further improvements.
The company’s management believes that it is closer to answering the question
of whether or not the company is delivering on its employment-value proposition.
Management now knows what it will take to deliver on this proposition, and it
has taken steps to draw closer to that delivery.
RESOURCES PLUS
For more information related to this paper:
www.worldatwork.org
Type in any or all of the following keywords
or phrases on the search line:
❚ Employee feedback
❚ Employee retention
❚ Turnover.
www.worldatwork.org/bookstore
❚ Battling to Be the Best — Why Companies
Compete for Best-Place-to-Work Lists
❚ Culture at Work — Building a Robust
Work Environment to Help Drive Your
Total Rewards Strategy
❚ Champion of Change — How to Build
Support for HR Initiatives and New Programs,
Second Edition.
www.worldatwork.org/education
❚ T1: Total Rewards Management
Certification Course
❚ T4: Strategic Communication in Total Rewards
Certification Course
❚ Pricing Critical Skills and Unique Positions
(Competitive Market Pay), Seminar.
58 WorldatWork Journal
Finally, the biggest lesson came from taking an integrated approach to reten-
tion by deeply analyzing a variety of turnover drivers. HR expects to save a
substantial amount on recruiting costs alone, on top of the improvements in
quality, on-time delivery and overall project costs. But the highest benefit will be
enhancing the work environment at IDC to ensure employees are further valued,
properly compensated for their efforts and have clearer career opportunities
within the company. ❚
AUTHOR
Fermin A. Diez, CCP, SPHR, is a worldwide partner
and head of sales for Mercer in Asia Pacific. He has 25
years of experience in human resources in consulting as
well as corporate roles in Asia, Australia, Latin America
and the United States. He has also taught at the post-
graduate level at the University of Puerto Rico and at
the Universidad del Sagrado Corazón. During the time
of this project, he was the vice president of human
resources, Asia Pacific, at Freescale Semiconductor.
Diez has a bachelor’s degree in psychology from
the University of Michigan and a master’s of busi-
ness administration from the Wharton School at the
University of Pennsylvania. He has served on the
board of directors of WorldatWork and is a frequent
author and reviewer for WorldatWork publications.
He can be reached at [email protected].
CFOs See Business Impacts
of Work-Life Flexibility,
But They Can’t Execute
for Strategic Benefit
Experts predict that the rate of change to which
organizations and individuals will have to adapt
will increase in the coming years (Kotter 2008).
The rise in energy costs and the worsening recession
are two recent examples of rapid change, and many
organizations lacked the f lexibility and agility to
respond creatively. Nimble response to change requires
decision makers to be open to new ideas in how,
when and where work is done, and life is managed.
These new ideas can become business realities through
the strategic use of workplace flexibility.
Through a combination of flexible and reduced sched-
uling, teleworking, job sharing, sabbaticals, compressed
workweeks and the use of contract workers, leaders
can adapt organizational operations to address business
challenges and seize opportunities. These workplace-
flexibility strategies can reduce labor costs, improve work
flow planning, expand client service, leverage technology,
reduce real-estate overhead, increase environmental
Work-Life ❚
Cali Williams Yost
Work+Life Fit Inc.
877-951-9191www.worldatwork.org
Contents © WorldatWork 2009. WorldatWork members and educational institutions may print 1 to 24 copies of any WorldatWork-published article for personal, non-commercial, one-time use only. To order 25 or more print presentation-ready copies, or an electronic copy for distribution to colleagues, clients or customers, contact Gail Hallman, [email protected] at Sheridan Press, 717-632-3535, ext. 8175. To order full copies of WorldatWork publications, contact WorldatWork Customer Relationship Services, [email protected], 877-951-9191.
Second Quarter 2009
60 WorldatWork Journal
sustainability, improve disaster preparedness and lower health-care costs, to list
a few potential positive business outcomes. And the strategies help employees
at all levels flexibly manage their work and their lives to meet their needs and
the organization’s needs.
Historically, workplace flexibility as an HR strategy to attract and retain talent
has received the most attention. This paper examines the perceptions of CFOs to
determine if these front-line, financial decision makers see what the survey termed
“work-life flexibility” as a strategic lever CFOs can apply to respond to changes
in the business. A survey was developed to determine if the culture, policies and
procedures in the CFOs’ organizations would support the rapid execution of a
business strategy that included work-life flexibility. In other words, did the aware-
ness and the organization align?
To answer these questions, BDO Seidman LLP (BDO) and Work+Life Fit (WLF)
cosponsored the 2008 CFO Perspectives on Work Life Flexibility study to gauge
CFO points of view on work-life flexibility’s potential business impact. The study
found that a majority of CFOs do see the broad potential results of work-life
flexibility. And more than one-half have increased their personal use of work-
life flexibility during the past few years. However, a wide gap emerges from
the study’s findings between CFO awareness and the organizational culture and
strategic infrastructure required to execute a coordinated flexibility strategy.
The study’s findings can guide efforts to more effectively integrate work-life flex-
ibility into the day-to-day operational decision-making and execution of business
strategy in response to external and internal change.
METHODOLOGY
The national telephone survey was conducted by a third-party research firm, Market
Measurement Inc. The study examined the opinions of 100 CFOs at companies
with at least 5,000 employees from a pure random sample of approximately 1,800
organizations in the United States. For this study’s purposes, work-life flexibility
was defined in the questionnaire as having adequate time for what is important
to you both personally and professionally, as well as flexibility in how you allocate
that time.
FINDINGS
Several findings emerged including:
CFOs are aware of the influence of work-life flexibility on the business. ❚
With a formal approach to flexibility, CFOs are more likely to see the effect on ❚
profitability and the business, and they predict continued use in a downturn.
CFOs report personal awareness and use of work-life flexibility. Despite CFO ❚
awareness, a lack of organizational alignment behind work-life flexibility will
limit strategic impact.
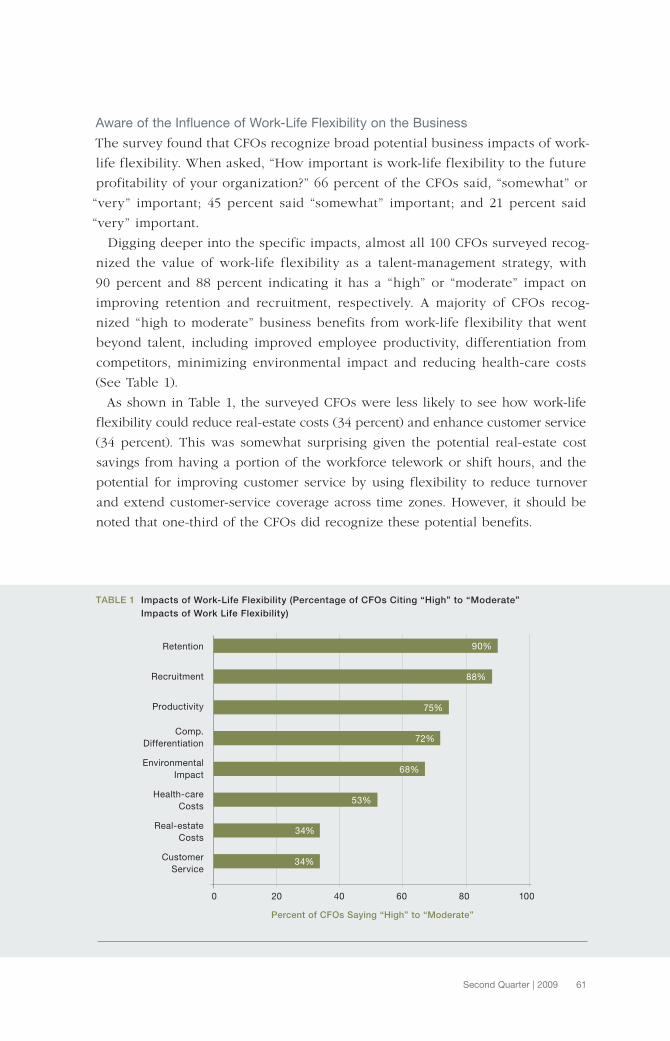
61 Second Quarter | 2009
Aware of the Influence of Work-Life Flexibility on the Business
The survey found that CFOs recognize broad potential business impacts of work-
life flexibility. When asked, “How important is work-life flexibility to the future
profitability of your organization?” 66 percent of the CFOs said, “somewhat” or
“very” important; 45 percent said “somewhat” important; and 21 percent said
“very” important.
Digging deeper into the specific impacts, almost all 100 CFOs surveyed recog-
nized the value of work-life flexibility as a talent-management strategy, with
90 percent and 88 percent indicating it has a “high” or “moderate” impact on
improving retention and recruitment, respectively. A majority of CFOs recog-
nized “high to moderate” business benefits from work-life flexibility that went
beyond talent, including improved employee productivity, differentiation from
competitors, minimizing environmental impact and reducing health-care costs
(See Table 1).
As shown in Table 1, the surveyed CFOs were less likely to see how work-life
flexibility could reduce real-estate costs (34 percent) and enhance customer service
(34 percent). This was somewhat surprising given the potential real-estate cost
savings from having a portion of the workforce telework or shift hours, and the
potential for improving customer service by using flexibility to reduce turnover
and extend customer-service coverage across time zones. However, it should be
noted that one-third of the CFOs did recognize these potential benefits.
TABLE 1 Impacts of Work-Life Flexibility (Percentage of CFOs Citing “High” to “Moderate”
Impacts of Work Life Flexibility)
Retention
Recruitment
Productivity
Comp.
Differentiation
Environmental
Impact
Health-care
Costs
Real-estate
Costs
Customer
Service
Percent of CFOs Saying “High” to “Moderate”
0 20 40 60 80 100
90%
88%
75%
72%
68%
53%
34%
34%
62 WorldatWork Journal
At the time the survey was conducted (in late May 2008), approximately one-
third (38 percent) of respondents reported that their organizations had reduced
their workforce in recent years. Employee layoffs were the most common form
of downsizing. However, almost one-third (30 percent) of the CFOs innovatively
used flexibility as a force-reduction strategy, allowing them to stay connected to
employees. They offered a combination of contract project-based work (24 percent),
reduced hours with full benefits (3 percent) and unpaid sabbaticals with full benefits
(3 percent). These findings confirm a historical precedence for a flexible approach
to downsizing that goes beyond job cuts. This is particularly important as the
economy moves deeper into a recession and financial decision makers seek to
achieve additional labor-cost savings. Layoffs are not the only option.
The Importance of a Formal Approach to Flexibility
The study found that having a formal organizational approach to work-life flex-
ibility made a difference in CFO awareness of the business benefits. Of the 100
CFOs who participated in the study, 39 percent, or almost two of five, work in
organizations with formal work-life flexibility policies and procedures.
Within these organizations with a formal approach to work-life flexibility, CFOs
were more likely to report that work-life flexibility is important to future profitability,
with 75 percent indicating it’s “very important” or “somewhat important” (versus
66 percent for all CFOs who responded). Eighty-seven percent of the CFOs whose
organizations have flexibility policies and procedures predicted the use of flexibility
will either increase or remain the same despite the economic downturn.
The fact that a majority (59 percent) of CFOs from organizations with a formal
approach to flexibility identified nontalent-related motivations as the primary
drivers for flexibility in their companies might partially explain their higher level
of support regardless of economic conditions. These drivers included:
Increased amount/complexity of work (28 percent) ❚
Competition (21 percent) ❚
Globalization (10 percent). ❚
Thirty-six percent of CFOs with flexibility policies and procedures cited the
competition for talent as the most important driver, and 5 percent responded
“don’t know.”
Personal Awareness and the Use of Work-Life Flexibility
The CFOs’ awareness of work-life flexibility didn’t stop with the organization.
A majority of the 100 CFOs (53 percent) reported an increased use of personal
work-life flexibility during the past several years, with 14 percent indicating that
the increase was substantial. More than 80 percent reported being satisfied with
their personal use of work-life flexibility, with 31 percent reporting they were
very satisfied.
63 Second Quarter | 2009
Flexible hours and teleworking were most common, with the majority of
CFOs surveyed reporting a “high” or “moderate” use of flexibility in their hours
(63 percent), followed by “working from other locations/telecommuting” (27 percent).
Approximately one in four CFOs (26 percent) have, at some point, reduced the
average number of hours they worked by five to 10 hours per week, with 16
percent reducing their schedule by at least five hours per week and the remaining
CFOs (10 percent) reducing it by at least 10 hours.
A Lack of Organizational Alignment Behind Work-Life Flexibility
The majority of CFOs do recognize the broad business and personal applications
of work-life flexibility. However, the likelihood that this awareness will translate
into a strategic use within the business is limited by the fact that only 13 out of
the 100 CFOs work for organizations with a formal approach to flexibility and
have a leadership team who sees flexibility as a business strategy, not a perk.
In other words, while a majority of CFOs understand how beneficial work-life
flexibility can be personally and to the business, 87 percent work in organi-
zations that do not have the cultural and procedural alignment necessary for
work-life flexibility to be part of a business strategy that rapidly responds to
business change. Without a formal approach in place and a like-minded manage-
ment team, this wide awareness-action gap must be bridged before a CFO could
use work-life flexibility as a strategic lever in the decision-making process.
Lack of Formal Approach to Flexibility
As noted earlier, less than one-half of the CFOs (39 percent) reported that their
organizations offer a formal approach to flexibility in the form of policies or proce-
dures. This does not mean that the remaining 61 percent of organizations don’t
have work-life flexibility. There may be pockets of ad hoc, informal flexibility on
where, when and how work is done. Or perhaps the responding CFO is unaware
of the formal policies and procedures in place. Regardless, these statistics mean
that no recognized organizational structure exists around work-life flexibility that
could guide a rapid response to change.
While policies and procedures alone do not guarantee the effectiveness of
work-life flexibility, they do provide guidelines against which to execute a stra-
tegic application flexibility to achieve a specific business goal. In other words,
a policy and procedure for reducing schedules would make it much easier for
a CFO to make schedule reductions part of his or her labor-cost saving strategy
in response to an economic downturn. A majority of the CFOs’ organizations
(61 percent) lack a formal approach to work-life flexibility. Therefore, the systems
are not in place to guide rapid, consistent execution.
64 WorldatWork Journal
Leadership Team Sees Flex as a Perk/HR Program, Not a Business Strategy
The absence of a formal approach to flexibility was not the only area of misalign-
ment between CFO awareness and organizational capacity identified in the survey.
Almost two-thirds (62 percent) of the CFOs who worked in organizations with
flexibility policies and procedures felt their management team viewed work-life
flexibility to be an informal perk or human-resources program. Only one-third
(33 percent) felt their leaders believe work-life flexibility is a business strategy to
manage talent, resources and work flow, showing that having a formal approach
to flexibility does not guarantee that the leadership will perceive work-life flex-
ibility strategically. Given these findings, it is clear that when faced with a business
challenge requiring rapid, flexible response, a minority of the senior leadership
team would consider work-life flexibility to be a strategic solution.
For Flex to Succeed, Business Leadership, Not Just HR Alone Must Champion It
Regarding the responsibility for flexibility, a majority (75 percent) of the 100 CFOs
agree that for work-life flexibility to succeed, it is “very important” for business-
unit leaders to be involved and supportive. Further reinforcing the importance of
direct business-line involvement, close to two-thirds (65 percent) felt that work-life
flexibility cannot be successful if the HR department is the only champion.
This is another area where the awareness of the CFOs does not match the action
being taken in their organizations. Considering that only 13 of the 100 CFOs
said they work for organizations with a formal approach to flexibility and with
a leadership team that sees it as a business strategy, it is unclear that work-life
flexibility is “on the radar screen” of HR. It is even less likely that business-unit
leadership is actively supporting the work-life flexibility strategy development and
implementation process.
Overcoming Common Organizational Obstacles to Flexibility
Sixty-two percent of CFOs in organizations with flexibility policies and proce-
dures reported that their senior leaders see flexibility as an informal perk or HR
program. Therefore, it is unsurprising that 37 percent of the 100 CFOs were “highly”
concerned that an organizational obstacle to the use of flexibility rests with senior
management, who is unconvinced of the benefits. The other obstacles provoking
a high level of concern with the CFOs surveyed related to implementation:
A concern that it must be offered to either all employees or no employees ❚
(45 percent)
Concerns that employees will abuse flexibility (32 percent) ❚
Fears that flexibility in the workplace will reduce worker productivity (32 percent). ❚
Few considered a lack of perceived need for work-life flexibility (15 percent) or
a lack of familiarity with the work-life flexibility concept (9 percent) to be high-
level obstacles. In other words, the awareness exists. The challenges CFOs saw
related to buy-in to strategic implementation.
65 Second Quarter | 2009
Overcoming Common Personal
Obstacles to Flexibility
Organizational obstacles were not
the only challenges that CFOs felt
stood in the way of successful work-
life flexibility. The CFOs identified
personal concerns that would be
equally challenging. When asked
to identify “significant” obstacles
that would keep them from person-
ally pursing work-life flexibility, the
majority of CFOs cited common
roadblocks such as:
Importance of face time with others ❚
in the organization (76 percent)
Demands and workload of the job ❚
(72 percent)
Concerns about how they would ❚
be perceived by other employees
at their level (62 percent)
Concern that it could hurt their ❚
career (58 percent).
CFOs who work for organiza-
tions with flexibility policies and
procedures were significantly less likely (67 percent) to indicate that “face time”
would be a significant obstacle to pursuing work-life flexibility than the CFOs
in companies without a formal approach (86 percent). This is further evidence
that a formal approach to flexibility does help individuals overcome personal
fears related to flexibility.
IMPLICATIONS
In an era where rapid change is no longer the exception, but the rule, flexibility
in where, when and how work is done and life is managed is an imperative.
Strategic work-life flexibility provides business leaders and individuals with an
important lever for responding to challenges and opportunities. Survey findings
provide insights to guide individuals focused on integrating work-life flexibility
strategies into the day-to-day strategic business decision-making process.
A majority of CFOs are aware of organizational and personal impacts of work-
life flexibility. These front-line, financial decision makers recognize the broad
potential business applications of work-life flexibility, including managing talent,
competitive differentiation, and reducing environmental impact and health-care
costs. A majority of CFOs who work for organizations with a formal approach
RESOURCES PLUS
For more information related to this paper:
www.worldatwork.org
Type in any or all of the following keywords
or phrases on the search line:
❚ Work-life flexibility
❚ Attract and retain
❚ Flexible schedules.
www.worldatwork.org/bookstore
❚ Work-Life Effectiveness — Bottom-Line
Strategies for Today’s Workplace
❚ Battling to Be the Best — Why Companies
Compete for Best-Place-to-Work Lists
❚ Workforce Engagement —Strategies
to Attract, Motivate and Retain Talent.
www.worldatwork.org/education
❚ W1: Introduction to Work-Life Effectiveness —
Successful Work-Life Programs to
Attract, Motivate and Retain Employees
Certification Course
❚ W2: The Flexible Workplace — Strategies
for Your Organization, Certification Course
❚ W4: Organizational Culture Change —
A Work-Life Perspective, Certification Course.
66 WorldatWork Journal
to flexibility believe the primary drivers behind flexibility strategies are the
work load’s complexity, competition and globalization. But more can be done
to connect the dots to enhance their understanding, particularly in the areas of
customer service and real-estate cost management.
A majority of the CFOs also personally use work-life flexibility to manage their
own work and personal responsibilities, which increases their recognition of how
individuals in their organizations benefit from flexibility as well.
The study also identified a wide gap between the CFOs’ awareness and the
cultural and procedural alignment necessary for work-life flexibility to be part
of a business strategy that rapidly responds to business change. Only 13 out
of the 100 CFOs in the study said they work for organizations with a formal
approach to flexibility and with a leadership team who believes work-life flex-
ibility is a business strategy. This limits the chance that a majority of CFOs will
be able to use flexibility as a strategic lever. By contrast, this gap also provides
an opportunity. Implications for work-life flexibility strategy development and
implementation include:
Use up-front “branding” of work-life flexibility within the culture as a business ❚
strategy for managing talent, resources and workflow. If flexible schedules, tele-
working, reduced schedules, compressed workweeks, sabbaticals and project-based
work are viewed as informal perks or HR programs by senior leadership, then
they will not be seen as part of the strategic decision-making process. Up-front,
flexibility in where, when and how work is done needs to be positioned as both
a business strategy and a personal work-life management strategy.
Involve business line leadership in the development and implementation of strategic ❚
work-life flexibility from the beginning. Too often, HR is the sole champion of work-
life flexibility within an organization. And as the CFO survey found, this will have
limited influence in terms of integrating work-life flexibility into the day-to-day
business operations. Leverage the CFOs’ awareness of how work-life flexibility
can help them achieve a variety of important profit and business objectives to
encourage line leaders to be involved and supportive throughout the process.
In addition to leaders understanding the benefits of flexibility, ensure organiza- ❚
tional obstacles related to effective implementation are addressed. Overcoming the
organizational obstacles about which the CFOs expressed a high level of concern
requires developing the work-life flexibility strategy in partnership with line lead-
ership. Unlike a policy or a program that must apply equally to all regardless of
circumstances, everyone has access to the same process to determine what type
of flexibility will work for them personally and for the business. But not everyone
is guaranteed the same type of flexibility. As part of business operations, formal,
flexible work plans should be reviewed periodically and, if they are not meeting
their goals established by the business and the individual in terms of performance
and productivity, should be discontinued. ❚
67 Second Quarter | 2009
Kotter, John P. 2008. A Sense of Urgency. Boston: Harvard Business Press.
REFERENCE
AUTHOR
Cali Williams Yost is the founder and CEO of Work+Life
Fit Inc., a consulting firm that specializes in developing
innovative business-based work-life flexibility strate-
gies for organizations and individuals. Clients include
BDO Seidman LLP, the United States Navy, Ernst &
Young, Barclays Global Investors and Quaker, as well
as thousands of individuals. Yost has been consulting
since 1995, first at the Families and Work Institute
and then at Bright Horizons Family Solutions. She has
a master’s of business administration from Columbia
University and is the author of Work+Life: Finding the
Fit That’s Right for You (Riverhead/Penguin Group
2005). Yost writes the Work+Life Fit Blog, available
at www.worklifefit.com, and is an expert blogger for
Fast Company magazine. She can be reached at
BDO Seidman LLP, co-sponsor of the CFO Survey,
is a national professional services firm providing assur-
ance, tax, financial advisory and consulting services
to a wide range of publicly traded and privately held
companies. BDO Seidman serves clients through
37 offices and more than 400 independent alliance
firm locations nationwide. As a member firm of BDO
International, BDO Seidman LLP serves multinational
clients by leveraging a global network of resources
comprised of 626 member-firm offices in 110 coun-
tries. BDO International is a worldwide network of
public accounting firms, called BDO member firms,
serving international clients. Each BDO member firm
is an independent legal entity in its own country.
Melissa L. Means, CCP
Pearl Meyer & Partners
Holistic Pay Modeling:
Getting the Complete Executive
Pay Picture
Growing public scrutiny of executive compensa-
tion means that for many companies, it’s a matter
of when — and not if — they will be required
to defend the design and administration of executive
compensation programs. Directors, executives and HR
leaders must be able to tell a compelling story about the
thinking behind decisions and outcomes, supported by
evidence of a solid, far-reaching framework underlying
the full complement of pay elements. Absent such a
detailed understanding of how the entire confluence
of possible factors in various scenarios could affect
compensation levels, companies may face controversy
over unexpectedly large payouts.
The traditional tools of compensation analysis bring
important information to the decision-making process.
A competitive analysis allows companies to compare the
overall structure and expected payout of a compensation
package against that of peer companies as well as data from
surveys at target or actual performance-achievement levels.
This is, in some organizations, known as a bench-
marking analysis. A tally sheet calculates an executive’s
total earnings as of a single point in time for all elements
❚ Compensation
877-951-9191www.worldatwork.org
Contents © WorldatWork 2009. WorldatWork members and educational institutions may print 1 to 24 copies of any WorldatWork-published article for personal, non-commercial, one-time use only. To order 25 or more print presentation-ready copies, or an electronic copy for distribution to colleagues, clients or customers, contact Gail Hallman, [email protected] at Sheridan Press, 717-632-3535, ext. 8175. To order full copies of WorldatWork publications, contact WorldatWork Customer Relationship Services, [email protected], 877-951-9191.
Second Quarter 2009
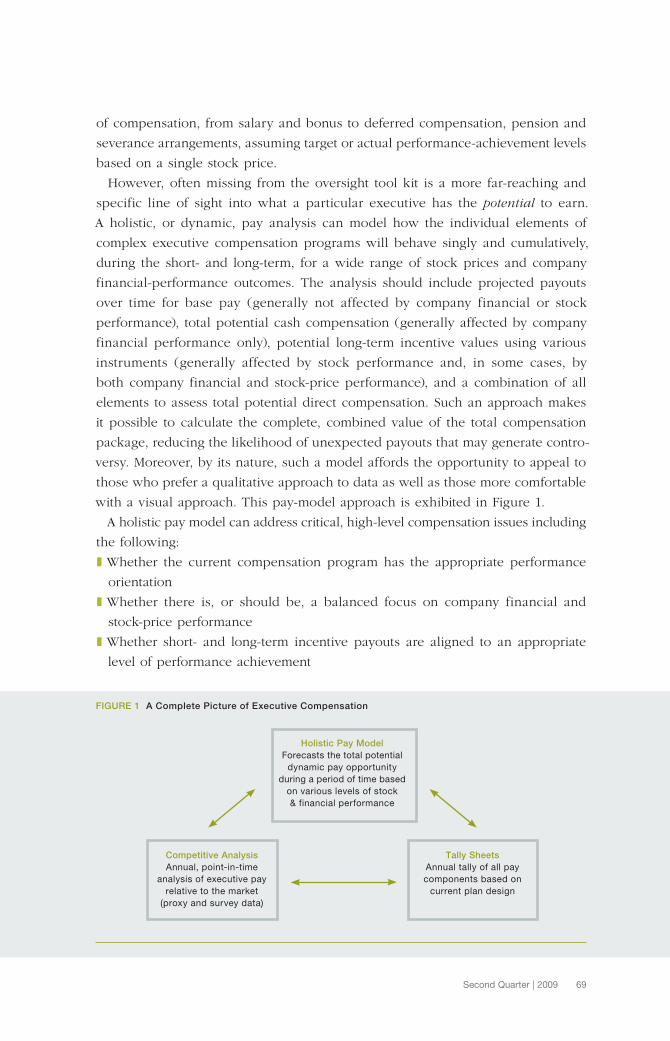
69 Second Quarter | 2009
of compensation, from salary and bonus to deferred compensation, pension and
severance arrangements, assuming target or actual performance-achievement levels
based on a single stock price.
However, often missing from the oversight tool kit is a more far-reaching and
specific line of sight into what a particular executive has the potential to earn.
A holistic, or dynamic, pay analysis can model how the individual elements of
complex executive compensation programs will behave singly and cumulatively,
during the short- and long-term, for a wide range of stock prices and company
financial-performance outcomes. The analysis should include projected payouts
over time for base pay (generally not affected by company financial or stock
performance), total potential cash compensation (generally affected by company
financial performance only), potential long-term incentive values using various
instruments (generally affected by stock performance and, in some cases, by
both company financial and stock-price performance), and a combination of all
elements to assess total potential direct compensation. Such an approach makes
it possible to calculate the complete, combined value of the total compensation
package, reducing the likelihood of unexpected payouts that may generate contro-
versy. Moreover, by its nature, such a model affords the opportunity to appeal to
those who prefer a qualitative approach to data as well as those more comfortable
with a visual approach. This pay-model approach is exhibited in Figure 1.
A holistic pay model can address critical, high-level compensation issues including
the following:
Whether the current compensation program has the appropriate performance ❚
orientation
Whether there is, or should be, a balanced focus on company financial and ❚
stock-price performance
Whether short- and long-term incentive payouts are aligned to an appropriate ❚
level of performance achievement
FIGURE 1 A Complete Picture of Executive Compensation
Holistic Pay Model
Forecasts the total potential
dynamic pay opportunity
during a period of time based
on various levels of stock
& financial performance
Tally Sheets
Annual tally of all pay
components based on
current plan design
Competitive Analysis
Annual, point-in-time
analysis of executive pay
relative to the market
(proxy and survey data)
70 WorldatWork Journal
Whether the current compensation mix is appropriate ❚
Whether the emphasis on time- and/or performance-based, long-term incentive ❚
awards is appropriate
To what extent the incentive programs support the organization’s business strategy ❚
and projected time period
To what extent executive payouts are aligned with incremental shareholder returns ❚
and whether the company can afford such executive payouts.
THE PICTURE TELLS THE STORY
Unlike most static, one-dimensional pay analyses, a holistic pay analysis should
be presented in a set of three-dimensional charts that vividly illustrate the extent
to which incremental changes in stock or company financial performance result
in changes in potential pay levels. The impact of differences in performance
results for a holistic pay model should be less like a row of dominoes falling in
a predictable and static pattern, and should be more like a flag blowing in the
wind where changes in wind strength and direction (i.e., performance) results in
changes to the flow of the flag itself (i.e., potential compensation payouts).
To understand how this crucial analysis may take shape from a three-dimensional
graphic perspective, it’s helpful to look at the individual elements that feed such
an analysis. Figures 2 through 5, on pages 71 and 72, present this graphic perspec-
tive. It is important to note that the color in the graphs reflect the range of payout
opportunities for each compensation program element. Base salary, shown in
Figure 2, remains fairly static as it does not increase or decrease based on company
financial or stock performance. Total potential cash compensation, shown in
Figure 3, encompasses base salary plus annual incentives, which changes the
shape of the three-dimensional graphic based on the impact of company financial
performance. Long-term incentives including, for example, instruments such as
stock options and performance-based restricted stock also change the graph-
ic’s shape, based on company financial and stock price performance (Figure 4).
Taken together, the three-dimensional graph shown in Figure 5 provides a view of
total potential direct compensation and how the potential payouts are impacted
by a range of company financial and stock-price performance.
At a high level, the example compensation package for a CEO outlined in
Figures 2 through 5 suggests the current annual short-term incentive program
modestly rewards for company financial performance up to the 50th percentile
and provides for more leveraged payout opportunities when performance is above
such levels. This example also highlights how a long-term incentive plan that is
delivered through the use of performance-based restricted stock is affected by
both company financial and stock-price performance. Overall, total potential direct
compensation (including all elements of compensation) for the sample CEO high-
lights a compensation program that is equally balanced by both company financial
and stock performance. Figures 2 through 5 also highlight the CEO’s potential to
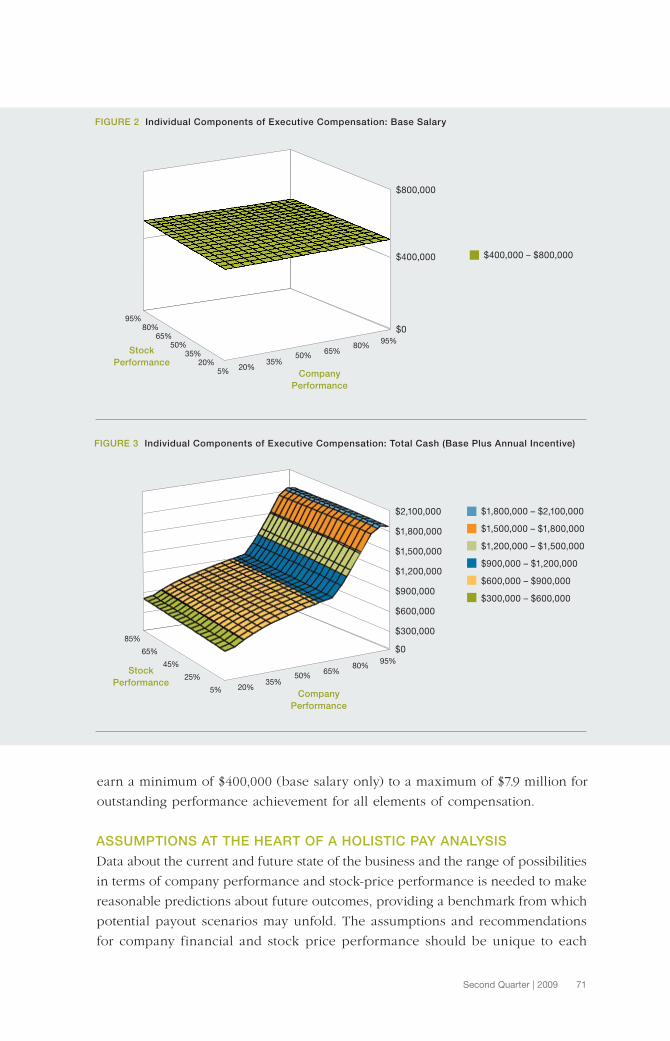
71 Second Quarter | 2009
earn a minimum of $400,000 (base salary only) to a maximum of $7.9 million for
outstanding performance achievement for all elements of compensation.
ASSUMPTIONS AT THE HEART OF A HOLISTIC PAY ANALYSIS
Data about the current and future state of the business and the range of possibilities
in terms of company performance and stock-price performance is needed to make
reasonable predictions about future outcomes, providing a benchmark from which
potential payout scenarios may unfold. The assumptions and recommendations
for company financial and stock price performance should be unique to each
FIGURE 2 Individual Components of Executive Compensation: Base Salary
$800,000
$400,000
$0
95%80%
65% 50%
35%20%
5%20%
35%50%
65%80%
95%
Company
Performance
Stock
Performance
$400,000 – $800,000
FIGURE 3 Individual Components of Executive Compensation: Total Cash (Base Plus Annual Incentive)
$2,100,000
$1,800,000
$1,500,000
$1,200,000
$900,000
$600,000
$300,000
$085%
65%
45%
25%
5% 20%35%
50%65%
80%95%
Company
Performance
Stock
Performance
$1,800,000 – $2,100,000
$1,500,000 – $1,800,000
$1,200,000 – $1,500,000
$900,000 – $1,200,000
$600,000 – $900,000
$300,000 – $600,000
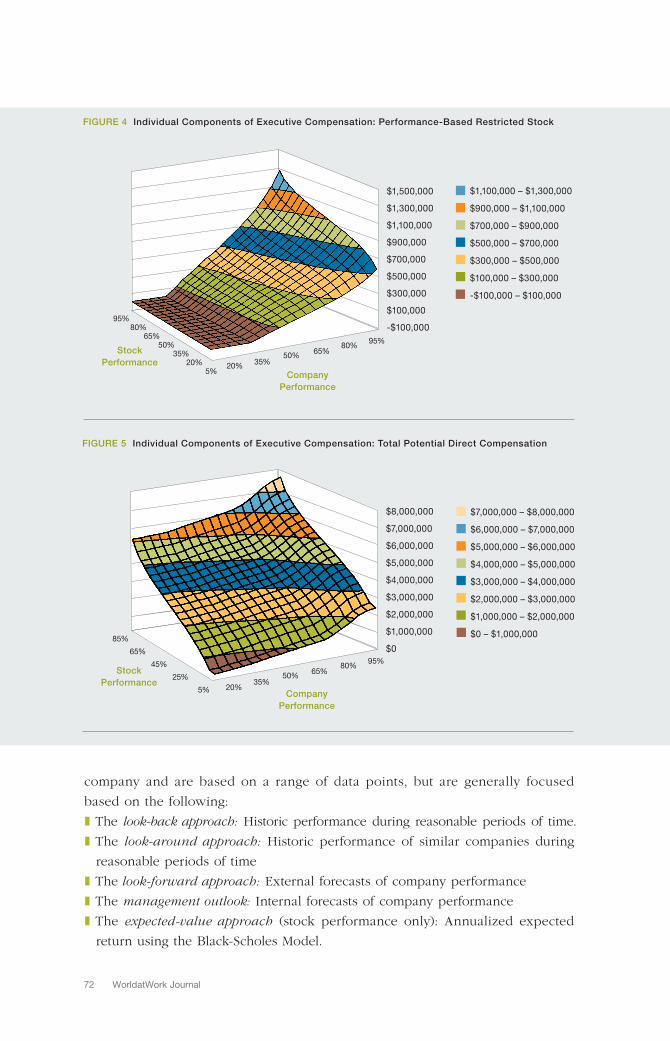
72 WorldatWork Journal
company and are based on a range of data points, but are generally focused
based on the following:
The ❚ look-back approach: Historic performance during reasonable periods of time.
The ❚ look-around approach: Historic performance of similar companies during
reasonable periods of time
The ❚ look-forward approach: External forecasts of company performance
The ❚ management outlook: Internal forecasts of company performance
The ❚ expected-value approach (stock performance only): Annualized expected
return using the Black-Scholes Model.
FIGURE 4 Individual Components of Executive Compensation: Performance-Based Restricted Stock
95%80%
65% 50%
35%20%
5%20%
35%50%
65%80%
95%
Company
Performance
Stock
Performance
FIGURE 5 Individual Components of Executive Compensation: Total Potential Direct Compensation
$8,000,000
$7,000,000
$6,000,000
$5,000,000
$4,000,000
$3,000,000
$2,000,000
$1,000,000
$085%
65%
45%
25%
5% 20%35%
50%65%
80%95%
Company
Performance
Stock
Performance
$7,000,000 – $8,000,000
$6,000,000 – $7,000,000
$5,000,000 – $6,000,000
$4,000,000 – $5,000,000
$3,000,000 – $4,000,000
$2,000,000 – $3,000,000
$1,000,000 – $2,000,000
$0 – $1,000,000
$1,500,000
$1,300,000
$1,100,000
$900,000
$700,000
$500,000
$300,000
$100,000
-$100,000
$1,100,000 – $1,300,000
$900,000 – $1,100,000
$700,000 – $900,000
$500,000 – $700,000
$300,000 – $500,000
$100,000 – $300,000
-$100,000 – $100,000
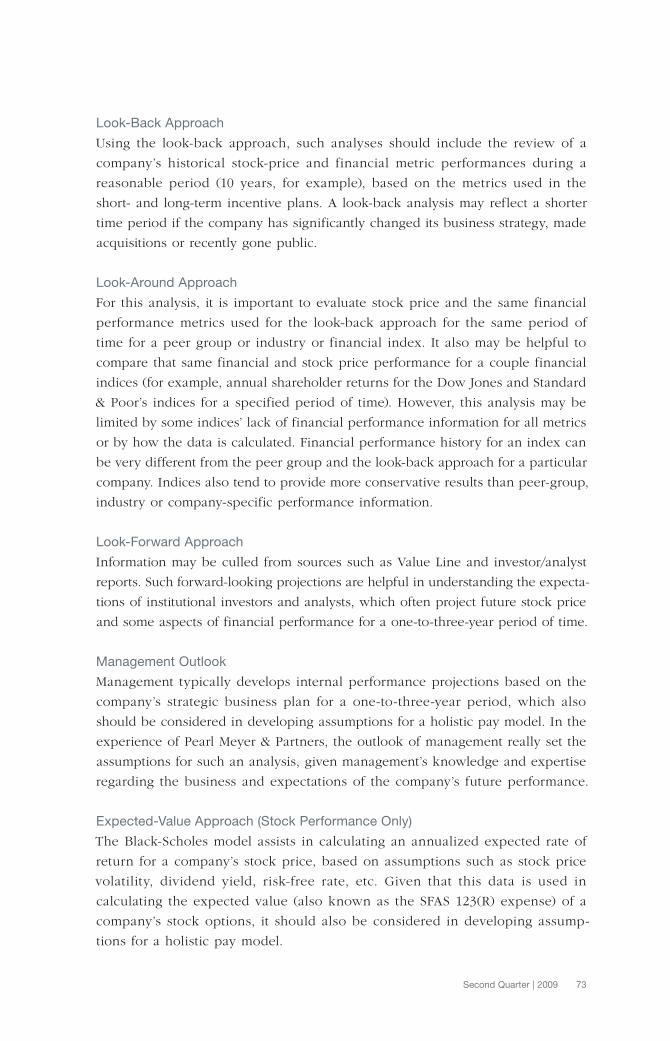
73 Second Quarter | 2009
Look-Back Approach
Using the look-back approach, such analyses should include the review of a
company’s historical stock-price and financial metric performances during a
reasonable period (10 years, for example), based on the metrics used in the
short- and long-term incentive plans. A look-back analysis may reflect a shorter
time period if the company has significantly changed its business strategy, made
acquisitions or recently gone public.
Look-Around Approach
For this analysis, it is important to evaluate stock price and the same financial
performance metrics used for the look-back approach for the same period of
time for a peer group or industry or financial index. It also may be helpful to
compare that same financial and stock price performance for a couple financial
indices (for example, annual shareholder returns for the Dow Jones and Standard
& Poor’s indices for a specified period of time). However, this analysis may be
limited by some indices’ lack of financial performance information for all metrics
or by how the data is calculated. Financial performance history for an index can
be very different from the peer group and the look-back approach for a particular
company. Indices also tend to provide more conservative results than peer-group,
industry or company-specific performance information.
Look-Forward Approach
Information may be culled from sources such as Value Line and investor/analyst
reports. Such forward-looking projections are helpful in understanding the expecta-
tions of institutional investors and analysts, which often project future stock price
and some aspects of financial performance for a one-to-three-year period of time.
Management Outlook
Management typically develops internal performance projections based on the
company’s strategic business plan for a one-to-three-year period, which also
should be considered in developing assumptions for a holistic pay model. In the
experience of Pearl Meyer & Partners, the outlook of management really set the
assumptions for such an analysis, given management’s knowledge and expertise
regarding the business and expectations of the company’s future performance.
Expected-Value Approach (Stock Performance Only)
The Black-Scholes model assists in calculating an annualized expected rate of
return for a company’s stock price, based on assumptions such as stock price
volatility, dividend yield, risk-free rate, etc. Given that this data is used in
calculating the expected value (also known as the SFAS 123(R) expense) of a
company’s stock options, it should also be considered in developing assump-
tions for a holistic pay model.
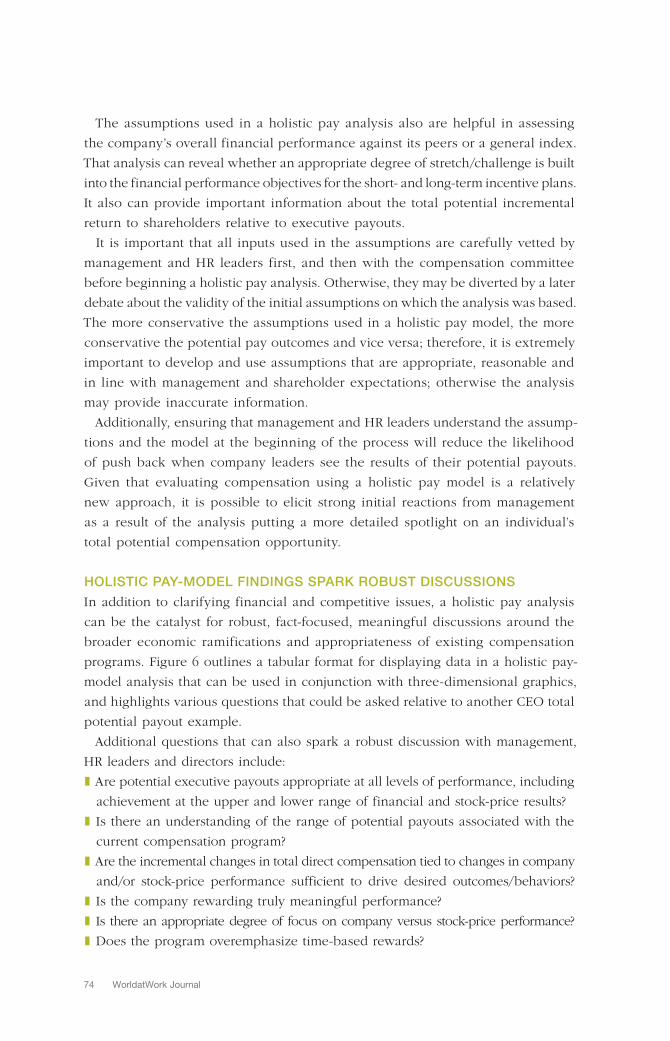
74 WorldatWork Journal
The assumptions used in a holistic pay analysis also are helpful in assessing
the company’s overall financial performance against its peers or a general index.
That analysis can reveal whether an appropriate degree of stretch/challenge is built
into the financial performance objectives for the short- and long-term incentive plans.
It also can provide important information about the total potential incremental
return to shareholders relative to executive payouts.
It is important that all inputs used in the assumptions are carefully vetted by
management and HR leaders first, and then with the compensation committee
before beginning a holistic pay analysis. Otherwise, they may be diverted by a later
debate about the validity of the initial assumptions on which the analysis was based.
The more conservative the assumptions used in a holistic pay model, the more
conservative the potential pay outcomes and vice versa; therefore, it is extremely
important to develop and use assumptions that are appropriate, reasonable and
in line with management and shareholder expectations; otherwise the analysis
may provide inaccurate information.
Additionally, ensuring that management and HR leaders understand the assump-
tions and the model at the beginning of the process will reduce the likelihood
of push back when company leaders see the results of their potential payouts.
Given that evaluating compensation using a holistic pay model is a relatively
new approach, it is possible to elicit strong initial reactions from management
as a result of the analysis putting a more detailed spotlight on an individual’s
total potential compensation opportunity.
HOLISTIC PAY-MODEL FINDINGS SPARK ROBUST DISCUSSIONS
In addition to clarifying financial and competitive issues, a holistic pay analysis
can be the catalyst for robust, fact-focused, meaningful discussions around the
broader economic ramifications and appropriateness of existing compensation
programs. Figure 6 outlines a tabular format for displaying data in a holistic pay-
model analysis that can be used in conjunction with three-dimensional graphics,
and highlights various questions that could be asked relative to another CEO total
potential payout example.
Additional questions that can also spark a robust discussion with management,
HR leaders and directors include:
Are potential executive payouts appropriate at all levels of performance, including ❚
achievement at the upper and lower range of financial and stock-price results?
Is there an understanding of the range of potential payouts associated with the ❚
current compensation program?
Are the incremental changes in total direct compensation tied to changes in company ❚
and/or stock-price performance sufficient to drive desired outcomes/behaviors?
Is the company rewarding truly meaningful performance? ❚
Is there an appropriate degree of focus on company versus stock-price performance? ❚
Does the program overemphasize time-based rewards? ❚
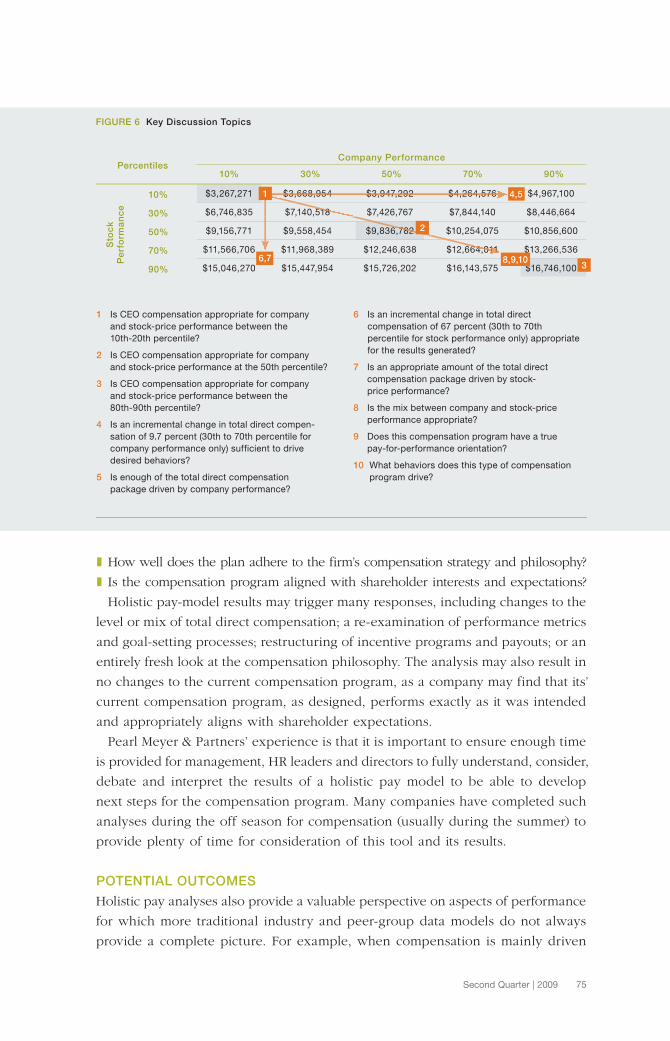
75 Second Quarter | 2009
How well does the plan adhere to the firm’s compensation strategy and philosophy?❚
Is the compensation program aligned with shareholder interests and expectations?❚
Holistic pay-model results may trigger many responses, including changes to the
level or mix of total direct compensation; a re-examination of performance metrics
and goal-setting processes; restructuring of incentive programs and payouts; or an
entirely fresh look at the compensation philosophy. The analysis may also result in
no changes to the current compensation program, as a company may find that its’
current compensation program, as designed, performs exactly as it was intended
and appropriately aligns with shareholder expectations.
Pearl Meyer & Partners’ experience is that it is important to ensure enough time
is provided for management, HR leaders and directors to fully understand, consider,
debate and interpret the results of a holistic pay model to be able to develop
next steps for the compensation program. Many companies have completed such
analyses during the off season for compensation (usually during the summer) to
provide plenty of time for consideration of this tool and its results.
POTENTIAL OUTCOMES
Holistic pay analyses also provide a valuable perspective on aspects of performance
for which more traditional industry and peer-group data models do not always
provide a complete picture. For example, when compensation is mainly driven
FIGURE 6 Key Discussion Topics
Company Performance
10% 30% 50% 70% 90%
1 Is CEO compensation appropriate for company
and stock-price performance between the
10th-20th percentile?
2 Is CEO compensation appropriate for company
and stock-price performance at the 50th percentile?
3 Is CEO compensation appropriate for company
and stock-price performance between the
80th-90th percentile?
4 Is an incremental change in total direct compen-
sation of 9.7 percent (30th to 70th percentile for
company performance only) sufficient to drive
desired behaviors?
5 Is enough of the total direct compensation
package driven by company performance?
6 Is an incremental change in total direct
compensation of 67 percent (30th to 70th
percentile for stock performance only) appropriate
for the results generated?
7 Is an appropriate amount of the total direct
compensation package driven by stock-
price performance?
8 Is the mix between company and stock-price
performance appropriate?
9 Does this compensation program have a true
pay-for-performance orientation?
10 What behaviors does this type of compensation
program drive?
Percentiles
$3,267,271 $3,668,954 $3,947,292 $4,264,576 $4,967,100
$6,746,835 $7,140,518 $7,426,767 $7,844,140 $8,446,664
$9,156,771 $9,558,454 $9,836,782 $10,254,075 $10,856,600
$11,566,706 $11,968,389 $12,246,638 $12,664,011 $13,266,536
$15,046,270 $15,447,954 $15,726,202 $16,143,575 $16,746,100
$3 668 954 $3 947 292 $4 264 576
,518
6,782
664 0111
1
2
3
4,5
6,7 8,9,10
Sto
ck
Pe
rfo
rma
nc
e
10%
30%
50%
70%
90%
76 WorldatWork Journal
by individual, stock and company
financial performance, most tradi-
tional analyses separately assess
those metrics. In contrast, a holistic
pay analysis should give a detailed
picture of the interplay of those
performance-based elements under
a variety of company financial and
stock results and the impact on actual
payouts, including the relative value
of each element to the total package;
a comparison of incremental pay to
incremental changes in company
and stock-price performance; and
a comparison of incremental pay to
incremental total shareholder return.
That, in turn, can help a company
determine i f its compensation
program is driving the intended
results and behaviors and make
changes as needed (for example, by
modifying the program to focus more
on performance outcomes beyond
one-year bonus opportunities to
encourage a more long-term focus among executives, or by adjusting threshold
and maximum performance levels in the firm’s short-term incentive plan, or by
introducing additional long-term incentive instruments and opportunities).
Volatile industries in which performance tends to veer from “feast to famine” also
can get important insights from the empirical data provided by a holistic pay model.
For example, a company might want confirmation that compensation aligns with
its philosophy of providing zero payouts for underperformance, target payouts for
expected levels of performance and maximum payouts for exceeding performance
expectations. A holistic pay model would reveal exactly how executive pay would
track against the company’s potential market value for the long term, as opposed to
needing to rely on a “gut feeling” about whether a program is working as intended.
Additionally, a holistic pay analysis can assist in communicating the potential
value of compensation packages to executives, including the precise link between
payouts and performance. This is especially useful when market downturns affect
performance and limit bonus potential. The data would make clear that execu-
tives still would have opportunities to bank future results regarding elements of
compensation tied to stock-price performance and relative to future results under
a multiyear performance-based long-term incentive plan.
RESOURCES PLUS
For more information related to this paper:
www.worldatwork.org
Type in any or all of the following keywords
or phrases on the search line:
❚ Executive pay
❚ Compensation program
❚ Incentives.
www.worldatwork.org/bookstore
❚ Executive Compensation —
An Introduction to Practice & Theory
❚ Incentive Pay —
Creating a Competitive Advantage
❚ Reading & Preparing Proxy Statements —
A Guide to the SEC Disclosure Rules for
Executive and Director Compensation,
Second Edition.
www.worldatwork.org/education
❚ C6: Principles of Executive Rewards
Certification Course
❚ C6A: Advanced Concepts in Executive
Compensation, Certification Course
❚ Determining Pay For Executives
(Competitive Market Pay), Seminar.
77 Second Quarter | 2009
LOOKING AHEAD
The U.S. Securities and Exchange Commission’s (SEC’s) drive for expanded
reporting of executive compensation programs could make holistic pay modeling
an even more powerful tool. Ideally, the analysis should compare total potential
compensation for an executive with comparable data from the external market.
However, such detailed information currently is not subject to disclosure by
companies in the Compensation Discussion and Analysis (CD&A) section of their
proxy statement, but may be forthcoming as the SEC continues to fine tune and,
in some cases, heighten its reporting requirements.
CONCLUSION
The tools on which compensation decision makers typically rely, including tally
sheets and competitive analyses, provide a solid and necessary set of data but repre-
sent information that is somewhat limited and static. Augmenting such perspectives
with a holistic pay analysis allows companies to engage in a deeper and more
meaningful analysis of the appropriateness and effectiveness of compensation
plans and their potential outcomes, which can help companies make decisions
that are more thoughtful, well-reasoned and defensible to shareholders. ❚
AUTHOR
Melissa L. Means, CCP, is a managing director in Pearl
Meyer & Partner’s Boston office, where her areas of
expertise include total compensation strategy, executive
compensation, board of directors compensation, short-
and long-term incentive compensation strategy, and
design and governance practices. She specializes in
working with firms across all industries ranging in size
from small, pre-IPO organizations to large multinational
corporations. Means is a recognized speaker and writer
on various executive and board compensation topics.
Prior to joining Pearl Meyer & Partners, Means held
various executive compensation consulting positions
at Mercer and Towers Perrin. She also served as a
manager and director of compensation and benefits for
a large for-profit health-care organization and a pre-IPO
software firm. She holds a bachelor of business admin-
istration degree from Miami University of Ohio. She can
be reached at [email protected].
Survey Data Valuable Tool for Hiring in Tough Economy
In this time of continued belt tightening, company hiring needs to be smarter. That’s why
organizations need market intelligence to hire the right talent at the right price. To stay competi-
tive, employers need to know what other companies are paying in various labor markets.
When it comes to setting pay scales for senior-management roles, an overwhelming majority
of organizations (82 percent) use national survey data. A new WorldatWork survey, Job Evalu-
ation and Market-Pricing Practices, shows that compensation managers rely on industry data
for sales positions and local data for administrative or production jobs. Market pricing, the HR
practice of analyzing the “going rate” for benchmark jobs in relevant labor markets to set pay,
has become the primary job-evaluation method in most organizations, especially when pricing
senior-level jobs. A majority (95 percent) of survey respondents indicated that pricing senior-level
jobs against the market was somewhat to very effective for attracting and retaining top talent.
In addition, the research found few organizations use compensation consultants to evaluate jobs.
Only 16 percent use them for senior-level jobs; the majority (67 percent) relies on the in-house
compensation manager or analyst. And the research also found that 80 percent to 90 percent
of responding organizations use at least two survey sources to price jobs against the market.
(www.worldatwork.org)
Telework Increasingly Popular Option at U.S. Employers
The number of U.S. employees who worked remotely at least one day per month increased
39 percent the past two years, from approximately 12.4 million in 2006 to 17.2 million in 2008,
according to WorldatWork. In its survey brief Telework Trendlines 2009, WorldatWork reports
that the sum of all teleworkers — employees, contractors and business owners — has risen
17 percent, from 28.7 million in 2006 to 33.7 million in 2008. In the five-year period since 2003, the
total number of once-a-month telecommuters in the United States has risen 43 percent — from
23.5 million to 33.7 million Americans. The survey found that the number of employee telecom-
muters in the United States increased 39 percent, from 12.4 million in 2006 to 17.2 million in 2008.
A shift is also reported among full-time telework to occasional telework. The number of employed
teleworkers who work remotely at least once a month grew, while the number of those who work
remotely almost every day decreased slightly. (www.worldatwork.org)
Layoffs Lead to Corporate Knowledge Drain
When workers walk out the door, often their corporate knowledge goes with them. A new study
by the Institute for Corporate Productivity (i4cp) found that 30 percent of respondents believe
they retain knowledge poorly or not at all when workers leave, 49 percent think they’re doing
only “OK” at preserving corporate knowledge and 20 percent think they are doing well or very
well in knowledge retention. Survey results also showed that 78 percent of respondents said their
organizations do not have a specific person or team responsible for knowledge-retention plans,
and 68 percent reported their companies don’t have a specific operating budget for knowledge
retention. The survey found that 61 percent of respondents said their companies do not have a
formal knowledge-retention initiative under way, 62 percent said they don’t measure the effective-
ness of their knowledge-retention efforts and 26 percent do so only to a small extent. According
to the survey, 63 percent of respondents said lack of time was the No. 1 reason hindering effective
knowledge-retention practices, 49 percent said their company does not offer enough financial
support for knowledge retention and 49 percent said lack of management support was a key
stumbling block. (www.i4cp.com)
Published Research in Total RewardsA review of total rewards, compensation, benefits and HR-management research reports.
(Compiled by the editors from the WorldatWork Newsline column at www.worldatwork.org.)
877-951-9191www.worldatwork.org
Contents © WorldatWork 2009. WorldatWork members and educational institutions may print 1 to 24 copies of any WorldatWork-published article for personal, non-commercial, one-time use only. To order 25 or more print presentation-ready copies, or an electronic copy for distribution to colleagues, clients or customers, contact Gail Hallman, [email protected] at Sheridan Press, 717-632-3535, ext. 8175. To order full copies of WorldatWork publications, contact WorldatWork Customer Relationship Services, [email protected], 877-951-9191.
Second Quarter 2009
79 Second Quarter | 2009
Health-Care Cost Increases Stagnant, CDHP Plans Up
U.S. employers expect health-care cost increases to remain at 6 percent, and more companies
plan to adopt consumer-directed health plans (CDHP) next year in an effort to control cost
increases, according to a recent survey. The survey by Watson Wyatt found that the median
rate of health-cost increases is expected to remain at 6 percent in 2009, although it is nearly
twice the rate of inflation. Fifty-one percent of companies offer their workers a CDHP, which
is up from 47 percent in 2008; 8 percent are expected to adopt a CDHP by 2010. The survey
also found that companies with at least half of their workers enrolled in a CDHP have a two-
year cost trend (4.6 percent) that is 25-percent lower than non-CDHP sponsors (6.1 percent).
(www.watsonwyatt.com)
Canadian Baby-Boomer Business Owners Delay Retirement
Due to Recession
The recession is now leading business owners to put off their retirement. A recent survey by the
Royal Bank of Canada about registered retirement savings plans found that more than 37 percent
of Baby Boomers who own their own business are planning to delay their retirement because
of the current economic conditions. The survey found that 28 percent of all Baby Boomers said
they planned to delay retirement. Survey results show that 43 percent of respondents said they
will put off retirement for a year or two, 37 percent said they would continue to work for three to
five years longer than initially planned and 9 percent were unsure. Thirty-two percent of retiring
Baby Boomer business owners plan to never fully retire, compared to 13 percent of average
Boomers; and 37 percent of retiring Boomer entrepreneurs expect to be completely retired at
age 65, compared to 47 percent of the Canadian Boomer average. (www.rbcroyalbank.com)
Board Members to Get Double-Digit Raises for Third Year
Individual directors and full boards of directors will see their third year of double-digit increases
in compensation. According to The Corporate Library’s Annual Director Pay Survey: Director
Pay 2008 the median increase in total board compensation was just under 11 percent, and the
median increase in compensation for individual directors was almost 12 percent.
The survey also found:
❚ Median total board compensation for S&P 500 firms is more than $2 million.
❚ Median total compensation for individual directors of S&P 500 companies is just under
$200,000.
❚ In contrast to their CEO colleagues, compensation for directors in the S&P 500 did not
increase by more than that for directors of smaller companies.
❚ Company size is the greatest influence on board and director compensation.
The report also compares total board compensation and director compensation policy at some
of the most prominent financial-services companies that were involved in the subprime lending
crisis. The survey is based on compensation data from more than 3,000 public companies and
23,000 directors. (www.thecorporatelibrary.com)
Defined Contribution Plans Favored for Retirement
Workers are increasingly seeing defined contribution (DC) plans — 401(k)-type plans — as their
primary retirement plan type. About two-thirds of workers said DC plans are their most important
plan for retirement, according to a new study by the Employee Benefit Research Institute (EBRI).
The study’s key findings: Overall, 67.1 percent of participants in a retirement plan had a defined
contribution plan as their primary plan in 2006; this is more than double the level found in 1988;
correspondingly, a smaller percentage of workers had a defined benefit retirement plan as their
primary plan: 30.9 percent in 2006, substantially lower than the 56.7-percent level found in 1988.
In addition, 30.1 percent of nonagricultural wage and salary workers age 16 and over had a salary
reduction plan (such as 401(k) plans) that they considered as their primary retirement plan in
2006, compared with just 7.5 percent in 1988. (www.ebri.org)
80 WorldatWork Journal
Nearly Half of HR Professionals Plan to Delay Retirement
HR professionals have joined the ranks of employees who plan to delay retirement, with nearly
half of surveyed respondents indicating such. The 15th annual “Top Five Total Rewards Priori-
ties” survey by Deloitte and the International Society of Certified Employee Benefit Specialists
(ISCEBS) found that 44 percent of respondents plan to delay retirement; 76 percent of respon-
dents said they are delaying retirement so they can actually afford retirement. Survey results
show that 48 percent of respondents plan to participate in wellness and disease-management
programs to maximize their current health status, 44 percent plan to increase their level of
contributions to their private savings, 35 percent plan to initiate formal retirement planning and/
or estate planning through resources other than through their employer, and 33 percent expect to
increase contributions to their qualified retirement plans like 401(k)s. The survey also found that
56 percent of respondents said their No. 2 personal concern was the investment performance of
their 401(k) or other employer-sponsored savings/profit-sharing plan, and 55 percent said their
No. 2 concern was their ability to earn additional rewards that allow them to stay on top of
inflation and advance in real economic terms. (www.deloitte.com or www.iscebs.org)
Workplace Conflict Can Harm, Help Companies
A new poll reveals the most common causes of workplace conflict are warring egos and person-
ality clashes, poor leadership, lack of honesty, stress and clashing values. The poll of more
than 350 HR professionals in Canada, conducted by Psychometrics Canada, found that in
many cases workplace conflict has severely crippling effects on productivity, staff engagement
and working relationships. The poll also found that when conflict is properly managed, it can
benefit organizations and employees by leading to better solutions to problems. Further, the poll
found that 76 percent of respondents have seen conflict result in personal insults and attacks,
43 percent have witnessed someone being fired, 81 percent have seen conflict lead to someone
leaving the organization, and 77 percent have seen conflict result in sickness or absence.
(www.psychometrics.com)
Workers Continue to Stress about Making Ends Meet, Retirement
The money woes continue for workers: A new report reveals that half of respondents are stressed
about making ends meet, and 59 percent are concerned that money from their pensions and 401(k)s
won’t be there when they need it. According to research from Boston College, workers lost about
$2 trillion worth of stock value held in individual retirement accounts, 401(k)s and other defined
contribution plans in 2008. The Workplace Options Job Satisfaction Survey found:
❚ Seventy-four percent of workers are currently stressed by their jobs.
❚ Of the 50 percent of workers stressed due to financial concerns, 65 percent were Hispanic,
54 percent black and 47 percent white.
❚ Workers in the manufacturing industry reported the highest level of financial stress at
69 percent, followed by 55 percent of workers in finance and real estate.
❚ While only 22 percent of workers nationwide said financial stress is hurting their ability to
do their job, 41 percent of workers in manufacturing and 36 percent in finance and real
estate said it was.
❚ Government workers are experiencing comparatively low levels of stress, with only
44 percent reporting they are stressed about their personal finances.
❚ Women and men were equally worried about retirement savings.
Survey Methodology
The national survey on financial stress, conducted by the North Carolina firm of Public Policy
Polling Jan. 17-20, 2009, polled 568 adults. The survey has a margin of error of +- 4.1 percent.
(www.workplaceoptions.com)
81 Second Quarter | 2009
Workers Believe Employer-Sponsored Wellness Benefits Lower Health Costs
Fifty-one percent of American workers believe wellness benefits offered by their employer are
successful at lowering health-care costs, a new study found. Despite this, the “Principal Financial
Well-Being Index” found that two-thirds of workers (up from 60 percent one year ago) expect
increased premiums this year ,and 43 percent of workers (up from 38 percent one year ago) expect
to pay higher deductibles. The survey found that, when offered, 79 percent of workers (up slightly
from 74 percent one year ago) take advantage of educational tools and resources offered by their
employer, while 77 percent (up from 59 percent) participate in blood sugar and cholesterol screen-
ings. The survey also found that 53 percent of respondents said better overall physical health and
38 percent said lower personal health-care costs are the most encouraging reasons to participate
in a wellness program, if offered by their employer. More than one-third (38 percent) said receiving
an incentive or reward would encourage them to participate in a wellness program. Sixteen
percent of workers indicated they have access to educational tools or resources at their work
site; 13 percent receive fitness-center discounts; and 11 percent have access to on-site health
screenings, educational wellness seminars and on-site fitness facilities. (www.principal.com)
Long-Term Incentive Grants Expected to Continue to Decline
A recent survey found that 2009 long-term incentive (LTI) grant values are likely to decline more
than 10 percent overall, with companies that actually change their grant values doing so by
decreasing their grant values by more than 20 percent at median. The Quick-Take Survey by
ExeQuity also found that a number of companies had not yet secured compensation committee/
board approval for their 2009 equity grants, and those companies were anticipating a decrease of
more than 30 percent at median. Survey results show: 2009 long-term incentive values will likely
fall substantially; total 2009 LTI grant values across general industry (including companies that
do not change grand values and those that do) likely will show a fall of greater than 10 percent
and for those changing their grant values, the median 2009 LTI grant value will fall 20 percent or
more. The survey also found that approximately 62 percent of respondents intend to hold grant
values steady, while 38 percent indicated that their values would change; the median change was
a decrease of 20 percent in their LTI values. Survey results show the greatest declines in grant
values are among those companies that have yet to approve 2009 awards. The survey results
also suggest that aggregate market data will show a decrease of more than 10 percent in the LTI
values awarded in 2009. (ww.exqty.com)
Asset Management Fees Face Challenges in 2009
Asset management fees remained stable in 2008 but are likely to be under pressure in 2009,
according to a report. Mercer’s 2008 Asset Manager Fee Survey found that alternative investment
strategies have the highest fees for each dollar of investor capital allocated. Survey results show
that the most expensive mainstream category was global emerging markets equity, with median
fees in the sector averaging about 0.9 percent. Median fees for Eastern European equity and
Chinese equity were similarly high, according to the report. According to survey results among
segregated large cap/all cap equity products, Canadian equity was the cheapest, with median
fees ranging from 0.25 percent to 0.35 percent. Australia, New Zealand and the United States’
equity averaged around 0.4 percent to 0.5 percent. United Kingdom equity all-cap products are
nearly 0.6 percent. Asia, Europe, Japan and global equity continue to be the most expensive,
with median fees averaging 0.5 percent to 0.7 percent. (www.mercer.com)
82 WorldatWork Journal
U.K. Companies Fear Impact of DB Plans on Their Business
A new pension survey shows that nearly 90 percent of companies in the United Kingdom
with a defined benefit (DB) pension plan are concerned about its impact on their businesses.
The PricewaterhouseCoopers survey polled 98 companies and found that firms plan to take
greater control of pension funding negotiations with trustees. Survey results show a significant
increase in companies’ desire to reduce or remove their pension risks despite constraints like
cost, lack of cash and insufficient capacity from insurance providers to which these risks may
be transferred. (www.pwc.com)
Weight-Loss Programs Key Component of Wellness Initiatives
Of those organizations that offer wellness programs, nearly half offer a weight-loss program,
a recent survey found. When asked about their primary reason for offering a wellness program,
46 percent of respondents cited controlling health-care costs followed by 35 percent who said
they want to help workers enjoy better overall physical health.
The survey also found:
❚ Common screening and treatment initiatives are flu-shot programs (82 percent), health-risk
assessments (73 percent) and health screenings (69 percent). Sixty percent of program
sponsors offer smoking-cessation programs.
❚ In the area of fitness and nutrition, the most prevalent initiatives include weight-loss/
management programs (49 percent), wellness competitions like walking and fitness chal-
lenges (48 percent), and healthy food choices in the cafeteria or snack areas (42 percent).
About one-third of program sponsors offer on-site fitness equipment (33 percent) or off-site
fitness programs/subsidies (32 percent).
❚ Common approaches for disseminating health and wellness information include online
resources (61 percent), health fairs (57 percent), nurse-advice hotlines (53 percent) and
wellness newsletters (52 percent).
❚ The survey found that four-fifths of wellness program sponsors use incentives like prizes
and raffles (39 percent), gift cards (32 percent), cash rewards (22 percent) and insurance-
premium reductions (22 percent).
While only 13 percent of respondents said they measure the return on investment (ROI) of their
program, about half of respondents say they benefit through improved worker health and morale.
Of those employers who do measure ROI, 78 percent reported a positive return, with the majority
seeing returns in the range of $1.01 to $4 for each dollar spent. (www.ifebp.org)
Survey Finds Keys to Managing Off-Site Employees
A new report shows that as the recession deepens and the job market seems to be getting worse,
employers are working hard to optimize their efficiency and engagement with all employees —
including off-site employees. The Conference Board’s “Meeting the Challenges of a Dispersed
Workforce: Managing Across Language, Culture, Time and Location” found that to make managing
an off-site employee a mutually rewarding experience, several factors must be taken into consid-
eration. Major findings of this study include:
❚ More than 60 percent of the respondents surveyed agreed that managing same-site
employees is easier than managing distance employees.
❚ Nearly 80 percent of the respondents believe that the extra costs of enabling employees
to work at a distance do pay off.
❚ Managers’ perceptions of the job they’re doing differs from that of distance employees —
53 percent of managers surveyed reported spending more than one hour a week developing
working relationships with distance employees, whereas only 18 percent of employees
believed that their managers spent that much time with them.
❚ Five practices were found to be shared among effective distance teams: in-person meet-
ings; clear agreements on accessibility; good use of group software; adequate company
support; and clearly defined roles for members. (www.conference-board.org)
83 Second Quarter | 2009
IT Industry Employees Say They Want to Change Jobs in 2009
Nearly all surveyed workers in the IT industry indicated they plan to look for better career opportu-
nities this year. The latest research by The IT Job Board found that almost nine in 10 techies plan
to change their job in 2009. More than half said they wanted to find better career opportunities
and 45 percent said they wanted to look for a new job in order to earn more money. The survey
also found that two-thirds of techies plan to further develop their technical skills through a new
job, and more than half said a career change would help them improve their work-life balance.
Survey results show that of the 11 percent of respondents who do not plan to look for a new job
this year, 46 percent said it was because they were happy with their current job, and 36 percent
said the volatile economic climate would prevent them from looking. (www.theitjobboard.co.uk)
Expat Nonessentials Being Cut To Reduce International Business Costs
More than three-quarters of survey respondents are cutting back on nonessential business
travel in an effort to reduce costs in the international arena, according to ORC Worldwide’s Flash
Survey: Cost Savings Initiatives survey that asked employers about their plans to reduce costs
in the international arena. One way to save money if a company has developmental/training
and early career assignment is to dispense with some of the higher-priced expatriate extras by
implementing tiered policies, ORC suggests. Some companies have implemented cost-effective
cost-of-living allowances in host locations where high-quality goods and services are readily
available, according to ORC. Where possible and depending on facts like job responsibilities
and family size on location, some employers are implementing less costly housing policies like
eliminating assistance with home-country property management. (www.orcworldwide.com)
Number of Companies Freezing Salaries May Continue to Rise
One-quarter of U.S. companies surveyed have instituted a salary freeze, a number that may rise
to one-third by the time 2009 budgets are finalized. According to a Mercer survey, the wors-
ening economy is to blame for the reshaping of corporate forecasts. The Mercer survey found
that organizations that still plan increases for 2009 have trimmed these by 0.5 percent from the
level cited in October. Three-quarters of respondents are making or considering a base salary
increase this year and are budgeting 3.2 percent overall, which is down nearly 0.5 percent from
mid-October projections of 3.5 percent. In a survey three months ago, 24 percent of respon-
dents planned to reduce their base-pay budgets from their April projections by 0.5 percent,
and 18 percent planned to increase their budgets from their April projections to an average of
3.8 percent. Twelve to 18 months ago, just 5 percent of companies planned to freeze salaries for
all or a portion of their staff, according to Mercer. (www.mercer.com)
Canadian Cite Health Issues as Key Reason for Retiring
One-quarter of retired workers in Canada cited health issues as the main reason for their retire-
ment, and 9 percent of preretired Canadians believe that health issues will cause them to
retire, found an annual poll. The 19th Annual RBC RRSP poll found that qualifying for a pension
(24 percent) and company downsizing (13 percent) were other top reasons for retirement. According
to survey results, when retirees were asked what the best gift they could receive in retirement was,
53 percent said good health and 30 percent said no financial worries. For those who have yet
to retire, 38 percent said no financial worries and 34 percent said good health. The survey also
found that 51 percent of retired Canadians have changed their lifestyle to ensure a healthy retire-
ment, 80 percent of those who did change their lifestyle said they have a better diet, 69 percent
are exercising more and 64 percent are attending regular medical appointments. (www.rbc.com)
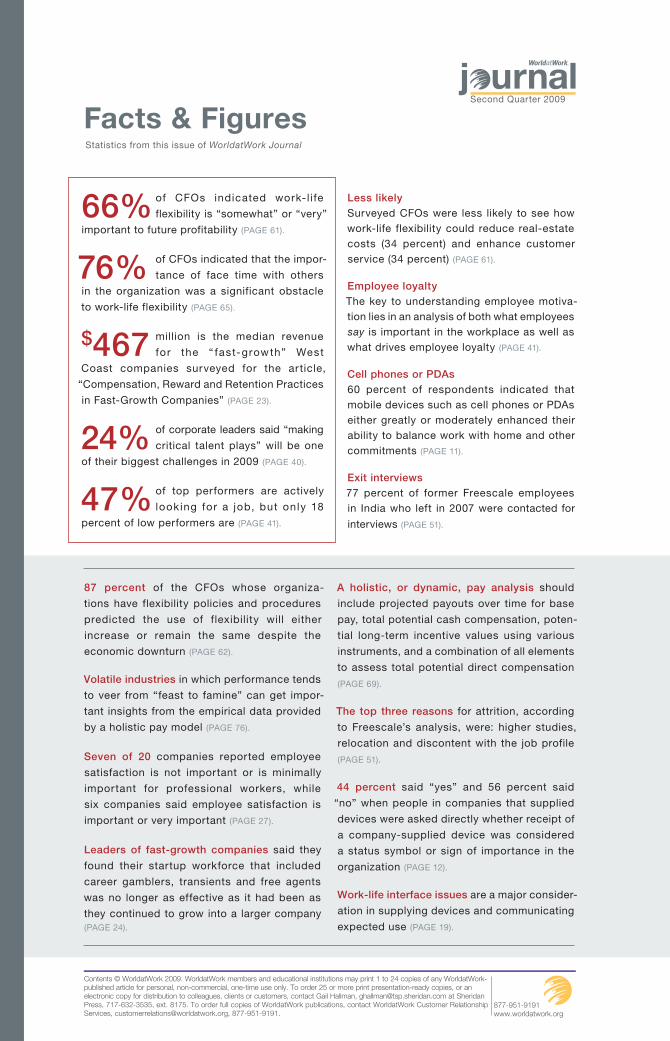
Facts & Figures Statistics from this issue of WorldatWork Journal
87 percent of the CFOs whose organiza-
tions have flexibility policies and procedures
predicted the use of flexibility will either
increase or remain the same despite the
economic downturn (PAGE 62).
Volatile industries in which performance tends
to veer from “feast to famine” can get impor-
tant insights from the empirical data provided
by a holistic pay model (PAGE 76).
Seven of 20 companies reported employee
satisfaction is not important or is minimally
important for professional workers, while
six companies said employee satisfaction is
important or very important (PAGE 27).
Leaders of fast-growth companies said they
found their startup workforce that included
career gamblers, transients and free agents
was no longer as effective as it had been as
they continued to grow into a larger company
(PAGE 24).
A holistic, or dynamic, pay analysis should
include projected payouts over time for base
pay, total potential cash compensation, poten-
tial long-term incentive values using various
instruments, and a combination of all elements
to assess total potential direct compensation
(PAGE 69).
The top three reasons for attrition, according
to Freescale’s analysis, were: higher studies,
relocation and discontent with the job profile
(PAGE 51).
44 percent said “yes” and 56 percent said
“no” when people in companies that supplied
devices were asked directly whether receipt of
a company-supplied device was considered
a status symbol or sign of importance in the
organization (PAGE 12).
Work-life interface issues are a major consider-
ation in supplying devices and communicating
expected use (PAGE 19).
Less likely
Surveyed CFOs were less likely to see how
work-life flexibility could reduce real-estate
costs (34 percent) and enhance customer
service (34 percent) (PAGE 61).
Employee loyalty
The key to understanding employee motiva-
tion lies in an analysis of both what employees
say is important in the workplace as well as
what drives employee loyalty (PAGE 41).
Cell phones or PDAs
60 percent of respondents indicated that
mobile devices such as cell phones or PDAs
either greatly or moderately enhanced their
ability to balance work with home and other
commitments (PAGE 11).
Exit interviews
77 percent of former Freescale employees
in India who left in 2007 were contacted for
interviews (PAGE 51).
66% of CFOs indicated work-l i fe
flexibility is “somewhat” or “very”
important to future profitability (PAGE 61).
76% of CFOs indicated that the impor-
tance of face time with others
in the organization was a significant obstacle
to work-life flexibility (PAGE 65).
$467 million is the median revenue
for the “ fast-growth” West
Coast companies surveyed for the article,
“Compensation, Reward and Retention Practices
in Fast-Growth Companies” (PAGE 23).
24% of corporate leaders said “making
critical talent plays” will be one
of their biggest challenges in 2009 (PAGE 40).
47% of top performers are actively
looking for a job, but only 18
percent of low performers are (PAGE 41).
877-951-9191www.worldatwork.org
Contents © WorldatWork 2009. WorldatWork members and educational institutions may print 1 to 24 copies of any WorldatWork-published article for personal, non-commercial, one-time use only. To order 25 or more print presentation-ready copies, or an electronic copy for distribution to colleagues, clients or customers, contact Gail Hallman, [email protected] at Sheridan Press, 717-632-3535, ext. 8175. To order full copies of WorldatWork publications, contact WorldatWork Customer Relationship Services, [email protected], 877-951-9191.
Second Quarter 2009