Embed Size (px)
Citation preview

© IGD 2012
James Tupper, ECR Learning & Change Manager, IGD
11.30 – 11:50 Main Hall, ECR Baltic Forum (Vilnius), 8th November 2012
© IGD 2012
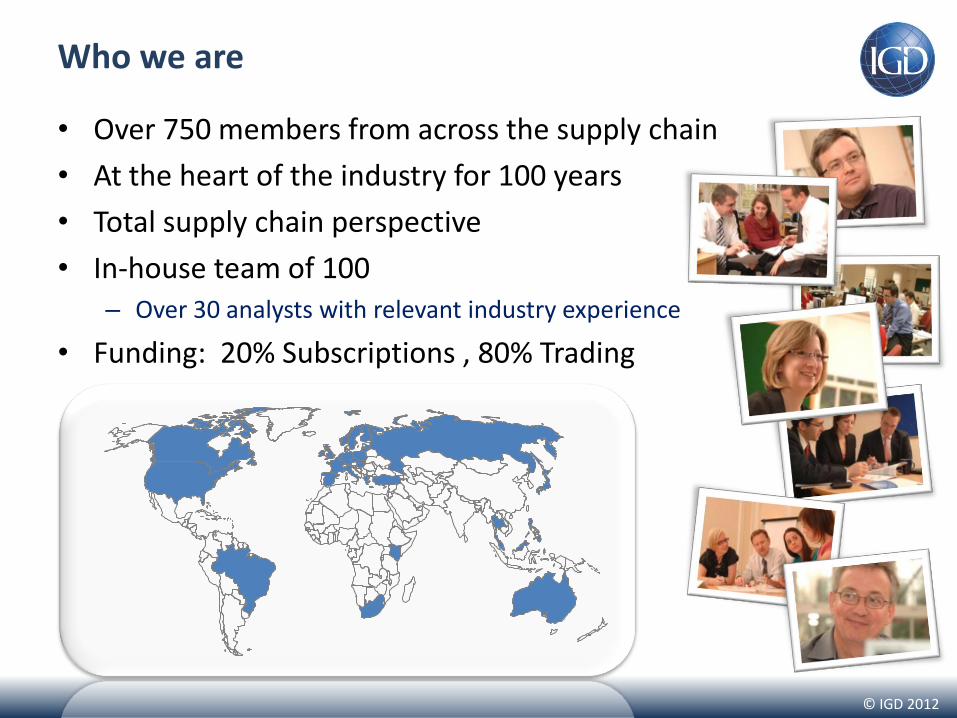
Who we are
• Over 750 members from across the supply chain
• At the heart of the industry for 100 years
• Total supply chain perspective
• In-house team of 100 – Over 30 analysts with relevant industry experience
• Funding: 20% Subscriptions , 80% Trading
© IGD 2012
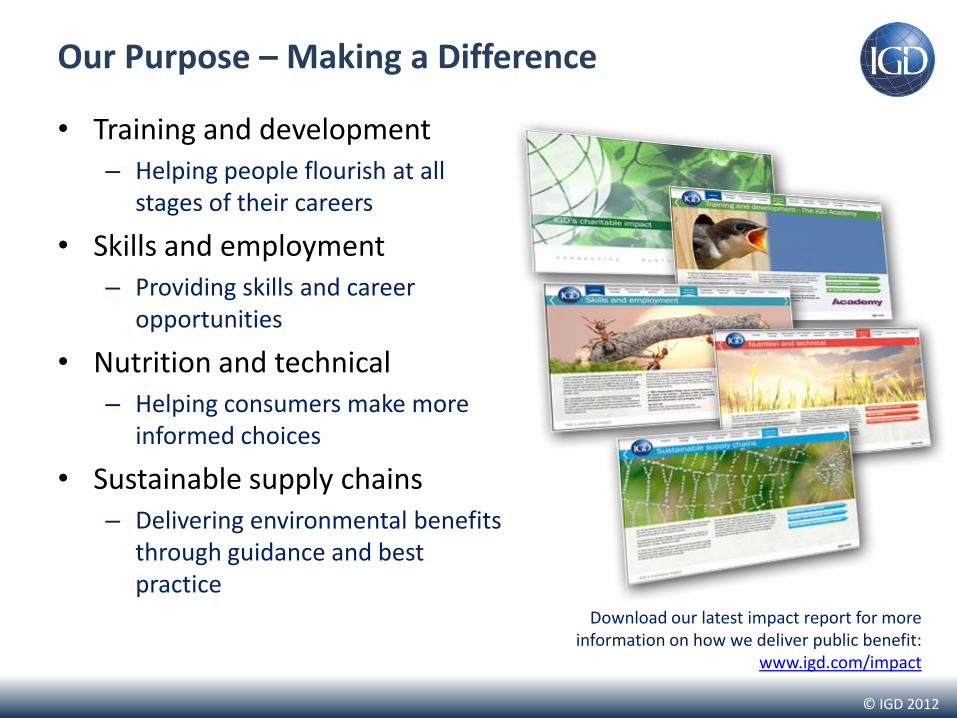
Our Purpose – Making a Difference
• Training and development – Helping people flourish at all
stages of their careers
• Skills and employment – Providing skills and career
opportunities
• Nutrition and technical – Helping consumers make more
informed choices
• Sustainable supply chains – Delivering environmental benefits
through guidance and best practice
Download our latest impact report for more information on how we deliver public benefit:
www.igd.com/impact
© IGD 2012
Agenda
• Food and packaging waste in the supply chain: preventing it from occurring in the first place
• Performance gaps and their scale. Why the gaps have grown and why opportunities to improve have not been exploited
• How some in the industry are challenging assumptions, driving change, demonstrating achievements and influencing the framework within which it operates
• Hard hitting case studies hot off the press from some of the most proactive FMCG - retail businesses in UK
How to Improve Performance Together will be fully addressed in the special workshop from 13.30 to 14:55 in the Secondary Hall
11.30 – 11:50 Main Hall, ECR Baltic Forum (Vilnius), 8th November 2012

© IGD 2012
Sustainability: the three pillars or the triple bottom line
Global Reporting Initiative Sustainability Performance Indicators
Social
Economic Environmental
Sustainable
Viable
Equitable Bearable
• Materials
• Energy
• Water
• Biodiversity
• Emissions, effluents and waste
• Products and services
• Labor Practices and Decent Work
• Human Rights
• Society
• Product Responsibility
• Economic performance
• Market presence
• Indirect economic impacts
• Compliance
• Transport
• Overall
Living within our means so future
generations can meet
their needs

© IGD 2012
Waste in the supply chain

© IGD 2012
• How may tonnes of Food and Drink waste do you need to Recover to be equivalent in Greenhouse Gas terms to Preventing one tonne of Food and Drink waste?
Adapted from Defra/DECC’s Greenhouse Gas Conversion Factors for Company Reporting
Prevention Recovery vs. Multipliers (CO2e)
Prevent / Redistribute
Compost Prevent /
Redistribute Anaerobic Digestion
> 8.3 > 6.6

© IGD 2012
1 2 3 4 5 6 7 8 9
Aluminium cans and foil
Wood
Steel Cans
Textiles
Board (78% crgt, 22% crtnbrd)
Glass (colours seperated)
Plastic film (incl bags)
Plastic rigid (incl bottles)
Glass (mixed colours)
Food and Drink Waste (AD)
Food and Drink Waste (Compost)
1.1
1.2
1.6
1.6
2.0
2.3
2.4
2.8
4.1
6.6
8.3
Prevention vs. Recycling Multiplier (CO2e)*
* Net Benefit of Saved Production Emissions Versus Landfill vs. Net Benefit of Recycling Versus Landfill data from July 2011 Guidelines to Defra/DECC’s Greenhouse Gas Conversion Factors for Company Reporting
Government’s new tougher UK packaging recovery rate targets 2012 2017
Overall 74% 79%
Glass 81% 64% re-melt
Plastic 32% 57%
Paper 69.5%
Steel 71% 76%
Wood 22%
Aluminium 40% 55%

© IGD 2012
Agenda
• Food and packaging waste in the supply chain: preventing it from occurring in the first place
• Performance gaps and their scale. Why the gaps have grown and why opportunities to improve have not been exploited
• How some in the industry are challenging assumptions, driving change, demonstrating achievements and influencing the framework within which it operates
• Hard hitting case studies hot off the press from some of the most proactive FMCG - retail businesses in UK
How to Improve Performance Together will be fully addressed in the special workshop from 13.30 to 14:55 in the Secondary Hall
11.30 – 11:50 Main Hall, ECR Baltic Forum (Vilnius), 8th November 2012
© IGD 2012
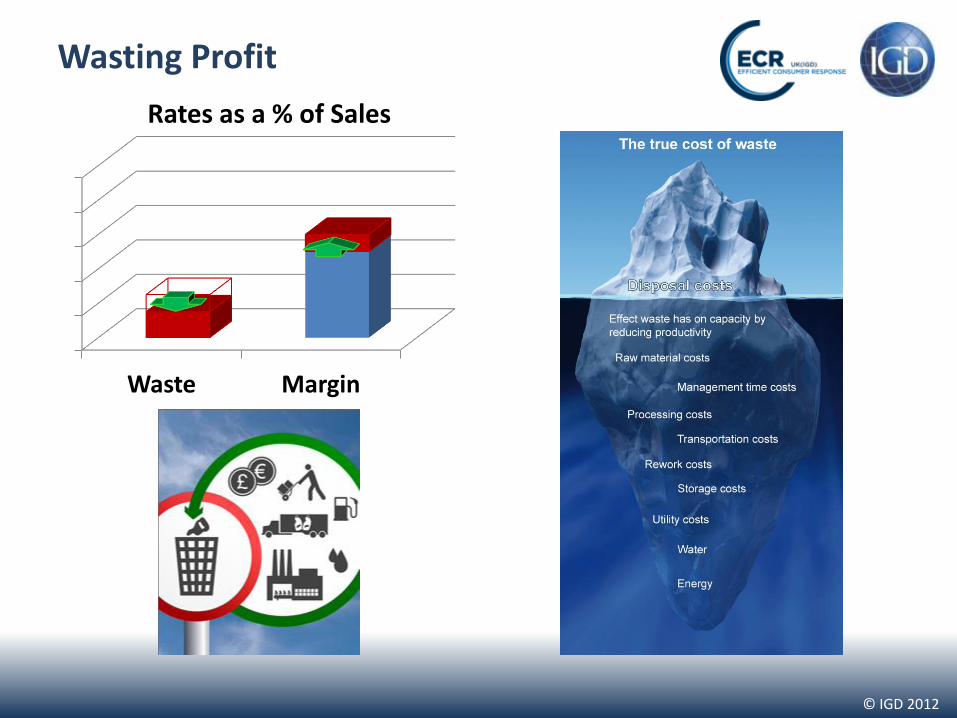
Wasting Profit
Waste Margin
Rates as a % of Sales
Waste Margin
Rates as a % of Sales
© IGD 2012
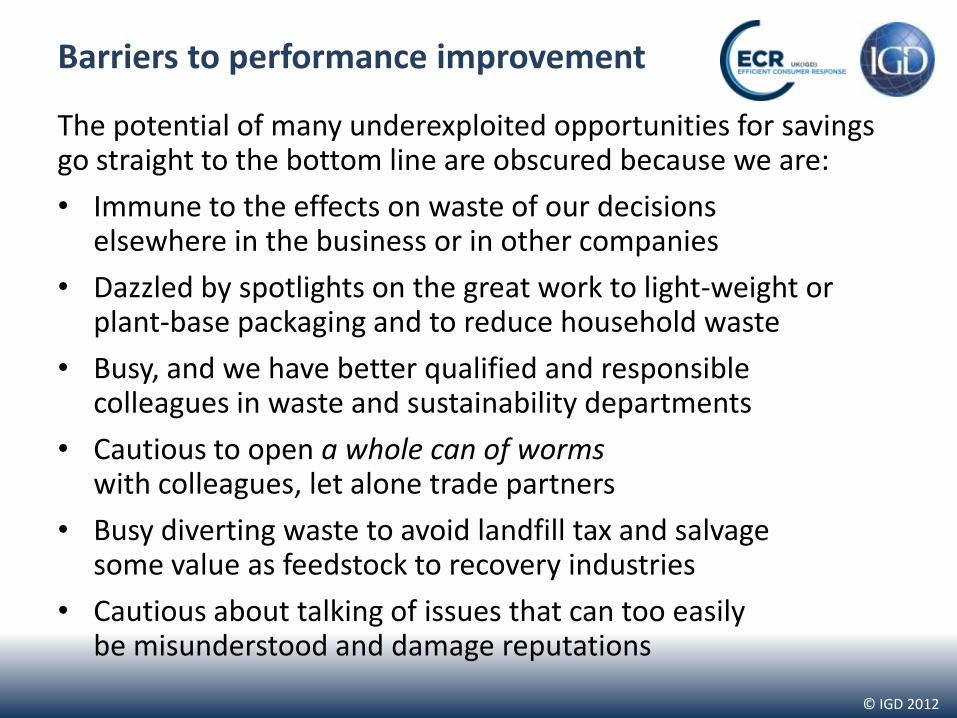
Barriers to performance improvement The potential of many underexploited opportunities for savings go straight to the bottom line are obscured because we are:
• Immune to the effects on waste of our decisions elsewhere in the business or in other companies
• Dazzled by spotlights on the great work to light-weight or plant-base packaging and to reduce household waste
• Busy, and we have better qualified and responsible colleagues in waste and sustainability departments
• Cautious to open a whole can of worms with colleagues, let alone trade partners
• Busy diverting waste to avoid landfill tax and salvage some value as feedstock to recovery industries
• Cautious about talking of issues that can too easily be misunderstood and damage reputations

© IGD 2012
Agenda
• Food and packaging waste in the supply chain: preventing it from occurring in the first place
• Performance gaps and their scale. Why the gaps have grown and why opportunities to improve have not been exploited
• How some in the industry are challenging assumptions, driving change, demonstrating achievements and influencing the framework within which it operates
• Hard hitting case studies hot off the press from some of the most proactive FMCG - retail businesses in UK
How to Improve Performance Together will be fully addressed in the special workshop from 13.30 to 14:55 in the Secondary Hall
11.30 – 11:50 Main Hall, ECR Baltic Forum (Vilnius), 8th November 2012
© IGD 2012
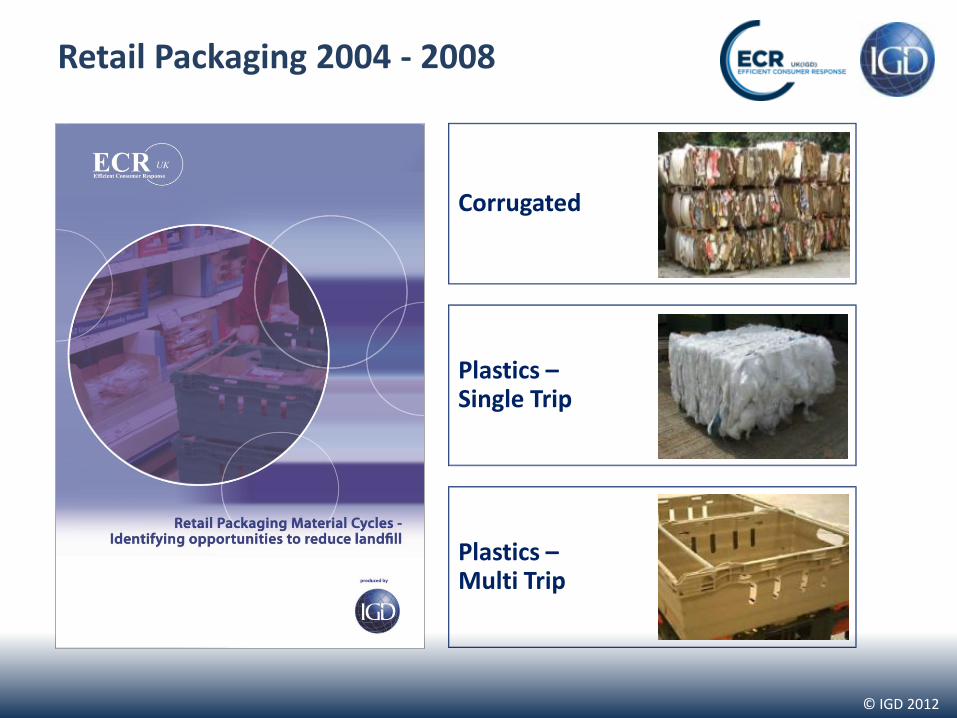
Retail Packaging 2004 - 2008
Plastics – Multi Trip
Plastics – Single Trip
Corrugated
© IGD 2012
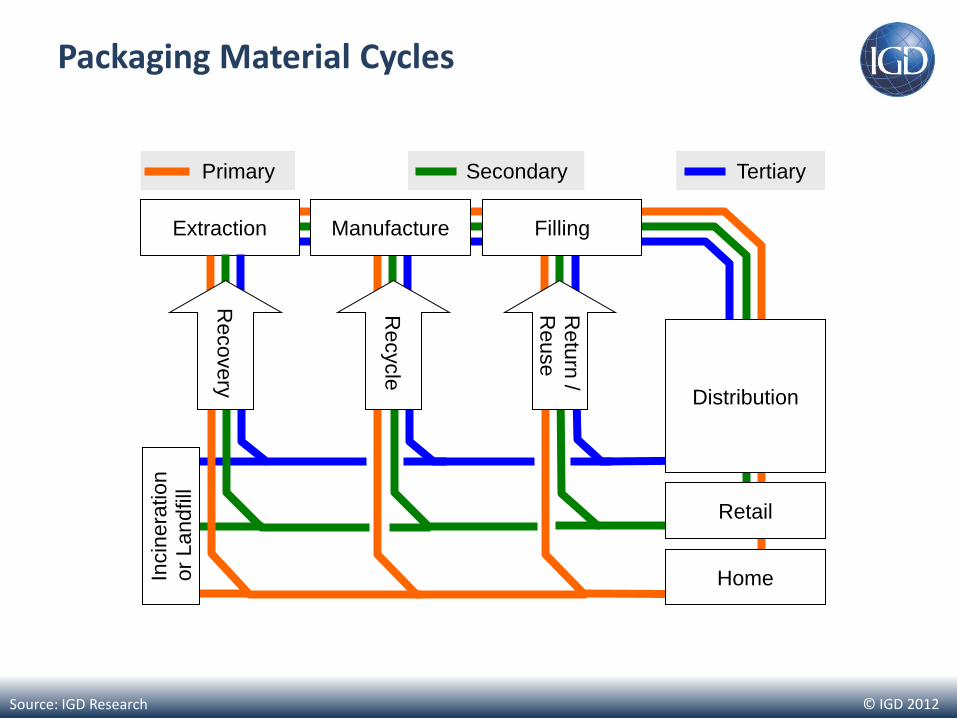
Packaging Material Cycles
Source: IGD Research
Home
Retail
Extraction Manufacture Filling
Distribution
Incin
era
tio
n
or
Landfill
Recovery
Retu
rn /
Reuse
Recycle
Tertiary Primary Secondary

© IGD 2012
Product and Packaging Waste 2010 -
• Customer Service Director
• Supply Chain Director
• Customer Supply Chain Manager
• Store Ordering Programme Manager
• Sustainability Manager
• Supply Chain Controller
• Customer Services Executive – Multiple
• Supply Chain Environment Manager
• Head of CSR & Corporate Affairs
• Fresh Supply Chain Controller
• Supply Chain Project Manager
• European Sustainability Director
• European Activity Management
• Operational Risk Manager UK & Ireland

© IGD 2012
Supply Chain Prod & Pack Waste (tonnes, 2009)
Returns Returns managed for suppliers
Redistribution / alternative markets
Fact
ory
In-G
ate
/ U
K P
ort
Recovery (including recycling and composting)
Recovery (including recycling and composting)
Redistribution / alternative markets
Manufacturers Supply Chain
Sewer / controlled water course
Dispose
Retailers Supply Chain
Dispose
Till Till
Red
uce to
Clear
Mark D
ow
ns
Arrows not to scale !
5,275 243

© IGD 2012
Struggling to see the Lines

© IGD 2012
IGD Waste Targets
150,000 tonnes Diverted from Landfill and Sewer by end 2012
≈ 10,000,000 wheelie bins
≈ 5,000,000 wheelie bins
75,000 tonnes Prevented or Redistributed by end 2012

© IGD 2012
Change-by-change reporting Identify
change & impact
See how improvement
achieved
Gauge return on
investment
Celebrate achievement
Share best
practice
Drive improvement
Broadsheet & broadcast
coverage
Inform consumers & government
Inspire trading partners
Get industry on front-foot

© IGD 2012
2010 Supply Chain Waste Submissions
75,000t waste Prevented or Redistributed 38,000t
150,000t waste Recovered or Recycled
115,000t

© IGD 2012
Types of initiatives of impact in 2010
The reported initiatives that prevented waste (or redistributed it to alternative markets) fell into one or more of the following categories:
• Design – of product and packaging to protect or prolong the product
• Range – selecting a new product range to minimise waste while increasing sales
• Forecast – to better deal with weather, new products and / or promotions
• Measure – focusing people's attention on preventing rather than managing waste
• Engage – engaging and motivating our teams to want to eliminate waste
• Process – accelerating the value adding flows of material and information
• Collaborate – working better together with trading partners to prevent waste
• Redistribute – via alternative markets for human or animal consumption
We also welcome reports about recovery / recycling initiatives that have diverted waste from, for example, landfill or sewer
1 2 3 4 5 1 2 3 4 5

© IGD 2012
Focus on Prevention
Definition of the “Five to Drive” based on survey of the root causes of waste
Design – of product and packaging design to protect or prolong the product
Range – selecting a new product range to minimise waste while increasing sales
Forecast – to better deal with weather, new products and promotions
Measure – focusing people's attention on preventing rather than managing waste
Engage – engaging and motivating our teams to want to eliminate waste
• Waste Prevention
• Waste Management

© IGD 2012

© IGD 2012
Collaboratative Waste Prevention Toolkit
© IGD 2012

© IGD 2012
The Five-to-Drive
Marketing
Commercial
Supply Chain
Operations
Sustainability Engage – engaging and motivating our teams to want to eliminate waste
Forecast – to better deal with weather, new products and promotions
Design – of product and packaging design to protect or prolong the product
Range – selecting a new product range to minimise waste while increasing sales
Measure – focusing people's attention on preventing rather than managing waste

© IGD 2012
Forecast – to better deal with weather, new products and promotions
Design – of product and packaging design to protect or prolong the product
So, how can we influence waste?
Engage – engaging and motivating our teams to want to eliminate waste
Range – selecting a new product range to minimise waste while increasing sales
Measure – focusing people's attention on preventing rather than managing waste
© IGD 2012

© IGD 2012
2010 and 2011 Supply Chain Waste Submissions
75,000t waste Prevented or Redistributed 70,000t
150,000t waste Recovered or Recycled
195,000t

© IGD 2012
Agenda
• Food and packaging waste in the supply chain: preventing it from occurring in the first place
• Performance gaps and their scale. Why the gaps have grown and why opportunities to improve have not been exploited
• How some in the industry are challenging assumptions, driving change, demonstrating achievements and influencing the framework within which it operates
• Hard hitting case studies hot off the press from some of the most proactive FMCG - retail businesses in UK
How to Improve Performance Together will be fully addressed in the special workshop from 13.30 to 14:55 in the Secondary Hall
11.30 – 11:50 Main Hall, ECR Baltic Forum (Vilnius), 8th November 2012

© IGD 2012
On-going Performance Improvement Programme
© IGD 2012
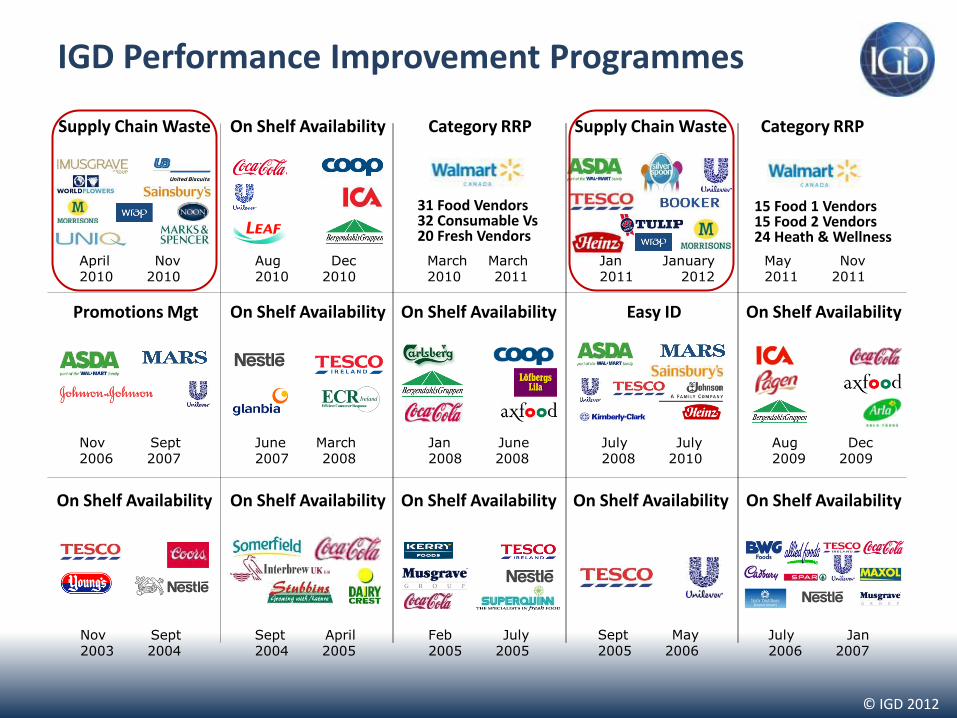
IGD Performance Improvement Programmes
March2011
March2010
31 Food Vendors 32 Consumable Vs 20 Fresh Vendors
Category RRP
Dec 2010
Aug 2010
On Shelf Availability
March 2008
June 2007
On Shelf Availability
April 2005
Sept 2004
On Shelf Availability
July 2005
Feb 2005
On Shelf Availability
May 2006
Sept 2005
On Shelf Availability
Jan 2007
July 2006
On Shelf Availability
Sept 2004
Nov 2003
On Shelf Availability
Sept 2007
Nov 2006
Promotions Mgt
June 2008
Jan 2008
On Shelf Availability
July 2010
July 2008
Easy ID
Dec 2009
Aug 2009
On Shelf Availability
Nov 2010
April 2010
Supply Chain Waste
January 2012
Jan 2011
Supply Chain Waste
Nov 2011
May 2011
Category RRP
15 Food 1 Vendors 15 Food 2 Vendors 24 Heath & Wellness
© IGD 2012
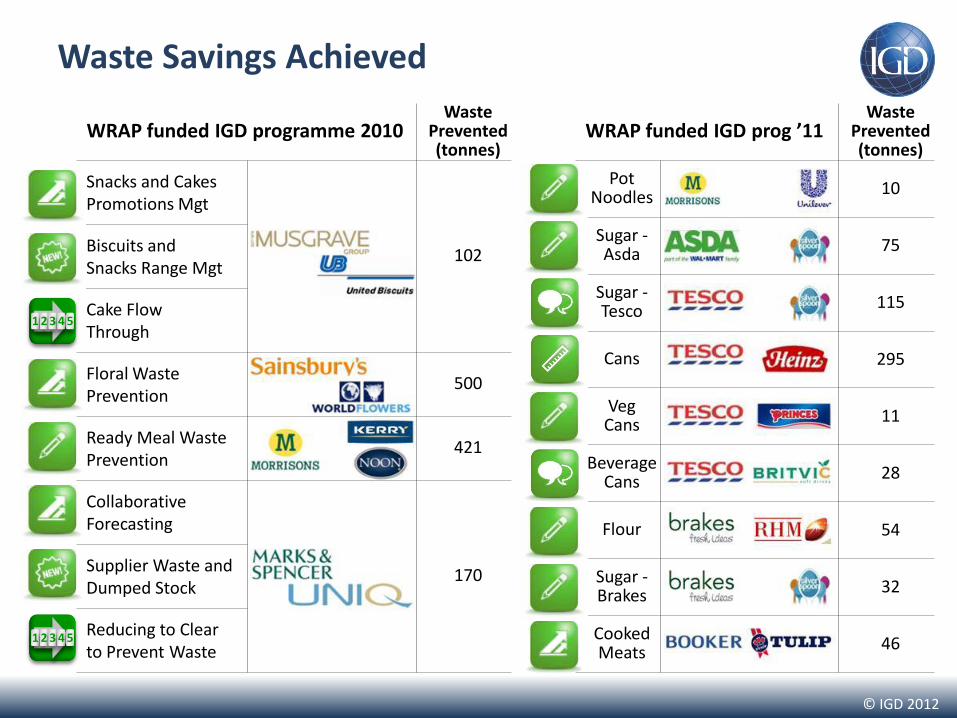
Waste Savings Achieved
WRAP funded IGD prog ’11 Waste
Prevented (tonnes)
Pot Noodles 10
Sugar - Asda 75
Sugar - Tesco 115
Cans 295
Veg Cans 11
Beverage Cans 28
Flour 54
Sugar - Brakes 32
Cooked Meats 46
WRAP funded IGD programme 2010 Waste
Prevented (tonnes)
Snacks and Cakes Promotions Mgt
102 Biscuits and Snacks Range Mgt
Cake Flow Through
Floral Waste Prevention
500
Ready Meal Waste Prevention
421
Collaborative Forecasting
170 Supplier Waste and Dumped Stock
Reducing to Clear to Prevent Waste
1 2 3 4 5
1 2 3 4 5 1 2 3 4 5
© IGD 2012
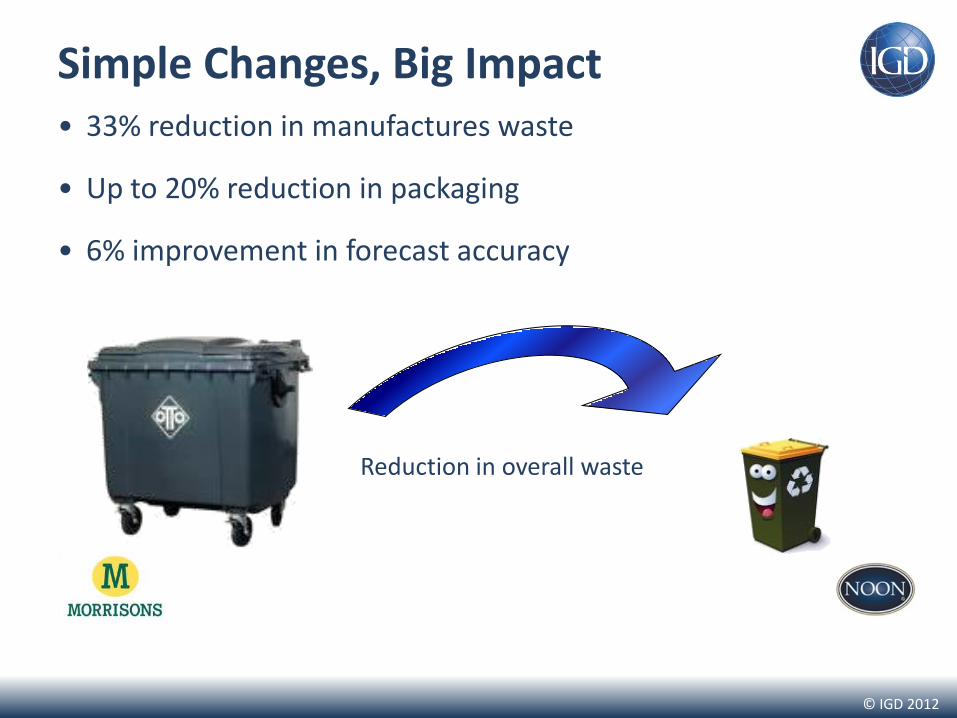
Simple Changes, Big Impact • 33% reduction in manufactures waste
• Up to 20% reduction in packaging
• 6% improvement in forecast accuracy
Reduction in overall waste
© IGD 2012
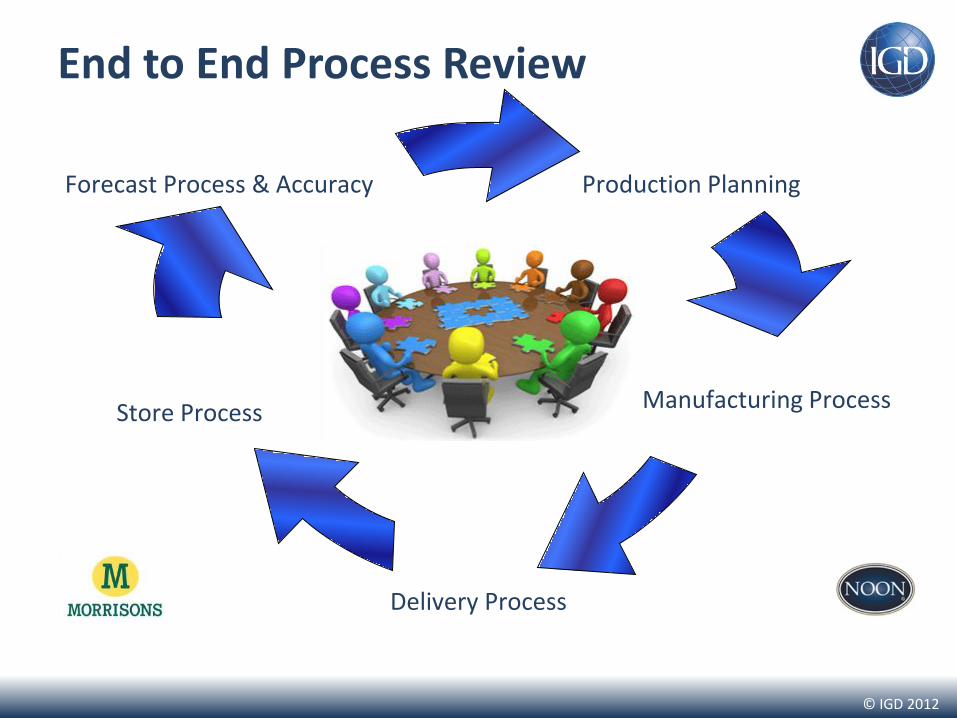
End to End Process Review
Forecast Process & Accuracy
Production Planning
Manufacturing Process
Delivery Process
Store Process
© IGD 2012
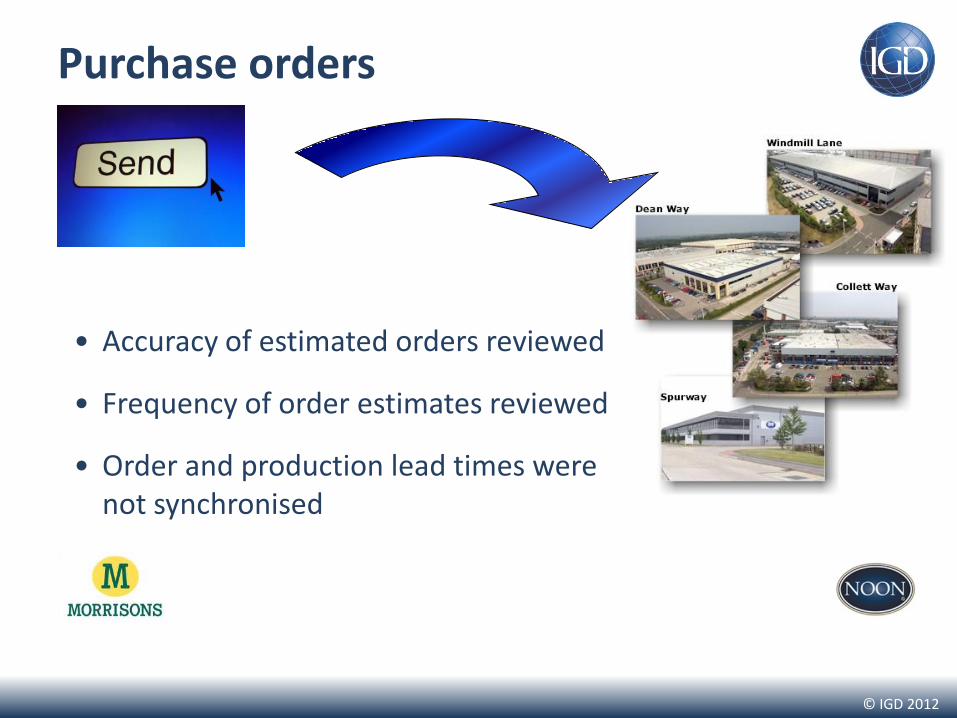
Purchase orders
• Accuracy of estimated orders reviewed
• Frequency of order estimates reviewed
• Order and production lead times were not synchronised
© IGD 2012
Improving Communication
• Communication was on a needs must basis
• Communication is now joined up and proactive not reactive
Effective communication is key!
© IGD 2012
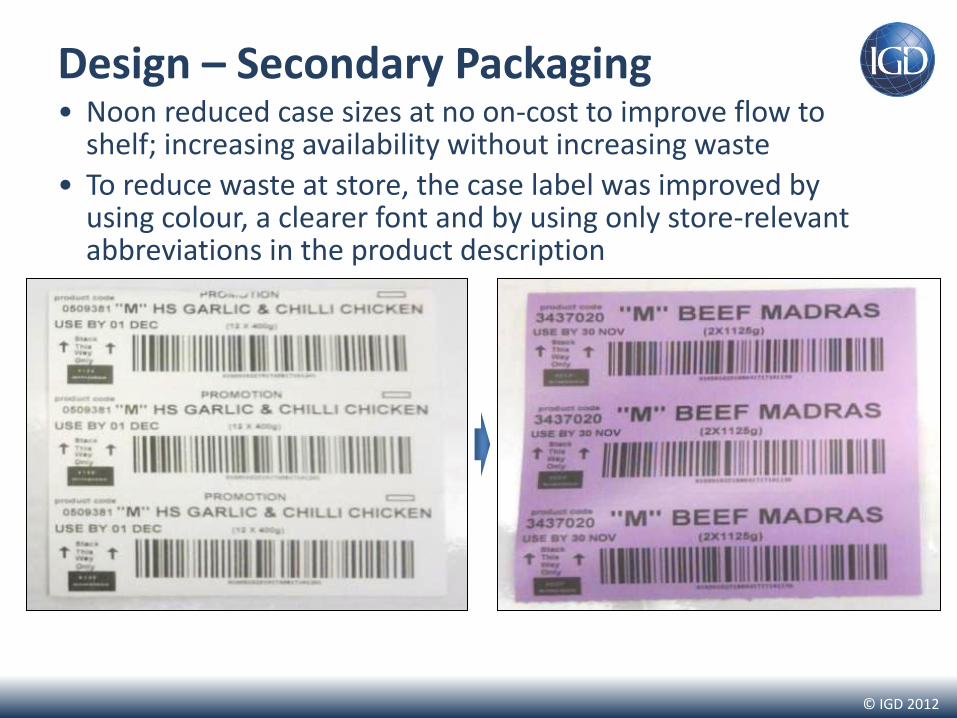
Design – Secondary Packaging • Noon reduced case sizes at no on-cost to improve flow to
shelf; increasing availability without increasing waste
• To reduce waste at store, the case label was improved by using colour, a clearer font and by using only store-relevant abbreviations in the product description

© IGD 2012
Design – Primary Packaging • Reduced in size by 20% saving material !
• The material added no value to the consumer !
• Easier to put on shelf and fit more on the shelf !
• Clearer for customers to understand what they are buying , sales prove this !
• Easier for the consumer to shop , in store consumers told us !
• Clearly stamped on the label ‘Meal-for-One’ , or meal for 2 , No confusion !
• Why did we not think of this before !

© IGD 2012
Design – Primary Packaging
• Keep meals for one in purple
• Move meals for two to clear bags to show off size better
• Move meals for four to a box to clearly display value for money
• Implement colours for different meals to make easier to shop
• Rearrange levels and adjust shelf heights
Not
the
best
What
good
looks
like

© IGD 2012
Ready meal waste
• improvement despite significant disruption
0
1000
2000
3000
4000
5000
6000
1 2 3 4 5 6 7 8 9 10 11 12 13 14 15 16 17 18 19 20 21 22 23
No
on
Rea
dy
Mea
l Was
te a
t M
orr
iso
ns
Week
New Product
Major Promotional
© IGD 2012
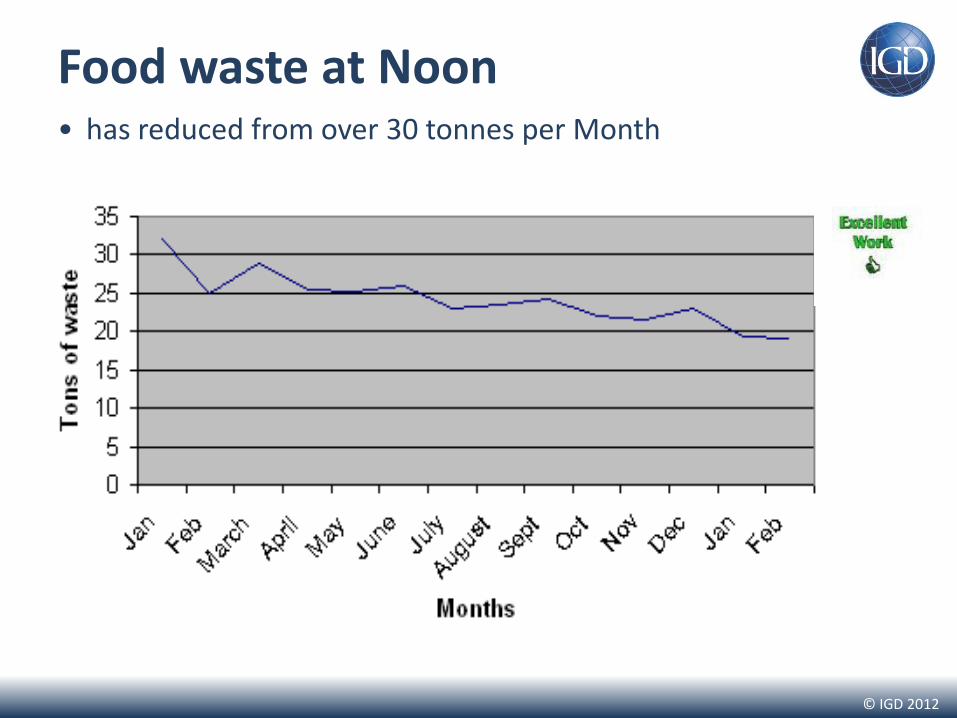
Food waste at Noon • has reduced from over 30 tonnes per Month

© IGD 2012
• Working together with other supply chains
• Increasing use of proven solutions, achieving efficiencies and reducing prices to shoppers
• steering completely clear of anticompetitive effects
Senior ManagementSenior ManagementSenior ManagementSenior ManagementSenior Management
A / PA / PA / PA / PA / P R & DR & DR & DR & DR & D
FinanceFinanceFinanceFinanceFinance MISMISMISMISMIS
Manufacturing& DistributionsManufacturing& DistributionsManufacturing& DistributionsManufacturing& DistributionsManufacturing& Distributions
CustomerService
CustomerService
CustomerService
CustomerService
CustomerService
MarketingMarketingMarketingMarketingMarketing
SalesRep
SalesRep
SalesRep
SalesRep
SalesRep
Senior ManagementSenior ManagementSenior ManagementSenior ManagementSenior Management
PlanningPlanningPlanningPlanningPlanning
FinanceFinanceFinanceFinanceFinance
A / PA / PA / PA / PA / P
MISMISMISMISMIS
Supply ChainSupply ChainSupply ChainSupply ChainSupply Chain
Store OperationsStore OperationsStore OperationsStore OperationsStore Operations
MerchandisingMerchandisingMerchandisingMerchandisingMerchandising
BuyerBuyerBuyerBuyerBuyer
Senior ManagementSenior ManagementSenior ManagementSenior ManagementSenior Management
A / PA / PA / PA / PA / P R & DR & DR & DR & DR & D
FinanceFinanceFinanceFinanceFinance MISMISMISMISMIS
Manufacturing& DistributionsManufacturing& DistributionsManufacturing& DistributionsManufacturing& DistributionsManufacturing& Distributions
CustomerService
CustomerService
CustomerService
CustomerService
CustomerService
MarketingMarketingMarketingMarketingMarketing
SalesRep
SalesRep
SalesRep
SalesRep
SalesRep
Senior ManagementSenior ManagementSenior ManagementSenior ManagementSenior Management
PlanningPlanningPlanningPlanningPlanning
FinanceFinanceFinanceFinanceFinance
A / PA / PA / PA / PA / P
MISMISMISMISMIS
Supply ChainSupply ChainSupply ChainSupply ChainSupply Chain
Store OperationsStore OperationsStore OperationsStore OperationsStore Operations
MerchandisingMerchandisingMerchandisingMerchandisingMerchandising
BuyerBuyerBuyerBuyerBuyer
• Working together with colleagues
• Building and asserting understanding
• Challenging the status quo
• Cutting through confusion
• Making small changes in behaviour & to designs
Performance improvement made possible by
Senior Management Senior Management
A / P A / P R & D R & D
Finance Finance MIS MIS
Manufacturing & Distributions Manufacturing & Distributions
Customer Service
Customer Service
Marketing Marketing
Sales Rep
Sales Rep
Senior Management Senior Management
Planning Planning
Finance Finance
A / P A / P
MIS MIS
Supply Chain Supply Chain
Store Operations Store Operations
Merchandising Merchandising
Buyer Buyer
and trading partners
© IGD 2012
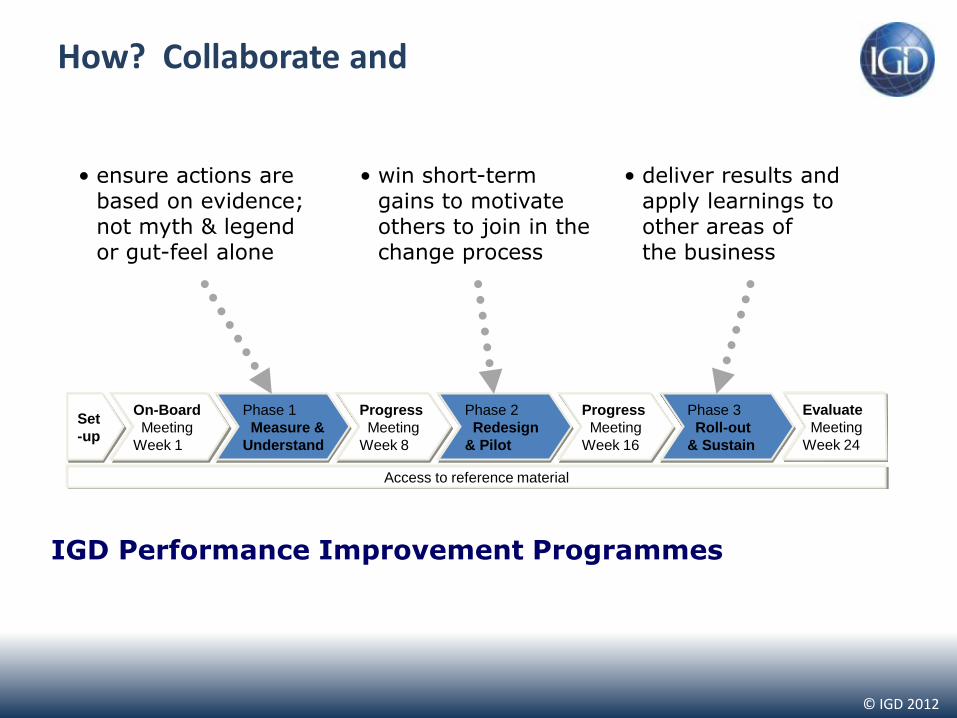
How? Collaborate and
Access to reference material
On-Board
Meeting
Week 1
Progress
Meeting
Week 8
Progress
Meeting
Week 16
Set
-up
Evaluate
Meeting
Week 24
• deliver results and apply learnings to other areas of the business
• win short-term gains to motivate others to join in the change process
• ensure actions are based on evidence; not myth & legend or gut-feel alone
IGD Performance Improvement Programmes
Phase 2
Redesign
& Pilot
Phase 3
Roll-out
& Sustain
Phase 1
Measure &
Understand
© IGD 2012
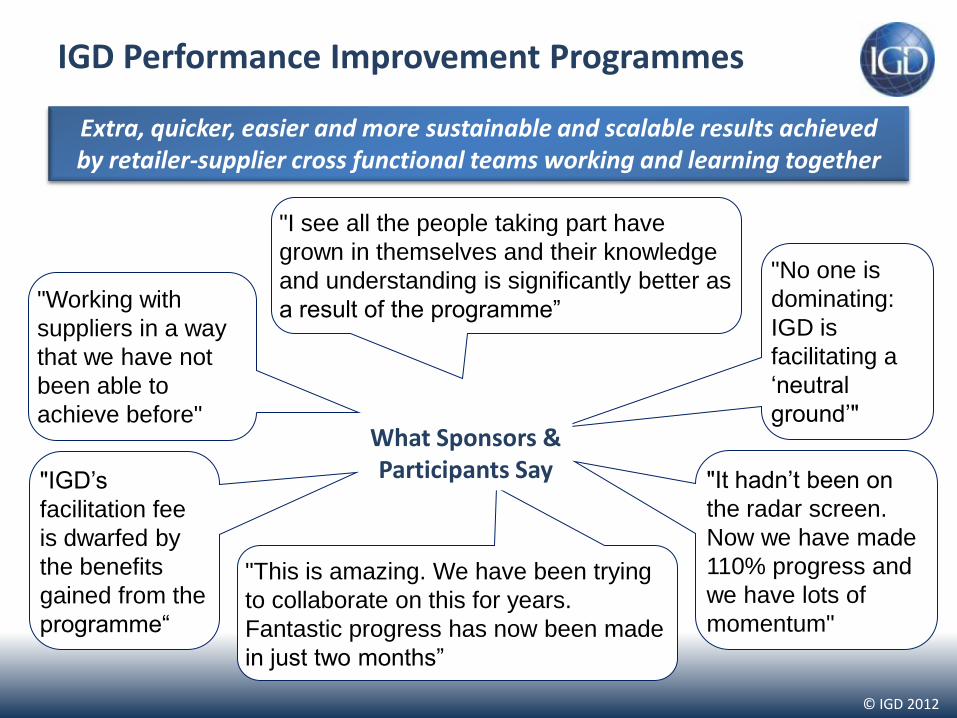
IGD Performance Improvement Programmes
"This is amazing. We have been trying
to collaborate on this for years.
Fantastic progress has now been made
in just two months”
"Working with
suppliers in a way
that we have not
been able to
achieve before"
"I see all the people taking part have
grown in themselves and their knowledge
and understanding is significantly better as
a result of the programme”
"No one is
dominating:
IGD is
facilitating a
‘neutral
ground’"
"IGD’s
facilitation fee
is dwarfed by
the benefits
gained from the
programme“
"It hadn’t been on
the radar screen.
Now we have made
110% progress and
we have lots of
momentum"
Extra, quicker, easier and more sustainable and scalable results achieved by retailer-supplier cross functional teams working and learning together
What Sponsors & Participants Say
© IGD 2012
Agenda
• Food and packaging waste in the supply chain: preventing it from occurring in the first place
• Performance gaps and their scale. Why the gaps have grown and why opportunities to improve have not been exploited
• How some in the industry are challenging assumptions, driving change, demonstrating achievements and influencing the framework within which it operates
• Hard hitting case studies hot off the press from some of the most proactive FMCG - retail businesses in UK
How to Improve Performance Together will be fully addressed in the special workshop from 13.30 to 14:55 in the Secondary Hall
11.30 – 11:50 Main Hall, ECR Baltic Forum (Vilnius), 8th November 2012