Embed Size (px)
Citation preview
PAGE 1File #JAN22
Investor Presentation
November 2006
PAGE 2File #JAN22
Disclosure of Risk Factors
Certain statements in this presentation constitute "forward-looking statements" which involve known and unknown risks, uncertainties and other factors that may cause actual results to be materially different from any future results, performance or achievements expressed or implied by such statements. Words such as "expects," "anticipates," "intends," "plans," "will," "believes," "seeks," "estimates," "should," "may,“ "could" and variations of such words and similar expressions are intended to identify such forward looking statements. The risks and uncertainties are detailed from time to time in reports filed by the Partnership with the securities regulatory authorities in all of the provinces and territories of Canada to which recipients of this presentation are referred to for additional information concerning the Partnership, its prospects and uncertainties relating to the Partnership and its prospects. These statements are based on management's current expectations and beliefs and actual events or results may differ materially. New risk factors may arise from time to time and it is not possible for management to predict all of those risk factors or the extent to which any factor or combination of factors may cause actual results, performance and achievements of the Partnership to be materially different from those contained in forward-looking statements. The forward-looking statements are based on current information and expectations and the Partnership assumes no obligation to update such information to reflect later events or developments, except as required by law.
In this presentation, references are made to EBITDA (Earnings before Interest, Taxes, Depreciation and Amortization) and distributable cash. Canfor Pulp considers EBITDA and distributable cash to be an important indicator for identifying trends in the performance and of the Fund’s ability to generate funds to meet its debt service, capital expenditure requirements and to make cash distributions to its partners. EBITDA and distributable cash is not a generally accepted earnings measure and should not be considered as an alternative to net income or cash flows as determined in accordance with Canadian generally accepted accounting principles. As there is no standardized method of calculating EBITDA and distributable cash , the Fund’s use of these terms may not be directly comparable with similarly titled measures used by other entities.
Unless otherwise noted, all financial references are in Canadian dollars.
PAGE 3File #JAN22
Company Overview
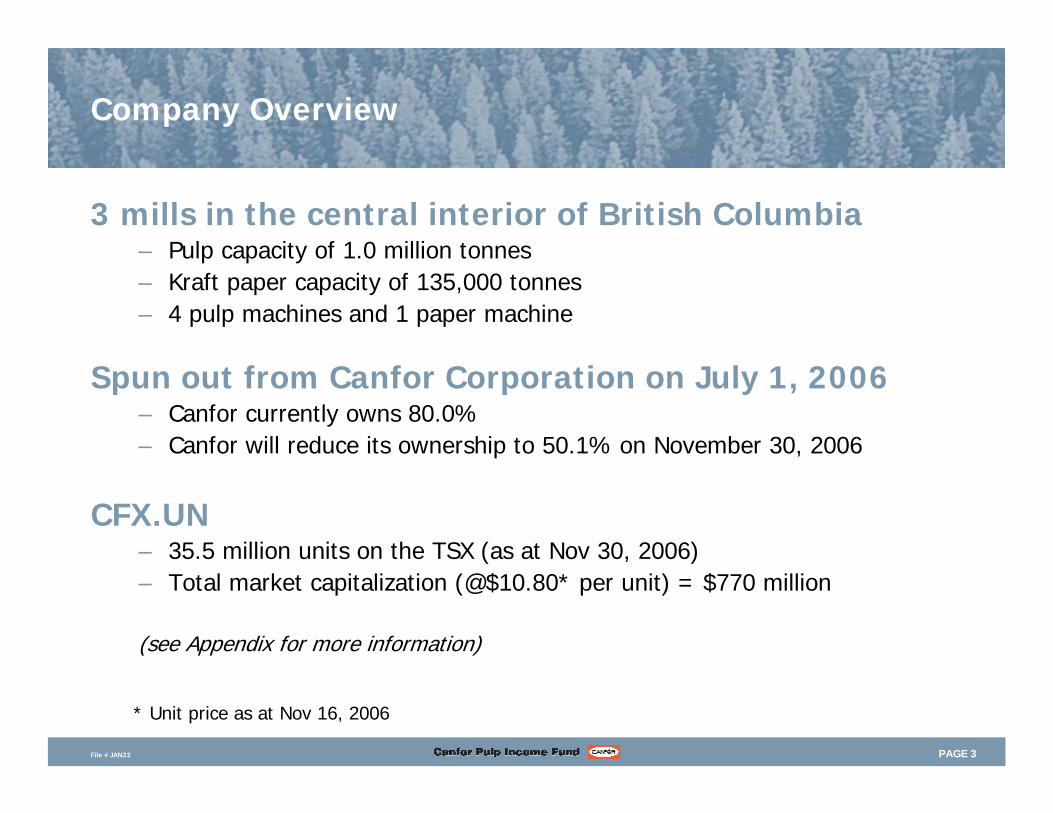
3 mills in the central interior of British Columbia– Pulp capacity of 1.0 million tonnes– Kraft paper capacity of 135,000 tonnes– 4 pulp machines and 1 paper machine
Spun out from Canfor Corporation on July 1, 2006– Canfor currently owns 80.0%– Canfor will reduce its ownership to 50.1% on November 30, 2006
CFX.UN– 35.5 million units on the TSX (as at Nov 30, 2006)– Total market capitalization (@$10.80* per unit) = $770 million
(see Appendix for more information)
* Unit price as at Nov 16, 2006
PAGE 4File #JAN22
Why Canfor Pulp?
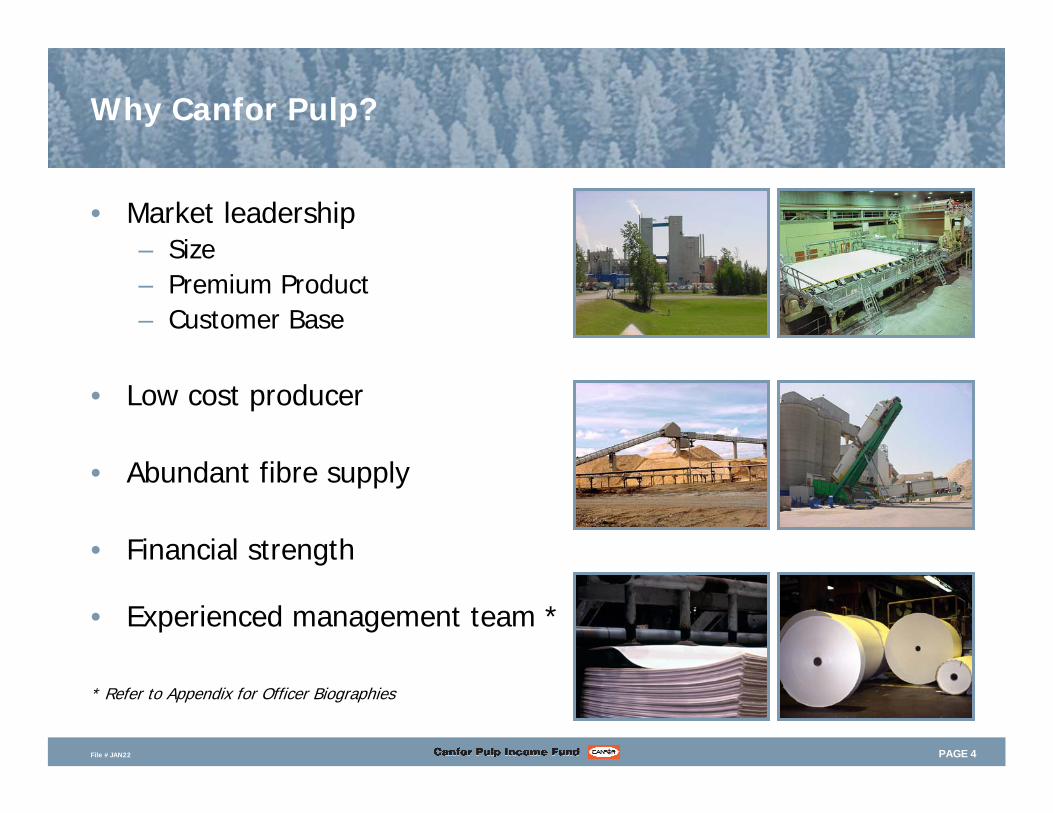
• Market leadership– Size– Premium Product – Customer Base
• Low cost producer
• Abundant fibre supply
• Financial strength
• Experienced management team *
* Refer to Appendix for Officer Biographies
PAGE 5File #JAN22
Market Leadership
0
200
400
600
800
1000
1200
1400
1600
Sodr
a Cel
l
Mer
cer
Wey
erha
euse
r
Can
for
Pulp
Fund
Pope
& T
albo
t
Ilim
Tem
bec
Wes
t Fr
aser
Stor
a En
so
Met
sa B
otni
a
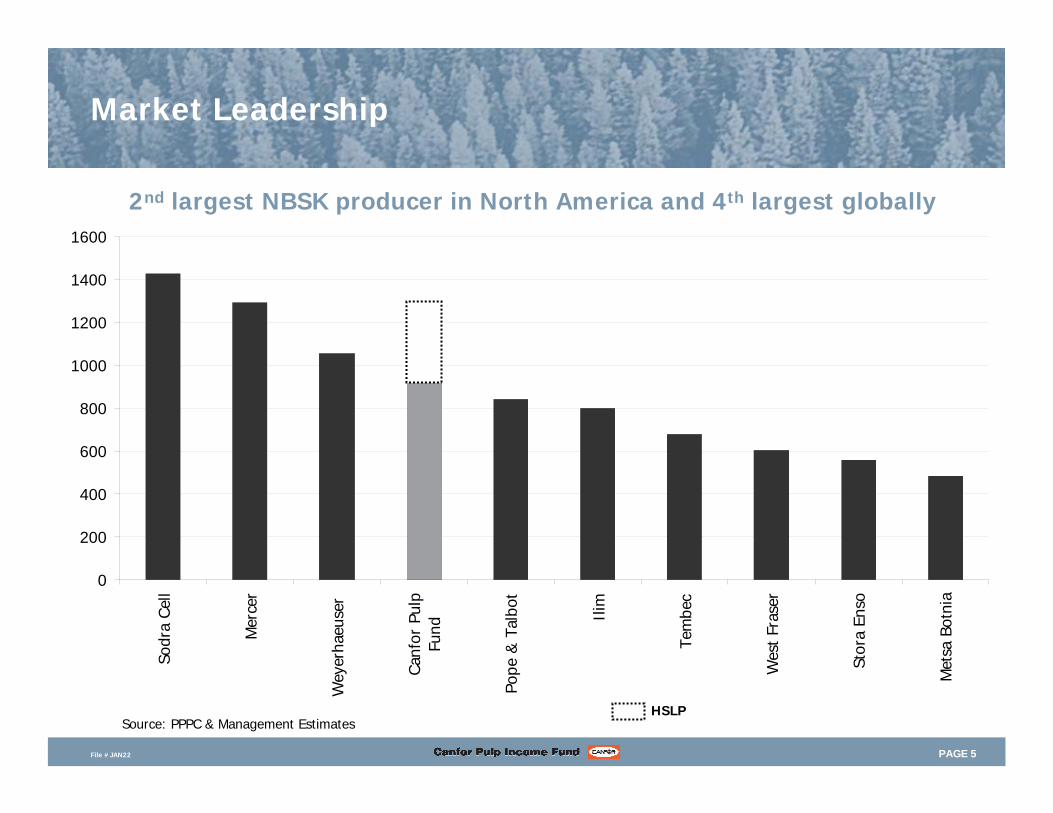
Source: PPPC & Management Estimates
2nd largest NBSK producer in North America and 4th largest globally
HSLP
PAGE 6File #JAN22
Market Conditions: Supply Shock Rally
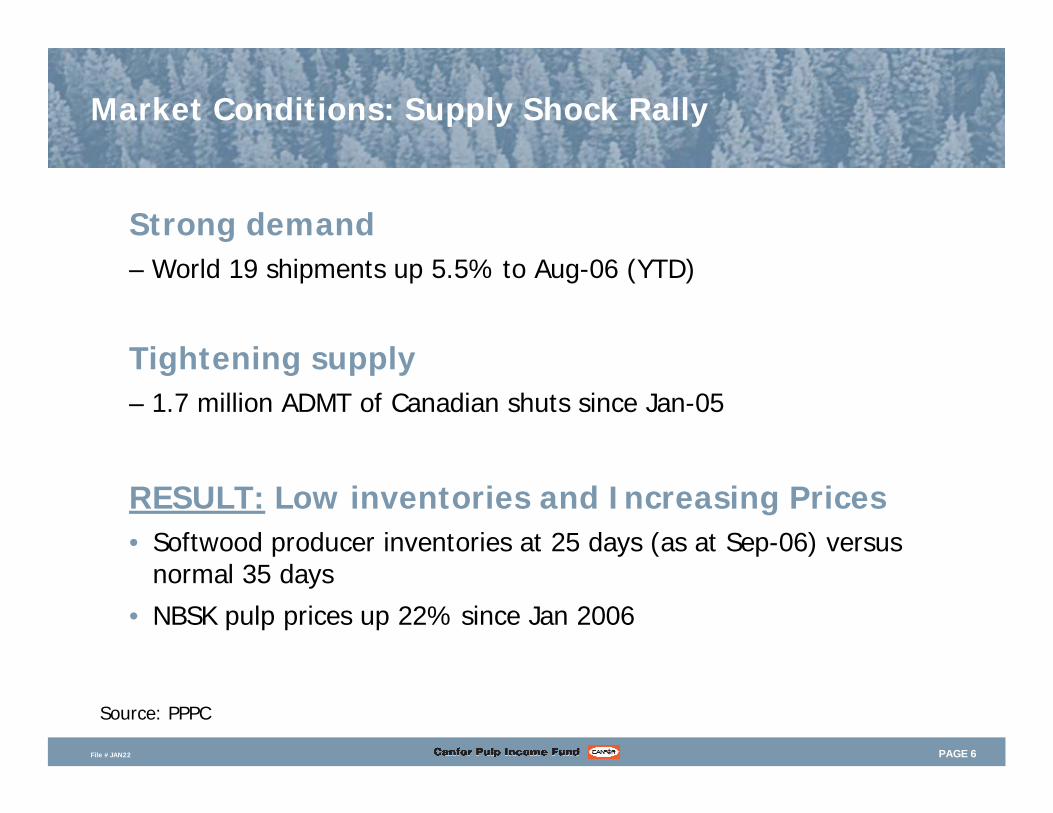
Source: PPPC
RESULT: Low inventories and Increasing Prices• Softwood producer inventories at 25 days (as at Sep-06) versus
normal 35 days
• NBSK pulp prices up 22% since Jan 2006
Strong demand– World 19 shipments up 5.5% to Aug-06 (YTD)
Tightening supply – 1.7 million ADMT of Canadian shuts since Jan-05
PAGE 7File #JAN22
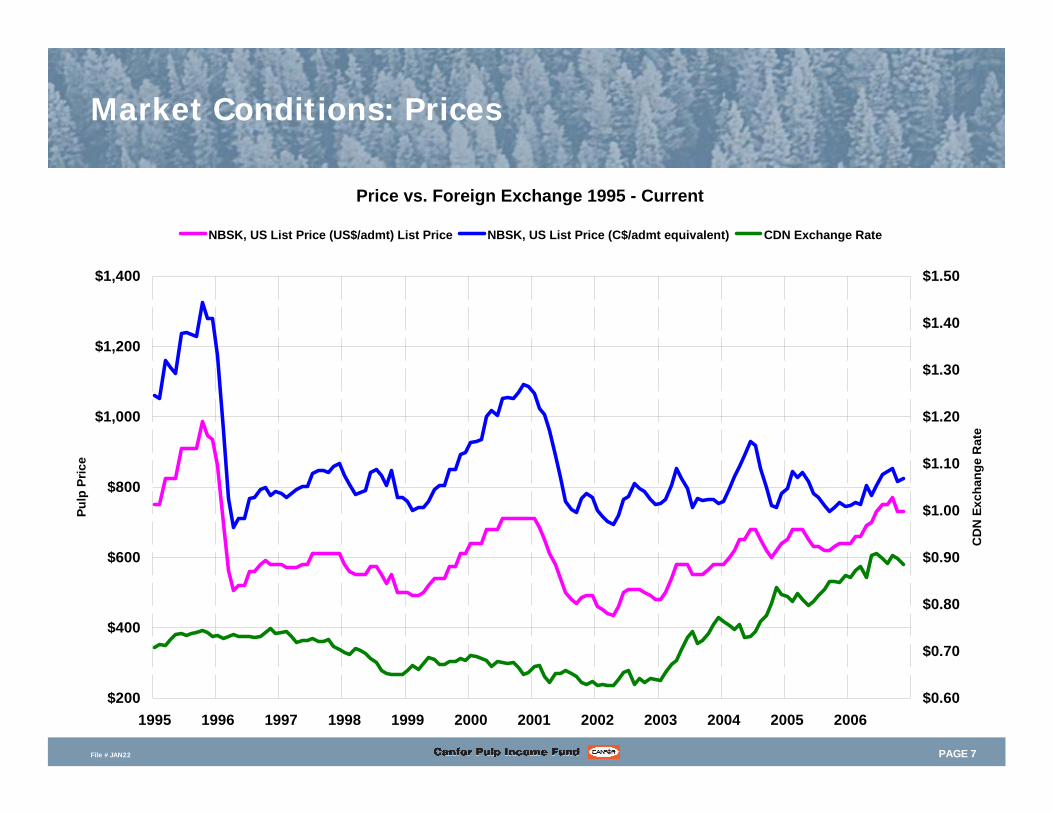
Market Conditions: Prices
Price vs. Foreign Exchange 1995 - Current
$200
$400
$600
$800
$1,000
$1,200
$1,400
1995 1996 1997 1998 1999 2000 2001 2002 2003 2004 2005 2006
Pulp
Pric
e
$0.60
$0.70
$0.80
$0.90
$1.00
$1.10
$1.20
$1.30
$1.40
$1.50
CD
N E
xcha
nge
Rat
e
NBSK, US List Price (US$/admt) List Price NBSK, US List Price (C$/admt equivalent) CDN Exchange Rate
PAGE 8File #JAN22
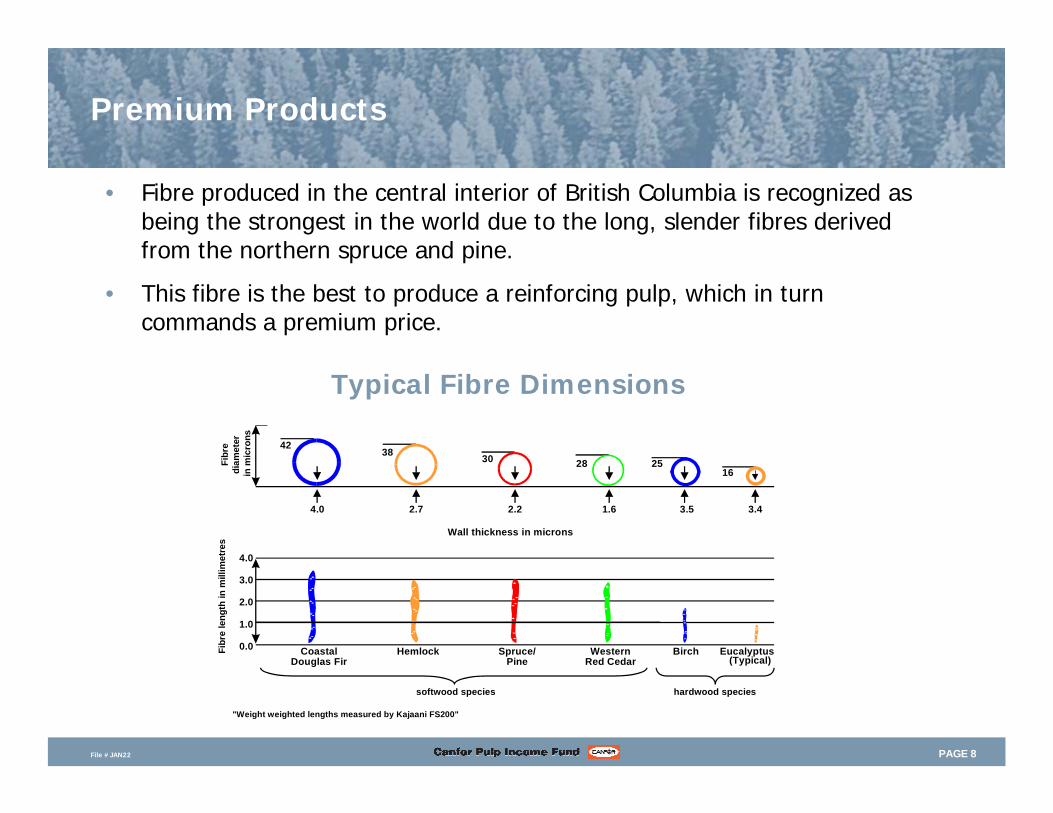
Typical Fibre Dimensions
CoastalDouglas Fir
WesternRed Cedar
Wall thickness in microns
4.0 1.62.22.7
42
283038
Spruce/Pine
Hemlock
4.0
3.0
2.0
1.0
0.0
"Weight weighted lengths measured by Kajaani FS200"
Eucalyptus(Typical)
3.43.5
1625
Birch
softwood species hardwood species
Fibr
e le
ngth
in m
illim
etre
sFi
bre
diam
eter
in m
icro
ns
• Fibre produced in the central interior of British Columbia is recognized as being the strongest in the world due to the long, slender fibres derived from the northern spruce and pine.
• This fibre is the best to produce a reinforcing pulp, which in turn commands a premium price.
Premium Products
PAGE 9File #JAN22
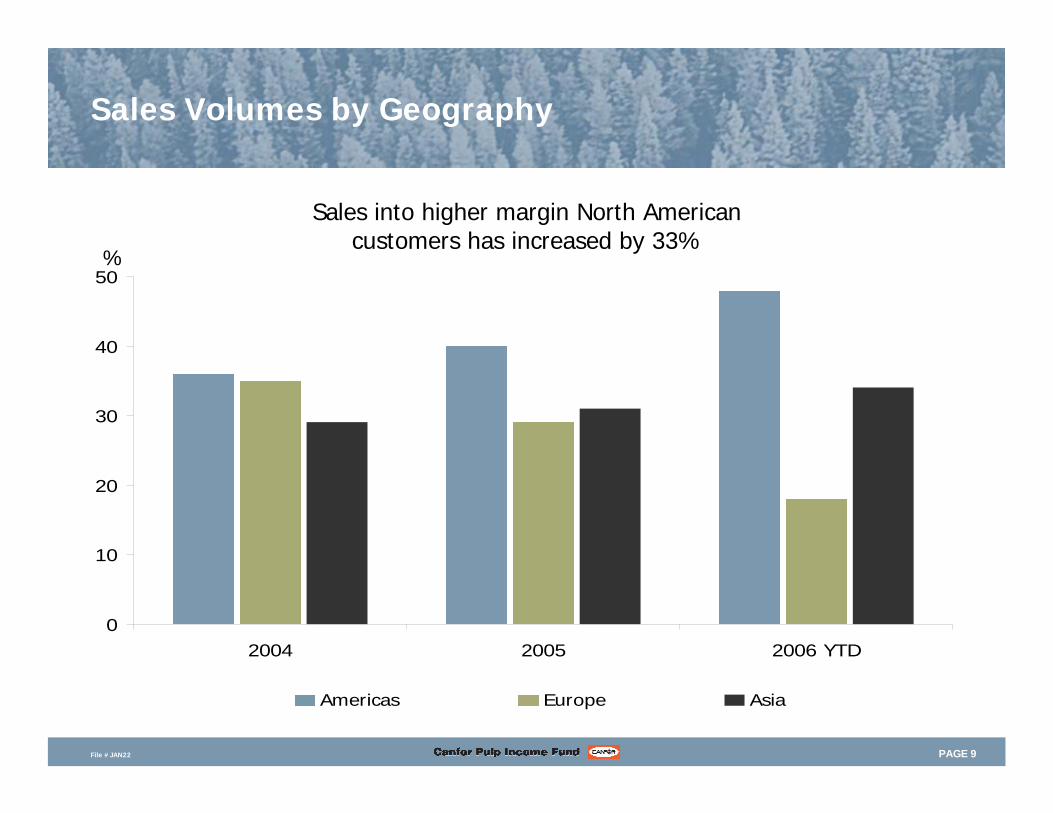
Sales Volumes by Geography
0
10
20
30
40
50
2004 2005 2006 YTD
Americas Europe Asia
Sales into higher margin North American customers has increased by 33%
%
PAGE 10File #JAN22
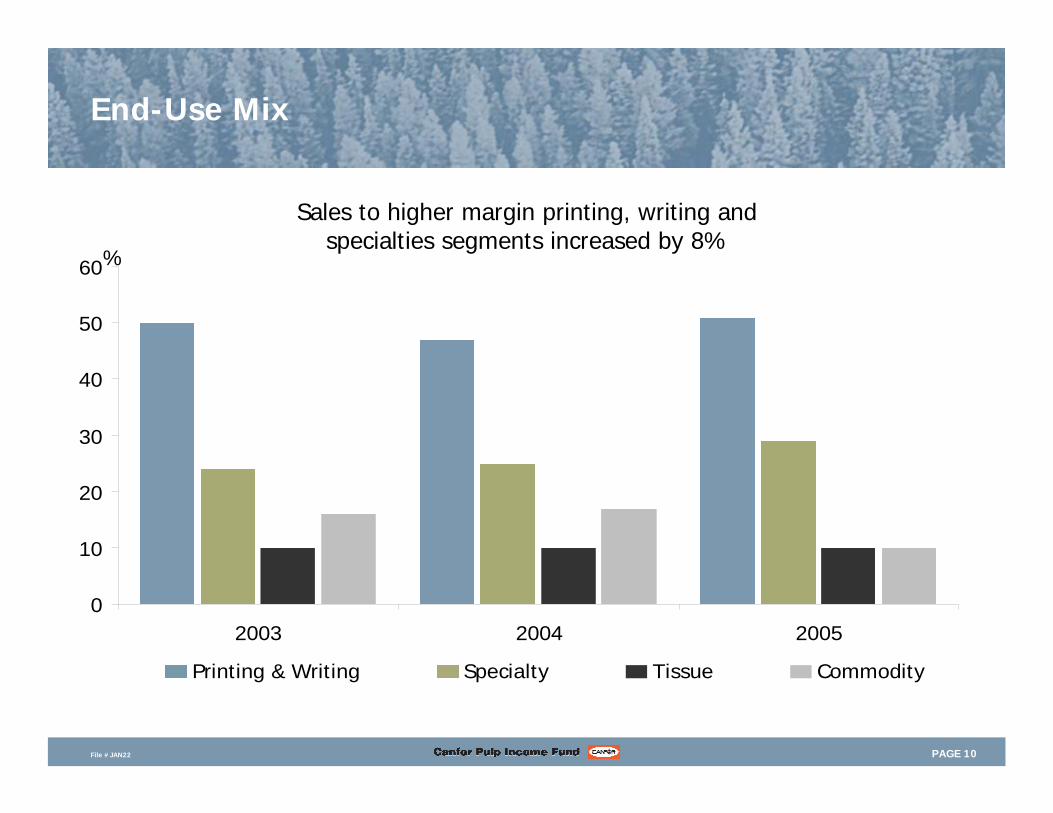
End-Use Mix
0
10
20
30
40
50
60
2003 2004 2005
Printing & Writing Specialty Tissue Commodity
Sales to higher margin printing, writing and specialties segments increased by 8%
%
PAGE 11File #JAN22
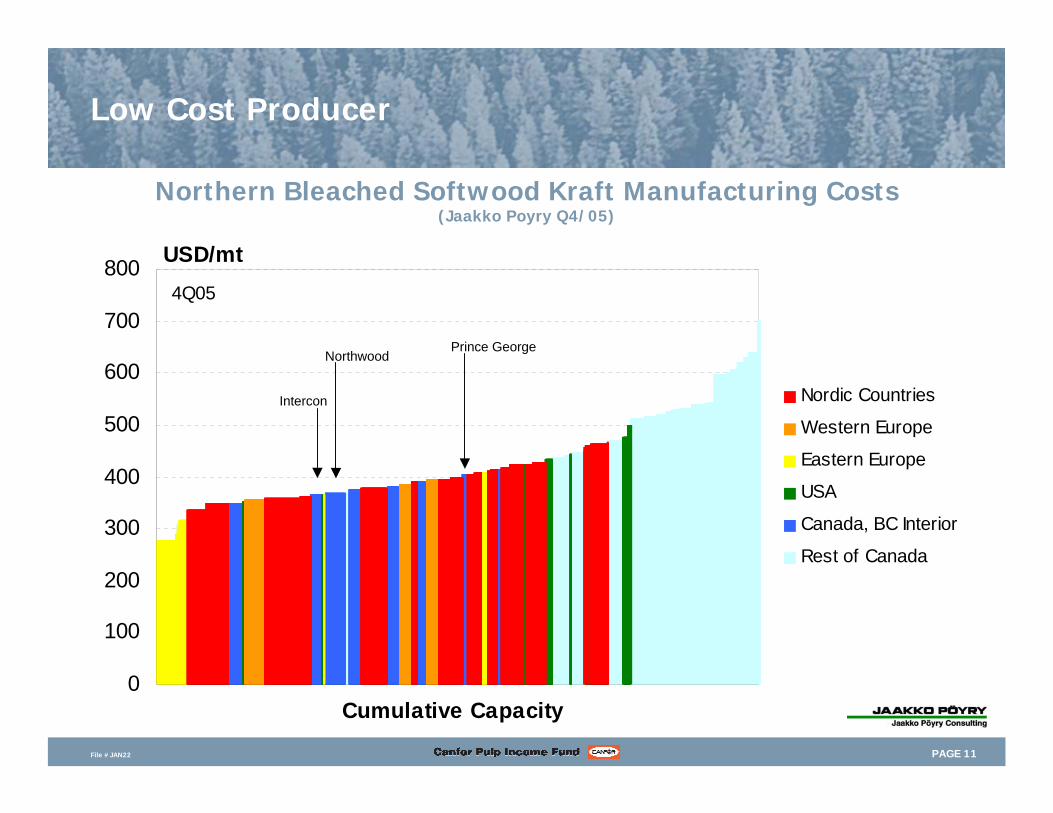
Low Cost Producer
Northern Bleached Softwood Kraft Manufacturing Costs(Jaakko Poyry Q4/05)
0
100
200
300
400
500
600
700
800
Nordic Countries
Western Europe
Eastern Europe
USA
Canada, BC Interior
Rest of Canada
USD/mt
Cumulative Capacity
4Q05
Northwood
Intercon
Prince George
PAGE 12File #JAN22
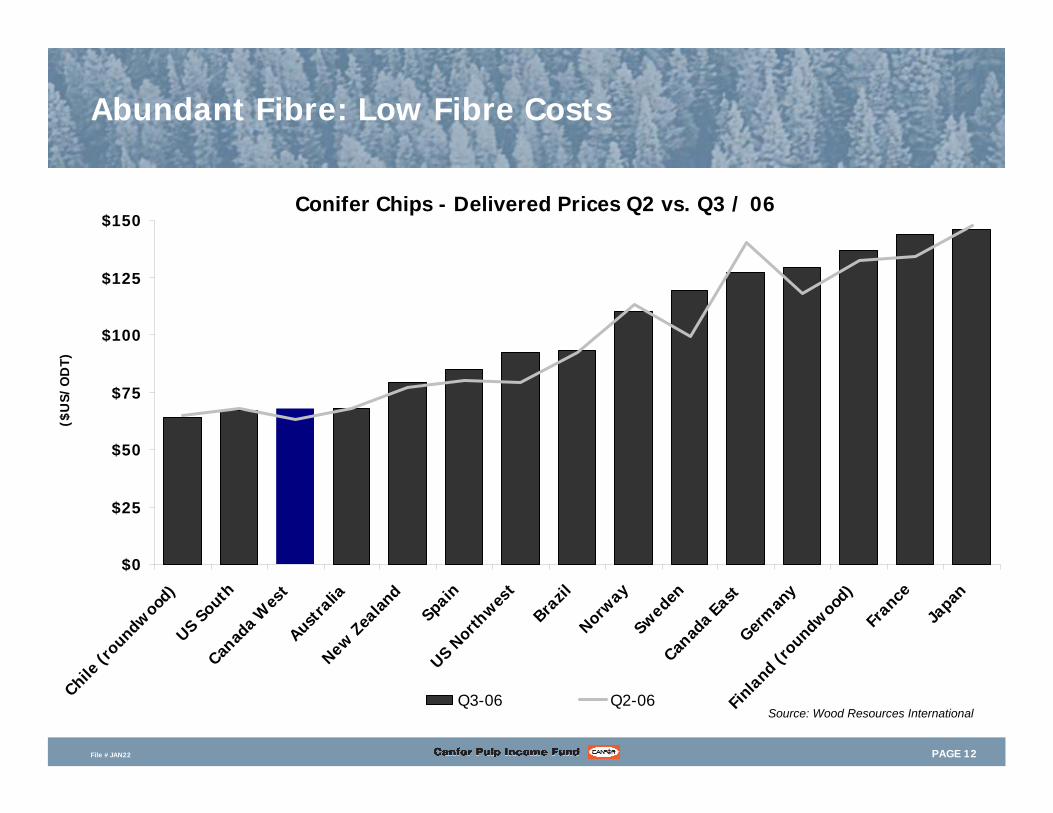
Abundant Fibre: Low Fibre Costs
Source: Wood Resources International
Conifer Chips - Delivered Prices Q2 vs. Q3 / 06
$0
$25
$50
$75
$100
$125
$150
Chile (r
oundwood
)US S
outhCan
ada W
est
Austra
liaNew Z
ealan
d
SpainUS N
orthwes
t
Brazil
Norway
SwedenCan
ada East
Germ
any
Finla
nd (roundw
ood)
France
Japan
($U
S/O
DT)
Q3-06 Q2-06
PAGE 13File #JAN22
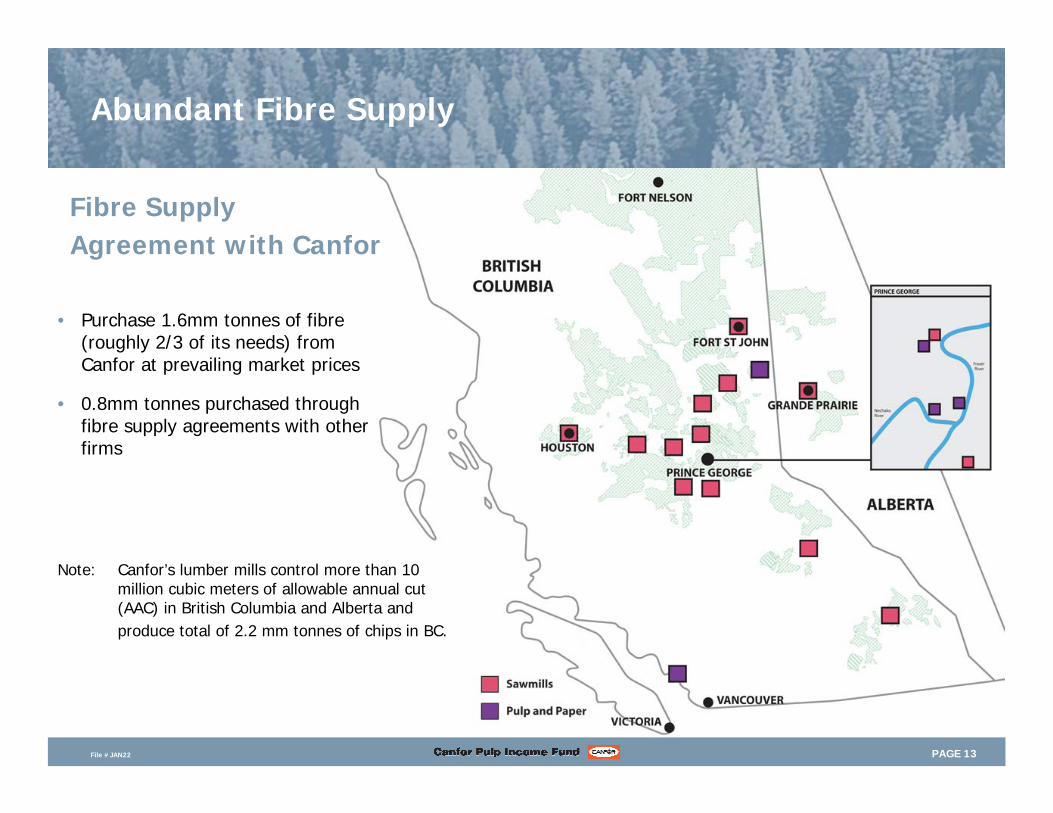
Abundant Fibre Supply
• Purchase 1.6mm tonnes of fibre (roughly 2/3 of its needs) from Canfor at prevailing market prices
• 0.8mm tonnes purchased through fibre supply agreements with other firms
Fibre Supply Agreement with Canfor
Note: Canfor’s lumber mills control more than 10 million cubic meters of allowable annual cut (AAC) in British Columbia and Alberta andproduce total of 2.2 mm tonnes of chips in BC.
PAGE 14File #JAN22
High Margin Producer
Top Quartile EBITDA per tonne producer due to:
• Revenues – Selling into the highest margin regions to targeted customers
• Low costs- Low cost fibre- Strong operations which drives low production costs
Per PwC 2005 benchmarking study of 18 Canadian NBSK mills, Canfor’s mills were Top Quartile
PAGE 15File #JAN22
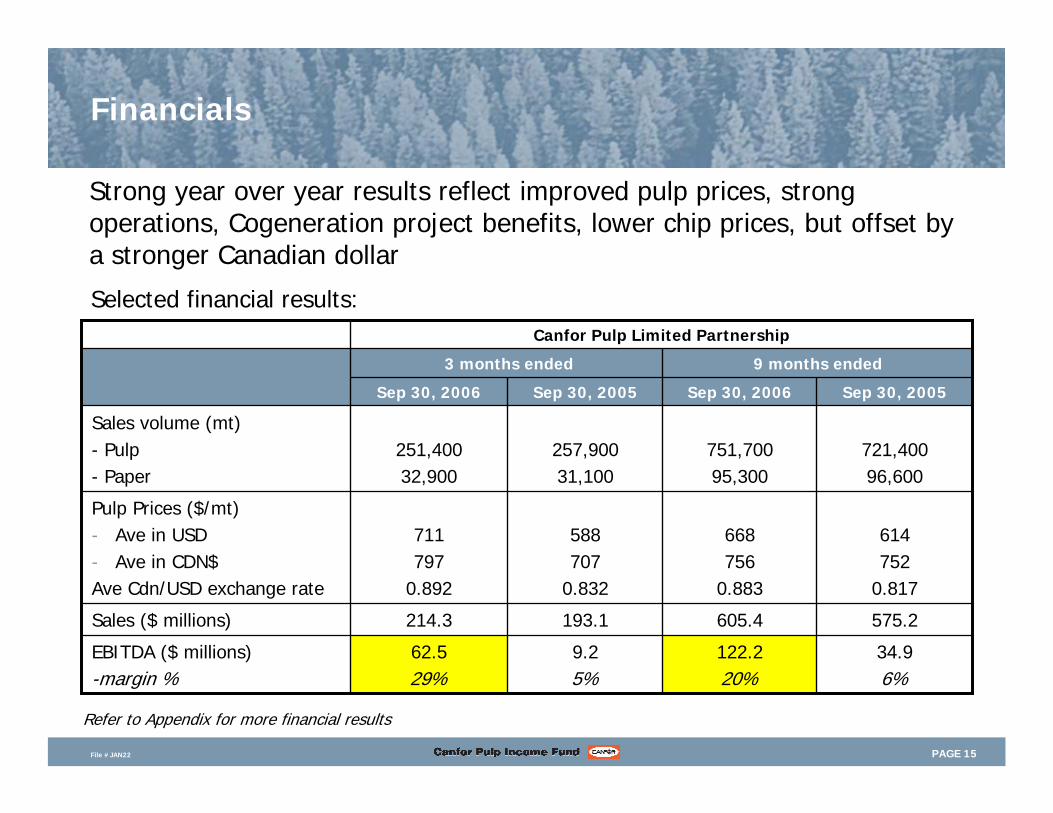
Financials
Strong year over year results reflect improved pulp prices, strong operations, Cogeneration project benefits, lower chip prices, but offset by a stronger Canadian dollar
Canfor Pulp Limited Partnership
575.2605.4193.1214.3Sales ($ millions)
34.96%
122.220%
9.25%
62.529%
EBITDA ($ millions)-margin %
614752
0.817
668756
0.883
588707
0.832
711797
0.892
Pulp Prices ($/mt)- Ave in USD- Ave in CDN$Ave Cdn/USD exchange rate
721,40096,600
751,70095,300
257,90031,100
251,40032,900
Sales volume (mt)- Pulp- Paper
Sep 30, 2005Sep 30, 2006Sep 30, 2005Sep 30, 2006
9 months ended3 months ended
Selected financial results:
Refer to Appendix for more financial results
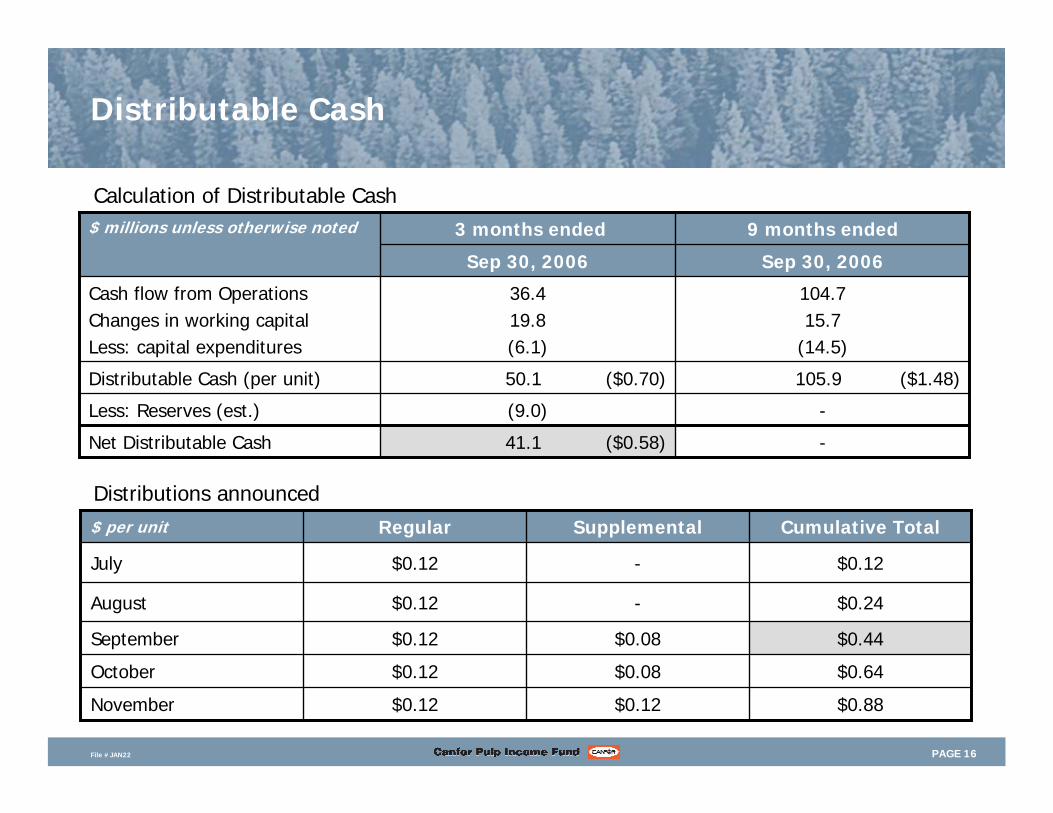
PAGE 16File #JAN22
Distributable Cash
-(9.0)Less: Reserves (est.)
-41.1 ($0.58)Net Distributable Cash
105.9 ($1.48)50.1 ($0.70)Distributable Cash (per unit)
104.715.7
(14.5)
36.419.8(6.1)
Cash flow from OperationsChanges in working capitalLess: capital expenditures
Sep 30, 2006Sep 30, 2006
9 months ended3 months ended$ millions unless otherwise noted
$0.88$0.12$0.12November
$0.64$0.08$0.12October
$0.44$0.08$0.12September
$0.24-$0.12August
-
Supplemental
$0.12$0.12July
Cumulative TotalRegular$ per unit
Calculation of Distributable Cash
Distributions announced
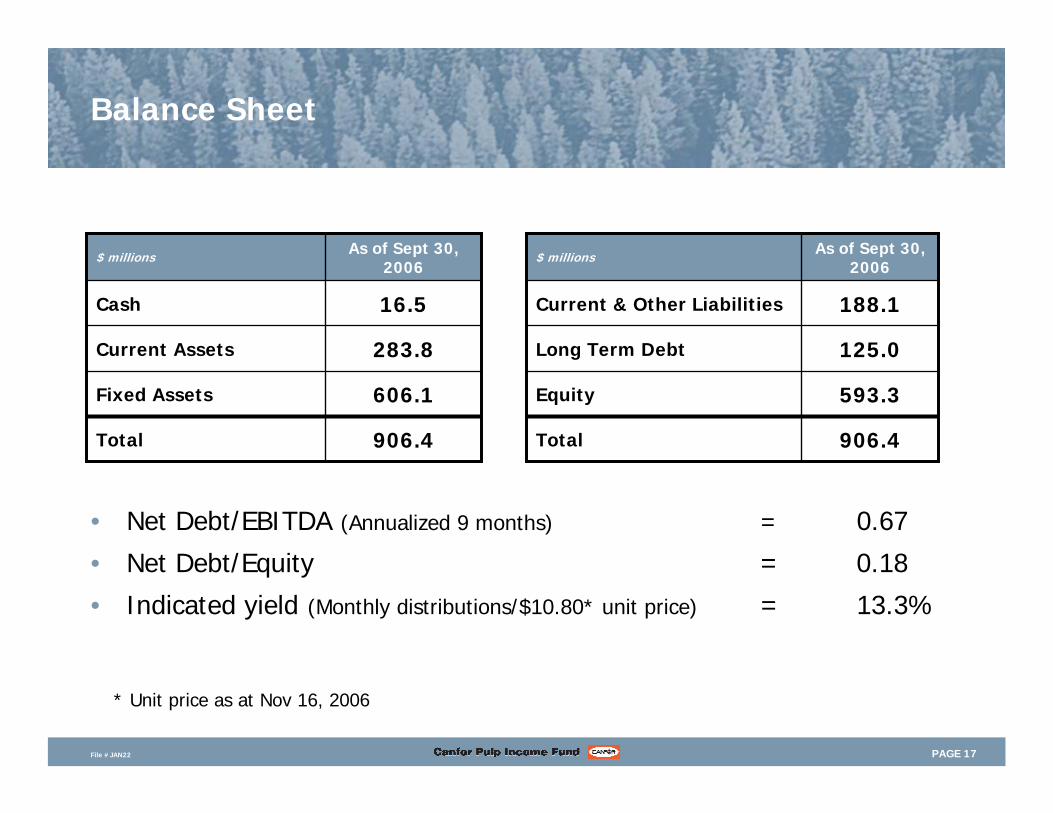
PAGE 17File #JAN22
Balance Sheet
• Net Debt/EBITDA (Annualized 9 months) = 0.67
• Net Debt/Equity = 0.18
• Indicated yield (Monthly distributions/$10.80* unit price) = 13.3%
As of Sept 30, 2006
$ millions
906.4Total
606.1Fixed Assets
283.8Current Assets
16.5Cash
As of Sept 30, 2006
$ millions
906.4Total
593.3Equity
125.0Long Term Debt
188.1Current & Other Liabilities
* Unit price as at Nov 16, 2006
PAGE 18File #JAN22
Operations Strategy
Remain Top Quartile EBITDA per tonne Producer
– Achieve targets for Prince George Cogen Project
– Continue to improve reliability / productivity
– Grow North American business
– Position right products / customers

PAGE 19File #JAN22
Summary
• Market leadership– Size– Premium Product – Customer Base
• Low cost producer
• Abundant fibre supply
• Financial strength
• Experienced management team
PAGE 20File #JAN22
Questions?CFX.UN
Contact: David Jan
Manager-Investor [email protected]
www.canforpulp.com