Embed Size (px)
Citation preview

JTI 2017 Key Achievements &2018 Guidance
Eddy PirardPresident & Chief Executive Officer
Tokyo – February 7, 2018© Copyright JT 2018
FORWARD-LOOKING STATEMENTS
2JT Investor Meeting
This presentation contains forward-looking statements. These statements appear in a number of places in this presentation and include statements regarding the intent, belief, or current and future expectations of our management with respect to our business, financial condition and results of operations. In some cases, you can identify forward-looking statements by terms such as “may”, “will”, “should”, “would”,“expect”, “intend”, “project”, “plan”, “aim”, “seek”, “target”, “anticipate”, “believe”, “estimate”, “predict”,“potential” or the negative of these terms or other similar terminology. These statements are not guarantees of future performance and are subject to various risks and uncertainties. Actual results, performance or achievements, or those of the industries in which we operate, may differ materially from any future results, performance or achievements expressed or implied by these forward-looking statements. In addition, these forward-looking statements are necessarily dependent upon assumptions, estimates and data that may be incorrect or imprecise and involve known and unknown risks and uncertainties. Forward-looking statements regarding operating results are particularly subject to a variety of assumptions, some or all of which may not be realized.
Risks, uncertainties or other factors that could cause actual results to differ materially from those expressed in any forward-looking statement include, without limitation:(1) decrease in demand for tobacco products in key markets;(2) restrictions on promoting, marketing, packaging, labeling and usage of tobacco products in markets in which we operate; (3) increases in excise, consumption or other taxes on tobacco products in markets in which we operate;(4) litigation around the world alleging adverse health and financial effects resulting from, or relating to, tobacco products ;(5) our ability to realize anticipated results of our acquisition or other similar investments;(6) competition in markets in which we operate or into which we seek to expand;(7) deterioration in economic conditions in areas that matter to us;(8) economic, regulatory and political changes, such as nationalization, terrorism, wars and civil unrest, in countries in which we operate;(9) fluctuations in foreign exchange rates and the costs of raw materials; and(10) catastrophes, including natural disasters.
Tokyo – February 7, 2018© Copyright JT 2018
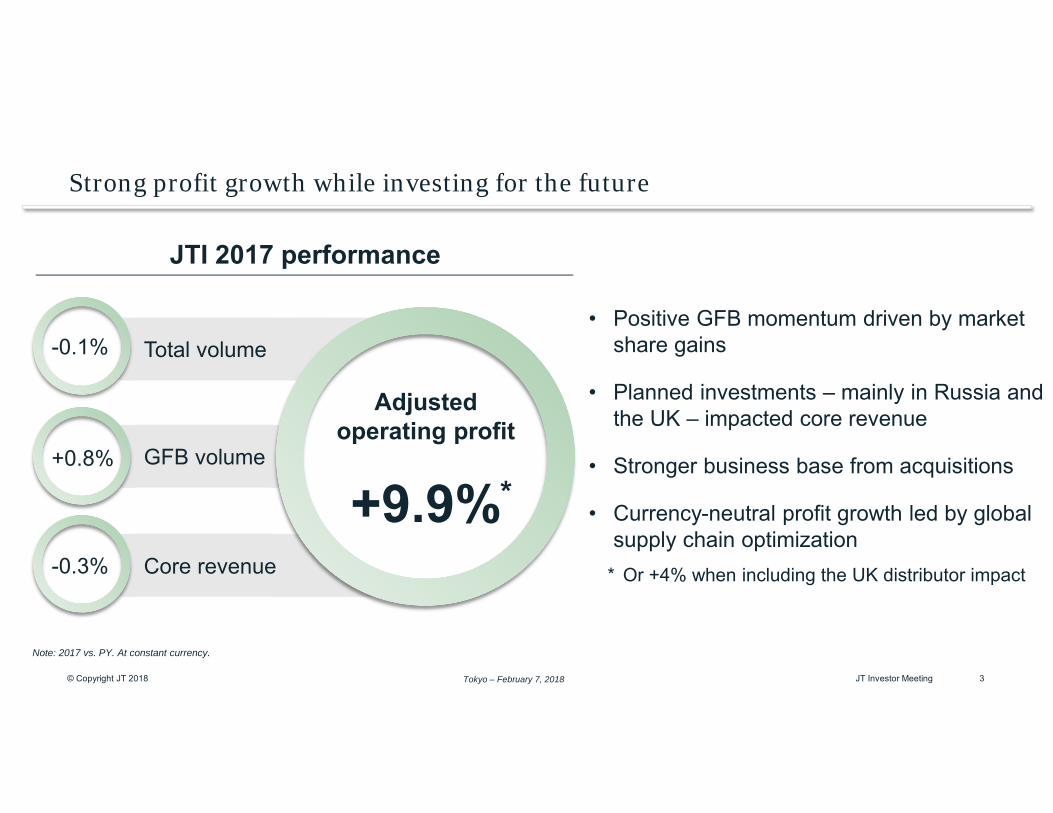
Strong profit growth while investing for the future
3JT Investor Meeting
-0.1%
+0.8%
-0.3%
Total volume
GFB volume
Core revenue
Adjusted operating profit
+9.9%
Note: 2017 vs. PY. At constant currency.
• Positive GFB momentum driven by market share gains
• Planned investments – mainly in Russia and the UK – impacted core revenue
• Stronger business base from acquisitions
• Currency-neutral profit growth led by global supply chain optimization
* Or +4% when including the UK distributor impact
JTI 2017 performance
*
Tokyo – February 7, 2018© Copyright JT 2018 4
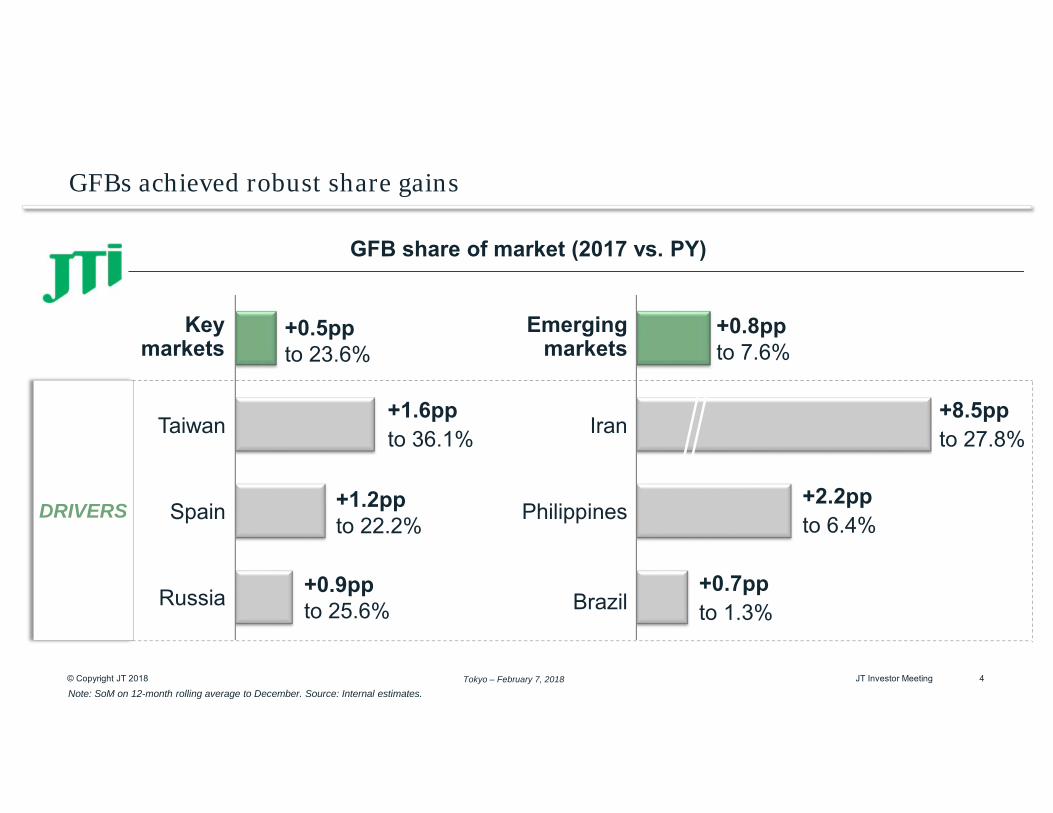
GFBs achieved robust share gains
Emergingmarkets
Taiwan Iran
Spain Philippines
Russia Brazil
Keymarkets
GFB share of market (2017 vs. PY)
+0.5ppto 23.6%
+0.8ppto 7.6%
+1.6ppto 36.1%
+1.2ppto 22.2%
+0.9ppto 25.6%
+8.5ppto 27.8%
+2.2ppto 6.4%
+0.7ppto 1.3%
DRIVERS
Note: SoM on 12-month rolling average to December. Source: Internal estimates.JT Investor Meeting
Tokyo – February 7, 2018© Copyright JT 2018 5
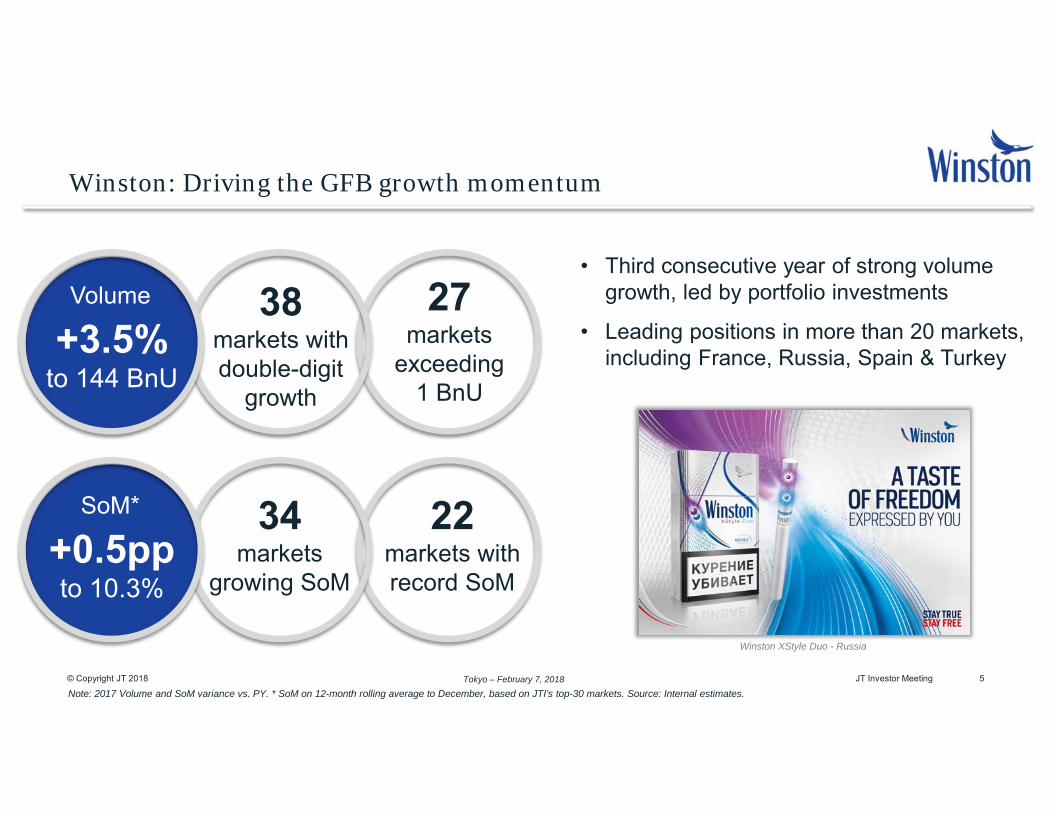
Winston: Driving the GFB growth momentum
SoM*
+0.5ppto 10.3%
34markets
growing SoM
22markets withrecord SoM
Volume
+3.5%to 144 BnU
38 markets withdouble-digit
growth
27 markets
exceeding 1 BnU
• Third consecutive year of strong volume growth, led by portfolio investments
• Leading positions in more than 20 markets, including France, Russia, Spain & Turkey
Note: 2017 Volume and SoM variance vs. PY. * SoM on 12-month rolling average to December, based on JTI’s top-30 markets. Source: Internal estimates.
Winston XStyle Duo - Russia
JT Investor Meeting
Tokyo – February 7, 2018© Copyright JT 2018 6
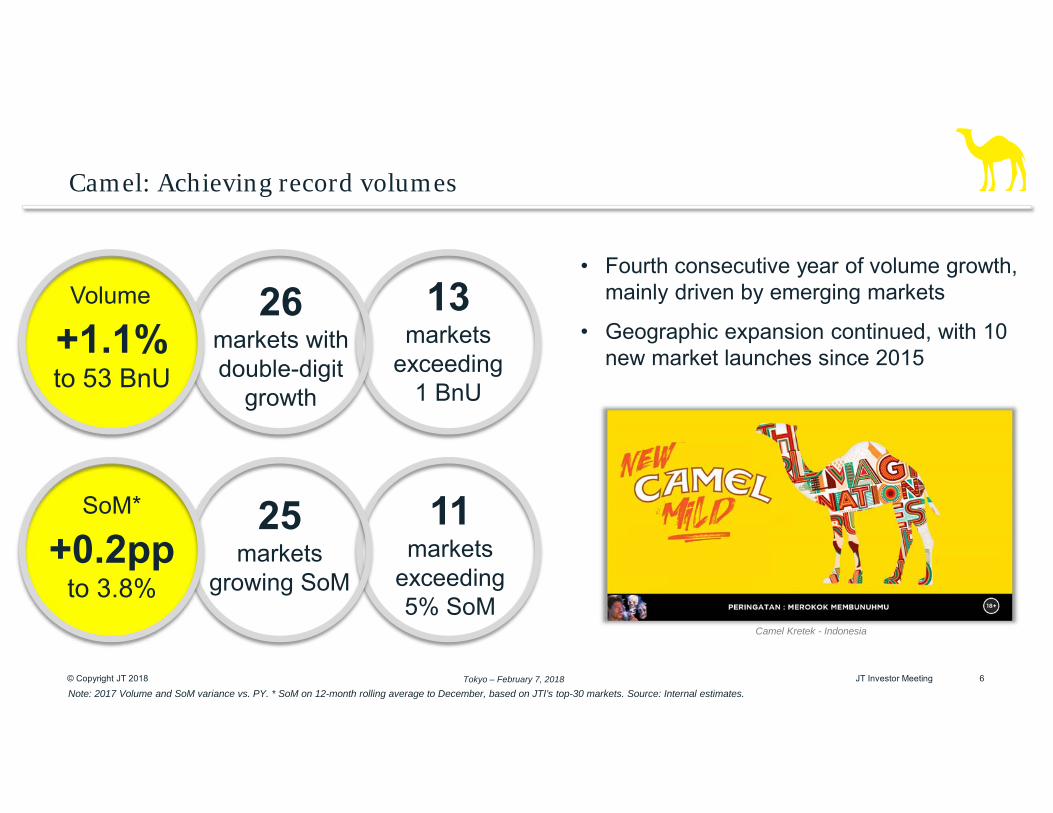
Camel: Achieving record volumes
SoM*
+0.2ppto 3.8%
25markets
growing SoM
11markets
exceeding 5% SoM
Volume
+1.1%to 53 BnU
26 markets withdouble-digit
growth
13 markets
exceeding 1 BnU
• Fourth consecutive year of volume growth, mainly driven by emerging markets
• Geographic expansion continued, with 10 new market launches since 2015
Note: 2017 Volume and SoM variance vs. PY. * SoM on 12-month rolling average to December, based on JTI’s top-30 markets. Source: Internal estimates.
Camel Kretek - Indonesia
JT Investor Meeting
Tokyo – February 7, 2018© Copyright JT 2018
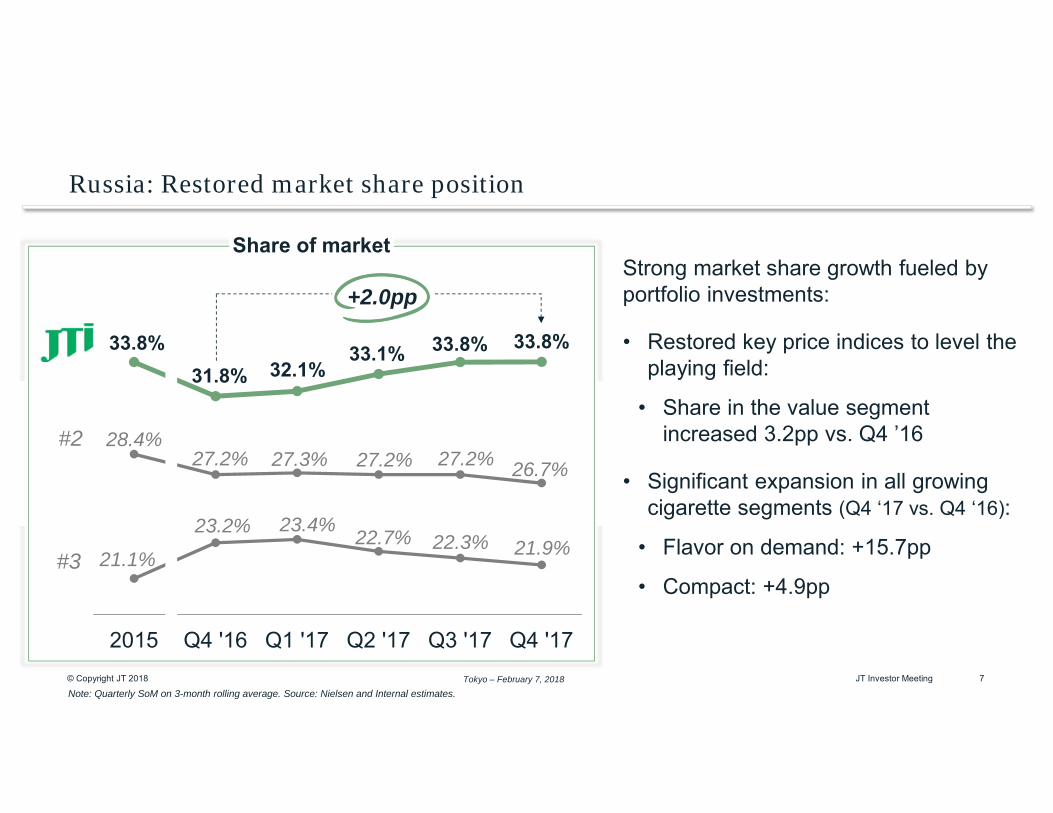
Russia: Restored market share position
7JT Investor Meeting
Strong market share growth fueled by portfolio investments:
• Restored key price indices to level the playing field:
• Share in the value segment increased 3.2pp vs. Q4 ’16
• Significant expansion in all growing cigarette segments (Q4 ‘17 vs. Q4 ‘16):
• Flavor on demand: +15.7pp
• Compact: +4.9pp
Note: Quarterly SoM on 3-month rolling average. Source: Nielsen and Internal estimates.
21.1%
23.2% 23.4% 22.7% 22.3% 21.9%
28.4%27.2% 27.3% 27.2% 27.2% 26.7%
33.8%31.8% 32.1%
33.1% 33.8% 33.8%
2015 Q4 '16 Q1 '17 Q2 '17 Q3 '17 Q4 '17
Share of market
#2
#3
+2.0pp
Tokyo – February 7, 2018© Copyright JT 2018
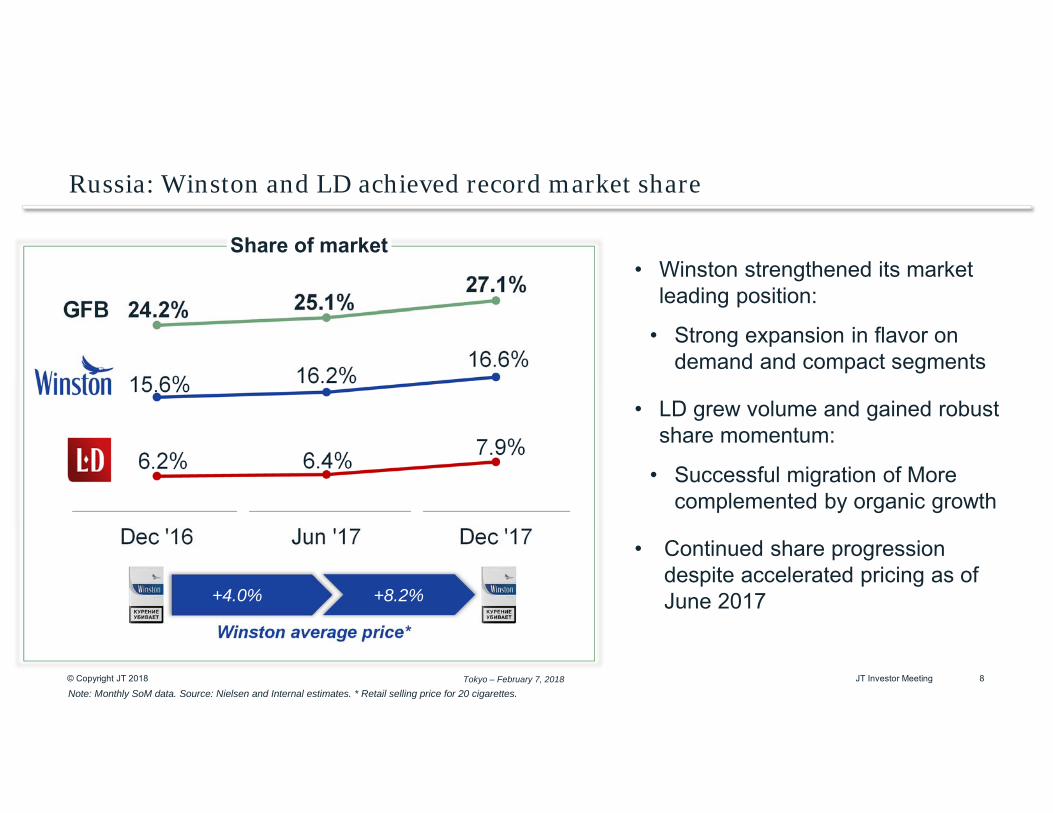
Russia: Winston and LD achieved record market share
8JT Investor Meeting
• Winston strengthened its market leading position:
• Strong expansion in flavor on demand and compact segments
• LD grew volume and gained robust share momentum:
• Successful migration of More complemented by organic growth
• Continued share progression despite accelerated pricing as of June 2017
Note: Monthly SoM data. Source: Nielsen and Internal estimates. * Retail selling price for 20 cigarettes.
6.2% 6.4% 7.9%
15.6% 16.2%16.6%
24.2% 25.1%27.1%
Dec '16 Jun '17 Dec '17
Winston average price*
GFB
Share of market
+4.0% +8.2%
Tokyo – February 7, 2018© Copyright JT 2018 9JT Investor Meeting
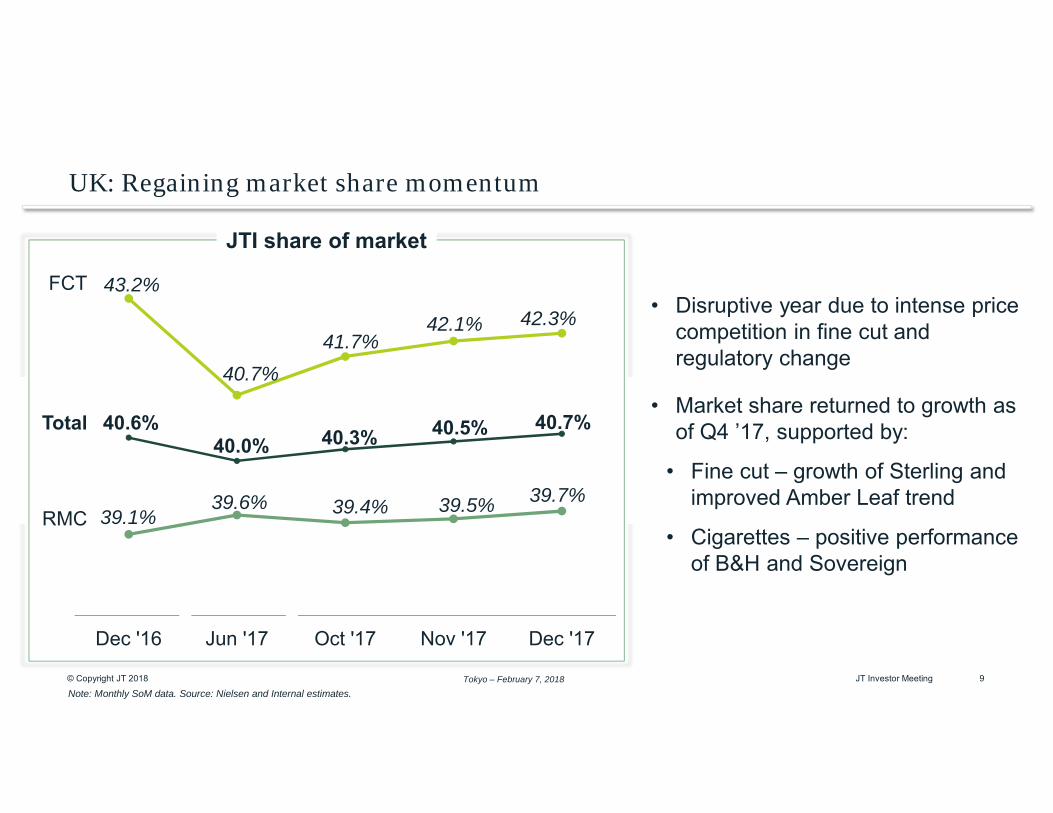
UK: Regaining market share momentum
• Disruptive year due to intense price competition in fine cut and regulatory change
• Market share returned to growth as of Q4 ’17, supported by:
• Fine cut – growth of Sterling and improved Amber Leaf trend
• Cigarettes – positive performance of B&H and Sovereign
Note: Monthly SoM data. Source: Nielsen and Internal estimates.
43.2%
40.7%41.7%
42.1% 42.3%
39.1%39.6% 39.4% 39.5% 39.7%
40.6%40.0% 40.3% 40.5% 40.7%
Dec '16 Jun '17 Oct '17 Nov '17 Dec '17
JTI share of market
FCT
RMC
Total
Tokyo – February 7, 2018© Copyright JT 2018 10JT Investor Meeting
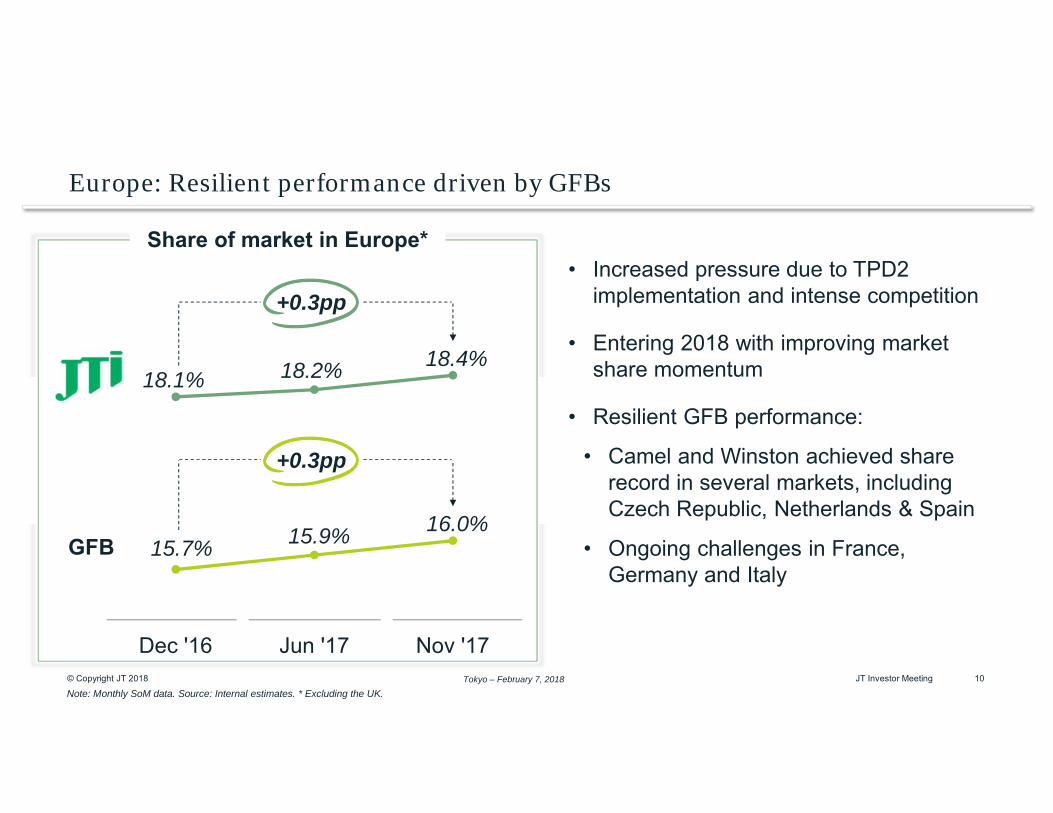
Europe: Resilient performance driven by GFBs
Note: Monthly SoM data. Source: Internal estimates. * Excluding the UK.
• Increased pressure due to TPD2 implementation and intense competition
• Entering 2018 with improving market share momentum
• Resilient GFB performance:
• Camel and Winston achieved share record in several markets, including Czech Republic, Netherlands & Spain
• Ongoing challenges in France, Germany and Italy
18.1% 18.2% 18.4%
15.7% 15.9% 16.0%
Dec '16 Jun '17 Nov '17
GFB
+0.3pp
Share of market in Europe*
+0.3pp
Tokyo – February 7, 2018© Copyright JT 2018
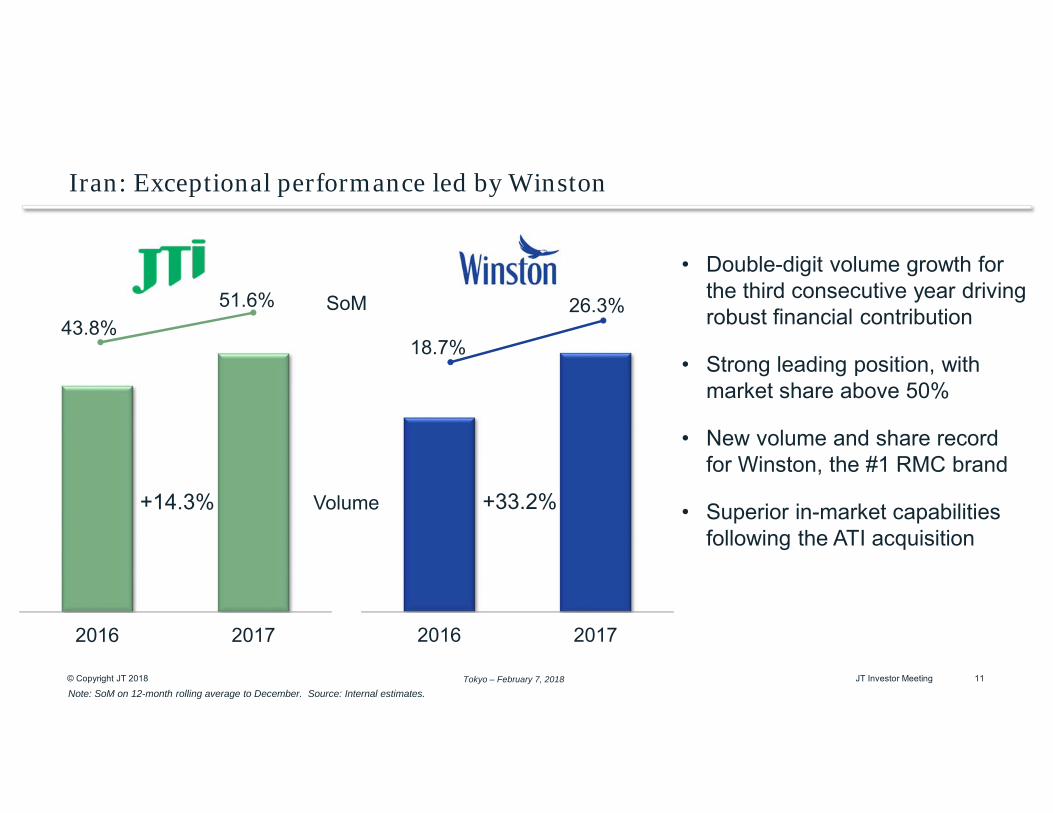
43.8%51.6%
11JT Investor Meeting
Iran: Exceptional performance led by Winston
2016 2017 2016 2017
• Double-digit volume growth for the third consecutive year driving robust financial contribution
• Strong leading position, with market share above 50%
• New volume and share record for Winston, the #1 RMC brand
• Superior in-market capabilities following the ATI acquisition
Volume +33.2%+14.3%
SoM
Note: SoM on 12-month rolling average to December. Source: Internal estimates.
18.7%
26.3%
Tokyo – February 7, 2018© Copyright JT 2018 12JT Investor Meeting
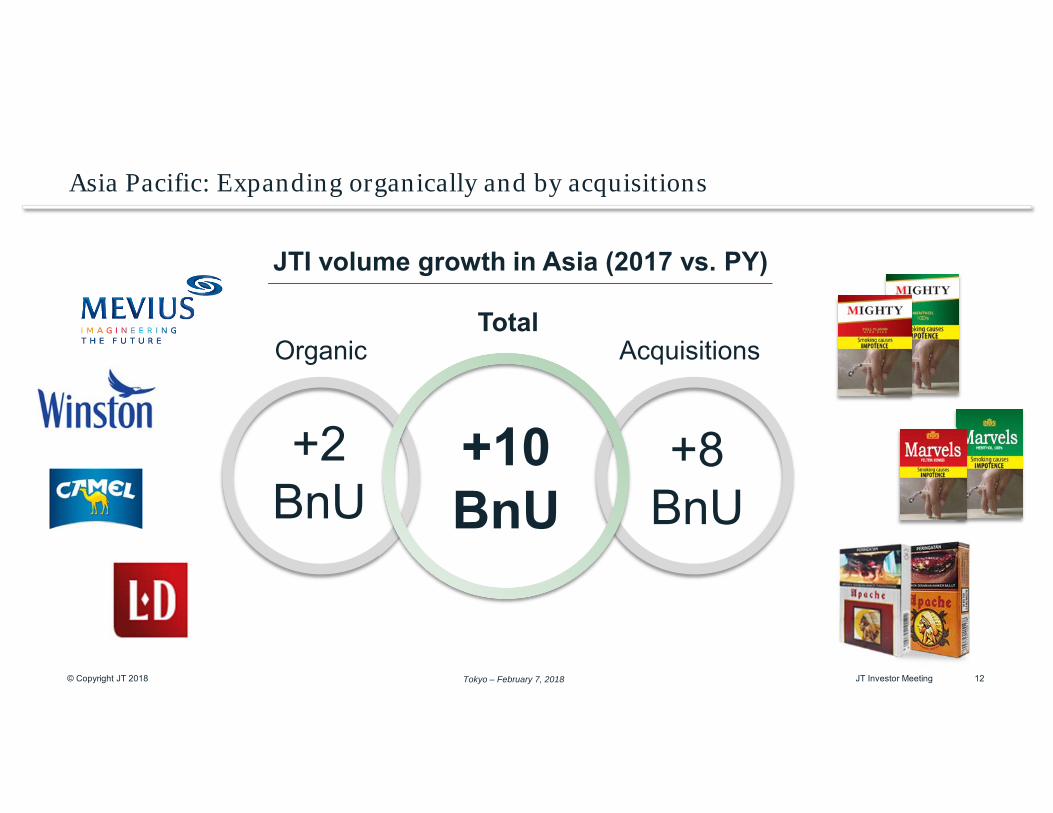
Asia Pacific: Expanding organically and by acquisitions
JTI volume growth in Asia (2017 vs. PY)
TotalAcquisitionsOrganic
+2BnU
+10BnU
+8BnU
Tokyo – February 7, 2018© Copyright JT 2018 13JT Investor Meeting
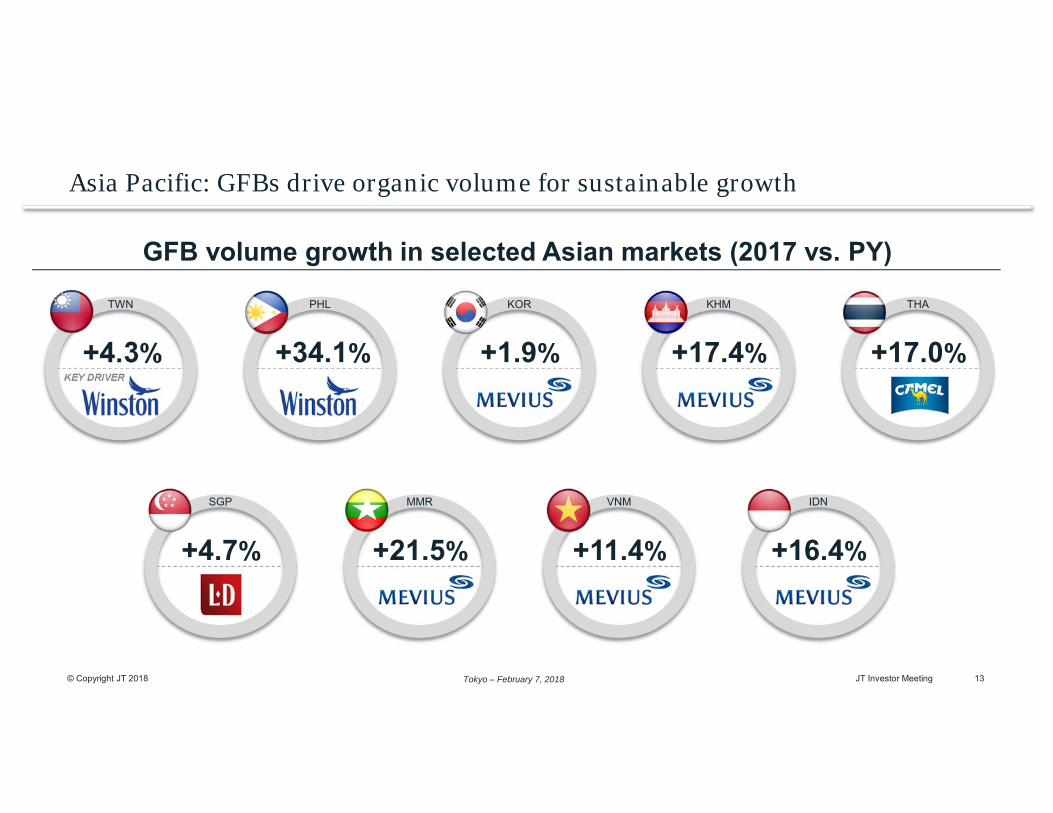
Asia Pacific: GFBs drive organic volume for sustainable growth
+4.3% +34.1% +1.9% +17.4% +17.0%
+4.7% +21.5% +11.4% +16.4%
GFB volume growth in selected Asian markets (2017 vs. PY)
KEY DRIVER
TWN PHL KOR KHM THA
SGP MMR VNM IDN
Tokyo – February 7, 2018© Copyright JT 2018 14JT Investor Meeting
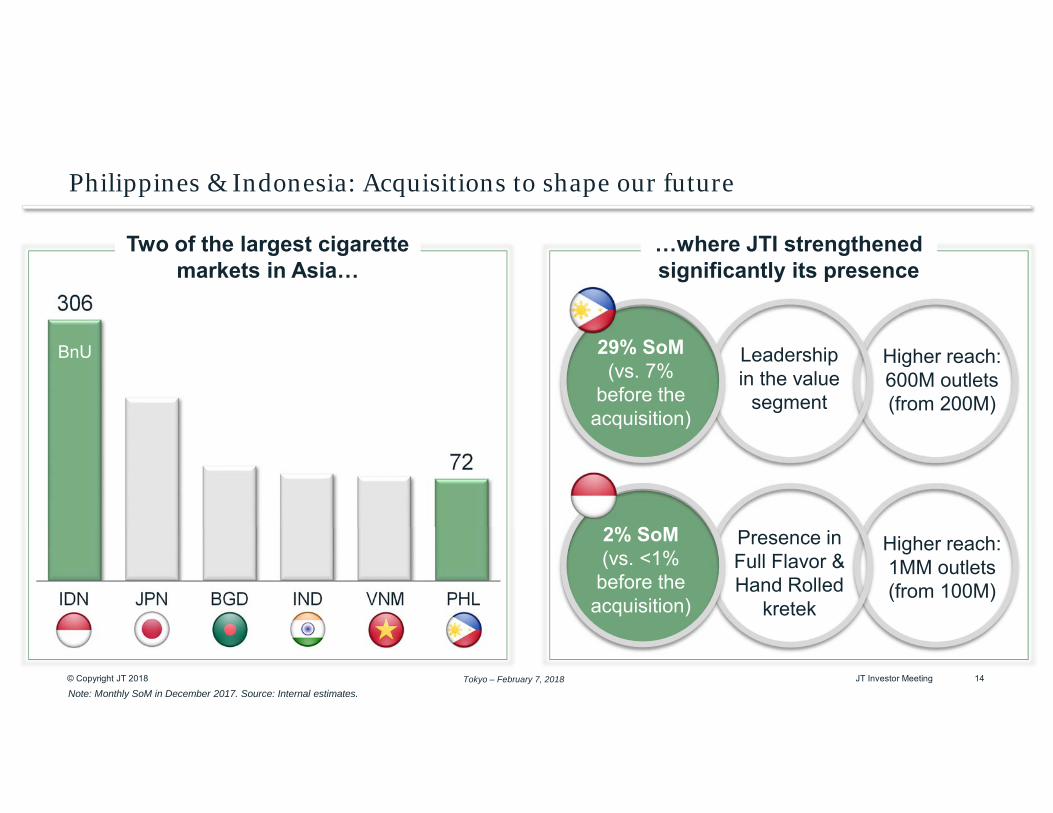
Philippines & Indonesia: Acquisitions to shape our future
306
72
Note: Monthly SoM in December 2017. Source: Internal estimates.
IDN JPN BGD IND VNM PHL
Two of the largest cigarette markets in Asia…
BnU
…where JTI strengthened significantly its presence
29% SoM (vs. 7%
before the acquisition)
2% SoM (vs. <1%
before the acquisition)
Presence in Full Flavor & Hand Rolled
kretek
Leadership in the value
segment
Higher reach: 600M outlets(from 200M)
Higher reach: 1MM outlets(from 100M)
Tokyo – February 7, 2018© Copyright JT 2018 15JT Investor Meeting
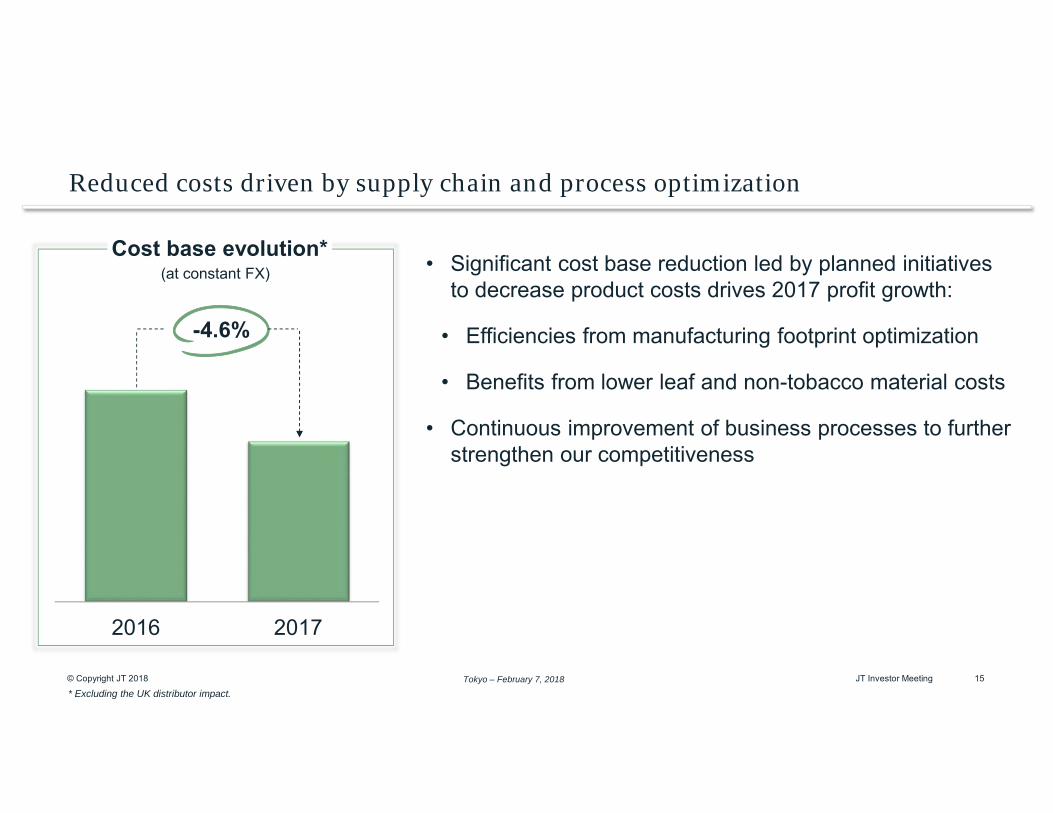
Reduced costs driven by supply chain and process optimization
• Significant cost base reduction led by planned initiatives to decrease product costs drives 2017 profit growth:
• Efficiencies from manufacturing footprint optimization
• Benefits from lower leaf and non-tobacco material costs
• Continuous improvement of business processes to further strengthen our competitiveness
2016 2017
Cost base evolution*(at constant FX)
-4.6%
* Excluding the UK distributor impact.
Tokyo – February 7, 2018© Copyright JT 2018 16JT Investor Meeting
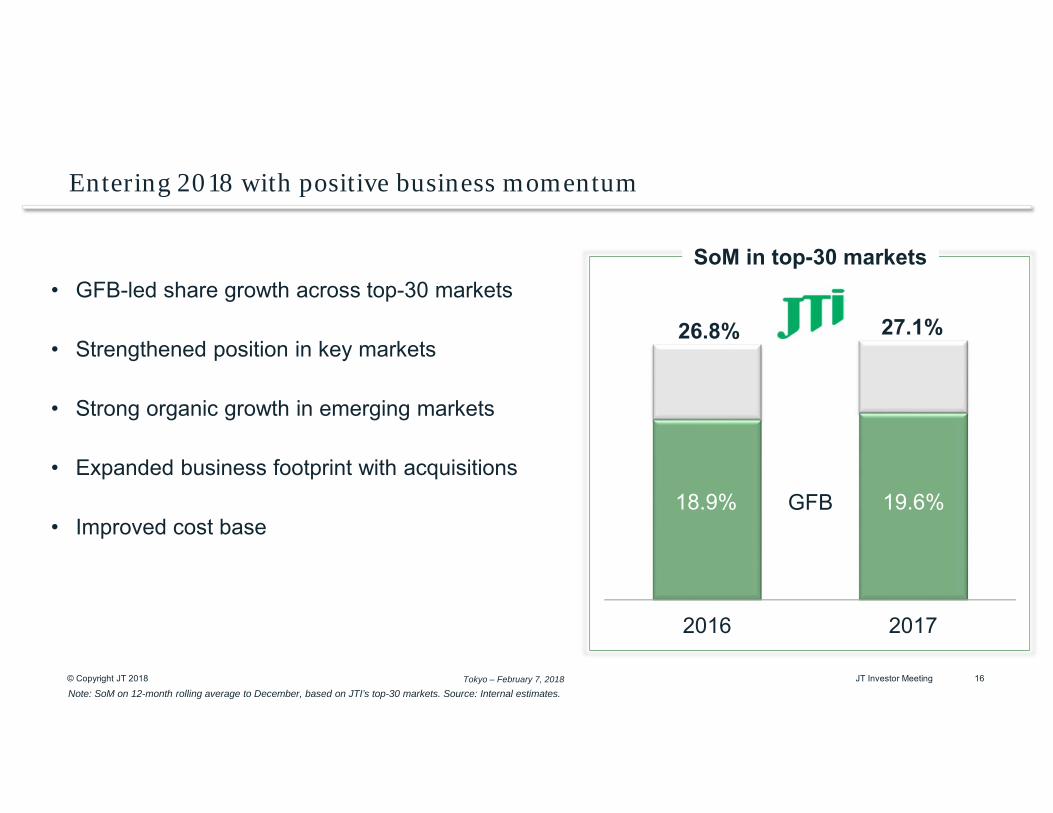
Entering 2018 with positive business momentum
Note: SoM on 12-month rolling average to December, based on JTI’s top-30 markets. Source: Internal estimates.
2016 2017
26.8% 27.1%
18.9% 19.6%
SoM in top-30 markets• GFB-led share growth across top-30 markets
• Strengthened position in key markets
• Strong organic growth in emerging markets
• Expanded business footprint with acquisitions
• Improved cost baseGFB

Tokyo – February 7, 2018
2018 Guidance
17JT Investor Meeting
Tokyo – February 7, 2018© Copyright JT 2018 18JT Investor Meeting
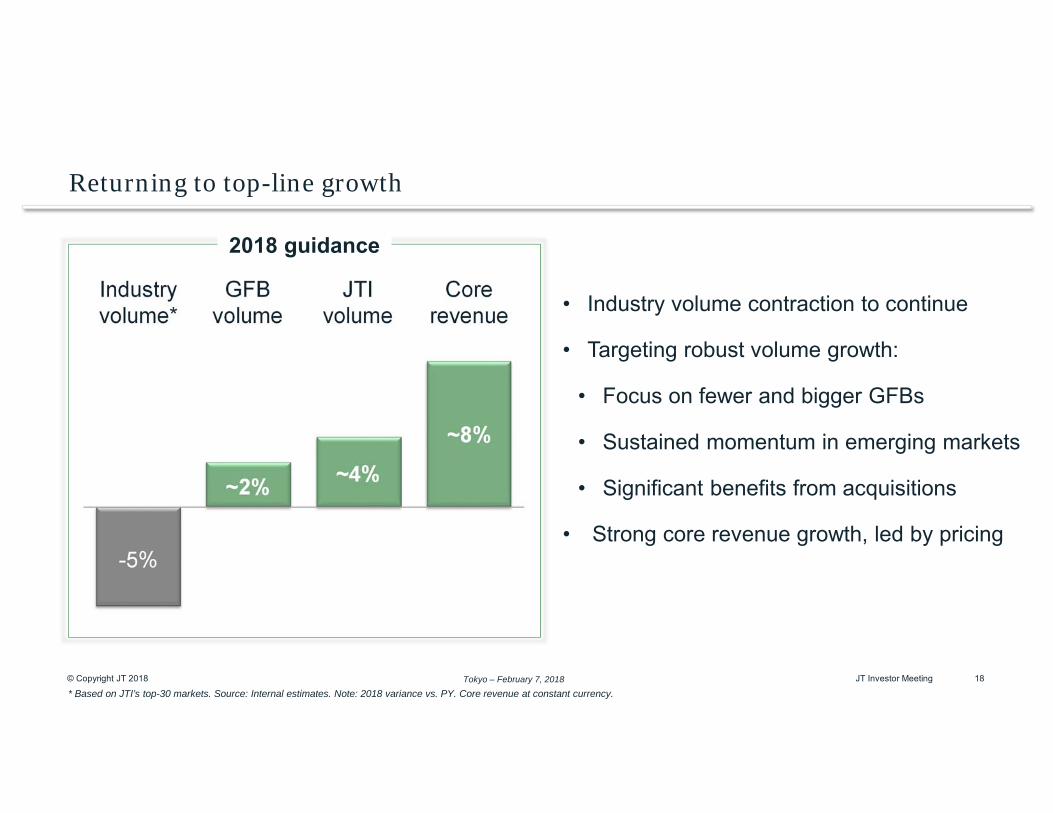
Returning to top-line growth
-5%
~2% ~4%
~8%
Industryvolume*
GFBvolume
JTIvolume
Corerevenue
* Based on JTI’s top-30 markets. Source: Internal estimates. Note: 2018 variance vs. PY. Core revenue at constant currency.
2018 guidance
• Industry volume contraction to continue
• Targeting robust volume growth:
• Focus on fewer and bigger GFBs
• Sustained momentum in emerging markets
• Significant benefits from acquisitions
• Strong core revenue growth, led by pricing
Tokyo – February 7, 2018© Copyright JT 2018 19JT Investor Meeting
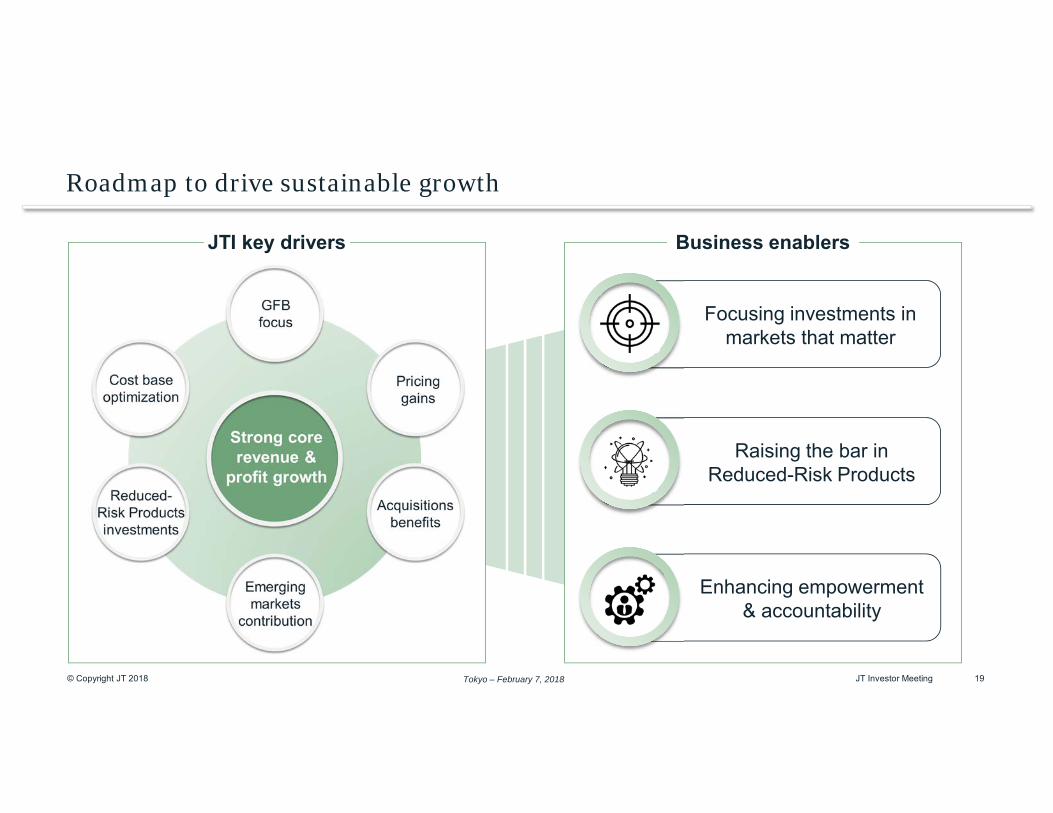
Roadmap to drive sustainable growth
JTI key drivers Business enablers
Raising the bar in Reduced-Risk Products
Focusing investments in markets that matter
Enhancing empowerment & accountability

© Copyright JT 2018 Tokyo – February 7, 2018 JT Investor Meeting 20Tokyo – February 7, 2018
[This slide is intentionally left black]