Embed Size (px)
Citation preview
1
KBC Group / BankDebt presentationFebruary 2017
KBC Group - Investor Relations Office – Email:More infomation: www.kbc.com
2
This presentation is provided for information purposes only. It does not constitute an offer to sell or the solicitation to buy anysecurity issued by the KBC Group.
KBC believes that this presentation is reliable, although some information is condensed and therefore incomplete. KBC cannot beheld liable for any loss or damage resulting from the use of the information.
This presentation contains non-IFRS information and forward-looking statements with respect to the strategy, earnings and capitaltrends of KBC, involving numerous assumptions and uncertainties. There is a risk that these statements may not be fulfilled andthat future developments differ materially. Moreover, KBC does not undertake any obligation to update the presentation in linewith new developments.
By reading this presentation, each investor is deemed to represent that it possesses sufficient expertise to understand the risksinvolved.
Important information for investors
3
4Q 2016 key takeaways for KBC Group
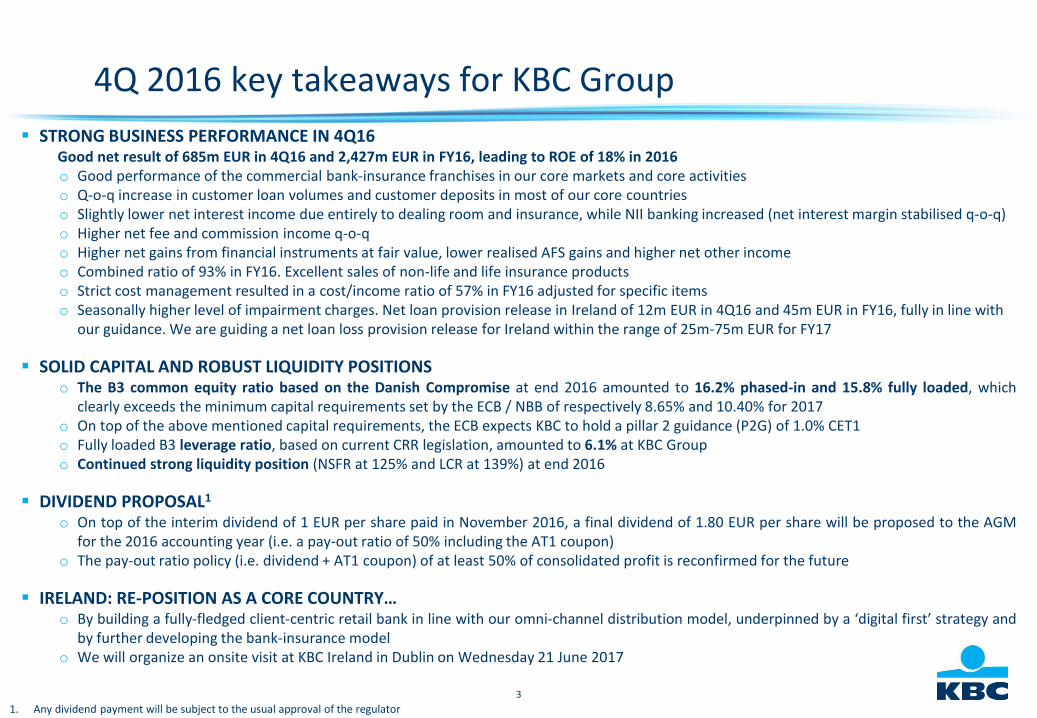
STRONG BUSINESS PERFORMANCE IN 4Q16Good net result of 685m EUR in 4Q16 and 2,427m EUR in FY16, leading to ROE of 18% in 2016o Good performance of the commercial bank-insurance franchises in our core markets and core activitieso Q-o-q increase in customer loan volumes and customer deposits in most of our core countrieso Slightly lower net interest income due entirely to dealing room and insurance, while NII banking increased (net interest margin stabilised q-o-q) o Higher net fee and commission income q-o-qo Higher net gains from financial instruments at fair value, lower realised AFS gains and higher net other income o Combined ratio of 93% in FY16. Excellent sales of non-life and life insurance productso Strict cost management resulted in a cost/income ratio of 57% in FY16 adjusted for specific items o Seasonally higher level of impairment charges. Net loan provision release in Ireland of 12m EUR in 4Q16 and 45m EUR in FY16, fully in line with
our guidance. We are guiding a net loan loss provision release for Ireland within the range of 25m-75m EUR for FY17
SOLID CAPITAL AND ROBUST LIQUIDITY POSITIONSo The B3 common equity ratio based on the Danish Compromise at end 2016 amounted to 16.2% phased-in and 15.8% fully loaded, which
clearly exceeds the minimum capital requirements set by the ECB / NBB of respectively 8.65% and 10.40% for 2017o On top of the above mentioned capital requirements, the ECB expects KBC to hold a pillar 2 guidance (P2G) of 1.0% CET1o Fully loaded B3 leverage ratio, based on current CRR legislation, amounted to 6.1% at KBC Groupo Continued strong liquidity position (NSFR at 125% and LCR at 139%) at end 2016
DIVIDEND PROPOSAL1
o On top of the interim dividend of 1 EUR per share paid in November 2016, a final dividend of 1.80 EUR per share will be proposed to the AGMfor the 2016 accounting year (i.e. a pay-out ratio of 50% including the AT1 coupon)
o The pay-out ratio policy (i.e. dividend + AT1 coupon) of at least 50% of consolidated profit is reconfirmed for the future
IRELAND: RE-POSITION AS A CORE COUNTRY…o By building a fully-fledged client-centric retail bank in line with our omni-channel distribution model, underpinned by a ‘digital first’ strategy and
by further developing the bank-insurance modelo We will organize an onsite visit at KBC Ireland in Dublin on Wednesday 21 June 2017
1. Any dividend payment will be subject to the usual approval of the regulator
4
Contents
1 Strategy and business profile
2 Financial performance
3 Balance sheet
4 Solvency and liquidity
5 MREL strategy
Appendices
6 4Q16 Wrap up
5
BE CZ SK HU BG IRL
Loans and deposits
Investment funds
Life insurance
Non-life insurance
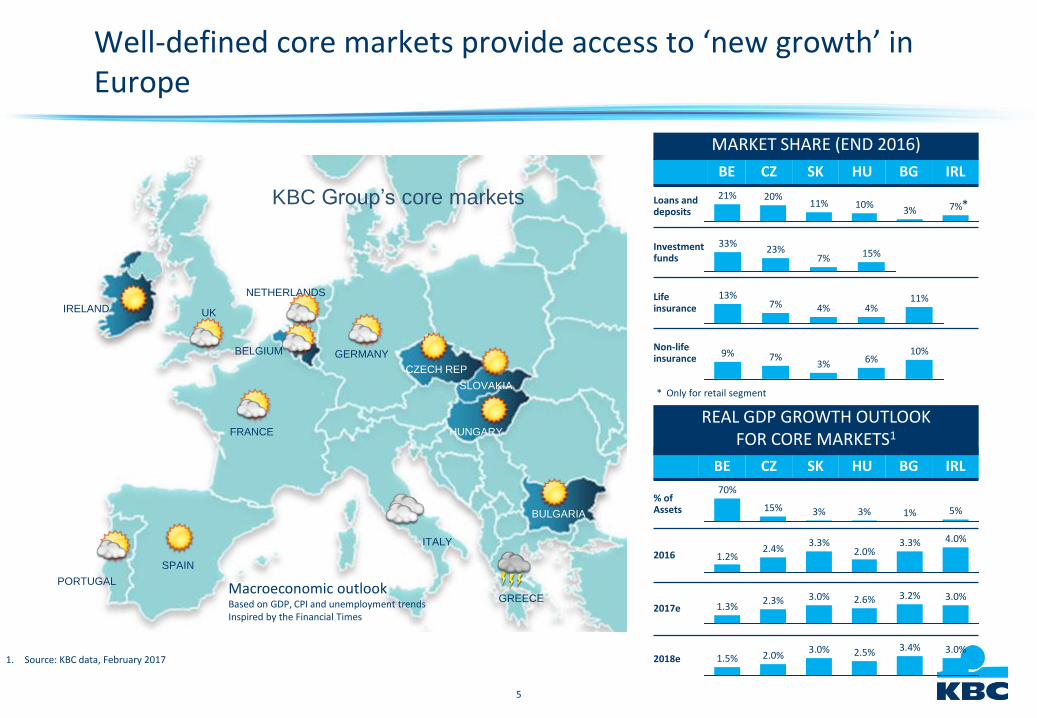
Well-defined core markets provide access to ‘new growth’ in Europe
1. Source: KBC data, February 2017
MARKET SHARE (END 2016)
10%11%20%21%
7%3%
15%7%23%
33%
11%4%4%7%
13%
9% 10%6%3%
7%
BE CZ SK HU BG IRL
% of Assets
2016
2017e
2018e
5%1%3%3%15%
70%
2.0%3.3%
2.4%1.2%
4.0%3.3%
3.0%3.2%2.6%3.0%2.3%1.3%
3.0%3.4%2.5%3.0%2.0%1.5%
REAL GDP GROWTH OUTLOOK FOR CORE MARKETS1
Macroeconomic outlookBased on GDP, CPI and unemployment trendsInspired by the Financial Times
IRELAND UK
BELGIUM
NETHERLANDS
GERMANY
CZECH REP
SLOVAKIA
HUNGARY
BULGARIA
GREECE
ITALY
PORTUGAL
SPAIN
FRANCE
KBC Group’s core markets *
* Only for retail segment
6
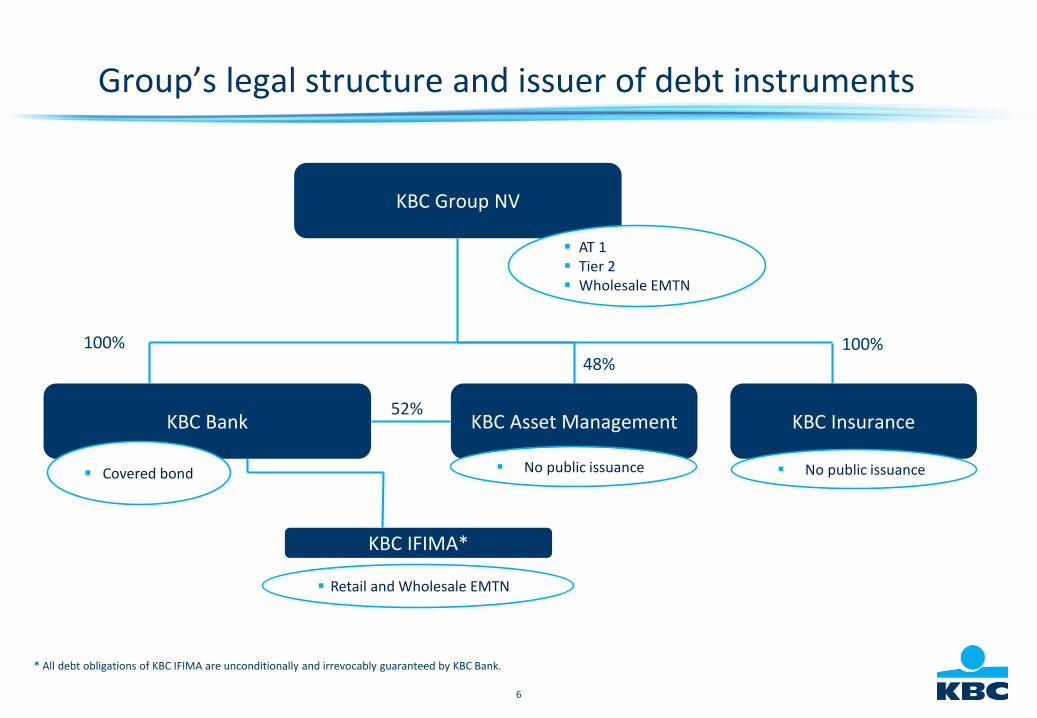
Group’s legal structure and issuer of debt instruments
KBC Group NV
KBC Bank KBC Insurance
100%100%
KBC IFIMA*
* All debt obligations of KBC IFIMA are unconditionally and irrevocably guaranteed by KBC Bank.
Retail and Wholesale EMTN
AT 1 Tier 2 Wholesale EMTN
Covered bond No public issuance
KBC Asset Management
48%
52%
No public issuance
7
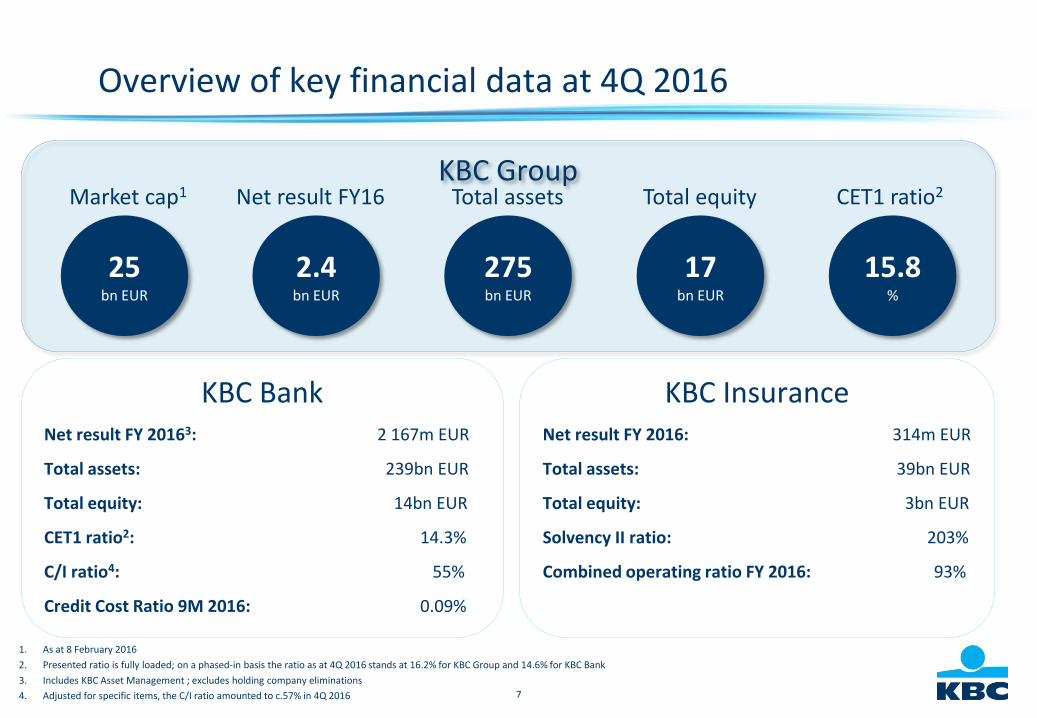
Overview of key financial data at 4Q 2016
1. As at 8 February 2016
2. Presented ratio is fully loaded; on a phased-in basis the ratio as at 4Q 2016 stands at 16.2% for KBC Group and 14.6% for KBC Bank
3. Includes KBC Asset Management ; excludes holding company eliminations
4. Adjusted for specific items, the C/I ratio amounted to c.57% in 4Q 2016
KBC Group
25bn EUR
Market cap1
2.4bn EUR
Net result FY16
275bn EUR
Total assets
17bn EUR
Total equity
15.8%
CET1 ratio2
KBC BankNet result FY 20163: 2 167m EUR
Total assets: 239bn EUR
Total equity: 14bn EUR
CET1 ratio2: 14.3%
C/I ratio4: 55%
Credit Cost Ratio 9M 2016: 0.09%
KBC InsuranceNet result FY 2016: 314m EUR
Total assets: 39bn EUR
Total equity: 3bn EUR
Solvency II ratio: 203%
Combined operating ratio FY 2016: 93%
8
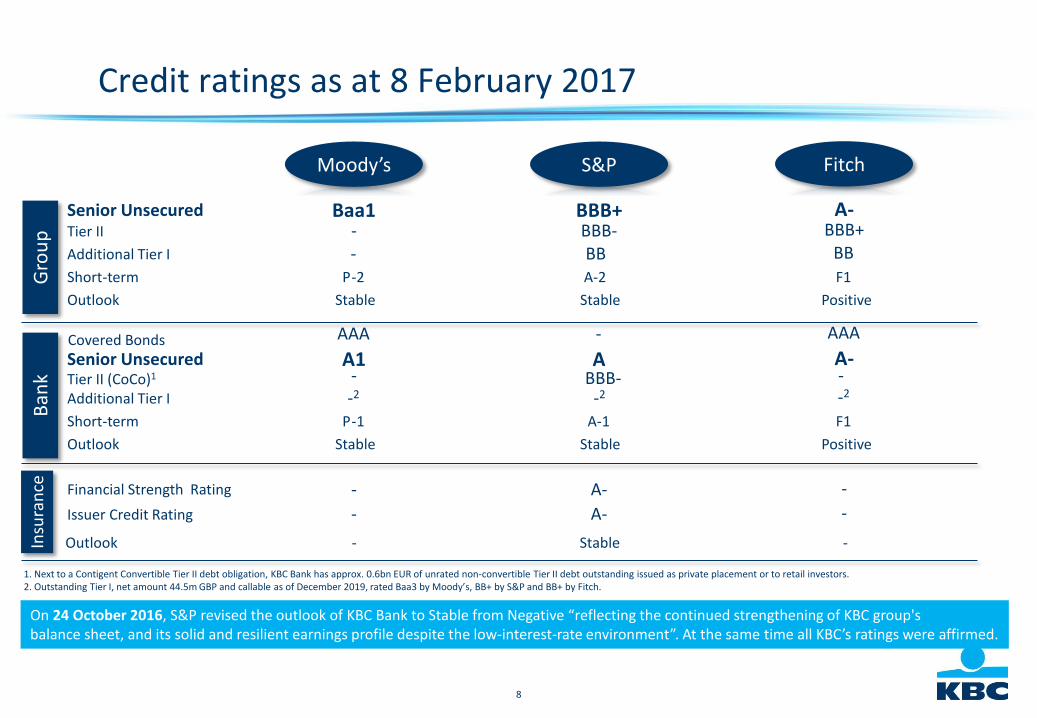
Credit ratings as at 8 February 2017
S&PMoody’s Fitch
Gro
up
Ban
kIn
sura
nce
Senior UnsecuredTier II
Additional Tier I
Short-term P-2 A-2 F1
Outlook Stable Stable Positive
Baa1 BBB+ A-- BBB- BBB+
- BB BB
Senior Unsecured
Additional Tier I
Short-term P-1 A-1 F1
Outlook Stable Stable Positive
A1 A A-
-2 -2 -2Tier II (CoCo)1
Covered Bonds AAA - AAA
-
Financial Strength Rating
Issuer Credit Rating
- A- -
- A- -
BBB-
1. Next to a Contigent Convertible Tier II debt obligation, KBC Bank has approx. 0.6bn EUR of unrated non-convertible Tier II debt outstanding issued as private placement or to retail investors.2. Outstanding Tier I, net amount 44.5m GBP and callable as of December 2019, rated Baa3 by Moody’s, BB+ by S&P and BB+ by Fitch.
Outlook - Stable -
-
On 24 October 2016, S&P revised the outlook of KBC Bank to Stable from Negative “reflecting the continued strengthening of KBC group'sbalance sheet, and its solid and resilient earnings profile despite the low-interest-rate environment”. At the same time all KBC’s ratings were affirmed.
9
Overview of KBC Group
STRONG BANK-INSURANCE GROUP PRESENT WITH LEADING MARKET POSITIONS IN ITS CORE GEOGRAPHIES (BELGIUM AND CEE)• A leading financial institution in both Belgium and the Czech Republic
• Business focus on Retail, SME & Midcap clients
• Unique selling proposition: in-depth knowledge of local markets and profound relationships with clients
INTEGRATED BANK-INSURANCE BUSINESS MODEL, LEADING TO HIGH CROSS-SELLING RATES• Strong value creator with good operational results through the cycle
• Integrated model creates cost synergies by avoiding overlap of supporting entities and generates added value for our clients through a complementary and optimised product and service offering
10
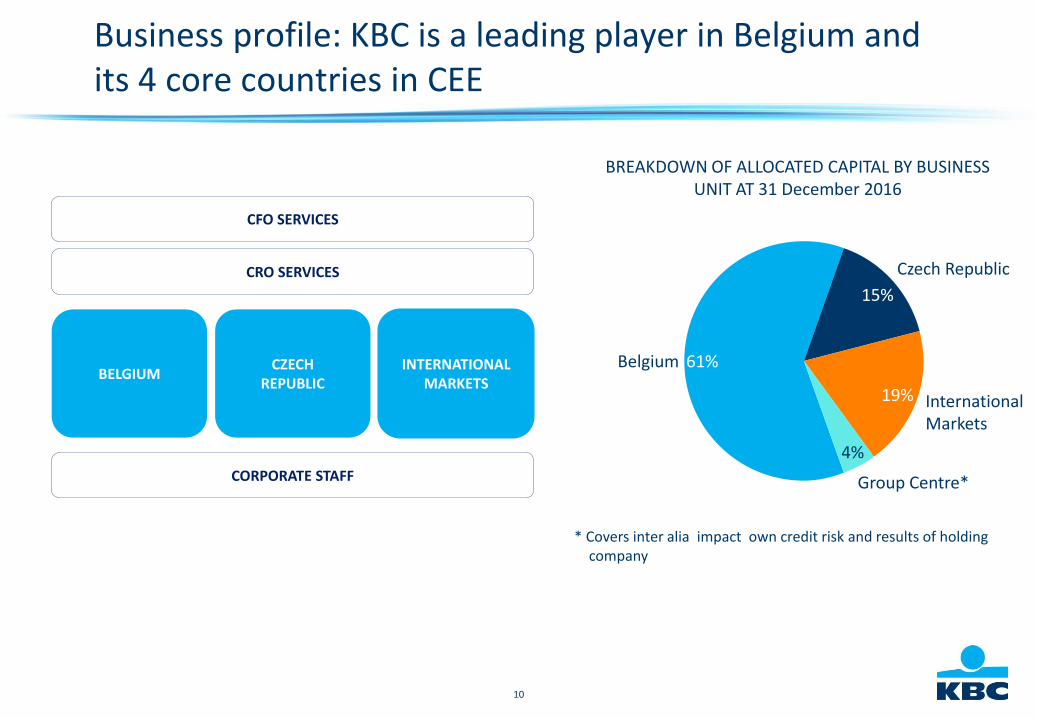
Business profile: KBC is a leading player in Belgium and its 4 core countries in CEE
BREAKDOWN OF ALLOCATED CAPITAL BY BUSINESS UNIT AT 31 December 2016
CFO SERVICES
CRO SERVICES
CORPORATE STAFF
BELGIUMCZECH
REPUBLICINTERNATIONAL
MARKETS
* Covers inter alia impact own credit risk and results of holding company
Group Centre*
4%
International Markets
19%
Czech Republic
15%
Belgium 61%
11
KBC Group going forward:To be among the best performing retail-focused institutions in Europe
KBC wants to be among Europe’s best performing retail-focused financial institutions. This will be achieved by:
• Strengthening our bank-insurance business model for retail, SME and mid-cap clients in our core markets, in a highly cost-efficient way
• Focusing on sustainable and profitable growth within the framework of solid risk, capital and liquidity management
• Creating superior client satisfaction via a seamless, multi-channel, client-centric distribution approach
By achieving this, KBC wants to become the reference in bank-insurance in its core markets
12
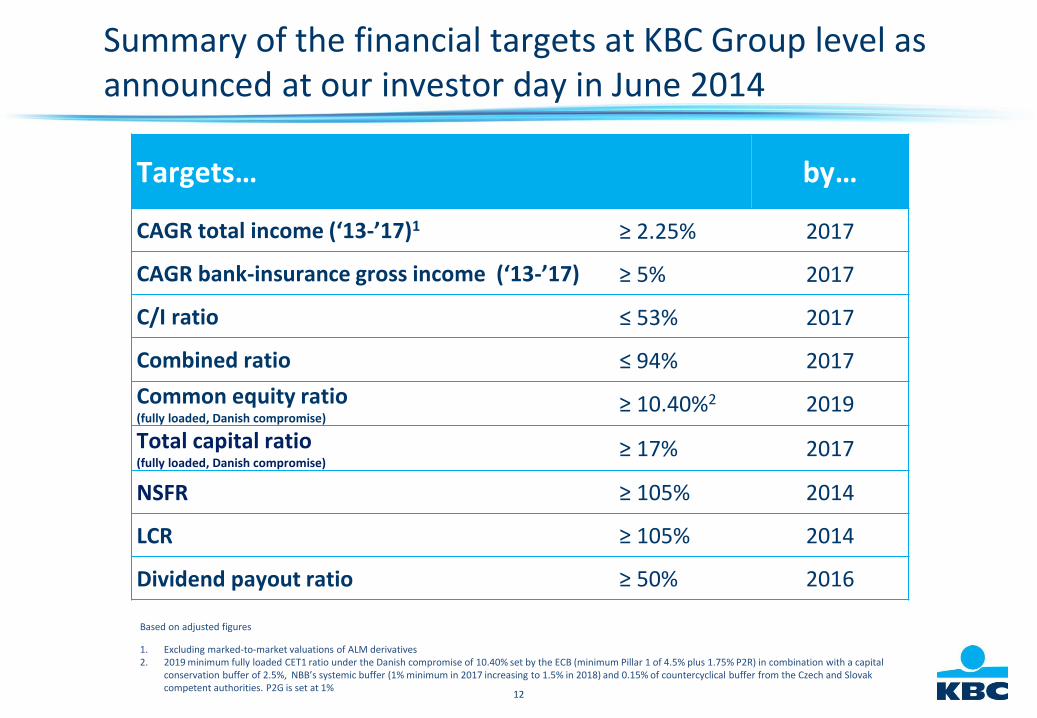
Based on adjusted figures
1. Excluding marked-to-market valuations of ALM derivatives2. 2019 minimum fully loaded CET1 ratio under the Danish compromise of 10.40% set by the ECB (minimum Pillar 1 of 4.5% plus 1.75% P2R) in combination with a capital
conservation buffer of 2.5%, NBB’s systemic buffer (1% minimum in 2017 increasing to 1.5% in 2018) and 0.15% of countercyclical buffer from the Czech and Slovak competent authorities. P2G is set at 1%
Summary of the financial targets at KBC Group level as announced at our investor day in June 2014
Targets… by…
CAGR total income (‘13-’17)1 ≥ 2.25% 2017
CAGR bank-insurance gross income (‘13-’17) ≥ 5% 2017
C/I ratio ≤ 53% 2017
Combined ratio ≤ 94% 2017
Common equity ratio (fully loaded, Danish compromise)
≥ 10.40%2 2019
Total capital ratio(fully loaded, Danish compromise)
≥ 17% 2017
NSFR ≥ 105% 2014
LCR ≥ 105% 2014
Dividend payout ratio ≥ 50% 2016
13
Contents
1 Strategy and business profile
2 Financial performance
3 Balance sheet
4 Solvency and liquidity
5 MREL strategy
Appendices
6 4Q16 Wrap up
14
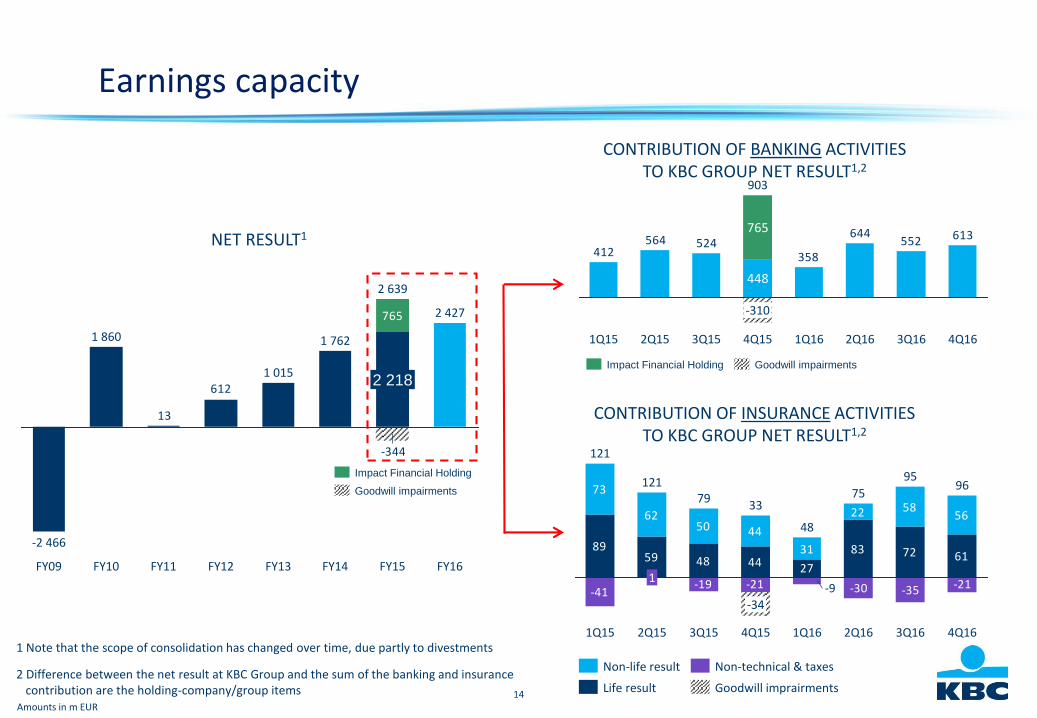
1 Note that the scope of consolidation has changed over time, due partly to divestments
2 Difference between the net result at KBC Group and the sum of the banking and insurance contribution are the holding-company/group items
CONTRIBUTION OF BANKING ACTIVITIES TO KBC GROUP NET RESULT1,2
552644
358524564
412
613
4Q163Q162Q161Q164Q15
903
448
-310
765
3Q152Q151Q15
-41
8959 48 44
83 72
73
6250 44
31
22 58
-35-30-21-19 -21-9
2761
56
4Q163Q16
95
2Q16
75
1Q16
48
4Q15
33
-34
3Q15
79
2Q15
121
1
1Q15
121
96
Goodwill imprairments
Non-technical & taxes
Life result
Non-life result
CONTRIBUTION OF INSURANCE ACTIVITIES TO KBC GROUP NET RESULT1,2
Amounts in m EUR
Earnings capacity
-344
612
13
765
FY10 FY13
1 762
FY12 FY14
1 015
1 860
FY11
2 218
2 427
FY15
2 639
FY16FY09
-2 466
NET RESULT1
Goodwill impairmentsImpact Financial Holding
Impact Financial Holding
Goodwill impairments
15
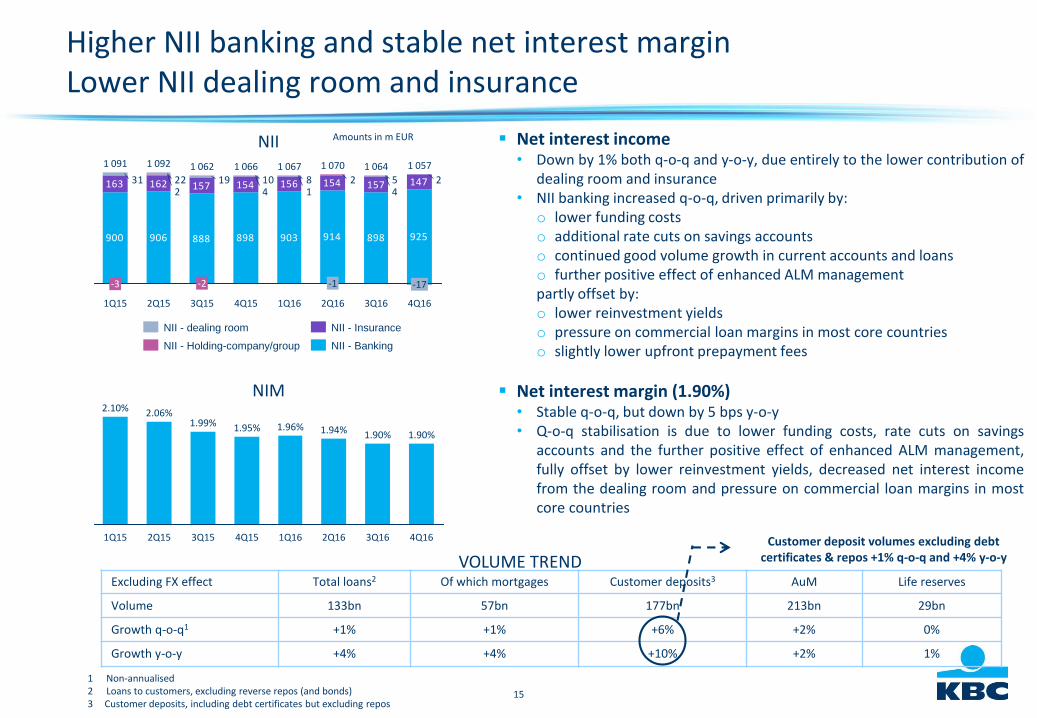
Higher NII banking and stable net interest marginLower NII dealing room and insurance
Net interest income• Down by 1% both q-o-q and y-o-y, due entirely to the lower contribution of
dealing room and insurance• NII banking increased q-o-q, driven primarily by:
o lower funding costso additional rate cuts on savings accountso continued good volume growth in current accounts and loanso further positive effect of enhanced ALM managementpartly offset by:o lower reinvestment yieldso pressure on commercial loan margins in most core countrieso slightly lower upfront prepayment fees
Net interest margin (1.90%)• Stable q-o-q, but down by 5 bps y-o-y• Q-o-q stabilisation is due to lower funding costs, rate cuts on savings
accounts and the further positive effect of enhanced ALM management,fully offset by lower reinvestment yields, decreased net interest incomefrom the dealing room and pressure on commercial loan margins in mostcore countries
NIM
NII
906 898 903 898900
162
888
154 156
914
157
925
4142147154157163 252810192231
1 057
-17
3Q16 4Q16
1 064
1Q15
-2
3Q152Q15
-3
1 0621 091
4Q15 1Q16
1 0701 0671 066
2Q16
-1
1 092
1.99%1.90%
1.95%
2.10%
1.96%
2Q15 2Q161Q16
2.06%
1Q15
1.90%
3Q164Q153Q15
1.94%
4Q16
Amounts in m EUR
NII - Holding-company/group
NII - dealing room
NII - Banking
NII - Insurance
1 Non-annualised 2 Loans to customers, excluding reverse repos (and bonds)3 Customer deposits, including debt certificates but excluding repos
VOLUME TRENDExcluding FX effect Total loans2 Of which mortgages Customer deposits3 AuM Life reserves
Volume 133bn 57bn 177bn 213bn 29bn
Growth q-o-q1 +1% +1% +6% +2% 0%
Growth y-o-y +4% +4% +10% +2% 1%
Customer deposit volumes excluding debtcertificates & repos +1% q-o-q and +4% y-o-y
16
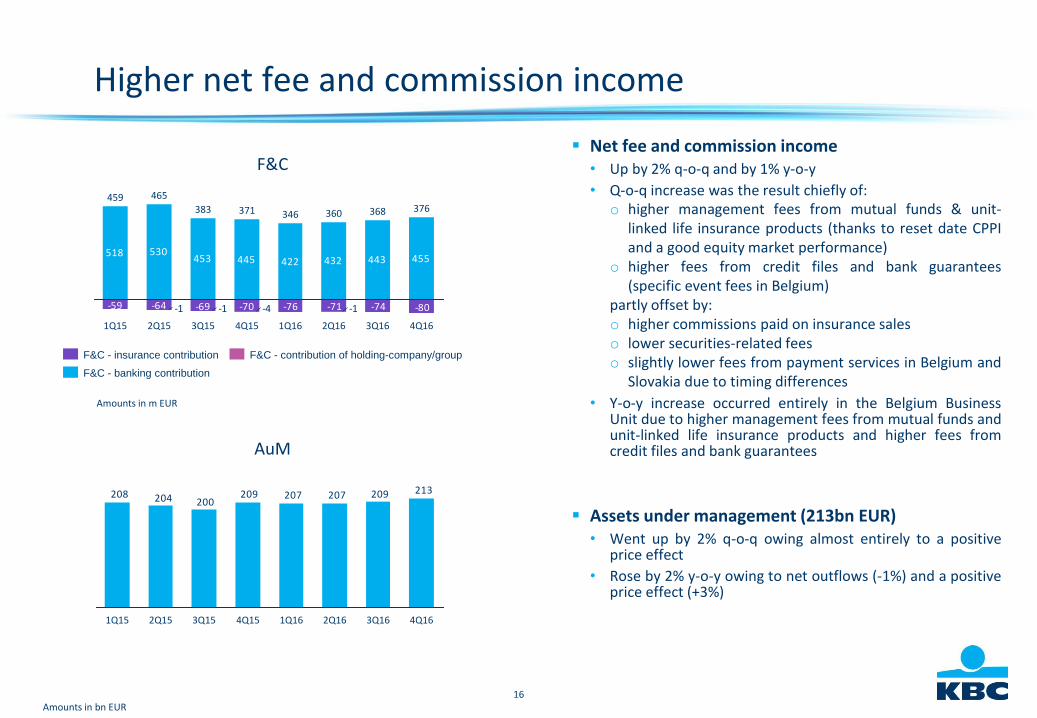
Higher net fee and commission income
Net fee and commission income• Up by 2% q-o-q and by 1% y-o-y
• Q-o-q increase was the result chiefly of:o higher management fees from mutual funds & unit-
linked life insurance products (thanks to reset date CPPIand a good equity market performance)
o higher fees from credit files and bank guarantees(specific event fees in Belgium)
partly offset by:o higher commissions paid on insurance saleso lower securities-related feeso slightly lower fees from payment services in Belgium and
Slovakia due to timing differences
• Y-o-y increase occurred entirely in the Belgium BusinessUnit due to higher management fees from mutual funds andunit-linked life insurance products and higher fees fromcredit files and bank guarantees
Assets under management (213bn EUR)• Went up by 2% q-o-q owing almost entirely to a positive
price effect
• Rose by 2% y-o-y owing to net outflows (-1%) and a positiveprice effect (+3%)
F&C
Amounts in m EUR
518 530453 445 422 432 443
-74-71-76-70-69-64-59 -80-1-4-1-1
455
4Q16
376
3Q16
368
2Q16
360
1Q16
346
4Q15
371
3Q15
383
2Q15
465
1Q15
459
F&C - contribution of holding-company/group
F&C - banking contribution
F&C - insurance contribution
Amounts in bn EUR
AuM
213209207207209200204208
4Q163Q162Q161Q164Q153Q152Q151Q15
17
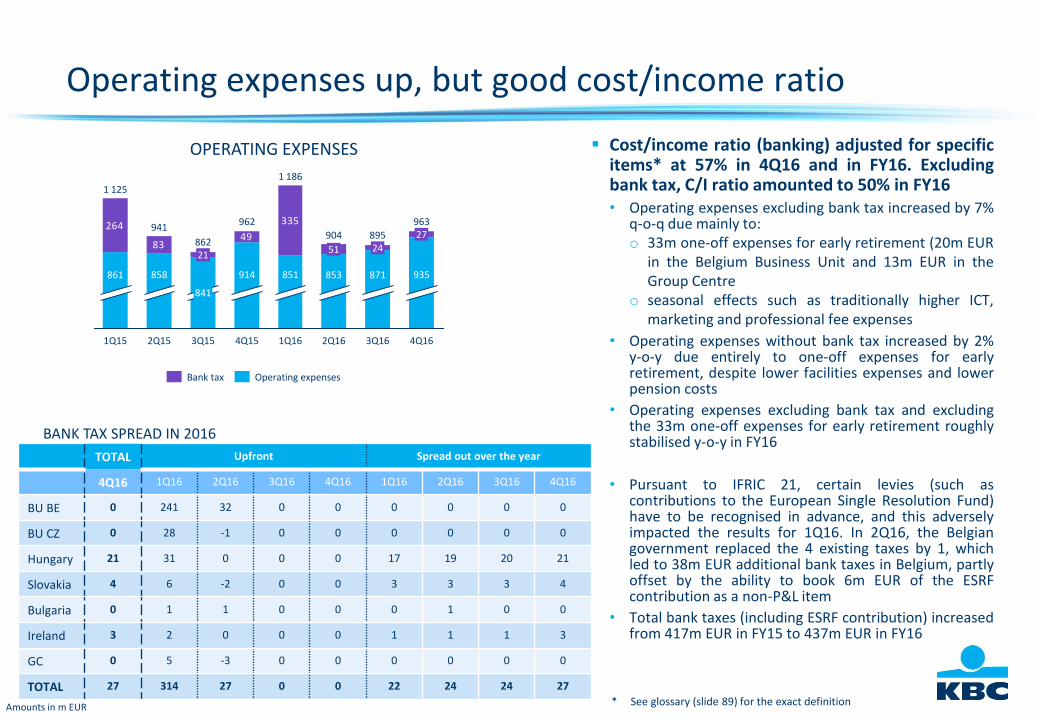
Operating expenses up, but good cost/income ratio
Cost/income ratio (banking) adjusted for specificitems* at 57% in 4Q16 and in FY16. Excludingbank tax, C/I ratio amounted to 50% in FY16• Operating expenses excluding bank tax increased by 7%
q-o-q due mainly to:o 33m one-off expenses for early retirement (20m EUR
in the Belgium Business Unit and 13m EUR in theGroup Centre
o seasonal effects such as traditionally higher ICT,marketing and professional fee expenses
• Operating expenses without bank tax increased by 2%y-o-y due entirely to one-off expenses for earlyretirement, despite lower facilities expenses and lowerpension costs
• Operating expenses excluding bank tax and excludingthe 33m one-off expenses for early retirement roughlystabilised y-o-y in FY16
• Pursuant to IFRIC 21, certain levies (such ascontributions to the European Single Resolution Fund)have to be recognised in advance, and this adverselyimpacted the results for 1Q16. In 2Q16, the Belgiangovernment replaced the 4 existing taxes by 1, whichled to 38m EUR additional bank taxes in Belgium, partlyoffset by the ability to book 6m EUR of the ESRFcontribution as a non-P&L item
• Total bank taxes (including ESRF contribution) increasedfrom 417m EUR in FY15 to 437m EUR in FY16
OPERATING EXPENSES
264
8349
335
2Q15
21
841
914
3Q15
862
1 186
851
962
4Q15
904
853
51
1Q16
895
871
2Q16
24
4Q16
963
3Q16
27
935861
941
858
1 125
1Q15
Bank tax Operating expenses
* See glossary (slide 89) for the exact definitionAmounts in m EUR
TOTAL Upfront Spread out over the year
4Q16 1Q16 2Q16 3Q16 4Q16 1Q16 2Q16 3Q16 4Q16
BU BE 0 241 32 0 0 0 0 0 0
BU CZ 0 28 -1 0 0 0 0 0 0
Hungary 21 31 0 0 0 17 19 20 21
Slovakia 4 6 -2 0 0 3 3 3 4
Bulgaria 0 1 1 0 0 0 1 0 0
Ireland 3 2 0 0 0 1 1 1 3
GC 0 5 -3 0 0 0 0 0 0
TOTAL 27 314 27 0 0 22 24 24 27
BANK TAX SPREAD IN 2016
18
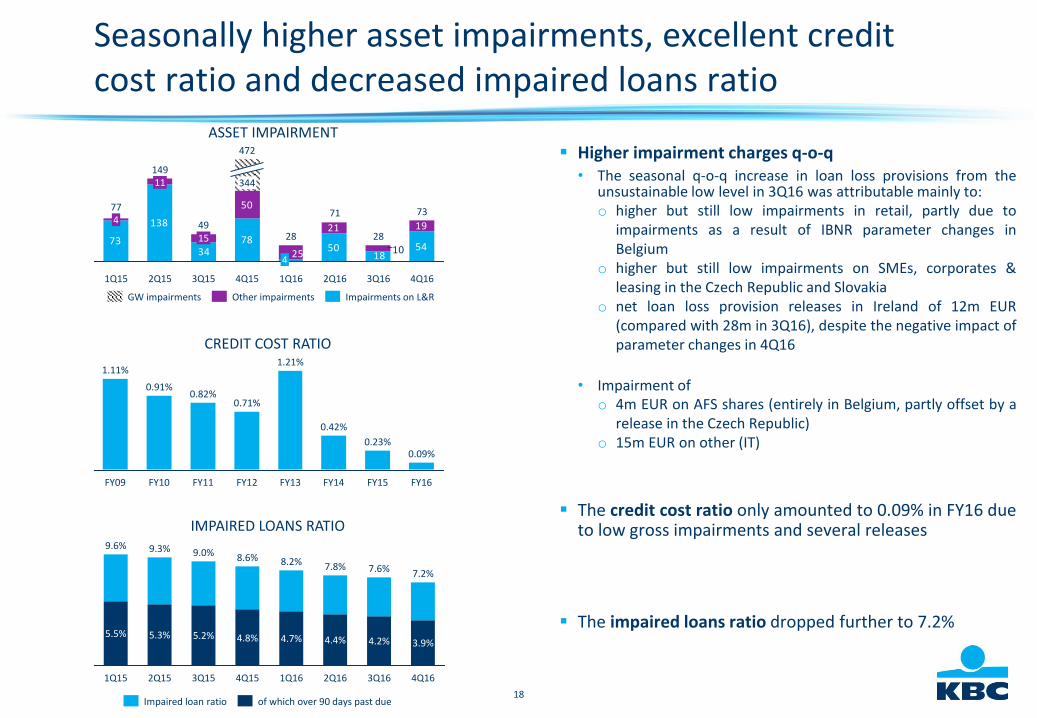
Seasonally higher asset impairments, excellent credit cost ratio and decreased impaired loans ratio
Higher impairment charges q-o-q• The seasonal q-o-q increase in loan loss provisions from the
unsustainable low level in 3Q16 was attributable mainly to:o higher but still low impairments in retail, partly due to
impairments as a result of IBNR parameter changes inBelgium
o higher but still low impairments on SMEs, corporates &leasing in the Czech Republic and Slovakia
o net loan loss provision releases in Ireland of 12m EUR(compared with 28m in 3Q16), despite the negative impact ofparameter changes in 4Q16
• Impairment ofo 4m EUR on AFS shares (entirely in Belgium, partly offset by a
release in the Czech Republic)o 15m EUR on other (IT)
The credit cost ratio only amounted to 0.09% in FY16 dueto low gross impairments and several releases
The impaired loans ratio dropped further to 7.2%
ASSET IMPAIRMENT
73
138
7850
50
21
1834 5425 10
194
1Q15
77
3Q162Q16 4Q16
73
28
71
1Q16
4
28
4Q15
472
344
3Q15
4915
2Q15
14911
IMPAIRED LOANS RATIO
1Q164Q15
4.8%
9.6%
4.4%
8.2%
4.7%
2Q16
8.6%
3Q15
9.0%
5.2%
2Q15
7.8%
1Q15
5.3%
9.3%
5.5%
3Q16
7.6%
4.2%
4Q16
3.9%
7.2%
CREDIT COST RATIO
FY15FY14
1.21%
0.09%
0.42%
FY16
0.23%
FY13FY12FY09
0.91%
FY11
0.71%
FY10
0.82%
1.11%
of which over 90 days past dueImpaired loan ratio
GW impairments Impairments on L&ROther impairments
19
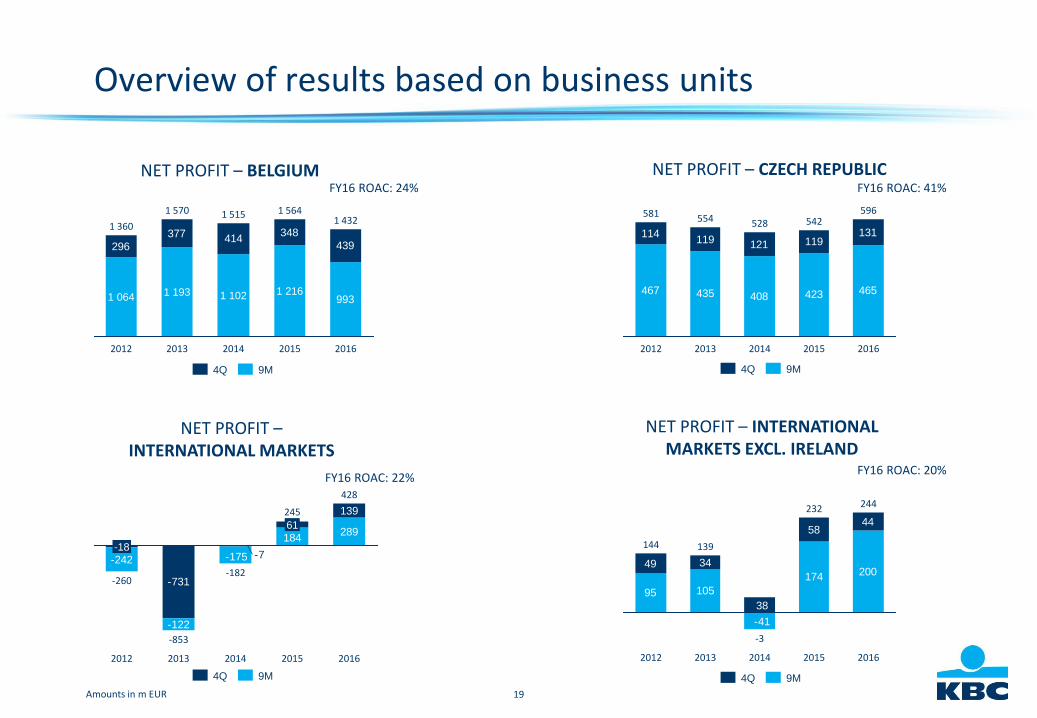
NET PROFIT – BELGIUM NET PROFIT – CZECH REPUBLIC
296
377 414348
439
993
2013
1 570
1 193
2012
1 360
1 064
2016
1 432
2015
1 564
1 216
2014
1 515
1 102
FY16 ROAC: 24%
Amounts in m EUR
467 435 408 423 465
114119 121 119
131
2016
596
2015
542
2014
528
2013
554
2012
581
FY16 ROAC: 41%
NET PROFIT –INTERNATIONAL MARKETS
-731
289
-242
-122
139
184
-7-175
-853
2012
-260
-18
2016
428
2015
24561
2014
-182
2013
FY16 ROAC: 22%
105
174
49 34
5844
200
-41
95
38
2016
244
2015
232
2014
-3
2013
139
2012
144
NET PROFIT – INTERNATIONAL MARKETS EXCL. IRELAND
Overview of results based on business units
9M4Q 4Q 9M
4Q 9M 4Q 9M
FY16 ROAC: 20%
20
Contents
1 Strategy and business profile
2 Financial performance
3 Balance sheet
4 Solvency and liquidity
5 MREL strategy
Appendices
6 4Q16 Wrap up
21
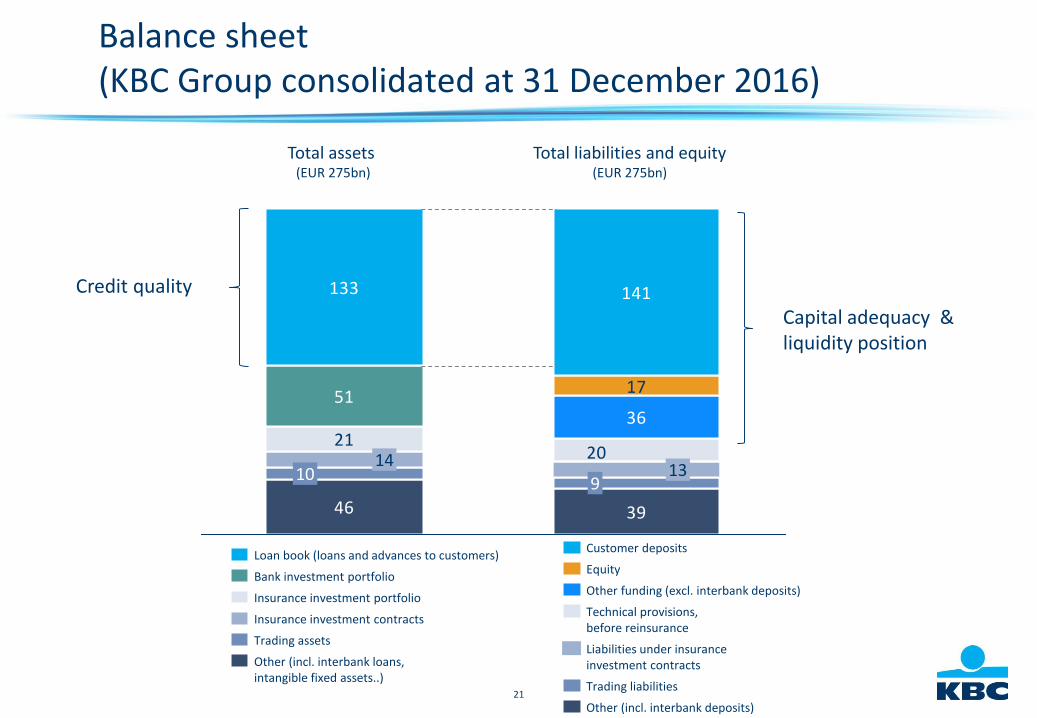
Balance sheet(KBC Group consolidated at 31 December 2016)
46
21
51
133
1014
Total assets (EUR 275bn)
Insurance investment contracts
Insurance investment portfolio
Bank investment portfolio
Loan book (loans and advances to customers)
Other (incl. interbank loans, intangible fixed assets..)
Trading assets
39
20
36
17
141
913
Total liabilities and equity (EUR 275bn)
Liabilities under insuranceinvestment contracts
Technical provisions,before reinsurance
Other funding (excl. interbank deposits)
Trading liabilities
Other (incl. interbank deposits)
Equity
Customer deposits
Credit quality
Capital adequacy &liquidity position
22
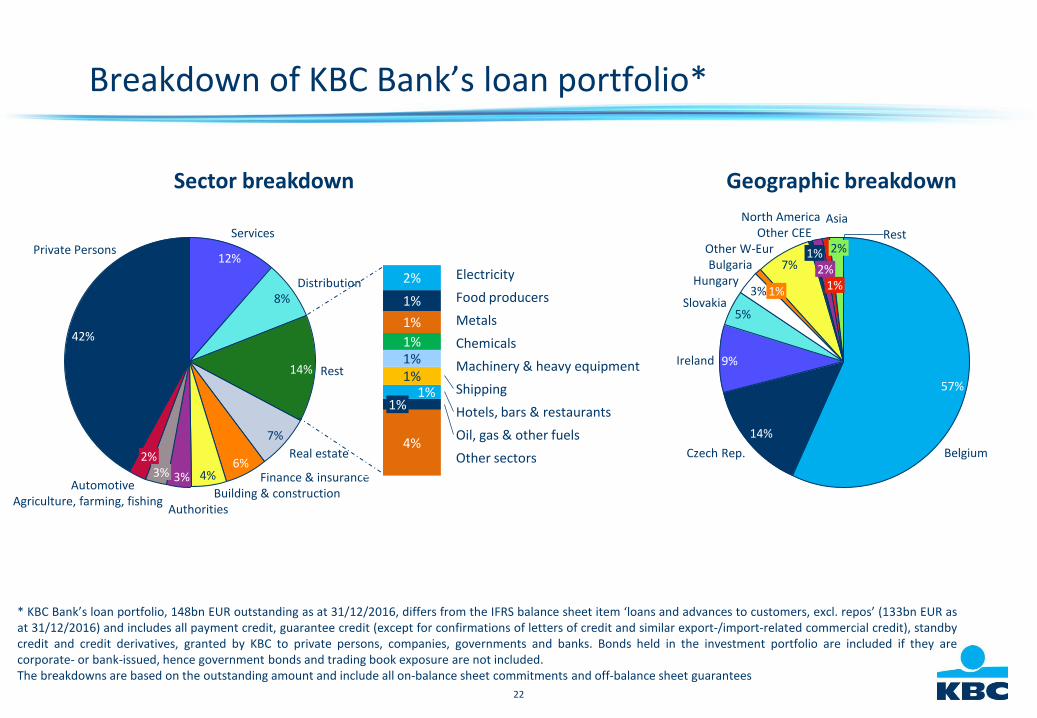
Breakdown of KBC Bank’s loan portfolio*
Private Persons
42%
Automotive
2%
Agriculture, farming, fishing
3%
Authorities
3%Building & construction
4% Finance & insurance6%
Real estate
7%
Rest14%
Distribution8%
Services
12%
* KBC Bank’s loan portfolio, 148bn EUR outstanding as at 31/12/2016, differs from the IFRS balance sheet item ‘loans and advances to customers, excl. repos’ (133bn EUR asat 31/12/2016) and includes all payment credit, guarantee credit (except for confirmations of letters of credit and similar export-/import-related commercial credit), standbycredit and credit derivatives, granted by KBC to private persons, companies, governments and banks. Bonds held in the investment portfolio are included if they arecorporate- or bank-issued, hence government bonds and trading book exposure are not included.The breakdowns are based on the outstanding amount and include all on-balance sheet commitments and off-balance sheet guarantees
4%Oil, gas & other fuels
Hotels, bars & restaurants
Shipping
Machinery & heavy equipment
Chemicals
Metals
Food producers
Electricity
Other sectors
1%1%
1%1%1%
1%
1%
2%
Sector breakdown Geographic breakdown
Other CEENorth America
1%2%
Asia
1%
Other W-Eur7%Bulgaria
1%Hungary
3%Slovakia
5%
Ireland 9%
Czech Rep.
14%
Belgium
57%
2%Rest
23
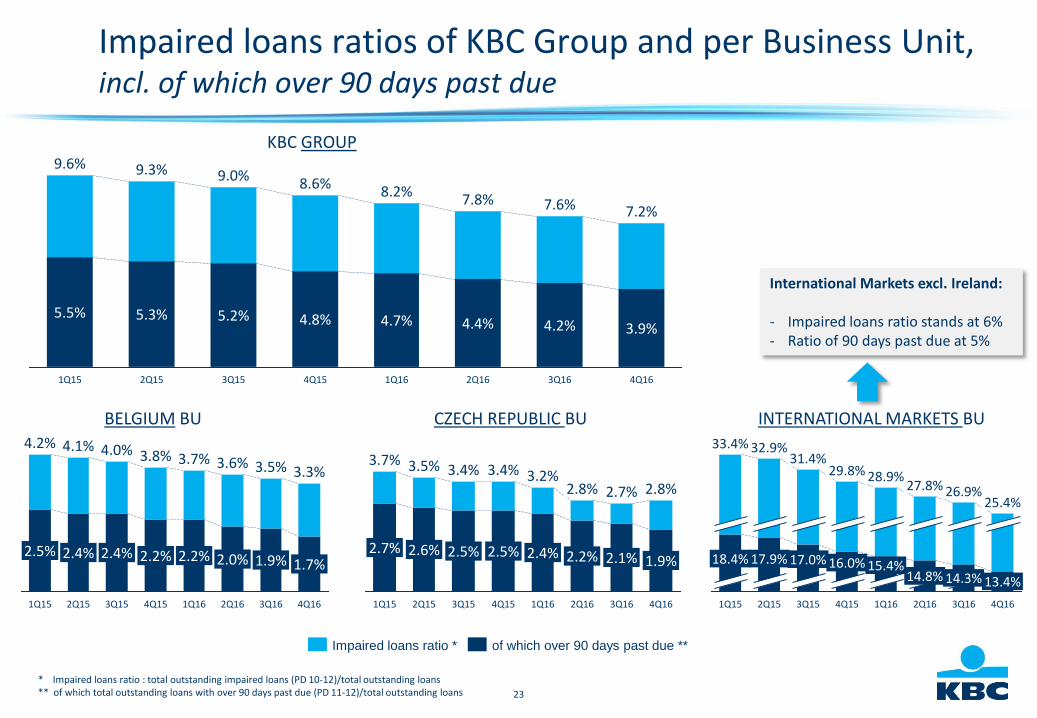
Impaired loans ratios of KBC Group and per Business Unit, incl. of which over 90 days past due
BELGIUM BU
KBC GROUP
INTERNATIONAL MARKETS BUCZECH REPUBLIC BU
* Impaired loans ratio : total outstanding impaired loans (PD 10-12)/total outstanding loans** of which total outstanding loans with over 90 days past due (PD 11-12)/total outstanding loans
3.9%
7.2%
4Q163Q16
7.6%
4.2%
2Q16
7.8%
4.4%
1Q16
8.2%
4.7%
4Q15
8.6%
4.8%
3Q15
9.0%
5.2%
2Q15
9.3%
5.3%
1Q15
9.6%
5.5%
of which over 90 days past due **Impaired loans ratio *
1.7%
3.3%
4Q163Q16
3.5%
1.9%
2Q16
3.6%
2.0%
1Q16
3.7%
2.2%
4Q15
3.8%
2.2%
3Q15
4.0%
2.4%
2Q15
4.1%
2.4%
1Q15
4.2%
2.5%
4Q163Q16
2.7%
2.1%
2Q16
2.8%
2.2%
1Q16
3.2%
2.4%
4Q15
3.4%
2.5%
3Q15
3.4%
2.5%
2Q15
3.5%
2.6%
1Q15
3.7%
2.7%1.9%
2.8%
4Q15 3Q16
26.9%
14.3%
29.8%
16.0%
3Q15
31.4%
17.0%
2Q15
32.9%
17.9%
1Q15
33.4%
18.4%
2Q16
13.4%
25.4%
4Q161Q16
15.4%
28.9%27.8%
14.8%
International Markets excl. Ireland:
- Impaired loans ratio stands at 6%- Ratio of 90 days past due at 5%
24
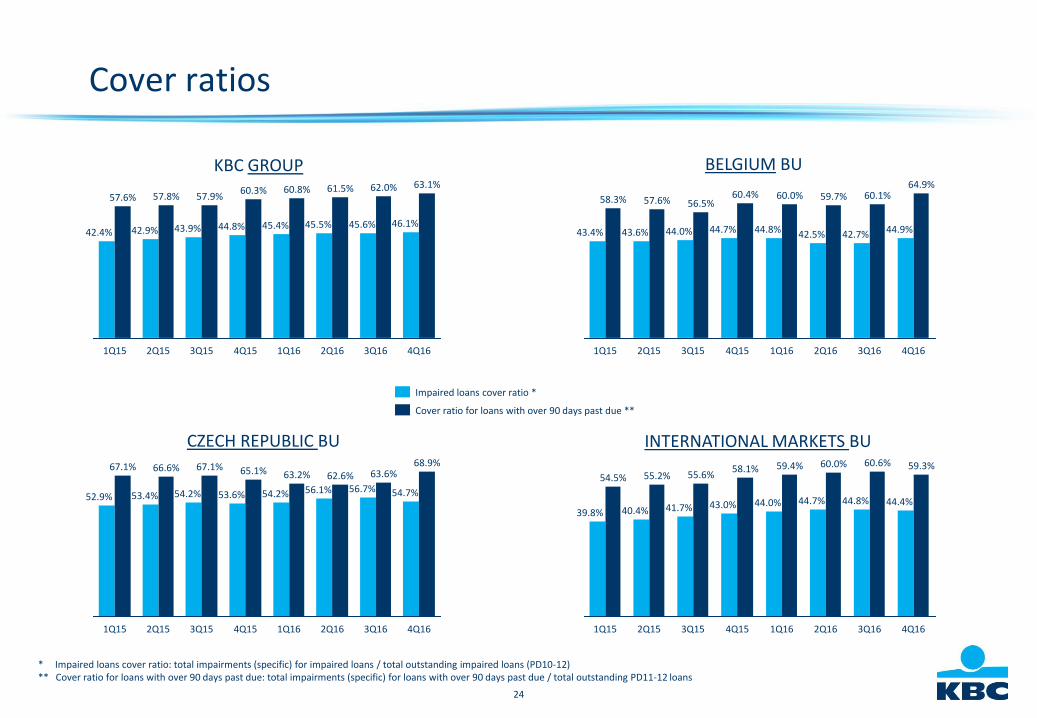
Cover ratios
INTERNATIONAL MARKETS BUCZECH REPUBLIC BU
BELGIUM BUKBC GROUP
* Impaired loans cover ratio: total impairments (specific) for impaired loans / total outstanding impaired loans (PD10-12)** Cover ratio for loans with over 90 days past due: total impairments (specific) for loans with over 90 days past due / total outstanding PD11-12 loans
46.1%
63.1%
4Q163Q16
62.0%
45.6%
2Q16
61.5%
45.5%
1Q16
60.8%
45.4%
4Q15
60.3%
44.8%
3Q15
57.9%
43.9%
2Q15
57.8%
42.9%
1Q15
57.6%
42.4%
Cover ratio for loans with over 90 days past due **
Impaired loans cover ratio *
4Q16
54.7%
68.9%
3Q16
63.6%
56.7%
2Q16
62.6%
56.1%
1Q16
63.2%
54.2%
4Q15
65.1%
53.6%
3Q15
67.1%
54.2%
2Q15
66.6%
53.4%
1Q15
67.1%
52.9%
4Q163Q16
60.1%
42.7%
2Q16
59.7%
42.5%
1Q16
60.0%
44.8%
4Q15
60.4%
44.7%
3Q15
56.5%
44.0%
2Q15
57.6%
43.6%
1Q15
58.3%
43.4%
64.9%
44.9%
44.4%
59.3%
4Q163Q16
60.6%
44.8%
2Q16
60.0%
44.7%
1Q16
59.4%
44.0%
4Q15
58.1%
43.0%
3Q15
55.6%
41.7%
2Q15
55.2%
40.4%
1Q15
54.5%
39.8%
25
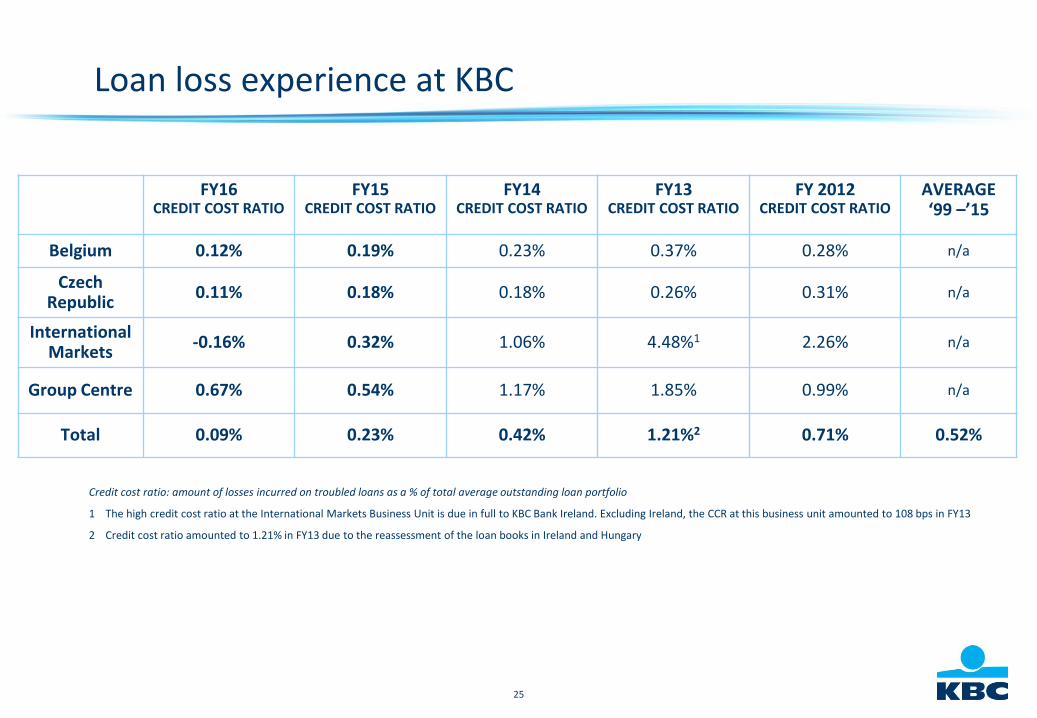
Loan loss experience at KBC
FY16CREDIT COST RATIO
FY15CREDIT COST RATIO
FY14CREDIT COST RATIO
FY13CREDIT COST RATIO
FY 2012CREDIT COST RATIO
AVERAGE ‘99 –’15
Belgium 0.12% 0.19% 0.23% 0.37% 0.28% n/a
Czech Republic
0.11% 0.18% 0.18% 0.26% 0.31% n/a
International Markets
-0.16% 0.32% 1.06% 4.48%1 2.26% n/a
Group Centre 0.67% 0.54% 1.17% 1.85% 0.99% n/a
Total 0.09% 0.23% 0.42% 1.21%2 0.71% 0.52%
Credit cost ratio: amount of losses incurred on troubled loans as a % of total average outstanding loan portfolio
1 The high credit cost ratio at the International Markets Business Unit is due in full to KBC Bank Ireland. Excluding Ireland, the CCR at this business unit amounted to 108 bps in FY13
2 Credit cost ratio amounted to 1.21% in FY13 due to the reassessment of the loan books in Ireland and Hungary
26
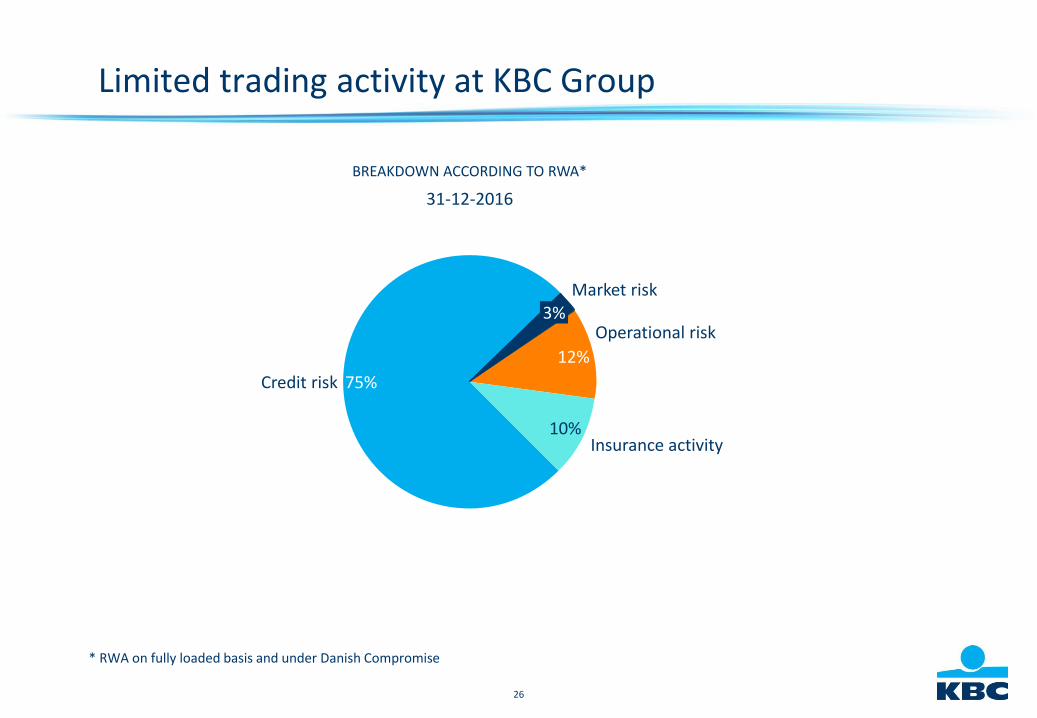
* RWA on fully loaded basis and under Danish Compromise
Limited trading activity at KBC Group
31-12-2016
Insurance activity10%
Operational risk
12%
Market risk3%
Credit risk 75%
BREAKDOWN ACCORDING TO RWA*
27
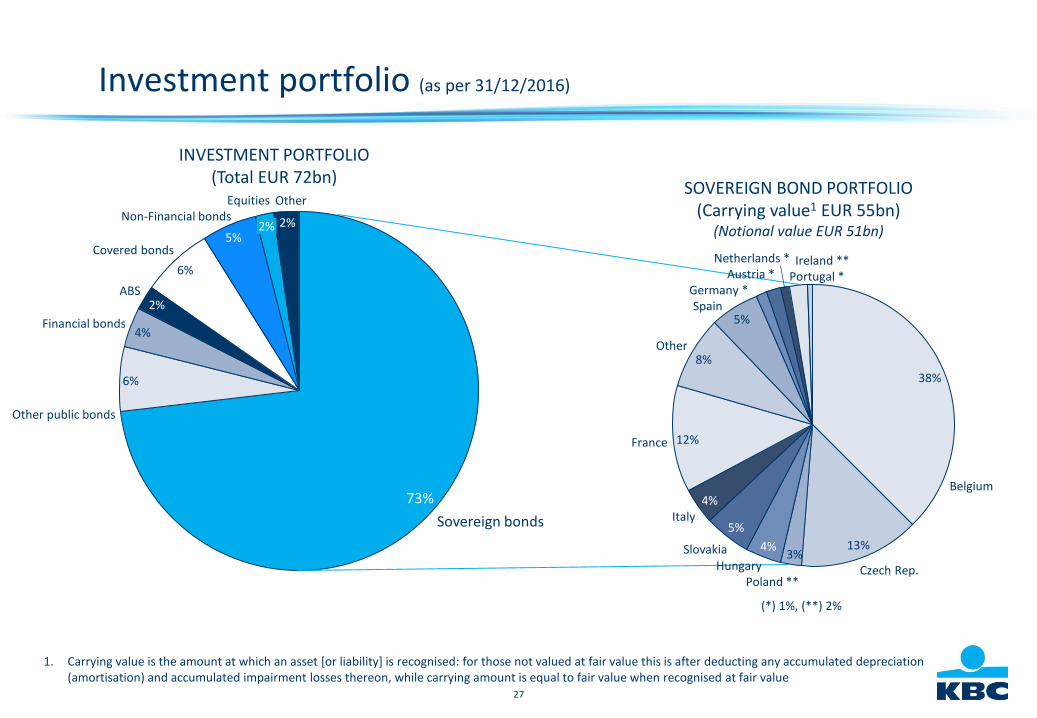
Investment portfolio (as per 31/12/2016)
Other
2%
Equities
2%Non-Financial bonds
5%Covered bonds
6%
ABS2%
Financial bonds4%
Other public bonds
6%
Sovereign bonds
73%
(*) 1%, (**) 2%
INVESTMENT PORTFOLIO (Total EUR 72bn)
SOVEREIGN BOND PORTFOLIO (Carrying value1 EUR 55bn)
(Notional value EUR 51bn)
1. Carrying value is the amount at which an asset [or liability] is recognised: for those not valued at fair value this is after deducting any accumulated depreciation (amortisation) and accumulated impairment losses thereon, while carrying amount is equal to fair value when recognised at fair value
8%
France
Spain5%
Other
Germany *
Slovakia
5%
Hungary
4%
Poland **
3%Czech Rep.
13%
Belgium
38%
Ireland **Austria * Portugal *
Netherlands *
Italy
12%
4%
28
Contents
1 Strategy and business profile
2 Financial performance
3 Balance sheet
4 Solvency and liquidity
5 MREL strategy
Appendices
6 4Q16 Wrap up
29
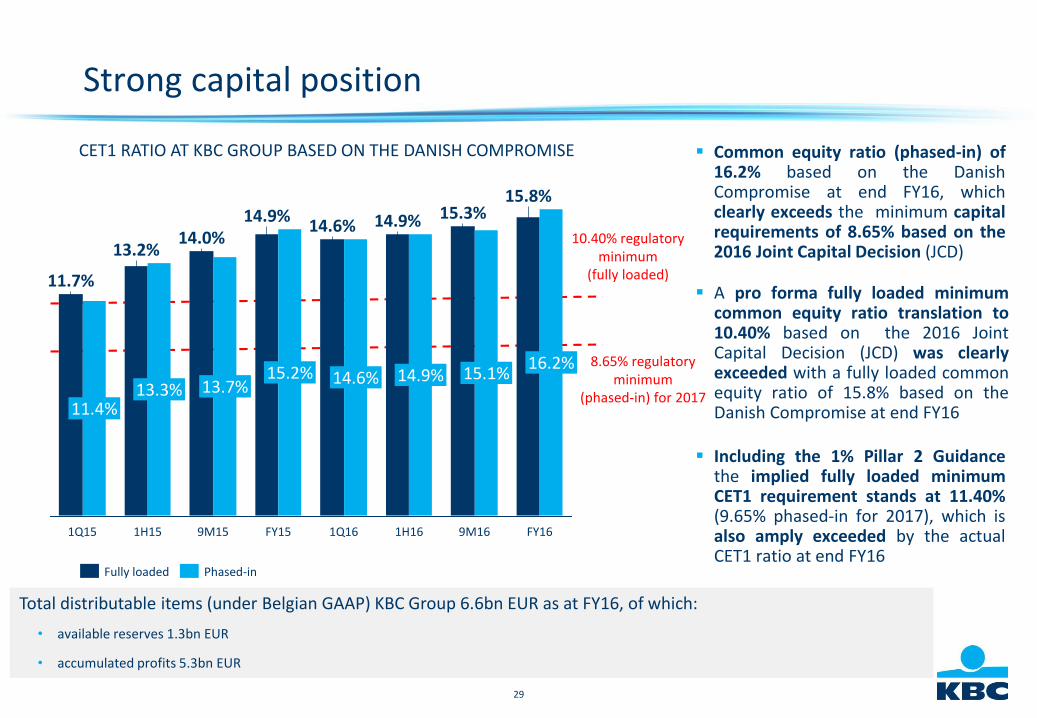
Strong capital position
CET1 RATIO AT KBC GROUP BASED ON THE DANISH COMPROMISE
8.65% regulatoryminimum
(phased-in) for 2017
Phased-inFully loaded
Common equity ratio (phased-in) of16.2% based on the DanishCompromise at end FY16, whichclearly exceeds the minimum capitalrequirements of 8.65% based on the2016 Joint Capital Decision (JCD)
A pro forma fully loaded minimumcommon equity ratio translation to10.40% based on the 2016 JointCapital Decision (JCD) was clearlyexceeded with a fully loaded commonequity ratio of 15.8% based on theDanish Compromise at end FY16
Total distributable items (under Belgian GAAP) KBC Group 6.6bn EUR as at FY16, of which:
• available reserves 1.3bn EUR
• accumulated profits 5.3bn EUR
15.1%
15.3%
1H16
14.9%
14.9%
1Q16
14.6%
14.6%
FY15
15.2%
14.9%
9M15
13.7%
14.0%
1H15
13.3%
13.2%
1Q15 FY16
11.4%
11.7%
9M16
15.8%
16.2%
Including the 1% Pillar 2 Guidancethe implied fully loaded minimumCET1 requirement stands at 11.40%(9.65% phased-in for 2017), which isalso amply exceeded by the actualCET1 ratio at end FY16
10.40% regulatoryminimum
(fully loaded)
30
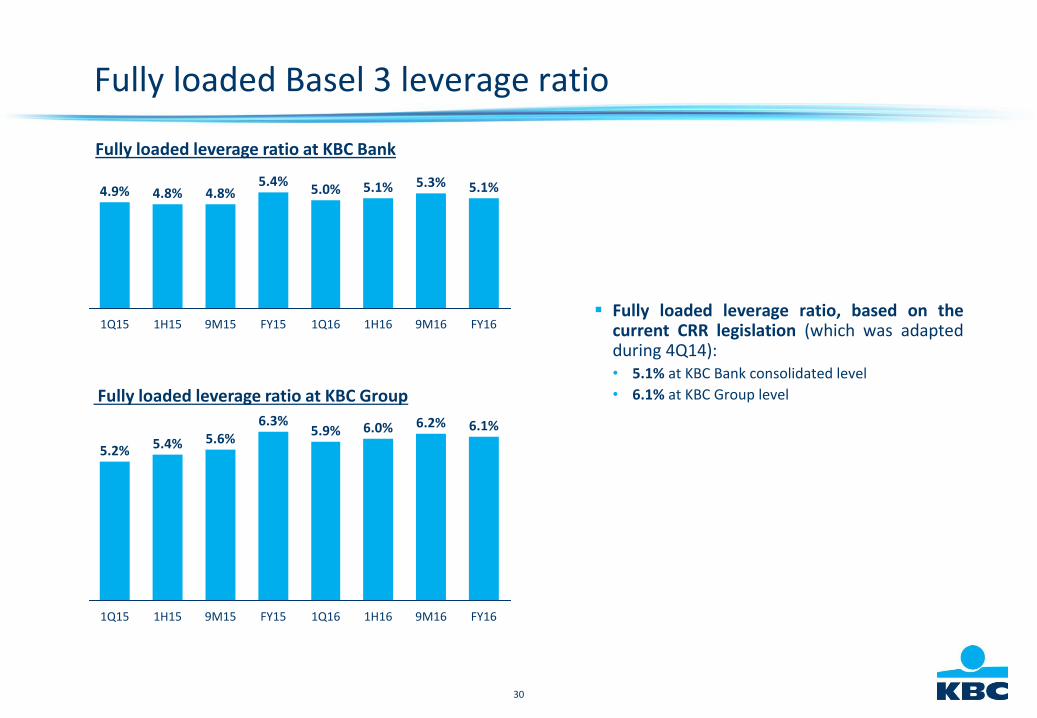
Fully loaded Basel 3 leverage ratio
Fully loaded leverage ratio, based on thecurrent CRR legislation (which was adaptedduring 4Q14):• 5.1% at KBC Bank consolidated level
• 6.1% at KBC Group level
FY16
5.3%
1H16 9M16
5.0% 5.1%
1Q16
5.1%
FY15
5.4%
9M15
4.8%
1H15
4.8%
1Q15
4.9%
Fully loaded leverage ratio at KBC Bank
Fully loaded leverage ratio at KBC Group
FY159M151Q15 1H15
5.6%5.2%
6.3%
5.4%6.1%5.9%
FY161Q16 9M16
6.2%
1H16
6.0%
31
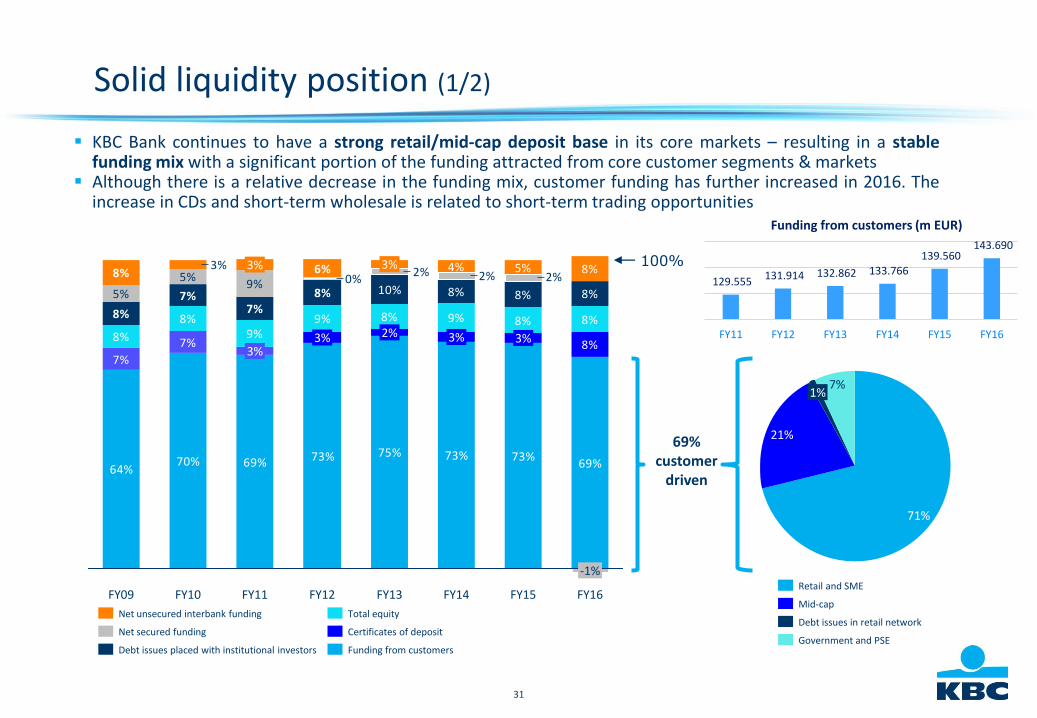
Solid liquidity position (1/2)
KBC Bank continues to have a strong retail/mid-cap deposit base in its core markets – resulting in a stablefunding mix with a significant portion of the funding attracted from core customer segments & markets
Although there is a relative decrease in the funding mix, customer funding has further increased in 2016. Theincrease in CDs and short-term wholesale is related to short-term trading opportunities
64%70% 69% 73% 75% 73% 73%
8%
8%9%
9% 8% 9% 8%
8%
10% 8% 8%
8%
5%
5%9%
4% 5% 8%
69%
7%
7%
8%7%
7%
8%
2%2%2%0%
8%
6%3%8%
100%
FY16
-1%
3%2%
3%
FY14FY12 FY13
3%
FY15FY10FY09
3%3%
FY11
3%
Certificates of deposit
Total equityNet unsecured interbank funding
Funding from customersDebt issues placed with institutional investors
Net secured funding
1%7%
21%
71%
Mid-cap
Government and PSE
Debt issues in retail network
Retail and SME
69% customer
driven
129.555 131.914 132.862 133.766
139.560 143.690
FY11 FY12 FY13 FY14 FY15 FY16
Funding from customers (m EUR)
32
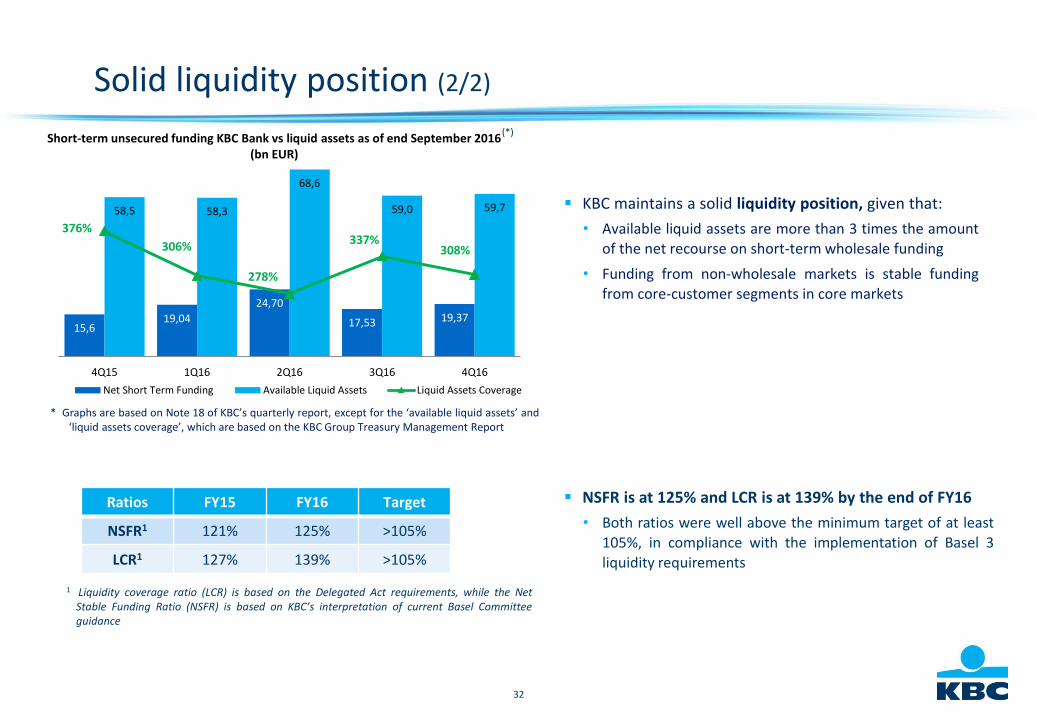
Short-term unsecured funding KBC Bank vs liquid assets as of end September 2016 (bn EUR)
* Graphs are based on Note 18 of KBC’s quarterly report, except for the ‘available liquid assets’ and‘liquid assets coverage’, which are based on the KBC Group Treasury Management Report
(*)
NSFR is at 125% and LCR is at 139% by the end of FY16
• Both ratios were well above the minimum target of at least105%, in compliance with the implementation of Basel 3liquidity requirements
Solid liquidity position (2/2)
Ratios FY15 FY16 Target
NSFR1 121% 125% >105%
LCR1 127% 139% >105%
1 Liquidity coverage ratio (LCR) is based on the Delegated Act requirements, while the NetStable Funding Ratio (NSFR) is based on KBC’s interpretation of current Basel Committeeguidance
KBC maintains a solid liquidity position, given that:
• Available liquid assets are more than 3 times the amountof the net recourse on short-term wholesale funding
• Funding from non-wholesale markets is stable fundingfrom core-customer segments in core markets
15,619,04
24,70
17,53 19,37
58,5 58,3
68,6
59,0 59,7
376%
306%
278%
337%308%
4Q15 1Q16 2Q16 3Q16 4Q16
Net Short Term Funding Available Liquid Assets Liquid Assets Coverage
33
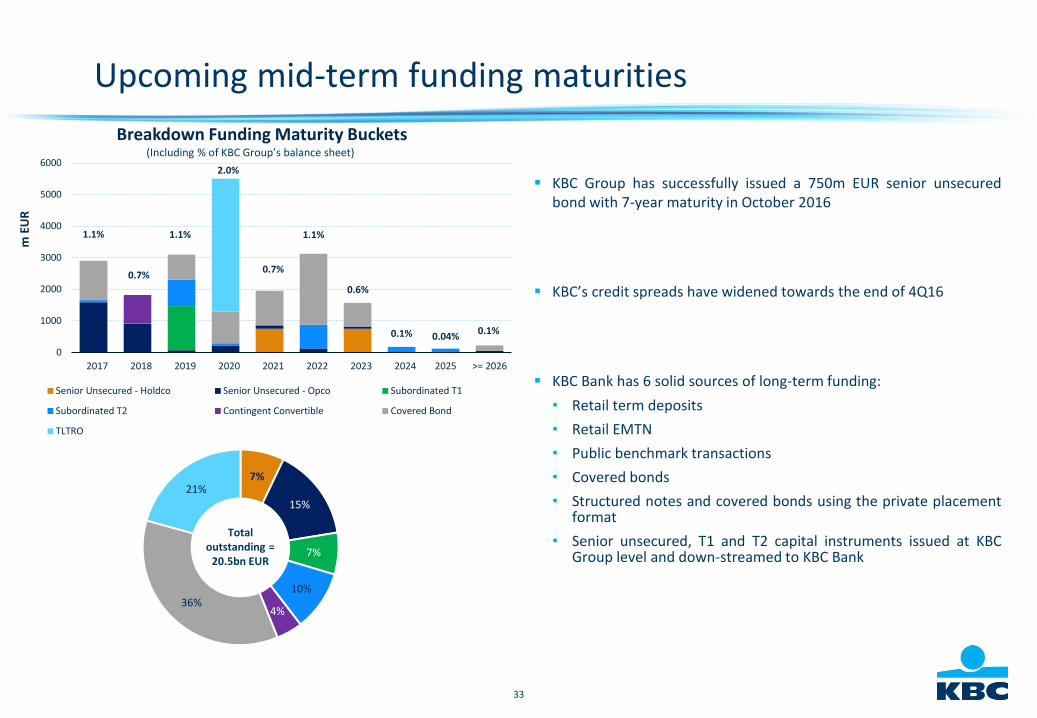
Upcoming mid-term funding maturities
KBC Group has successfully issued a 750m EUR senior unsecuredbond with 7-year maturity in October 2016
KBC’s credit spreads have widened towards the end of 4Q16
KBC Bank has 6 solid sources of long-term funding:
• Retail term deposits
• Retail EMTN
• Public benchmark transactions
• Covered bonds
• Structured notes and covered bonds using the private placementformat
• Senior unsecured, T1 and T2 capital instruments issued at KBCGroup level and down-streamed to KBC Bank
7%
15%
7%
10%
4%36%
21%
1.1%
0.7%
1.1%
2.0%
0.7%
1.1%
0.6%
0.1% 0.04%0.1%
0
1000
2000
3000
4000
5000
6000
2017 2018 2019 2020 2021 2022 2023 2024 2025 >= 2026
m E
UR
Breakdown Funding Maturity Buckets
Senior Unsecured - Holdco Senior Unsecured - Opco Subordinated T1
Subordinated T2 Contingent Convertible Covered Bond
TLTRO
Total outstanding =
20.5bn EUR
(Including % of KBC Group’s balance sheet)
34
-10
40
90
140
190
240
-15
5
25
45
65
85
105
125
145
Dec-13 Apr-14 Aug-14 Dec-14 Apr-15 Aug-15 Dec-15 Apr-16 Aug-16 Dec-16
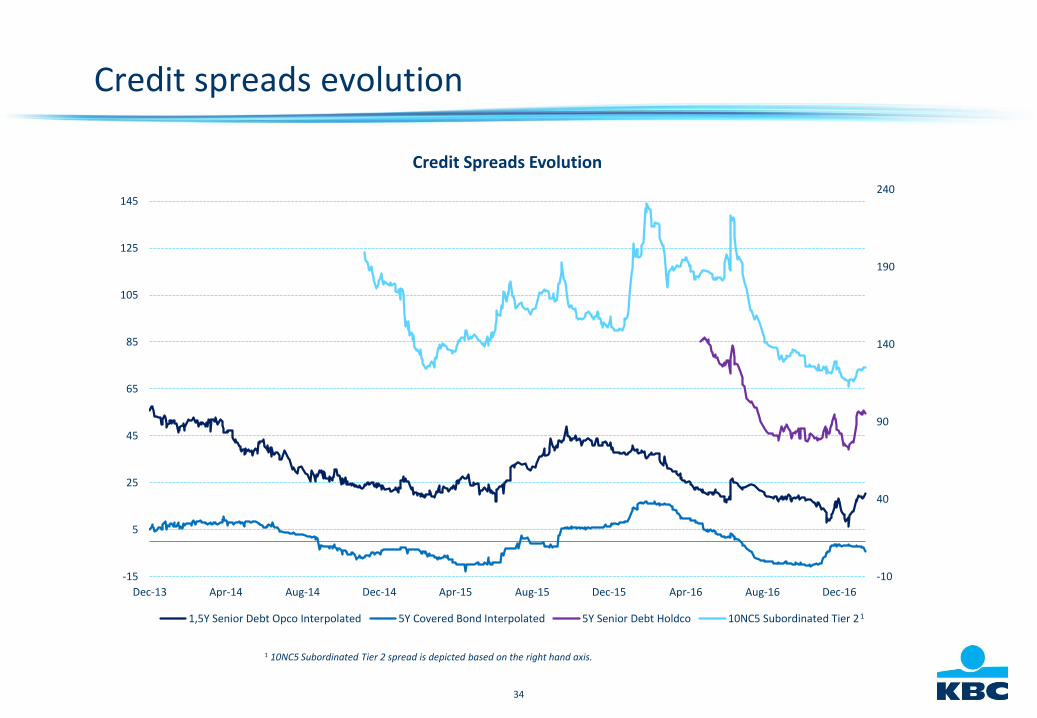
Credit Spreads Evolution
1,5Y Senior Debt Opco Interpolated 5Y Covered Bond Interpolated 5Y Senior Debt Holdco 10NC5 Subordinated Tier 2
Credit spreads evolution
1 10NC5 Subordinated Tier 2 spread is depicted based on the right hand axis.
1
35
KBC IS A FREQUENT ISSUER OF BENCHMARK COVERED BONDS AND PRIVATE PLACEMENTS FOR AN AMOUNT OF 7.31 BN EUR• KBC’s 10bn EUR covered bond programme is rated Aaa/AAA (Moody’s/Fitch)
• CRD and UCITS compliant / 10% risk-weighted
• All issues performed well in the secondary market
KBC’S COVERED BONDS ARE BACKED BY STRONG LEGISLATION AND SUPERIOR COLLATERAL• Cover pool: Belgian residential mortgage loans
• Strong Belgian legislation – inspired by German Pfandbriefen law
• Direct covered bond issuance from a bank’s balance sheet
• Dual recourse, including recourse to a special estate with cover assets included in a register
• Requires license from the National Bank of Belgium (NBB)
• The special estate is not affected by a bank insolvency. In that case, the NBB can appoint a cover pool administrator to managethe special estate in issuer ; both monitor the pool on a ongoing basis
• The value of one asset category must be at least 85% of the nominal amount of covered bonds
• The value of the cover assets must at least be 105% of the covered bonds (value of mortgage loans is limited to 80% LTV)
• Maximum 8% of a bank’s assets can be used for the issuance of covered bonds
THE COVERED BOND PROGRAMME IS CONSIDERED AS AN IMPORTANT FUNDING TOOL FOR THE TREASURY DEPARTMENT• KBC’s intentions are to be a frequent benchmark issuer if markets permit
Summary covered bond programme (1/2) (details, see Annex 3)
36
Summary covered bond programme (2/2) (details, see Annex 3)
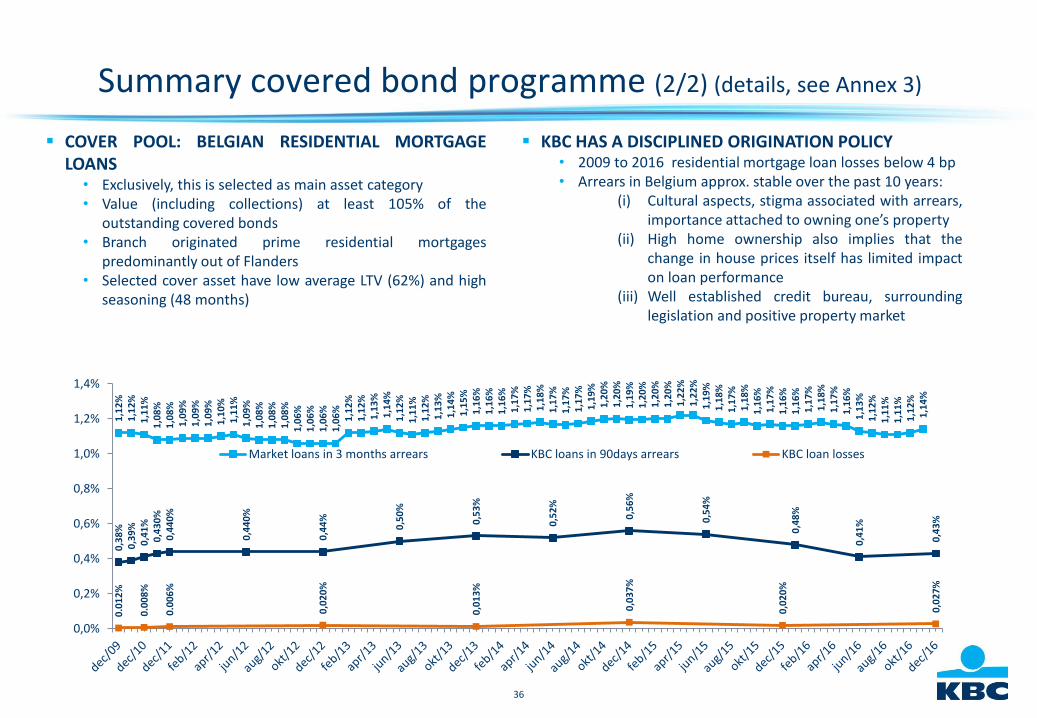
COVER POOL: BELGIAN RESIDENTIAL MORTGAGELOANS• Exclusively, this is selected as main asset category• Value (including collections) at least 105% of the
outstanding covered bonds• Branch originated prime residential mortgages
predominantly out of Flanders• Selected cover asset have low average LTV (62%) and high
seasoning (48 months)
KBC HAS A DISCIPLINED ORIGINATION POLICY• 2009 to 2016 residential mortgage loan losses below 4 bp• Arrears in Belgium approx. stable over the past 10 years:
(i) Cultural aspects, stigma associated with arrears,importance attached to owning one’s property
(ii) High home ownership also implies that thechange in house prices itself has limited impacton loan performance
(iii) Well established credit bureau, surroundinglegislation and positive property market
1,1
2%
1,1
2%
1,1
1%
1,0
8%
1,0
8%
1,0
9%
1,0
9%
1,0
9%
1,1
0%
1,1
1%
1,0
9%
1,0
8%
1,0
8%
1,0
8%
1,0
6%
1,0
6%
1,0
6%
1,0
6%
1,1
2%
1,1
2%
1,1
3%
1,1
4%
1,1
2%
1,1
1%
1,1
2%
1,1
3%
1,1
4%
1,1
5%
1,1
6%
1,1
6%
1,1
6%
1,1
7%
1,1
7%
1,1
8%
1,1
7%
1,1
7%
1,1
7%
1,1
9%
1,2
0%
1,2
0%
1,1
9%
1,2
0%
1,2
0%
1,2
0%
1,2
2%
1,2
2%
1,1
9%
1,1
8%
1,1
7%
1,1
8%
1,1
6%
1,1
7%
1,1
6%
1,1
6%
1,1
7%
1,1
8%
1,1
7%
1,1
6%
1,1
3%
1,1
2%
1,1
1%
1,1
1%
1,1
2%
1,1
4%
0,3
8%
0,3
9%
0,4
1%
0,4
30
%0
,44
0%
0,4
40
%
0,4
4%
0,5
0%
0,5
3%
0,5
2%
0,5
6%
0,5
4%
0,4
8%
0,4
1%
0,4
3%
0.0
12
%
0.0
08
%
0.0
06
%
0,0
20
%
0,0
13
%
0,0
37
%
0,0
20
%
0,0
27
%
0,0%
0,2%
0,4%
0,6%
0,8%
1,0%
1,2%
1,4%
Market loans in 3 months arrears KBC loans in 90days arrears KBC loan losses
37
Contents
1 Strategy and business profile
2 Financial performance
3 Balance sheet
4 Solvency and liquidity
5 MREL strategy
Appendices
6 4Q16 Wrap up
38
Resolution strategy for KBC
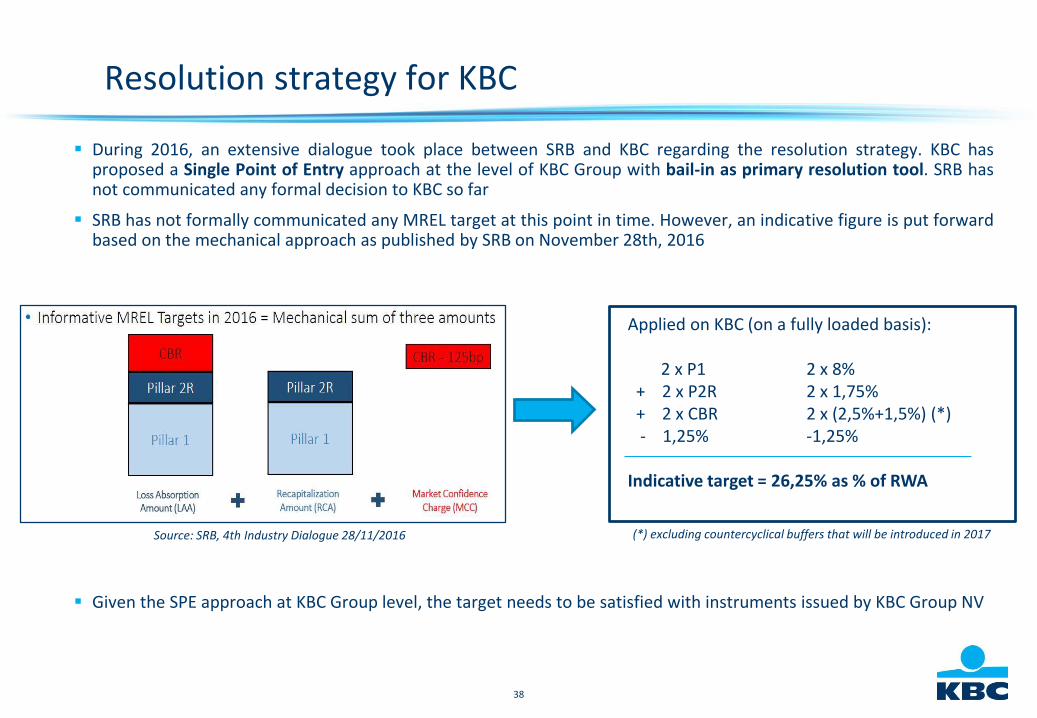
During 2016, an extensive dialogue took place between SRB and KBC regarding the resolution strategy. KBC hasproposed a Single Point of Entry approach at the level of KBC Group with bail-in as primary resolution tool. SRB hasnot communicated any formal decision to KBC so far
SRB has not formally communicated any MREL target at this point in time. However, an indicative figure is put forwardbased on the mechanical approach as published by SRB on November 28th, 2016
Source: SRB, 4th Industry Dialogue 28/11/2016
Applied on KBC (on a fully loaded basis):
2 x P1 2 x 8%+ 2 x P2R 2 x 1,75%+ 2 x CBR 2 x (2,5%+1,5%) (*)- 1,25% -1,25%
Indicative target = 26,25% as % of RWA
(*) excluding countercyclical buffers that will be introduced in 2017
Given the SPE approach at KBC Group level, the target needs to be satisfied with instruments issued by KBC Group NV
39
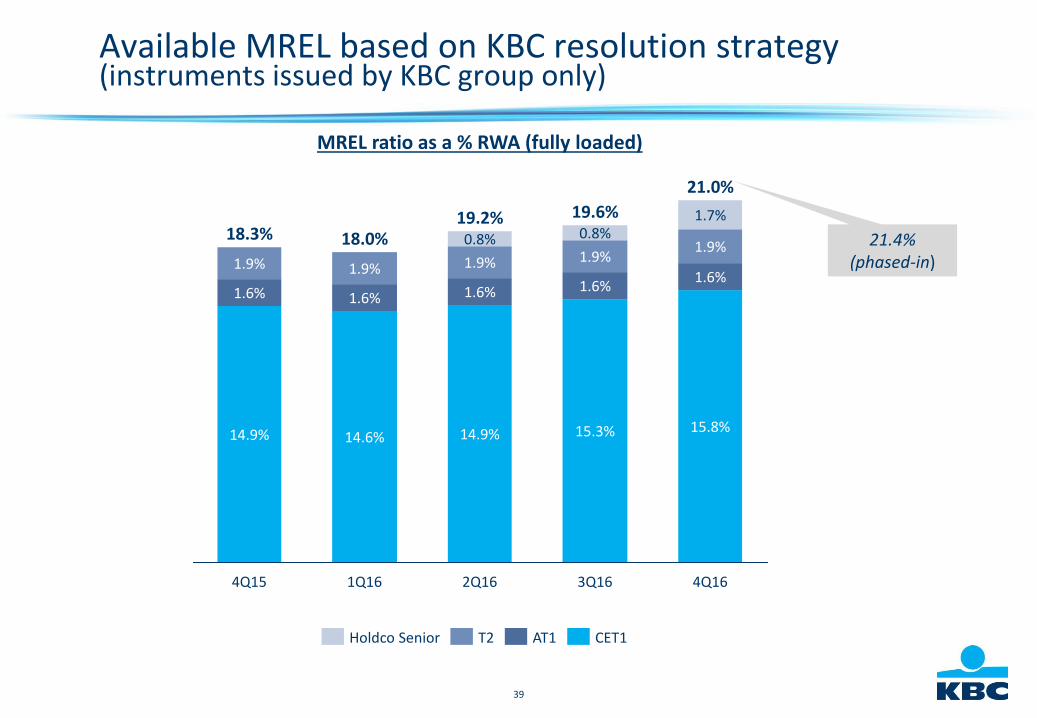
Available MREL based on KBC resolution strategy(instruments issued by KBC group only)
1.9%
14.9%
19.6%
1Q16 3Q16 4Q16
18.3%
1.6%
18.0%
14.6%
1.6%
0.8%
1.9%
14.9%
1.9%
1.6%
2Q16
19.2%
4Q15
15.3%
1.6%
1.9%
0.8%
21.0%
15.8%
1.6%
1.9%
1.7%
MREL ratio as a % RWA (fully loaded)
T2 CET1Holdco Senior AT1
21.4% (phased-in)
40
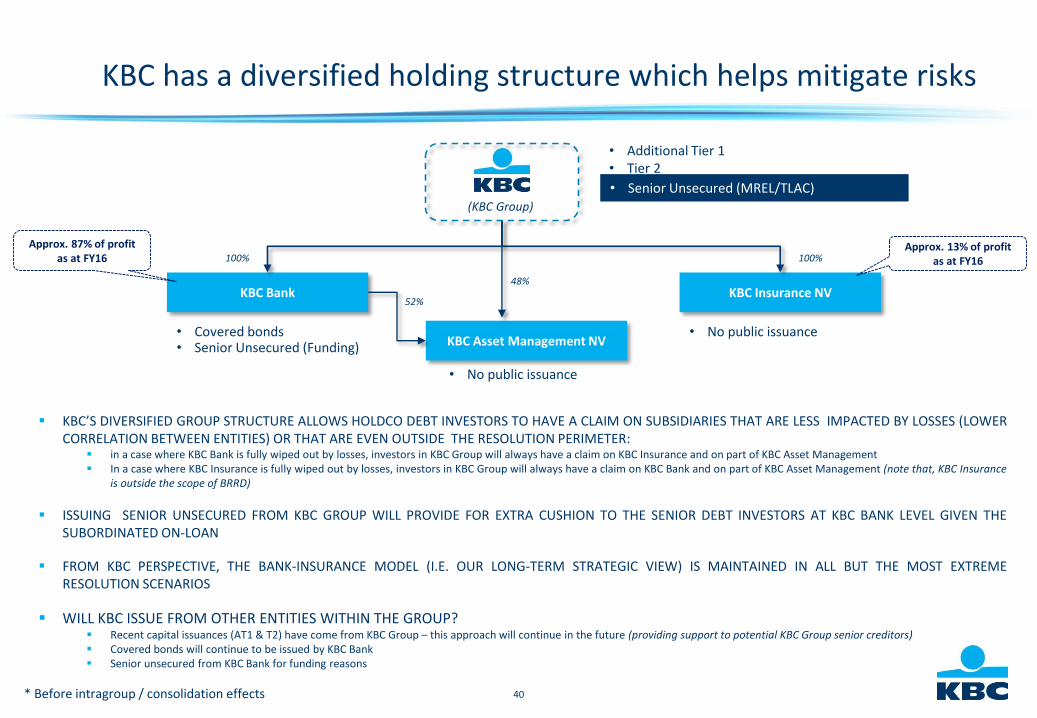
KBC has a diversified holding structure which helps mitigate risks
KBC Insurance NV KBC Bank
(KBC Group)
KBC’S DIVERSIFIED GROUP STRUCTURE ALLOWS HOLDCO DEBT INVESTORS TO HAVE A CLAIM ON SUBSIDIARIES THAT ARE LESS IMPACTED BY LOSSES (LOWERCORRELATION BETWEEN ENTITIES) OR THAT ARE EVEN OUTSIDE THE RESOLUTION PERIMETER:
in a case where KBC Bank is fully wiped out by losses, investors in KBC Group will always have a claim on KBC Insurance and on part of KBC Asset Management In a case where KBC Insurance is fully wiped out by losses, investors in KBC Group will always have a claim on KBC Bank and on part of KBC Asset Management (note that, KBC Insurance
is outside the scope of BRRD)
ISSUING SENIOR UNSECURED FROM KBC GROUP WILL PROVIDE FOR EXTRA CUSHION TO THE SENIOR DEBT INVESTORS AT KBC BANK LEVEL GIVEN THESUBORDINATED ON-LOAN
FROM KBC PERSPECTIVE, THE BANK-INSURANCE MODEL (I.E. OUR LONG-TERM STRATEGIC VIEW) IS MAINTAINED IN ALL BUT THE MOST EXTREMERESOLUTION SCENARIOS
WILL KBC ISSUE FROM OTHER ENTITIES WITHIN THE GROUP? Recent capital issuances (AT1 & T2) have come from KBC Group – this approach will continue in the future (providing support to potential KBC Group senior creditors) Covered bonds will continue to be issued by KBC Bank Senior unsecured from KBC Bank for funding reasons
• Additional Tier 1• Tier 2
• Covered bonds • No public issuance
100%100%
* Before intragroup / consolidation effects
• Senior Unsecured (Funding)
• Senior Unsecured (MREL/TLAC)
KBC Asset Management NV
48%
52%
• No public issuance
Approx. 13% of profitas at FY16
Approx. 87% of profitas at FY16
41
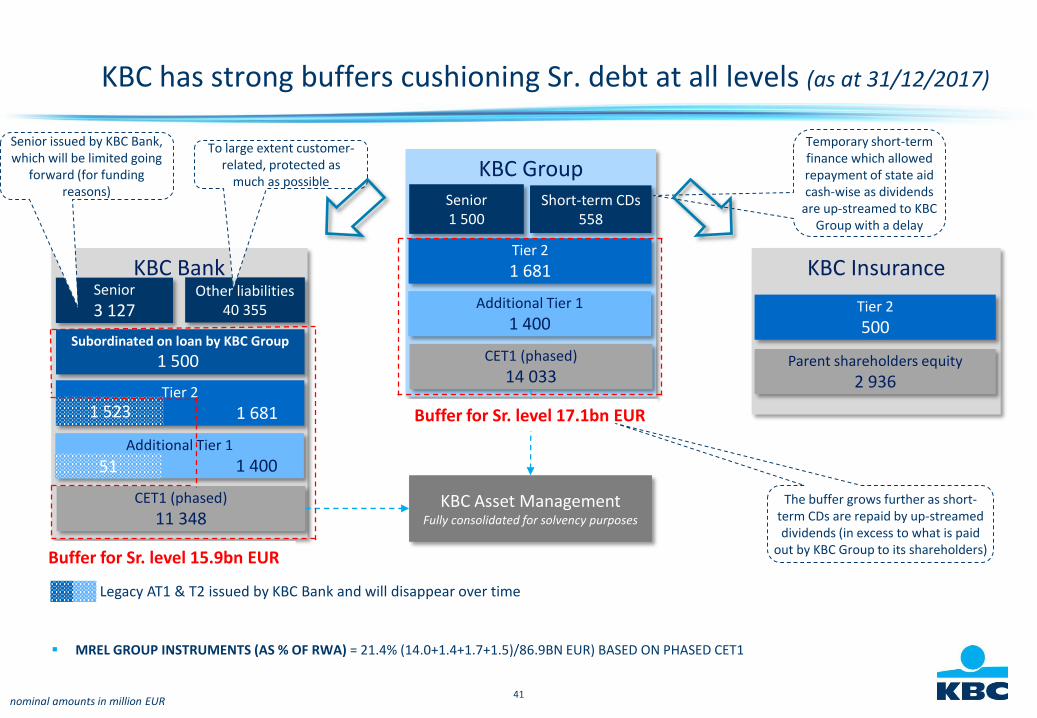
KBC has strong buffers cushioning Sr. debt at all levels (as at 31/12/2017)
KBC GroupSenior1 500
Short-term CDs558
Tier 2
1 681
Additional Tier 1
1 400
CET1 (phased)
14 033
KBC BankSenior
3 127Other liabilities
40 355
Tier 2
1 681
Additional Tier 1
1 400
CET1 (phased)
11 348
1 523
KBC Insurance
Tier 2
500
Parent shareholders equity
2 936
KBC Asset ManagementFully consolidated for solvency purposes
51
Temporary short-term finance which allowed repayment of state aid cash-wise as dividends
are up-streamed to KBC Group with a delay
To large extent customer-related, protected as
much as possible
Senior issued by KBC Bank, which will be limited going
forward (for funding reasons)
Buffer for Sr. level 15.9bn EUR
Buffer for Sr. level 17.1bn EUR
Legacy AT1 & T2 issued by KBC Bank and will disappear over time
MREL GROUP INSTRUMENTS (AS % OF RWA) = 21.4% (14.0+1.4+1.7+1.5)/86.9BN EUR) BASED ON PHASED CET1
nominal amounts in million EUR
The buffer grows further as short-term CDs are repaid by up-streamed dividends (in excess to what is paid
out by KBC Group to its shareholders)
Subordinated on loan by KBC Group
1 500
42
Key investment highlights
KBC is one of the strongest capitalised and most capital generative financials in Europe
• Compared with other European financials to have issued from their Holding Companies, KBC has one of the strongest leverage ratios andone of the highest CET1 and total capital positions
• According to market estimates, KBC generates at least an approximated additional 2% of CET1 on a yearly basis before dividends
• Proven track record of prudent capital management (e.g. shareholder loans (2013), capital increase (2012), final repayment of YES (2015))
Given its already strong capitalisation and liquidity, KBC currently foresees relatively limited amounts of senior debt inthe future to reach MREL targets (at group level) and/or to complete its funding needs
A really diversified holding company and the absence of ring-fencing helps to mitigate the risks of structuralsubordination of Senior debt of KBC Group compared to other issuers
43
Contents
1 Strategy and business profile
2 Financial performance
3 Balance sheet
4 Solvency and liquidity
5 MREL strategy
Appendices
6 4Q16 Wrap up
44
Wrap up
Strong commercial bank-insurance results in our core countries
Successful underlying earnings track record
Solid capital and robust liquidity position
45
Looking forward
We expect 2017 to be a year of sustained economic growth in both the euro area andthe US. The most significant risks for the euro area stem from political events withseveral elections on the horizon and the start of Brexit negotiations
Management guides for:• solid returns for all our business units
• loan impairments for Ireland towards a release in the 25m-75m EUR range for FY17
Besides the Belgium and the Czech Republic Business Units, the International MarketsBusiness Unit will also become a strong contributor to the net result of KBC Groupthanks to:• Ireland: re-positioning as a core country with a meaningful and sustainable profit
contribution• Bulgaria: after the acquisition of UBB and Interlease, UBB-CIBANK and DZI will become the
largest bank-insurance group in Bulgaria, which will lead to a substantial increase in profitcontribution. The deal is expected to be closed in 2Q17
46
Appendices
1 KBC 2015/16 benchmarks + overview of outstanding benchmarks
2 KBC Bank CDS levels
3
Overview of bank taxes
4
Solvency: details on capital
5
Details on selective credit exposure
6
7
Summary of KBC’s covered bond programme
Macroeconomic views
47
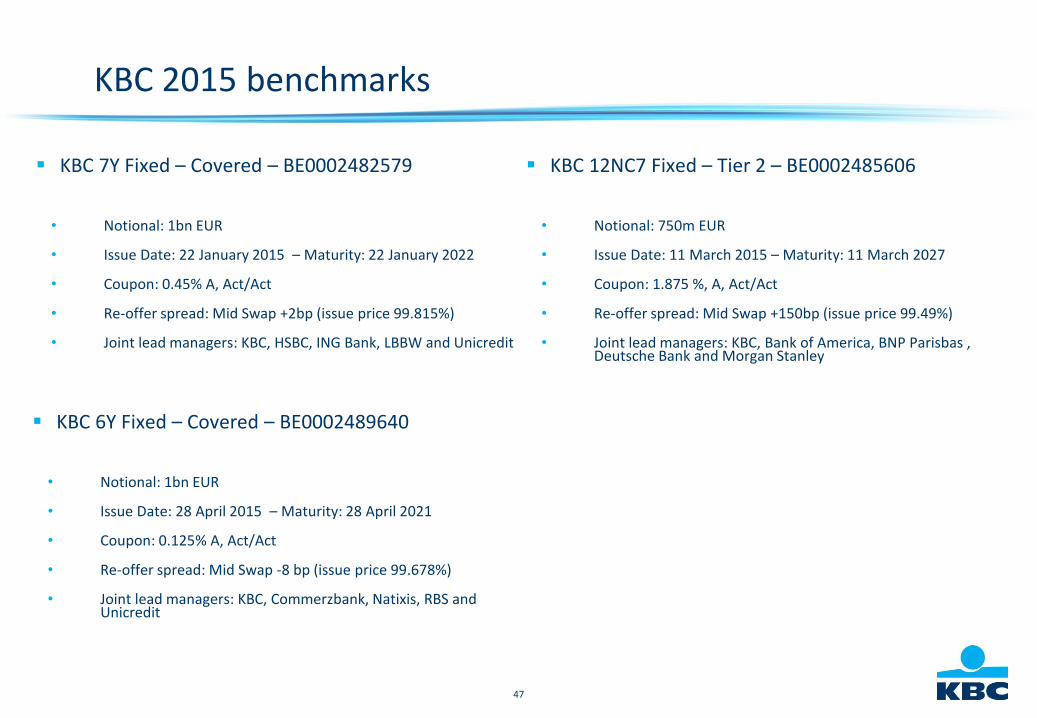
KBC 2015 benchmarks
KBC 7Y Fixed – Covered – BE0002482579
• Notional: 1bn EUR
• Issue Date: 22 January 2015 – Maturity: 22 January 2022
• Coupon: 0.45% A, Act/Act
• Re-offer spread: Mid Swap +2bp (issue price 99.815%)
• Joint lead managers: KBC, HSBC, ING Bank, LBBW and Unicredit
KBC 12NC7 Fixed – Tier 2 – BE0002485606
• Notional: 750m EUR
• Issue Date: 11 March 2015 – Maturity: 11 March 2027
• Coupon: 1.875 %, A, Act/Act
• Re-offer spread: Mid Swap +150bp (issue price 99.49%)
• Joint lead managers: KBC, Bank of America, BNP Parisbas , Deutsche Bank and Morgan Stanley
KBC 6Y Fixed – Covered – BE0002489640
• Notional: 1bn EUR
• Issue Date: 28 April 2015 – Maturity: 28 April 2021
• Coupon: 0.125% A, Act/Act
• Re-offer spread: Mid Swap -8 bp (issue price 99.678%)
• Joint lead managers: KBC, Commerzbank, Natixis, RBS andUnicredit
48
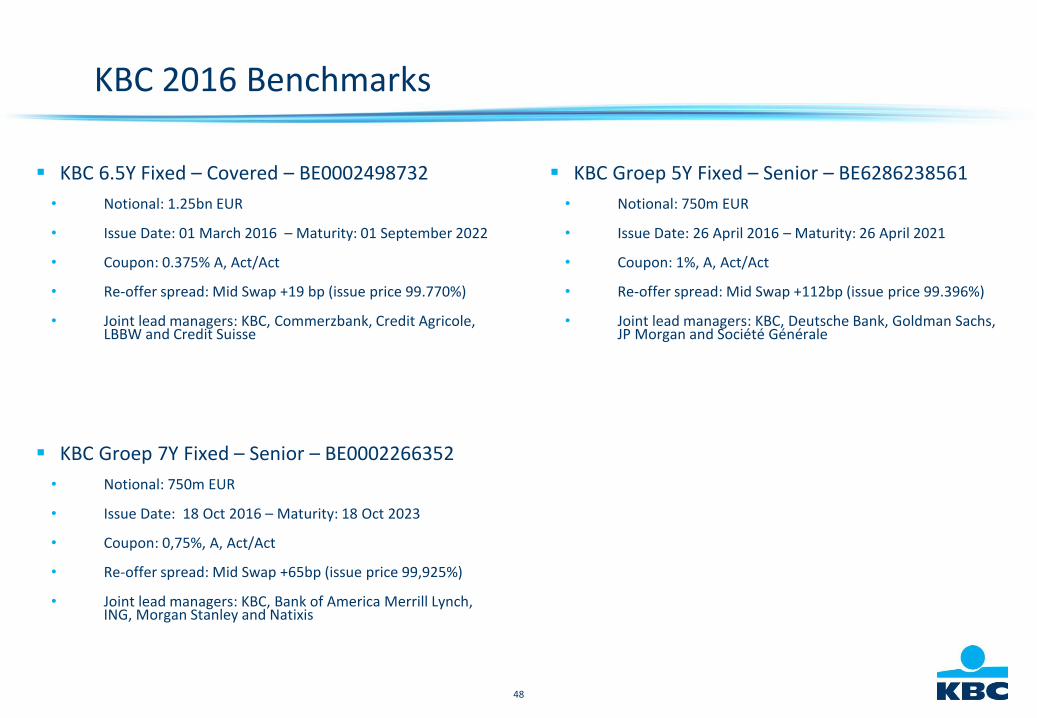
KBC 2016 Benchmarks
KBC Groep 5Y Fixed – Senior – BE6286238561
• Notional: 750m EUR
• Issue Date: 26 April 2016 – Maturity: 26 April 2021
• Coupon: 1%, A, Act/Act
• Re-offer spread: Mid Swap +112bp (issue price 99.396%)
• Joint lead managers: KBC, Deutsche Bank, Goldman Sachs, JP Morgan and Société Générale
KBC 6.5Y Fixed – Covered – BE0002498732
• Notional: 1.25bn EUR
• Issue Date: 01 March 2016 – Maturity: 01 September 2022
• Coupon: 0.375% A, Act/Act
• Re-offer spread: Mid Swap +19 bp (issue price 99.770%)
• Joint lead managers: KBC, Commerzbank, Credit Agricole, LBBW and Credit Suisse
KBC Groep 7Y Fixed – Senior – BE0002266352
• Notional: 750m EUR
• Issue Date: 18 Oct 2016 – Maturity: 18 Oct 2023
• Coupon: 0,75%, A, Act/Act
• Re-offer spread: Mid Swap +65bp (issue price 99,925%)
• Joint lead managers: KBC, Bank of America Merrill Lynch, ING, Morgan Stanley and Natixis
49
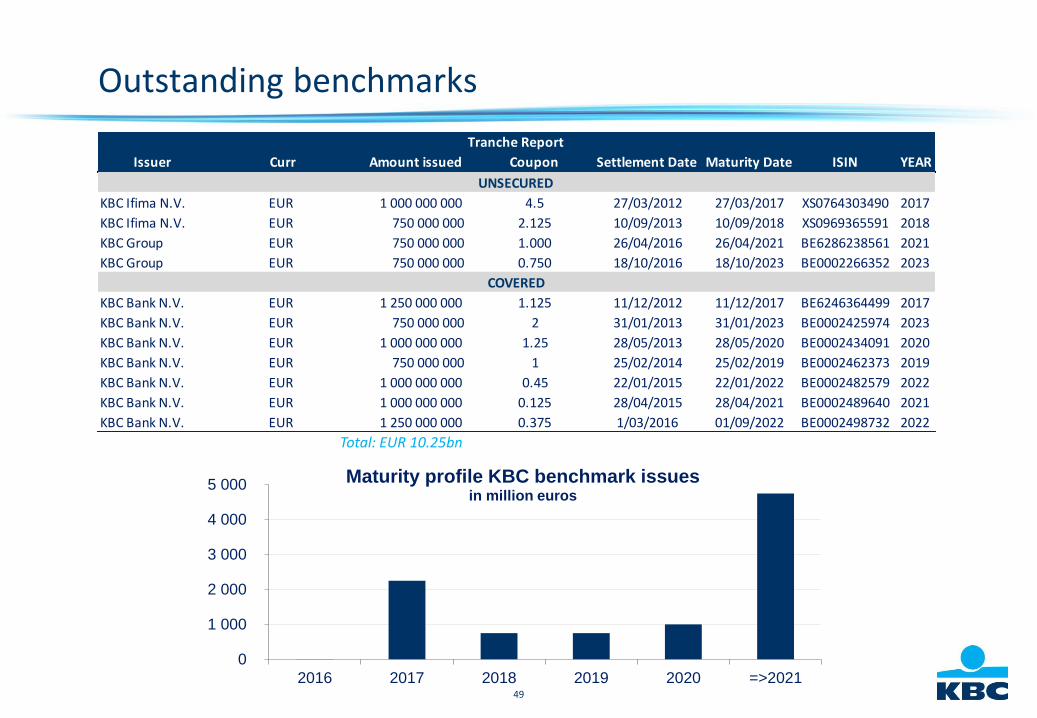
Outstanding benchmarks
Total: EUR 10.25bn
Issuer Curr Amount issued Coupon Settlement Date Maturity Date ISIN YEAR
KBC Ifima N.V. EUR 1 000 000 000 4.5 27/03/2012 27/03/2017 XS0764303490 2017
KBC Ifima N.V. EUR 750 000 000 2.125 10/09/2013 10/09/2018 XS0969365591 2018
KBC Group EUR 750 000 000 1.000 26/04/2016 26/04/2021 BE6286238561 2021
KBC Group EUR 750 000 000 0.750 18/10/2016 18/10/2023 BE0002266352 2023
KBC Bank N.V. EUR 1 250 000 000 1.125 11/12/2012 11/12/2017 BE6246364499 2017
KBC Bank N.V. EUR 750 000 000 2 31/01/2013 31/01/2023 BE0002425974 2023
KBC Bank N.V. EUR 1 000 000 000 1.25 28/05/2013 28/05/2020 BE0002434091 2020
KBC Bank N.V. EUR 750 000 000 1 25/02/2014 25/02/2019 BE0002462373 2019
KBC Bank N.V. EUR 1 000 000 000 0.45 22/01/2015 22/01/2022 BE0002482579 2022
KBC Bank N.V. EUR 1 000 000 000 0.125 28/04/2015 28/04/2021 BE0002489640 2021
KBC Bank N.V. EUR 1 250 000 000 0.375 1/03/2016 01/09/2022 BE0002498732 2022
Tranche Report
COVERED
UNSECURED
0
1 000
2 000
3 000
4 000
5 000
2016 2017 2018 2019 2020 =>2021
Maturity profile KBC benchmark issuesin million euros

50
Main characteristics of subordinated debt issues
KBC Bank NV KBC Groep NV KBC Groep NV KBC Groep NV
T2 Coco AT1 Tier II Tier II
GBP 525 000 000 USD 1 000 000 000 EUR 1 400 000 000 EUR 750 000 000 EUR 750 000 000
Tendered GBP 480 500 000
Net Amount GBP 44 500 000 USD 1 000 000 000 EUR 1 400 000 000 EUR 750 000 000 EUR 750 000 000
ISIN-code BE0119284710 BE6248510610 BE0002463389 BE0002479542 BE0002485606
Maturity date perpetual 25/01/2023 perpetual 25/11/2024 11/03/2027
Initial coupon 6.202% 8% 5.625% 2.375% 1.875%
3m gbp libor + 193bps $ MS 5Y + 7.097% € MS 5Y + 4.759% € MS 5Y + 1.980% € MS 5Y + 1.50%
19/12/2019 25/01/2018 19/03/2019 25/11/2019 11/03/2022
ACPM Yes - - - -
Yes - - - -
Yes - - - -
Trigger
Supervisory Event or
general "concursus
creditorum"
CT1/CET1 < 7% at KBC
Group level
Full and permanent write-
down
Trigger CET1 RATIO <
5.125% Temporary write-
down
Regulatory+Tax Call Regulatory+Tax Call
KBC Bank NV
SUBORDINATED BOND ISSUES KBC
Amount issued
Coupon step-up / reset
First (next) call date
Dividend Stopper
Conversion into PSC
51
Appendices
1 KBC 2015/16 benchmarks + overview of outstanding benchmarks
2 KBC Bank CDS levels
3
Overview of bank taxes
4
5
Details on selective credit exposure
6
7
Summary of KBC’s covered bond programme
Macroeconomic views
Solvency: details on capital
52
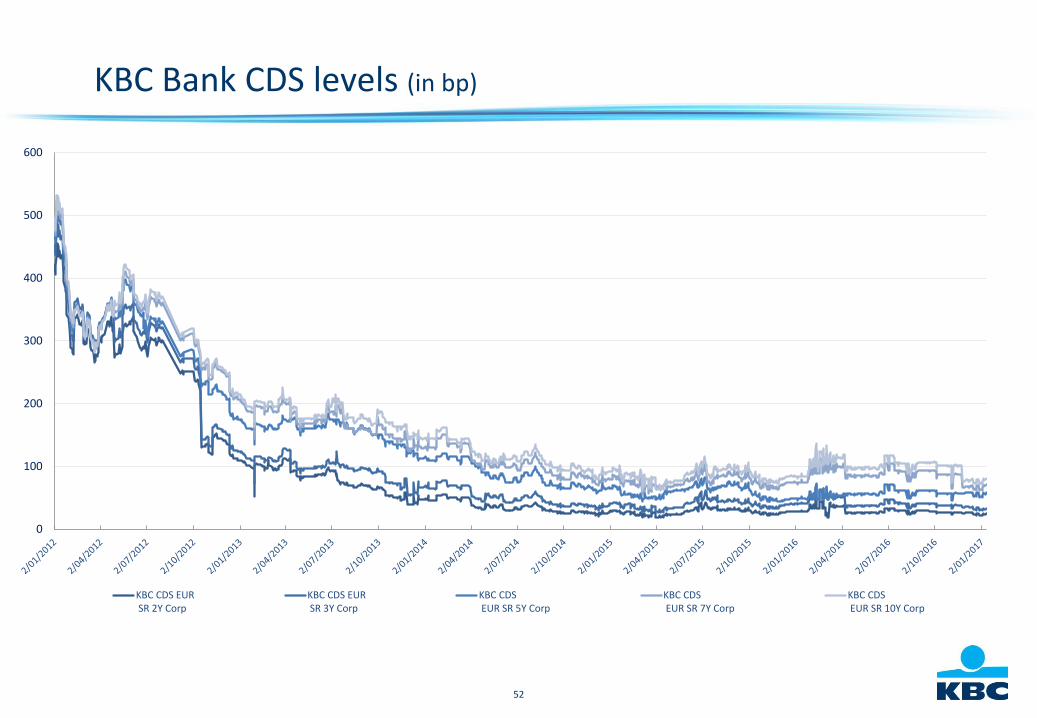
KBC Bank CDS levels (in bp)
0
100
200
300
400
500
600
KBC CDS EUR SR 2Y Corp
KBC CDS EUR SR 3Y Corp
KBC CDS EUR SR 5Y Corp
KBC CDS EUR SR 7Y Corp
KBC CDS EUR SR 10Y Corp
53
Appendices
1 KBC 2015/16 benchmarks + overview of outstanding benchmarks
2 KBC Bank CDS levels
3
Overview of bank taxes
4
5
Details on selective credit exposure
6
7
Summary of KBC’s covered bond programme
Macroeconomic views
Solvency: details on capital
54
Key messages on KBC’s covered bond programme
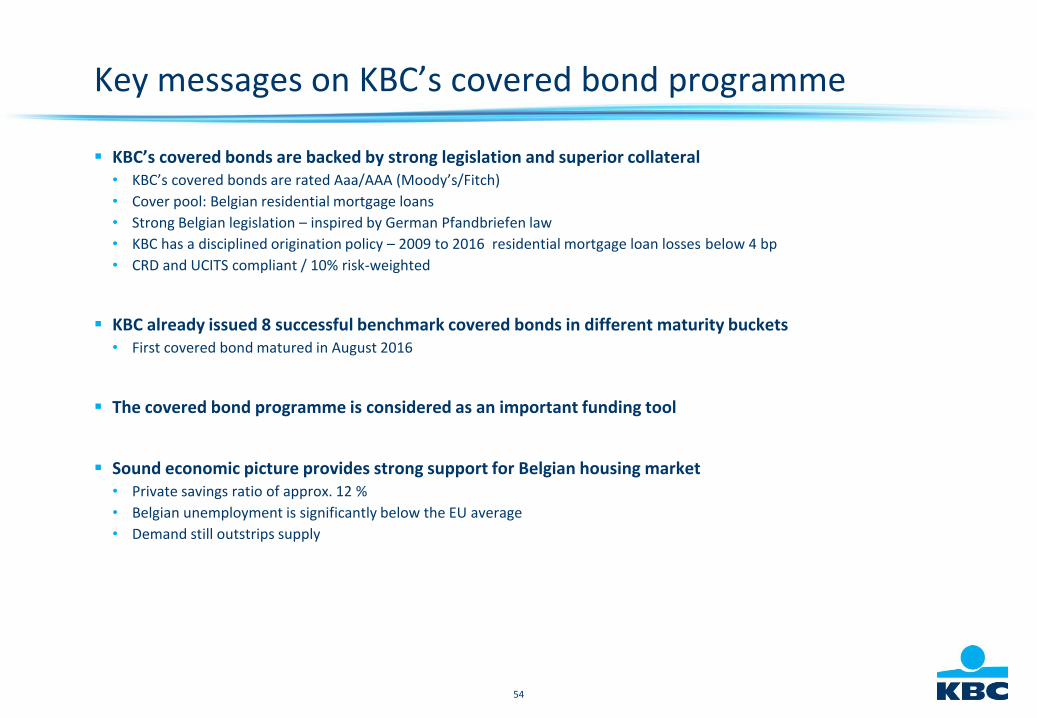
KBC’s covered bonds are backed by strong legislation and superior collateral• KBC’s covered bonds are rated Aaa/AAA (Moody’s/Fitch)
• Cover pool: Belgian residential mortgage loans
• Strong Belgian legislation – inspired by German Pfandbriefen law
• KBC has a disciplined origination policy – 2009 to 2016 residential mortgage loan losses below 4 bp
• CRD and UCITS compliant / 10% risk-weighted
KBC already issued 8 successful benchmark covered bonds in different maturity buckets• First covered bond matured in August 2016
The covered bond programme is considered as an important funding tool
Sound economic picture provides strong support for Belgian housing market• Private savings ratio of approx. 12 %
• Belgian unemployment is significantly below the EU average
• Demand still outstrips supply
55
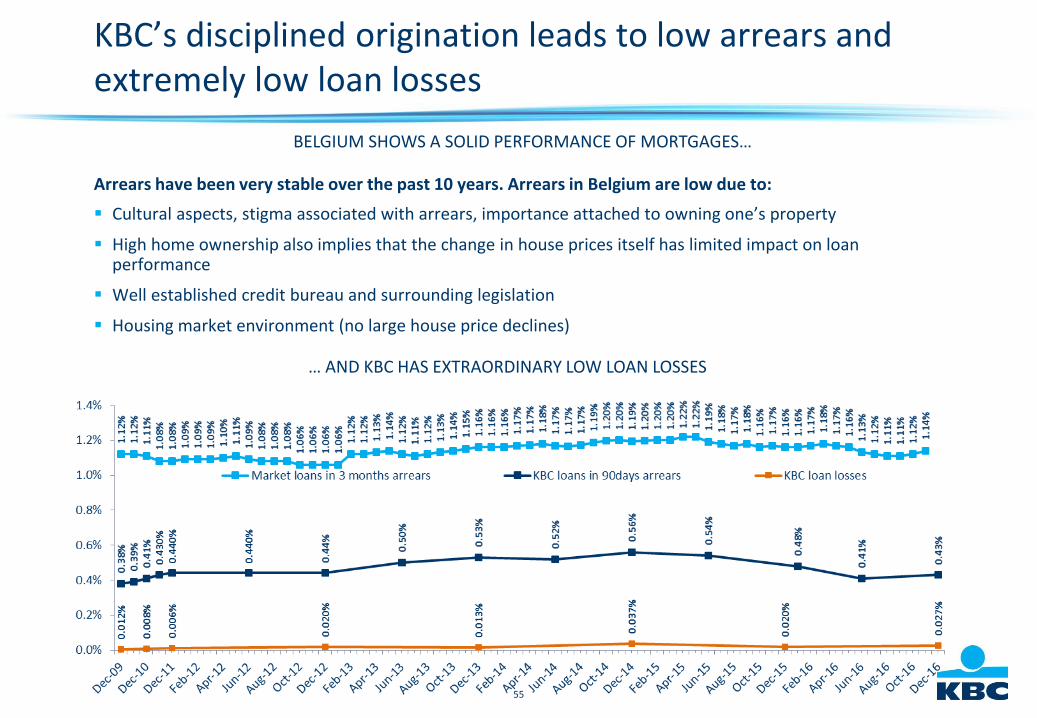
KBC’s disciplined origination leads to low arrears and extremely low loan losses
Arrears have been very stable over the past 10 years. Arrears in Belgium are low due to:
Cultural aspects, stigma associated with arrears, importance attached to owning one’s property
High home ownership also implies that the change in house prices itself has limited impact on loan performance
Well established credit bureau and surrounding legislation
Housing market environment (no large house price declines)
BELGIUM SHOWS A SOLID PERFORMANCE OF MORTGAGES…
… AND KBC HAS EXTRAORDINARY LOW LOAN LOSSES
56
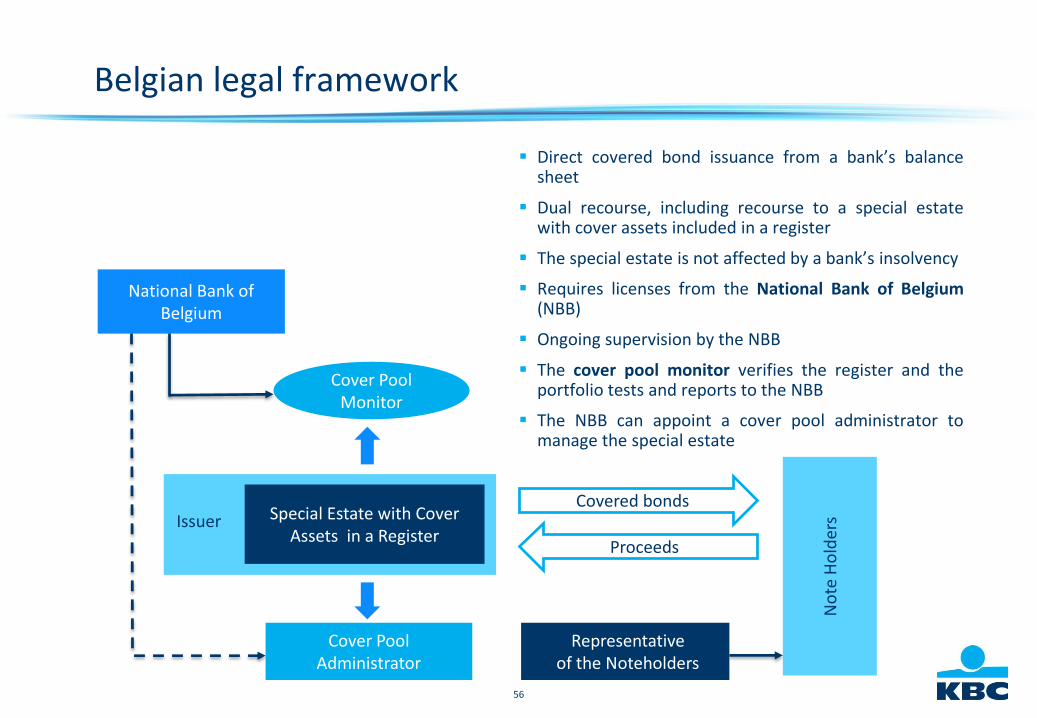
Direct covered bond issuance from a bank’s balancesheet
Dual recourse, including recourse to a special estatewith cover assets included in a register
The special estate is not affected by a bank’s insolvency
Requires licenses from the National Bank of Belgium(NBB)
Ongoing supervision by the NBB
The cover pool monitor verifies the register and theportfolio tests and reports to the NBB
The NBB can appoint a cover pool administrator tomanage the special estate
Belgian legal framework
National Bank of Belgium
Cover Pool Administrator
No
te H
old
ers
Covered bonds
Proceeds
Issuer
Cover PoolMonitor
Special Estate with Cover Assets in a Register
Representativeof the Noteholders
57
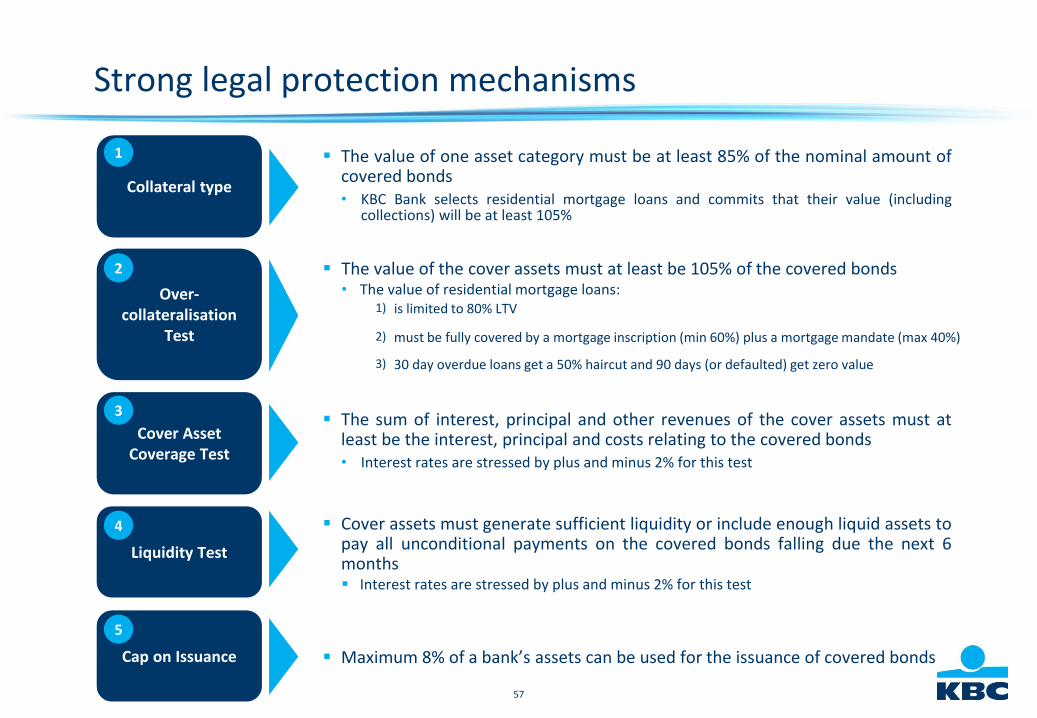
The value of one asset category must be at least 85% of the nominal amount ofcovered bonds• KBC Bank selects residential mortgage loans and commits that their value (including
collections) will be at least 105%
Strong legal protection mechanisms
Collateral type
Over-collateralisation
Test
Cover Asset Coverage Test
Liquidity Test
Cap on Issuance
1
2
3
4
5
The value of the cover assets must at least be 105% of the covered bonds• The value of residential mortgage loans:
1) is limited to 80% LTV
2) must be fully covered by a mortgage inscription (min 60%) plus a mortgage mandate (max 40%)
3) 30 day overdue loans get a 50% haircut and 90 days (or defaulted) get zero value
The sum of interest, principal and other revenues of the cover assets must atleast be the interest, principal and costs relating to the covered bonds• Interest rates are stressed by plus and minus 2% for this test
Cover assets must generate sufficient liquidity or include enough liquid assets topay all unconditional payments on the covered bonds falling due the next 6months Interest rates are stressed by plus and minus 2% for this test
Maximum 8% of a bank’s assets can be used for the issuance of covered bonds
58
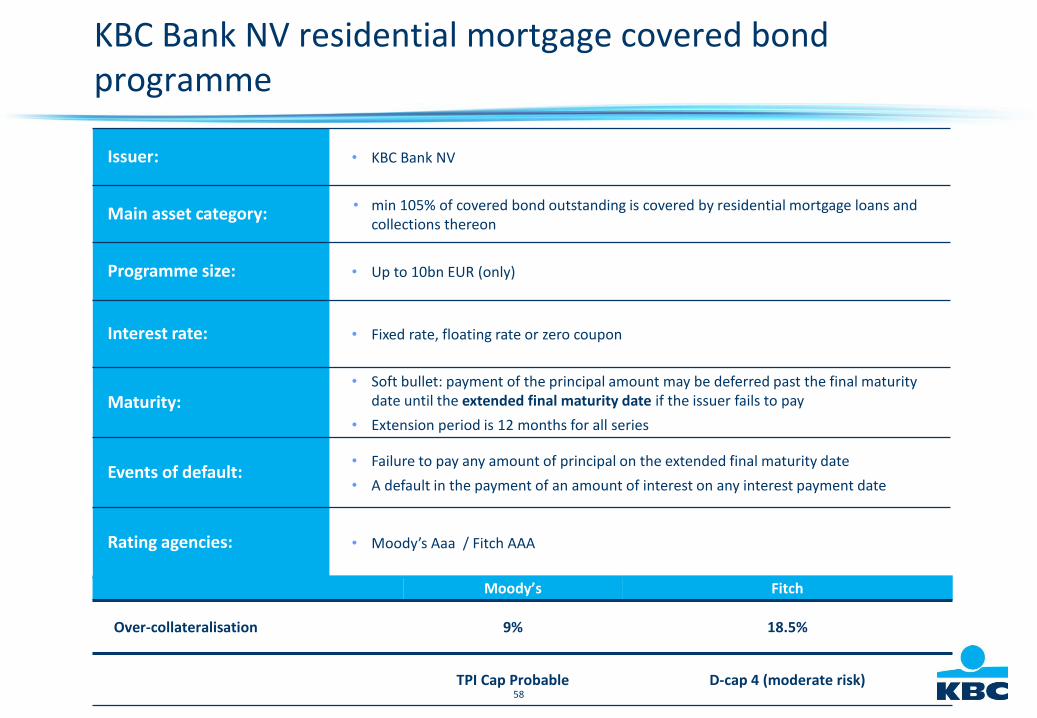
KBC Bank NV residential mortgage covered bond programme
Issuer: • KBC Bank NV
Main asset category: • min 105% of covered bond outstanding is covered by residential mortgage loans and collections thereon
Programme size: • Up to 10bn EUR (only)
Interest rate: • Fixed rate, floating rate or zero coupon
Maturity: • Soft bullet: payment of the principal amount may be deferred past the final maturity
date until the extended final maturity date if the issuer fails to pay
• Extension period is 12 months for all series
Events of default:• Failure to pay any amount of principal on the extended final maturity date
• A default in the payment of an amount of interest on any interest payment date
Rating agencies: • Moody’s Aaa / Fitch AAA
Moody’s Fitch
Over-collateralisation 9% 18.5%
TPI Cap Probable D-cap 4 (moderate risk)
59
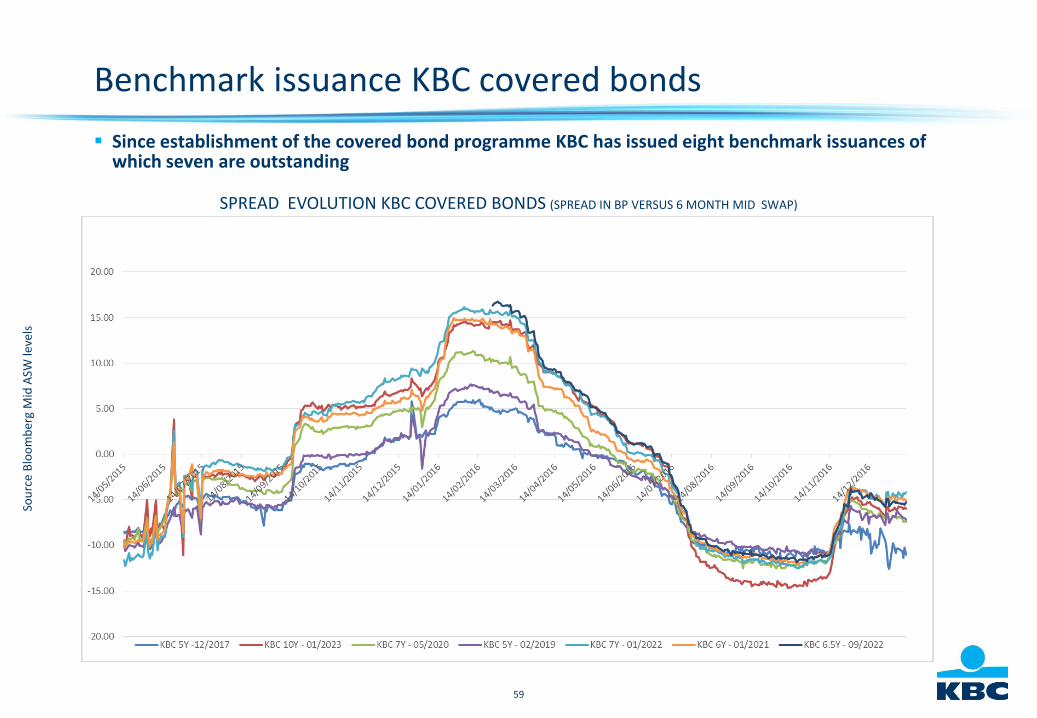
Benchmark issuance KBC covered bonds
Since establishment of the covered bond programme KBC has issued eight benchmark issuances of which seven are outstanding
SPREAD EVOLUTION KBC COVERED BONDS (SPREAD IN BP VERSUS 6 MONTH MID SWAP)
Sou
rce
Blo
om
ber
g M
id A
SW le
vels
60
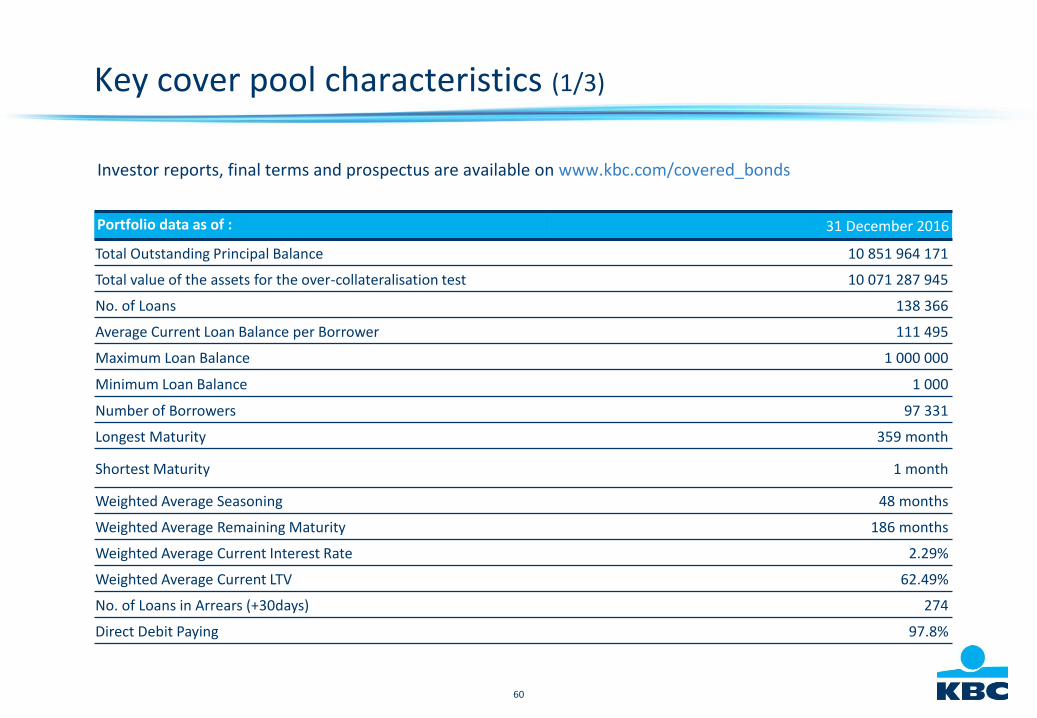
Key cover pool characteristics (1/3)
Investor reports, final terms and prospectus are available on www.kbc.com/covered_bonds
Portfolio data as of : 31 December 2016
Total Outstanding Principal Balance 10 851 964 171
Total value of the assets for the over-collateralisation test 10 071 287 945
No. of Loans 138 366
Average Current Loan Balance per Borrower 111 495
Maximum Loan Balance 1 000 000
Minimum Loan Balance 1 000
Number of Borrowers 97 331
Longest Maturity 359 month
Shortest Maturity 1 month
Weighted Average Seasoning 48 months
Weighted Average Remaining Maturity 186 months
Weighted Average Current Interest Rate 2.29%
Weighted Average Current LTV 62.49%
No. of Loans in Arrears (+30days) 274
Direct Debit Paying 97.8%
61
Key cover pool characteristics (2/3)
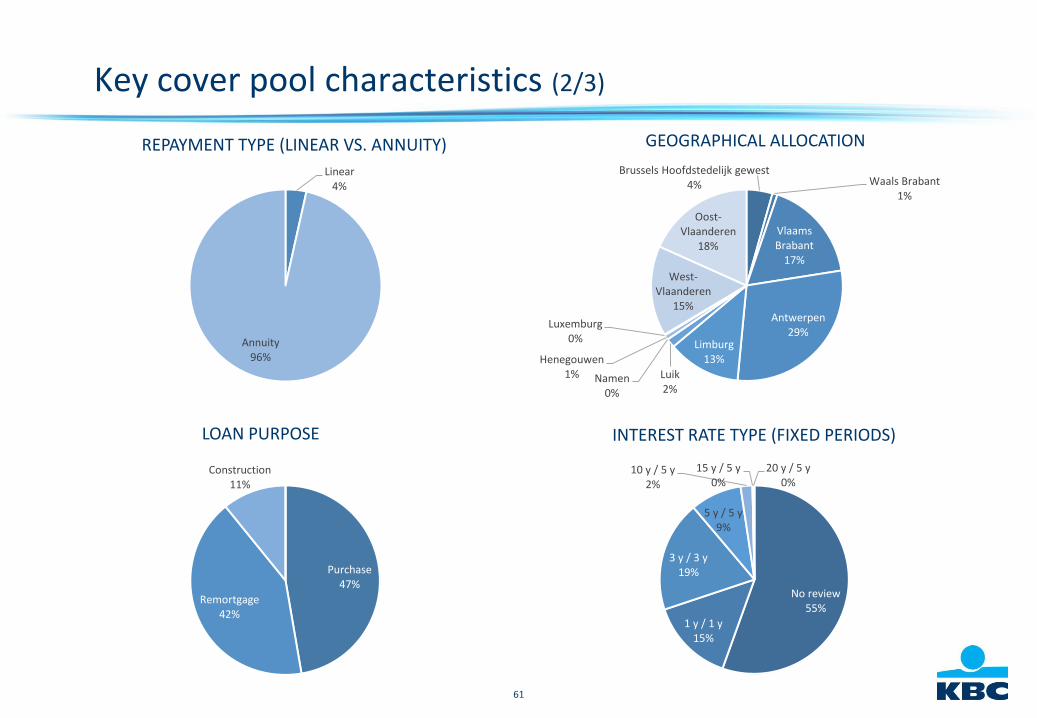
REPAYMENT TYPE (LINEAR VS. ANNUITY) GEOGRAPHICAL ALLOCATION
LOAN PURPOSE INTEREST RATE TYPE (FIXED PERIODS)
Linear4%
Annuity96%
Brussels Hoofdstedelijk gewest4% Waals Brabant
1%
Vlaams Brabant
17%
Antwerpen29%
Limburg13%
Luik2%
Namen0%
Henegouwen1%
Luxemburg0%
West-Vlaanderen
15%
Oost-Vlaanderen
18%
No review55%
1 y / 1 y15%
3 y / 3 y19%
5 y / 5 y9%
10 y / 5 y2%
15 y / 5 y0%
20 y / 5 y0%
Purchase47%
Remortgage42%
Construction11%
62
0,00
2,00
4,00
6,00
8,00
10,00
12,00
14,00
16,00
18,00
0,00
10,00
20,00
30,00
40,00
50,00
60,00
< 2
,5
2.5
< t
o <
= 3
.0
3.0
< t
o <
= 3
.5
3.5
< t
o <
= 4
.0
4.0
< t
o <
= 4
.5
4.5
< t
o <
= 5
.0
5.0
< t
o <
= 5
.5
5.5
< t
o <
= 6
.0
6.0
< t
o <
= 6
.5
6.5
< t
o <
= 7
.0
> 7
.0
0,00
5,00
10,00
15,00
20,00
25,00
30,00
0 - 12 13 - 24 25 - 36 37 - 48 49 - 60 61 - 72 73 - 84 85 - 96 97 -108 109 -
0,00
10,00
20,00
30,00
40,00
50,00
60,00
2013 - 2017 2018 - 2022 2023 - 2027 2028 - 2032 > 2032
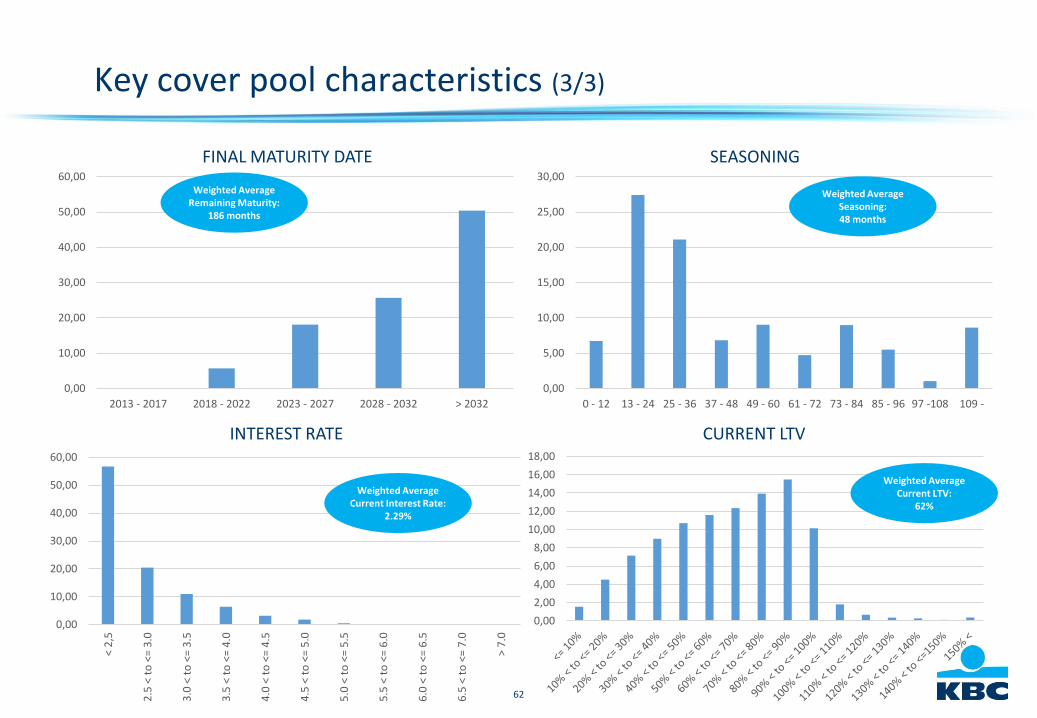
Key cover pool characteristics (3/3)
FINAL MATURITY DATE SEASONING
INTEREST RATE CURRENT LTV
Weighted Average Remaining Maturity:
186 months
Weighted Average Seasoning: 48 months
Weighted Average Current LTV:
62%
Weighted Average Current Interest Rate:
2.29%
63
Appendices
1 KBC 2015/16 benchmarks + overview of outstanding benchmarks
2 KBC Bank CDS levels
3
Overview of bank taxes
4
5
Details on selective credit exposure
6
7
Summary of KBC’s covered bond programme
Macroeconomic views
Solvency: details on capital
64
Ireland (1/3): now a core market of KBC group with a clear strategy and ambition
Ireland evidences strong demographics, solid macroeconomic fundamentals andgrowth prospects
With Ireland as a core market of KBC Group we confirm our long standing commitmentof 40 years to the Irish market
The recent performance of KBC Bank Ireland has been strong and it is completing atransformation from a mortgage and corporate lender to a fully-fledged client-centricretail bank
The strategy and ambition going forward is very clear: client-centric challenger bankwith a ‘Digital First’ approach supported by a focused physical distribution presencethrough hubs and straightforward product / solutions offering
65
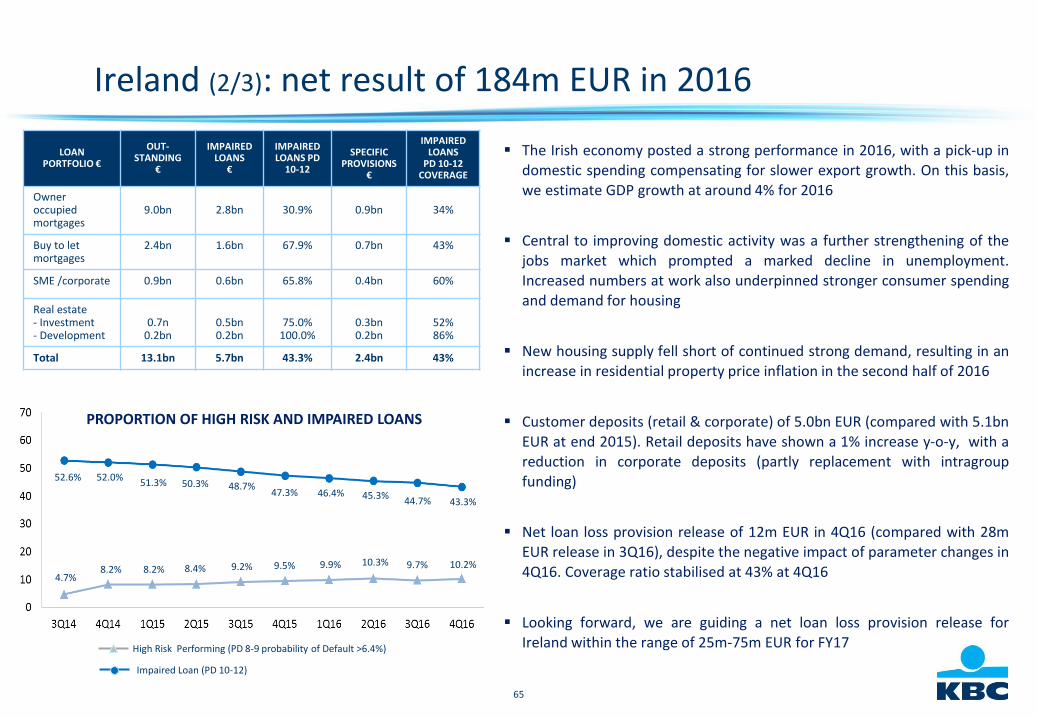
Ireland (2/3): net result of 184m EUR in 2016
The Irish economy posted a strong performance in 2016, with a pick-up indomestic spending compensating for slower export growth. On this basis,we estimate GDP growth at around 4% for 2016
Central to improving domestic activity was a further strengthening of thejobs market which prompted a marked decline in unemployment.Increased numbers at work also underpinned stronger consumer spendingand demand for housing
New housing supply fell short of continued strong demand, resulting in anincrease in residential property price inflation in the second half of 2016
Customer deposits (retail & corporate) of 5.0bn EUR (compared with 5.1bnEUR at end 2015). Retail deposits have shown a 1% increase y-o-y, with areduction in corporate deposits (partly replacement with intragroupfunding)
Net loan loss provision release of 12m EUR in 4Q16 (compared with 28mEUR release in 3Q16), despite the negative impact of parameter changes in4Q16. Coverage ratio stabilised at 43% at 4Q16
Looking forward, we are guiding a net loan loss provision release forIreland within the range of 25m-75m EUR for FY17
LOAN PORTFOLIO €
OUT-STANDING
€
IMPAIRED LOANS
€
IMPAIRED LOANS PD
10-12
SPECIFIC PROVISIONS
€
IMPAIRED LOANS
PD 10-12 COVERAGE
Owner occupied mortgages
9.0bn 2.8bn 30.9% 0.9bn 34%
Buy to let mortgages
2.4bn 1.6bn 67.9% 0.7bn 43%
SME /corporate 0.9bn 0.6bn 65.8% 0.4bn 60%
Real estate- Investment- Development
0.7n0.2bn
0.5bn0.2bn
75.0%100.0%
0.3bn0.2bn
52%86%
Total 13.1bn 5.7bn 43.3% 2.4bn 43%
PROPORTION OF HIGH RISK AND IMPAIRED LOANS
High Risk Performing (PD 8-9 probability of Default >6.4%)
Impaired Loan (PD 10-12)
52.6%
4.7%8.2%
52.0%51.3% 50.3%
8.4%8.2% 9.2%
48.7%
9.5%
47.3% 46.4%
9.9%
45.3%
10.3%
44.7%
9.7%
43.3%
10.2%
66
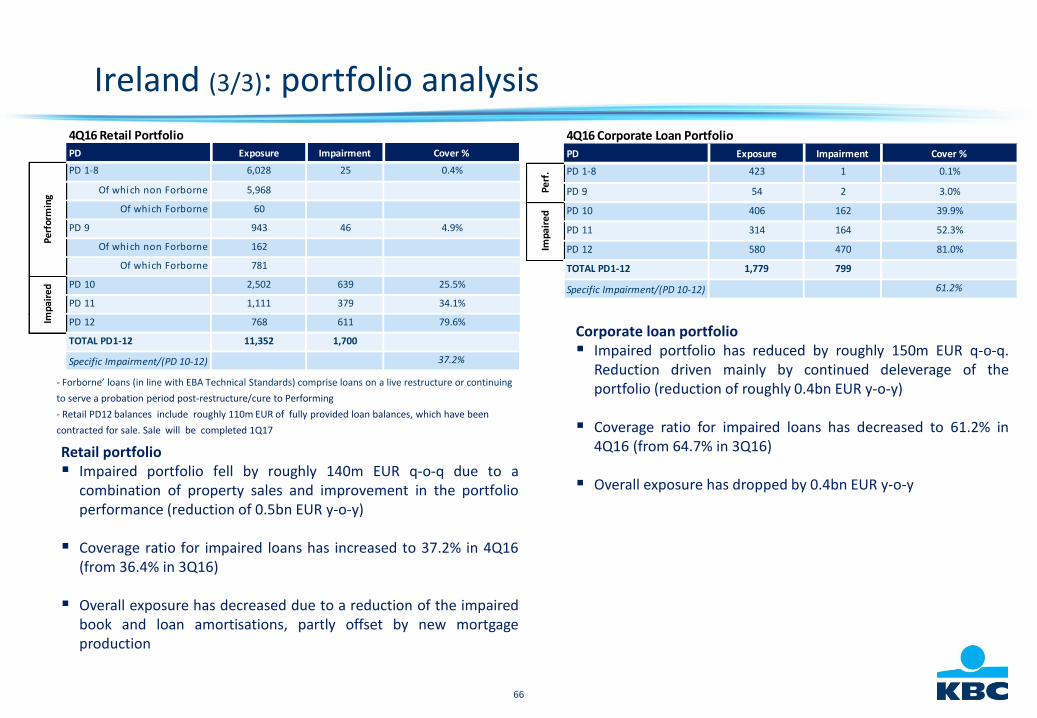
Retail portfolio Impaired portfolio fell by roughly 140m EUR q-o-q due to a
combination of property sales and improvement in the portfolioperformance (reduction of 0.5bn EUR y-o-y)
Coverage ratio for impaired loans has increased to 37.2% in 4Q16(from 36.4% in 3Q16)
Overall exposure has decreased due to a reduction of the impairedbook and loan amortisations, partly offset by new mortgageproduction
Ireland (3/3): portfolio analysis
Corporate loan portfolio Impaired portfolio has reduced by roughly 150m EUR q-o-q.
Reduction driven mainly by continued deleverage of theportfolio (reduction of roughly 0.4bn EUR y-o-y)
Coverage ratio for impaired loans has decreased to 61.2% in4Q16 (from 64.7% in 3Q16)
Overall exposure has dropped by 0.4bn EUR y-o-y
- Forborne’ loans (in line with EBA Technical Standards) comprise loans on a live restructure or continuing
to serve a probation period post-restructure/cure to Performing
- Retail PD12 balances include roughly 110m EUR of fully provided loan balances, which have been
contracted for sale. Sale will be completed 1Q17
4Q16 Retail Portfolio
PD Exposure Impairment Cover %
PD 1-8 6,028 25 0.4%
Of which non Forborne 5,968
Of which Forborne 60
PD 9 943 46 4.9%
Of which non Forborne 162
Of which Forborne 781
PD 10 2,502 639 25.5%
PD 11 1,111 379 34.1%
PD 12 768 611 79.6%
TOTAL PD1-12 11,352 1,700
Specific Impairment/(PD 10-12) 37.2%
Perf
orm
ing
Impa
ired
4Q16 Corporate Loan Portfolio
PD Exposure Impairment Cover %
PD 1-8 423 1 0.1%
PD 9 54 2 3.0%
PD 10 406 162 39.9%
PD 11 314 164 52.3%
PD 12 580 470 81.0%
TOTAL PD1-12 1,779 799
Specific Impairment/(PD 10-12) 61.2%
Imp
air
ed
Pe
rf.
67
Appendices
1 KBC 2015/16 benchmarks + overview of outstanding benchmarks
2 KBC Bank CDS levels
3
Overview of bank taxes
4
5
Details on selective credit exposure
6
7
Summary of KBC’s covered bond programme
Macroeconomic views
Solvency: details on capital
68
Overview of bank taxes1
INTERNATIONAL MARKETS BUCZECH REPUBLIC BU
BELGIUM BUKBC GROUP
2724232550
26
71
23
11
8
4Q163Q162Q16
22
-1
1Q16
61
4Q15
282
3Q152Q151Q15
79
Common bank taxesESRF contribution
18449118
0013
0 38
57
42
4Q163Q162Q16
32
-6
1Q16
241
4Q153Q152Q151Q15
160
Common bank taxesESRF contribution
11
9
22
-1
710
6
-12
900
4Q163Q162Q161Q16
28
4Q153Q15
-3
2Q151Q15
20
Common bank taxesESRF contribution
62
92
592724
-12
83243
34
202
3215
4Q163Q162Q16
51
-8
1Q16
335
4Q15
49
3Q15
21
2Q151Q15
264
Common bank taxes
European Single Resolution Fund contribution
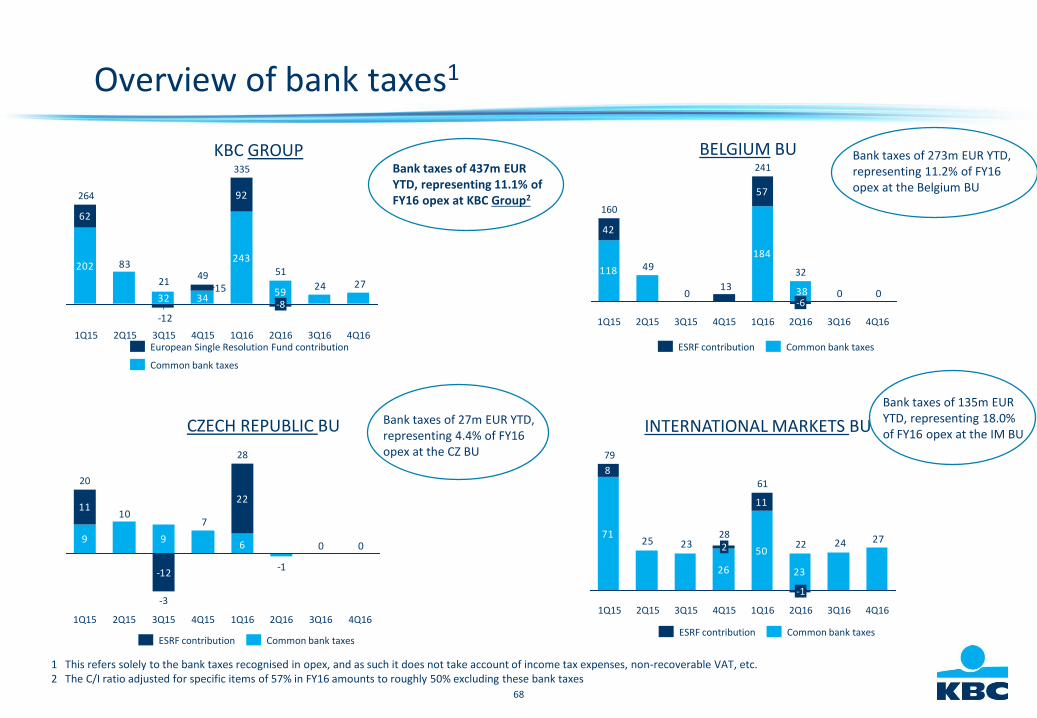
1 This refers solely to the bank taxes recognised in opex, and as such it does not take account of income tax expenses, non-recoverable VAT, etc.2 The C/I ratio adjusted for specific items of 57% in FY16 amounts to roughly 50% excluding these bank taxes
Bank taxes of 437m EUR YTD, representing 11.1% of FY16 opex at KBC Group2
Bank taxes of 273m EUR YTD, representing 11.2% of FY16 opex at the Belgium BU
Bank taxes of 27m EUR YTD, representing 4.4% of FY16 opex at the CZ BU
Bank taxes of 135m EUR YTD, representing 18.0% of FY16 opex at the IM BU
69
Appendices
1 KBC 2015/16 benchmarks + overview of outstanding benchmarks
2 KBC Bank CDS levels
3
Overview of bank taxes
4
5
Details on selective credit exposure
6
7
Summary of KBC’s covered bond programme
Macroeconomic views
Solvency: details on capital
70
P1 Requirement
P2 Requirement
Capital Conservation buffer
O-SIFI buffer
CounterCyclical buffer
10.25%
4.50%
4.625%
0.625%0.50%
2019
10.40%
4.50%
1.75%
2.50%
1.50%0.15%
2018
9.78%
4.50%
1.75%
1.875%
1.50%0.15%
2017
8.65%
4.50%
1.75%
1.250%
1.00%0.15%
2016
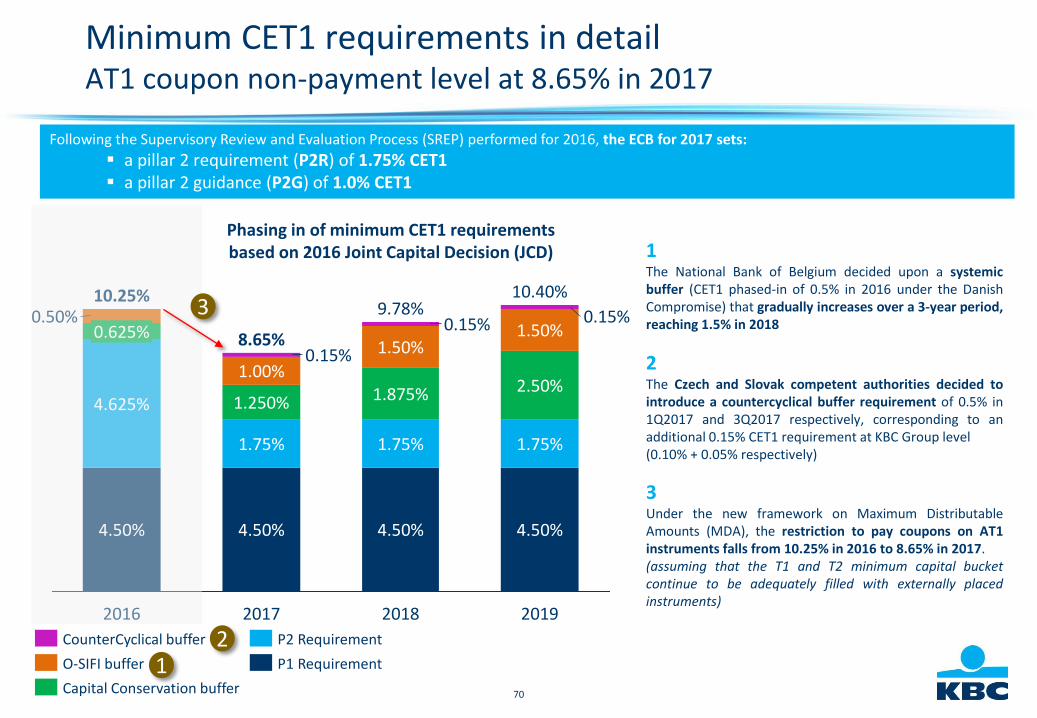
Minimum CET1 requirements in detailAT1 coupon non-payment level at 8.65% in 2017
1The National Bank of Belgium decided upon a systemicbuffer (CET1 phased-in of 0.5% in 2016 under the DanishCompromise) that gradually increases over a 3-year period,reaching 1.5% in 2018
2The Czech and Slovak competent authorities decided tointroduce a countercyclical buffer requirement of 0.5% in1Q2017 and 3Q2017 respectively, corresponding to anadditional 0.15% CET1 requirement at KBC Group level(0.10% + 0.05% respectively)
3Under the new framework on Maximum DistributableAmounts (MDA), the restriction to pay coupons on AT1instruments falls from 10.25% in 2016 to 8.65% in 2017.(assuming that the T1 and T2 minimum capital bucketcontinue to be adequately filled with externally placedinstruments)
12
Phasing in of minimum CET1 requirementsbased on 2016 Joint Capital Decision (JCD)
Following the Supervisory Review and Evaluation Process (SREP) performed for 2016, the ECB for 2017 sets:
a pillar 2 requirement (P2R) of 1.75% CET1 a pillar 2 guidance (P2G) of 1.0% CET1
3
71
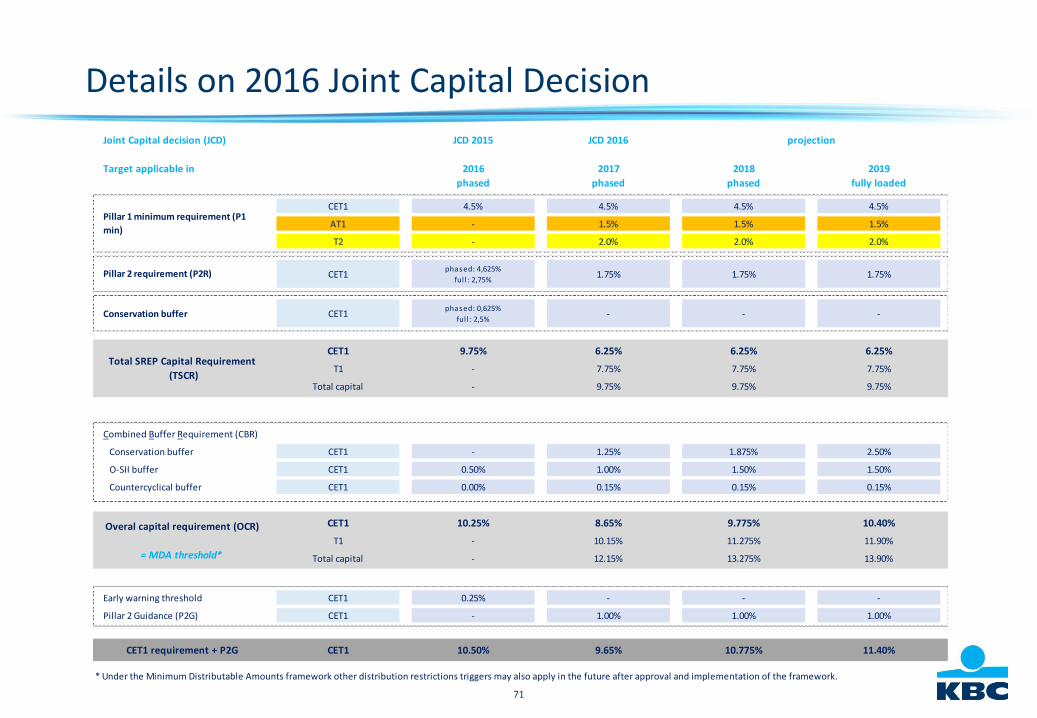
Details on 2016 Joint Capital Decision
Joint Capital decision (JCD) JCD 2015 JCD 2016 projection
Target applicable in 2016 2017 2018 2019
phased phased phased fully loaded
CET1 4.5% 4.5% 4.5% 4.5%
AT1 - 1.5% 1.5% 1.5%
T2 - 2.0% 2.0% 2.0%
CET1phased: 4,625%
ful l : 2,75%1.75% 1.75% 1.75%
Conservation buffer CET1phased: 0,625%
ful l : 2,5%- - -
CET1 9.75% 6.25% 6.25% 6.25%
T1 - 7.75% 7.75% 7.75%
Total capital - 9.75% 9.75% 9.75%
Combined Buffer Requirement (CBR)
Conservation buffer CET1 - 1.25% 1.875% 2.50%
O-SII buffer CET1 0.50% 1.00% 1.50% 1.50%
Countercyclical buffer CET1 0.00% 0.15% 0.15% 0.15%
CET1 10.25% 8.65% 9.775% 10.40%
T1 - 10.15% 11.275% 11.90%
Total capital - 12.15% 13.275% 13.90%
Early warning threshold CET1 0.25% - - -
Pillar 2 Guidance (P2G) CET1 - 1.00% 1.00% 1.00%
CET1 10.50% 9.65% 10.775% 11.40%
* Under the Minimum Distributable Amounts framework other distribution restrictions triggers may also apply in the future after approval and implementation of the framework.
Total SREP Capital Requirement
(TSCR)
Overal capital requirement (OCR)
= MDA threshold*
CET1 requirement + P2G
Pillar 1 minimum requirement (P1
min)
Pillar 2 requirement (P2R)
72
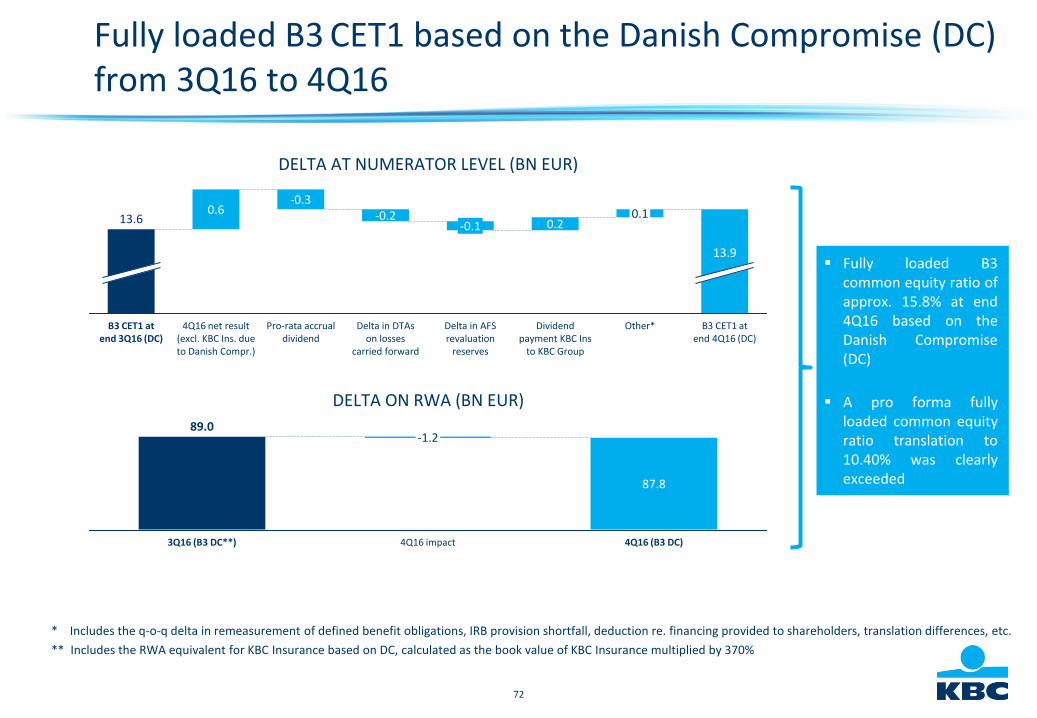
Fully loaded B3 CET1 based on the Danish Compromise (DC)from 3Q16 to 4Q16
Jan 2012 Dec 2012 2014-2020
4Q16 (B3 DC)
87.8
4Q16 impact
-1.2
3Q16 (B3 DC**)
89.0
DELTA AT NUMERATOR LEVEL (BN EUR)
DELTA ON RWA (BN EUR)
* Includes the q-o-q delta in remeasurement of defined benefit obligations, IRB provision shortfall, deduction re. financing provided to shareholders, translation differences, etc.
** Includes the RWA equivalent for KBC Insurance based on DC, calculated as the book value of KBC Insurance multiplied by 370%
Fully loaded B3common equity ratio ofapprox. 15.8% at end4Q16 based on theDanish Compromise(DC)
A pro forma fullyloaded common equityratio translation to10.40% was clearlyexceeded
B3 CET1 at end 4Q16 (DC)
13.9
Other*
0.1
Dividend payment KBC Ins
to KBC Group
0.2
Delta in AFS revaluation
reserves
-0.1
Delta in DTAs on losses
carried forward
-0.2
Pro-rata accrual dividend
-0.3
4Q16 net result (excl. KBC Ins. due to Danish Compr.)
0.6
B3 CET1 at end 3Q16 (DC)
13.6
73
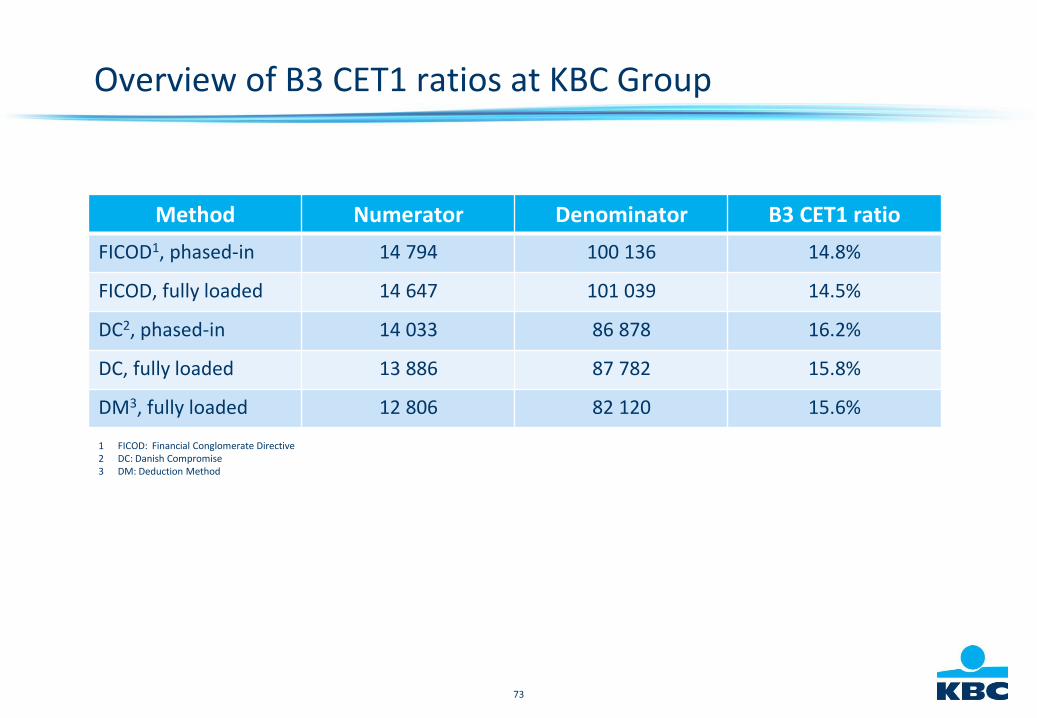
Overview of B3 CET1 ratios at KBC Group
Method Numerator Denominator B3 CET1 ratio
FICOD1, phased-in 14 794 100 136 14.8%
FICOD, fully loaded 14 647 101 039 14.5%
DC2, phased-in 14 033 86 878 16.2%
DC, fully loaded 13 886 87 782 15.8%
DM3, fully loaded 12 806 82 120 15.6%
1 FICOD: Financial Conglomerate Directive2 DC: Danish Compromise3 DM: Deduction Method
74
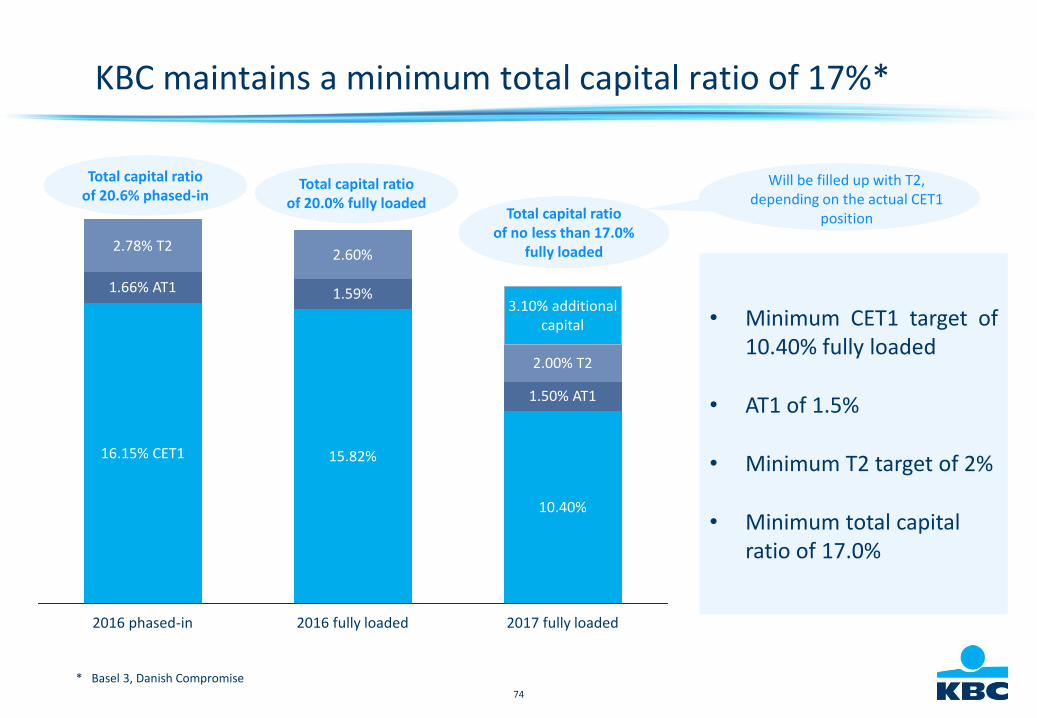
KBC maintains a minimum total capital ratio of 17%*
• Minimum CET1 target of10.40% fully loaded
• AT1 of 1.5%
• Minimum T2 target of 2%
• Minimum total capital ratio of 17.0%
Total capital ratioof 20.6% phased-in
2017 fully loaded
10.40%
1.50% AT1
2.00% T2
3.10% additionalcapital
2016 fully loaded
15.82%
1.59%
2.60%
2016 phased-in
16.15% CET1
1.66% AT1
2.78% T2
Total capital ratioof no less than 17.0%
fully loaded
Will be filled up with T2, depending on the actual CET1
position
* Basel 3, Danish Compromise
Total capital ratioof 20.0% fully loaded
75
Solvency II ratio
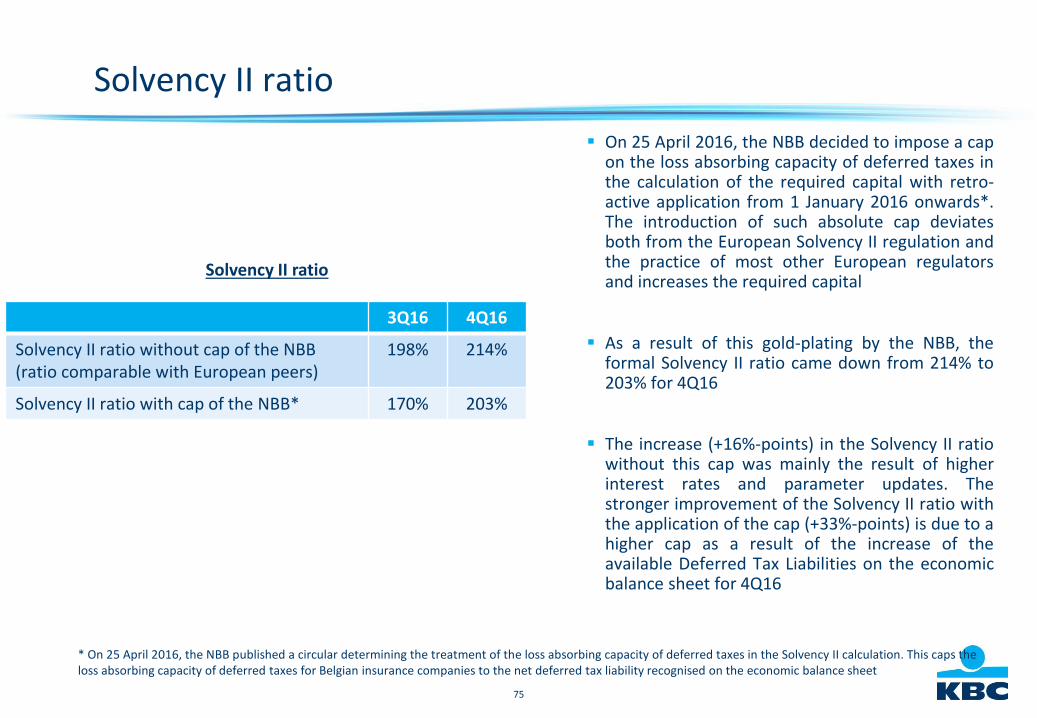
Solvency II ratio
3Q16 4Q16
Solvency II ratio without cap of the NBB(ratio comparable with European peers)
198% 214%
Solvency II ratio with cap of the NBB* 170% 203%
* On 25 April 2016, the NBB published a circular determining the treatment of the loss absorbing capacity of deferred taxes in the Solvency II calculation. This caps theloss absorbing capacity of deferred taxes for Belgian insurance companies to the net deferred tax liability recognised on the economic balance sheet
On 25 April 2016, the NBB decided to impose a capon the loss absorbing capacity of deferred taxes inthe calculation of the required capital with retro-active application from 1 January 2016 onwards*.The introduction of such absolute cap deviatesboth from the European Solvency II regulation andthe practice of most other European regulatorsand increases the required capital
As a result of this gold-plating by the NBB, theformal Solvency II ratio came down from 214% to203% for 4Q16
The increase (+16%-points) in the Solvency II ratiowithout this cap was mainly the result of higherinterest rates and parameter updates. Thestronger improvement of the Solvency II ratio withthe application of the cap (+33%-points) is due to ahigher cap as a result of the increase of theavailable Deferred Tax Liabilities on the economicbalance sheet for 4Q16
76
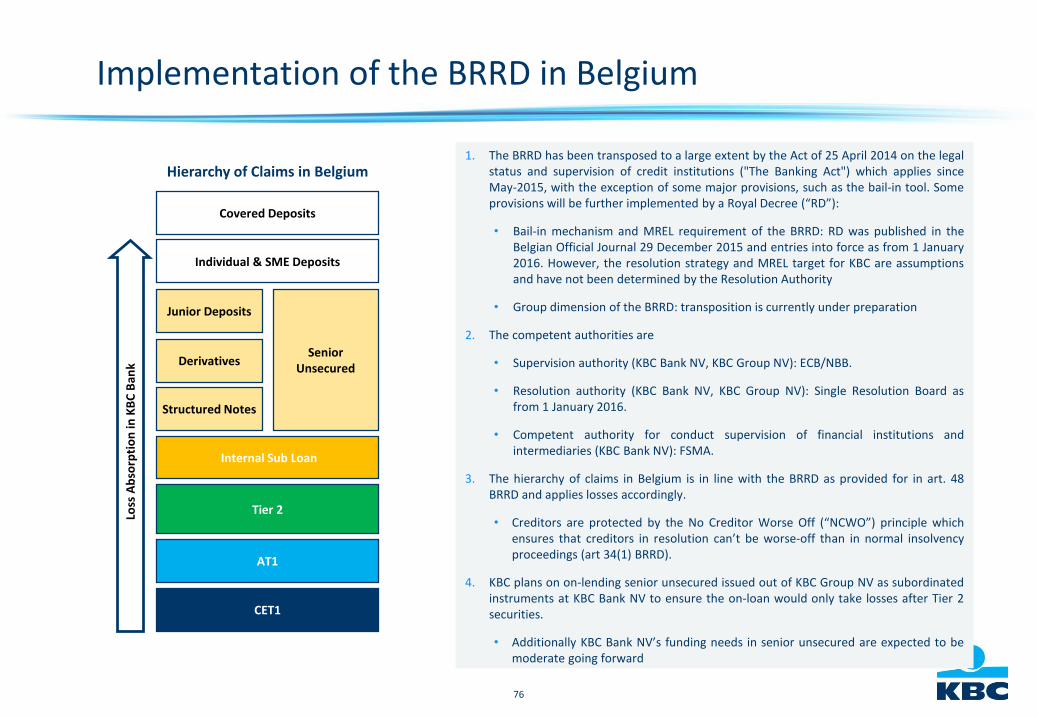
Implementation of the BRRD in Belgium
1. The BRRD has been transposed to a large extent by the Act of 25 April 2014 on the legalstatus and supervision of credit institutions ("The Banking Act") which applies sinceMay-2015, with the exception of some major provisions, such as the bail-in tool. Someprovisions will be further implemented by a Royal Decree (“RD”):
• Bail-in mechanism and MREL requirement of the BRRD: RD was published in theBelgian Official Journal 29 December 2015 and entries into force as from 1 January2016. However, the resolution strategy and MREL target for KBC are assumptionsand have not been determined by the Resolution Authority
• Group dimension of the BRRD: transposition is currently under preparation
2. The competent authorities are
• Supervision authority (KBC Bank NV, KBC Group NV): ECB/NBB.
• Resolution authority (KBC Bank NV, KBC Group NV): Single Resolution Board asfrom 1 January 2016.
• Competent authority for conduct supervision of financial institutions andintermediaries (KBC Bank NV): FSMA.
3. The hierarchy of claims in Belgium is in line with the BRRD as provided for in art. 48BRRD and applies losses accordingly.
• Creditors are protected by the No Creditor Worse Off (“NCWO”) principle whichensures that creditors in resolution can’t be worse-off than in normal insolvencyproceedings (art 34(1) BRRD).
4. KBC plans on on-lending senior unsecured issued out of KBC Group NV as subordinatedinstruments at KBC Bank NV to ensure the on-loan would only take losses after Tier 2securities.
• Additionally KBC Bank NV’s funding needs in senior unsecured are expected to bemoderate going forward
CET1
AT1
Tier 2
Internal Sub Loan
Senior Unsecured
Hierarchy of Claims in Belgium
Structured Notes
Derivatives
Junior Deposits
Individual & SME Deposits
Covered Deposits
Loss
Ab
sorp
tio
n in
KB
C B
ank
77
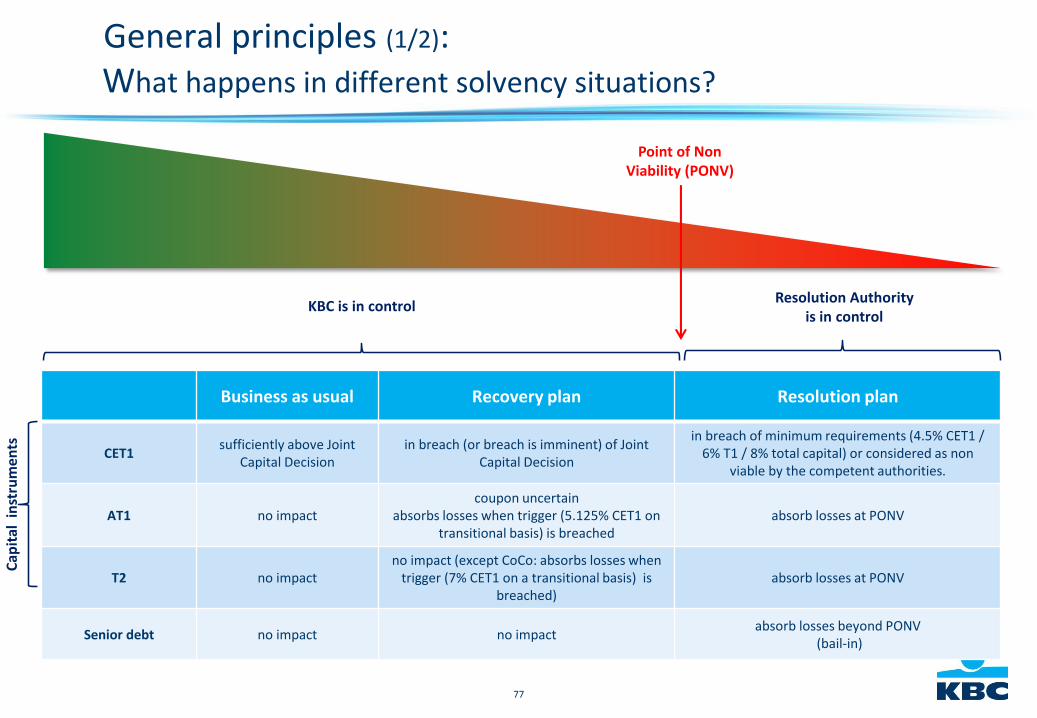
General principles (1/2): What happens in different solvency situations?
Point of Non Viability (PONV)
Business as usual Recovery plan Resolution plan
CET1sufficiently above Joint
Capital Decisionin breach (or breach is imminent) of Joint
Capital Decision
in breach of minimum requirements (4.5% CET1 / 6% T1 / 8% total capital) or considered as non
viable by the competent authorities.
AT1 no impactcoupon uncertain
absorbs losses when trigger (5.125% CET1 on transitional basis) is breached
absorb losses at PONV
T2 no impactno impact (except CoCo: absorbs losses when
trigger (7% CET1 on a transitional basis) is breached)
absorb losses at PONV
Senior debt no impact no impactabsorb losses beyond PONV
(bail-in)
KBC is in controlResolution Authority
is in control
Cap
ital
inst
rum
ents
78
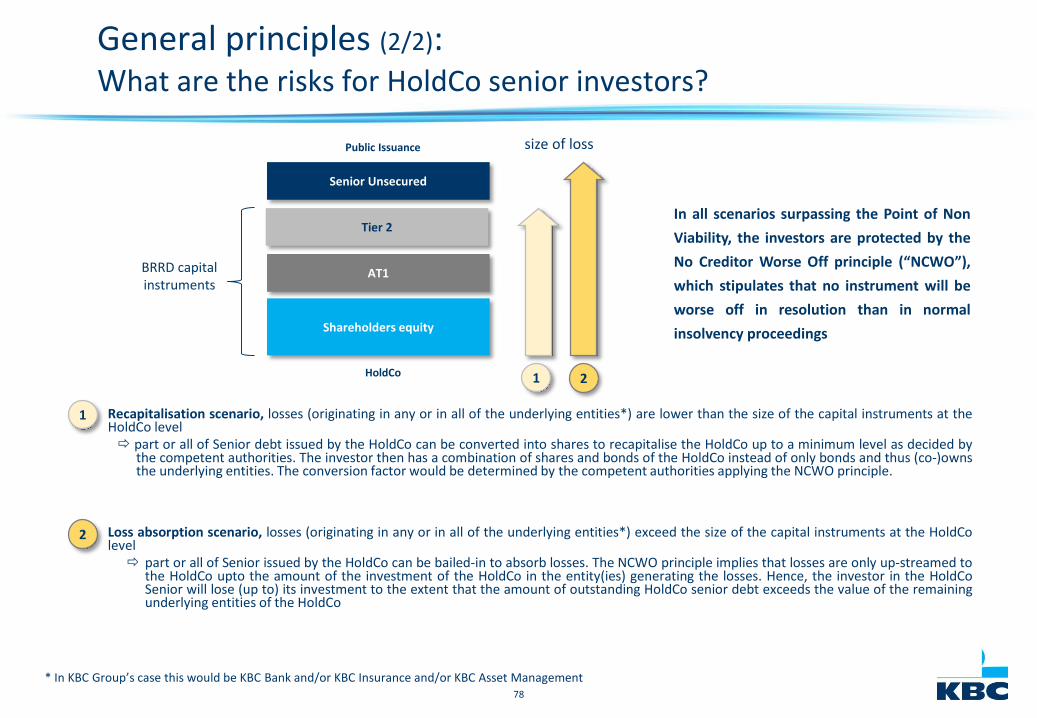
General principles (2/2): What are the risks for HoldCo senior investors?
78
Shareholders equity
AT1
Tier 2
Senior Unsecured
Recapitalisation scenario, losses (originating in any or in all of the underlying entities*) are lower than the size of the capital instruments at theHoldCo level part or all of Senior debt issued by the HoldCo can be converted into shares to recapitalise the HoldCo up to a minimum level as decided by
the competent authorities. The investor then has a combination of shares and bonds of the HoldCo instead of only bonds and thus (co-)ownsthe underlying entities. The conversion factor would be determined by the competent authorities applying the NCWO principle.
Loss absorption scenario, losses (originating in any or in all of the underlying entities*) exceed the size of the capital instruments at the HoldColevel part or all of Senior issued by the HoldCo can be bailed-in to absorb losses. The NCWO principle implies that losses are only up-streamed to
the HoldCo upto the amount of the investment of the HoldCo in the entity(ies) generating the losses. Hence, the investor in the HoldCoSenior will lose (up to) its investment to the extent that the amount of outstanding HoldCo senior debt exceeds the value of the remainingunderlying entities of the HoldCo
Public Issuance
1 2
1
2
BRRD capitalinstruments
HoldCo
In all scenarios surpassing the Point of Non
Viability, the investors are protected by the
No Creditor Worse Off principle (“NCWO”),
which stipulates that no instrument will be
worse off in resolution than in normal
insolvency proceedings
* In KBC Group’s case this would be KBC Bank and/or KBC Insurance and/or KBC Asset Management
size of loss
79
Appendices
1 KBC 2015/16 benchmarks + overview of outstanding benchmarks
2 KBC Bank CDS levels
3
Overview of bank taxes
4
5
Details on selective credit exposure
6
7
Summary of KBC’s covered bond programme
Macroeconomic views
Solvency: details on capital
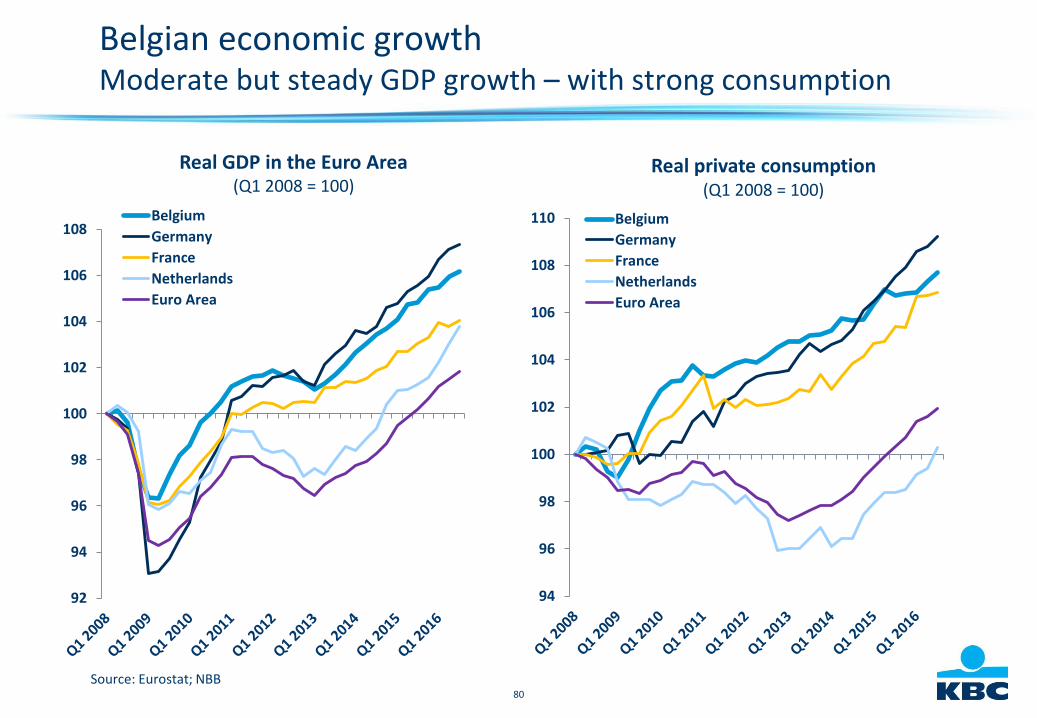
80
Belgian economic growthModerate but steady GDP growth – with strong consumption
92
94
96
98
100
102
104
106
108Belgium
Germany
France
Netherlands
Euro Area
Real GDP in the Euro Area (Q1 2008 = 100)
94
96
98
100
102
104
106
108
110
Real private consumption(Q1 2008 = 100)
Belgium
Germany
France
Netherlands
Euro Area
Source: Eurostat; NBB
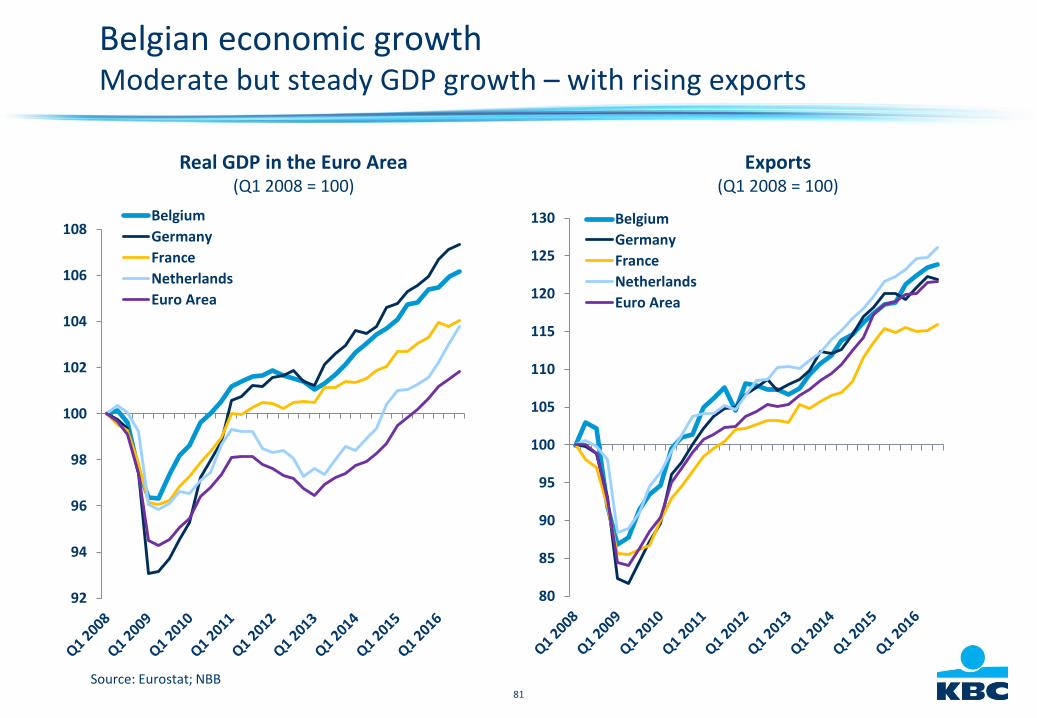
81
Real GDP in the Euro Area (Q1 2008 = 100)
Exports (Q1 2008 = 100)
Belgian economic growthModerate but steady GDP growth – with rising exports
Source: Eurostat; NBB
80
85
90
95
100
105
110
115
120
125
130 Belgium
Germany
France
Netherlands
Euro Area
92
94
96
98
100
102
104
106
108Belgium
Germany
France
Netherlands
Euro Area
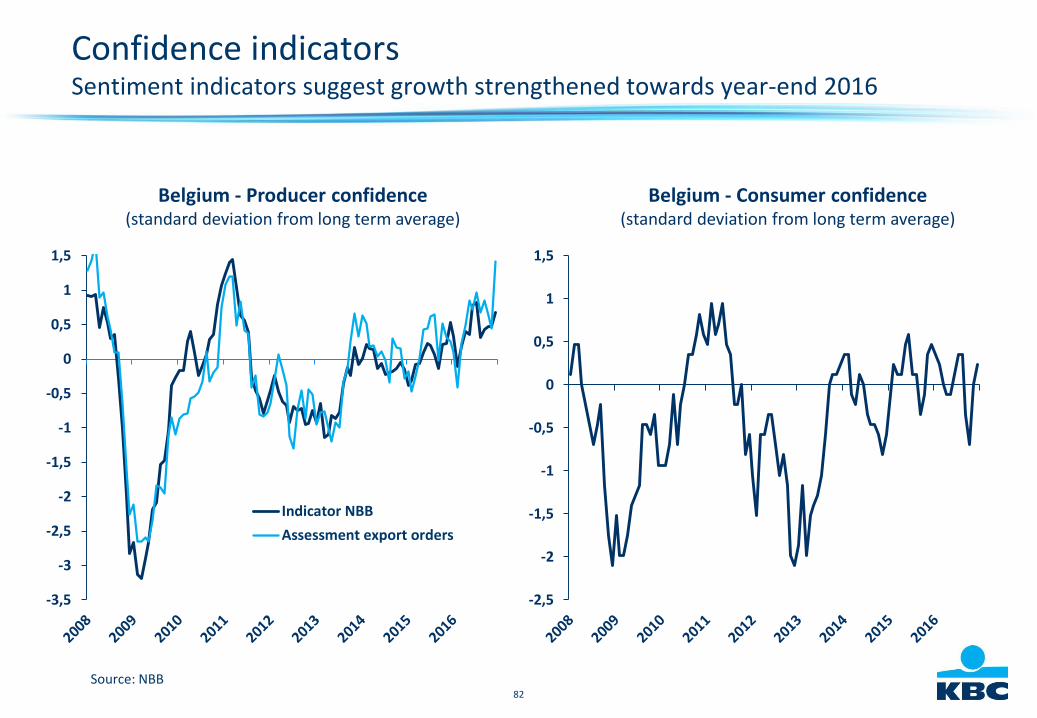
82
Belgium - Consumer confidence (standard deviation from long term average)
Confidence indicatorsSentiment indicators suggest growth strengthened towards year-end 2016
-2,5
-2
-1,5
-1
-0,5
0
0,5
1
1,5
Source: NBB
-3,5
-3
-2,5
-2
-1,5
-1
-0,5
0
0,5
1
1,5
Indicator NBB
Assessment export orders
Belgium - Producer confidence (standard deviation from long term average)
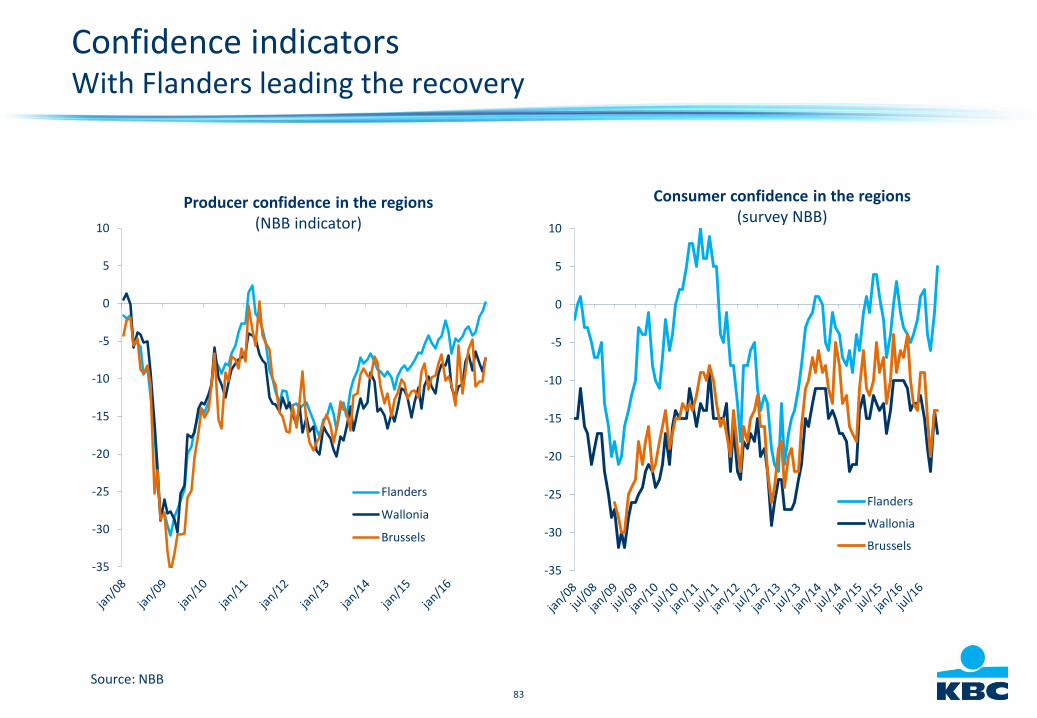
83
Confidence indicatorsWith Flanders leading the recovery
Source: NBB
-35
-30
-25
-20
-15
-10
-5
0
5
10
Flanders
Wallonia
Brussels
Producer confidence in the regions (NBB indicator)
-35
-30
-25
-20
-15
-10
-5
0
5
10
Flanders
Wallonia
Brussels
Consumer confidence in the regions (survey NBB)
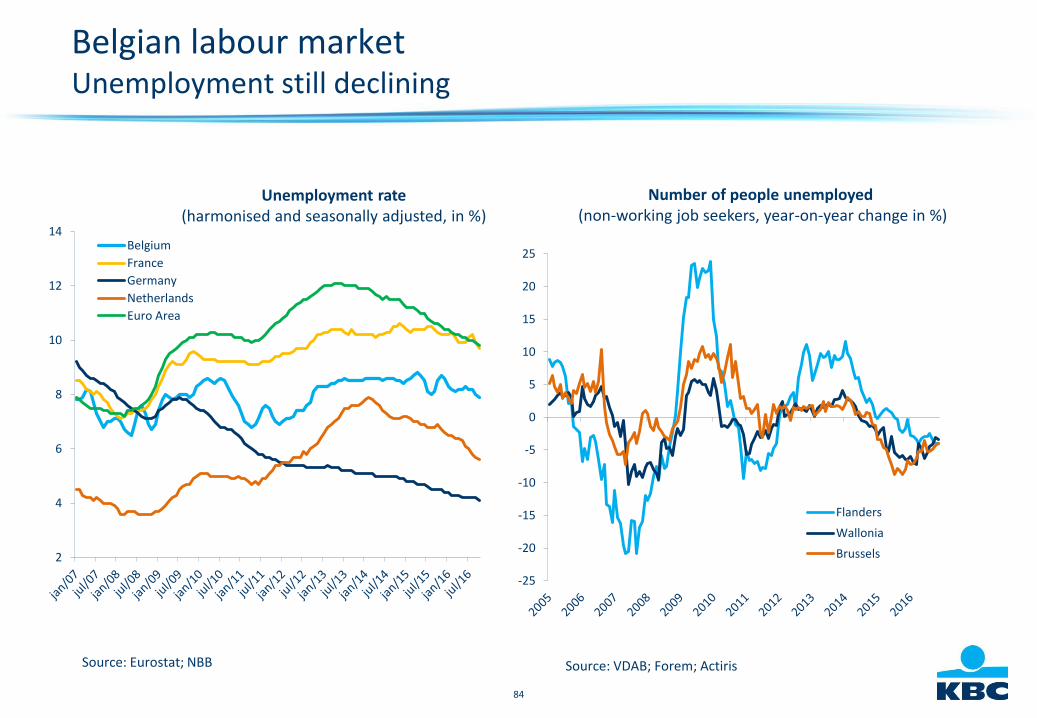
84
Belgian labour marketUnemployment still declining
Number of people unemployed(non-working job seekers, year-on-year change in %)
Source: VDAB; Forem; Actiris
-25
-20
-15
-10
-5
0
5
10
15
20
25
Flanders
Wallonia
Brussels2
4
6
8
10
12
14Belgium
France
Germany
Netherlands
Euro Area
Unemployment rate(harmonised and seasonally adjusted, in %)
Source: Eurostat; NBB
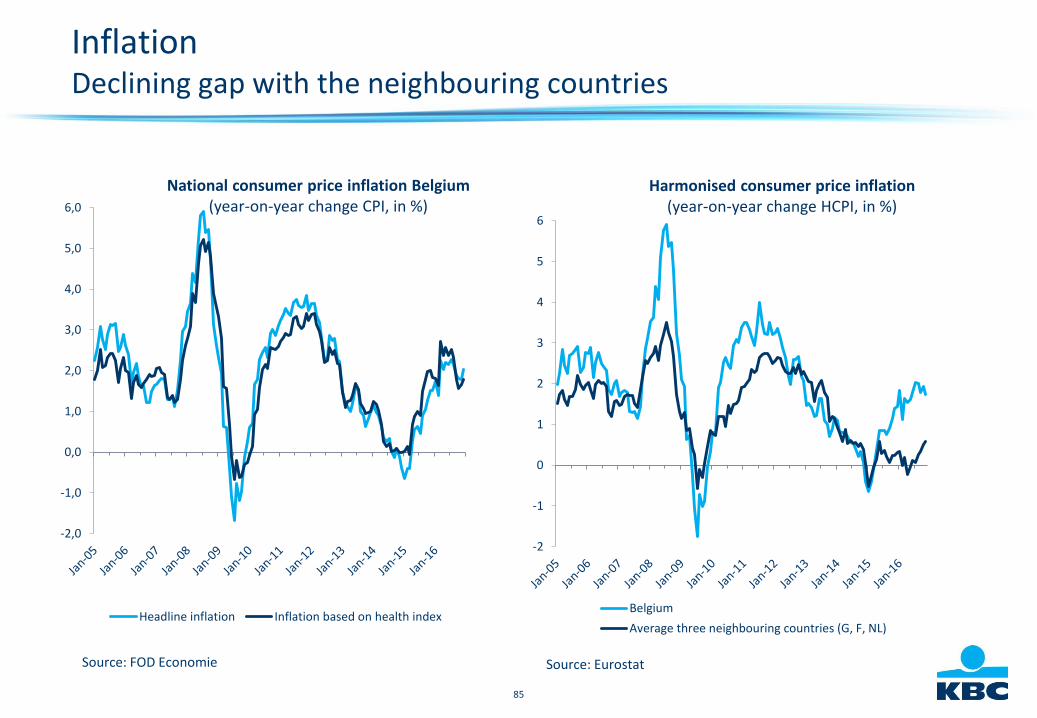
85
InflationDeclining gap with the neighbouring countries
Source: FOD Economie
-2
-1
0
1
2
3
4
5
6
Belgium
Average three neighbouring countries (G, F, NL)
Harmonised consumer price inflation (year-on-year change HCPI, in %)
-2,0
-1,0
0,0
1,0
2,0
3,0
4,0
5,0
6,0
Headline inflation Inflation based on health index
National consumer price inflation Belgium (year-on-year change CPI, in %)
Source: Eurostat
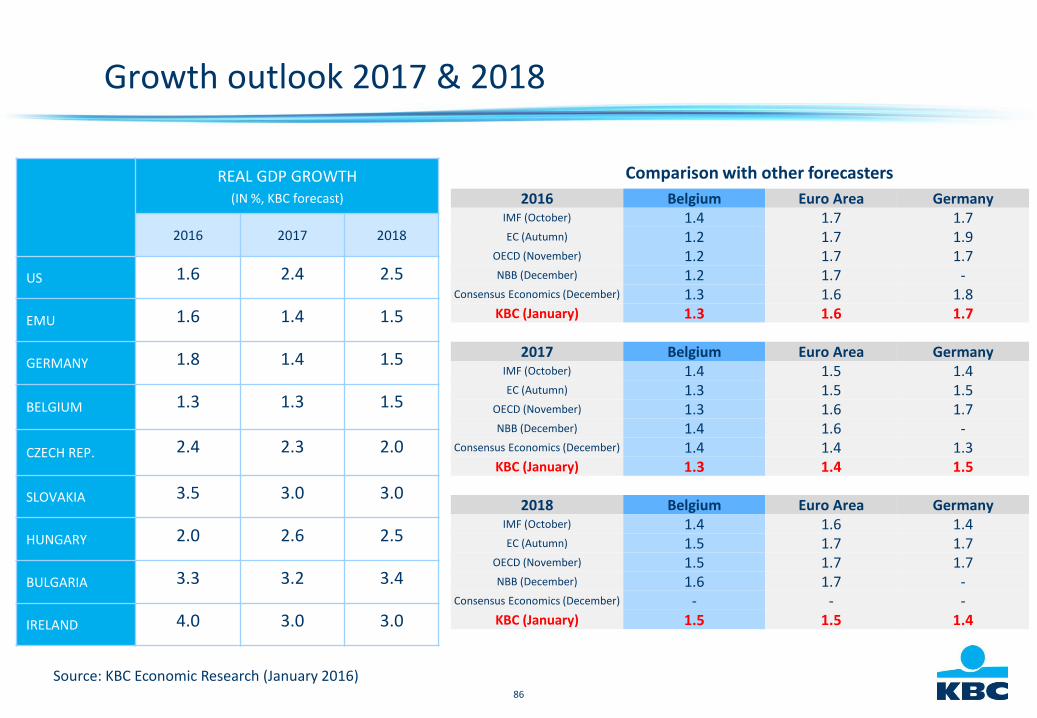
86
REAL GDP GROWTH (IN %, KBC forecast)
2016 2017 2018
US 1.6 2.4 2.5
EMU 1.6 1.4 1.5
GERMANY 1.8 1.4 1.5
BELGIUM 1.3 1.3 1.5
CZECH REP. 2.4 2.3 2.0
SLOVAKIA 3.5 3.0 3.0
HUNGARY 2.0 2.6 2.5
BULGARIA 3.3 3.2 3.4
IRELAND 4.0 3.0 3.0
Growth outlook 2017 & 2018
Source: KBC Economic Research (January 2016)
Comparison with other forecasters
2016 Belgium Euro Area GermanyIMF (October) 1.4 1.7 1.7EC (Autumn) 1.2 1.7 1.9
OECD (November) 1.2 1.7 1.7NBB (December) 1.2 1.7 -
Consensus Economics (December) 1.3 1.6 1.8KBC (January) 1.3 1.6 1.7
2017 Belgium Euro Area GermanyIMF (October) 1.4 1.5 1.4EC (Autumn) 1.3 1.5 1.5
OECD (November) 1.3 1.6 1.7NBB (December) 1.4 1.6 -
Consensus Economics (December) 1.4 1.4 1.3KBC (January) 1.3 1.4 1.5
2018 Belgium Euro Area GermanyIMF (October) 1.4 1.6 1.4EC (Autumn) 1.5 1.7 1.7
OECD (November) 1.5 1.7 1.7NBB (December) 1.6 1.7 -
Consensus Economics (December) - - -KBC (January) 1.5 1.5 1.4
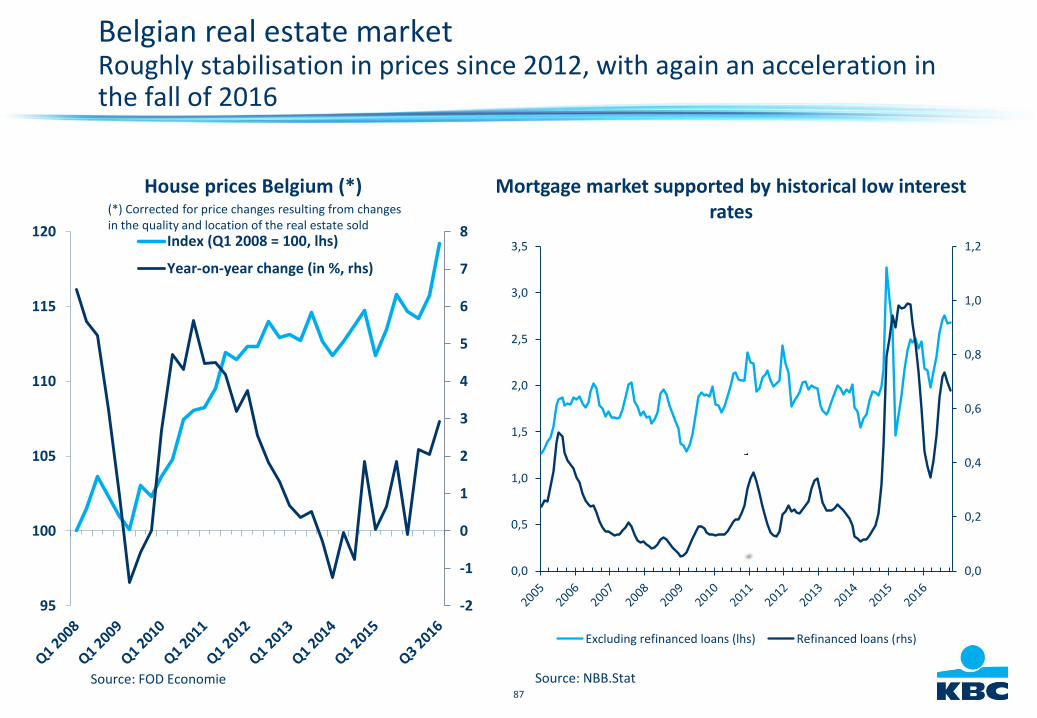
87
Belgian real estate marketRoughly stabilisation in prices since 2012, with again an acceleration in the fall of 2016
House prices Belgium (*)
Source: FOD Economie
(*) Corrected for price changes resulting from changes in the quality and location of the real estate sold
-2
-1
0
1
2
3
4
5
6
7
8
95
100
105
110
115
120Index (Q1 2008 = 100, lhs)
Year-on-year change (in %, rhs)
0,0
0,2
0,4
0,6
0,8
1,0
1,2
0,0
0,5
1,0
1,5
2,0
2,5
3,0
3,5
Excluding refinanced loans (lhs) Refinanced loans (rhs)
Source: NBB.Stat
Mortgage market supported by historical low interest rates
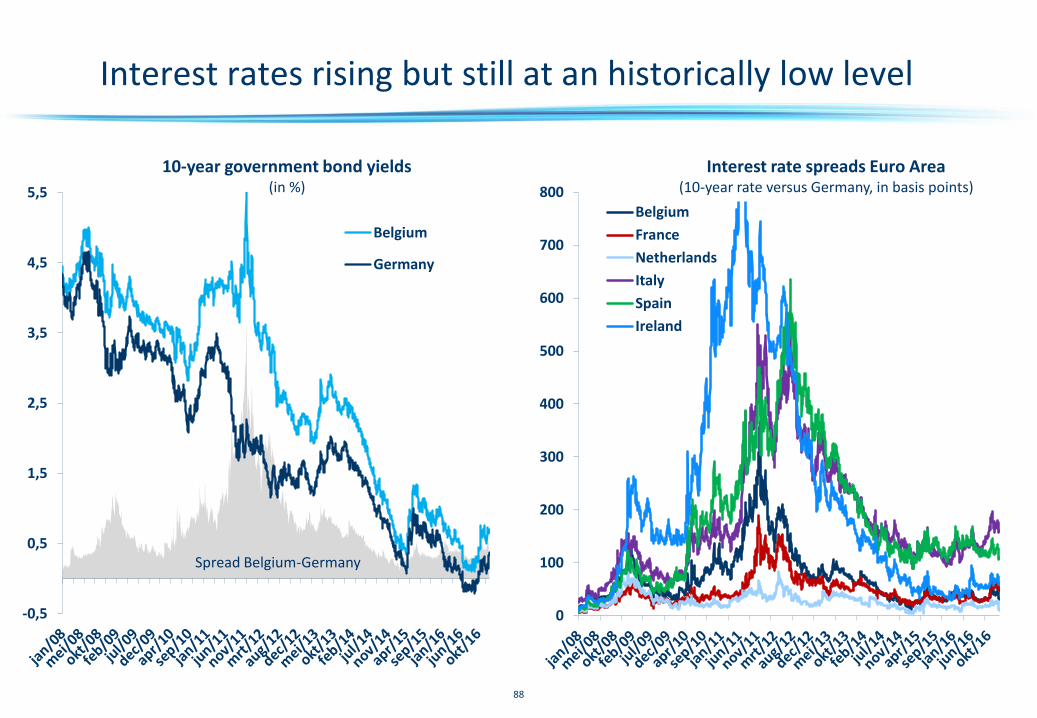
88
-0,5
0,5
1,5
2,5
3,5
4,5
5,5
Belgium
Germany
0
100
200
300
400
500
600
700
800Belgium
France
Netherlands
Italy
Spain
Ireland
Interest rates rising but still at an historically low level
10-year government bond yields(in %)
Spread Belgium-Germany
Interest rate spreads Euro Area(10-year rate versus Germany, in basis points)
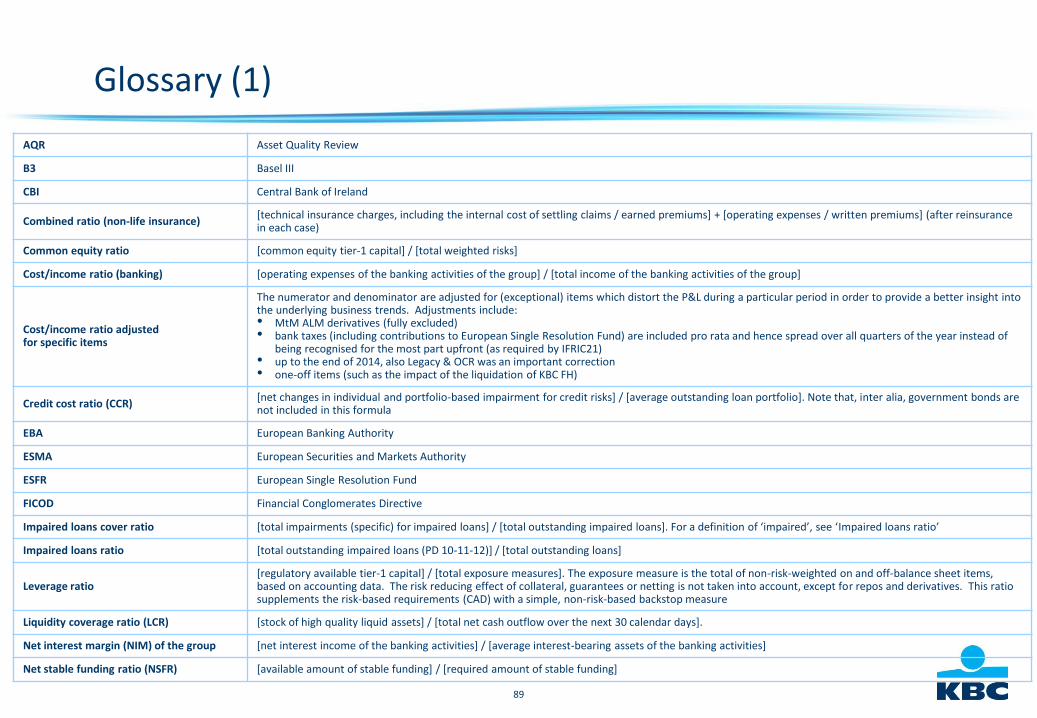
89
Glossary (1)
AQR Asset Quality Review
B3 Basel III
CBI Central Bank of Ireland
Combined ratio (non-life insurance)[technical insurance charges, including the internal cost of settling claims / earned premiums] + [operating expenses / written premiums] (after reinsurance in each case)
Common equity ratio [common equity tier-1 capital] / [total weighted risks]
Cost/income ratio (banking) [operating expenses of the banking activities of the group] / [total income of the banking activities of the group]
Cost/income ratio adjusted for specific items
The numerator and denominator are adjusted for (exceptional) items which distort the P&L during a particular period in order to provide a better insight into the underlying business trends. Adjustments include: • MtM ALM derivatives (fully excluded)• bank taxes (including contributions to European Single Resolution Fund) are included pro rata and hence spread over all quarters of the year instead of
being recognised for the most part upfront (as required by IFRIC21)• up to the end of 2014, also Legacy & OCR was an important correction• one-off items (such as the impact of the liquidation of KBC FH)
Credit cost ratio (CCR)[net changes in individual and portfolio-based impairment for credit risks] / [average outstanding loan portfolio]. Note that, inter alia, government bonds are not included in this formula
EBA European Banking Authority
ESMA European Securities and Markets Authority
ESFR European Single Resolution Fund
FICOD Financial Conglomerates Directive
Impaired loans cover ratio [total impairments (specific) for impaired loans] / [total outstanding impaired loans]. For a definition of ‘impaired’, see ‘Impaired loans ratio’
Impaired loans ratio [total outstanding impaired loans (PD 10-11-12)] / [total outstanding loans]
Leverage ratio[regulatory available tier-1 capital] / [total exposure measures]. The exposure measure is the total of non-risk-weighted on and off-balance sheet items, based on accounting data. The risk reducing effect of collateral, guarantees or netting is not taken into account, except for repos and derivatives. This ratio supplements the risk-based requirements (CAD) with a simple, non-risk-based backstop measure
Liquidity coverage ratio (LCR) [stock of high quality liquid assets] / [total net cash outflow over the next 30 calendar days].
Net interest margin (NIM) of the group [net interest income of the banking activities] / [average interest-bearing assets of the banking activities]
Net stable funding ratio (NSFR) [available amount of stable funding] / [required amount of stable funding]
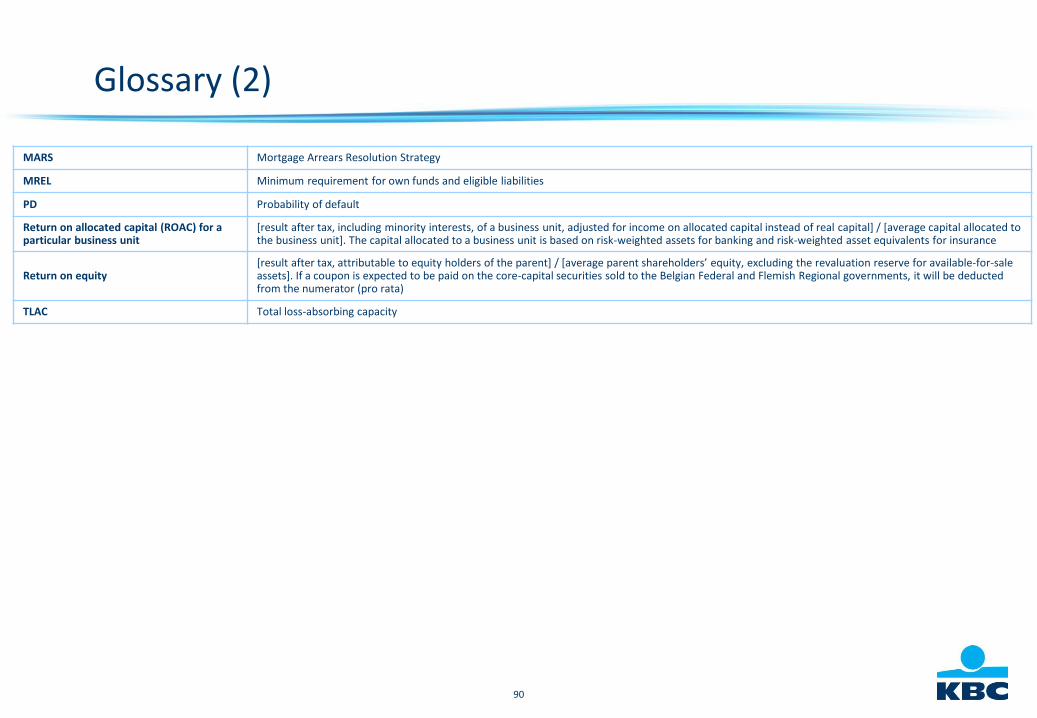
90
Glossary (2)
MARS Mortgage Arrears Resolution Strategy
MREL Minimum requirement for own funds and eligible liabilities
PD Probability of default
Return on allocated capital (ROAC) for a particular business unit
[result after tax, including minority interests, of a business unit, adjusted for income on allocated capital instead of real capital] / [average capital allocated to the business unit]. The capital allocated to a business unit is based on risk-weighted assets for banking and risk-weighted asset equivalents for insurance
Return on equity[result after tax, attributable to equity holders of the parent] / [average parent shareholders’ equity, excluding the revaluation reserve for available-for-sale assets]. If a coupon is expected to be paid on the core-capital securities sold to the Belgian Federal and Flemish Regional governments, it will be deducted from the numerator (pro rata)
TLAC Total loss-absorbing capacity
91
Contact informationInvestor Relations OfficeE-mail: [email protected]
www.kbc.comvisit for the latest update