Embed Size (px)
Citation preview
perkasa11
KEEN INTEREST IN TANJUNG MANIS
HALAL HUBAsean member
countries showed keen interest to
establish business networking and to come to Tanjung
Manis to acquire first hand information
on Tanjung Manis Halal Hub
S TIDC is a state government
agency tasked to oversee the
overall development of Tanjung
Manis Halal Hub. Parallel with this, the
Corporation is concerting its efforts in
ensuring the success of this project. On
20th - 24th October 2010, it participated
in the 7th China-Asean Expo (CAEXPO
2010) in Nanning, Guangzi Zhuang, China
together with Pertanza Sendirian Berhad.
Pertanza Sendirian Berhad is among the
local investing companies operating in this
Halal Hub.
Dubbed as the largest international
trade fair held in China, CAEXPO was an
initiative of the People’s Government of
Guangxi Shuang Autonomous Province.
It was credited as an effective platform to
promote China-Asean cooperation in the
areas of trade, investment and tourism in
the light of the China-Asean Free Trade
Agreement which came into effect on
1st January 2010.
The five-day expo served as a platform
to further promote Sarawak and Tanjung
Manis Halal Hub on global stage particularly
China and other Asean countries taking
advantage of the immensed investment
opportunities in Sarawak Corridor of
Renewable Energy (SCORE). Tanjung Manis
is among the five new growth nodes to
be further developed under SCORE with
emphasis on halal hub development.
Through this expo, feedback were also
received on food quality, processing,
import and export procedures and labeling
particularly those related with China and
Asean member countries.
STIDC had made full use of this platform
to provide information on investment
opportunities in Tanjung Manis Halal Hub
perkasa 12
Tanjung Manis. The paper featured the
background, facilities and infrastructures,
participating agencies and organisations,
economic and business opportunities,
issues and challenges as well as the
prospect of Tanjung Manis Halal Hub.
The 77,000 hectares halal hub is poised
to lure at least RM9 billion worth of
investments and create not less than
10,000 employment opportunities besides
other spin-off benefits such as service
related businesses. Hence, the development
of this hub will surely bring significant
positive impacts and improve the socio-
economic well-being of the people in this
area and Sarawak as a whole. This is in
tandem with the increasing demand for
halal products from both Muslim and non-
Muslim markets globally.
The availability of communication and
transport network in this township as well
as the development of Tanjung Manis
Halal Park is in line with the government’s
objective to make Tanjung Manis the
country’s halal hub of choice. Besides
promoting the use of green technology and
renewable energy, this Halal Park emphasizes
on bio-technology and continuous Research
and Development particularly in aquaculture.
This will pave the way for more local and
foreign direct investments.
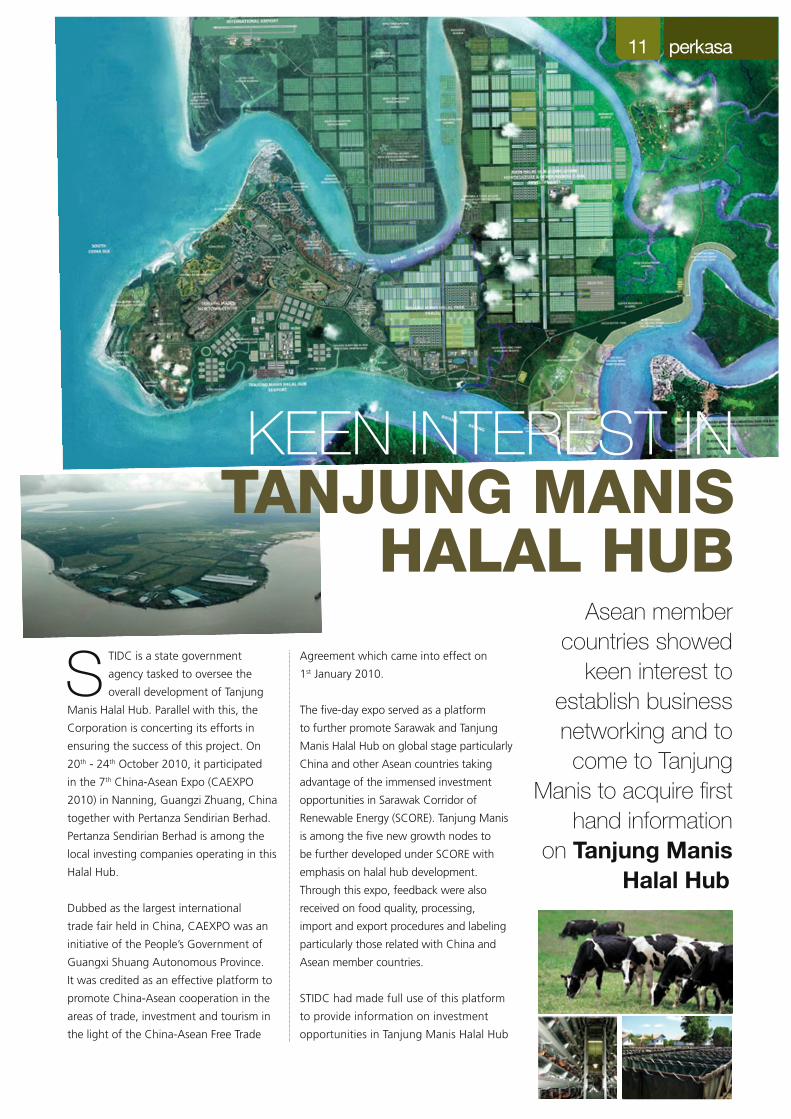
This halal hub will support among
others, the aquaculture, poultry and
egg production, livestock and meat
production, fruit gardens, animal feed
mills, eel farming industry as well as
chlorella plant and tilapia hatchery.
Undoubtedly, this will help to boost the
development of the neighboring areas.
SUMMARY
received from the member
countries to establish business
networking and to come to
Tanjung Manis in the near future to
acquire first hand information on
Tanjung Manis Halal Hub.
poised to lure at least RM9 billion
worth of investments and create
not less than 10,000 employment
opportunities besides other spin-
off benefits such as service related
businesses.
and transport network in
this township as well as the
development of Tanjung Manis
Halal Park is in line with the
government’s objective to make
Tanjung Manis the country’s halal
hub of choice.
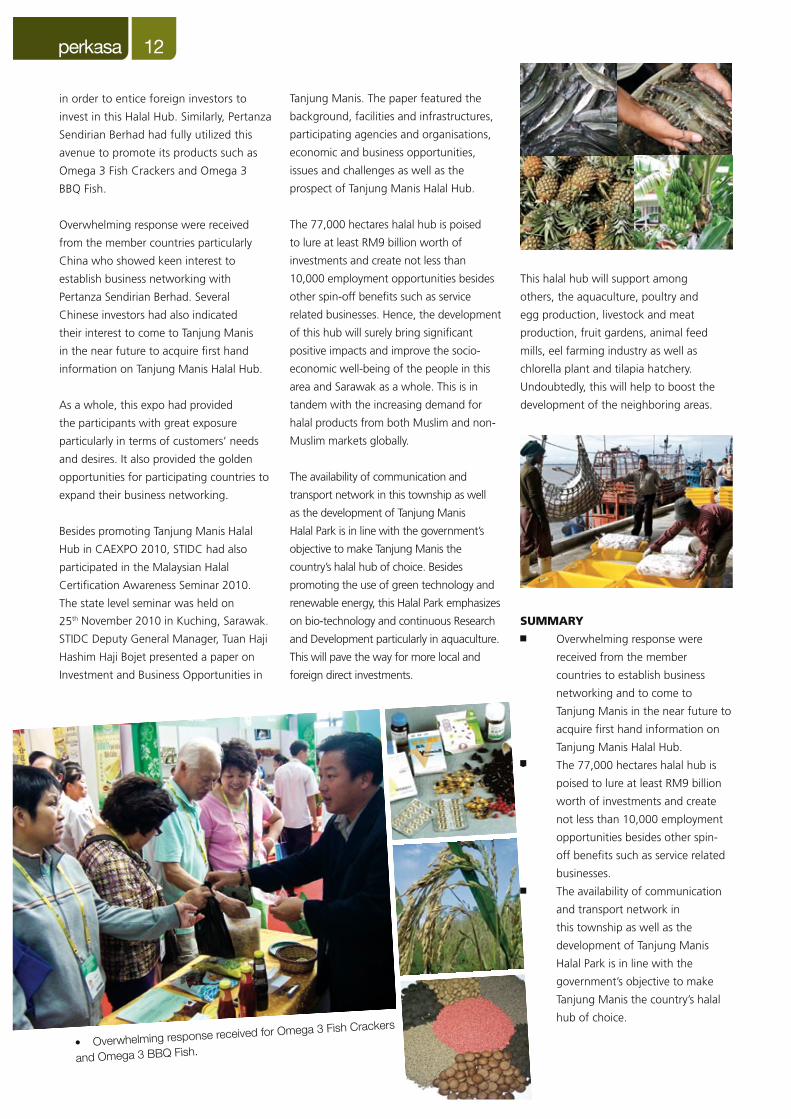
in order to entice foreign investors to
invest in this Halal Hub. Similarly, Pertanza
Sendirian Berhad had fully utilized this
avenue to promote its products such as
Omega 3 Fish Crackers and Omega 3
BBQ Fish.
Overwhelming response were received
from the member countries particularly
China who showed keen interest to
establish business networking with
Pertanza Sendirian Berhad. Several
Chinese investors had also indicated
their interest to come to Tanjung Manis
in the near future to acquire first hand
information on Tanjung Manis Halal Hub.
As a whole, this expo had provided
the participants with great exposure
particularly in terms of customers’ needs
and desires. It also provided the golden
opportunities for participating countries to
expand their business networking.
Besides promoting Tanjung Manis Halal
Hub in CAEXPO 2010, STIDC had also
participated in the Malaysian Halal
Certification Awareness Seminar 2010.
The state level seminar was held on
25th November 2010 in Kuching, Sarawak.
STIDC Deputy General Manager, Tuan Haji
Hashim Haji Bojet presented a paper on
Investment and Business Opportunities in
perkasa13
CARBON FOOTPRINT
Industry players
must always comply with the dynamic
product requirements
imposed by consuming
countries
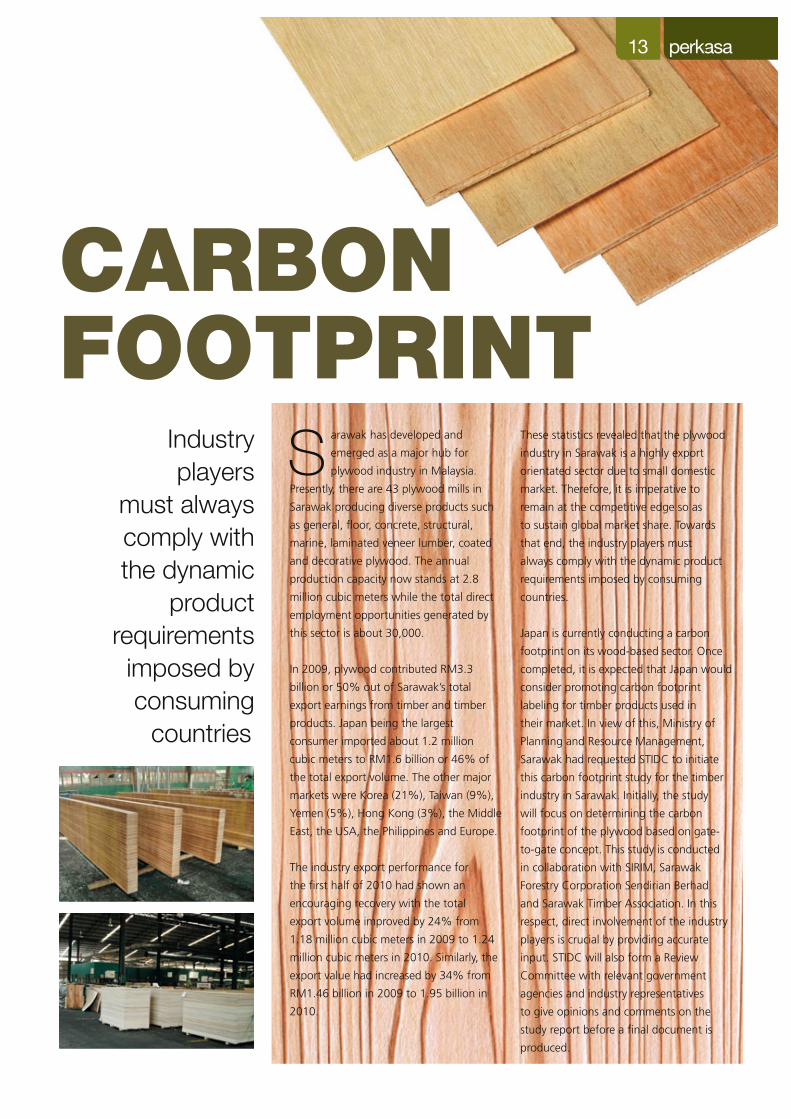
S arawak has developed and
emerged as a major hub for
plywood industry in Malaysia.
Presently, there are 43 plywood mills in
Sarawak producing diverse products such
as general, floor, concrete, structural,
marine, laminated veneer lumber, coated
and decorative plywood. The annual
production capacity now stands at 2.8
million cubic meters while the total direct
employment opportunities generated by
this sector is about 30,000.
In 2009, plywood contributed RM3.3
billion or 50% out of Sarawak’s total
export earnings from timber and timber
products. Japan being the largest
consumer imported about 1.2 million
cubic meters to RM1.6 billion or 46% of
the total export volume. The other major
markets were Korea (21%), Taiwan (9%),
Yemen (5%), Hong Kong (3%), the Middle
East, the USA, the Philippines and Europe.
The industry export performance for
the first half of 2010 had shown an
encouraging recovery with the total
export volume improved by 24% from
1.18 million cubic meters in 2009 to 1.24
million cubic meters in 2010. Similarly, the
export value had increased by 34% from
RM1.46 billion in 2009 to 1.95 billion in
2010.
These statistics revealed that the plywood
industry in Sarawak is a highly export
orientated sector due to small domestic
market. Therefore, it is imperative to
remain at the competitive edge so as
to sustain global market share. Towards
that end, the industry players must
always comply with the dynamic product
requirements imposed by consuming
countries.
Japan is currently conducting a carbon
footprint on its wood-based sector. Once
completed, it is expected that Japan would
consider promoting carbon footprint
labeling for timber products used in
their market. In view of this, Ministry of
Planning and Resource Management,
Sarawak had requested STIDC to initiate
this carbon footprint study for the timber
industry in Sarawak. Initially, the study
will focus on determining the carbon
footprint of the plywood based on gate-
to-gate concept. This study is conducted
in collaboration with SIRIM, Sarawak
Forestry Corporation Sendirian Berhad
and Sarawak Timber Association. In this
respect, direct involvement of the industry
players is crucial by providing accurate
input. STIDC will also form a Review
Committee with relevant government
agencies and industry representatives
to give opinions and comments on the
study report before a final document is
produced.

perkasa 14
CONGRATULATIONS
FAREWELL
Heartiest Congratulation to:
Haji Wan Ahmad Lutfi Wan Zainal AbidinMr. Jeman Udin
Mr. Jaddil @ Zaidel Ibrahim
For being awarded the Pingat Perkhidmatan Bakti (Perak) (PPB)
Mdm. Fatimawati binti Abang Abdul LatifMdm. Salbiah Bolhassan
Mr. Abdul Japar bin MohammedMr. Alin bin Aleng
For being awarded the Pingat Perkhidmatan Terpuji (Gangsa) (PPT)
in conjuction with the 89th birthday of Head
of State, His Excellency Tun Datuk Patinggi Abang Haji Muhammad Salahuddin on
16th October 2010.
Farewell and good luck to Mr. Kuwa @ Matilee bin Rebi and Hajah Dayang Maimunah binti Muzi who were on
mandatory retirement after serving STIDC for
28 years and 37 years respectively.
Wishing you every success in your future
endeavors.
The plywood industry stands to
gain from this study in terms of:
1. Quantify average carbon
equivalent to produce plywood in Sarawak;
2. Industry benchmarking on carbon footprint;
3. Capacity building for the industry on carbon
footprint;
4. Promoting “green image” of the industry; and
5. Continuous improvement in plywood production
technology.
It is therefore vital for the industry to give its fullest
cooperation in ensuring the success of this study for
mutual benefit.
Carbon footprint refers to:
emissions and GHG removals of a process, a
system of processes or a product system, that
include carbon dioxide, methane, nitrous oxide
and CFCs, summed up as CO2 equivalent.
the life cycle of a product, material or service
i.e. from cradle to grave including use phase in
association with human activities.
Why Carbon Footprint (CFC)?
encouraging companies to advertise to
consumers their efforts to combat global
warming, and educate consumers at the same
time on CO2 emission
2 emission
throughout the supply chain
2 will support
mechanisms or schemes that encourage
reduction or compensation for CO2 emission
such as CDM and Offsets.
SUMMARY
hub for plywood industry in Malaysia.
or 50% out of Sarawak’s total export earnings
from timber and timber products.
dynamic product requirements imposed by
consuming countries.
perkasa15
market performance
The demand from major market were
picking up steadily such as plywood, logs
and sawntimber by RM 3 billion, RM 1.5
billion and RM 0.6 billion respectively.
These contributed to 53%, 27% and 11%
to the total exported value of logs and
timber products from the State for the first
three quarter of 2010.
Logs
Volume of logs exported in January to
September 2010 increased by 16% to 3
million m3 from 2.6 million m3 and the
value also increased by 17% to RM 1.5
billion from RM 1.3 billion compared to
the corresponding period 2009.
India maintained its position as the major
purchaser of the State’s logs at 1.7 million
m3 valued at RM 865 million followed
by China (479,802 m3 valued at RM 206
million), Taiwan (371,418 m3 valued at
RM 174 million) and Japan (296,416 m3
valued at RM 140 million).
Export of logs to India for the first three
quarters 2010 up by 4% to 1.7 million m3
from 1.6 million m3 in comparison to the
corresponding period of 2009 followed
by China (72%), Taiwan (30%) and Japan
(75%).
The major buyer of logs like India, China,
Japan and Taiwan constituted 93% of the
total export volume and contributed 90%
to the total export value of logs for the
first nine months 2010. ( Table 2 )
Sawntimber
Volume of sawn timber exported in
January to September 2010 increased
by 15% to 650,760m3 from 566,485
m3 and the value also increased by 15%
to RM 596 million from RM 519 million
compared to that of similar period in
2009.
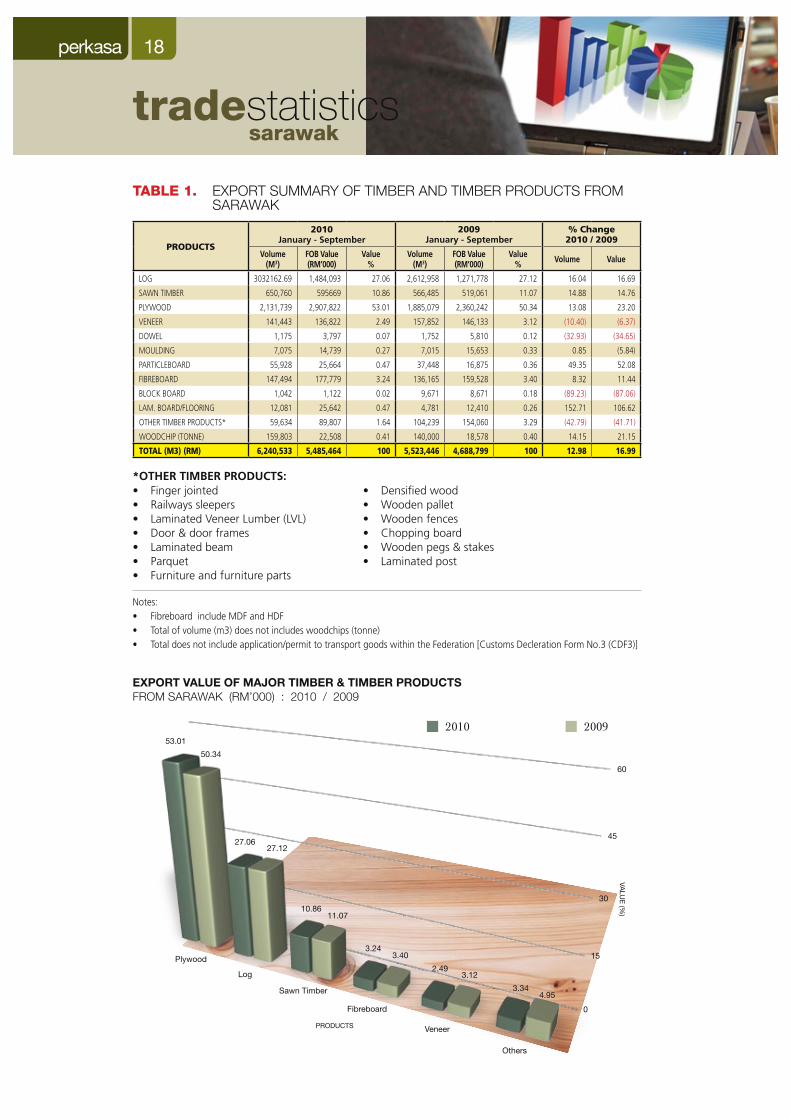
Export Value of Logs and Timber Products
C umulative exports value for
January to September of the
year reported to be increased
by 17% at RM 5.5 billion against that
of RM 4.7 billion for the corresponding
period in 2009. There were increased in
values of logs (17%), sawntimber (15%),
plywood (23%), particleboard (52%),
fibreboard (11%), laminated board
(107%) and woodchips (21%). In spite of
the overall increase in export value, there
were a decreased in values of veneer
(6%), dowel (35%), moulding (6%),
blockboard (87%) and other timber
products (42%).
January to September 2010
perkasa 16
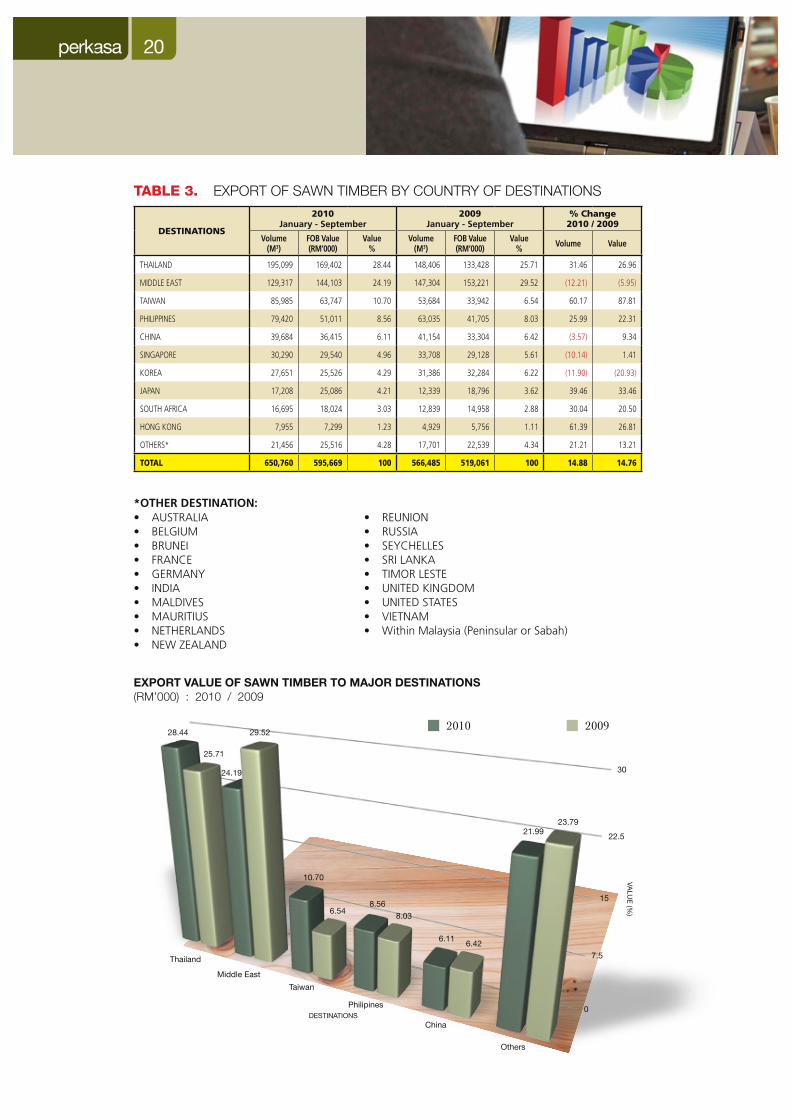
Thailand remained the major importer
of the State’s sawntimber, by purchasing
195,099 m3 of the overall volume
exported valued at RM 169 million
followed by Middle East (129,317 m3
valued at RM 144 million) , Taiwan
(85,985 m3 valued at RM 64 million) and
Philippines (79,420 m3 valued at RM 51
million).
Export of sawn timber to Thailand in
2010 increased by 31% to 195,099 m3
from 148,406 m3 in comparison to the
corresponding period of 2009, followed
by Taiwan (60%) and Philippines (26%).
However export volume of sawntimber to
Middle East decreased by 12%.
The major buyers of sawn timber like
Thailand, Middle East, Taiwan and
Philippines constituted 72% of the total
export volume and contributed 70% to
the total export value of logs for the first
two months 2010. ( Table 3 )
Plywood
Plywood exported for the first three
quarters of 2010 at 2.1 million m3 was
13% higher than that of 1.9 million m3
exported for the corresponding period in
2009. Its export value was increased by
23% to RM 3 billion from RM 2.4 billion
compared to the same period in 2009.
Japan remains the major importer of the
State’s plywood with the purchase of 1
million m3 or 51% of the volume exported
valued at RM 1.5 billion followed by Korea
(384,495 m3 valued at RM 428 million),
Middle East (238,016 m3 valued at RM
307 million) and Taiwan (222,566 m3
valued at RM 279 million).
Export of plywood to Japan in 2010
increased by 16% to 1 million m3 from
0.9 million m3 in comparison to the
corresponding period of 2009. Volume of
plywood exported to Taiwan also increased
by 37% to 222,566 m3 from 162,926 m3.
However export of plywood to Korea and
Middle East decreased by 4% and 0.18%
respectively.
Export of plywood to Japan, Korea, Middle
East and Taiwan constituted 86% of the
overall exported volumes and contributed
87% to the overall revenues from the
product for the first three quarters of
2010. ( Table 4 )
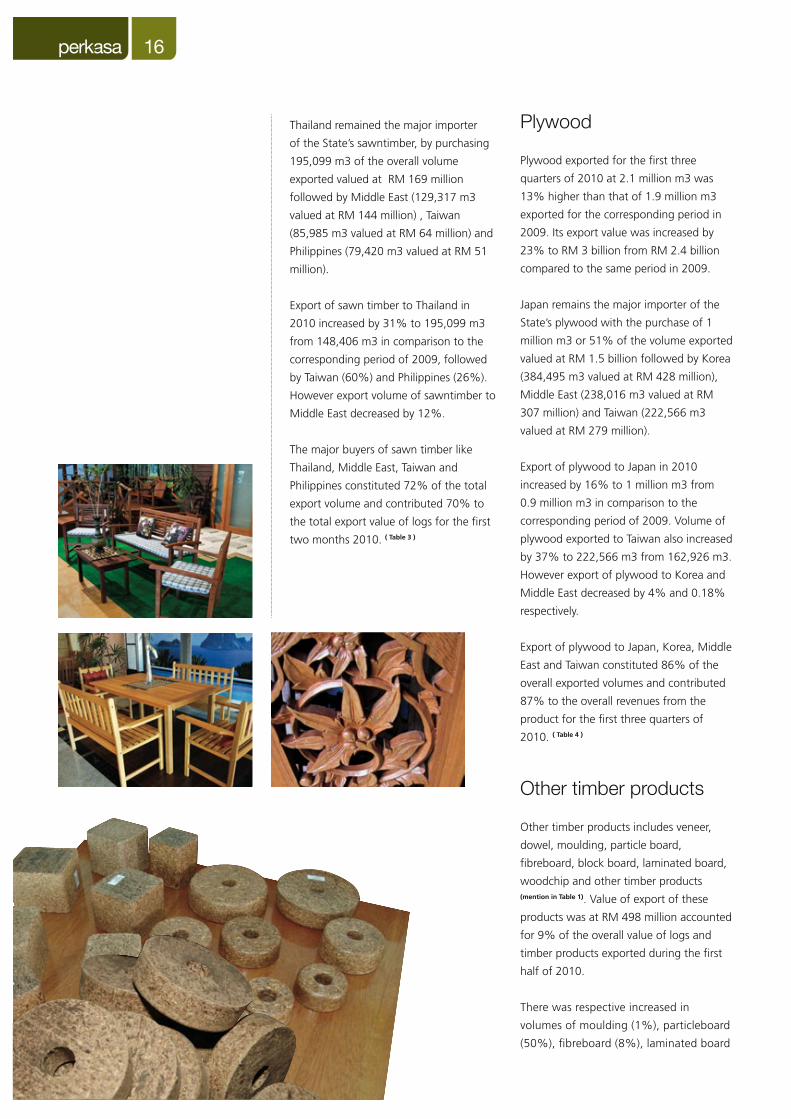
Other timber products includes veneer,
dowel, moulding, particle board,
fibreboard, block board, laminated board,
woodchip and other timber products (mention in Table 1). Value of export of these
products was at RM 498 million accounted
for 9% of the overall value of logs and
timber products exported during the first
half of 2010.
There was respective increased in
volumes of moulding (1%), particleboard
(50%), fibreboard (8%), laminated board
perkasa17
(153%) and woodchips (14%). However,
there was a marked decrease for veneer
(10%), dowel (33%) and blockboard
(89%) for the first three quarters of 2010
compared to the corresponding period in
2009. ( Table 5 & 6 )
By the end of September 2010, the
average unit prices of timber products
such as logs, plywood, veneer,
particleboard, fibreboard and woodchips
remain stable whereas blockboard was
quite encouraging. They were respectively
higher in the unit price of block board
(20%) followed by plywood (9%),
woodchips ( 6%) , veneer (4%), fibreboard
(3%) particleboard (2%) and logs (1%)
for January to September 2010 compared
to the previous year. However unit price
of sawntimber was lower by 0.1% then
followed by dowel (3%), moulding (8%)
and laminated board (18%) for the first
three quarter of 2010 compared to that
similar period in 2009.
Sarawak’s log suppliers are unwilling to
commit to orders from importer due to
the “tight” supply situation which has also
resulted in higher log price. The average
prices for tropical logs have gone up by
more than 10% from a year ago.
The shortfall in log supply was attributed
largely to the abnormal wet weather
which had adversely affected logging
activities between May and July. (Source :
The Star)
The other reason for the log shortage
could be the impoundment of the Bakun
hydroelectric dam that might have
lowered the level of the Rejang River and
its tributaries which have been used to
transport logs from the major logging
areas in Sarawak. As a result, the transport
of logs for processing mills and exports has
been disrupted. (Source: ITTO)
In addition, according to a report, which
Japan Plywood Manufactures Association
compiled based on the Finance Ministry’s
“Trade Statistics”, Japan’s plywood
import in September 2010 increased
for the sixth consecutive month with
267,889 m3 (up 9.1%) from the same
month in year earlier). However, the
supply trend at Malaysia, the biggest
supplier, lost its momentum because the
production showed down due to the
shortage of logs. (Source: Japan Lumber
Journal)
In spite of the current situation, the state
registered an increase of 15.6 per cent
for the export of timber products, which
translates into RM5.60 billion for the first
three quarters of 2010, as compared to
RM4.75 billion in the same period last
year. Ministry of Planning and Resource
Management, Datuk Amar Awang
Tengah Ali Hassan said that apart from
that, the State’s main wood product
exports such as log, plywood and sawn
timber, for the first three quarter of 2010
had increased 20% from RM4.15 billion
in 2009 to RM4.98 billion, compared to
the same period in 2009. The upward
surge is mainly due to the increase in
demand by traditional markets such as
Japan, China, Taiwan, India, United States
and Middle East countries.
In line with the positive demand,
the government had taken proactive
measures to tackle issues in relation
to procedures of exporting goods
and product standards, in an effort to
strengthen the international market level.
(Source: Borneo Post)
Export receipt from our timber industry is
expected to hit RM 7 billion this year if the
demand of timber products remain stable
until year end.
perkasa 18
PRODUCTS
2010January - September
2009January - September
% Change2010 / 2009
Volume(M3)
FOB Value(RM’000)
Value%
Volume(M3)
FOB Value(RM’000)
Value% Volume Value
LOG 3032162.69 1,484,093 27.06 2,612,958 1,271,778 27.12 16.04 16.69
SAWN TIMBER 650,760 595669 10.86 566,485 519,061 11.07 14.88 14.76
PLYWOOD 2,131,739 2,907,822 53.01 1,885,079 2,360,242 50.34 13.08 23.20
VENEER 141,443 136,822 2.49 157,852 146,133 3.12 (10.40) (6.37)
DOWEL 1,175 3,797 0.07 1,752 5,810 0.12 (32.93) (34.65)
MOULDING 7,075 14,739 0.27 7,015 15,653 0.33 0.85 (5.84)
PARTICLEBOARD 55,928 25,664 0.47 37,448 16,875 0.36 49.35 52.08
FIBREBOARD 147,494 177,779 3.24 136,165 159,528 3.40 8.32 11.44
BLOCK BOARD 1,042 1,122 0.02 9,671 8,671 0.18 (89.23) (87.06)
LAM. BOARD/FLOORING 12,081 25,642 0.47 4,781 12,410 0.26 152.71 106.62
OTHER TIMBER PRODUCTS* 59,634 89,807 1.64 104,239 154,060 3.29 (42.79) (41.71)
WOODCHIP (TONNE) 159,803 22,508 0.41 140,000 18,578 0.40 14.15 21.15
TOTAL (M3) (RM) 6,240,533 5,485,464 100 5,523,446 4,688,799 100 12.98 16.99
tradestatisticssarawak
TABLE 1. SARAWAK
EXPORT VALUE OF MAJOR TIMBER & TIMBER PRODUCTS
Finger jointed Railways sleepersLaminated Veneer Lumber (LVL)Door & door framesLaminated beamParquetFurniture and furniture parts
Densified woodWooden palletWooden fencesChopping boardWooden pegs & stakesLaminated post
*OTHER TIMBER PRODUCTS:
Notes: Fibreboard include MDF and HDF Total of volume (m3) does not includes woodchips (tonne) Total does not include application/permit to transport goods within the Federation [Customs Decleration Form No.3 (CDF3)]

DESTINATIONS
2010January - September
2009January - September
% Change2010 / 2009
Volume(M3)
FOB Value(RM’000)
Value%
Volume(M3)
FOB Value(RM’000)
Value% Volume Value
INDIA 1,650,225 865,402 58.31 1,588,201 795,832 62.58 3.91 8.74
CHINA 479,802 206,368 13.91 278,709 136,475 10.73 72.15 51.21
TAIWAN 371,418 174,307 11.75 286,487 133,182 10.47 29.65 30.88
JAPAN 296,416 139,938 9.43 169,862 84,953 6.68 74.50 64.72
VIETNAM 135,349 48,782 3.29 222,452 83,981 6.60 (39.16) (41.91)
KOREA 60,287 26,290 1.77 50,389 25,121 1.98 19.64 4.65
THAILAND 36,380 20,711 1.40 11,564 8,529 0.67 214.604 142.83
PAKISTAN 2,288 2,295 0.15 3,992 3,365 0.26 (42.70) (31.80)
PHILIPPINES - - - 1,302 340 0.03 (100.00) (100.00)
TOTAL 3,032,163 1,484,093 100.00 2,612,958 1,271,778 100.00 16.04 16.69
TABLE 2.
EXPORT VALUE OF LOG TO MAJOR DESTINATIONS
perkasa19
perkasa 20
DESTINATIONS
2010January - September
2009January - September
% Change2010 / 2009
Volume(M3)
FOB Value(RM’000)
Value%
Volume(M3)
FOB Value(RM’000)
Value% Volume Value
THAILAND 195,099 169,402 28.44 148,406 133,428 25.71 31.46 26.96
MIDDLE EAST 129,317 144,103 24.19 147,304 153,221 29.52 (12.21) (5.95)
TAIWAN 85,985 63,747 10.70 53,684 33,942 6.54 60.17 87.81
PHILIPPINES 79,420 51,011 8.56 63,035 41,705 8.03 25.99 22.31
CHINA 39,684 36,415 6.11 41,154 33,304 6.42 (3.57) 9.34
SINGAPORE 30,290 29,540 4.96 33,708 29,128 5.61 (10.14) 1.41
KOREA 27,651 25,526 4.29 31,386 32,284 6.22 (11.90) (20.93)
JAPAN 17,208 25,086 4.21 12,339 18,796 3.62 39.46 33.46
SOUTH AFRICA 16,695 18,024 3.03 12,839 14,958 2.88 30.04 20.50
HONG KONG 7,955 7,299 1.23 4,929 5,756 1.11 61.39 26.81
OTHERS* 21,456 25,516 4.28 17,701 22,539 4.34 21.21 13.21
TOTAL 650,760 595,669 100 566,485 519,061 100 14.88 14.76
TABLE 3.
EXPORT VALUE OF SAWN TIMBER TO MAJOR DESTINATIONS
AUSTRALIA BELGIUM BRUNEI FRANCE GERMANY INDIA MALDIVES MAURITIUS NETHERLANDS NEW ZEALAND
REUNION RUSSIASEYCHELLESSRI LANKATIMOR LESTEUNITED KINGDOMUNITED STATESVIETNAMWithin Malaysia (Peninsular or Sabah)
*OTHER DESTINATION: