Embed Size (px)
Citation preview

Keeping Track Of All The ThingsA use-case and content management story
Matt Parks | Manager, Kaiser PermanenteRuperto Razon | Sr. Threat Analyst, Kaiser Permanente
8/12/2017 | ver 5.2.2
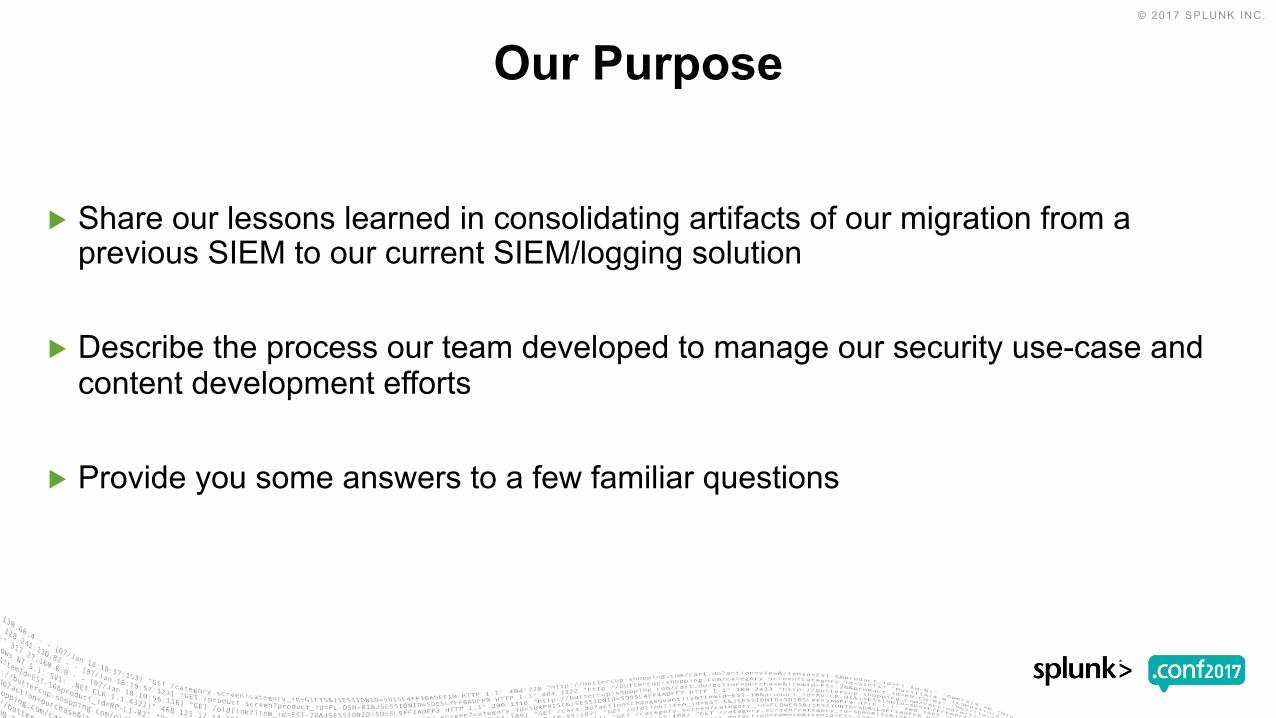
▶ Share our lessons learned in consolidating artifacts of our migration from a previous SIEM to our current SIEM/logging solution
▶ Describe the process our team developed to manage our security use-case and content development efforts
▶ Provide you some answers to a few familiar questions
Our Purpose
What Questions? These Questions
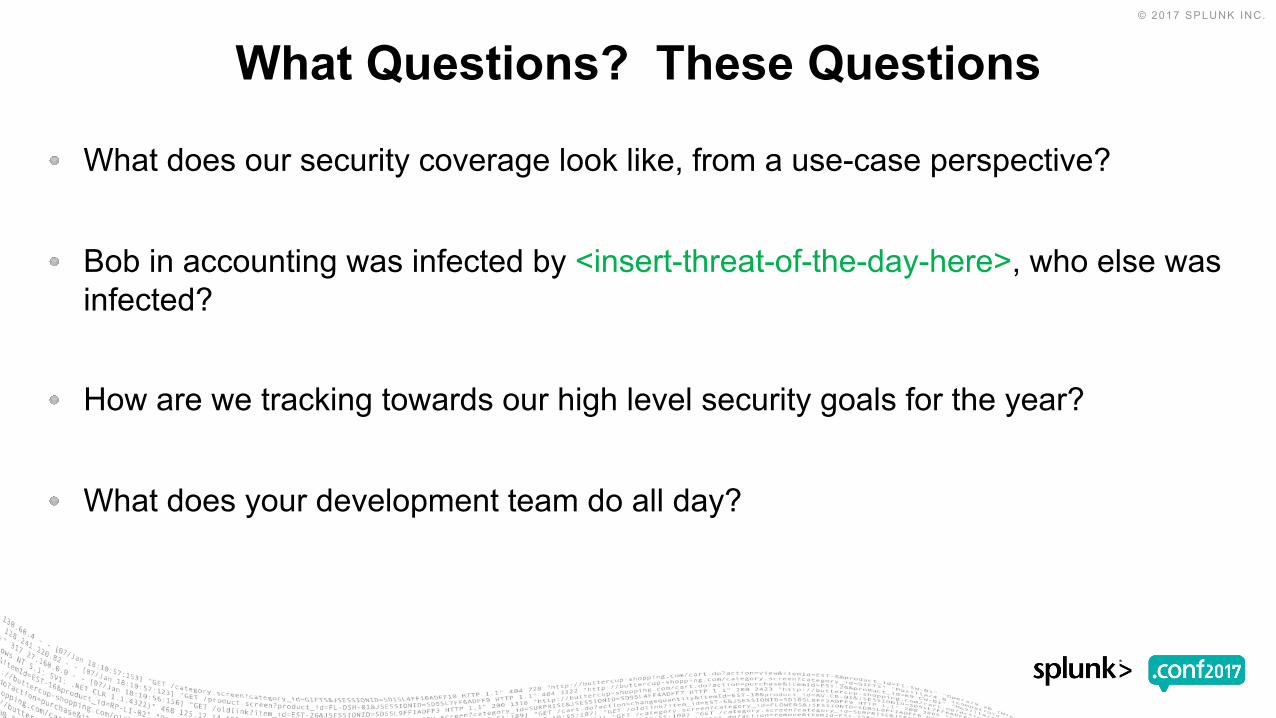
What does our security coverage look like, from a use-case perspective?
Bob in accounting was infected by <insert-threat-of-the-day-here>, who else was infected?
How are we tracking towards our high level security goals for the year?
What does your development team do all day?
Matt ParksManager, Security Analytics, Cyber Risk Defense Center
▶ linkedin.com/in/matthewparks
Who are you guys?
Ruperto RazonSr. Threat Analyst, Security Analytics, Cyber Risk Defense Center
▶ linkedin.com/in/PertoRazon
▶ @thatperto
Who are you guys?
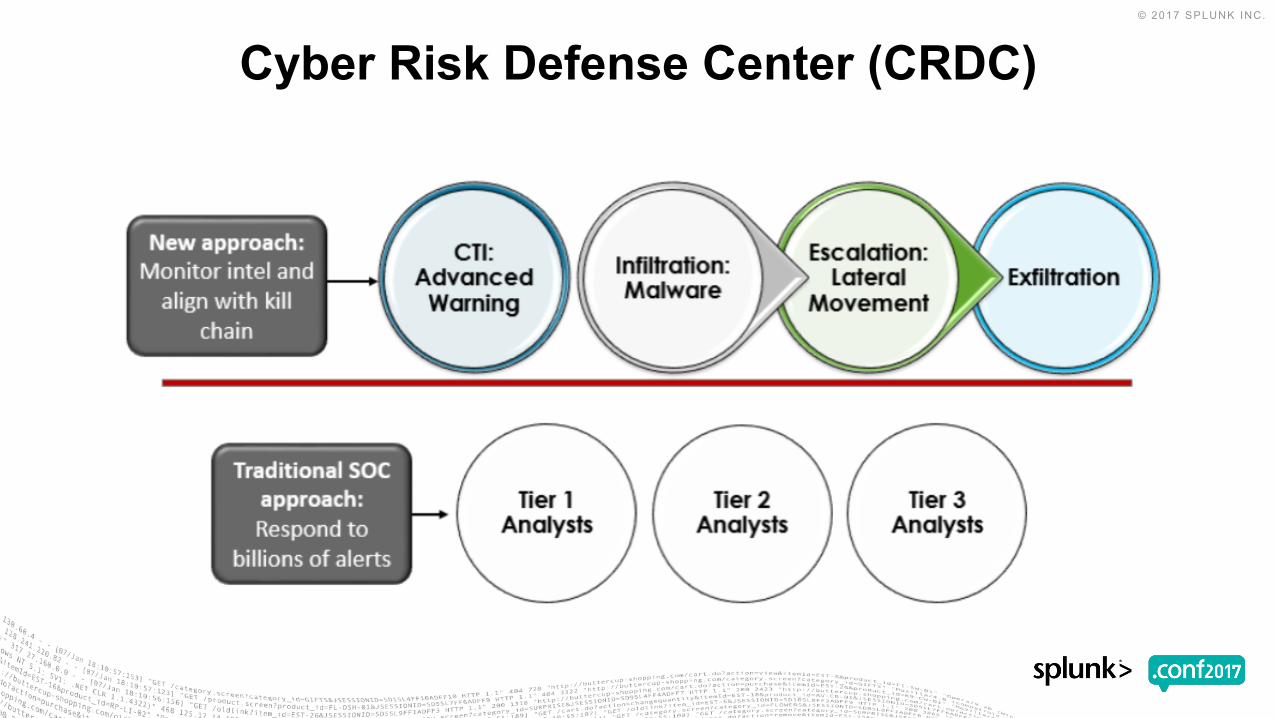
Cyber Risk Defense Center (CRDC)
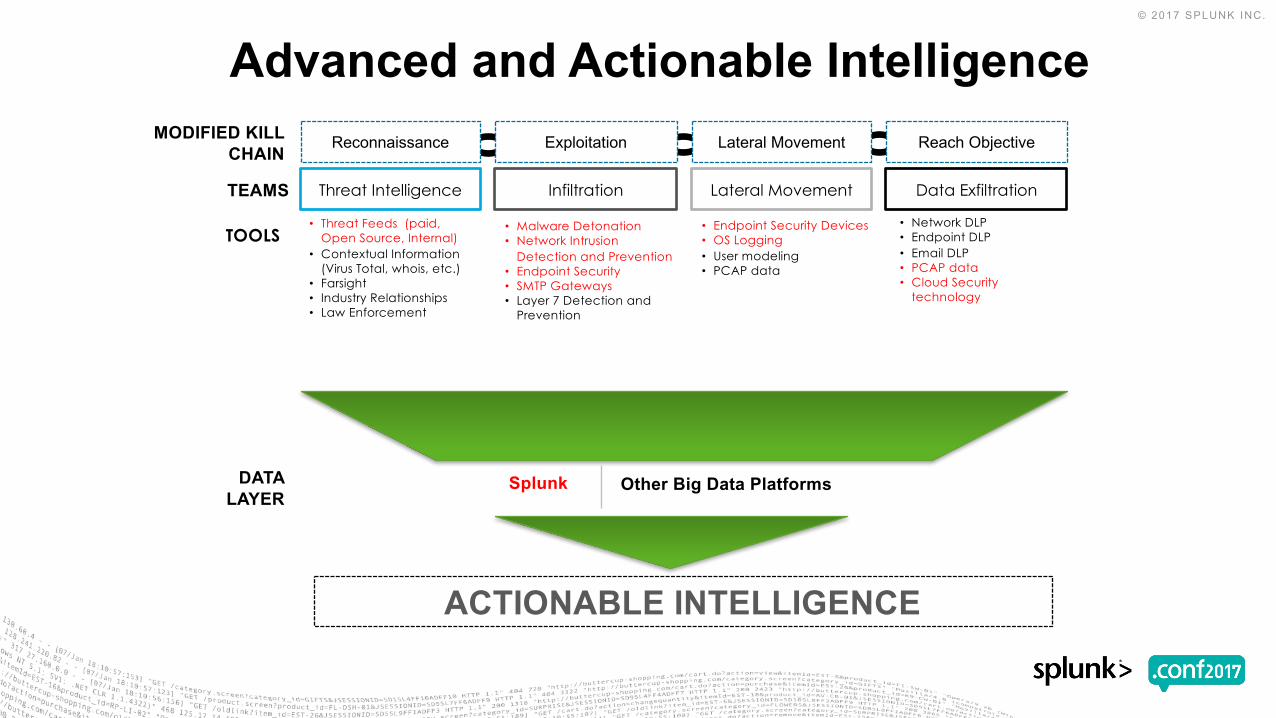
Advanced and Actionable Intelligence
Splunk Other Big Data PlatformsDATA LAYER
ACTIONABLE INTELLIGENCE
Reconnaissance Exploitation Reach ObjectiveLateral Movement
Threat Intelligence Infiltration Data ExfiltrationLateral MovementTEAMS
MODIFIED KILL CHAIN
TOOLS• Threat Feeds (paid,
Open Source, Internal)• Contextual Information
(Virus Total, whois, etc.)• Farsight• Industry Relationships• Law Enforcement
• Malware Detonation• Network Intrusion
Detection and Prevention• Endpoint Security• SMTP Gateways• Layer 7 Detection and
Prevention
• Endpoint Security Devices• OS Logging• User modeling• PCAP data
• Network DLP• Endpoint DLP• Email DLP• PCAP data• Cloud Security
technology
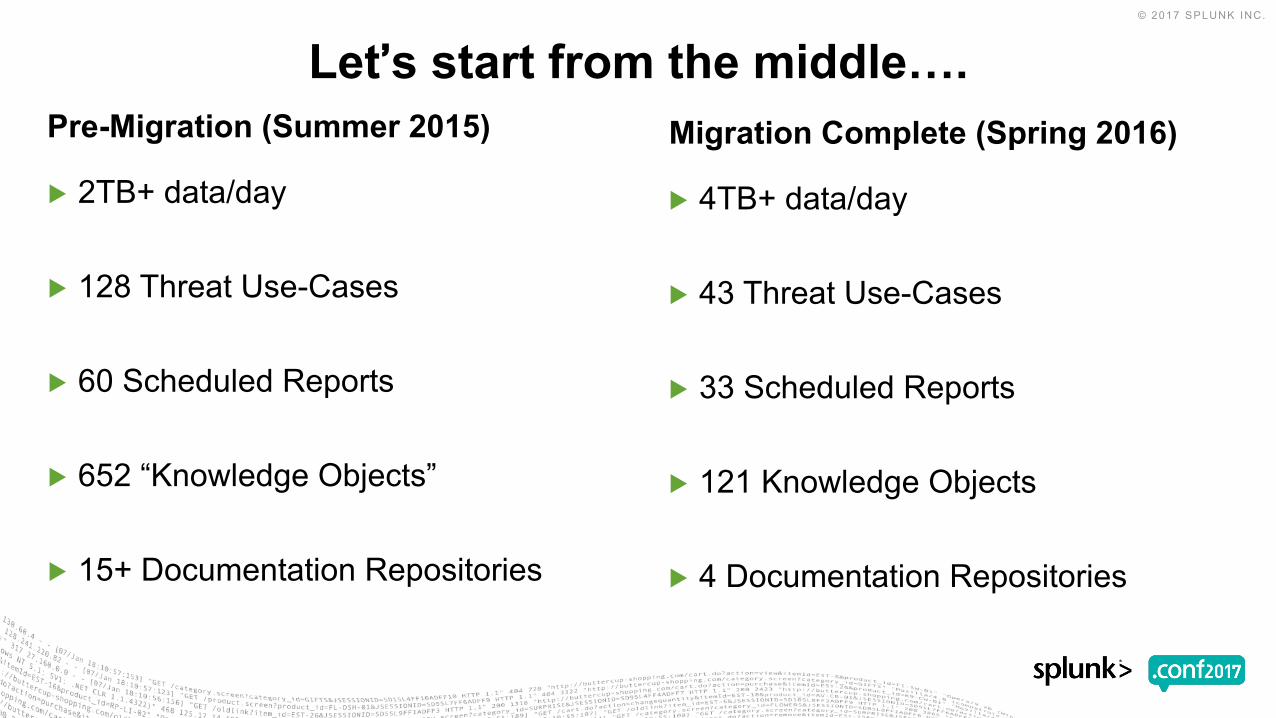
Pre-Migration (Summer 2015) Migration Complete (Spring 2016)
▶ 2TB+ data/day
▶ 128 Threat Use-Cases
▶ 60 Scheduled Reports
▶ 652 “Knowledge Objects”
▶ 15+ Documentation Repositories
▶ 4TB+ data/day
▶ 43 Threat Use-Cases
▶ 33 Scheduled Reports
▶ 121 Knowledge Objects
▶ 4 Documentation Repositories
Let’s start from the middle….
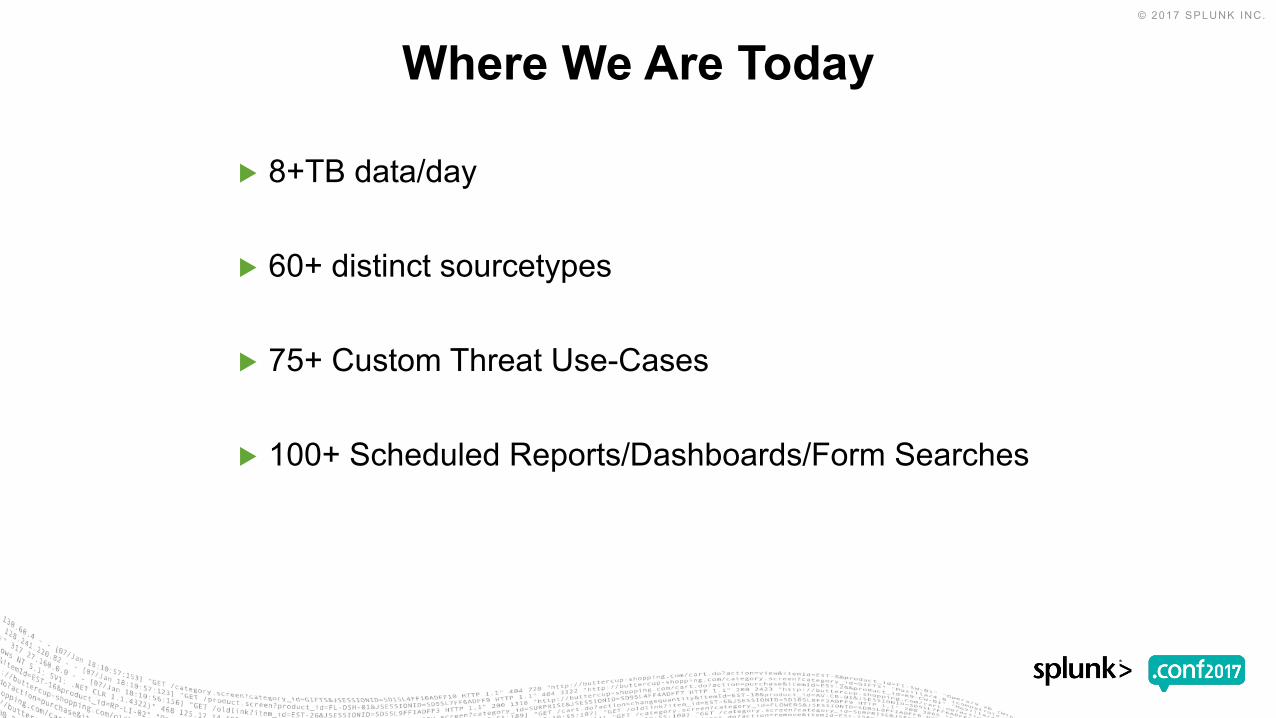
▶ 8+TB data/day
▶ 60+ distinct sourcetypes
▶ 75+ Custom Threat Use-Cases
▶ 100+ Scheduled Reports/Dashboards/Form Searches
Where We Are Today
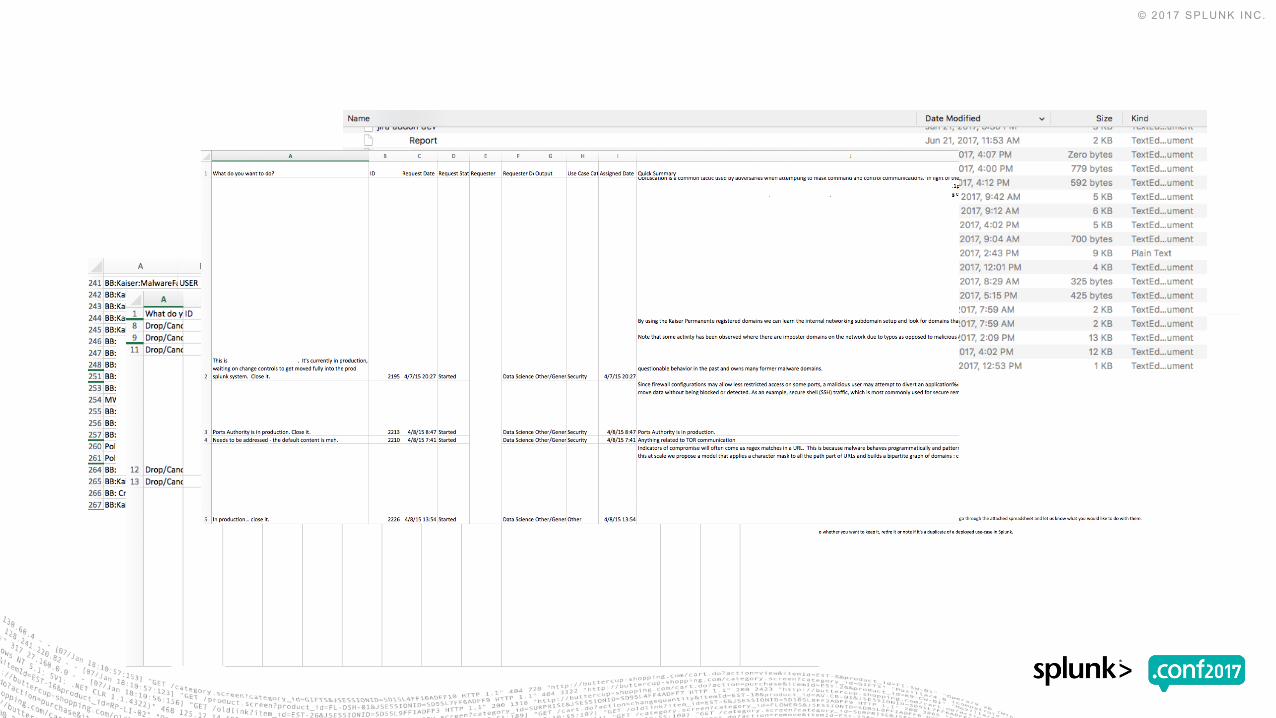
Documentation…
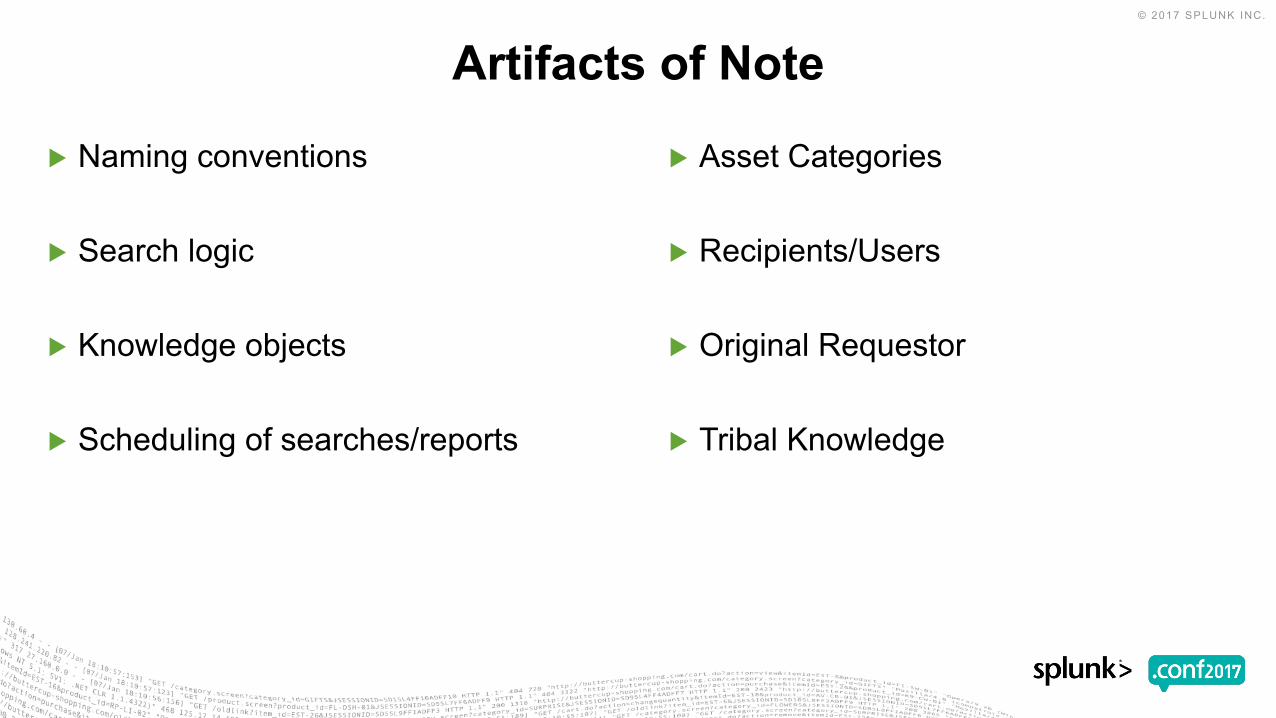
▶ Naming conventions
▶ Search logic
▶ Knowledge objects
▶ Scheduling of searches/reports
▶ Asset Categories
▶ Recipients/Users
▶ Original Requestor
▶ Tribal Knowledge
Artifacts of Note
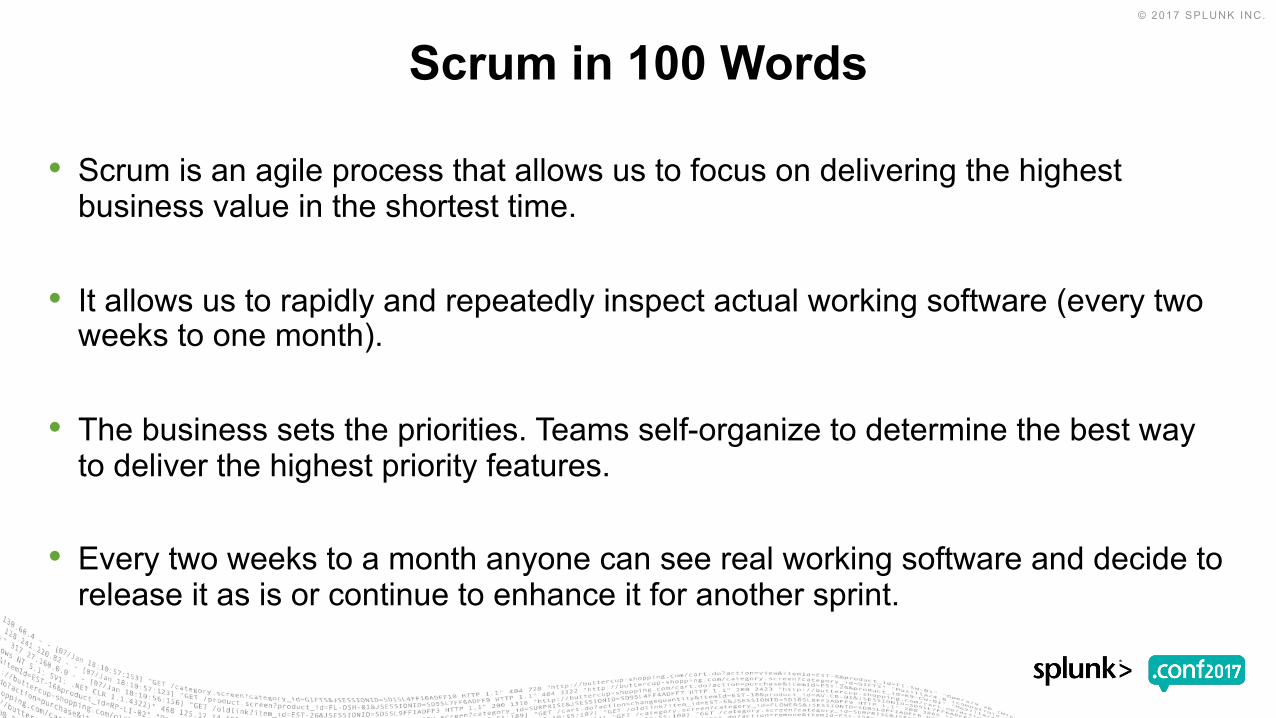
• Scrum is an agile process that allows us to focus on delivering the highest business value in the shortest time.
• It allows us to rapidly and repeatedly inspect actual working software (every two weeks to one month).
• The business sets the priorities. Teams self-organize to determine the best way to deliver the highest priority features.
• Every two weeks to a month anyone can see real working software and decide to release it as is or continue to enhance it for another sprint.
Scrum in 100 Words
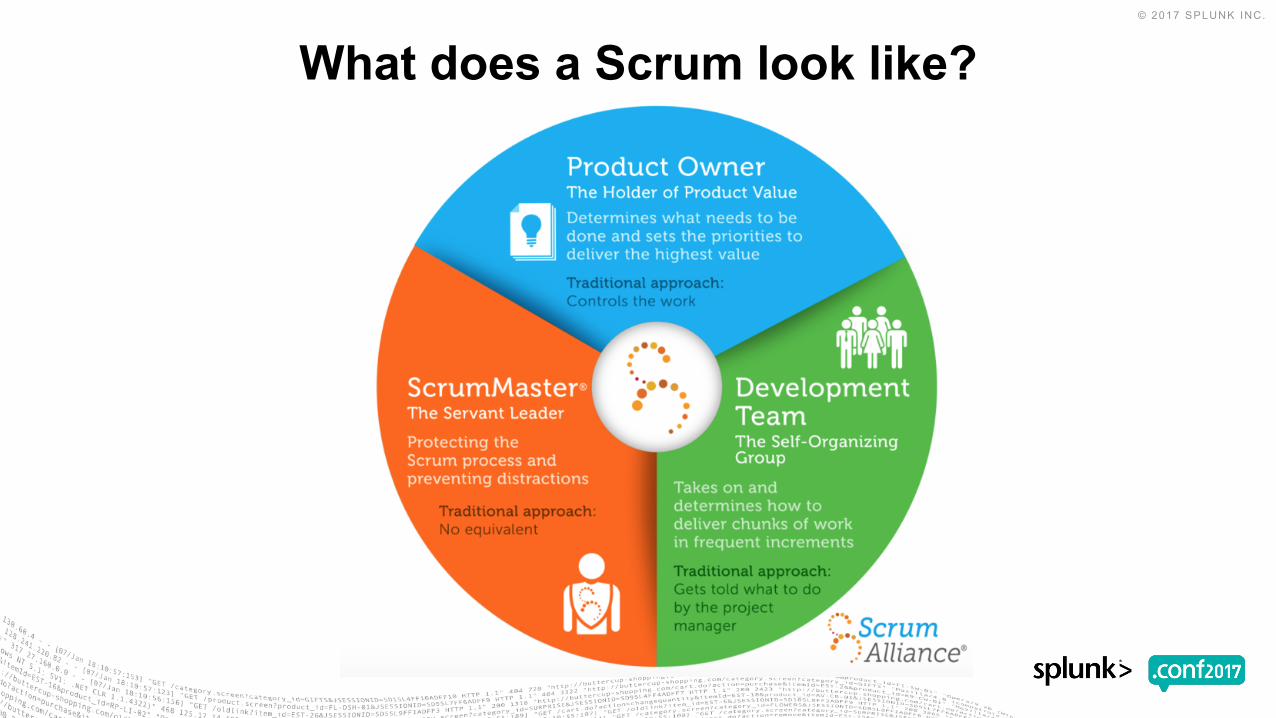
What does a Scrum look like?
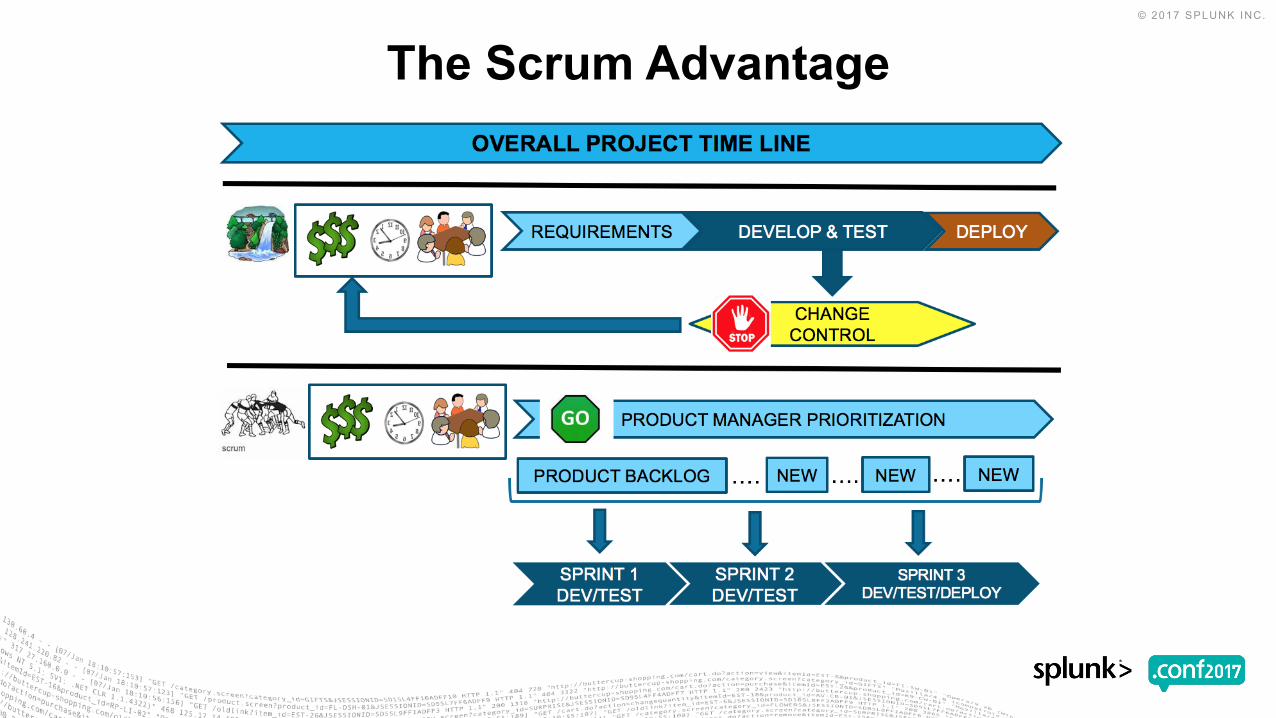
The Scrum Advantage
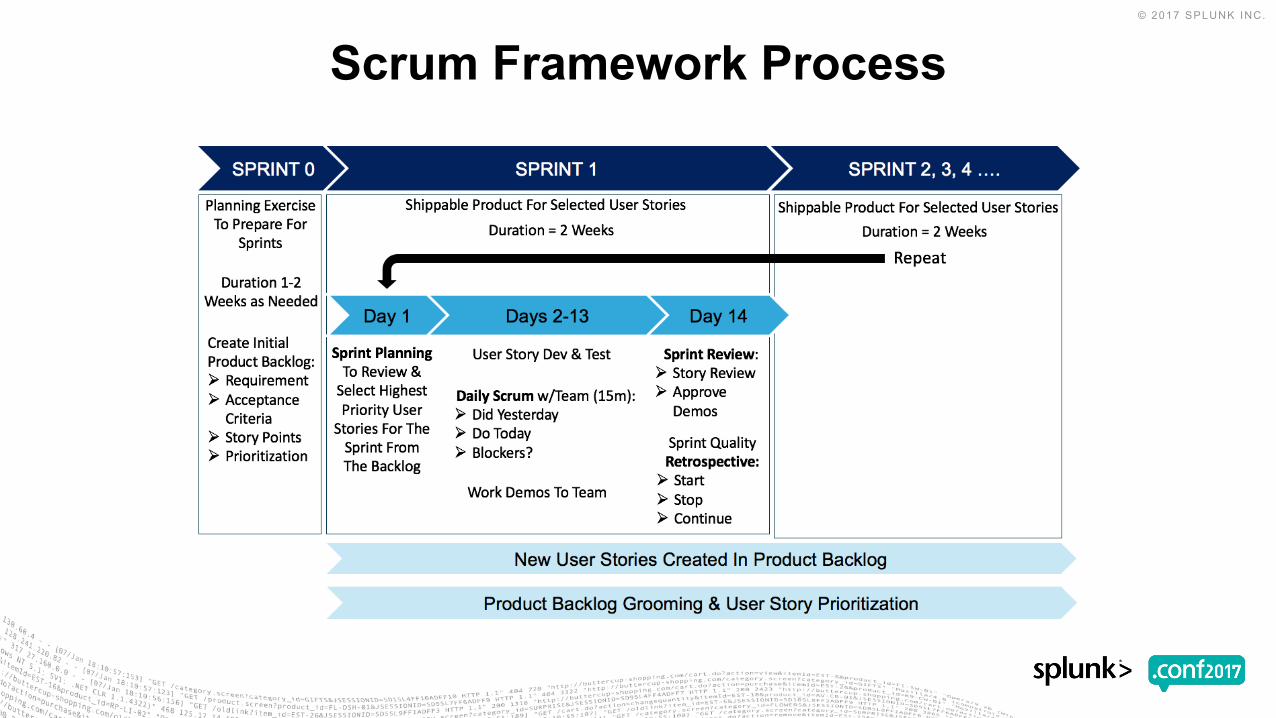
Scrum Framework Process
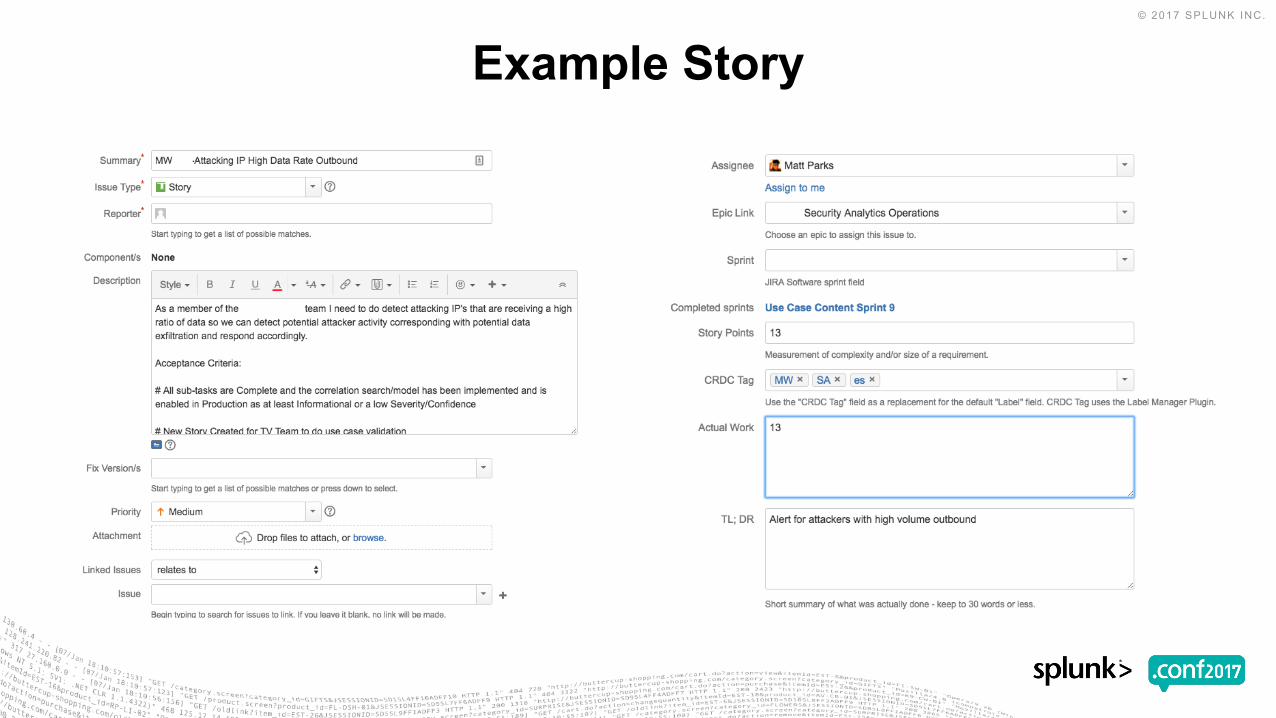
Example Story
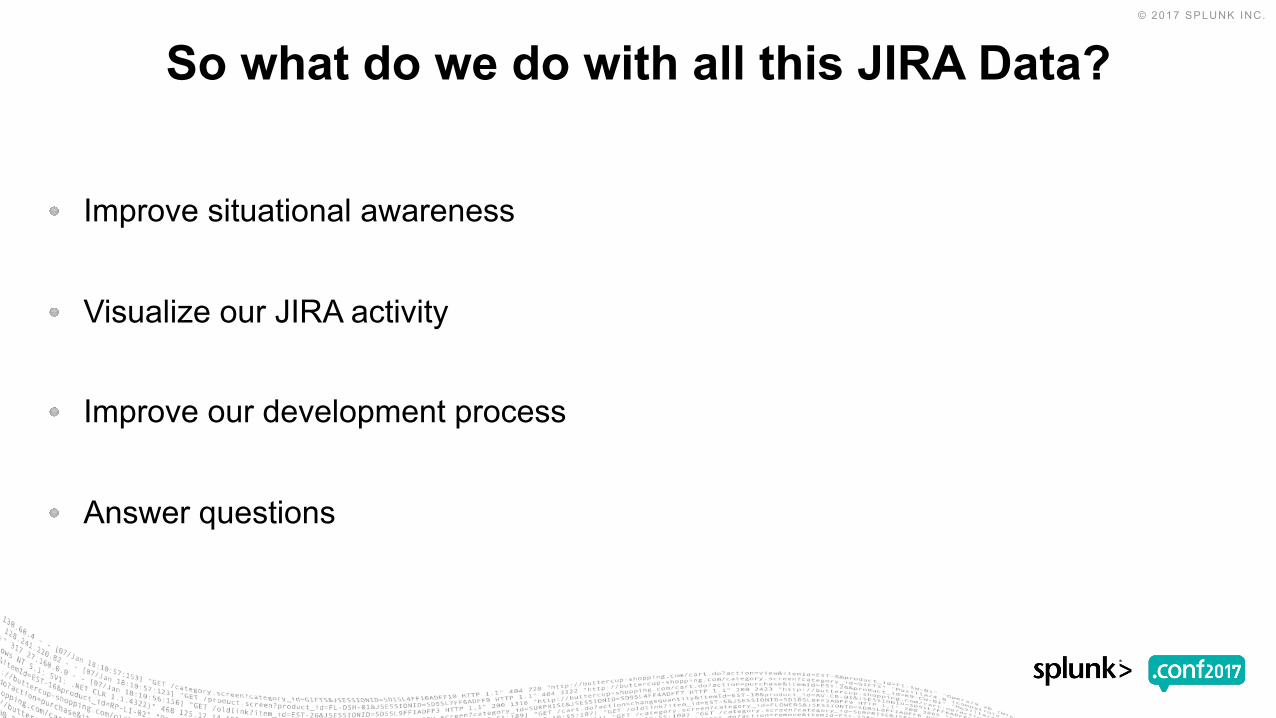
So what do we do with all this JIRA Data?
Improve situational awareness
Visualize our JIRA activity
Improve our development process
Answer questions
Bob in accounting was infected by <insert-threat-of-the-day-here>, who else was infected?
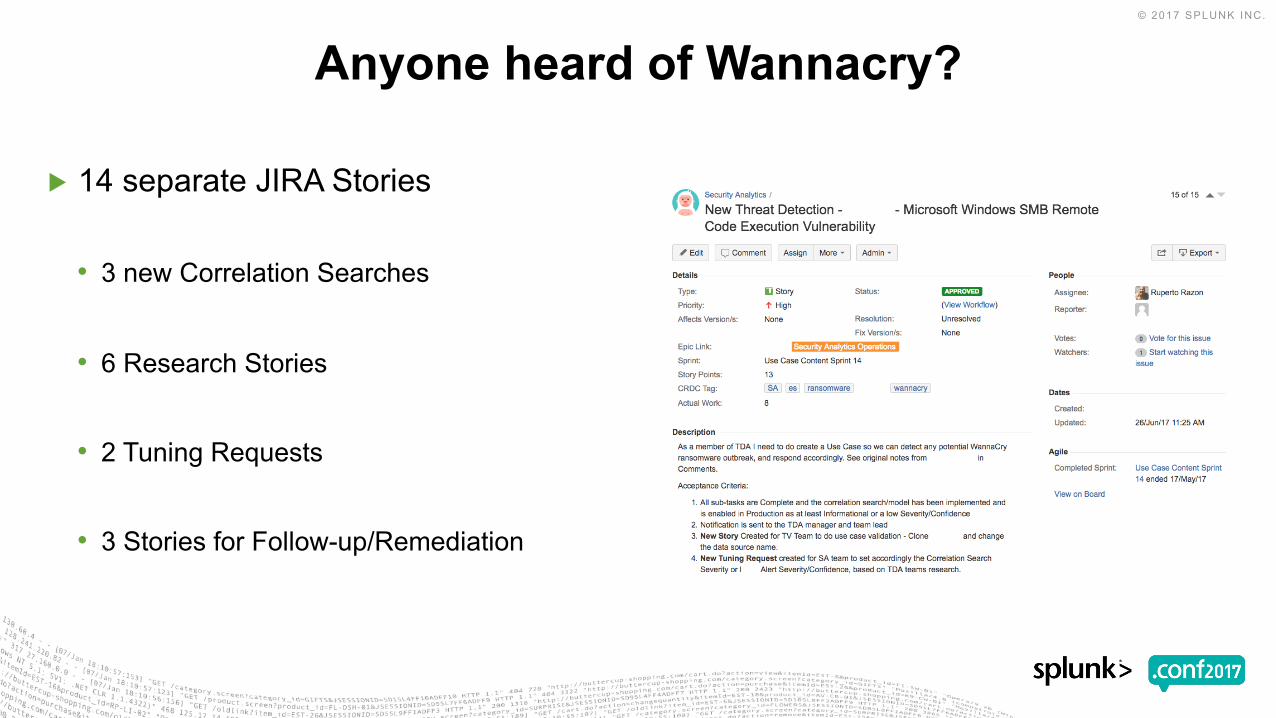
▶ 14 separate JIRA Stories
• 3 new Correlation Searches
• 6 Research Stories
• 2 Tuning Requests
• 3 Stories for Follow-up/Remediation
Anyone heard of Wannacry?

What does our security coverage look like, from a use-case perspective?
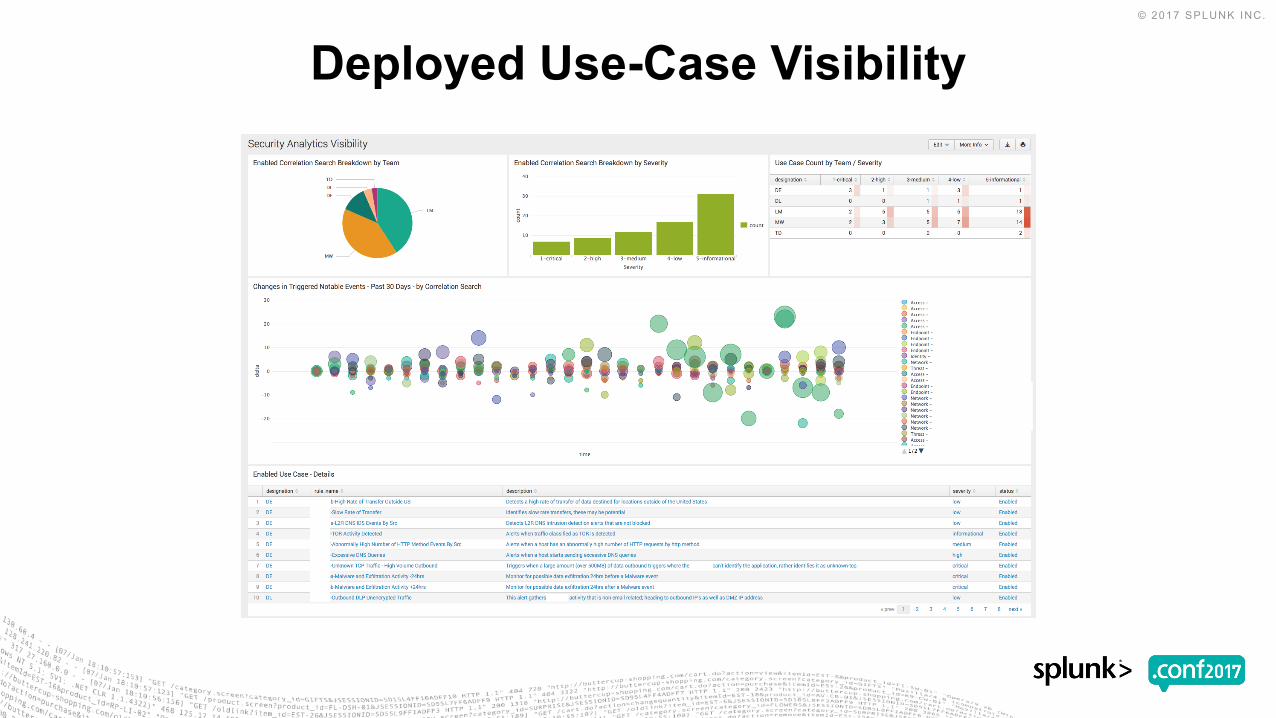
Deployed Use-Case Visibility
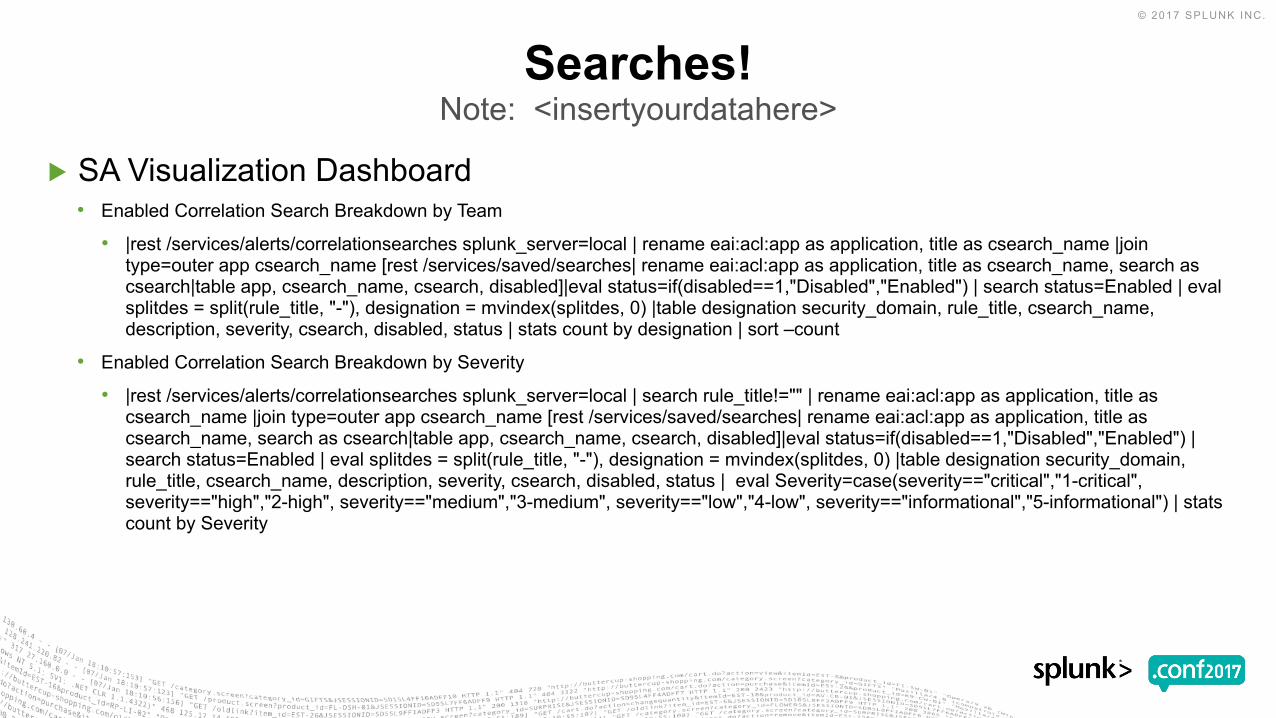
▶ SA Visualization Dashboard• Enabled Correlation Search Breakdown by Team
• |rest /services/alerts/correlationsearches splunk_server=local | rename eai:acl:app as application, title as csearch_name |join type=outer app csearch_name [rest /services/saved/searches| rename eai:acl:app as application, title as csearch_name, search as csearch|table app, csearch_name, csearch, disabled]|eval status=if(disabled==1,"Disabled","Enabled") | search status=Enabled | evalsplitdes = split(rule_title, "-"), designation = mvindex(splitdes, 0) |table designation security_domain, rule_title, csearch_name, description, severity, csearch, disabled, status | stats count by designation | sort –count
• Enabled Correlation Search Breakdown by Severity
• |rest /services/alerts/correlationsearches splunk_server=local | search rule_title!="" | rename eai:acl:app as application, title as csearch_name |join type=outer app csearch_name [rest /services/saved/searches| rename eai:acl:app as application, title as csearch_name, search as csearch|table app, csearch_name, csearch, disabled]|eval status=if(disabled==1,"Disabled","Enabled") | search status=Enabled | eval splitdes = split(rule_title, "-"), designation = mvindex(splitdes, 0) |table designation security_domain, rule_title, csearch_name, description, severity, csearch, disabled, status | eval Severity=case(severity=="critical","1-critical", severity=="high","2-high", severity=="medium","3-medium", severity=="low","4-low", severity=="informational","5-informational") | stats count by Severity
Searches!Note: <insertyourdatahere>
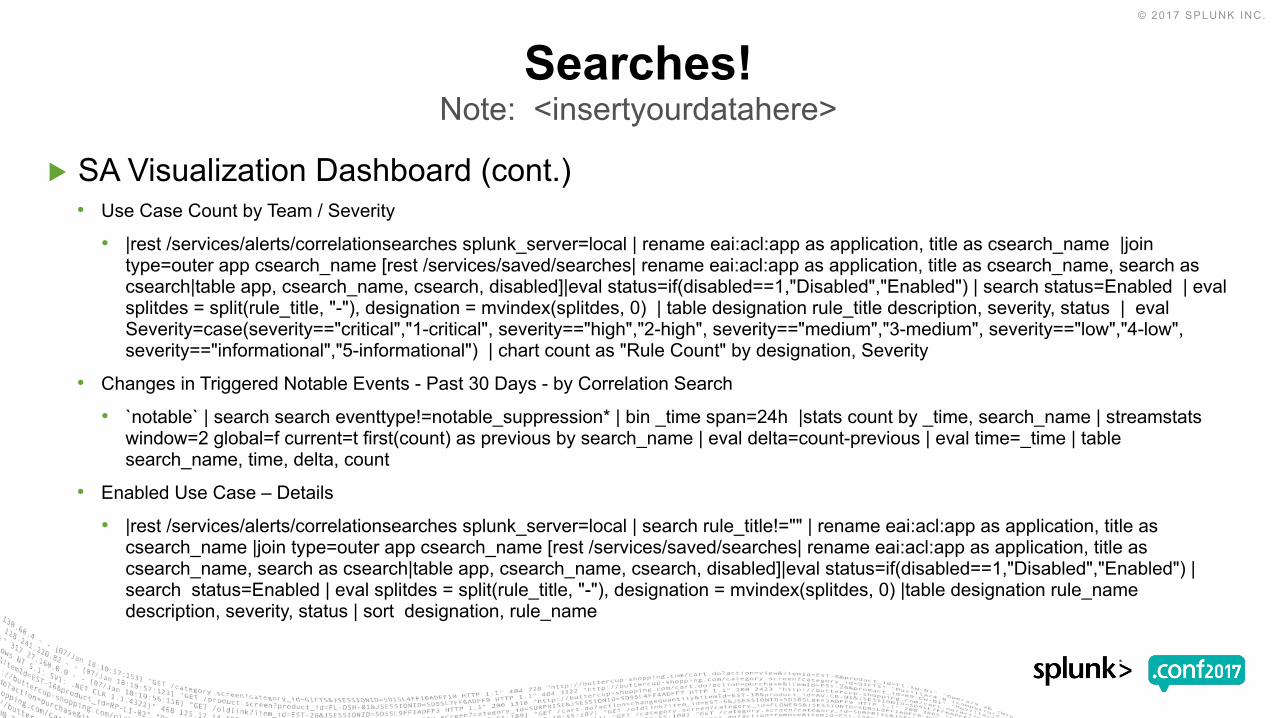
▶ SA Visualization Dashboard (cont.)• Use Case Count by Team / Severity
• |rest /services/alerts/correlationsearches splunk_server=local | rename eai:acl:app as application, title as csearch_name |join type=outer app csearch_name [rest /services/saved/searches| rename eai:acl:app as application, title as csearch_name, search as csearch|table app, csearch_name, csearch, disabled]|eval status=if(disabled==1,"Disabled","Enabled") | search status=Enabled | evalsplitdes = split(rule_title, "-"), designation = mvindex(splitdes, 0) | table designation rule_title description, severity, status | evalSeverity=case(severity=="critical","1-critical", severity=="high","2-high", severity=="medium","3-medium", severity=="low","4-low", severity=="informational","5-informational") | chart count as "Rule Count" by designation, Severity
• Changes in Triggered Notable Events - Past 30 Days - by Correlation Search
• `notable` | search search eventtype!=notable_suppression* | bin _time span=24h |stats count by _time, search_name | streamstatswindow=2 global=f current=t first(count) as previous by search_name | eval delta=count-previous | eval time=_time | table search_name, time, delta, count
• Enabled Use Case – Details
• |rest /services/alerts/correlationsearches splunk_server=local | search rule_title!="" | rename eai:acl:app as application, title as csearch_name |join type=outer app csearch_name [rest /services/saved/searches| rename eai:acl:app as application, title as csearch_name, search as csearch|table app, csearch_name, csearch, disabled]|eval status=if(disabled==1,"Disabled","Enabled") | search status=Enabled | eval splitdes = split(rule_title, "-"), designation = mvindex(splitdes, 0) |table designation rule_namedescription, severity, status | sort designation, rule_name
Searches!Note: <insertyourdatahere>
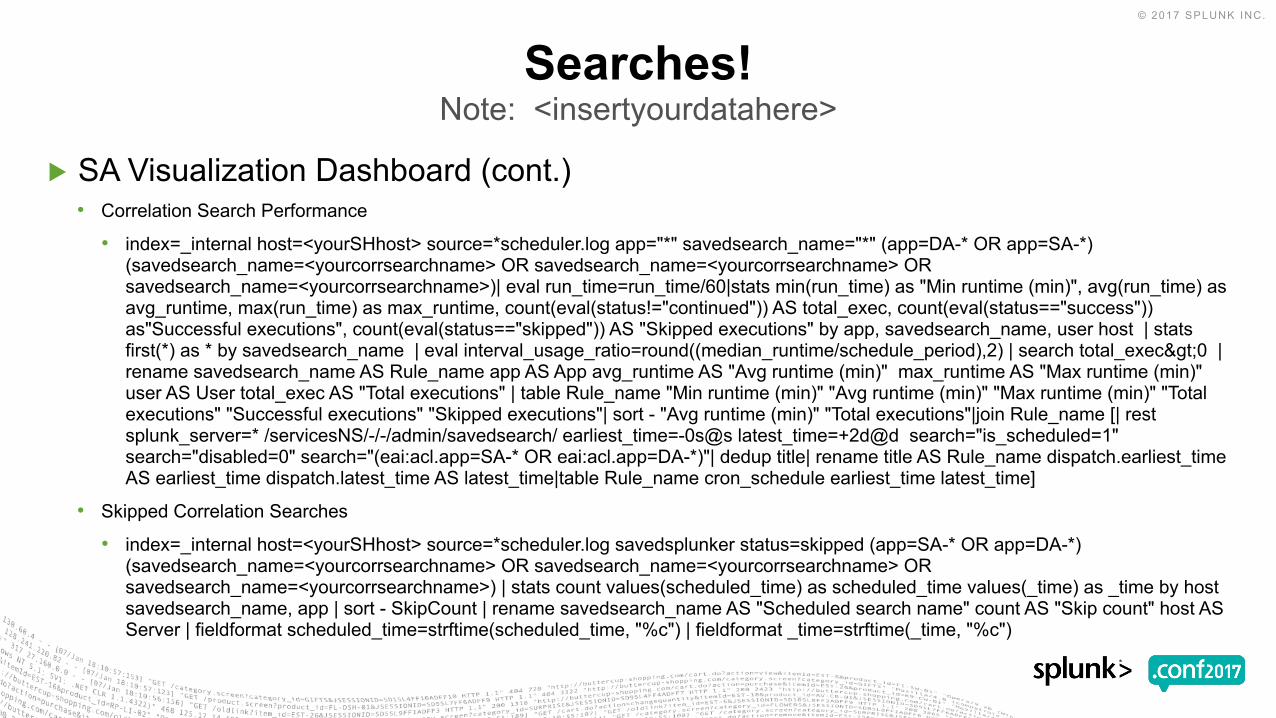
▶ SA Visualization Dashboard (cont.)• Correlation Search Performance
• index=_internal host=<yourSHhost> source=*scheduler.log app="*" savedsearch_name="*" (app=DA-* OR app=SA-*) (savedsearch_name=<yourcorrsearchname> OR savedsearch_name=<yourcorrsearchname> OR savedsearch_name=<yourcorrsearchname>)| eval run_time=run_time/60|stats min(run_time) as "Min runtime (min)", avg(run_time) as avg_runtime, max(run_time) as max_runtime, count(eval(status!="continued")) AS total_exec, count(eval(status=="success")) as"Successful executions", count(eval(status=="skipped")) AS "Skipped executions" by app, savedsearch_name, user host | stats first(*) as * by savedsearch_name | eval interval_usage_ratio=round((median_runtime/schedule_period),2) | search total_exec>0 | rename savedsearch_name AS Rule_name app AS App avg_runtime AS "Avg runtime (min)" max_runtime AS "Max runtime (min)" user AS User total_exec AS "Total executions" | table Rule_name "Min runtime (min)" "Avg runtime (min)" "Max runtime (min)" "Total executions" "Successful executions" "Skipped executions"| sort - "Avg runtime (min)" "Total executions"|join Rule_name [| rest splunk_server=* /servicesNS/-/-/admin/savedsearch/ earliest_time=-0s@s latest_time=+2d@d search="is_scheduled=1" search="disabled=0" search="(eai:acl.app=SA-* OR eai:acl.app=DA-*)"| dedup title| rename title AS Rule_name dispatch.earliest_timeAS earliest_time dispatch.latest_time AS latest_time|table Rule_name cron_schedule earliest_time latest_time]
• Skipped Correlation Searches
• index=_internal host=<yourSHhost> source=*scheduler.log savedsplunker status=skipped (app=SA-* OR app=DA-*) (savedsearch_name=<yourcorrsearchname> OR savedsearch_name=<yourcorrsearchname> OR savedsearch_name=<yourcorrsearchname>) | stats count values(scheduled_time) as scheduled_time values(_time) as _time by host savedsearch_name, app | sort - SkipCount | rename savedsearch_name AS "Scheduled search name" count AS "Skip count" host AS Server | fieldformat scheduled_time=strftime(scheduled_time, "%c") | fieldformat _time=strftime(_time, "%c")
Searches!Note: <insertyourdatahere>

How are we tracking towards our high level security goals for the year?
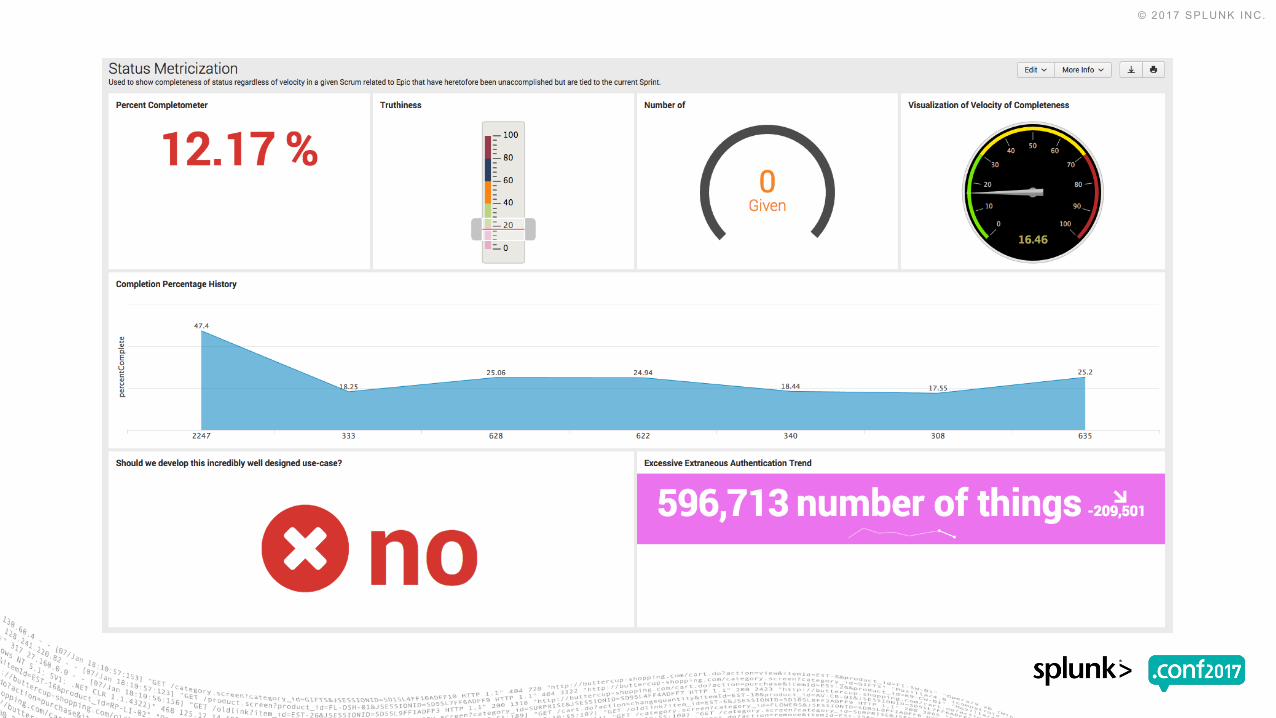
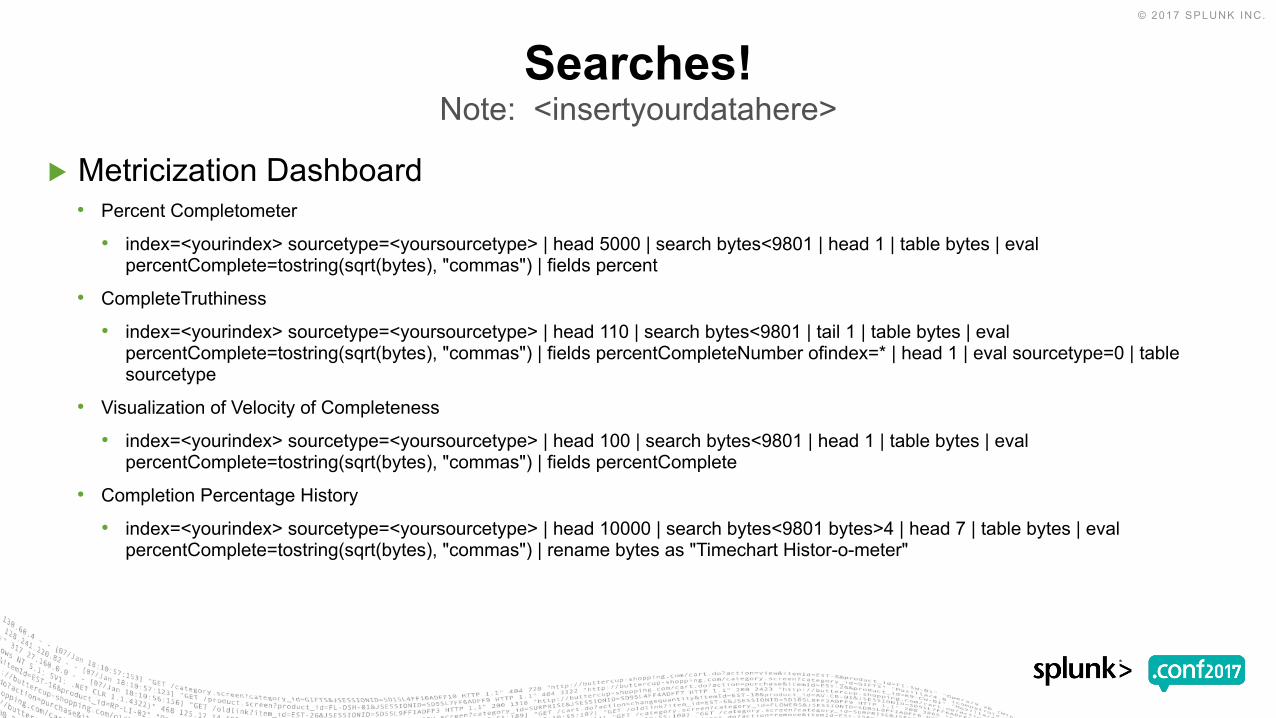
▶ Metricization Dashboard• Percent Completometer
• index=<yourindex> sourcetype=<yoursourcetype> | head 5000 | search bytes<9801 | head 1 | table bytes | evalpercentComplete=tostring(sqrt(bytes), "commas") | fields percent
• CompleteTruthiness
• index=<yourindex> sourcetype=<yoursourcetype> | head 110 | search bytes<9801 | tail 1 | table bytes | evalpercentComplete=tostring(sqrt(bytes), "commas") | fields percentCompleteNumber ofindex=* | head 1 | eval sourcetype=0 | table sourcetype
• Visualization of Velocity of Completeness
• index=<yourindex> sourcetype=<yoursourcetype> | head 100 | search bytes<9801 | head 1 | table bytes | evalpercentComplete=tostring(sqrt(bytes), "commas") | fields percentComplete
• Completion Percentage History
• index=<yourindex> sourcetype=<yoursourcetype> | head 10000 | search bytes<9801 bytes>4 | head 7 | table bytes | evalpercentComplete=tostring(sqrt(bytes), "commas") | rename bytes as "Timechart Histor-o-meter"
Searches!Note: <insertyourdatahere>
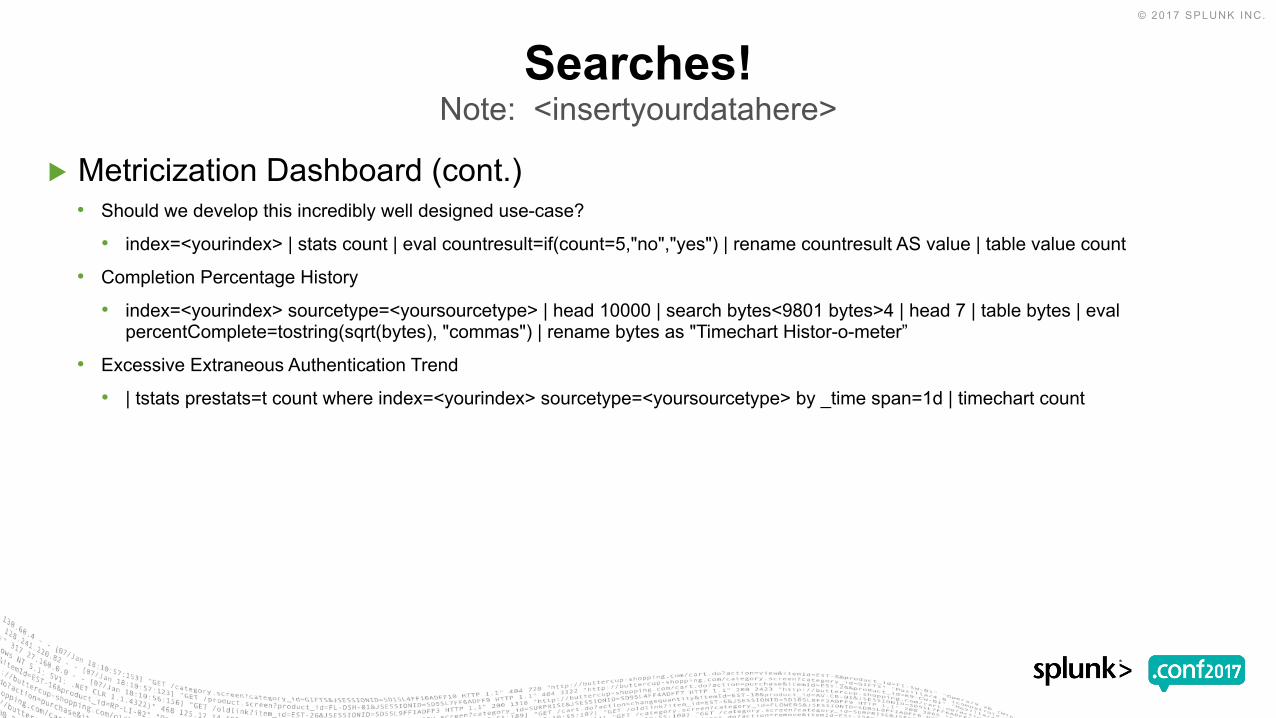
▶ Metricization Dashboard (cont.)• Should we develop this incredibly well designed use-case?
• index=<yourindex> | stats count | eval countresult=if(count=5,"no","yes") | rename countresult AS value | table value count
• Completion Percentage History
• index=<yourindex> sourcetype=<yoursourcetype> | head 10000 | search bytes<9801 bytes>4 | head 7 | table bytes | evalpercentComplete=tostring(sqrt(bytes), "commas") | rename bytes as "Timechart Histor-o-meter”
• Excessive Extraneous Authentication Trend
• | tstats prestats=t count where index=<yourindex> sourcetype=<yoursourcetype> by _time span=1d | timechart count
Searches!Note: <insertyourdatahere>
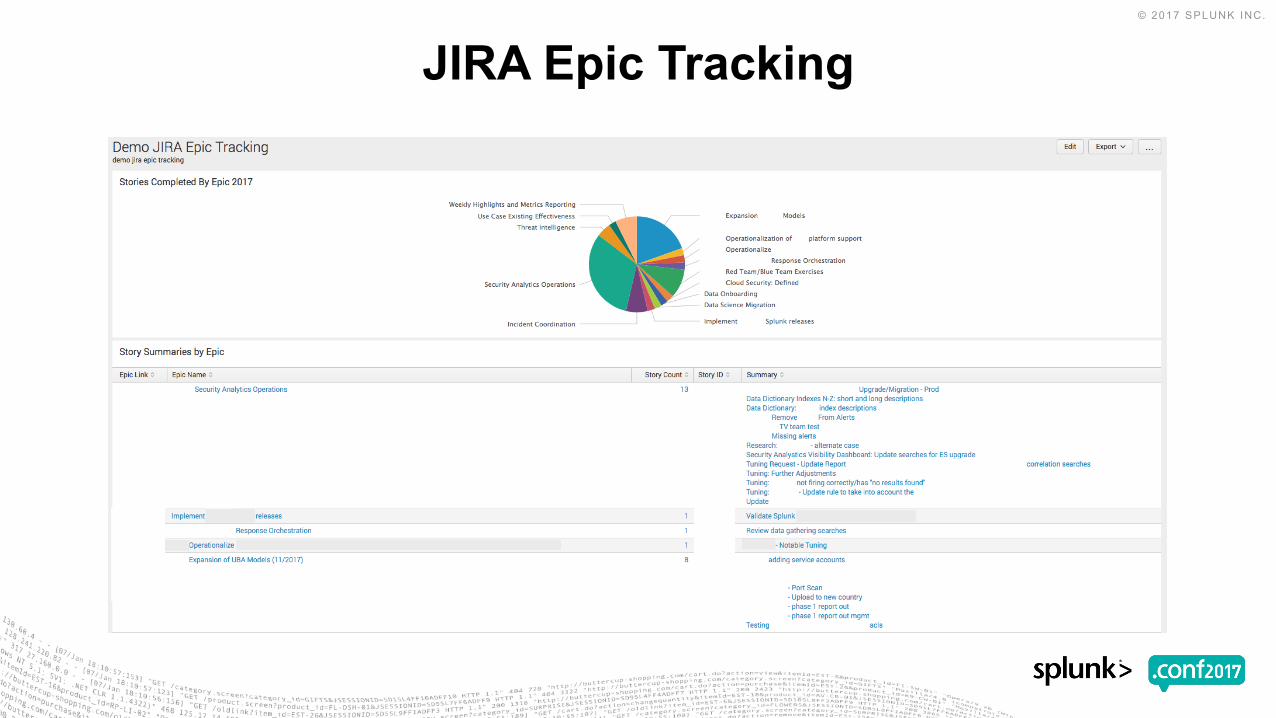
JIRA Epic Tracking
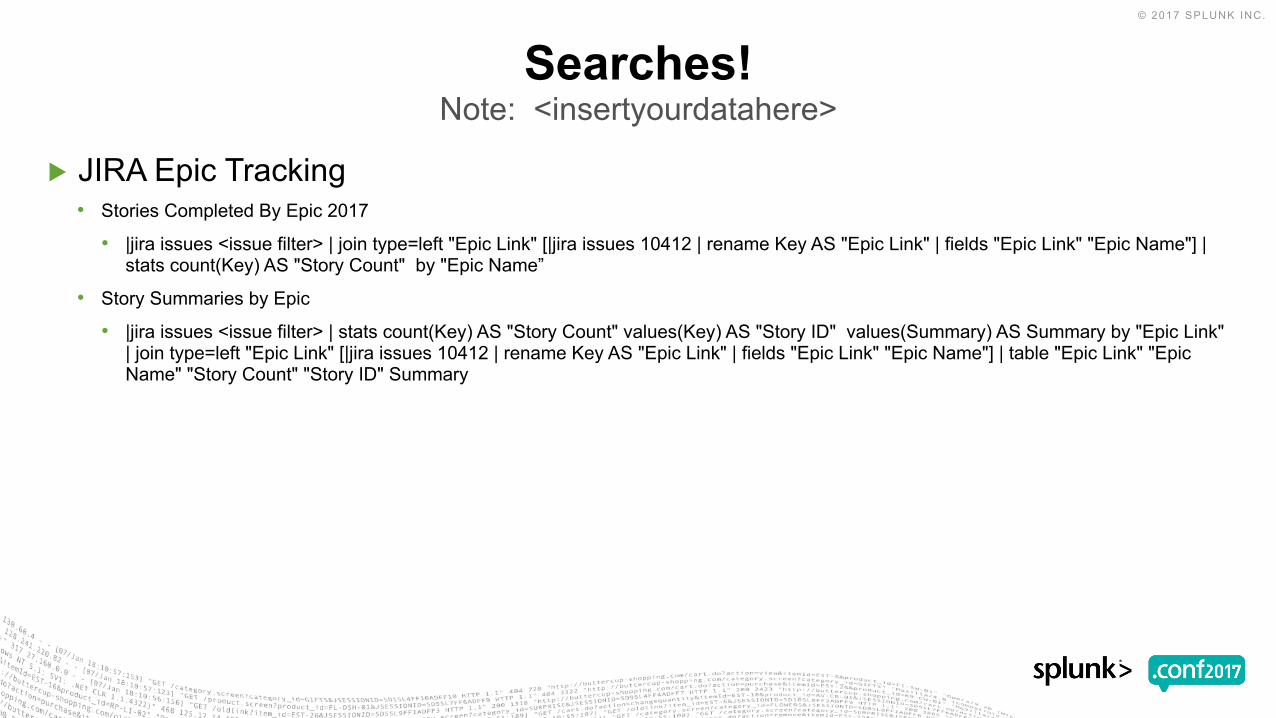
▶ JIRA Epic Tracking• Stories Completed By Epic 2017
• |jira issues <issue filter> | join type=left "Epic Link" [|jira issues 10412 | rename Key AS "Epic Link" | fields "Epic Link" "Epic Name"] | stats count(Key) AS "Story Count" by "Epic Name”
• Story Summaries by Epic
• |jira issues <issue filter> | stats count(Key) AS "Story Count" values(Key) AS "Story ID" values(Summary) AS Summary by "Epic Link" | join type=left "Epic Link" [|jira issues 10412 | rename Key AS "Epic Link" | fields "Epic Link" "Epic Name"] | table "Epic Link" "Epic Name" "Story Count" "Story ID" Summary
Searches!Note: <insertyourdatahere>

What does your development team do all day?
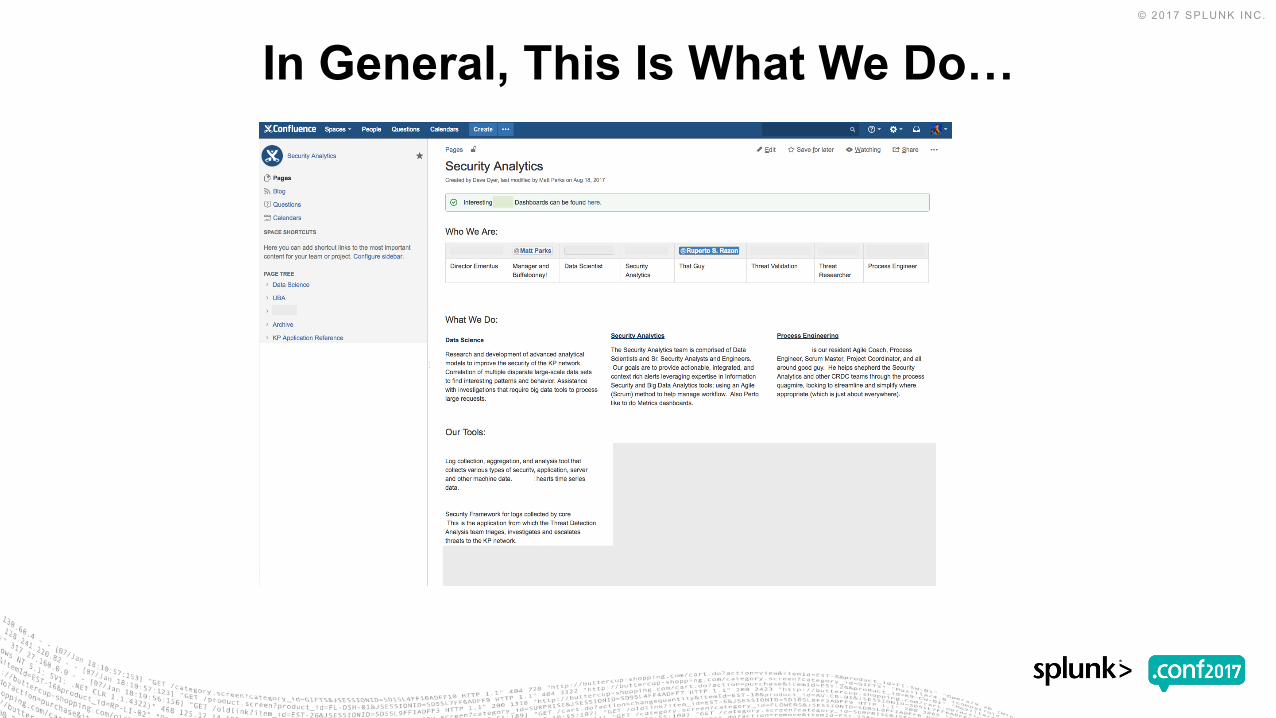
In General, This Is What We Do…
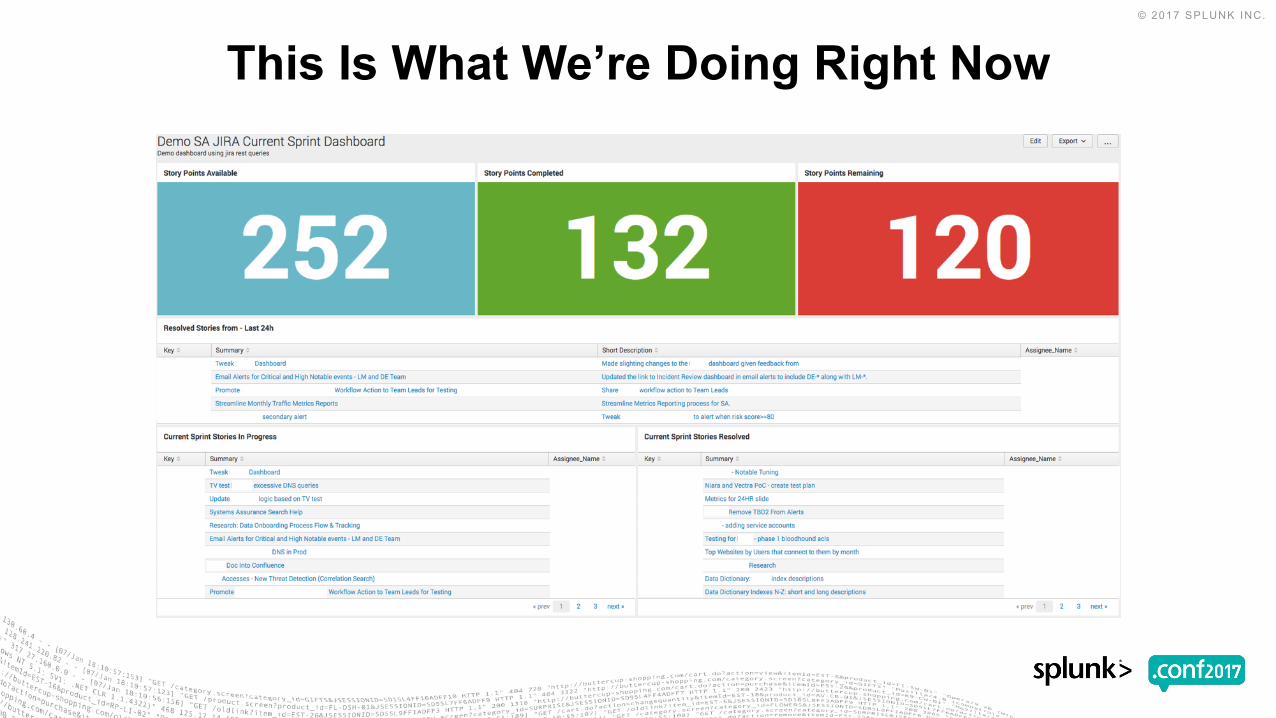
This Is What We’re Doing Right Now
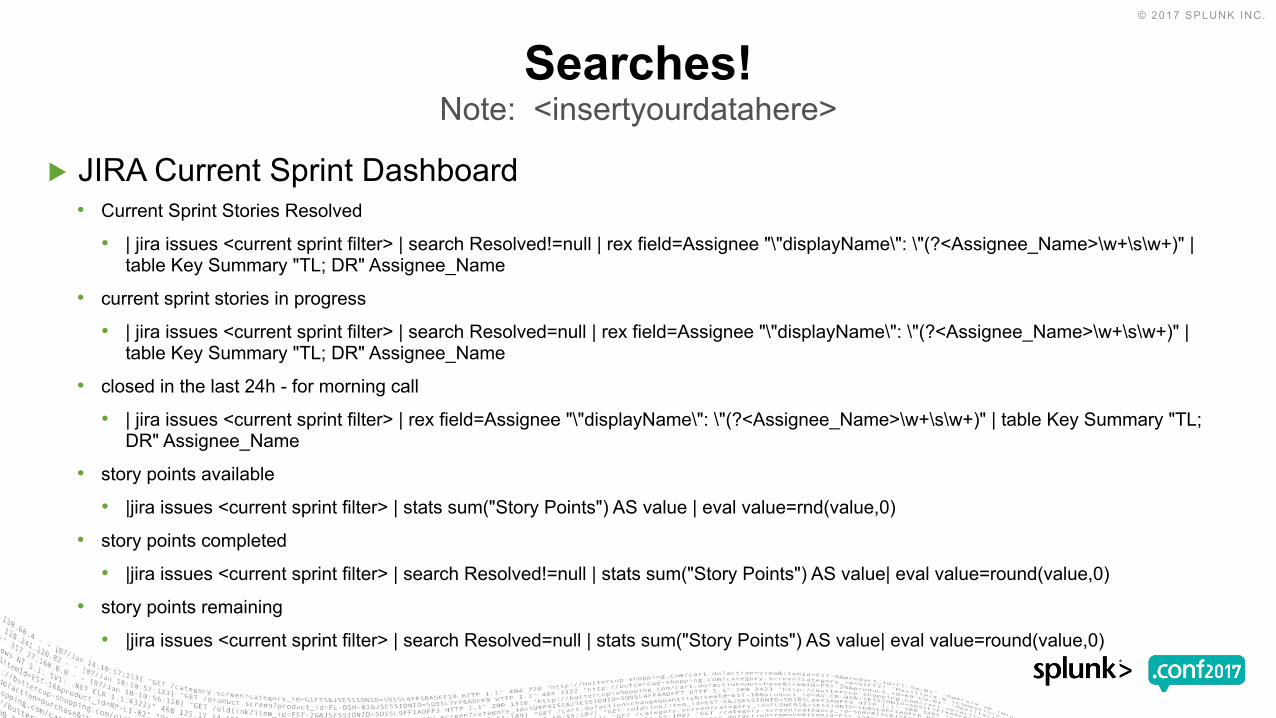
▶ JIRA Current Sprint Dashboard• Current Sprint Stories Resolved
• | jira issues <current sprint filter> | search Resolved!=null | rex field=Assignee "\"displayName\": \"(?<Assignee_Name>\w+\s\w+)" | table Key Summary "TL; DR" Assignee_Name
• current sprint stories in progress
• | jira issues <current sprint filter> | search Resolved=null | rex field=Assignee "\"displayName\": \"(?<Assignee_Name>\w+\s\w+)" | table Key Summary "TL; DR" Assignee_Name
• closed in the last 24h - for morning call
• | jira issues <current sprint filter> | rex field=Assignee "\"displayName\": \"(?<Assignee_Name>\w+\s\w+)" | table Key Summary "TL; DR" Assignee_Name
• story points available
• |jira issues <current sprint filter> | stats sum("Story Points") AS value | eval value=rnd(value,0)
• story points completed
• |jira issues <current sprint filter> | search Resolved!=null | stats sum("Story Points") AS value| eval value=round(value,0)
• story points remaining
• |jira issues <current sprint filter> | search Resolved=null | stats sum("Story Points") AS value| eval value=round(value,0)
Searches!Note: <insertyourdatahere>
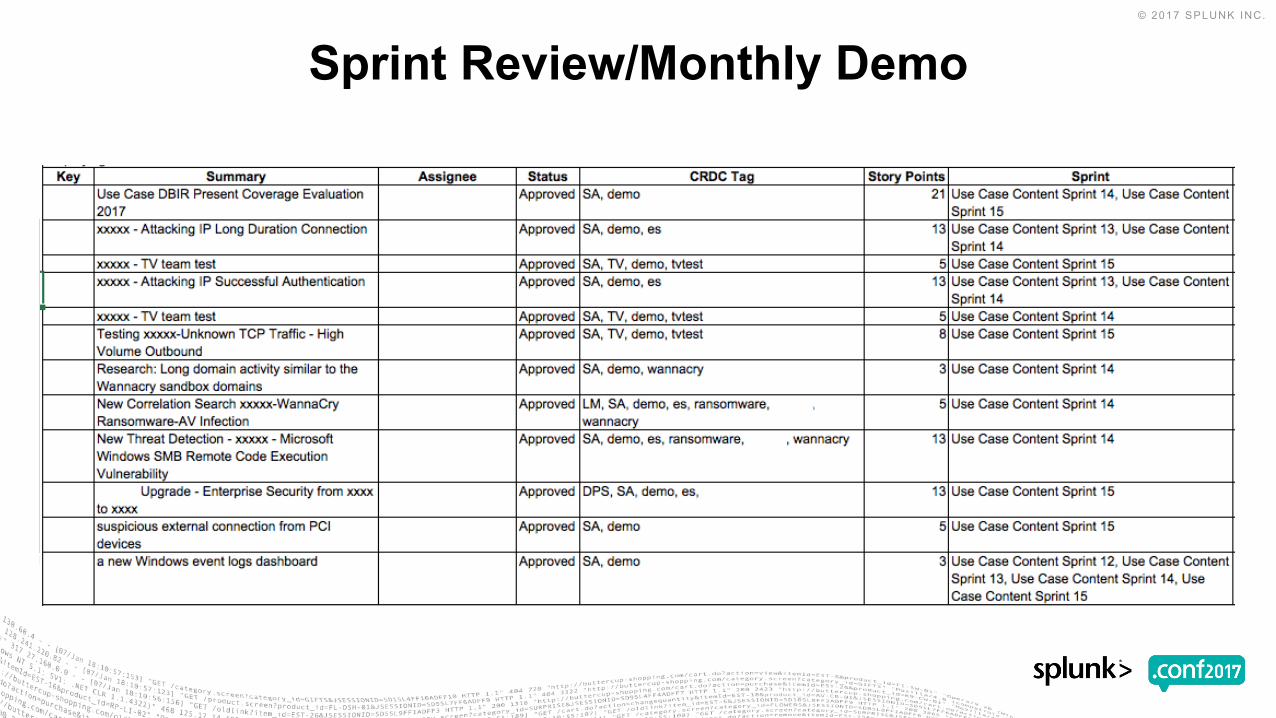
Sprint Review/Monthly Demo
▶ Gave you tips on how you can build a flexible content development process
▶ Shared with you a real-world example of how this flexible process works in practice
▶ Provided you with dashboards and searches that will improve visibility of your security posture, high-level goal tracking and content dev capacity
Recap

What will we do in the next 12 months?

▶ Identify the key metadata in your currently deployed use-cases
▶ Listen to your dev team. Examine your current dev process and improve on the challenges identified by your team
▶ When building your process, work towards a minimum viable product (MVP)
What can you do in the next 12 months?
96%

Do or do not, there is no try.- Abraham Lincoln

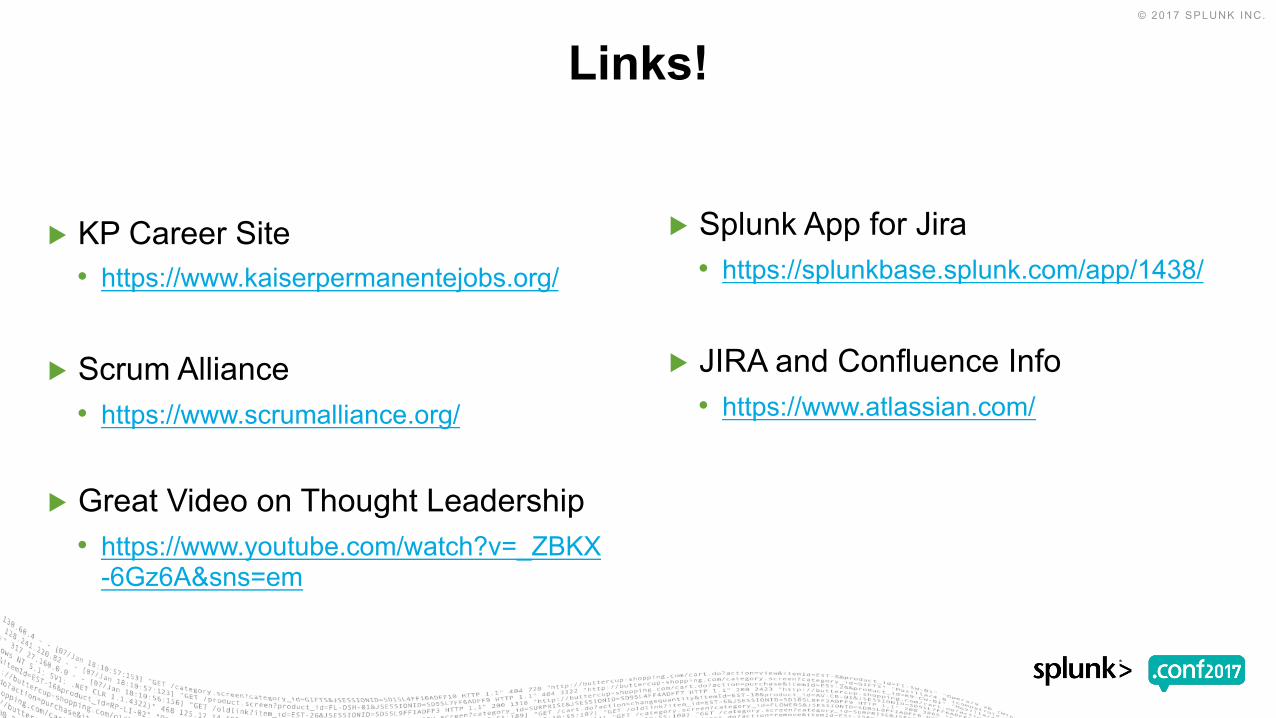
▶ KP Career Site• https://www.kaiserpermanentejobs.org/
▶ Scrum Alliance• https://www.scrumalliance.org/
▶ Great Video on Thought Leadership• https://www.youtube.com/watch?v=_ZBKX
-6Gz6A&sns=em
▶ Splunk App for Jira• https://splunkbase.splunk.com/app/1438/
▶ JIRA and Confluence Info • https://www.atlassian.com/
Links!

Questions?