Embed Size (px)
Citation preview

System Consulting
2015 KSP Port & Logistics Consulting:
A Project Supporting Indonesian Fari Trade System
Improvement
June, 2015

1
Contents
2015 Port and Logistics Consulting
I. Introduction ················································································· - 1 -
1. Background and Purpose ································································ - 1 -
1.1. Background of the Project ······················································ - 1 -
1.2. Purpose of the Project ··························································· - 1 -
2. Project Scope and Expected Benefits ·················································· - 2 -
2.1. Project Scope ······································································ - 2 -
2.2. Expected Benefits ································································· - 2 -
3. Project Implementation Direction and Major Contents ····························· - 2 -
3.1. Direction for the Project implementation ···································· - 2 -
3.2. Major Contents of the Project·················································· - 2 -
II. Main Subject-(Target Area Analysis: Indonesia) ···································· - 3 -
1. Current State of Indonesian Ports and Logistics ····································· - 3 -
1.1. Tanjung Priok Port ······························································· - 5 -
1.2. Tanjung Perak ···································································· - 7 -
1.3. Characteristics of Indonesia Port and Logistics ···························· - 8 -
III. Main Subject-(Target Area Analysis: Korea) ······································· - 11 -
1. Current State of Korean Port and Logistics ········································· - 11 -
1.1. State of Ports ····································································· - 11 -
1.2. Introduction of the Terminal Operating Company (TOC) System····· - 15 -
1.3. Busan Port Hinterland Complex Case ······································ - 43 -
1.4. Port Master Plan Establishment Case ······································· - 48 -
IV. Conclusion ················································································· - 54 -
Reference ························································································ - 57 -

2
List of Table
Table 1. Indonesian Port and Port Management Bodies ···································· 4
Table 2. Container throughput in Indonesia ··················································· 4
Table 3. Current State of Container Terminal Facility in Tanjung Priok Port ············ 6
Table 4. Container Handling at Tanjung Priok Port ·········································· 6
Table 5. Current State of Container Terminals at Tanjung Perak Port ···················· 7
Table 6. Container Handling at Tanjung Perak ··············································· 8
Table 7. Facilies of Busan Port ································································ 12
Table 8. Container Throughput of Busan port ··············································· 13
Table 9. Busan New Port Development Plan ················································ 13
Table 10. Busan Port Liner Service ··························································· 15
Table 11. Productivity Evaluation on TOC Terminals (as of 2002) ······················ 24
Table 12. Structure of Cargo Handling Tariffs ··············································· 30
Table 13. Considerations in Performance Evaluation ······································ 39
Table 14. Plan on Creation and Supply of Port Hinterland Complex ···················· 46
Table 15. Increase in Transit Cargo Volume ················································· 47
Table 16. History of Master Plan on Port ···················································· 49
Table 17. Port Demurrage Rate and Cost ····················································· 52

3
List of Figure
Figure1. Major Ports in Indonesia ······························································ 3
Figure2. Korean ports ··········································································· 11
Figure3. TOC System Operating Structure ·················································· 16
Figure4. Computation of Cargo Handling Tariffs at Ports ································· 29
Figure5. Changing Cargo Handling Tariffs at Busan Port ································· 33
Figure6. The Process of Developing a Port Hinterland Complex Plan ·················· 44
Figure7. Area of Demand Calculations System for the Port Hinterland Development 45
Figure8. The Process of Developing Port Master Plan ····································· 51

- 1 -
I. Introduction
1. Background and Purpose
1.1. Background of the Project
◦ Indonesia is an archipelago comprising around 18,000 islands. For this geological
reason, efficient operation of maritime transportation and ports are important. However,
insufficient container handling equipment, lack of port hinterland sites and increasing
throughput consumed long time for loading and unloading container cargoes. Therefore,
it is necessary to secure capable port operation and reduce logistics costs.
◦ The main culprit behind high port costs is the absence of competition. Although
multiple companies deal with cargoes within ports, price competition among them is
virtually non-existent.
◦ The Komisi Pengawas Persaingan Usaha (KPPU), the Business Competition
Supervisory Commision (BCSC) in English, showed deep interest in the case of Busan
Port (Korea). The KPPU asked us to review effects of the Terminal Operating Company
(TOC) system as well as background for its introduction and to draw implications to
Indonesia based on relevant cases.
1.2. Purpose of the Project
◦ 'The Deputy of Prevention' in charge of port and logistics under the KPPU asked us to
introduce efforts of Busan Port for lower costs and higher efficiency.
◦ The purpose of KSP Port Logistics Consulting is to help Indonesia to stimulate
competition in port and logistics field. For that purpose, we will introduce cases of Busan
Port and induce implications for the nation.

- 2 -
2. Project Scope and Expected Benefits
2.1. Project Scope
◦ KPPU's main interest are in the Terminal Operation Company (TOC) system, port
complex and the Port Master Plan. We will look for suggestions to Indonesia based on
each case.
2.2. Expected Benefits
◦ Success cases of Korean port and logistics industry will present reference and data for
the Long-term Logistics Development Road Map which is being drafted by the Deputy
of Prevention of KPPU.
3. Project Implementation Direction and Major Contents
3.1. Direction for the Project implementation
◦ Total project period: Dec. 30, 2014~June 19, 2015
◦ Collection of data on Korean ports and logistics
◦ Case analysis
◦ Drawing of implications
3.2. Major Contents of the Project
◦ Focus on introduction of the TOC system and its benefits
◦ Cases of port complex site development of Busna Port
◦ Procedures for the Port Master Plan development and its contents
◦ Implications for Indonesia based on analyses on success cases of Korea
- 3 -
II. Main Subject-(Target Area Analysis: Indonesia)
1. Current State of Indonesian Ports and Logistics1
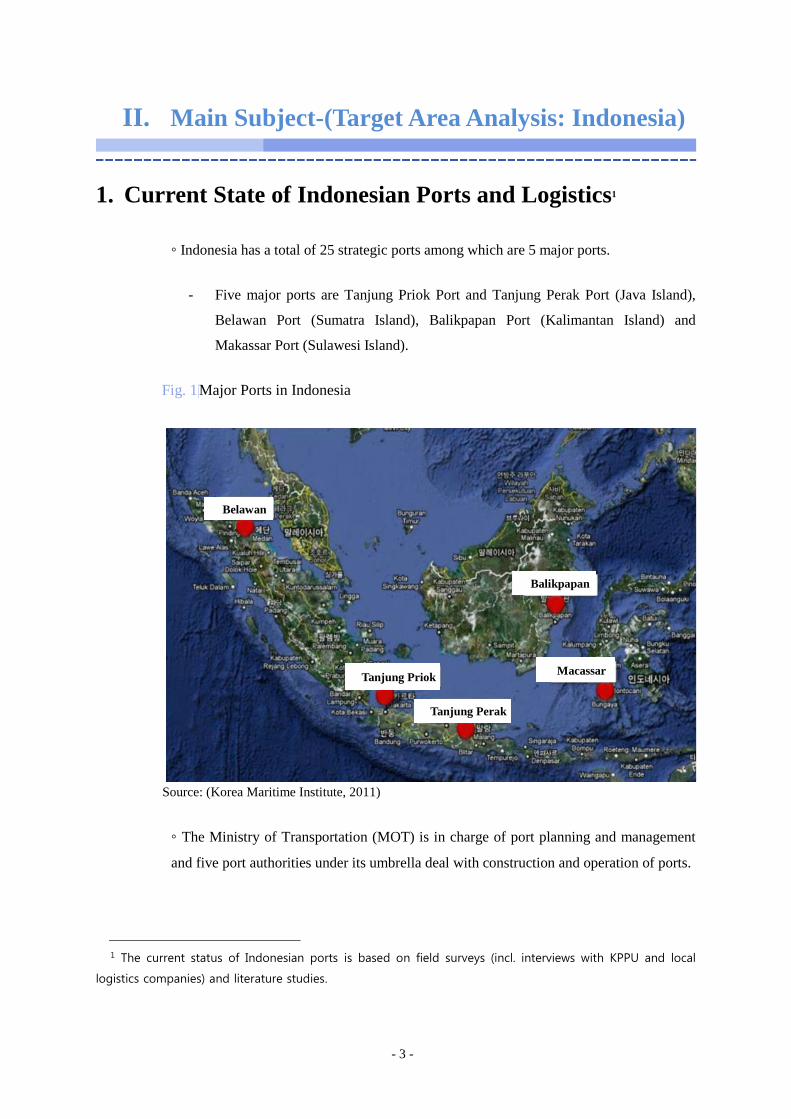
◦ Indonesia has a total of 25 strategic ports among which are 5 major ports.
- Five major ports are Tanjung Priok Port and Tanjung Perak Port (Java Island),
Belawan Port (Sumatra Island), Balikpapan Port (Kalimantan Island) and
Makassar Port (Sulawesi Island).
Fig. 1|Major Ports in Indonesia
Source: (Korea Maritime Institute, 2011)
◦ The Ministry of Transportation (MOT) is in charge of port planning and management
and five port authorities under its umbrella deal with construction and operation of ports.
1 The current status of Indonesian ports is based on field surveys (incl. interviews with KPPU and local
logistics companies) and literature studies.
Belawan
Tanjung Priok
Balikpapan
Tanjung Perak
Macassar

- 4 -
Table 1 | Indonesian Port and Port Management Bodies
No. Operating Authority Details
1 PT. PELINDO Ⅰ
Major ports : 5 ports such as Belawan, Dumai,
Lhokeumawe, Pekanbaru, Tanjung, Pinang
Under its jurisdiction : 28 ports
2 PT. PELINDO Ⅱ
Major ports : 12 ports such as Banten, Palembang,
Panjang, Pontianak, Tanjing priok, Teluk Bayur, Jambi,
Cirebon, Bengkulu, Pangkal balam, Tanjung Pandan,
Sunda Kelapa
Under its jurisdiction: 17 ports
3 PT. PELINDO Ⅲ
Major ports : 5 ports such as Banjarmasin, Benoa, Tenau,
Tanjung Emas, Tanjung Perak
Under its jurisdiction : 18 ports
4 PT. PELINDO Ⅳ
Major ports : 8 ports such as Ambon, Balikpapan, Biak,
Bitung, Jayapura, Makasar, Samarinda, Sorong
Under its jurisdiction : 24 ports
5 Pelabuhan Otorita Major port: Batam Port
Source: (Indonesian MOT and Korean Ministry of Land, Infrastructure and Transport , 2010)
◦ National throughput of Indonesia stood at 10.79 million TEU (2013), growing at the
annual average rate of 14.0% from 2006.
Table 2 | Container throughput in Indonesia
2006
(1,000
TEU)
2007
(1,000
TEU)
2008
(1,000
TEU)
2009
(1,000
TEU)
2010
(1,000
TEU)
2011
(1,000
TEU)
2012
(1,000
TEU)
2013
(1,000
TEU)
Average
annual
increase
4,316 6,582 7,404 7,255 8,482 8,966 9,324 10,790 14.0%
Source: UNCTAD, 2014; The World Bank

- 5 -
1.1. Tanjung Priok Port
◦ Port location and characteristics
- Tanjung Priok Port is the largest trade port in Indonesia with Jakarta (capital city)
as its hinterland. It acts as the port of call for national seaborne feeder system.
- The port is located north of Jakarta, the capital city on the northwest coast of Java
Island and at the mouth of Ciliwung. It deals with imports and exports of Jawa
Barat (West Java), most of which are transported to other Indonesian islands,
Singapore and Malaysia.
- Tanjung Priok Port is equipped with good transportation infrastructure such as
roads and railways which covers nationwide. Sukarno-Hatta International Airport
is only 25km off the port.
- As of 2012, around 14,500 ships arrived or departed at and from the port. It
handles 36.3 million tons of general cargoes and 4 million TEU throughput.
◦ Current port facilities
- Tanjung Priok Port is 1.716 million ㎡ in size and has 15 berths.
- The total length of the port is 3,450m.
- The depth of water is from 8.0 to 14.0m. The port holds 34 quay cranes.

- 6 -
Table 3 | Current State of Container Terminal Facility in Tanjung Priok Port
Berth
(No)
Berth
length(m)
Water
level(m)
Size
(1,000 m2) C/C Terminal operator
Jakarta International
Container Terminal 10 2,338 9~14 1,280 22
Jakarta International
Container Terminal
KOJA Terminal 2 450 14 306 5 PT Terminal
Petikemas Koja
Multi
Terminal T009 2 404 8 80 4
PT Serbaguna
Terminal
Terminal 300 1 258 12 50 3 PT Portindo
Dinamika
Total 15 3,450 8~14 1,716 34
Source: CI Yearbook, 2012
◦ Container cargo handling performance
- As of 2013, the port handled 6.59 million TEU containers (world's 22nd) and has
grown at the annual average rate of 9.8% from 2006 to 2013
Table 4 | Container Handling at Tanjung Priok Port
2006
(1,000
TEU)
2007
(1,000
TEU)
2008
(1,000
TEU)
2009
(1,000
TEU)
2010
(1,000
TEU)
2011
(1,000
TEU)
2012
(1,000
TEU)
2013
(1,000
TEU)
Annual
Growth
Rate
3,420 3,690 3,984 3,805 4,715 5,620 6,214 6,590 9.8%
Source: UNCTAD, 2014; The World Bank
◦ The Indonesia Port Corporations or PT Pelabuhan Indonesia (Pelindo) Ⅱ has been
developing Kalibaru port (north of Jakrta) to address saturation of Tanjung Priok Port. The
construction started in March 2013 and will be finished by 2022. Kalibaru port is expected
to handle 13million TEU on its completion.

- 7 -
1.2. Tanjung Perak
◦ Port location and characteristics
- Tanjung Perak Port is located on the northeast coast of Java and the gateway to
Surabaya, a city called as 'the capital of east Indonesia.'
- Surabaya is the second largest city of Indonesia. It acts as the business center of
east Java island and has well-developed transportation networks linking major
cities.
- The growth rates of east Java area (esp. Surabaya) stand at 7.3%, exceeding the
national average. The area is being preferred to west Java area which suffers a
chronic bottleneck to its infrastructure.
- The port transports agricultural exports produced in Java Island, such as sugar,
rubber, timber, peanuts, and tobacco.
- Major imports include petroleum products, textiles, electronics, machinery and
cars.
◦ Current port facilities
- Tanjung Perak Port is 1.95million ㎡ in size and holds 10 births.
- The total length of the port is 1,950m.
Table 5 | Current State of Container Terminals at Tanjung Perak Port
Berth
(No.)
Berth
length(m)
Water
level(m)
Size
(1000 m2) C/C Terminal Operator
Container Terminal 9 1,450 10.5 738 11 PT Terminal
Petikemas Surabays
Container
TerminalⅠ/Ⅱ 1 500 10.5 362 5
PT Berlian Jasa
Terminal Indonesia
Total 10 1,950 10.5 1.100 16
Source: CI Yearbook, 2012

- 8 -
◦ Container cargo handling performance
- As of 2013, the port handled 3.02 million TEU containers (world's 46th) and has
grown at 7.2% from 2006 to 2013 on annual average.
Table 6 | Container Handling at Tanjung Perak
2006
(1,000
TEU)
2007
(1,000
TEU)
2008
(1,000
TEU)
2009
(1,000
TEU)
2010
(1,000
TEU)
2011
(1,000
TEU)
2012
(1,000
TEU)
2013
(1,000
TEU)
Annual
Growth
Rate
1,852 2,042 2,213 2,270 3,030 2,640 2,850 3,020 7.2%
Source: UNCTAD, 2014; The World Bank
1.3. Characteristics of Indonesia Port and Logistics
◦ For an archipelago nation like Indonesia, maritime transportation is pivotal. However,
cargo handling has consumed a long time due to insufficient spaces for container loading,
lack of cargo handling equipment, and rapidly rising throughput. This raised needs for port
infrastructure improvement.
◦ Less developed port infrastructure has caused high logistics costs and price gap between
regions. For example, domestic maritime transportation costs between Jakarta and Sumatra
is four to five times higher than international costs between Jakarta and Singapore.
◦ There are four port authorities in Indonesia. Marjor ports are Belawan port (north
Sumatra), Tanjung Priok Port (south Sumatra, west Java and west Kalimantan), Tanjung
Perak Port (central Java and west Java) and Balikpapan Port (Sulawesi, east Kalimantan
and east Indonesia).
◦ The Indonesia Port Corporations or PT Pelabuhan Indonesia (Pelindo) Ⅱ has been
developing Kalibaru port in north Jakarta in an effort to resolve congestion at Tanjung
Priok Port. The construction started in March 2013 and will be completed by 2022. When
the development is completed, the port is expected to handle 13 million TEU cargoes.
◦ According to the Global Competitiveness Report (2013) by the World Economic Forum,
9.1% of respondents quoted 'lack of infrastructure' as the third largest hurdle in doing
business in Indonesia.

- 9 -
- Excluding railways (44th), competitiveness of Indonesian infrastructure was
weak in large, with roads and ports ranking 78th and 89th, respectively.
◦ Logistics costs in Indonesia account for 24~27% of national GDP, relatively higher than
Singapore (7~8%), Thailand (15~18%) and Vietnam (24~25%).
◦ Port stay in Indonesia is about 6 days (in case of Tanjung Priok Port). The figure is far
above that of Singapore (1.1 days), Hong Kong (2 days), Malaysia (4days, Port Klang) and
Thailand (5 days).
◦ High cost at ports is partly attributable to insufficient infrastructure which allows port
service providers to decide prices. Another reason can be found from the absence of
competition. For instance, Hutchison Port Holdings is participating in operation of
Tanhung Priok Port in return for their investment. Such investment in the form of stake
sales discourages competition.
◦ Hutchison Port Holdings Limited (HPH), a multinational company headquartered in
Hong Kong, has been partaking in terminal operation of Tanjung Priok Port.
◦ From the perspective of International Freight Forwarders, major problems in port and
logistics are port congestion resulted from insufficient infrastructure, delays in CIQ
inspection and high trucking costs. Meanwhile, port congestion is caused by insufficient
container yard, shallow water depth (port of call for mainly mid-and small-sized container
ships), lack of cargo handling equipment and traffic jamming roads nearby ports.
◦ Port landing charges in Indonesia are notified as a ministerial decree after consultation
between Pelindo and Ministry of Transportation.
◦ Despite the multiple number of stevedoring companies, competition among them are
non-existent in practice.
◦ As for maritime transportation, only local shipping companies can do domestic
transportation. As a result, transportation costs on Jakarta-Borneo route are $500 (20ft) and
$900 (40ft). In comparison, routes where foreign shipping companies partake have lower
costs. Jakarta-Singapore route is about $50~$100 (20ft) and Jakarta-Busan route is $100
(20ft).
◦ Container handling fees at Tanjung Priok Port, a representative port of Indonesia, are

- 10 -
$145 (40ft) and $95 (20ft), which are higher than Busan Port of Korea. When Hutchison
Port Holdings Limited (HPH) participated in the terminal operation, the Indonesian rupiah
was depreciated during the Asian Financial Crisis. As the exchange rates became
stabilized from early 2000, container handling fees rose up to $210 to preserve profits.
Afterwards, the Indonesia Shipping Association opposed strongly, pushing down the fees
to the current level.
◦ As for informitization, EDI system is in place. However, for products are to be released,
documents should be printed out and stamped at the field after being sent into EDI, which
watered down effectiveness of the system.
◦ Most import and export cargoes of Indonesia are sent to Singapore Port or Tanjung
Telepas Port (Malaysia) for transshipment for the US and Europe. It seems that Indonesian
ports hardly handle tans shipment cargoes.
◦ Due to road congestion, container truck transportation is available only once in a day for
30 km and the cost is $150. Railway transportation is not low as well at $250 which
includes loading and unloading fees.
◦ As the Indonesian economy grows, cargoes for container transportation is expected to
increase fast rather than bulk transportation.

- 11 -
III. Main Subject-(Target Area Analysis: Korea)
1. Current State of Korean Port and Logistics
1.1. State of Ports
1.1.1. Korean Ports
◦ Korea has a total of 31 trade ports among which are 5 major ports.
- Five major ports include Busan, Incheon, Gwangyang, Pyongtaek and Ulsan Port
and each port has its own Port Authority.
Fig. 2| Korean ports
Source: Korean ports (MLTM, 2012)
<Note>
State management
Local authority management
Coastal port
Busan port
(New)
Ulsan port (New)
Pohang port (Younggil Bay, New)
Donghae-Mukho port Gyongin port
Incheon Port
(North, New)
Pyongtaek-Dangjin port
Janghang port
Gunsan port
Mokpo port (New)
Gyangyang port (New)
Yeosu
port

- 12 -
1.1.2. Busan Port
◦ 10 terminals have been under operation in Busan with five terminals for Busan North
Port and another five for Busan New Port.
Table 7 | Facilies of Busan Port
Jaseongda
e (Phase
1 ,2)
Shinseon
dae
(Phase 3)
Gamman
Terminal
(Phase 4)
Shingam
man
Terminal
Wooim
Terminal
PNIT
(Phase
11)
PNC
(Phase
11,2)
HJNC
(Phase
21)
HPNT
(Phase
22)
BNCT
(Phase
23)
Project
duration
1974~ 1996
1985~1997
1991~ 1997
1995~ 2001
1995~ 1999
1995~ 2006
1995~2009
2001~ 2009
2001~ 2010
2004~ 2013
Project
expenses
₩108.4
billion
₩222.6
billion
₩472.4
billion
₩178.1
billion
₩53.5
billion
₩1.746
trillion
₩388.1
billion
₩411.8
billion
₩510.8
billion -
Opening
1978. 9 (Feeder :
1996.9)
1991. 6 (1 berth :
1997.9)
1998. 4 2002. 4 1996. 9 2006.1
2010. 3
2006.
12 (1-1),
2009. 6(1-2)
2009.2 2010.2 2012.1
Operator
Hutchison Korea
(Corp.)
CJ
Korea
Express
Busan Container
Terminal
SBTC,
BGCT
Dongbu
Busan Container
terminal
(Corp.)
Uam Terminal
(Corp.)
Busan
Newport
Int'l Terminal
Busan New Port
(Corp)
Hanjin New Port
(Corp)
Hyungd
ae Busan New Port
Terminal
(Corp)
Busan
New Port Container
Terminal
(Corp)
No. of
employees 399 529 691 341 210 329 580 600 587 420
Terminal
length 1,447m 1,500m 1,400m 826m 500m 1,200m 2,000m 1,100m 1,150m 1,400m
Handling
capacity
1,700,00
0
TEU
2,000,0
00
TEU
1,560,0
00
TEU
780,000 TEU
300,000 TEU
1,380,0
00
TEU
2,730,0
00
TEU
1,600,0
00
TEU
1,600,0
00
TEU
1,920,0
00
TEU
Berthing
capacity
4 ships
(50,000
ton), 1 ship
(10,000
ton)
5 ships
(50,000 ton)
4 ships
(50,000 ton)
2 ships
(50,000
ton), 1 ship
(5,000
ton)
1 ship
(20,000
ton) 2 ships
(5,000
ton)
3 ships (50,000
ton)
6 ships
(50,000 ton)
2 ships
(50,000
ton) 2 ships
(20,000
ton)
2 ships
(50,000
ton) 2 ships
(20,000
ton)
4 ships
(50,000
ton),
Site size 624,000
㎡
1,288,0
00 ㎡
727,00
0 ㎡
294,00
0 ㎡
182,00
0 ㎡
840,00
0 ㎡
1,286,0
00 ㎡
688,00
0 ㎡
553,00
0 ㎡
785,00
0 ㎡
Source: Busan Port Authority, 2014

- 13 -
◦ As of 2014, container throughput of Busan Port is 18.652 million TEU.
Table 8 | Container Throughput of Busan Port
Cargo 2006
(1,000 TEU)
2007
(1,000 TEU)
2008
(1,000 TEU)
2009
(1,000 TEU)
2010
(1,000 TEU)
2011
(1,000 TEU)
2012
(1,000 TEU)
2013
(1,000 TEU)
Export 3,371 3,702 3,790 3,316 3,923 4,331 4,441 4,530
Export transshipmen
t
2,640 2,943 3,032 2,779 3,345 3,990 4,275 4,515
Import 3,505 3,849 3,958 3,358 4,018 4,402 4,564 4,642
Import
transshipment
2,589 2,882 2,850 2,653 3,126 3,715 3,962 4,247
Sub-total 12,107 13,378 13,629 12,108 14,414 16,440 17,244 17,936
World
ranking 5 5 5 5 5 5 5 5
Source: Busan Port Authority, 2014
◦ Busan New Port development plan
- Construction period: 1995-2020 (Goal: 45 berths, completed development: 23
berths)
- Total investments: KRW 16.682 trillion, government KRW 7.455 trillion, private
KRW 9.227 trillion (Investments by 2011: 9.154 trillion)
Table 9 | Busan New Port Development Plan
Classification Phase
Unloading
Capacity
(1,000 TEU)
Berth Length (m) Operator Developer
Total 15,840 45 14716
North
Container
Subtotal 5,710 13 4300
Phase 11 2,760 3 1200
Busan New Port International
Terminal Private Finance Project
3 800 Busan New Port
Phase 12 1,350 3 1200
Phase 21 1,600 3 1100
Hanjin Shipping New Port BPA 2 1100
Connected
Area
Subtotal 2 700
Connecting
Bridge 1 300
Busan New Port Multipurpose
Terminal Government
Multipurpos
e Terminal 1 400
South
Container
Subtotal 5,160 13 4163
Phase 22 1,600 2 1150
Hyundai Busan New Port BPA 2 1150
Phase 23 1,920 4 1400 BNCT Private Finance Project
Phase 24 1,350 3 1050 To be determined Private Finance Project
Multipurpos 290 2 563 To be determined BPA

- 14 -
e Terminal
West
Container
Subtotal 2,670 9 2713
Phase 25 800 9 700 To be determined BPA
Phase 26 1,290 2 1050 To be determined BPA
Feeder
Terminal 290 3 579 To be determined BPA
Feeder
Terminal 209 2 384 To be determined BPA
Phase 3
Subtotal 2,300 8 2850
West
Terminal 2,300 5 1850 To be determined BPA
General
Terminal 1 400 To be determined Private Finance Project
Multipurpos
e Terminal 1 240 To be determined BPA
Grain
Terminal 1 350 To be determined BPA
Source: Busan Port Authority, 2014
◦ Busan Port introduced the TOC system in 1997. The government held the ownership
while private sector operated the terminals. Since the establishment of Busan Port
Authority in 2004, it took over port development and management from the government.
Private companies are still in charge of terminal operation.
◦ As of 2014, Busan Port handled 75.4% of the total container throughput in Korea
(18,652,000 TEU) and 94.3% of transshipment cargoes (9,997,000 TEU). It adopted
operation method of the private sector for more effective port management. While carrying
out active marketing to attract more throughput, the Port has grown organically with Busan
city based on effective port development.
◦ Busan Port operated 368 global service routes as of 2013.

- 15 -
Table 10 | Busan Port Liner Service
Regopm
Service Route
2009 2010 2011 2012 2013
Japan 58 63 70 68.5 71.5
Southeast Asia 52 72 72 77 85
China 46 51 45.5 45 42.5
North America 42 37 46 50.5 57
South America 23 29 43 39 33.5
Europe 26 26 37 24.5 30
Russia 11 12 13.5 13.5 11
Middle East 7 15 13 12 11.5
Oceania 24 18 27 27 25
Others 1 0 1 1 1
Total 290 323 368 358 368
Source: Busan Port Authority, 2014
1.2. Introduction of the Terminal Operating Company (TOC)
System
1.2.1. Outlines and Current Status of the TOC system
① Outline
◦ Under the TOC system, operation of stated-owned port is transferred to private
companies. Private companies leased from government berths of each terminal, aprons,
yards, and cargo handling facilities en block and operated them. 2
◦ The TOC system is founded on the Harbor Act (Article 30) : A person who intends to
use a harbor facility (excluding beacons; the same shall apply hereafter in this Article)
shall obtain permission from the Minister of Land, Transport and Maritime Affairs, make
a lease contract with a person to whom the Minister of Land, Transport and Maritime
Affairs delegates or commissions operation of the harbor facility (hereinafter referred to
as "harbor facility operator"), or obtain consent from a person who made a lease contract
for the facility (hereinafter referred to as "lessee") for the use of the harbor facility:
2 Si, Girung, Introduction of TOC and Its Significance, Maritime Korea 280 (1997) pp.65

- 16 -
Provided, That a person who intends to use a harbor facility specified by the Minister of
Land, Transport and Maritime Affairs shall report his/her intended use to the Minister of
Land, Transport and Maritime Affairs.3
◦ Moreover, the Ministry of Oceans and Fisheries notified the Regulations on Port Facility
Usage and Use Fees in 2001. The Article 4 (Lease Contract on Port Facility) made it clear
that Minister of Oceans and Fisheries or port management organizations determined rules
on the scope of port facility under lease, terms of lease contract, lease contract period, use
fees and use fee payment.4
Fig. 21| TOC System Operating Structure
Source: See Gil-Woong 1997
◦ For better understanding of the TOC system, it is necessary to review the following three
operation system; Landlord port, Tool Port and Operating Port.5
◦ Landlord Port System: The state (port management body) plans and builds the port and
leases the facility to private port operating companies. Lease fees are set to secure costs
3 The Harbor Act, Article 30 (Use of Harbor Facilities, Service Fees,
etc.)
4 Regulations on Port Facility Usage and Use Fees in 2001, The Article 4 (Lease Contract on Port Facility) 5 Choi, Jaesu, Stories for Shipping History: Introduction of TOC and behind story, Maritime Korea (2002, 10) 126p
Signing of Maritime Transportation
Contract
Shipping company
Cargo handling,
ferriage, other service
Cargo owner
Transportation business (forwarder)
Terminal Operating Company
Government
-Operation of berths, yards, storage -Cargo handling
-Computerization, machinization for terminal operation
- Strategies to attract customers
-Port development, operation master plan
-Waters, seawall, and infrastructure building -Maintaining of port security and order
- Mediation of interests
-City planning
-Opinion gathering
Local community
Cargo delivery/Take-over Cargo delivery/Take-over

- 17 -
and collected from port operating companies. The system was firstly implemented in the
US during the early 1920s and spread to ports around the world as they opted for
containerization.
◦ Tool Port System: The state (port management body) plans, builds, secures and operates
ports and port facilities. The state leases port facility and equipment to stevedoring
companies for a certain period of time and collects usage fees from them.
◦ Operating Port: Singapore Port is the case in point. The state (port management body) is
in charge of the whole process from port planning to its operation.
◦ In its operation type, the TOC system is similar to Land Port system and the principle
stage of port privatization.
② Terminal Operating Company
◦ The TOC system has been implemented in Korea since January 1997. Its target can be
divided into general terminals and container terminals.
◦ Terminal Operating Company for general ports6
- The target was 19 trade ports with leasable facility. 51 terminals at 9 ports
adopted the TOC for the first time.
- Leasable facility included berths, piers, yards (for cargo storage and management),
warehouse, and cargo handling equipment and transportation facility.
- In most cases, general stevedoring companies were chosen as the TOC although
large cargo owners with given cargo handling facility were eligible for the choice.
Certain standards including cargo handling performance were the basis for the
determination and those qualified were put under 'voluntary consultation.'
- Lease period was set at three years. Renewal of the contract was determined after
an evaluation on performance, including efforts for cargo handling mechanization.
Lease fees were based on basic usage fees and determined within the range which
didn't increase the costs.
6 Si, Girung, Introduction of TOC, Its Significance and Future Tasks, Maritime Korea 280 (1997), pp 68-70

- 18 -
- Terminal usage charges followed agreed rates between TOC (ship owner) and
port users (cargo owner) and those decided rates were reported to local port
authorities.
- To ensure fairness and to avoid monopoly, dumping activities, price-fixing,
multiple contracts with other TOCs, efforts to gets around cargoes from certain
ships and shipping companies were banned.
- Public needs dictated each company’s access to the leased facility usage and ship
arrival and departure were controlled or modified to ensure effective terminal
operation. Such measures helped to guarantee 'publicness' of private terminal
operators.
- As of 2014, 42 TOCs were under operation at 45 terminals of 10 ports.
- Local port administration had managed the TOC system since 1997 until parts of
the work were handed down to local port authorities after their establishment.
Since then, TOCs were under supervision of either local port administration or
local port authorities in the so-called dualized system.
◦ TOCs for container terminals
- When the TOC system was introduced in 1997, container terminals were still
managed by the Busan Container Terminal Operation Corporation (BCTOC)
under the Korea Container Terminal Authority (KCTA), an government-affiliated
organization.
- However, needs for privatization increased for faster processing of container
cargoes, better port service and overall competitiveness. Afterwards, privatization
of BCTOC gained the momentum as restructuring of government-affiliated
organization carried out.7
- Private investment flowed for development of container terminals at Busan Port.
Since they were built by private capital, the terminals could be leased for 50 years.
- The Terminal Operating Company (TOC) system is a scheme which combines
features of both public and private ports.
7 Press release, MOF, “Operation right of Jasungdae terminal (Busan) sold to the private”

- 19 -
- The TOC system brings in advantages. It helps balanced port development
nationwide under state control and partly motivates the private to pursue profits,
which brings about effectiveness in port operation. Moreover, the system put
ports under competition.
- One of disadvantages is that realization of effectiveness is limited because the
state (which owns and manages ports) still exerts control over private operators.
In addition, 'proposals on the spot' are commonplace in the port industry, which
can cause excessive competition among TOCs for cargoes.8
1.2.2. Introduction Background of the Terminal Operating
Company (TOC) System
① Requests from the International Bank for Reconstruction &
Development (IBRD)
◦ As cargo containerization proceeded around the world, demand for container terminals
increased. In order to build container terminals, the Korean government took out a loan
from the International Bank for Reconstruction & Development (IBRD). The loan for
Busan Port (1st stage) came with terms and one of them was to introduce the TOC system.
Accordingly, the early type of TOC system was implemented.9
◦ The terminals developed with loan from IBRD were grain terminal, coal terminal, scrap
metal /mineral terminal as well as Jasungdae container terminal at Busan Port (1st
container terminal in Korea). Private companies handled cargoes according to
characteristics of each terminal after Jasungdae terminal was built in 1978. The
government named these terminals as 'development terminals' and prepared regulations on
'development terminal usage fees' differently from other terminals.
◦ Busan Container Terminal Operating Company (BCTOC) was established by a
government-affiliated organization called 'the Container Terminal Management
Corporation' and BCTOC was in charge of operating Jasungdae terminal. However,
independent operation was difficult as BCTOC was under the influence of government.
8 Jung, Bongmin, The Analysis on TOC implementation in Korea and Its Achievements, Maritime & Fisheries, Vol.325,
2004, pp 51 9 Jung, Bongmin, The Analysis on TOC implementation in Korea and Its Achievements, Maritime & Fisheries, Vol.234,
2004, pp 47

- 20 -
◦ The government issued one year contract for exclusive use for grain terminal, coal
terminal and scraped metal/mineral terminal. Those terminals were leased and operated
under the name of 'consigned operation of cargo handling facility'. This made it difficult
that stevedoring companies prepared long-term management plan. Moreover,
characteristics of each cargo limited user base, which thwarted competition with other
terminals.10
② Rising needs for private capital and effectiveness
◦ After Jasungdae container terminal (1st in Korea) opened in 1978, container cargo
throughput increased by double digit. However, congestion of ships and cargoes became
worse as few port facilities were available due to insufficient investment and port
operation was unproductive. Ports were considered as public goods in the past and port
operation by the state was bureaucratic and rigid. Such port operation failed to actively
respond to changing environment.11
◦ Stevedoring companies could not implement mechanization since there were no
unloading/loading places designated for them. Frequent relocation of equipment and
stevedores increased cargo handling costs. In response, the government planned to sharpen
productiveness of port service based on effective port operation in the short-term, while
promoting investment in facilities. This, in turn, raised needs for private capital and their
port development and operation.12
◦ In general, state-owned ports were evaluated to have high service costs and
ineffectiveness. They tended to rely on financial support by the government. For that
reason, the TOC system was introduced with the following purposes;13
- Higher effectiveness of port service: Each terminal is assigned for different
stevedoring companies, which promotes mechanization and specialized terminal
operation. Upmost utilization of cargo handling equipment and yards enhances
port operation. Long-term contract between TOCs and shipping companies makes
10 Jung, Bongmin, The Analysis on TOC implementation in Korea and Its Achievements, Maritime & Fisheries, Vol.234,
2004, pp. 44 11 Si, Girung, Introduction of TOC, Its Significance and Future Tasks, Maritime Korea 280 (1997), pp 66 12 Si, Girung, Introduction of TOC, Its Significance and Future Tasks, Maritime Korea 280 (1997), pp. 67 13 Si, Girung, Introduction of TOC, Its Significance and Future Tasks, Maritime Korea 280 (1997), pp 70-71, Jung,
Bongmin, The Analysis on TOC implementation in Korea and Its Achievements, Maritime & Fisheries, vol.234 (2004),
pp.50

- 21 -
preparatory work possible before cargo loading and unloading and shortens
waiting time within the port. As TOCs can invest in their terminals for facility
expansion, congestion of ships and cargoes can be addressed.
- Competition system for port operation enhances economic benefits: Competition
among nations, ports and terminals leads to better service for users such as ship
owners and cargo owners. This, in turn, achieves reasonable port rates.
- Establishment of comprehensive logistics system: The role of ports has evolved
as the place for simple cargo handling/storage to the base to provide optimized
logistics service. Multimodal transportation brought in various logistics activities
including processing and distribution inside ports. Such comprehensive logistics
system pushed down logistics costs. Since TOCs provide a range of logistics
service, they lay the groundwork to develop into comprehensive logistics
companies.
- Financial resources for port development and maintenance: The government
secures fixed financial resources or lease fees from TOCs and the resources can
be reinvested into port development. The government has smaller management
scope for port operation, being free from administrative and financial burden.
③ Impact of Port Privatization Policies
◦ Since Korea adopted the early type of TOC system in 1979, it has experienced
difficulties in accommodating interests of different businesses as well as voices of port
laborers about port labor supply system. From 1997, the Korean government implemented
deregulation policies with eagerness. As a result, wave of privatization flowed into port
operation.14
◦ For privatization in earnest, stevedoring companies were merged. A new system called
'regular employment system' was introduced under which port laborers became regular
workers of stevedoring companies instead of the labor supply system of the past.15
◦ The labor supply system in the past relied on the daily contract system. It was introduced
14 Si, Girung, Introduction of TOC, Its Significance and Future Tasks, Maritime Korea 280 (1997), pp 67-68 15 Choi, Jaesu, Stories for Shipping History: Introduction of TOC and Behind Story (2)-BCTOC and Company-Labor
Issue, Maritime Korea (2002, 11) p.90
- 22 -
to address irregularities of cargo throughput and demand for port laborers. Under the
system, the labor and the company shared risks and stable supply of port laborers were
ensured. Port labor unions acquired 'Labor Supply Business Permit' from the Ministry of
Labor and send off laborers in working unit (GANG) to terminal operators which
requested port laborers.
◦ Wages were paid 'daily' and per ton of cargoes regardless of working hour or the number
of laborers for the cargoes. There were no official employers on the paper, so port laborers
didn't receive employment insurance. Overall, welfare level of port laborers was far behind
other industries.
◦ Moreover, the port labor union wielded exclusive power of labor supply, hampering
autonomous employment of port laborers by stevedoring companies and their rational
management. As the port labor union held the upper hand over company, normal
company-labor relation was hard to come by.
◦ Accordingly, modernization and mechanization of cargo handling were delayed and the
closed system of port labor union had corruption possibilities. The leadership of the union
held exclusive right to employment and recruitment irregularities continued to rise as a
result. Against this backdrop, regular employment of port laborers was promoted as the
TOC system was being implemented.
◦ At terminals of the TOC system, terminal operators hired members of the port labor
union as regular workers. However, at terminals without the TOC system, such as public
terminals, a manpower management company employed them. This manpower
management company was created by joint investment of stevedoring companies and port
labor suppliers.
◦ As regular employment of port laborers reduced the necessary laborers for cargo
handling, logistics costs were reduced and companies were able to enjoy autonomy.
Resulting mechanization improved productivity and credibility to foreign nations and this
led to an increasing number of ships calling at port as well as investment.

- 23 -
1.2.3. Benefits of introducing the Terminal Operating Company
(TOC) System16
① Port Productivity before and after the introduction of the
TOC17
◦ Detailed data are necessary to compare port productivity before and after the TOC
system was introduced. These data should specify input and output of production elements
of port service, such as mechanization, automation, changes in labor input, throughput
change and cargo handling performance of each port. Unless such data is secured, it is
hard to separate benefits of the TOC system from others.
◦ It should be noted that the following comparison on port productivity include other
benefits from mechanization, automation, and throughput rise as well as benefits from
introduction of the TOC system.
◦ For example, let's compare loading productivity after and before the TOC system. The
averages of 94.9 tons were handled per hour of ship berthing in 1996. However, after the
TOC system was implemented in 1997 the productivity jumped by 13.6% to reach 107.8
tons only in a year. While loading productivity rates at terminals with the TOC system
increased by 4.4% on the annual average, those at public terminals rose only 1.7%. In a
nutshell, effectiveness at terminals with the TOC system improved faster than other
terminals.
◦ The reason behind such faster productivity improvement is the fact that the TOC system
secured stable operation at terminals. Stable terminal operation boosted investment in
16 KMI, “Increasing Entrance of Foreign TOCs and Policy Measures” (2002) p26-34 17 Port productivity index can be divided into partial indicators and aggregate indicators. The former
refers to productivity of certain parts of port and consist ofⅰ) physical indicators, such as waiting time, ship
berthing rates, ⅱ) productivity of factors, such as labor, crane hour, berth hour, and ship hour, and ⅲ)
economic and financial indicators, such as operating revenues and cargo volume. Such partial indicators help
to understand performance of specific factors of ports but are inadequate to estimate productivity of overall
factors. Therefore, comprehensive indicators are being used to quantitatively calculate stochastic frontier
function and distance function. Calculation of comprehensive indicators requires detailed data on input
production factors which are hard to attain. Due to such limitation of data, this report uses cargo handling
volume per ship hour (among partial indicators) as evaluation index for port productivity.

- 24 -
loading facility compared to public terminals. On top of that, terminals with the TOC
system were propelled by profit motive, which stimulated effectiveness of operation more
than others.
◦ Ship waiting time at Gusan Port was dramatically reduced as well from 30.0h (1996) to
7.3h (1997) after the TOC system was in place. Public terminals had to improve their
service to compete with the TOC terminals. As a result, they were able to achieve higher
productivity, too.
② Productivity comparison according to type of the TOC system
◦ The TOC terminals can be divided into those specialized in singe cargo type and general
terminals for various cargoes. Each Terminal Operating Companies (TOC) is separated
into an unitary operating company and a company with multiple businesses. As
aforementioned, the latter consists of human resource business, equipment business and
berth operators and is sub-divided based on stakes of each business. It is similar to
operation of consortium in the past.
◦ The following table showed the results of productivity analysis. As for cargo handling
per ship berthing hour, specialized terminals posted much higher productivity. Even within
specialized terminals, unitary operator handled 392 tons per hour while multiple operator
dealt with only 258 tons. At general terminals, unitary operator managed 120 tons per ship
berthing hour but multiple operator processed just 90 tons.
Table 11 | Productivity Evaluation on TOC Terminals (as of 2002)
TOC Yard (m³)
Pier (m³)
Cargo
handling/ship hour
(ton/h)
Cargo volume (1,000 ton)
Specialized terminal
(9)
Unitary operator
Incheon terminal 4-1 114,636 625 413 41,810
Incheon terminal 4-2 128,761 535 378 27,700
Busan terminal 7-1 20,449 523 122 9,437
Ulsan con terminal 56,552 390 498 8,580
Busan terminal 7-2 33,093 136 425 2,716
Pyongtaek East terminal 198,127 720 518 180,000
Avg. 96,936 488 392 4,504
Multipl
e operator
Busan terminal 4 70,124 1,109 331 70,124
Busan central terminal 30,026 646 284 10,293
Busan terminal 3 62,343 1,145 159 23,628
Avg. 54,164 967 258 34,682

- 25 -
Specialized (total) Avg. 82,679 648 348 41,558
General
terminal (25)
Unitary
operator
Incheon 8-1terminal 42,432 400 165 8,000
Gamchon central terminal 57,232 646 27 11,100
Gusan Hansol CSN 48,715 420 129 11,400
Gusan Sebang 173,475 420 114 31,900
Incheon 5-2 terminal 151,127 880 205 151,127
Ulsan Daewon 17,966 220 91 17,966
Ulsan Shinheungsa 6,460 469 103 6,883
Incheon terminal 6 91,246 750 70 14,380
POSCO 84,706 4,210 263 93,338
Gwangyang POSCO 22,224 4,684.7 373 18,360
Yeosu35 (CJ Korea
express) 1,339 120 19 1,200
Incheon terminal 5-1 31,100 270 167 5,400
Yeosu33 (Sebang) 1,560 120 18 1,560
Gusan SK shipping 33,316 410 80 7,600
Yeosu11(Dong bang) 840 120 3 1,200
Gusan CJ Korea express 163,444 420 91 20,260
Avg. 57,960 910 120 25,105
Multipl
e operator
Pohang terminal 8 64,740 1,298 72 30,000
Incheon terminal 2 102,039 1,442 97 28,240
Incheon terminal 3 105,558 1,250 88 26,585
Masan terminal 4 82,650 1,050 106 40,701
Pohang terminal 7 95,555 1,622 83 37,776
Incheon terminal 8-2 88,578 1,020 157 19,200
Ulsan port 126,469 777 77 26,394
Ulsan terminal 67 44,120 810 65 22,400
Masan terminal 5 31,703 420 66 4,200
Avg. 82,379 1,077 90 26,166
General terminal (total) Avg. 66,751 970 109 25,487
Source: Jung Bong-min, 2004

- 26 -
1.2.4. Structure of Cargo Handling Tariffs(Korea)
① Outline
◦ Cargo handling tariffs are estimated by reflecting costs of cargo handling works at each
port. The Ministry of Oceans and Fisheries (MOF) prepared such standards to be applied
to various cargo types and different kinds of involved works at each port objectively and
consistently. MOF announced the finally approved rates once every year.
◦ The current cargo handling tariffs were approved and announced by the Minister of
Oceans and Fisheries. They are based on the Harbor Transport Business Act (Article 10:
Freight Charges and Fees) and its enforcement ordinance (Article 27)
- Any person who has registered a harbor loading and unloading business shall
determine freight charges and fees as prescribed by Ordinance of the Ministry of
Oceans and Fisheries and obtain approval thereof from the Minister of Oceans
and Fisheries. The same shall also apply when he/she changes them (Article 10 -
1)
- Notwithstanding paragraph (1), any person who has registered a harbor loading
and unloading business shall determine freight charges and fees for freight
loaded and unloaded in harbor facilities designated by Ordinance of the Ministry
of Oceans and Fisheries or for freight falling under items designated by
Ordinance of the Ministry of Oceans and Fisheries, and report them to the
Minister of Oceans and Fisheries, as prescribed by Ordinance of the Ministry of
Oceans and Fisheries. The same shall also apply when he/she changes them.
(Article 10-2)
◦ Cargo handling tariffs put on the characteristics of public utility charges as they affect
national logistics costs. Therefore, their systematization and operation came from
governmental needs for price stabilization. Moreover, increase degrees in cargo handling
tariffs tended to dictate degrees of wage increase for port laborers. As a result, the
approved and announced rates became the standards in wage determination between
company (terminal operator) and labor.18
18 A study on Improvement of stage 4 Entrance Regulations (Finance, transportation, health care and medical sector),
Korea Industry Organization Association, (2011.2), p36

- 27 -
② Process of systematization
◦ Before the Harbor Transport Business Act was implemented in 1963, cargo handling
tariffs were voluntarily managed between cargo owners and stevedoring companies or
modified by the authorities. The Act initiated the rate system and the local Maritime and
Fisheries Authority (the then title) approved the cargo handing rates19 and put the rate
system in operation.
◦ As privatization and port environment changes carried on, new type of cargo handling
tariffs, which were consistent and rational, became required. As a result, the cargo
handling rate system was restructured in 1998.
◦ Background of cargo handling rate restructuring (1998)
- Amid changing industry environment, cargo handling method shifted to
mechanization and automation from manual management of the past.
Accordingly, the rate system was overhauled based on the following reasons.
- Complex cargo categorization: Excessively sub-divided according to container
types and packaging types
- Rate system and irrational application of the rates: Costs failed to reflect
difference between mechanization and manual work as well as difference
between car transportation and manual transportation.
- Irrational extra charges: Extra charges are various and complex according to
types of works and cargoes.
- Unclear applicable standards: Cargo handling costs were poorly reflected due to
manual work and mechanization in the past.
◦ Contents of cargo-handling rates restructuring (1998)
- Work stages and input costs were analyzed based on cargoes of each terminal and
rate structure was simplified for convenience of port users.
19 When the cargo handling tariffs were enacted, local port authority has the final decision right. Today, the MOF (main
authority body) has this right and announces the finally approved rates.

- 28 -
- Cargo handling service was separated for each work stage to mirror adequate
costs as well as to curb cost increase factors. Such rate system restructuring was
geared to sharpen national competitiveness.
- All ports adopted the governmental approval system for cargo handling tariffs as
in the past. However, container terminals could implement the rate report system.
③ Structure of cargo handling tariff system
◦ The approval system at general terminals
- After consultation between stake holders such as company, government and labor,
the government decided and announced the official cargo handling tariffs.
(Approval system)
- The approved rates are the final and notified by the Ministry of Oceans and
Fisheries in March, once a year.
- Cargo handling tariffs should compensate satisfactory costs of stevedoring
companies and should include enough profits for them. The handling costs
incorporate labor costs and general management expenses. The costs are based on
the written wage agreement between cargo handing companies and the port labor
union.20
- The rates are determined based on the Habor Transport Business Act (Article 10:
Freight Charges and Fees) and the Price Stabilization Act (Article 4:
Determination of Public Utilities Charges and Fees), considering price increase
rates, governmental price policies and wage increase rates.
- The approval procedure for cargo handling tariffs is as follows;
- After the tariffs are decided after consultation with stevedoring companies and
the port labor union, requests are made to the local port authority for calculation
standards and other necessary documents.
- The local port authority receives and reviews the documents and transferred them
to the Ministry of Oceans and Fisheries (MOF).
20 Park, Taewon, Rationalization of cargo handling rate system for general packaging products, KMI (2000, 6), p.12

- 29 -
- Based on the transferred plan from the local port authority, the MOF holds prior
discussion sessions along with cargo owners’ organizations and shipping
companies. After gathering the opinions of users and mediated them, the MOF
decides the final cargo handling tariffs.
- The tariffs set by the MOF are finally approved after the last consultation with the
Ministry of Finance and Economy.
◦ The approval system at general terminals
Fig. 4|Computation of Cargo Handling Tariffs at Ports
Source: Korea International Trade Association (KITA)
- Cargo handling rate structure consists of 'basic tariffs,' 'extra charges,' and 'other
charges.' 21 Items of the each cargo handling type (general cargo handling,
special cargo handling and coastal cargo handling) are specified under 'basic
tariffs.' And then, 'extra charges' are separately marked and 'other charges' are
collected for special service.
- General cargo handling tariffs: Rates for traditional bulk cargoes whose handling
cannot be mechanized.
- Special cargo handling tariffs: Rates for mechanized cargo handling works. These
cargoes are divided into cargoes at grain terminal, cars at car ferry, cargoes of
car-only ships, cargoes for special machinery, cargoes at coal terminal, cargo
handling at RO-RO ship only terminal, and cargoes at limestone terminal.
- Coastal cargo handling tariffs: Rates for cargo handling as part of coastal
transportation, instead of trade
21 Cargo handling tariffs (MOF, 2015.3)
Local Port &
Transportation
Association Local Port Authority
Ministry of
Oceans and
Fisheries
Ministry of
Finance and
Economy
Apply
---->
Mediate
------>
Approve-
----->

- 30 -
Table 12 | Structure of Cargo Handling Tariffs
Basic tariffs Extra charges Other charges Standards
General
cargo handling
Divided into cargo handling inside ship, cargo handling with
supplementary ships, and cargo
handling in land
Extra charges for 4
items and 13 work types
Divided into extra work
other than basic cargo handling, flat rate charges
(appropriation for retirement
benefits, port modernization fund) and agreed charges
Work scope, work
distance, timing of rate implementation
Special cargo handling
Divided into 7 cargoes including,
cargoes at grain terminal, cars at car
ferry, cargoes of car-only ships, cargoes for special machinery,
cargoes at coal terminal, cargo handling at RO-RO ship only
terminal, and cargoes at limestone
terminal Different rates for different
terminal
Extra charges for 11 types
Divided into 5 according to cargo type and port
Work scope, work
distance, timing of rate
implementation
Coastal cargo handling
Divided according to packaging
type (incl. containers for coastal
transportation)
Extra charges for 4 items and 8 work types
Divided into extra work other than basic cargo
handling, flat rate charges (appropriation for retirement
benefits, port modernization
fund) and agreed charges
Work scope, work
distance, timing of rate
implementation
Source: Cargo handling tariffs, MOF (2015.03)
- Features of the approved cargo handling tariffs are as follows;
- The rates are applied to stevedoring companies, shipping companies and other
contract parties. Each party is responsible to observe the tariffs.
- Stevedoring companies should show the confirmed rates to the counterpart before
a contract is sealed.
- Stevedoring companies cannot suggest separate rates, citing less cargo volume or
difficulties in cargo handling. They cannot reject to sign a contract.

- 31 -
- Stevedoring companies cannot force separate rates based on their ability to secure
large cargo volume or their supremacy position.
- Contracts based on unapproved rates cannot be signed as a way to set off
unjustified competition.
- The Ministry of Oceans and Fisheries (MOF) should annually monitor
implementation of the approved tariffs as well as the reported tariffs and examine
the actual condition.
- During monitoring and examination, all contract parties should present
application cases of the tariffs (approved/reported).
- The MOF can punish stevedoring companies when they apply charges or rates
different from those approved or reported according to the Harbor Transport
Business Act (Article 26).
- When improvement is necessary for the approved rates, anyone can specify the
reasons in written documents and send them to the MOF before February every
year.22
◦ The report system for cargo handling tariffs at container terminal
- The report system for cargo handling tariffs is an exceptional case of the
approved tariff system (Harbor Transport Business Act, Article 10-2). Under the
system, container cargoes at container terminals should be reported to the
Minister of Oceans and Fisheries and observe the cargo handling tariffs.
- Terminals to which the reported rates are applied are limited to container
terminals.
- The goal of the report rate system is to enhance competitiveness of terminal
operators. Under the system, terminal operators apply their own rates,
differentiating themselves from others.
- Business bodies at container terminals decide cargo handling tariffs for
22 Article 26 (suspension and revocation of registration) Where a harbor transport-related business owner falls under any
of the following subparagraphs, the Minister of Oceans and Fisheries may revoke the registration or suspend the whole or
part of the business with a fixed period not exceeding six months.

- 32 -
themselves. Basically, the rates include costs for work within the main ship,
marshalling costs, and extra charges for work at night or on holidays, bonded
cargo handling fees, additional charges for hatch cover and re-handling fees
within the terminal.
- TOCs or stevedoring companies request documents on cargo handling tariffs and
their detailed estimation from local port authority. The papers should clearly
show rates before and after, date of change and application methods for changed
rates.
- The local port authority hands over submitted documents to the MOF (main
administrative body) and the MOF collects them and evaluates adequacy of the
reported rates.
- The finally approved cargo handling tariffs are notified to TOCs or stevedoring
companies.
- The approved tariff system for container terminals kindled excessive competition
among TOCs, pushing down cargo handling tariffs continuously. The low cargo
handling tariffs worsened financial condition of TOCs. Accordingly, berths were
retuned and some had to close their business. However, large foreign TOCs took
a lion's share of cargo handling works and posted higher sales profits. As such
situation raised concerns for leak of national wealth, the approved cargo handling
tariff system was re-introduced temporarily.
- The following shows how cargo handling tariffs are reported.23
23 Park, Taewon, Institutional Improvement of Korea’s Container Cargo handling tariffs, KMI (2002.5) p.59

- 33 -
Fig. 5|Changing Cargo Handling Tariffs at Busan Port
Source: Measures to normalize the competitive structure of container cargo handling market, KMI
report
- As the number of port facilities, including Busan New Port, continued to increase,
supply exceeded demand. As a result, the report system, whose goal was to
induce competition for higher competitiveness, began losing its intended effects.
The governmental intervention became necessary in public business sector like
port industry and the approval system was known effective in establishing market
order. Thus, cargo handling tariffs at container only terminals became to require
approval from the Minister of Oceans and Fisheries again. The approval system is
to be re-introduced from July 2015 and to be temporarily effective by June 30,
2018.24
24 Article 2 (Exceptions in approving freight charges and fees) Notwithstanding Article 10-2, charges and fees of the
items designated by Ordinance of the Ministry of Oceans and Fisheries should be decided according to 10-1 until June 30,
2018 and should be approved by the Minister of Oceans and Fisheries.
Tariff at North Port
Overall tariffs

- 34 -
1.2.5. Introduction of the Terminal Operation Company (TOC)
System and Overseas Port Operators in Korea
◦ With the introduction of deregulation policies and port privatization since 1997 which
started attracting private capital in port construction, overseas port operators started
expanding its businesses realm into container terminals.
◦ At an early stage, it usually took the form of equity participation in 1998. However, the
acquisition of the rights to operate the existing terminals and the rent of new ones has
become common since 2000. Overseas port operators ventured into not only Busan Port
but also into Incheon and Gwangyang Port in 2002. In case of Gwangyang Port, the
occupancy ratio of overseas operators is more than 50% in terms of facility size and cargo
handling capacity.25
◦ The purposes of opening up the port market and attracting overseas operators can be
analyzed as follows.26
- Increasing the supply of port services through the introduction of overseas capital
(attracting overseas capital to compensate the lack of port development resources)
- Tapping into the advanced management resources (attracting overseas port
operators with superior operation know-how and outstanding marketing ability to
address the issues of domestic companies' lack of port operation know-how and
marketing ability and make an improvement)
- Container ports need to install, control and maintain high performance equipment,
have an appropriate terminal operation system established and attract large-sized
shipping companies in order for effective operation.
- Creation of employment and added values
25 Referred to Korea Maritime Institute, “Policy Measures for Overseas Port Operators' Increasing Entrance to
Korean Market” (2002), p1
26 Referred to and restructured Korea Maritime Institute, “Policy Measures for Overseas Port Operators'
Increasing Entrance to Korean Market” (2002), p15-23

- 35 -
① Effects of Overseas Port Operators’ Advancement into the
Domestic Market
◦ As of now, the seven companies who participate in the operations of Korean container
terminals in any form include HPH (Hong Kong), CSXWT (US), PSA (Singapore),
Evergreen/Uniglory (Taiwan), OOCL (Hong Kong) and ZIM (Israel). OOCL and ZIM
invest a share and the rest directly participate in the port operation.27
◦ Overseas port operators' entrance into the domestic market presents both positive and
negative effects.28
◦ Positive effects
- Introducing capital, cutting-edge equipment and the latest terminal operation
systems
- Job creation / attracting shipping companies and freight volume
- Decrease cargo handling tariff through the introduction of advanced operation
know-how
- Improve service quality and productivity
- Promote market competition
- Promote domestic ports worldwide: HPH, PSA Corp., CSX World Terminal and
Evergreen that are operating in Korea are global brands. Their presence in Korea
presents a good opportunity to let the world know Korean ports are not closed but
rather opening to a certain level, contributing to the port globalization.
27 Referred to Korea Maritime Institute, referred to “Policy Measures for Increasing Overseas Port Operators
in Korean Market” (2002) p24
28 Referred to and restructured Korea Maritime Institute, “Policy Measures for Increasing Overseas Port
Operators in Korean Market” (2002) p26-34

- 36 -
◦ Negative effects29
- Outflow of excess profits overseas
- Raise pay
- Build a market dominance based on an economy of scale and abuse the strength
- The monopoly issue: the possibilities are that if ports are privatized, private
operators will focus on getting profits and do against public interest by
establishing a monopolistic system and exercising market dominance. It could
cause the following issues; increasing port fees, decreasing service quality,
discrimination against small and medium-sized shipping companies and shippers.
- The issue of acquiring publicity: Even if the service is a must to maintain the port
function, operators possibly tend not to provide the service as it does not help
getting profits. The services in example include ship traffic control, reduction of
environmental pollution, ship and cargo safety management. They are necessary
to maintain the port function and to secure publicity.
1.2.6. Implications of the Introduction of the TOC System
◦ The TOC system was introduced in 1997 to increase operational efficiency and is still in
operation. However, improper post-management on the TOC could cause some problems
in the process of choosing and operating the system.30
◦ When the system was introduced in 1997, several stevedoring companies created a
consortium to establish a TOC, which guarantees their own rights and interests to the
maximum level and therefore minimized resistance to this institutional improvement.
◦ Unlike the original purpose, the operation of organization, manpower and equipment had
not been integrated, but been separated by berth for a long period of time even after the
establishment of the TOC system. The TOC has failed to reach an internal integration;
29 Referred to and restructured Korea Maritime Institute, “Policy Measures for Increasing Overseas Port
Operators in Korean Market” (2002) p59-70 30 Referred to and restructure Jeong, Bong-Min, Analysis on Performance of Execution of Korean Terminal
Operation Company System, Maritime and Fisheries Serial No. 234 (2004) pp.57-66, Ministry of Oceans and
Fisheries Port Management Division Internal Data (2012) ‘Improvement Measures of the Terminal Operation
Company System’

- 37 -
rather its operation has been segmented. Therefore, the issue of waste was caused such as
overlapping of manpower and equipment along with the issue of inefficiency, let alone the
un-realization of an economy of scale.
◦ Recognizing the issues, the government authorities and the industry did their best to
integrate the operation. As a result, the system has been transformed into a single
corporation system since May, 1999. However, it was a mere physical integration, short of
achieving a substantial integration among participating companies. The TOC has the form
of a single corporation looking from outside. However, when it is created with more than
two companies, each participant operates its share of the terminal, independently.
Therefore, the private investment for efficient operation and expansion of facility capacity
was limited unlike the original expectations.
◦ While it is important to achieve an economy of scale in terms of port operation,
segmentation of operations by participant within the TOC not only causes inefficiency and
overlapped manpower and equipment but also decreases efficiency of berth and shed use.
That is, severe segmentation of the TOC operation increases operation inefficiency, which
harms the original purpose of the system, which was to increase operational efficiency.
◦ When the system was introduced in 1997, several stevedoring companies created a
consortium to establish a TOC, which guarantees their own rights and interests to the
maximum level and therefore minimized resistance to this institutional improvement.
◦ In case of excess supply, multiple TOCs within the ports will compete each other, which
will lower the service fee. In turn, TOCs who mainly rely on cargo handling tariff come to
have a poor profit structure, which will have them to give up the lease contract. Decreased
service quality will, in the end, make the entire port industry lose competitiveness.
◦ Compared with other ports, Busan Port has relatively many TOCs. Container terminals
are in a fierce competition as they have the same cargo dealing methods and deals with the
same type of cargoes. Therefore, price is their top priority.
- In this fierce competition, they set a lower price and such an excess competition
puts TOCs in a difficult position.
- 38 -
◦ The lease period should be decided based on an analysis on the facilities and equipment
the relevant container terminal operators will invest in and the durable years of the
equipment should be guaranteed. That is, less than 3 years of a short-term lease is
inappropriate to make an investment in the facilities or equipment of the relevant terminal
considering the durable years and you can't expect any improvement in port efficiency in
this case. For port terminal lessee to invest in superstructures including cargo dealing
equipment, warehouse and storage facilities, it is appropriate to set the lease period of at
least 10 years. And the majority of major ports worldwide set the lease period of the
minimum 15 years.
1.2.7. Recommendations for the Introduction of the TOC System
① Development of the Guidelines on TOC Application and
Management
◦ By establishing standards on TOC bidding and contract, where the responsibility of the
operation lies can be clarified and transparency can be secured when renewing the contract.
◦ In order to promote unified operation of the previously berth-based and consortium-
based operators, the evaluation process should review whether the operation is unified
before renewing the contract.31
② Conduct TOC Performance Evaluation
◦ Evaluation process and methodologies on the port operation performances should be
defined to increase productivity and competitiveness of ports through efficient port
operation. In this way, TOCs can be encouraged to voluntarily pursue innovation and
competition.
◦ The companies with the outstanding evaluation can be granted with incentive such as
reduction of rent, but those with poor evaluation are necessarily given with the penalty
such as lease contract cancellation or being rejected from re-bidding.
31 Excerpt from the Ministry of Oceans and Fisheries Port Management Division Internal Data (2012)
‘Improvement Plan for the TOC System' and Article from the [Guidelines on TOC Selection and Management]

- 39 -
Table 13 Considerations in Performance Evaluation
Div. Details
Cargo service satisfaction level Speedy and accurate cargo handling (cargo loading/unloading)
Safe cargo handling
Port facility satisfaction level
Terminal safety and security
Terminal cleanliness
Subsidiary facility services (parking lot, cafeteria, etc.)
Customer service satisfaction
level
Rapid task and request handling
Employee's work attitude
Rapid information provision
Satisfaction about fairness Fair berth allocation and coordination
Others Overall satisfaction with port use
Source: (Ministry of Land, Transport and Maritime Affairs Notification No, 2011-101
③ Reflection of Laws
◦ A clear legal foundation is required for the TOC system based on the above-mentioned
[Guidelines for the Selection and Management of TOC] and [Work Guidelines for the
TOC Performance Evaluation].
④ Countermeasures to Increasing Overseas Port Operators in
Korean Market32
◦ With the increasing overseas port operators in Korean market, some worrisome elements
should be identified in advance along with the countermeasures to the issues.
- Measures to promote fair competition: When overseas port operators expand its
business in Korean port market, their market dominance will increases, which
also increase the possibility that the market dominance is abused. This could
break the order of fair competition, turning the port industry into a monopolistic
market and decreasing productivity. Preventative measures should be installed in
32 Referred to and restructured KMI, “Policy Measures to Increasing Overseas Port Operators in
Korean Market” (2002) p73-84

- 40 -
advance, but the market opening should not be limited in the course. Some
restrictions on the overseas companies’ entry to the domestic market should be
established and the restrictions can be gradually relaxed. In addition, a guideline
on participation shares and market shares is necessary and the regulations that can
be applied to the port industry should be developed based on the Monopoly
Regulation and Fair Trade Act in order to prevent unfair transactions.
- Establish the terms of lease to maintain the order of the port market: If overseas
port operators do not treat cargoes during the lease period or do not conduct the
port functions, it could decrease port efficiency. To prevent this, the penalty
clause should be added to the lease contract to encourage them to contribute to
the port facilitation through cargo treatment activities beyond a mere investment.
Moreover, the minimum port lease period should be stipulated on the contract and
the clause that bans the sales of the rights to operate a port for the purpose of
getting the sales profit should be added to the contract. And the exercise of the
market dominance or unfair transactions should be prevented by adding the
clause to the contract, in which the rights to operate a port can be recovered for
the activities that can disturb the market order. Lastly, the clause that prepares for
an emergency should be inserted in the contract (so that port facilities can be used
as a nation’s critical facility in case of emergency).
- Maximize the overseas capital attraction effects: In order to take a strategy to
attract more cargo volume, one of the ways to attract the maximum overseas
capital, it is necessary to introduce the measures of differentially imposing rent
according to the scale of the cargo volume attracted.
- Strengthen competitiveness of domestic port operators: Domestic operators could
put in a disadvantageous position when they are short of financing capabilities,
operation know-how and marketing abilities compared with overseas counterparts.
Therefore, there should be ways to help domestic operators to strengthen
competitiveness considering the existing competitiveness gap.
- Solve reverse discrimination against domestic companies: A policy should be
established that maintains fairness in treating both domestic and overseas
operators. When the importance of attracting overseas capital and swift attraction
are overly emphasized and too much incentive is granted to overseas companies,
this could give disadvantages to domestic operators.

- 41 -
1.2.8. Policy Suggestion
◦ The TOC system turns the existing government-owned and –operated port operation
system into the government-owned, private-operated system. The new system took effect
from January, 1997 and berth of each unit pier, apron, open-air storage yards, unloading
facilities are entirely leased to a private company with the rights to operate..
◦ The system was introduced with the request from the International Bank for
Reconstruction and Development and an increasing necessity to introduce capital and
efficiency of the private sector to increase port efficiency and with the influence of the
national port privatization policy.
◦ The TOC system was introduced in 1997 and has been still in implementation to enhance
efficiency of port operation. Poor post management of port operators could cause some
troubles in the process of selecting and managing the operators.
◦ When the system was introduced in 1997, several stevedoring companies created a
consortium to establish a TOC, which guarantees their own rights and interests to the
maximum level and therefore minimized resistance to this institutional improvement.
◦ Unlike the original purpose, the operation of organization, manpower and equipment had
not been integrated, but been separated by berth for a long period of time even after the
establishment of the TOC system. The TOC has failed to reach an internal integration;
rather its operation has been segmented. Therefore, the issue of waste was caused such as
overlapping of manpower and equipment along with the issue of inefficiency, let alone the
un-realization of an economy of scale.
◦ Recognizing the issues, the government authorities and the industry did their best to
integrate the operation. As a result, the system has been transformed into a single
corporation system since May, 1999. However, it was a mere physical integration, short of
achieving a substantial integration among participating companies.
- The TOC has the form of a single corporation looking from outside. However,
when it is created with more than two companies, each participant operates its
share of the terminal, independently. Therefore, the private investment for
efficient operation and expansion of facility capacity was limited unlike the
original expectations.
- 42 -
- Severe segmentation of the TOC operation increases operation inefficiency,
which harms the original purpose of the system, increasing operational efficiency.
◦ In case of excess supply, multiple TOCs within the ports will compete each other, which
will lower the service fee. In turn, TOCs who mainly rely on cargo handling tariff come to
have a poor profit structure, which will have them to give up the lease contract. Decreased
service quality will, in the end, make the entire port industry lose competitiveness.
◦ Compared with other ports, Busan Port has relatively many TOCs. Container terminals
are in a fierce competition as they have the same cargo dealing methods and deals with the
same type of cargoes. Therefore, price is their top priority.
- In this fierce competition, they set a lower price and such an excess competition
puts TOCs in a difficult position.
◦ The lease period should be decided based on an analysis on the facilities and equipment
the relevant container terminal operators will invest in and the durable years of the
equipment should be guaranteed. That is, less than 3 years of a short-term lease is
inappropriate to make an investment in the facilities or equipment of the relevant terminal
considering the durable years and you can't expect any improvement in port efficiency in
this case. For port terminal lessee to invest in superstructures including cargo dealing
equipment, warehouse and storage facilities, it is appropriate to set the lease period of at
least 10 years. And the majority of major ports worldwide set the lease period of the
minimum 15 years.
◦ The guidelines on TOC application and management should be established and the
performance evaluation on port operators should be conducted when introducing the TOC
system. And the system should reflect the domestic laws and the countermeasures for the
increasing overseas port operators in Korean market should be developed, as well.

- 43 -
1.3. Busan Port Hinterland Complex Case
1.3.1. Development Background
◦ The modern concept of the port hinterland complex started from the idea that includes
both port free economic zone and delivery center in the US and Europe in the mid-1970s.
As ports perform more various functions and start to provide added value services, ports
were expanded in space to create the hinterland complexes which have both direct and
indirect relations with ports.33
◦ With the increasing demands from the users who hope to get more various services from
port, the functions of the port hinterland started to expand from simple cargo handling to a
part of production process, becoming a critical factor that decides port competitiveness.34
- Not only a simple cargo handling ability but also the varieties of added value
services provided by ports are to be considered when choosing ports.
- As multiple companies move their logistics origin/destinations to hinterland
complex, logistics base, R&D base and manufacturing base tend to be created
around the port areas.
◦ From the perspective of a company, the supply chain that connects from supply of raw
materials to the sales of the products should be established in order to build up a low-cost
production network or production base. Ports have never become more important in this
matter.
- Therefore, the platform is being created in and around the ports for all the
international transaction activities such as procurement, production, sales and
consumption.
◦ The international logistics system established based on the trade and logistics
globalization not only saves logistics cost and time, but also grows fast to create the
maximum logistics added values.
33 Referred to Goetz & Rodrigue, “Transportation Terminals: New Perspectives” (1999) p237-240
34 Referred to IAPH & Spanish Ports Agency, “Guide for Developing Logistics Activity Zones in Ports” (2003)

- 44 -
- This moves the focus of the logistics hub from the warehouse near the
manufacturers to the port hinterland complex.
- Port hinterland complexes create added values and moreover provide global
logistics service to each and every nation around the world.
◦ Port hinterland complex which has both direct and indirect relations with ports was
established to provide a space for industrial or economic activities to port users.
◦ As the logistics functions cluster, Northeast Asian countries spare no efforts to create
industrial complex or new towns in the port hinterlands to attract global companies and to
increase cargo volume.
1.3.2. Current Development Status of Port Hinterland Complex
◦ The establishment of port hinterland complex aims to take the initiative in global
logistics and to strengthen national competitiveness (to create port demands and added
values)
Fig. 6 The process of developing a port hinterland complex plan
Source: (Ministry of Land, Infrastructure and Transport, 2011

- 45 -
◦ The principles are that the government creates the site of the Busan Port Hinterland and
the private developers develop its superstructures.
◦ The following figure shows how an area of demand for the port hinterland development
is calculated.
Fig. 7 Area of Demand Calculation System for the Port Hinterland Development
Source: (Ministry of Land, Infrastructure and Transport, 2011

- 46 -
◦ Busan Port created the 3,503,000㎡ of port hinterland complex as of 2013 and set the
target of creating 4,707,000㎡ by 2020.
Table 14 Plan on Creation and Supply of Port Hinterland Complex
(Unit: 1,000 ㎡)
Total ~ 2013 2014 2015 2016∼2020
Creation Supply Creation Supply Creation Supply Creation Supply Creattion Supply
Busan Port 8,743 5,555 3,530 2,098 506 371
4,707 3,086
․Bukbu(North) 2,226 1,154 1,704 1,044
5 2 110
․Ungdong 2,983 1,806 1,826 1,054 506 371
651 381
․Nambu(South) 1,366 951
1,366 951
․Seobu(West) 2,168 1,644
2,168 1,644
Source: Ministry of Oceans and Fisheries, 2014
1.3.3. Effects of Creating a Port Hinterland Complex
◦ Effects of Creating a Port Hinterland Complex
- Jebel Ali Free Zone (Dubai) houses 6,400 businesses from 120 countries and
creates the employment effects of 160,000.35.
- Rotterdam Port Hinterland houses 2,950 businesses, creating added value36.
- Development of the Busan Port Hinterland Complex has many ripple effects
throughout the local economy including sparking 5.298 trillion worth of
production and 2.1886 trillion worth of added value and creating about 39,437
jobs.37
35 Referred to Korea Maritime Institute, “Research on Port Hinterland Development Measures to Maximize
Added Value Creation” (2011) p83
36 Referred to Korea Maritime Institute, “Research on Port Hinterland Development Measures to Maximize
Added Value Creation” (2011) p80
37 Referred to Park, Heon-Soo, “Effects of the Development of Port Hinterland Logistics Complex on Local
Economy”, Ministry of Oceans and Fisheries Symposium on A Search for Development Direction of Port
Hinterland Complex, (2006)

- 47 -
◦ Busan Port achieved the freight target as planned in 2013 for the hinterland complex.
- The transit cargo volume increased by 37.3% from the previous year and has
tripled from 2010.
Table 15 Increase in Transit Cargo Volume
2010 2011 2012 2013
Volume Growth Rate Volume Growth Rate Volume Growth Rate
320,246 507,210 58.4 661,254 30.4 908,211 37.3
Source: Ministry of Oceans and Fisheries, 2014
1.3.4. Implications and Policy Suggestion
◦ Port hinterland complex must be created along with the port development as it creates
cargo volume and port added values and strengthens port competitiveness.
◦ As internalization and diversification of the integrated shipping system expands the
Global Product Network or (GPN), global companies create logistics, R&D and
production bases in and around the port hinterland complexes.
◦ Port hinterland complexes created in Korea achieve its goals in terms of lease proportion,
employment creation and attraction of foreign investment and the transit cargo volume is
on the rapid rise.
◦ The operation of the port hinterland complex should review the possibilities of the
business models presented by the candidate tenants (or the companies attracted) from
many different angles. And the ways to attract competitive companies should be
considered when selecting the terms of the candidate tenants (or the companies attracted).
◦ As the ports perform various functions and started to provide various added value
services, the necessity of port hinterland complex increases, which has direct and indirect
relations with the ports as it expands the space of ports.

- 48 -
◦ The port users consider not only port’s cargo handling capacities but also the diversity
and possibility of added values provided by the ports as an important element in choosing
a port.
◦ The development of the Busan Port Hinterland Complex generated several ripple effects
throughout the local economy including production inducement, creation of added values
and jobs and it not only increases cargo volume, but also attracts foreign capital.
◦ Therefore, the port hinterland complex is required to be created along with the port as it
generates added values for ports and strengthens competitiveness of the ports.
1.4. Port Master Plan Establishment Case
1.4.1. Background and History
◦ As a background, the central government establishes a mid- and longer-term port
development and promotion plans and a ten-year plan with which a timely port
development is made possible and reviews its validity to revise the plans every 5 years.
- Ports are in fierce competitions. If it is not developed timely but delayed, it
causes a huge social and economic loss.
- Therefore, the establishment of port master plan supports vibrant import and
export and help to be prepared for the insufficient port facilities and increasing
port demands. And the ports can be promoted as a national core strategic industry
for the national economic development.
- Profitability of port development is low for its huge amount of private investment
and the investment involves high risks (initial investment period is 5-10 years,
payback period 50 years).
- It is significant to attract private capital for the port development for diversity.
However, the government-led port development is necessary as it is difficult to
achieve the timely development and the higher security of port facilities only with
private capitals.

- 49 -
- The local government-led port development is appropriate for the local society as
it considers the local conditions in developing the port. However, its poor
financial conditions present a hardship to the development which requires a large-
scale investment. Therefore, the central-government-led investment is necessary
for efficient budget operation.
- The central-government-led master plan prevents overlapping investment that
originates from excessive and irrational desire for development and too much
competition among domestic ports. The government-led balanced port
development helps to improve competitiveness of the national port and logistics
industries.
◦ History of Port Master Plan
Table 16 History of Master Plan on Port
Div Period
(Investment Planned) Details
1st Port Master Plan
(Apr., 1995)
1992-2001
(10 tril. won)
Expansion of port facilities which have sufficient and integrated cargo
distribution functions with the specialization by area.
Turn the government-operated system to private-operated one, increased efficiency thanks to open competition.
2nd Port Master Plan
(Dec. 2001)
2002-2011
(34 tril. won) Nurture hub port that generates demands, develop hub port by area
Continue to liberalize, privatize and commercialize port operations and
introduce the eco-friendly concept, Water Front 2nd Revision
(Dec. 2006)
2006-2011
(21.9 tril. won)
3rd Port Master Plan
(Jul. 2011)
2011-2020
(40 tril. won)
High value added port with logistics, leisure and cultural elements
⋅Re-create the port space as a national core infrastructure based on various functions such as logistics, production, commercial, water front and disaster
prevention
Source: Ministry of Land, Infrastructure and Transport, 2011

- 50 -
1.4.2. Port Master Plan Development Process
Harbor Act Article 5 (Establishment of Port Master Plan)
To promote port development and increase its operational efficiency, the Minister of Land,
Transport and Maritime Affairs should establish and implement the port master plan for the
designated port and the Mayors and Governors should establish and implement the master plan for
the local port every ten years.
Establishment of Port Master Plan (Article 5)
◦ Trade port, coastal port ⇒ every ten years
◦ Consultation among central administrative organization
heads, mayors and governors
↓
Contents of Port Master Plan (Article 6)
◦ Matters about port designation and change
◦ Matters about port facility supply
◦ Matters about size, development period and future demands
of port facilities
◦ Port management, operation plan
◦ Designation of port area and designated development area
↓
Consultation among central administrative organization heads, mayors and
governors (Article 5)
↓
Port Policy Commission (Article 4)
◦ Central Port Policy Council (Minister of Land, Transport
and Maritime Affairs)
◦ Local Port Policy Council (Regional Oceans & Fisheries
Administration Director)
↓
Notification of Port Master Plan (Article 8)
Source: (Ministry of Land, Transport and Maritime Affairs, 2011)

- 51 -
Fig. 8 The Process of Developing Port Master Plan
Master Plan
conception phase
The necessity of developing ports raised and draw up a plan
Increasing port demands
Change in shipping patterns (containerization)
Development request from locals and related organizations
Draw up a development necessity and basic draft
Development
phase
Master plan and validity review
Basic data investigation
Technical data (maritime, water level, geological and soil investigation)
Port status data investigation (facility and operation)
Related plan investigation(land, local, city and industrial conditions)
Cargo volume estimation and function establishment
Analysis on existing performance data (cargo, passenger, etc.)
Economic index review such as GNP and population growth
Review plans of related organizations
Select location and draw up a floor plan (draft)
Select location and floor plan draft
Facility arrangement plan
Behind-the-scene transport network plan
The best location and arrangement plan
Physical and numerical experiment impact assessment
Harbor tranquility, burying, internal erosion investigation
Seawater circulation, water rising and current change
Environmental, transport, fishing damage impact assessment
Establishment of development plan
Various types of structural forms and facades
Process planning
Estimation of business expenses
Draw up a project plan by stage
Technical feasibility review
Review various construction methods, designs and construction ability
Review various construction methods application
Economic feasibility review
Benefit analysis on investment cost by plan
Review each plan’s economic performance
Intermediate and final review report
Meetings among related organizations, port-related organizations
Final review of various technical matters
Confirm and review on matters to be improved
Confirmation
phase
Establish port master plan (draft) and discussion among related organizations
Review and reflect the discussed opinions and confirm the master plan (draft)
Deliberation at the Central Policy Council
Confirm and Notify the Port Master Plan
Source: Ministry of Land, Infrastructure and Transport, 2011

- 52 -
1.4.3. Effects of Port Master Plan Establishment
◦ Increased competitiveness with the timely expansion of port infrastructure (from 33rd in
2006 to 23rd in 2010).
◦ Become the 9th largest trade giant (7th biggest exporter) in the world due to its smooth
handling of import and export cargo (ports handle 99.8% of the total import/export cargo
volumes).
◦ Secure external price competitiveness of import and export goods (reduce port
congestion and cost).
Table 17 Port Demurrage Rate and Cost
Div. 2006 2010
Ship demurrage rate
(over 12 hours) 5.38% 2.92%
Port demurrage,
congestion cost 714.1 bil. won 399.3 bil. won
Source: Ministry of Land, Transport and Maritime Affairs, 2011
1.4.4. Implications and Policy Suggestion
◦ The central government establishes a mid- and longer-term port development and
promotion plan and a ten-year plan with which a timely port development is made possible
and reviews its validity to revise the plan every 5 years.
◦ The establishment of the port master plan will support vibrant import and export with
increased trade volume and will have the ports to be prepared for the chronic lack of port
facilities and increasing port demands.
◦ It is significant to attract private capital for the port development for diversity. However,
the government-led port development is necessary as it is difficult to achieve the timely
development and the higher security of port facilities only with private capitals.
◦ The local government-led port development is appropriate for the local society as it
considers the local conditions in developing the port. However, its poor financial
conditions present a hardship to the development which requires a large-scale investment.

- 53 -
Therefore, the central-government-led investment is necessary for efficient budget
operation.
◦ The central government’s unilateral port development and promotion plans for all the
ports in Korea can prevent overlapped investment and support a timely expansion of port
infrastructure. However, with incorrect estimation about infrastructure demands, the port
operators should suffer worsening profitability due to lack of cargo volume or over supply
along with the issue of idle facilities.
◦ The central-government-led master plan prevents overlapping investment that originates
from excessive and irrational desire for development and too much competition among
domestic ports. The government-led balanced port development helps to improve
competitiveness of the national port and logistics industries.
- The central government’s unilateral port development and promotion plans for all
the ports in Korea can prevent overlapped investment and support a timely
expansion of port infrastructure. However, with incorrect estimation about
infrastructure demands, the port operators should suffer worsening profitability
due to lack of cargo volume or over supply along with the issue of idle facilities.
- It is hard for the central government to reflect each port’s special conditions or
potentials on the port master plan. Therefore it is necessary to gather local
community opinions when establishing local port plans.
- The mismatch between the port functions managed by the central government and
the urban functions managed under the local government could continue to create
a friction between port functions and residential and commercial functions of
nearby cities. Therefore an institution should be established to reflect the opinions
of the local government to address the mismatch issue.

- 54 -
IV. Conclusion
◦ For Indonesia, which is created with approximately 18,000 islands, marine transportation
and efficient operation of ports are important. It takes too long to treat container cargo due
to lack of container cargo handling equipment and hinterland and increasing freight
volume. Therefore, it is necessary to increase port efficiency and reduce logistics cost.
◦ Lack of competition is a major cause behind the high port prices in Indonesia. Multiple
stevedoring companies are in operation without any price competition.
◦ Indonesia’s Commission for the Supervision of Business Competition (KPPU) showed a
huge interest in the Busan Port case and especially about the background and the effects of
the introduction of the TOC system to promote competition within the port. Based on this,
the study aims to introduce related cases and to its implications to Indonesia.
◦ The TOC system turns the existing government-owned and –operated port system into
the government-owned, private-operated one. The new system took effect from January,
1997 and berth of each unit pier, apron, open-air storage yards, unloading facilities are
entirely leased to a private company with the rights to operate.
◦ The TOC System which took effect in January, 1997 was divided for two different
terminals; general terminal and container terminal. The majority of those who are sleeved
for the TOC are general stevedoring companies and large-scale shipping companies with a
fixed cargo handling facility could participate. A certain standards such as cargo handling
history were reviewed to select the TOC through a way of free discussion among the
companies.
- Collusion, dumping, singing multiple contracts and evasion of a certain ship or
evasion of cargo handling of a certain shipping companies are banned to prevent
TOC’s monopoly and to secure fairness.
- The ports are operated by a private company but the publicity required for ports
are secured as the order of the rent facility use can be adjusted according to the
needs of the public and the ship entry/departure order can be also adjusted and
controlled for efficient operation.

- 55 -
◦ The system was introduced with the request from the International Bank for
Reconstruction and Development and an increasing necessity to introduce capital and
efficiency of the private sector to increase port efficiency and with the influence of the
national port privatization policy.
◦ The TOC system was introduced to increase port service productivity, to strengthen
management capability, to increase economic benefits through the introduction of
competitive port operation system, to establish an integrated logistics system and to secure
resources for port development and maintenance.
◦ When the system was introduced in 1997, several stevedoring companies created a
consortium to establish a TOC, which guarantees their own rights and interests to the
maximum level and therefore minimized resistance to the institutional improvement.
◦ It is important to achieve an economy of scale in operating the ports. However, operation
segmentation by participant not only creates overlapping of manpower and equipment and
operational inefficiency but also decrease efficiency of berth and shed use. Therefore,
severe segmentation of the operation unit increases operational inefficiency and makes it
harder to achieve the purpose of introducing the system, which is to improve operational
efficiency.
◦ As a supplementary policy to the TOC system, the guidelines on TOC application and
management should be established, the performance evaluation of the port operators
should be conducted and the solid legal foundation for the system should be clarified. And
the countermeasures for increasing port operators in Korean market should be prepared.
◦ As the ports perform various functions and started to provide various added value
services, the necessity of port hinterland complex increases, which has direct and indirect
relations with the ports as it expands the space of ports. The port users consider not only
port’s cargo handling capacities but also the diversity and possibility of added values
provided by the ports as an important element when choosing a port.
◦ The development of the Busan Port Hinterland Complex generated several ripple effects
throughout the local economy including production inducement, creation of added values
and jobs and it not only increases cargo volume, but also attracts foreign capital. Therefore,
the port hinterland complex is required to be created along with the port as it generates
added values for ports and strengthens competitiveness of the ports.
- 56 -
◦ Port hinterlands created in Korea have many positive effects such as increasing transit
cargo volume, job creation and attraction of foreign investment.
◦ As a background, the central government established a mid- and longer-term port
development and promotion plans and a ten-year plan with which a timely port
development is made possible and reviews its validity to revise the plan every 5 years.
◦ Ports are in fierce competitions. If it is not developed timely but delayed, it causes a huge
social and economic loss. Therefore, the establishment of port master plan supports vibrant
import and export and helps to be prepared for the insufficient port facilities and increasing
port demands. And the ports can be promoted as a national core strategic industry for the
development of the national economy.
◦ It is significant to attract private capital for the port development as it secures diversity.
However, the government-led port development is necessary as it is difficult to achieve the
timely development and the higher security of port facilities only with private capitals.
◦ The local government-led port development is appropriate to consider the local
conditions in developing the port. However, its poor financial conditions present a
hardship to the development which requires a large-scale investment. Therefore, the
central government-led investment is necessary for efficient budget operation.
◦ The central government-led master plan prevents overlapping investment that originates
from excessive and irrational desire for development and too much competition among
domestic ports. The government-led balanced port development helps to improve
competitiveness of the national port and logistics industries.

- 57 -
Reference
Kang, S. J., ([____]. Due Process in Competition Law Enforcement, Proceedings from ICC
Roundtable.
Kang, Dongjun, Bang, Heusuk, Yu, Soohan (2014) A Study on Global Major Liners’ Port Networks, Korea Port
Economic Association 30(1), 73-96
MLTM. (2011) 2011 Port guide.
MLTM. (2011) Notification 2011-101. Evaluation Guidance for TOC Performance
MLTM. (2011) The 3rd National Port Mater Plan
MLTM. (2011.9.19) The 1st Evaluation of TOC Performance at Trade Ports (in 10 years)
MLTM. (2012). The 2nd Port Complex Development Plan
Gwon, Ohsuk. Current Status and Problems of Korea’s Cargo Handling System, Logistics Consultant Program,
Joonang Univ.
Kim, Myongsu. (2005) Strategies for Northeast Asia’s Logistics Base and Double Port Policy, Budget and
Account Committee, National Assembly
Ma, Moonsik, Yoo, Hongsung, Kim, Byungil (2009). A Study on Ripple Effects on Local Economy by
Logistics Complex of Incheon New Port, Korea Port Economy Association, 25(4), 83-106
Park, Taewon (2000) Rationalization Direction for Cargo Handling Tariff System of General Packaging
Products, KMI
Park, Taewon (2002) Institutional Improvements of Container Cargo Handling Tariffs, KMI
Park, Hunsu. (2006) Ripple Effects on Local Economy by Logistics Complex, MOF Symposium on
Development Direction for Logistics Complex
Busan Metropolitan City (2011) Strategies to Attract Global Companies into World Class Logistics City off
Busan New Port
Busan Port Authority (2014) Statistics on Container Cargo Handling and Transportation at Busan Port 2013
Si, Girung, Introduction of TOC, Its Significance and Future Tasks, Maritime Korea 280, 65-71.
Yang, Hangjin, Jang, bonggyu, Jung, Doosik (2005) Central Port Development of Major Ports in Korea, Korea
Port Economy Association 21(1), 23-44
Lee, Donghyun (2009) An Analysis on Korean Port Development Policies (with neoinstitutional approach),
Maritime Policy Study, 24(2), 151-180.
Indonesia MOT and MLTM. (2010) ASEAN Road Map for Maritime Transportation Integration
Jung, Bongmin (2004) The Analysis on TOC implementation in Korea and Its Achievements, Maritime &
Fisheries
234. 47-68.
Jung, Bongmin (2011) Container Port System Changes in Northeast Asia and Their Prospects 26(1), 1-34.
Choi, Jaesun, Woo, Jonggyn, Kim, Minsu, Park, Moonjin (2006), A Study on Improvement Measures for Busan
Port Transshipment System, KMI
Choi, Jaesu (2002, 10) Stories for Shipping History: Introduction of TOC and behind story (1), Maritime Korea

- 58 -
349, 121-128.
Choi, Jaesu (2002, 11) Stories for Shipping History: Introduction of TOC and behind story (2), Maritime Korea
350, 82-92.
Korea International Trade Association http://www.kita.net/fresh_sg/export/cost_info_04.jsp
Korea Ship owners’ Association (2014). Maritime Affair Statistics 2014.
Korea Container Terminal (2004). Impacts of Shanghai and North China’s Development and Responsive
Measures
Korea Port Logistics Association http://www.kopla.or.kr/default.asp
Korea Port Logistics Association (2014) Background of Container Cargo Handling Tariff Approval System, Its
Problems and Future Tasks (for internal meeting)
Korea Maritime Institute. (2002). Policy Measures for Increasing Overseas Port Operators in Korean Market.
Korea Maritime Institute. (2007). A Study on Business Attraction Measures for Port Hinterland amidst
International Division of Labor.
Korea Maritime Institute. (2008). Change in Global Logistics Environment and the Countermeasures.
Korea Maritime Institute. (2009). A Research on Port Operation Performance Evaluation and Improvement
Measures.
Korea Maritime Institute. (2011). A Research on Indonesian Logistics Business In Connection with
Environmental Development.
Korea Maritime Institute. (2011) A Study on Port Hinterland Development Measures for Maximum Added
Values.
Korea Maritime Institute. (2013). A Normalization Measure for the Competitive Composition of the Container
Handling Market.
Korea Maritime Institute. (Oct. 2013). Port and Industry.
Korea Maritime Institute. (Aug. 2013). Port and Industry.
Port Transport Business Act. Ministry of Government Legislation.
Port Cargo Handling Tariffs. (2015). Ministry of Oceans and Fisheries.
Marine Science Education Portal Site. http://www.ilovesea.or.kr/
Ministry of Oceans and Fisheries. (2014). Ports and Logistics Planning Division Press Release.
Ministry of Oceans and Fisheries. (2015). Port Facility Use & Port Transport Business Q&A Session Book.
Ministry of Oceans and Fisheries. Port Management Information System (Port-MIS) : https://portmis.go.kr/
Ministry of Oceans and Fisheries. Shipping & Port Integrated Data Center: https://www.spidc.go.kr/
Gotez, A. & Rodrigue, J.(1999). Transportation Terminals: New Perspectives. Journal of Transport Geography.
7, 237-240.
IAPH & Spanish State Ports Agency. (2003). Guide for Developing Logistics Activity Zones in Ports. V.A.
IMPRESORES, S.A.
Informa. (2012). Containerisation International Yearbook.
Kotra-globalwindow. (2013. 2. 28). Indonesian Logistics Market Expands Opening in 2013.
Lee,(Ed.). (2005). A Study on Port Performance Related to Port Back-Up Area in the ESCAP Region.
UNESCAP & KMI.
The Science Times. Does the Limits to Container Ships Getting Bigger Disappear, 2014. 12. 5.

- 59 -
The World Bank. (2015). Container port traffic Online website : http://data.worldbank.org/
The World Bank. (2015). Container port traffic Online website : http://data.worldbank.org/
UNCTAD. (2014). Review of maritime transport.