Embed Size (px)
Citation preview
1
Laboratory Assessment of Delaminated Polyimide Cable
Personnel
Sandia Personnel participating in this laboratory assessment were: Robert Bernstein, Roger L.Clough, Kenneth T. Gillen, G. Michael Malone, Dora K. Derzon, Alex R. Griego, David Tallant,Manuel Garica, David Wheeler, and Douglas J. Harris. Sandia received cooperation from AirbusIndustries’ Jean-Luc Ballenghien, Dominique Mazzarino, Alcatel Cable’s Jean Pierre Ferlier,Dupont’s James Edman (Dupont),
BackgroundGeneral: Using the Lectromec DelTest®, a breech was found in the LCL-Midspan of the A300aircraft. This bundle was then carefully ‘opened up’ at Sandia National Laboratories by BillLindsey and Robert Bernstein. The bundle was discovered to possess a region that was atypical.A more lengthy description (with pictures), of this can be found in the Chapter 4 of the reportprovided to the working group by Sandia National Laboratories, and will not be repeated in thisdocument.1
Kapton®: Kapton® is a polyimide made by DuPont, sythnesized by the condensationpolymerization of a diamine and dianhydride and can be hydrolyzed, reversibly, by (usually basecatalyzed) H2O (Scheme 1).2
Scheme 1
OO
O
O
O
O
n
OH3N
2H2O
NN
O
O
O
O
O
OH2N
NH2
R
N
O
O
O
O
OH
O
n
Kapton
_ +
4,4'-Oxydianiline1, 2, 4, 5- Benzenetetracarboxylic dianhydride
n
-nH2O
-2H2O
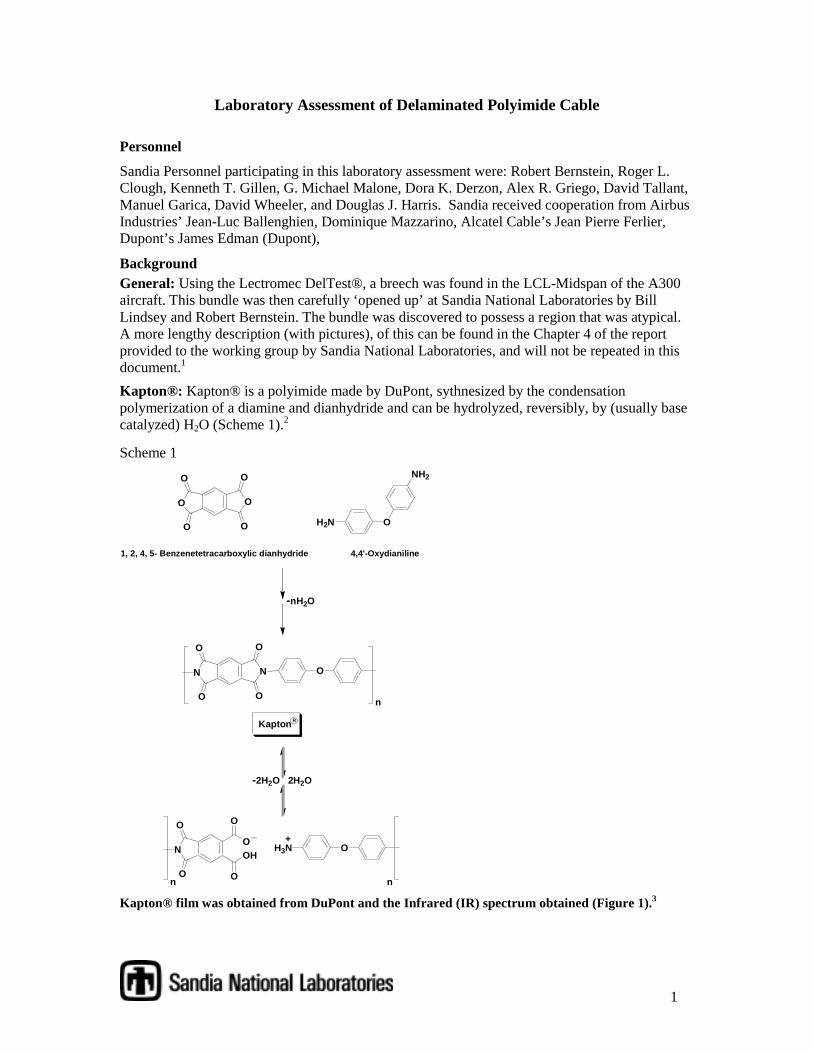
Kapton® film was obtained from DuPont and the Infrared (IR) spectrum obtained (Figure 1).3
2
0
.5
1
1.5A
bsor
banc
e
3500 3000 2500 2000 1500 1000 Wavenumber (cm-1)
1775
1720
1500
1375 1243
1600
Figure 1: IR spectrum of Kapton film.3
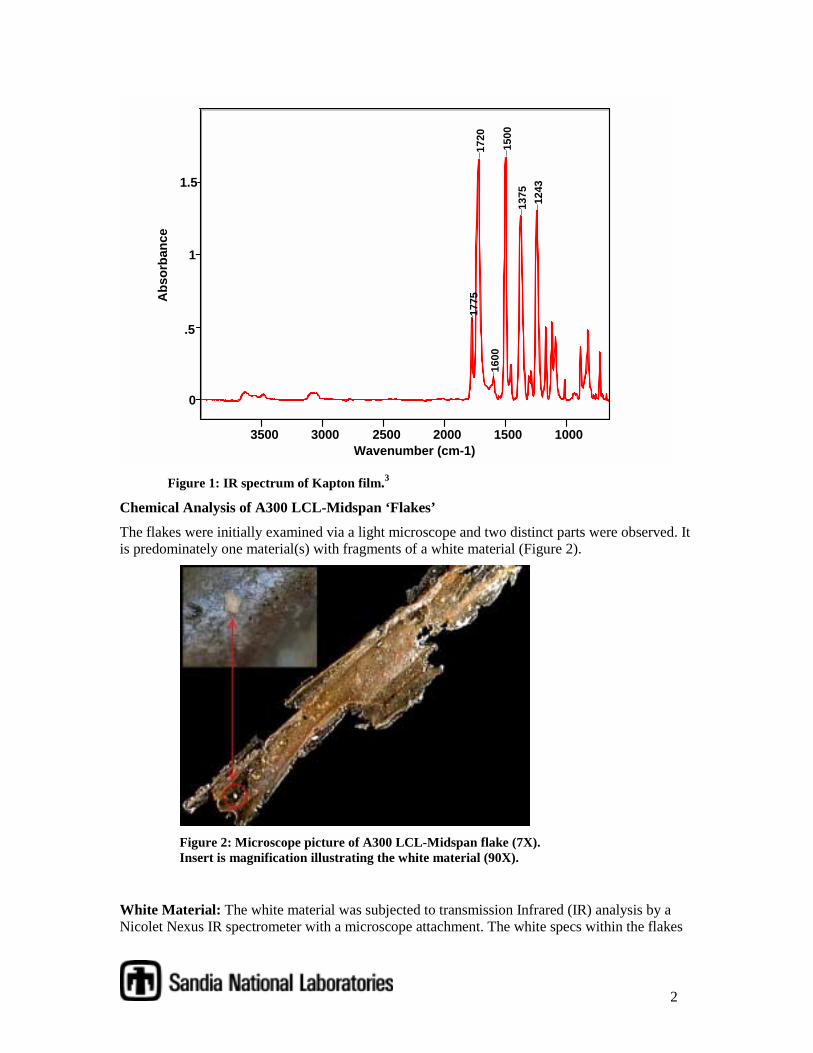
Chemical Analysis of A300 LCL-Midspan ‘Flakes’The flakes were initially examined via a light microscope and two distinct parts were observed. Itis predominately one material(s) with fragments of a white material (Figure 2).
Figure 2: Microscope picture of A300 LCL-Midspan flake (7X).Insert is magnification illustrating the white material (90X).
White Material: The white material was subjected to transmission Infrared (IR) analysis by aNicolet Nexus IR spectrometer with a microscope attachment. The white specs within the flakes
3
were quickly determined to be FEP (fluorinated ethylene-propylene polymer) via IR analysis bycomparing the spectrum to FEP obtained from DuPont (Error! Reference source not found.).4
It is most likely that these FEP flakes came from the outer coat of the wire insulation but there isnot enough data to determine how and why this FEP came apart; thus we will refrain fromspeculating on this matter.
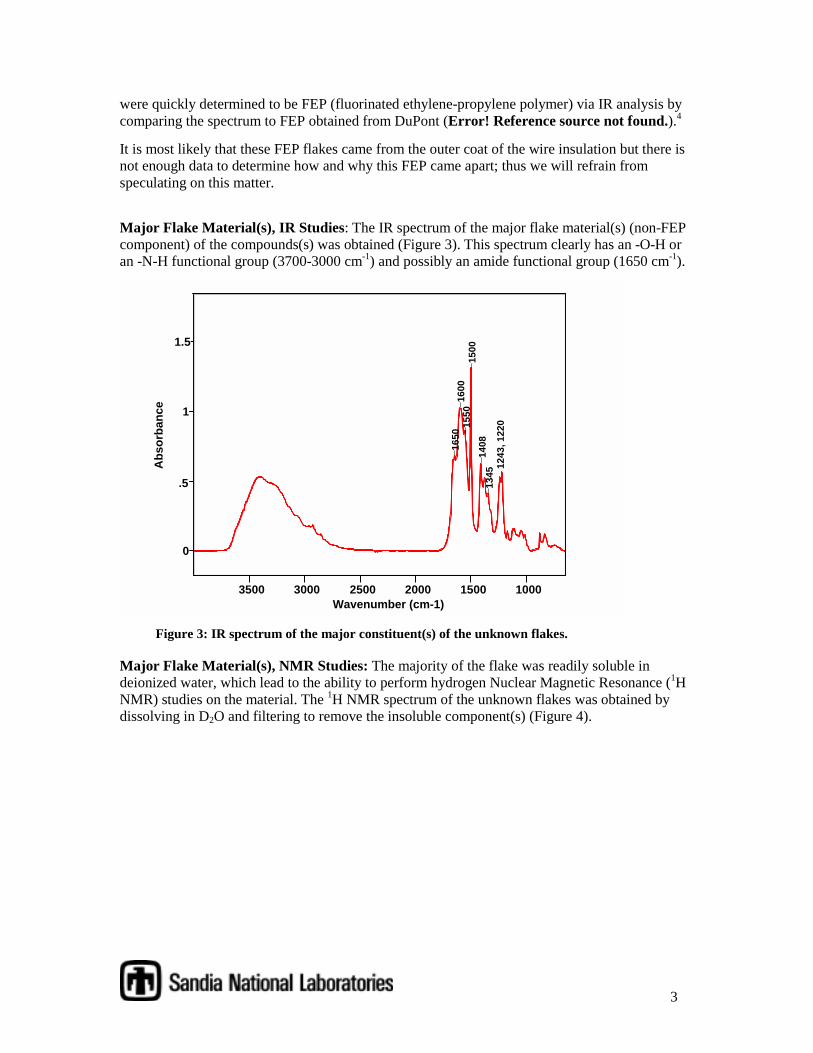
Major Flake Material(s), IR Studies: The IR spectrum of the major flake material(s) (non-FEPcomponent) of the compounds(s) was obtained (Figure 3). This spectrum clearly has an -O-H oran -N-H functional group (3700-3000 cm-1) and possibly an amide functional group (1650 cm-1).
0
.5
1
1.5
Abs
orba
nce
3500 3000 2500 2000 1500 1000 Wavenumber (cm-1)
1600
1500
1650
1550
1345
1408
1243
, 122
0
Figure 3: IR spectrum of the major constituent(s) of the unknown flakes.
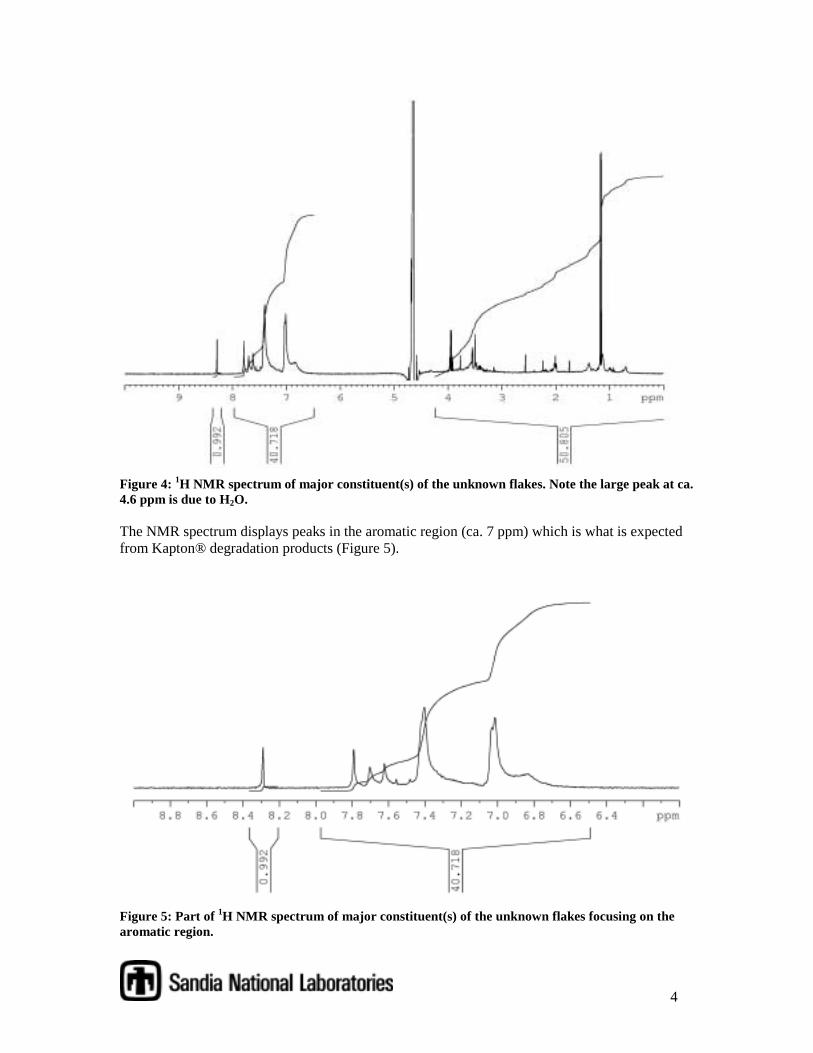
Major Flake Material(s), NMR Studies: The majority of the flake was readily soluble indeionized water, which lead to the ability to perform hydrogen Nuclear Magnetic Resonance (1HNMR) studies on the material. The 1H NMR spectrum of the unknown flakes was obtained bydissolving in D2O and filtering to remove the insoluble component(s) (Figure 4).
4
Figure 4: 1H NMR spectrum of major constituent(s) of the unknown flakes. Note the large peak at ca.4.6 ppm is due to H2O.
The NMR spectrum displays peaks in the aromatic region (ca. 7 ppm) which is what is expectedfrom Kapton® degradation products (Figure 5).
Figure 5: Part of 1H NMR spectrum of major constituent(s) of the unknown flakes focusing on thearomatic region.
5
The unknown spectrum contains very broad peaks. Two possible explanations for this are a‘tumbling effect’ due to a high molecular weight, or a paramagnetic impurity. Either of thesewould result in the broadened peaks.
Comparison Studies, IR Studies: The IR spectrum of Kapton® (DuPont) was obtained, andcomparison of the unknown spectra clearly show that the flake is not Kapton® in its pristine state(Figure 1 vs. Figure 3). This lead to the hypothesis that the flakes could be some derivative ordegradation product of Kapton®.
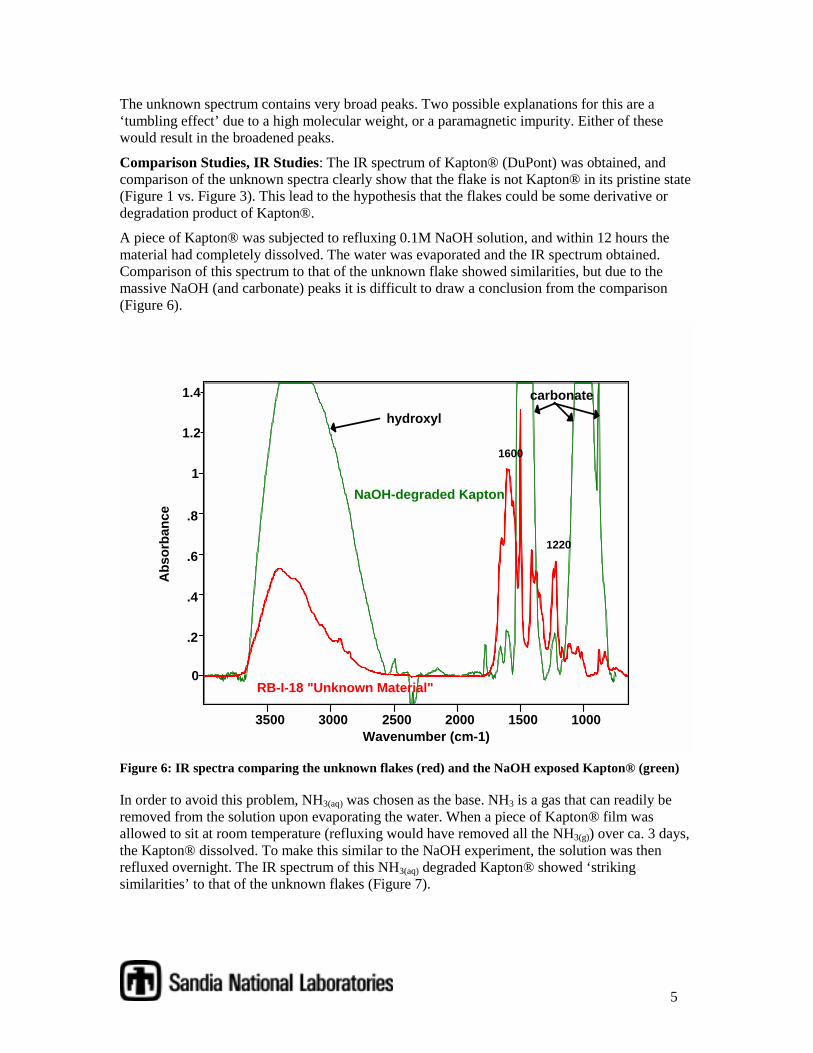
A piece of Kapton® was subjected to refluxing 0.1M NaOH solution, and within 12 hours thematerial had completely dissolved. The water was evaporated and the IR spectrum obtained.Comparison of this spectrum to that of the unknown flake showed similarities, but due to themassive NaOH (and carbonate) peaks it is difficult to draw a conclusion from the comparison(Figure 6).
0
.2
.4
.6
.8
1
1.2
1.4
Abs
orba
nce
3500 3000 2500 2000 1500 1000 Wavenumber (cm-1)
RB-I-18 "Unknown Material"
NaOH-degraded Kapton
hydroxylcarbonate
1600
1220
Figure 6: IR spectra comparing the unknown flakes (red) and the NaOH exposed Kapton® (green)
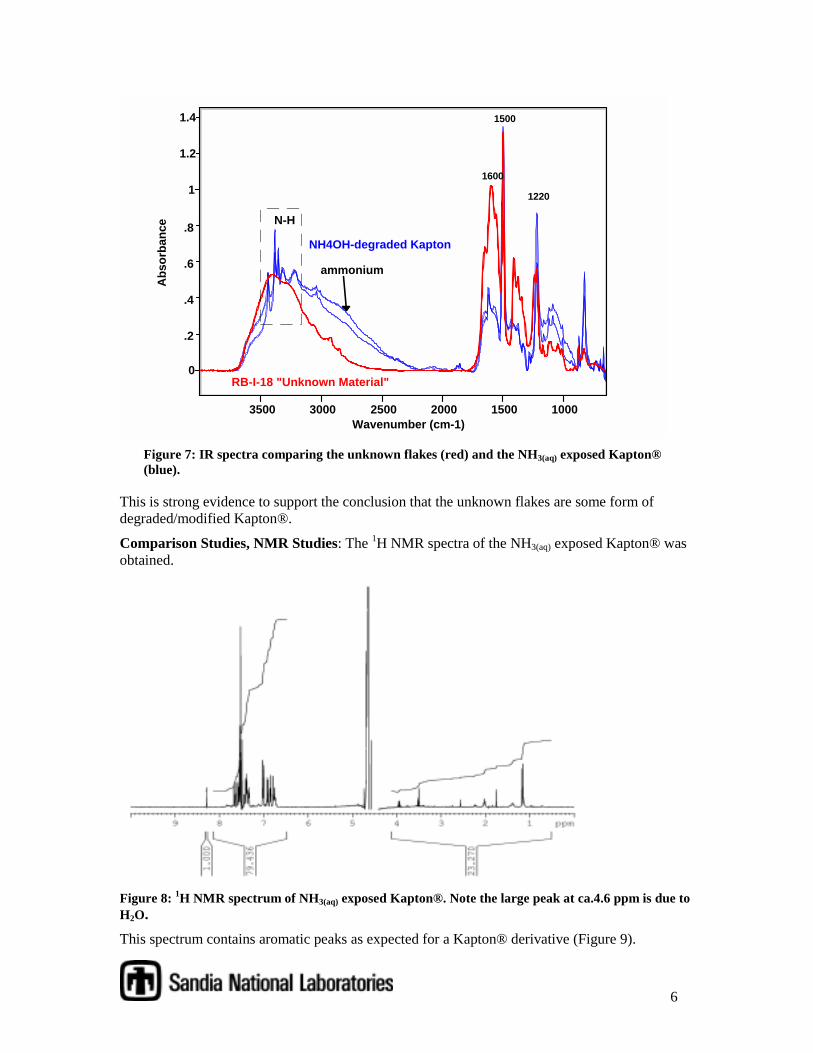
In order to avoid this problem, NH3(aq) was chosen as the base. NH3 is a gas that can readily beremoved from the solution upon evaporating the water. When a piece of Kapton® film wasallowed to sit at room temperature (refluxing would have removed all the NH3(g)) over ca. 3 days,the Kapton® dissolved. To make this similar to the NaOH experiment, the solution was thenrefluxed overnight. The IR spectrum of this NH3(aq) degraded Kapton® showed ‘strikingsimilarities’ to that of the unknown flakes (Figure 7).
6
0
.2
.4
.6
.8
1
1.2
1.4
Abs
orba
nce
3500 3000 2500 2000 1500 1000 Wavenumber (cm-1)
RB-I-18 "Unknown Material"
NH4OH-degraded Kapton
ammonium
N-H
1600
1500
1220
Figure 7: IR spectra comparing the unknown flakes (red) and the NH3(aq) exposed Kapton®(blue).
This is strong evidence to support the conclusion that the unknown flakes are some form ofdegraded/modified Kapton®.
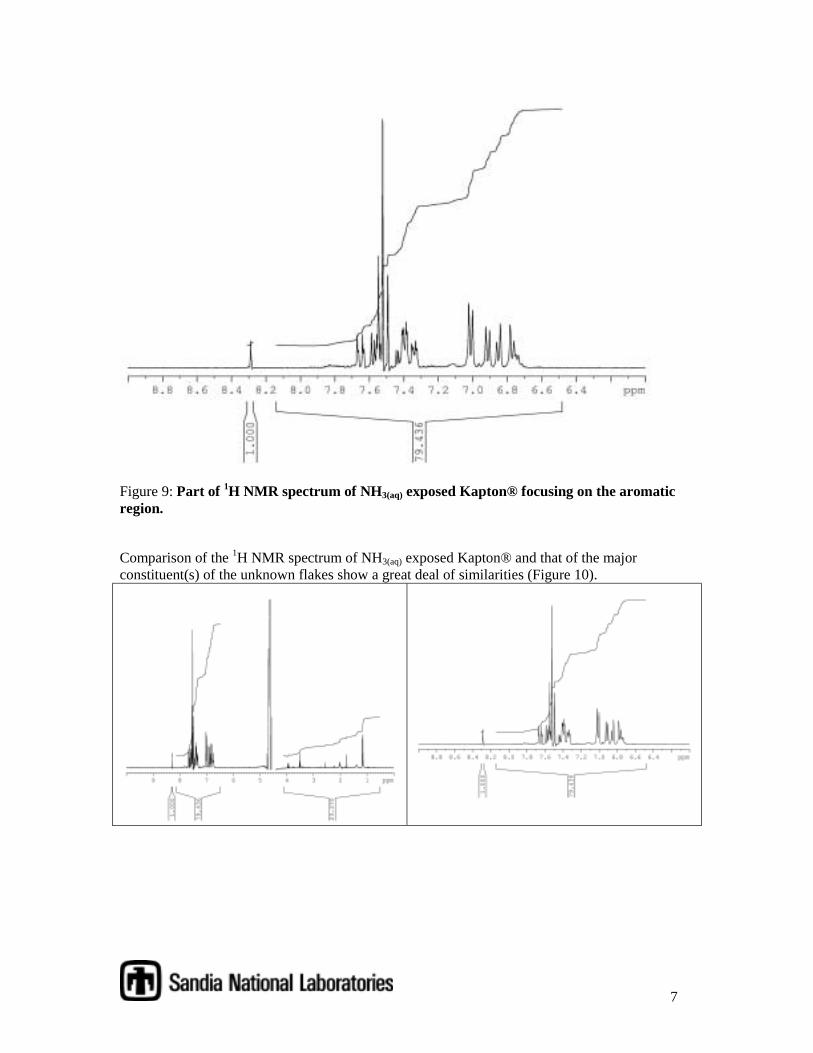
Comparison Studies, NMR Studies: The 1H NMR spectra of the NH3(aq) exposed Kapton® wasobtained.
Figure 8: 1H NMR spectrum of NH3(aq) exposed Kapton®. Note the large peak at ca.4.6 ppm is due toH2O.
This spectrum contains aromatic peaks as expected for a Kapton® derivative (Figure 9).
7
Figure 9: Part of 1H NMR spectrum of NH3(aq) exposed Kapton® focusing on the aromaticregion.
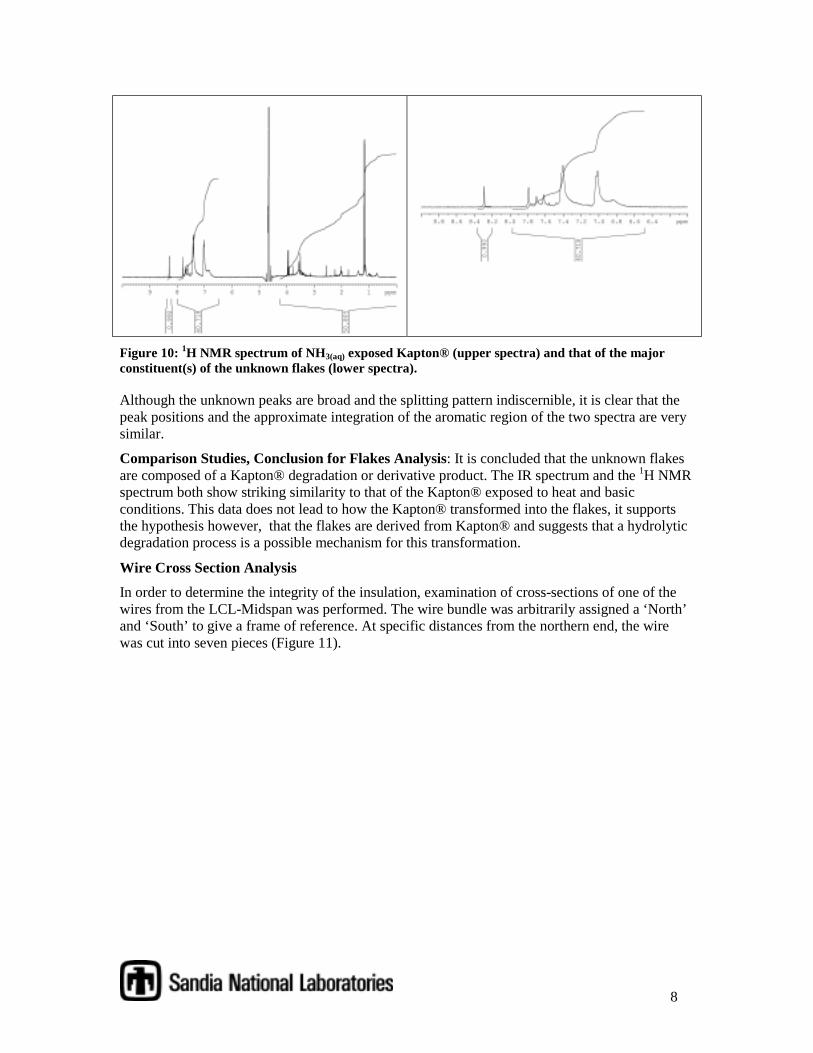
Comparison of the 1H NMR spectrum of NH3(aq) exposed Kapton® and that of the majorconstituent(s) of the unknown flakes show a great deal of similarities (Figure 10).
8
Figure 10: 1H NMR spectrum of NH3(aq) exposed Kapton® (upper spectra) and that of the majorconstituent(s) of the unknown flakes (lower spectra).
Although the unknown peaks are broad and the splitting pattern indiscernible, it is clear that thepeak positions and the approximate integration of the aromatic region of the two spectra are verysimilar.
Comparison Studies, Conclusion for Flakes Analysis: It is concluded that the unknown flakesare composed of a Kapton® degradation or derivative product. The IR spectrum and the 1H NMRspectrum both show striking similarity to that of the Kapton® exposed to heat and basicconditions. This data does not lead to how the Kapton® transformed into the flakes, it supportsthe hypothesis however, that the flakes are derived from Kapton® and suggests that a hydrolyticdegradation process is a possible mechanism for this transformation.
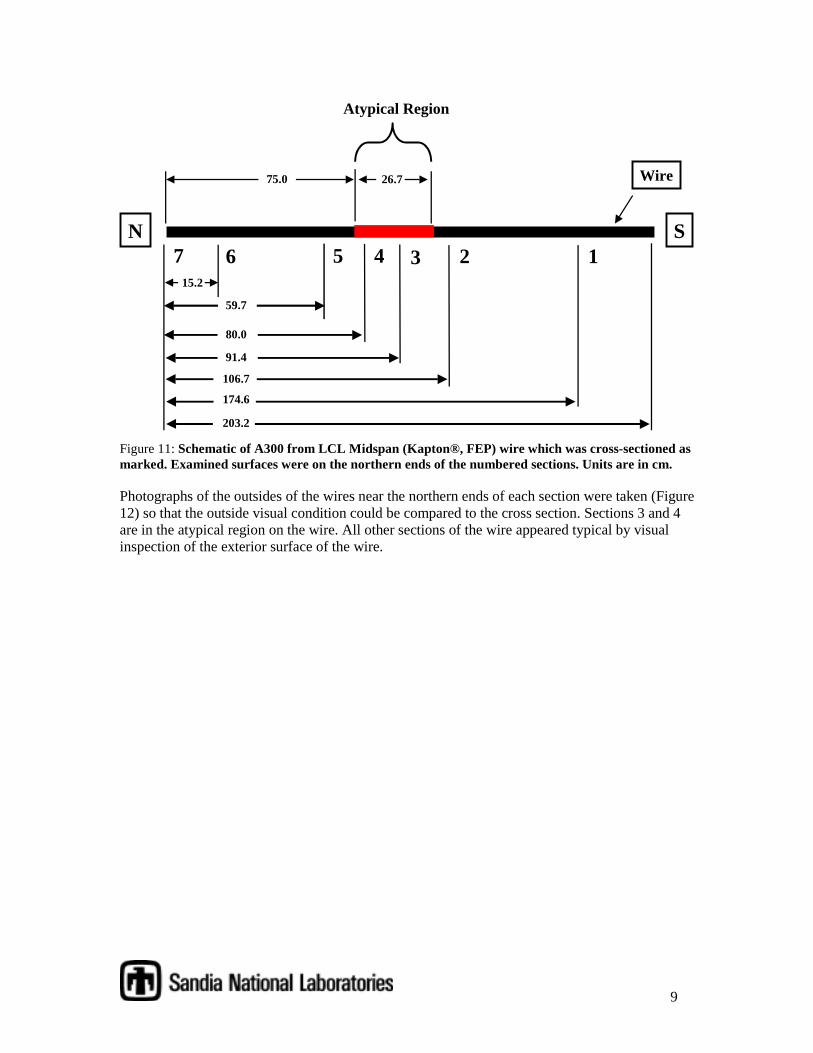
Wire Cross Section AnalysisIn order to determine the integrity of the insulation, examination of cross-sections of one of thewires from the LCL-Midspan was performed. The wire bundle was arbitrarily assigned a ‘North’and ‘South’ to give a frame of reference. At specific distances from the northern end, the wirewas cut into seven pieces (Figure 11).
9
203.2
174.6
15.2
59.7
80.0
91.4
106.7
N123456
Atypical Region
75.0 26.7 Wire
S7
Figure 11: Schematic of A300 from LCL Midspan (Kapton®, FEP) wire which was cross-sectioned asmarked. Examined surfaces were on the northern ends of the numbered sections. Units are in cm.
Photographs of the outsides of the wires near the northern ends of each section were taken (Figure12) so that the outside visual condition could be compared to the cross section. Sections 3 and 4are in the atypical region on the wire. All other sections of the wire appeared typical by visualinspection of the exterior surface of the wire.
10
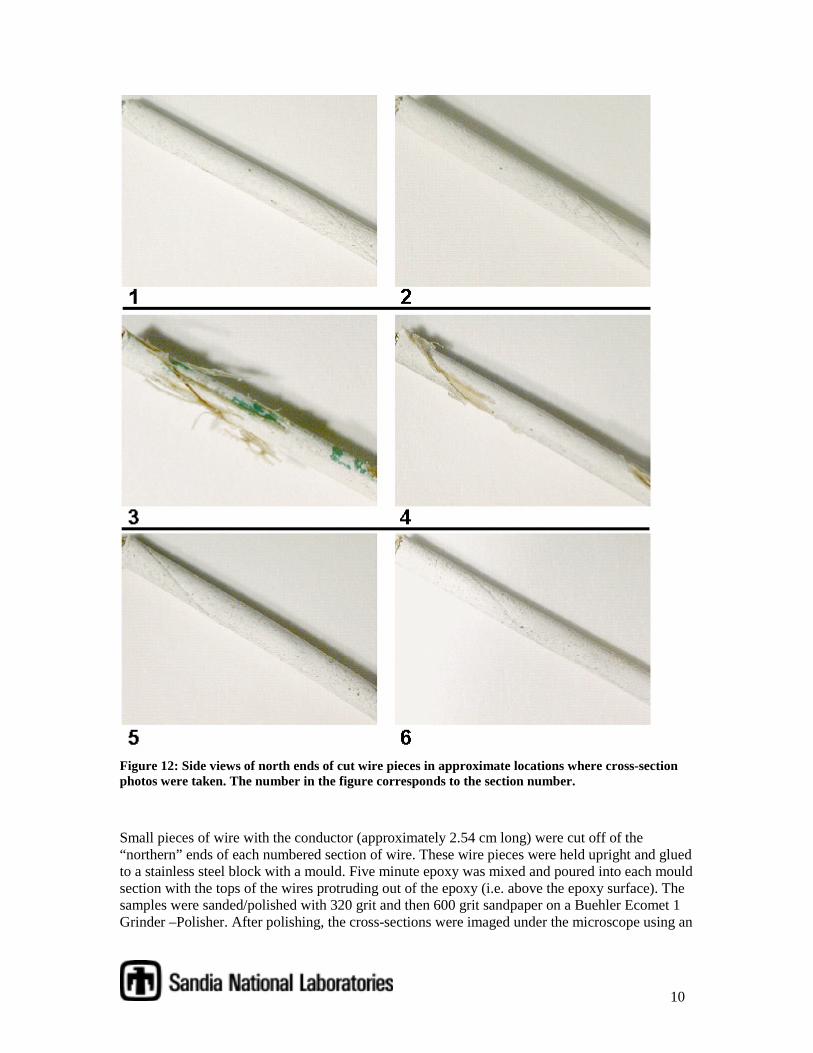
Figure 12: Side views of north ends of cut wire pieces in approximate locations where cross-sectionphotos were taken. The number in the figure corresponds to the section number.
Small pieces of wire with the conductor (approximately 2.54 cm long) were cut off of the“northern” ends of each numbered section of wire. These wire pieces were held upright and gluedto a stainless steel block with a mould. Five minute epoxy was mixed and poured into each mouldsection with the tops of the wires protruding out of the epoxy (i.e. above the epoxy surface). Thesamples were sanded/polished with 320 grit and then 600 grit sandpaper on a Buehler Ecomet 1Grinder –Polisher. After polishing, the cross-sections were imaged under the microscope using an
11
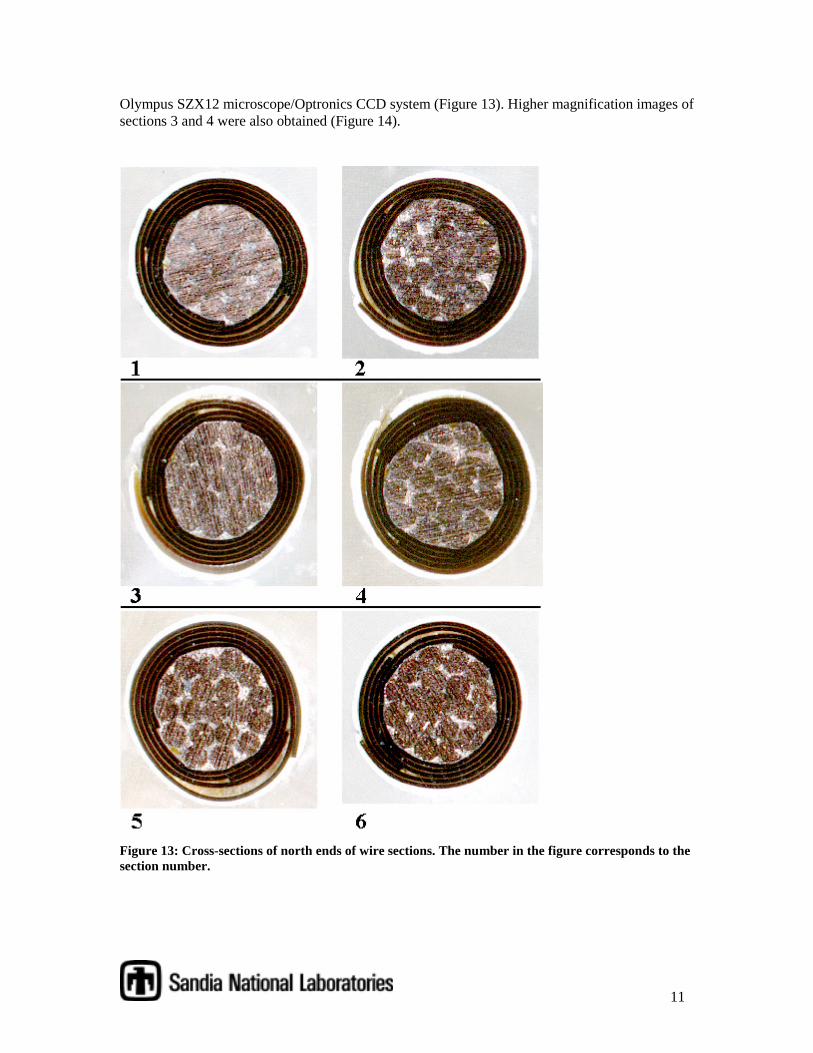
Olympus SZX12 microscope/Optronics CCD system (Figure 13). Higher magnification images ofsections 3 and 4 were also obtained (Figure 14).
Figure 13: Cross-sections of north ends of wire sections. The number in the figure corresponds to thesection number.
12
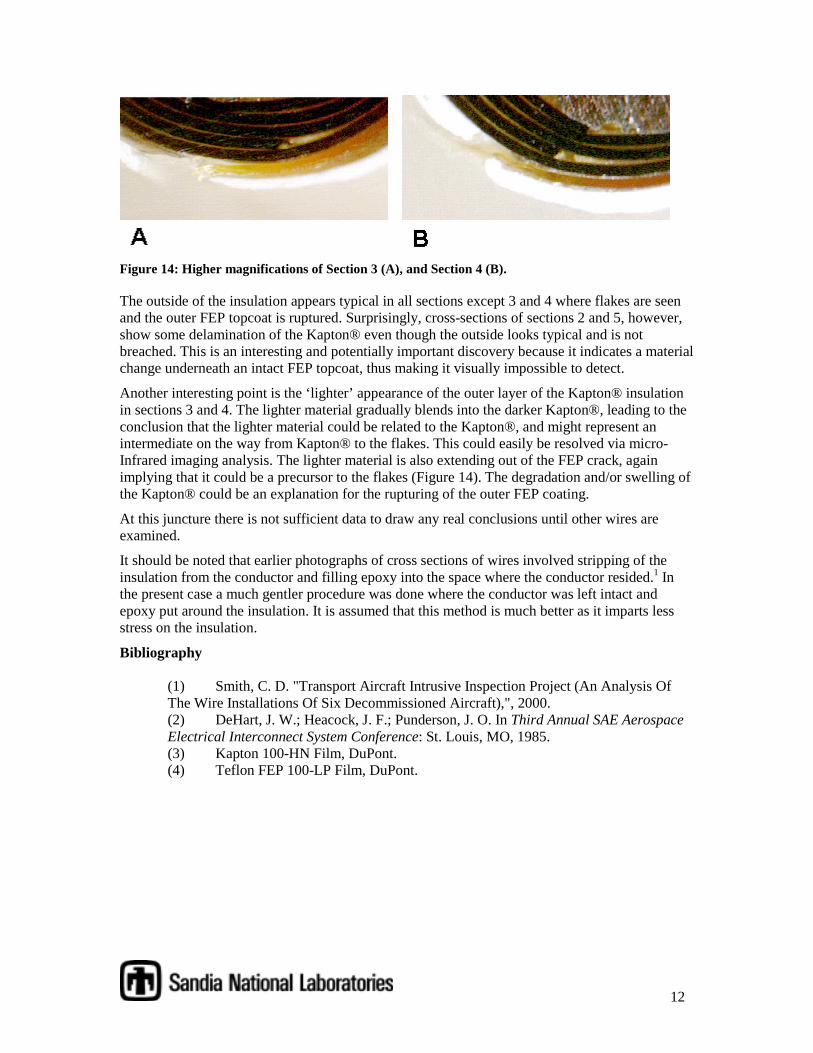
Figure 14: Higher magnifications of Section 3 (A), and Section 4 (B).
The outside of the insulation appears typical in all sections except 3 and 4 where flakes are seenand the outer FEP topcoat is ruptured. Surprisingly, cross-sections of sections 2 and 5, however,show some delamination of the Kapton® even though the outside looks typical and is notbreached. This is an interesting and potentially important discovery because it indicates a materialchange underneath an intact FEP topcoat, thus making it visually impossible to detect.
Another interesting point is the ‘lighter’ appearance of the outer layer of the Kapton® insulationin sections 3 and 4. The lighter material gradually blends into the darker Kapton®, leading to theconclusion that the lighter material could be related to the Kapton®, and might represent anintermediate on the way from Kapton® to the flakes. This could easily be resolved via micro-Infrared imaging analysis. The lighter material is also extending out of the FEP crack, againimplying that it could be a precursor to the flakes (Figure 14). The degradation and/or swelling ofthe Kapton® could be an explanation for the rupturing of the outer FEP coating.
At this juncture there is not sufficient data to draw any real conclusions until other wires areexamined.
It should be noted that earlier photographs of cross sections of wires involved stripping of theinsulation from the conductor and filling epoxy into the space where the conductor resided.1 Inthe present case a much gentler procedure was done where the conductor was left intact andepoxy put around the insulation. It is assumed that this method is much better as it imparts lessstress on the insulation.
Bibliography
(1) Smith, C. D. "Transport Aircraft Intrusive Inspection Project (An Analysis OfThe Wire Installations Of Six Decommissioned Aircraft),", 2000.(2) DeHart, J. W.; Heacock, J. F.; Punderson, J. O. In Third Annual SAE AerospaceElectrical Interconnect System Conference: St. Louis, MO, 1985.(3) Kapton 100-HN Film, DuPont.(4) Teflon FEP 100-LP Film, DuPont.