Embed Size (px)
Citation preview


3Lao PDR 2015 Census-Based Poverty Map – June 2016
Harold Coulombe, Consultant, World Bank
Michael Epprecht, Centre for Development and Environment (CDE)
Obert Pimhidzai, Economist, GPV02, World Bank
Vilaysouk Sisoulath – Director of Research and Analysis Division, Social Statistics Department, LSB
Dr. Samaychanh Boupha - Vice Minister, Head of Lao Statistics Bureau
Phonesaly Souksavath, Deputy Head of Lao Statistics Bureau
Thirakha Chanthalanouvong, Deputy Director General of Social Statistics Department, LSB
Salman Zaidi - Practice Manager, GPV02, World Bank
Copyright © 2016 by Ministry of Planning and Investment, Lao Statistics Bureau
Ban Sithan Neua, Souphanoungvong Road
Vientiane Capital, Lao PDR
Tel: + 856 21 214740; 242023
Fax: + 856 21 242022; 219129
Email: [email protected]
Webpage: http://www.lsb.gov.la
Authors
Supervisors
4 Lao PDR 2015 Census-Based Poverty Map – June 2016
This report documents the construction of, and presents the main results from a poverty map of Lao PDR based on the 2012/13 LECS-5 survey and the 2015 Population and Housing Census. Monetary and non-monetary poverty indicators are presented at two different administrative levels: province and district. The non-monetary poverty indicators – closely related to the SDGs – were easily calculated directly from the Census databases. However, monetary poverty indicators are more challenging to compute as no income or expenditure information was collected by the Census. Based on a statistical methodology linking survey and Census datasets, poverty headcount and other monetary poverty indicators have been estimated at local levels. Two main findings stand out from the analysis of the results. First, the results show that for most indicators there is a relatively high level of heterogeneity across provinces and districts. Variations in poverty level (monetary or not) raises the possibility of more efficient geographical targeting. Second, we found that correlations between the different indicators are quite low in most cases. In such circumstances, policy makers need to have indicators specific to different projects or programmes. A one-size-fits-all indicator does not yield efficient outcomes for any intervention.
Abstract
5Lao PDR 2015 Census-Based Poverty Map – June 2016
Over the last four years, the Lao Statistics Bureau has conducted two major activities that significantly improve our understanding of poverty in the Lao PDR. The fifth round of the Lao Expenditure and Consumption Survey (LECS 5) was conducted over a 12 month period spanning 2012 and 2013, and then the third national Population and Housing Census was conducted in 2015. Based on the former, the Lao Statistics Bureau and the World Bank Group published a poverty profile in 2014. It provided an update of poverty statistics from previous surveys and presented poverty estimates at the provincial level. Such information is very useful to monitor poverty over time and across provinces but does not permit to identify variation in poverty within districts or pinpoint where poverty is concentrated at the local level. The 2015 Population and Housing Census data was therefore combined with the LECS 5 using a sophisticated and reliable small-area statistical technique that made it possible to estimate poverty rates at the local level and therefore improve our knowledge of poverty at lower administrative levels and reveal pockets of poverty. Such local-level information greatly increases the targeting efficiency of projects and programs aiming at reducing poverty.
This report presents poverty indices at the district level based on small-area estimations, and uses the results to present maps of poverty in the country. Acknowledging that poverty is multi-dimensional, this report also presents non-monetary indicators that fit perfectly in the recently approved Sustainable Development Goals (SDG) framework.
This report is a product of a joint collaborative effort among the Lao Statistics Bureau (LSB), the Centre for Development and Environment (CDE) and the World Bank Group. It was made possible with financial support from the Australian Government, Department of Foreign Affairs and Trade, the Swiss Agency for Development and Cooperation through financing of the Lao DECIDE Info Project and the World Bank Group, through the LAOSTAT Project. The Lao Statistics Bureau greatly appreciates both the support received from these organizations and the great collaboration that ensured.
As this report comes at the start of the implementation of the 8th National Socio-Economic Development Plan, it is my hope that the results presented here will be used to prioritize the poorest districts and target programs to areas most in need, be it in terms of lack of income, or in terms of low level of education and employment activities or simply as not having basic infrastructure. The findings presented here will also serve as a benchmark for monitoring progress in reducing poverty during the implementation of the 8th National Socio-Economic Development Plan.
Dr. Samaychanh Boupha, Vice Minister, Head of Lao Statistics Bureau
Foreword
6 Lao PDR 2015 Census-Based Poverty Map – June 2016
Table Of Contents
I. Introduction 8
II. Poverty Mapping Methodology 10
Monetary Poverty 10
Non-monetary Poverty 10
III. Results 11
Monetary Poverty Indicators 11
Non-Monetary Indicators 18
Relationship between the Different Poverty Indicators 22
IV. Concluding Remarks 24
References 25
Appendix 1: Monetary Poverty Methodology 26
First stage 26
Second stage 26
Third stage 27
Appendix 2: 30
Databases and Lao PDR Administrative Layers 30
Census 30
LECS-5 Survey 30
Administrative Layers 31
Appendix 3: Monetary Poverty Methodology in Practice 32
Stage 1: Aligning the data 32
Stage 2: Survey-based regressions 32
Stage 3: Welfare indicators 34
How low can we go? 34
Appendix 4: Survey-Based Regression Models 38
Appendix 5: Administrative Unit Labels 43
Appendix 6: Monetary and Non-Monetary Maps at Different Administrative Levels 46
Appendix 7: Correlation Matrix between the different Poverty Indicators 89
Appendix 8: Monetary Poverty Indices, by Province and District 91
Appendix 9: Non-Monetary Indicators (Education), by Province and District 100
Appendix 10: Non-Monetary Indicators (Others), by Province and District 108
8 Lao PDR 2015 Census-Based Poverty Map – June 2016
This report documents the construction of, and
shows some results from, a monetary poverty
map based on data from the 2012/13 Lao
Expenditure and Consumption Survey (LECS-
5) and the 2015 Population & Housing Census.
Based on a methodology developed by Elbers,
Lanjouw and Lanjouw (2003), we calculate
monetary poverty indicators at low levels of
aggregation, using the detailed information
found in the survey and the exhaustive coverage
of the population found in the Census. Results
for the 18 provinces and 148 districts are
presented and briefly analysed in this report.
In past decades poverty profiles1 have been
developed into useful tools to characterise,
assess and monitor poverty. Based on
information collected in household surveys,
including detailed information on expenditures
and incomes, these profiles present the
characteristics of the population according
to levels of monetary and non-monetary
standards of living, while helping to assess the
poverty reducing effect of some policies and
to compare poverty levels between regions or
groups or over time. While these household
survey-based studies have greatly improved
our knowledge of welfare levels of households
in general and of the poorer ones in particular,
the approach has a number of limitations. In
particular, policy makers and planners need
finely disaggregated information in order
to implement their anti-poverty programs.
Typically, they need information for small
geographic units in order to optimize the
efficiency of their decisions. Telling Laotian
policy makers that the neediest people are in
the rural areas would not be too impressive,
since that information is well known and not
very useful because it is too vague; telling
them in which districts the poorest households
are concentrated would be more useful and
convincing! Using regional information often
hides the existence of poverty pockets in
otherwise relatively well-off regions, leading
to poorly targeted programmes. Inefficient
targeting could also occur if relatively well-off
areas are contained in otherwise poor regions.
Having better information at the local level
would necessarily minimise leaks and therefore
permit more cost-effective and efficient anti-
poverty programmes. Poverty indicators are
needed at a local level as spatial inequalities
can be considerable within a given region.
For a first time, such information was
developed in 2007 using small-area estimation
techniques producing high-resolution poverty
maps based on 2005 Lao PDR Population
and Housing Census data and 2002/3 Lao
Expenditure and Consumption Survey data
(Epprecht et al, 2008). Spatially disaggregated
poverty indicators have not been updated
since.
The methodology used in this report to compute
up-to-date monetary poverty indicators at
a high level of spatial disaggregation using
I. Introduction
1 See Pimhidzai et al. (2014) for the latest published poverty profile in Lao PDR.
9Lao PDR 2015 Census-Based Poverty Map – June 2016
information on household expenditure, is fully
consistent with poverty profile figures, and
permits the computation of standard errors
for these poverty indicators. Since these types
of poverty maps are fully compatible with
poverty profile results, they should be seen as a
natural extension to poverty profiles, a way to
operationalise poverty profile results.
Apart from monetary poverty indicators, this
report also presents a series of non-monetary
indicators, many of them being Sustainable
Development Goal (SDG) indicators. From the
Census database it is possible to compute
29 non-monetary indicators at the same
administrative levels as the monetary
indicators (province and district).
The paper is structured as follows: we first
present the methodology used to compute
the monetary and non-monetary poverty
indicators in less technical language. Section
3 follows, containing the main results for the
monetary and non-monetary indicators. In
the last section some concluding remarks
focus on the policy implications of the different
findings. More technical presentations of the
methodology and how it was applied in practice
are found in Appendices 1 to 4. The results
are presented in two different ways, maps
(Appendices 5 and 6) and tables (Appendices 8,
9 and 10). Appendix 7 presents the correlation
matrix between the different indicators.
10 Lao PDR 2015 Census-Based Poverty Map – June 2016
The indicators presented in this report use two
different methodologies, one for the monetary
poverty indicators and a second for the non-
monetary indicators.
Monetary Poverty
The basic idea behind the methodology is
rather straightforward. First a regression
model of per-capita expenditure is estimated
using LECS-5 survey data, limiting the set
of explanatory variables to those that are
common to both that survey and the latest
Census. Next, the coefficients from that model
are applied to the Census data set to predict
the expenditure level of every household in the
Census. And finally, these predicted household
expenditures are used to construct a series of
welfare indicators (e.g. poverty level, depth,
severity, inequality2) for different geographical
subgroups.
Although it is conceptually simple, proper
implementation of this methodology requires
complex computations. These complexities
mainly arise from the need to account for
spatial autocorrelation (expenditures of
households within the same local area are
correlated) and heteroskedasticity in the
development of the predictive model. Taking
into account these econometric issues
ensures unbiased predictions. A further factor
making computation non-trivial is our desire
to compute standard errors for each welfare
statistic. These standard errors are important
because they tell us to what extent we can
disaggregate the poverty indicators. As we
disaggregate our results at lower and lower
levels, the number of households to which the
econometric models are applied decreases as
well, therefore they yield less and less precise
estimates. At a certain point, the estimated
poverty indicators become too imprecise to
be used with confidence. Computation of
standard errors helps us decide where to stop
the disaggregation process. The methodology
used to estimate monetary poverty is further
discussed in more technical terms in Appendix
1, while the datasets used are described in
detail in Appendix 2. Appendices 3 and 4
show intermediate output in producing these
monetary poverty indicators and argue that
our results are reliable.
Non-Monetary Poverty
Contrary to the monetary poverty indicators,
which are very complex and time-consuming to
compute, the non-monetary indicators are very
straightforward to calculate and do not involve
any estimation procedures. In most cases we
simply take the proportion of individuals or
household with a particular characteristics,
like having electricity at home, for example.
2 Although a series of inequality measures were computed at the local level, the results are not presented in this report.
Inequality at the local level is rather difficult to analyse and its interpretation can be misleading. However, inequality
measurements are available to researchers on request.
II. Poverty Mapping Methodology
11Lao PDR 2015 Census-Based Poverty Map – June 2016
3 These three poverty indices are part of the FGT class of indices as developed by Foster et al. (1984)
III. Results
This section presents the main results for both
the monetary and non-monetary indicators.
Monetary Poverty Indicators
Based on the methodology described in the
previous section and in Appendices 1 to 4, we
obtained a series of poverty estimates for each
province and district in Lao PDR. Those results
can be found in Appendix 8. In these tables
we present the three most common poverty
indices found in the literature as well as in
the latest Lao PDR Poverty Profile: poverty
headcount, poverty gap index and poverty
severity index3. Along with these poverty
estimates for each administrative unit, we also
present the population and the number of poor
people. We converted these poverty figures
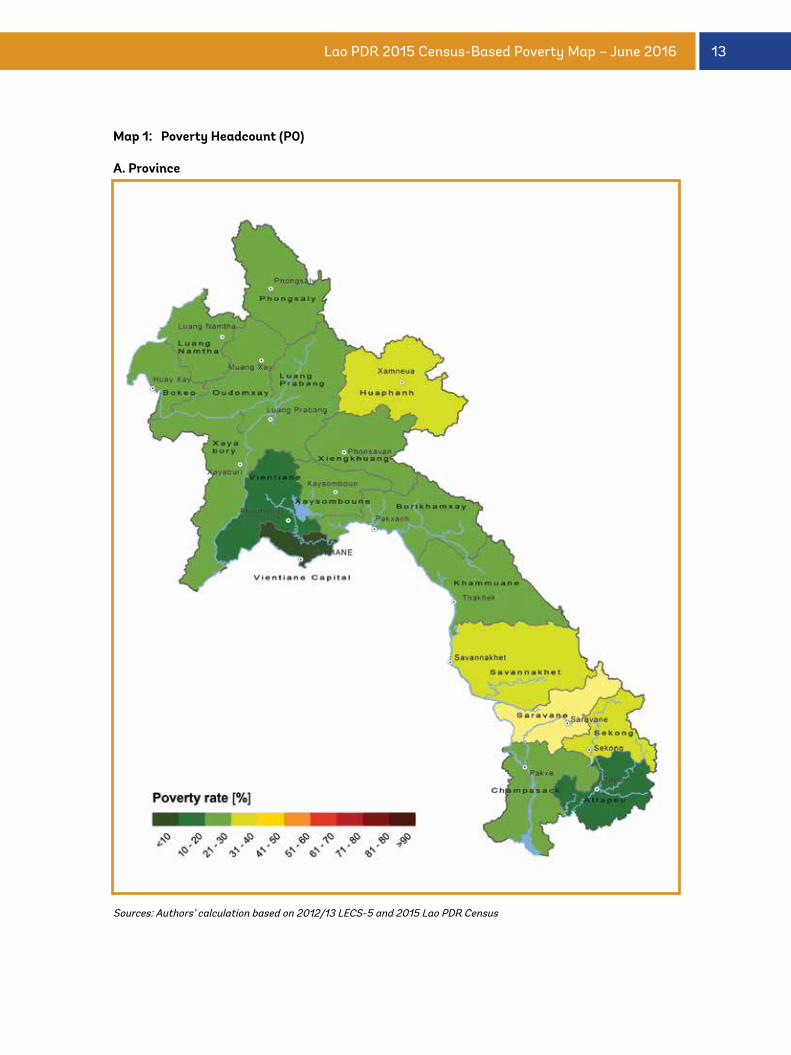
into a series of maps for each administrative
unit under study. Maps 1a and 1b present
the poverty headcount estimates while the
poverty gap index maps are found in Appendix
6 (Maps 2a and 2b). In order to better identify
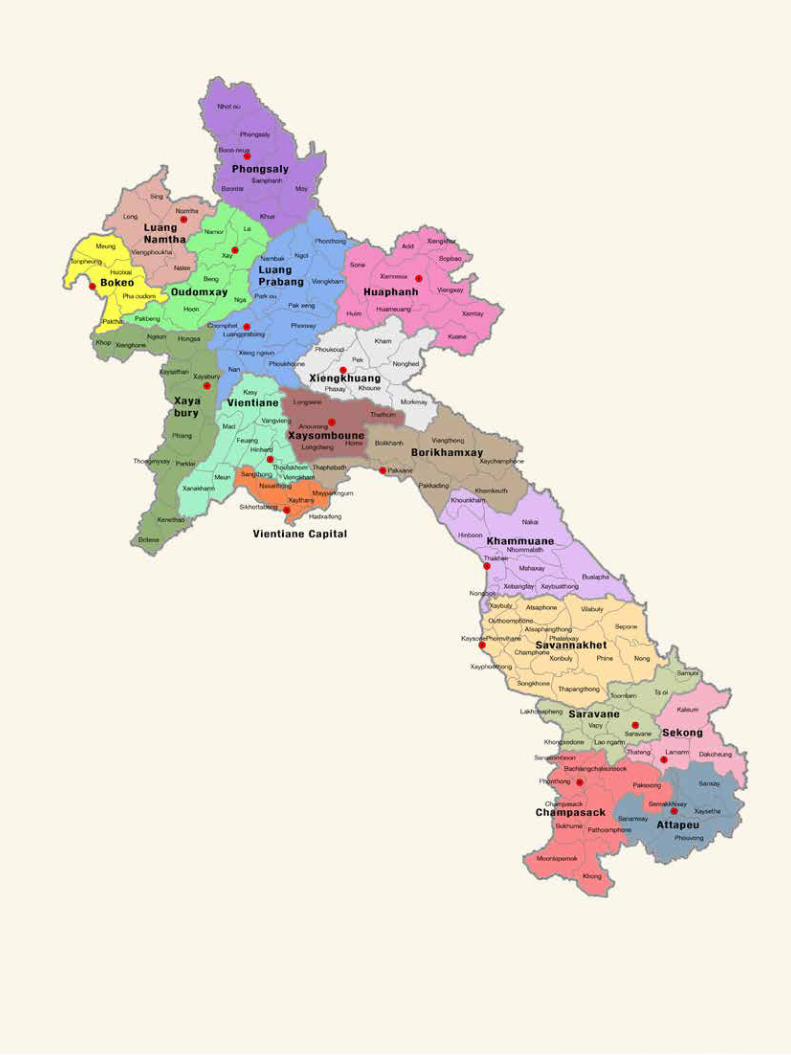
the different administrative units, the names
of the different province and districts are found
on a map in Appendix 5.
The use of maps rather than tables makes it
possible to visualise a geographical pattern
which is difficult to detect in the latter. It is
also an efficient way to present the different
figures. Examining Maps 1a and 1b, which show
the poverty headcount by province and district
respectively, it is notable how disaggregating
poverty figures reveal a more detailed
pattern of poverty. These maps clearly show
how different parts of the 18 provinces are
far from homogeneous. For example, the
Borikhamxay province has both one of the
poorest three district (Xaychamphone) in Lao
PDR as well as two of the richest ones (Pakxane
and Thaphabath). Some other provinces
(Luangprabang, Xayaboury and Vientiane
Province) also experience large variation in
poverty headcount among their districts. In this
type of environment, the usefulness of poverty
maps becomes evident. Such variations in
poverty headcount within a given province
would make district-level targeting much more
efficient that a simple province-level targeting.
In other words, district level targeting would
lead to more resources going to the poorest
districts than otherwise. Poverty gap indices
are presented in Maps 2, showing a similar
spatial pattern as the poverty headcount.
Maps 1c shows side-by-side district-level maps
for 2005 and 2015. There has been an overall
decline in poverty across the board, but poverty
declined more in the north. The geographical
pattern of poverty has changed as a result,
with more of the poorest districts now located
in provinces in the south.
Figure 1 is a more formal way to examine these
within-region variations in poverty rate. For
each of the four regions (Vientiane Capital,
North, Central and South), the vertical bar
12 Lao PDR 2015 Census-Based Poverty Map – June 2016
presents the range of poverty headcounts
along with a bullet point showing the regional
poverty headcount rate. Looking at the first
panel showing the variation in poverty rates at
the province-level, a considerable within-region
spread of poverty rates in all three regions
outside the capital can be observed. The
poverty rates differ by around 17 percentage
points within provinces in the North and by
almost 30 percentage points in the South.
The bottom panel presents the same figures
at the district level and shows a significantly
larger range of poverty headcount rates. The
incidence of poverty is estimated to be 12.9
percent and 73 percent respectively, in the two
districts with the lowest (Xaysetha District in
Attapeu Province) and highest poverty rates
(Toomlarm District in Saravane Province) in
the South. This figure shows a considerable
increase in information by moving from
province to the district level. The highlighted
large spread in poverty rates, particularly at
the district level, demonstrates that poverty
maps provide policy-makers with useful
information for targeting the poorest districts.
Combining information on the level of poverty
headcount and the actual number of individuals,
Map 2 presents poverty density for Lao PDR.
In that map, each red dot represents 100 poor
individuals and it permits to geo-localize where
the poor people are concentrated. Map 2 shows
that poor people are mainly concentrated in
two separate locations, a first one in the capital
Vientiane and a second one around Saravane
Province. Those two locations are very
different. Vientiane, has the lowest poverty
headcount but is the most populated part of
the country, while the high poverty density
in Saravane Province is mainly the result of
being the poorest province in Lao PDR. In any
poverty reduction scheme, those two areas
would clearly call for different type of targeting
strategies. In Saravane, the high poverty
headcount and poverty density would call for
geographical targeting covering potentially all
individuals in the province. However, such type
of targeting rule would yield a much higher
level of leakage in Vientiane Capital. The large
leakage (i.e. covering non-poor individuals)
would demand a different targeting approach
aiming at better reaching the poor individuals
in an otherwise much richer province.
13Lao PDR 2015 Census-Based Poverty Map – June 2016
Map 1: Poverty Headcount (P0)
A. Province
Sources: Authors’ calculation based on 2012/13 LECS-5 and 2015 Lao PDR Census
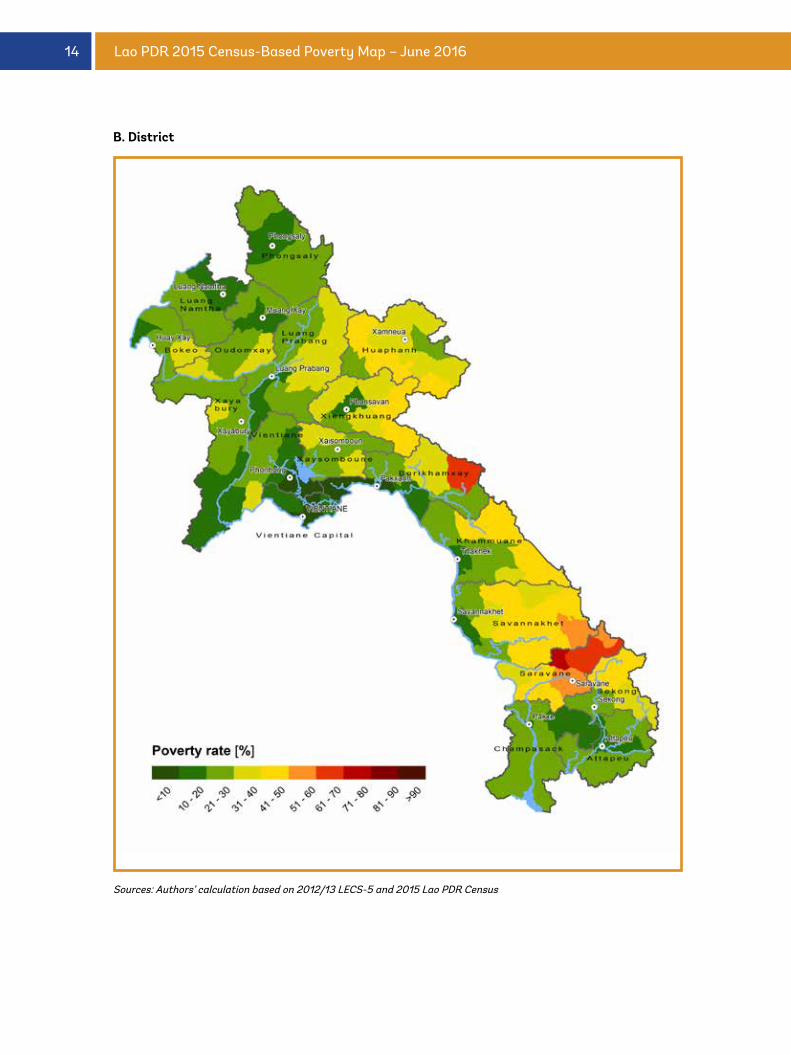
14 Lao PDR 2015 Census-Based Poverty Map – June 2016
B. District
Sources: Authors’ calculation based on 2012/13 LECS-5 and 2015 Lao PDR Census
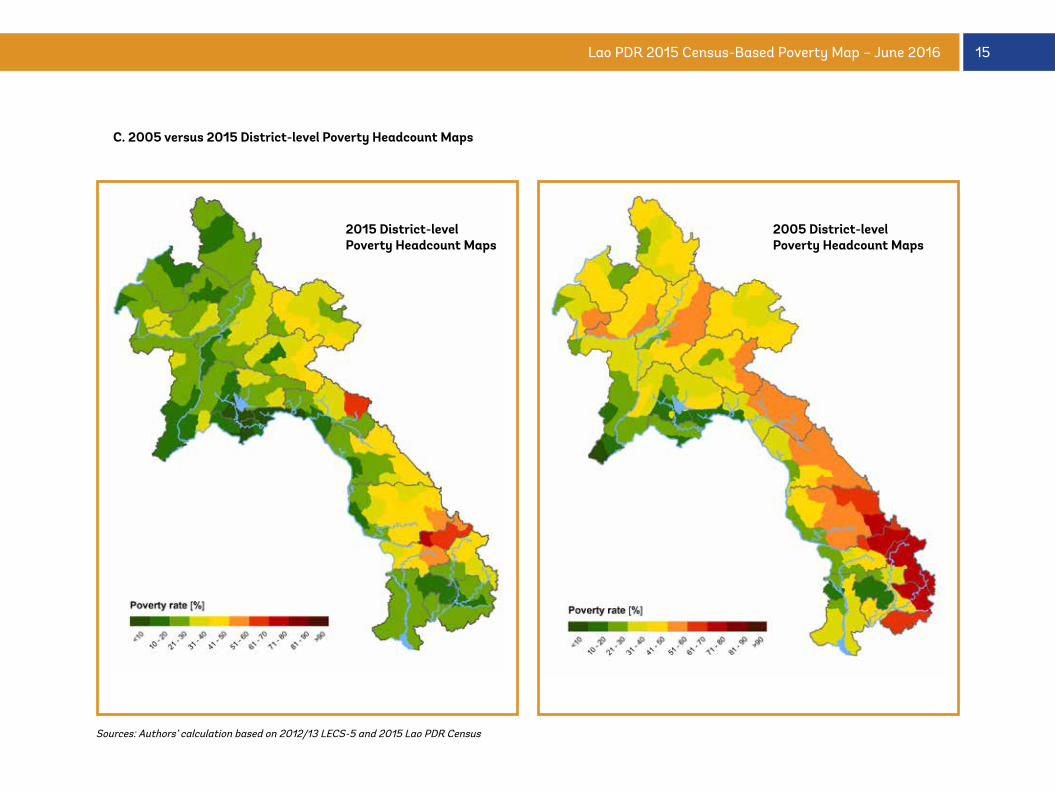
15Lao PDR 2015 Census-Based Poverty Map – June 2016
C. 2005 versus 2015 District-level Poverty Headcount Maps
2015 District-levelPoverty Headcount Maps
2005 District-levelPoverty Headcount Maps
Sources: Authors’ calculation based on 2012/13 LECS-5 and 2015 Lao PDR Census
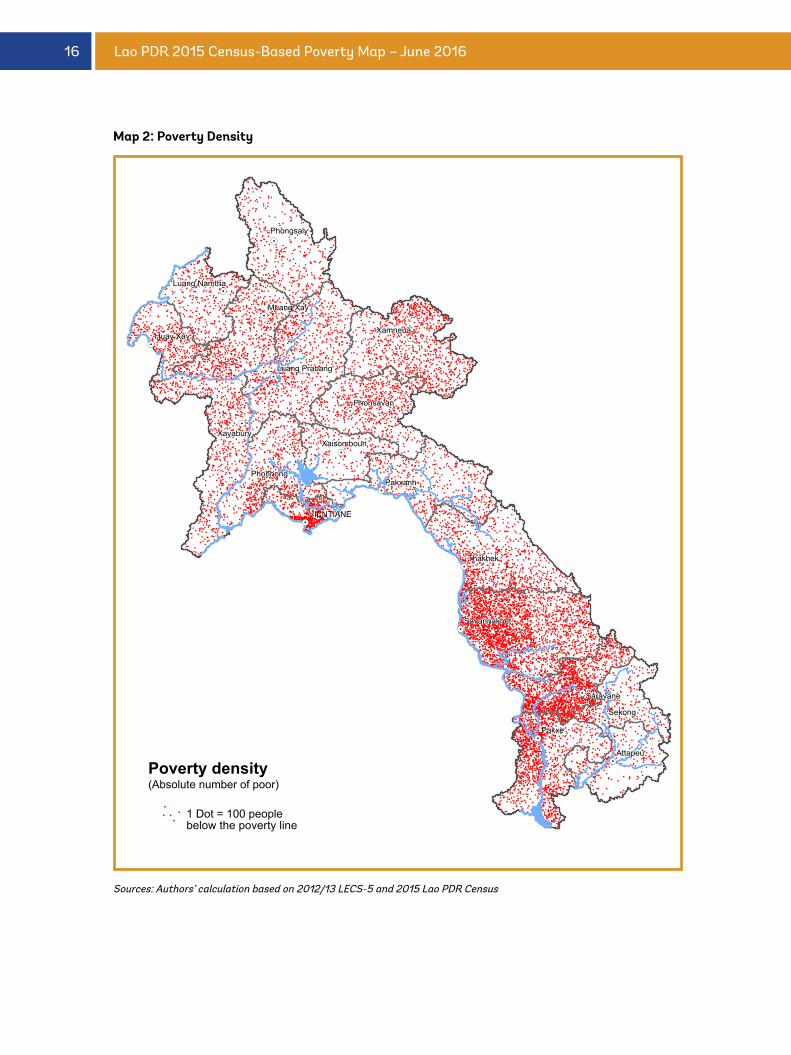
16 Lao PDR 2015 Census-Based Poverty Map – June 2016
!!!!!
!
!
!!
!
!
!
!
!!!
!
!!!
!!!!
!!
!
!
!
!!
!
!!
!!!
!
!
!
!
!
!
!
!
!
!!!
!
!
!
!
!
!
!
!!!!
!!
!
!!!!!
!!!
!
!
!!
!
!!
!!
!
!
!
!
!
!
!
!
!
!
!!
!
!!!!
!
!!
!
!!
!
!!!
!
!
!
!
!!
!
!!
!
!!!!
!
!
!!
!
!
!
!
!
!
!!
!
!
!
!
!!
!!!
!!
!!
!!!
!
!!
!
!
!
!
!
!
!
!
!
!!
!
!
!!
!
!!
!
!!!!
!
!!!
!
!
!
!
!
!
!
!!!!
!
!
!!!!
!
!
!
!
!!
!
!
!
!
!
!
!
!!
!
!
!
!
!
!!!!!
!
!
!
!
!
!
!
!
!
!
!
!
!
!
!
!
!
!
!
!
!!
!!!
!!
!!
!
!
!
!!
!
!
!!
!
!
!
!
!
!
!!
!
!
!
!
!
!
!
!!
!
!
!
!
!
!
!
!
!
!
!
!
!
!!
!
!!
!
!!
!!
!
!!!!!!!
!!!
!!!!!!!!
!
!!!!
!!!
!!!
!
!!!
!
!
!
!
!
!
!
!
!
!
!
!
!
!
!!!
!
!
!
!
!
!
!
!
!
!
!
!
!
!
!!
!!
!
!
!
!!
!
!
!
!!
!
!
!
!
!!!
!!
!
!!
!
!
!
!
!!
!
!
!
!
!
!!
!
!
!
!
!
!
!
!!
!
!
!!
!
!
!
!
!!
!
!
!!
!
!
!
!
!
!
!
!
!
!!
!
!
!!
!
!
!
!
!
!!
!
!
!
!
!
!
!
!
!
!
!
!
!
!
!
!
!
!
!
!
!
!
!
!
!
!!
!
!!
!
!
!
!
!
!
!
!
!
!!
!!!
!
!
!
!
!
!
!
!!
!
!
!
!!!!
!
!!
!!
!!!!!!!!!!!!!!!
!!!!!!!!
!!!!!!
!
!
!!!!
!
!!!!!!!
!
!!!!!!!
!
!!
!
!!!!
!
!!!!!!
!
!!!!!!
!
!!
!!!!!!!!!!!!!!!!
!
!
!!!!
!!!!!!
!
!
!
!
!!
!
!
!
!!!
!
!
!!
!
!!!
!!!!
!
!
!
!
!
!!!
!
!!
!!
!!
!!
!
!!
!!!!!!
!!!!
!
!!!!!!!!!
!
!!
!
!!!!!!!!!!!!!!!!
!
!
!
!!
!
!
!!
!
!!!
!!
!
!
!
!!
!!
!
!
!
!
!!
!
!
!
!
!
!
!
!
!!!
!
!
!
!!
!!
!
!
!
!!
!
!
!!!
!
!
!
!
!
!
!
!!!
!!
!
!!
!!
!
!
!!!!
!!
!
!!
!!!
!!
!
!
!
!
!!
!
!
!
!
!
!
!
!
!
!
!!
!
!
!
!!
!
!
!!!!!
!
!
!!!
!
!
!
!!
!
!
!
!
!
!!
!
!
!
!
!
!!
!
!
!
!!
!!
!
!
!
!
!
!
!
!
!
!!!
!
!
!
!!
!
!!
!
!
!
!
!
!
!
!
!!
!
!
!
!
!
!
!
!
!!
!
!
!
!
!!!
!
!
!!!
!
!
!
!
!
!!
!
!!
!
!
!
!
!
!!
!
!
!
!
!
!
!
!
!
!
!
!
!
!!
!
!
!
!
!
!
!
!!
!!!!
!!!!!!
!!
!!!!!!!
!
!
!
!!!
!!
!
!
!!
!!
!!
!!!!
!
!!
!
!
!
!!!!!
!
!!!!!!
!
!
!!!
!
!
!!!!!!!!!
!!!!!!!!!!!!!!
!!!!!!!!
!
!
!!
!
!
!
!
!!
!!
!
!
!!
!
!!
!
!
!
!!!
!
!
!
!
!
!
!
!
!
!
!!!!!!
!
!!!
!
!
!
!!!
!
!
!
!
!
!
!!!!
!
!
!
!
!
!
!
!
!
!!
!!
!
!!!
!
!!!!
!!
!
!
!
!
!
!!
!!!!!
!
!!
!!
!
!
!
!
!
!
!!
!
!
!
!
!
!
!
!!
!
!
!
!
!
!
!
!
!
!
!
!
!!
!!
!
!
!
!!
!
!
!
!
!
!
!
!
!
!!
!
!
!
!
!
!
!
!
!!
!
!
!!
!
!
!
!
!
!!
!
!
!
!!
!
!
!
!
!!
!!
!
!!
!
!!!
!
!
!!!
!
! !
!
!
!!
! !
!
!
!
!
!
!
!
!
!
!
!
!
!
!
!
!
!
!
!!
!
!
!
!!
!!
!
!
!
!
!!
!
!
!
!
!!
!
!!
!
!
!
!
!
!
!!
!
!!
!
!
!!
!
!
!
!
!
!
!
!
!
!!
!
!!
!!
!
!
!
!
!
!
!
!
!
!
!
!
!
!
!
!
!
!
!
!
!
!
!
!
!!
!!!
!
!
!
!
!
!
!
!
!
!!
!
!
!!
!!
!!
!!
!
!
!
!
!
!!
!
!
!
!
!
!
!
!
!
!
!
!!
!
!
!
!
!
!
!
!
!
!
!
!
!
!
!
!
!
!
!
!
!
!
!
!
!
!
!
!
!!
!
!
!!
!
!
!
!
!
!
!
!
!
!
!
!
!
!
!
!
!
!
!
!
!
!
!
!
!
!
!
!
!
!
!
!!
!
!
!
!
!
!!
!!
!
!
!
!
!
!
!
!
!!
!
!
!
!
!!
!
!!
!
!!
!
!!
!
!
!
!
!
!
!!
!
!!
!
!
!
!
!
!
!
!
!
!
!
!
!
!!
!
!
!!!
!
!
!!
!!!!
!
!
!
!
!
!
!!!
!!!
!!
!
!
!
!
!
!
!
!
!
!
!
!
!!
!
!
!
!
!
!
!
!
!
!
!
!
!!
!
!
!
!
!
!
!
!
!
!!
!!
!
!
!
!
!
!
!
!
!
!
!
!
!
!
!
!!
!
!
!
!
!
!
!
!
!
!
!
!
!
!
!
!
!!
!
!
!
!
!
!
!!
!
!
!
!
!
!
!
!
!!
!
!
!
!
!
!
!
!!
!
!
!!
!!
!
!
!
!
!
!
!
!
!
!
!!
!!
!
!
!!!
!!
!!
!!!!!
!
!
!
!!
!
!!!!
!
!
!
!
!
!
!
!!
!
!
!!!
!!
!
!
!!
!
!
!
!
!
!
!
!
!
!
!!
!
!
!!
!
!
!!
!
!
!
!!!
!!
!
!!
!
!!
!!!
!!
!
!
!
!
!
!
!
!
!
!
!!!
!!
!!!!!
!
!
!
!
!!
!
!!
!!
!!
!!!!
!
!
!!!
!
!!
!!
!
!!
!!
!
!
!
!
!
!
!!
!
!!!!!
!!
!
!!
!!
!
!
!
!
!
!
!
!!!
!!
!
!
!
!
!
!!
!
!
!
!
!
!
!!!!
!
!!
!!!!!
!!
!
!
!!!!!
!!!!!!!!
!!
!!!
!!
!
!
!
!
!
!
!!!!!
!
!!
!
!!
!
!
!
!
!
!
!
!
!!!
!
!
!
!!!
!
!
!!
!!!!!!
!
!
!
!!!
!!
!
!
!!!
!
!!
!
!!
!!
!
!!
!
!!
!
!
!
!
!
!!!!!!
!!!
!
!
!
!!
!
!!
!
!
!
!
!
!!!
!
!
!
!
!!
!
!
!
!
!
!
!
!
!!
!
!!
!
!
!
!
!
!
!
!
!
!
!
!
!
!
!
!!
!
!
!
!
!
!
!
!
!
!!
!
!
!!
!
!
!
!
!
!
!
!
!
!
!
!!
!
!
!
!
!
!
!
!
!
!
!
!!
!
!
!!
!
!
!
!
!
!
!
!!
!!!
!
!
!
!
!
!
!
!
!
!
!
!
!
!
!
!!
!
!
!
!
!
!
!
!
!
!
!!
!
!
!
!
!
!
!
!
!
!!
!!
!
!
!
!!
!
!!
!!
!
!
!
!!
!
!
!
!
!
!
!
!
!
!
!
!
!
!
!
!
!
!
!
!
!!
!
!
!
!
!
!!
!
!
!
!
!
!
!
!
!
!
!
!
!
!
!
!
!
!
!
!
!
!!
!
!
!
!
!
!
!
!
!
!
!
!
!!
!
!
!
!!!!
!
!
!
!!!
!
!
!!
!
!
!
!!
!
!
!!
!
!
!
!
!
!
!
!!
!
!
!!
!
!
!
!
!
!
!!
!!
!
!
!
!
!
!
!!
!!
!
!
!!
!!!
!
!!
!!
!
!
!
!!!!
!
!!
!
!
!
!
!!
!!!
!!!
!!
!
!
!
!
!!
!!!!!
!
!
!
!
!
!!!
!!
!!
!
!
!
!!
!!
!!
!
!
!
!!
!!!
!
!
!!
!!
!
!!
!!
!
!
!
!
!!
!!!
!
!
!
!
!
!
!!
!
!!!
!!
!
!
!!
!
!
!!
!!!
!!
!
!!
!!
!
!
!
!!
!
!!
!!
!!
!
!!
!!!
!
!
!
!
!
!
!!
!
!
!
!
!
!
!
!
!
!
!
!
!
!
!
!
!!
!
!!
!
!!
!
!
!!
!!
!!
!
!
!
!
!
!
!!
!
!
!
!
!
!!
!
!
!!
!
!
!
!!
!
!
!
!
!
!!
!!
!
!
!
!
!
!
!
!
!
!
!!
!
!
!
!
!
!
!
!!!!
!
!!
!
!
!
!
!!
!!
!
!
!!
!
!!
!!
!
!!
!
!
!
!!!
!
!
!
!
!
!
!
!!
!!
!
!!
!
!
!
!!
!!!
!
!
!
!
!
!
!
!
!!
!
!
!
!
!
!
!!!
!
!
!
!
!
!
!
!
!
!
!!
!
!
!!
!!
!
!
!
!
!
!
!
!!!
!
!
!
!
!
!
!
!
!!
!
!
!!
!
!
!
!
!
!
!
!!!
!
!
!
!!
!
!
!
!
!
!
!!
!
!
!
!
!!
!!
!!
!
!
!
!
!!!
!
!
!!
!!
!!!!
!
!
!
!!
!
!
!
!!
!
!
!
!!!
!!
!
!
!
!!
!
!
!
!
!
!
!
!
!
!
!
!
!
!
!
!
!
!
!
!
!!
!
!
!
!
!
!
!
!
!
!
!
!!
!
!
!
!
!
!
!
!!
!
!
!
!
!!
!
!
!
!
!
!
!
!
!
!!
!
!
!
!
!
!!
!
!
!
!
!!
!!
!
!
!
!
!
!!
!
!
!
!
!
!
!
!
!!
!
!!!!!
!
!
!!
!
!!
!!
!
!
!!!!
!!
!!
!!
!
!!
!
!
!!
!
!
!
!
!!
!
!
!!
!
!
!
!!
!
!!
!
!
!!
!
!
!
!
!!
!
!
!
!
!!
!!
!
!
!
!
!
!
!
!
!
!
!
!!
!!
!
!
!
!!
!
!
!!!!!!!
!
!!!!
!
!
!
!!!
!
!
!
!
!
!
!
!
!
!!!!
!
!
!
!
!!
!
!!
!
!!!
!!
!
!!!
!
!
!
!!
!!!
!!
!!!
!!
!
!
!
!
!
!!
!
!
!!
!!
!
!
!
!
!
!
!!
!
!
!
!!
!
!
!
!
!
!
!
!
!
!
!
!
!
!
!
!
!
!
!!
!!
!
!
!!
!
!
!
!
!
!!
!
!
!
!
!
!!
!
!!
!
!
!
!
!
!
!!
!
!
!
!
!
!
!
!
!
!
!!!
!
!
!
!
!
!
!!
!
!
!
!
!!
!
!
!
!
!
!
!
!
!
!
!
!
!!
!
!
!
!
!
!
!
!
!
!
!
!
!
!
!
!
!
!
!
!
!
!
!
!
!
!
!
!
!
!!
!
!
!
!!
!
!
!
!
!
!
!
!
!
!
!
!
!
!
!
!
!
!!
!!!!
!
!
!
!
!
!
!
!
!
!
!
!
!
!
!
!
!!
!
!
!
!!
!
!
!
!
!
!!
!
!
!!!
!
!
!
!
!
!!
!
!!
!
!
!
!
!
!
!!
!
!
!
!!
!
!
!
!
!
!
!
!
!
!
!!!
!
!
!
!
!
!
!
!
!
!
!
!
!!
!
!!
!!
!
!
!
!
!
!
!
!
!!!!
!!
!
!!
!
!
!
!
!
!!
!!!
!
!
!!
!
!
!!
!
!
!!!
!
!!!!
!!
!
!!
!
!!
!
!
!
!
!
!
!!
!
!!
!
!
!!
!
!!
!
!
!
!
!!
!
!
!
!
!!
!
!
!
!!!
!
!
!
!!
!!
!
!
!!
!
!
!
!!
!
!
!
!
!
!
!
!!
!
!
!
!
!
!!
!
!
!
!
!!
!
!
!
!
!
!
!
!!
!
!
!
!
!
!
!
!
!
!
!
!
!
!!
!
!
!
!!
!
!
!!
!
!
!!
!!
!!
!!
!
!
!
!
!
!!
!
!
!
!
!
!
!
!
!
!
!
!
!
!
!
!
!
!
!
!
!
!
!
!
!
!
!
!
!
!
!!
!
!
!!!
!
!!
!
!
!
!!!
!
!
!!!!!
!
!
!!
!!!!!
!
!!
!!!
!!!
!!
!!
!
!
!
!
!
!!
!
!
!!
!
!
!
!
!
!
!
!!
!
!!!
!!
!
!
!
!
!
!
!
!
!
!
!
!
!
!
!
!!
!
!
!
!
!!
!
!
!
!
!!
!
!
!
!!
!
!
!
!
!!
!
!
!
!
!
!!
!
!
!!
!
!
!
!
!
!
!
!
!!
!
!
!!
!!
!
!
!
!
!
!
!
!
!
!
!
!!
!
!
!
!
!
!
!
!
!!
!!!
!
!
!
!!!
!!! !
!!!!!!
!!!!!
!
!
!
!
!!
!
!
!!!
!
!
!!
!
!!
!
!
!
!
!
!
!
!
!
!!!!!!!
!
!
!
!
!
!
!
!
!!
!
!!
!
!
!
!
!!
!
!
!
!
!
!
!!
!
!
!!
!
!
!
!
!
!!
!
!
!
!
!
!
!
!
!!
!
!
!
!
!
!
!
!
!
!
!!!
!!
!
!
!!
!
!!!
!
!!
!
!
!
!
!
!
!!
!
!
!!
!
!
!!!
!
!
!
!
!!
!
!
!
!
!!
!
!
!
!
!
!
!
!
!!
!
!!
!
!
!
!
!
!
!
!
!!
!
!
!
!
!!
!
!
!
!
!
!!!!!
!
!
!!
!
!!
!!!!!!
!
!!
!!
!
!
!
!
!
!!!!
!
!!
!
!
!!
!!
!
!
!
!
!
!
!
!!
!
!
!
!
!!
!
!
!
!
!
!
!
!
!!
!
!
!
!
!
!!!
!
!!
!
!!
!
!!!!!
!
!
!
!!
!
!
!
!!
!
!
!
!
!
!
!
!
!
!
!
!
!
!
!
!
!
!
!!
!
!
!
!!
!
!
!!!
!
!
!
!
!
!
!!
!
!
!
!
!!
!
!
!
!
!!
!
!
!!
!
!
!
!
!!
!
!
!
!!!!
!
!!
!
!
!!
!
!
!
!
!
!
!
!!!
!
!!
!
!
!
!
!!!
!
!
!
!!
!!
!!
!
!
!
!
!
!!
!
!!
!
!
!!
!
!
!!
!
!
!
!!
!
!
!
!
!
!
!
!
!
!
!
!
!!
!!!!
!
!!
!
!!
!
!!
!
!
!!!!!
!!
!
!!!
!
!
!
!
!
!!
!
!!!
!
!!!!!!
!
!!
!
!
!
!
!
!
!
!
!
!!
!
!
!
!
!
!!
!
!
!!
!
!!
!!
!
!!
!
!
!
!
!
!
!
!
!
!
!
!!
!
!
!
!
!
!
!
!
!
!
!!!
!
!
!
!
!
!
!
!
!!
!!
!
!
!
!
!
!
!
!
!
!
!!
!
!
!
!
!
!
!
!
!
!
!
!
!
!!
!
!
!
!
!
!
!
!
!!
!
!
!
!
!
!!
!
!
!!
!
!
!
!
!
!
!
!
!!
!
!
!
!
!
!
!!
!
!!
!
!!!!
!
!
!
!
!
!
!
!
!!
!!
!
!
!
!
!
!
!
!!
!
!
!!
!
!!
!!
!
!
!
!
!!
!
!
!
!
!!
!
!!
!
!
!
!
!
!
!
!
!
!
!
!
!
!
!!
!
!
!
!
!
!!!
!
!
!
!!!
!
!
!
!!
!
!
!
!
!
!
!!!!!!
!
!
!!
!
!!
!
!!
!!!
!!
!!!
!!
!!!
!
!!
!
!!
!
!
!!
!
!!!!!
!
!!!
!!!
!
!
!!!!!!!!
!!!
!!
!!
!
!
!!
!!!
!
!!
!
!!
!
!!!
!
!
!!!
!
!!
!!!
!!
!
!
!!
!
!!!
!
!
!
!
!!
!
!
!
!
!!!!
!
!
!
!!
!!
!
!
!
!
!!
!
!
!!
!
!!
!
!
!
!
!
!
!!!!
!
!
!
!
!
!
!
!
!
!
!
!
!
!
!
!
!
!!
!
!
!
!!
!
!
!
!!
!
!
!
!!
!!
!!
!
!!
!
!
!
!
!
!
!
!
!!
!
!
!
!!!
!
!
!
!
!!
!
!
!
!
!
!
!
!
!
!
!!!
!!
!
!
!
!
!
!!
!
!
!
!
!
!!!
!
!
!!
!
!
!
!!!
!
!!
!
!
!
!!!
!
!
!
!
!
!
!
!!
!
!
!
!
!
!!!
!
!!
!
!
!
!
!!!!
!!!
!
!!
!
!
!
!
!
!
!
!!
!!
!
!
!
!!
!
!
!
!
!
!
!
!
!
!!
!
!
!
!
!!
!!
!
!!
!
!!
!
!
!
!
!!
!!!!
!!!
!!
!
!!!!
!
!!
!!
!
!
!
!
!
!!!
!
!!
!
!
!
!
!
!!!
!
!
!
!
!
!
!
!
!
!
!
!
!
!
!
!
!
!
!
!
!
!
!
!
!
!!
!
!
!
!
!
!!
!
!
!!
!
!
!!
!
!
!!
!
!!
!
!
!
!
!!
!
!
!
!!!!!
!
!
!!!!
!
!
!
!
!!!
!
!
!!!
!
!
!!
!!
!
!!!!!
!
!
!
!
!!
!!
!
!
!!!
!!
!
!!!
!!
!
!!
!!
!!
!
!!
!!!
!
!!!!!!!
!
!!!!
!!
!!
!
!!
!
!
!
!
!
!
!
!!
!
!
!!
!
!!
!
!
!
!
!
!
!
!!
!
!
!
!
!
!
!!
!
!
!!
!
!
!
!
!
!
!
!
!
!
!
!
!!
!
!
!
!
!
!!
!
!!
!
!
!!!
!
!
!
!
!!
!
!
!!
!!!
!
!!
!!
!
!!
!
!
!
!
!
!
!
!
!
!!
!
!!
!
!!!
!!
!
!!!!!
!
!
!
!!!
!
!!
!!
!
!
!!
!
!!
!
!
!
!!
!
!!
!
!
!!
!
!
!
!
!
!
!
!!!!
!
!
!
!
!
!
!
!
!!
!!
!!
!!!
!
!
!
!!!
!
!
!
!
!
!
!
!
!
!!
!
!
!!!!
!
!
!
!
!
!
!
!!
!
!
!!
!
!!
!
!
!
!
!
!
!!
!
!
!
!
!!
!
!
!
!
!!
!
!
!!
!
!!
!
!!
!
!!
!
!
!
!
!!
!
!
!
!
!
!
!!
!
!
!
!
!
!
!!
!
!!
!
!
!!
!
!
!
!
!!
!
!
!
!
!
!
!
!
!
!
!!
!
!
!
!!
!
!
!
!!
!
!
!
!
!
!
!
!
!!
!
!
!!
!
!
!
!
!
!!
!
!
!!
!
!!
!!!
!
!
!
!
!!
!!
!
!
!
!!
!
!
!!
!
!!!
!
!
!!!!!!
! !!
!
!
!
!
!!
!
!!!
!
!
!
!
!
!!
!!
!
!
!
!
!!
!
!
!
!
!
!
!
!
!
!
!
!
!
!
!
!
!
!
!
!!
!
!
!
!
!
!!
!
!!
!
!!
!
!
!
!!
!
!!
!!!
!
!!!!
!!!!
!!
!
!
!!!
!!
!
!
!
!
!!
!
!!
!!
!
!
!
!
!
!
!
!!
!
!
!
!
!!!
!
!
!!
!
!
!
!
!
!!
!
!
!
!
!
!
!
!
!
!!
!
!
!!
!
!
!
!
!
!
!
!
!
!
!
!
!
!
!
!
!
!
!
!
!
!
!
!
!
!
!!
!
!
!
!
!
!!
!
!
!
!
!
!!
!
!
!
!
!
!
!
!
!
!
!
!
!
!
!!
!
!
!
!
!
!
!
!
!
!
!
!
!
!!
!
!
!
!
!
!
!
!
!
!!
!
!
!
!!
!!!!
!
!
!
!
!
!!
!!!
!!
!
!
!
!!!!
!!
!
!!
!
!
!
!!!
!
!
!
!
!!!!
!
!
!!
!!
!
!
!
!
!
!!
!
!
!
!!
!
!!!
!
!
!
!
!
!
!
!
!
!
!
!
!!
!
!
!
!!
!
!!
!
!
!
!
!
!
!
!
!
!
!
!
!
!
!
!
!
!!
!!
!!
!
!
!
!
!
!
!
!
!
!!
!
!
!
!
!
!
!
!
!
!
!
!
!
!!
!
!
!
!!
!!
!
!
!
!
!
!
!
!
!
!
!
!
!
!
!!
!
!
!
!!
!
!
!
!
!
!!!
!
!
!!
!!
!!
!
!
!
!
!!
!
!
!
!
!
!
!
!
!
!
!
!
!
!
!
!
!
!
!
!
!
!!!
!
!
!!
!
!
!
!!!
!
!
!
!
!
!!
!
!
!
!
!
!
!
!
!!
!
!
!
!!!
!
!
!!!
!
!!
!
!
!!
!
!
!
!
!
!
!
!!
!
!
!
!
!
!
!
!!
!
!
!
!
!!
!
!
!
!
!
!
!
!
!
!
!!
!
!
!
!!
!
!
!
!!
!
!
!
!!
!
!
!
!
!
!
!
!
!!
!
!
!!
!
!
!
!
!
!
!
!
!
!
!
!
!
!!
!
!
!
!
!
!
!
!
!!
!
!
!
!
!
!
!!
!
!
!
!
!
!
!
!!
!
!!!
!
!!
!
!
!
!!
!
!
!!!!!
!
!!
!
!
!
!
!!
!
!
!!
!
!
!
!
!
!!!
!
!
!!
!!
!
!
!
!
!
!
!
!
!
!
!
!
!!!
!
!
!
!
!
!
!
!
!
!!
!
!
!!!
!
!
!
!
!!
!
!
!!
!
!
!
!
!
!
!
!!
!
!
!!
!!!
!
!
!
!!
!
!
!
!!!
!!
!
!
!
!
!!
!!
!!!
!
!!
!
!
!
!
!!
!
!
!!
!
!
!
!
!!
!!!
!
!
!
!
!
!
!
!
!!
!
!
!!
!
!!
!
!!
!
!
!!
!
!
!
!
!
!!!!
!
!!
!!
!
!!
!
!
!!!
!!
!
!
!
!!
!
!
!
!
!
!
!
!
!
!
!
!
!
!
!
!
!
!
!
!
!
!
!
!
!
!
!
!
!
!
!!
!
!!
!
!
!
!
!!
!
!!
!
!
!
!!
!
!
!
!!
!
!!
!!!
!
!
!!
!
!
!!
!
!
!
!!
!
!!
!
!!
!
!
!
!
!
!
!!
!!!
!!
!
!
!
!
!!
!
!
!
!
!
!!!
!
!
!
!!!
!
!
!
!
!
!
!
!!!!
!!!
!
!!!
!!!!
!
!!
!!
!
!!
!
!!
!!
!
!
!
!
!!!!!!!!
!
!
!
!!
!!
!!
!
!
!
!
!!
!
!
!
!
!
!
!!
!
!
!
!!
!
!
!
!
!
!
!
!
!
!
!
!!
!
!
!
!
!
!
!
!!
!
!!!
!!!
!
!!
!
!
!
!!!!
!!
!
!
!
!
!
!!!
!
!
!
!
!
!
!
!
!!!!
!
!!
!
!
!
!
!!
!!
!
!
!!!
!
!!
!
!
!
!
!
!!
!
!!!
!
!
!
!
!!
!
!!
!
!!
!
!
!!
!!
!
!
!
!
!
!
!
!!!
!!
!
!
!
!
!
!
!
!
!!!
!
!!!
!
!!!
!!
!
!
!!
!!!
!
!!
!
!
!
!
!
!
!
!
!
!
!
!
!
!!
!
!
!
!
!
!
!
!
!
!
!
!
!
!!
!
!
!
!!
!
!
!!
!
!
!!
!!
!
!
!
!
!
!
!
!
!
!
!
!
!
!
!
!
!
!
!
!
!
!
!
!
!
!
!
!!
!!
!
!
!
!
!
!
!
!
!
!
!
!
!
!
!
!
!
!
!
!
!
!
!
!
!
!!
!
!
!
!
!
!
!
!
!!
!
!
!
!
!
!
!!
!!
!
!
!
!
!
!
!!
!
!!
!!
!
!
!
!
!
!!
!
!!!!
!
!
!!!
!
!!
!
!
!
!!!
!!
!
!
!!
!!
!!
!!
!
!
!
!
!!!
!
!
!
!
!
!
!
!!!
!!
!
!
!
!
!
!!!!
!
!!
!
!
!
!!
!
!!
!
!!
!
!!!!
!
!!
!
!
!!
!
!!
!
!
!!
!
!
!
!
!
!
!
!
!!
!
!
!!
!
!
!!
!
!
!
!
!!!
!
!!!
!
!
!
!
!
!
!
!
!!
!!
!
!
!!
!!
!
!!
!
!!
!!
!
!
!
!!
!
!
!!
!
!
!
!!
!
!
!!
!!!
!
!
!
!
!
!
!
!
!!
!!!
!
!
!
!
!
!!
!
!
!!
!!!
!
!
!
!!!
!
!!
!
!
!
!
!
!
!
!
!!
!
!!
!!!
!!
!!
!
!
!
!
!
!!
!
!
!!
!
!
!
!!
!!!!
!
!
!!
!
!!
!
!
!
!
!!
!
!
!!
!
!
!
!!!!
!!!!!
!
!
!!
!!
!!
!
!
!
!!
!
!
!
!
!!
!
!
!!!
!!!
!!
!!!
!!
!!
!
!
!
!!
!
!!!!
!
!
!
!
!!
!
!!
!!
!!!!
!!!
!
!!
!
!!
!!!
!!
!
!
!
!
!
!!!
!
!
!
!
!
!
!
!
!
!
!!
!
!
!
!
!
!
!
!!
!
!
!!!
!
!
!!
!
!
!
!!
!!
!
!
!
!
!
!
!
!!
!
!
!
!
!!!!
!!
!
!
!
!
!
!!
!
!
!!
!
!!
!
!
!
!
!
!
!
!
!
!
!
!
!
!
!
!
!
!
!
!
!
!
!!!
!!
!
!!
!!!
!
!!
!
!!
!!!!
!!
!!
!
!
!
!!
!
!
!!!
!
!
!
!
!
!!
!
!
!
!
!
!
!
!
!
!
!
!!
!
!!
!
!
!
!!
!
!
!!
!!!
!!
!!!!!
!
!
!
!
!
!
!!
!
!!
!
!!
!
!
!
!
!
!
!
!!
!!!
!
!
!
!
!
!!!
!!
!
!
!
!!!!!!
!!!!
!
!
!
!
!
!
!!
!
!
!!
!
!
!!
!
!
!
!
!
!
!
!!
!
!
!!!
!
!
!
!
!
!
!
!
!
!!
!!
!
!!!
!
!
!
!
!
!
!
!!!!
!!!
!!!
!!
!!
!
!
!
!!!!
!
!
!!
!
!!!
!
!
!
!!
!
!
!!
!
!
!
!
!
!
!
!
!
!
!
!!
!
!
!
!
!
!
!
!!
!
!
!
!
!
!
!
!
!
!!
!
!
!
!!
!
!!
!
!
!
!
!!!
!
!
!
!
!
!
!
!
!
!
!
!
!
!
!
!
!
!
!
!!
!
!!
!
!
!!
!!
!
!!
!
!
!
!!
!
!
!
!
!!
!
!
!
!
!!
!
!
!!
!
!
!
!!
!
!
!
!
!
!
!
!
!
!
!
!
!!
!
!
!
!
!
!
!
!
!!
!
!!
!
!
!!
!
!
!
!
!!
!!
!
!
!!
!
!
!!
!
!
!
!
!
!!!!
!
!!
!!
!
!
!
!
!!!
!
!
!
!!!
!
!
!!!!!
!
!
!
!
!
!
!
!!!!
!!!
!
!
!
!!
!!
!
!!
!
!
!!
!
!
!
!!
!!!
!
!
!
!!
!
!
!
!
!!
!
!
!
!
!
!!
!
!!
!
!!
!
!
!
!!
!!!!!
!!!!!!!!!
!!!
!!!!!!!!!!
!!!!!
!!
!!
!
!!!!!!!!!!!!!!
!!!
!!
!!
!!
!
!
!!!
!
!!
!
!
!
!
!!!
!!
!
!
!
!!!!!!
!
!
!!!!
!
!!!
!
!!
!
!
!!
!
!
!
!
!!!!!
!!
!!
!!
!!
!
!!
!
!
!
!
!
!
!
!!
!!!
!!
!
!
!
!
!
!
!
!!
!
!
!
!!
!!
!
!
!
!
!
!
!!
!
!
!!
!
!
!
!
!!
!
!
!
!
!!
!!
!
!
!
!
!
!!!
!
!
!
!
!
!
!
!
!
!!!!!
!
!
!
!
!
!
!
!!
!
!
!
!
!
!
!
!
!
!!!!!!
!!
!
!!
!!!!
!!
!!!
!
!!!!!!
!!
!!
!!
!!!!!!!
!!!
!!!
!!!!!
!!
!
!!!
!
!!!
!
!
!
!
!
!
!
!
!
!
!
!
!
!
!
!
!
!
!
!
!!
!
!
!!
!
!!
!
!
!
!
!
!
!
!
!
!
!
!!
!
!
!
!
!
!!
!!
!
!
!
!
!
!
!
!
!
!
!
!
!!
!
!
!
!!
!
!
!
!
!
!!
!
!
!
!
!
!!
!!
!
!
!
!
!
!
!
!
!
!
!!
!!
!
!
!
!
!
!
!
!
!
!
!
!
!
!
!!
!
!
!
!
!
!
!
!
!!
!
!
!!!
!
!
!
!
!
!
!
!
!
!
!
!
!
!
!
!
!
!
!
!
!!
!!
!
!
!
!!!!
!
!
!
!
!!
!
!
!
!
!
!
!
!
!
!
!
!
!
!
!
!
!
!
!
!
!
!
!
!
!!
!
!
!
!
!
!!
!
!
!
!
!
!
!
!
!
!
!!
!
!
!
!
!
!!
!
!
!
!
!
!!
!
!
!
!
!
!
!
!!
!!
!!
!!
!
!
!
!!
!
!!!!!
!
!
!!!
!
!!
!
!
!
!
!
!
!!
!
!
!
!
!
!!
!
!!!
!
!!
!!
!
!
!
!
!!
!
!!
!
!
!
!
!
!
!
!!
!
!
!
!
!
!
!
!
!
!!
!
!
!!
!
!
!
!
!
!
!
!
!
!
!
!
!!!!!!
!
!
!
!
!
!
!
!
!
!
!
!
!!
!
!
!
!
!
!
!
!
!
!
!
!
!
!
!
!!!
!
!
!!
!
!!!
!
!
!
!!
!
!
!
!
!
!
!
!
!
!
!
!
!
!
!!!
!
!
!!
!
!
!
!!!
!
!
!!
!
!!!!!
!
!
!
!!
!
!
!
!
!!
!
!!
!
!
!!
!
!!!!
!
!
!!!!!!!
!
!
!
!!
!!
!
!
!!
!!
!
!
!!
!!
!
!
!
!!
!!
!
!!
!
!!
!
!!!!
!
!
!
!!
!
!!
!!!!!!
!!
!!!
!!!
!!!!!
!
!!
!
!!
!!!
!
!
!
!!
!!
!
!
!
!
!
!!
!!
!!
!
!!
!
!
!!
!
!
!!
!
!
!!
!
!
!
!!
!!
!
!
!
!
!
!!
!
!
!
!
!!
!
!!
!
!
!
!!
!
!
!
!
!
!
!
!
!
!!
!
!
!
!
!
!
!
!
!
!
!
!
!
!
!
!
!
!
!
!
!!
!
!!
!
!!
!
!
!
!
!
!
!
!
!
!
!!
!
!
!
!!
!!
!
!
!
!
!!
!
!
!
!
!
!
!
!
!
!
!
!!
!
!
!
!
!!
!
!
!
!
!!
!
!
!
! ! !!!
! !!!
!
!!
!
!
!!
!
!!
!!
!
!
!
!!!
!!
!!!!
!
!
!
!
!
!
!
!
!
!
!
!
!
!
!
!
!
!
!
!
!
!
!
!
!
!
!
!!
!
!
!
!
!
!
!
!
!
!
!
!
!
!
!
!
!!
!
!!!
!
!
!
!
!!
!
!
!
!
!
!!!
!!!!
!
!
!!
!
!
! ! !
!!
!
!
!
!
!
!
!
!
!
!
!
!
!
!
!!
!!
!
!
!
!
!
!
!
!
!
!!
!
!
!
!
!
!
!!!!
!!
!
!
!
!
!
!
!
!
!
!
!!!
!
!!!
!
!!
!
!
!
!
!
!
!
!
!
!
!!
!!
!
!
!
!
!
!
!
!
!
!
!
!
!
!
!
!!
!
!
!
!
!
!
!!
!
!
!
!
!!
!
!
!
!
!
!
!!!
!
!
!
!!
!
!
!
!
!
!
!
!
!
!
!
!!
!
!
!
!
!
!
!
!
!
!
!
!
!
!
!
!
!
!
!
!
!
!
!
!!!
!
!
!
!!
!
!
!
!
!
!
!
!!
!
!
!
!
!
!
!
!!
!
!
!
!
!
!
!
!
!
!
!!!
!
!
!!
!
!!
!!
!
!
!!!!
!
!
!
!
!
!
!
!
!!
!
!
!
!
!
!
!
!
!
!
!
!
!
!!
!
!!
!
!
!
!
!
!
!
!!
!!
!
!
!
!!!
!
!
!
!
!
!
!
!!!
!
!
!
!!
!
!
!
!!
!!
!
!
!
! !
!
!
!
!
!
!
!
!
!
!
!
!
!
!
!
!!!
!
!!!
!
!
!
!
!
!
!
!
!
!!
!!
!!
!
!
!!
!!
!
!
!
!
!
!
!
!
!
!!
!
!
!
!
!
!
!
!
!
!
!
!
!
!
!
!
!
!
!
!!!
!
!
!
!
!!
!
!
!
!
!!
!!
!
!
!
!
!
!
!
!
!!
!
!
!
!
!
!
!
!
!
!
!
!
!
!
!
!
!
!
!!!!
!!!
!!!!
!
!!!!
!!! !
!
!
!
!!
!!
!
!!!
!
!
!
!
!!
!
!!
!
!
!
!
!
!!
!
!
!
!
!
!
!!
!
!
!
!
!
!
!
!
!
!
!
!
!
!
!
!
!
!
!!
!
!
!!
!
!
!
!
!
!
!
!
!
!
!
!
!
!!
!
!
!
!
!
!
!
!
!
!
!
!
!
!
!
!
!
!
!
!
!
!
!
!
!
!
!
!
!
!!
!
!
!
!!
!
!
!
!
!
!
!
!!
!
!
!
!
!
!
!!
!
!
!
!!
!!
!!
!
!!
!
!
!!
!
!
!
!
!
!
!
!
!
!
!
!!
!
!
!
!
!
!
!!!
!
!
!
!!!
!
!
!
!
!
!
!
!!
!
!
!
!
!
!
!
!
!
!
!
!
!
!
!
!
!
!!!
!
!!
!!
!
!
!
!
! !
!
!
!
!!
!
!
!
!
!!
!
!
!
!!
!
!
!
!
!!
!
!!
!!
!
!!
!
!
!
!
!
!
!
!
!
!
!
!
!
!
!
!
!!!!
!
!!
!!!
!
!
!
!
!
!
!
!!
!
!!
!
!
!!
!
!
!
!!
!
!
!
!
!
!!
!
!
!
!!
!
!
!
!
!!
!
!
!
!
!
!
!
!!
!
!
!
!
!
!!!
!
!!!
!
!
!
!
!!!!
!
!
!
!
!
!
!
!
!
!
!
!
!
!
!
!
!
!
!!
!
!!!
!
!
!!
!!
!
!
!
!
!!
!
!
!
!
!
!
!
!
!
!
!
!
!
!
!
!!
!! !
!!
!
!
!
!
!
!
!
!
!
!
!
!
!
!!!
!
!
!
!!!
!
!
!
!
!
!
!
!
!
!!
!
!!
!
!!
!
!
!
!!!
!
!
!!
!
!
!
!!
!
!
!
!
!!
!
!
!!
!
!
!
!
!
!
!
!
!
!
!!
!
!
!
!
!
!
!
!
!!!
!
!
!
!
!
!
!
!
!
!
!
!
!
!
!!
!
!
!!
!
!
!
!
!
!
!
!
!!
!
!!
!
!! !
!
!!!!
!!
!!
!!!
!
!!!!
!!
!
!
!
!!
!!
!
!
!!
!
!
!
!
!
!
!
!
!
!
!
!!
!
!!
!
!
!
!
!
!
!
!
!
!
!
!
!
!
!!
!
!
!
!
!
!
!
!!
!
!
!
!
!
!
!
!
!
!
!
!
!
!
!
!
!
!
!
!
!
!
!
!
!
!
!
!
!
!
!
!!
!!
!!!!
!
!
!
!
!
!
!
!
!!
!
!
!
!
!!
!
!!
!
!
!
!
!
!
!
!
!
!
!
!
!
!!
!
!
!
!
!
!
!
!
!!!
!
!!
!!!
!
!
!
!!!!
!
!!
!
!
!
!
!!
!!
!
!
!
!
!!!
!
!!!!!
!
!!
!
!
!
!
!
!
!
!
!
!
!
!
!
!!
!
!
!!
!
!
!
!!
!
!
!
!!
!
!
!
!
!
!
!
!
!
!
!
!
!
!
!
!
!
!
!
!
!
!
!
!!
!
!
!
!
!!!
!!
!
!!
!
!
!
!
!
!
!
!
!!
!
!
!!!
!
!
!
!
!
!
!
!
!
!
!
!
!
!
!
!
!
!
!
!
!
!
!
!
!
!!
!
!
!!
!
!
!
!
!
!
!
!
!
!
!
!
!
!!
!
!
!
!!
!
!
!
!
!
!
!
!
!!
!
!
!
!
!
!
!
!
!
!
!
!
!
!!
!!
!
!
!
!
!
!!
!!
!
!
!
!
!
!
!
!
!
!
!!
!
!
!
!
!
!!!!
!
!!!
!
!
!
!!!
!!
!!
!
!
!!
!
!
!
!!
!!
!
!
!!!
!!
!
!
!!!!!
!
!
!
!!
!
!
!
!
!
!
!!
!!
!
!
!
!
!!!!!!!!
!
!
!
!
!
!!
!
!
!
!
!
!
!!
!
!
!
!
!
!!
!
!
!!!!
!
!!!!
!!
!
!!
!!!!!!
!
!
!!
!!!
!
!
!!!!
!!
!
!
!
!
!
!
!
!
!
!!
!
!
!!
!
!!
!
!
!
!
!!
!
!!
!!
!
!
!
!!
!
!
!
!!
!
!!
!
!
!
!
!!
!
!!
!
!
!
!
!
!
!
!
!
!
!!
!!
!!!
!
!
!
!
!!
!!
!!
!!
!
!
!
!!
!
!!
!
!
!!
!
!
!
!
!
!
!
!
!!!!
!
!!!
!
!
!!
!
!!!
!
!!!!!!
!
!!
!!
!
!
!!
!
!!
!
!!!
!!
!
!
!
!
!
!
!!
!!
!
!
!!
!!
!!
!
!
!
!
!
!
!
!
!
!
!
!
!
!
!
!
!
!!
!
!
!!
!
!
!
!
!
!!!
!!
!
!
!
!
!
!
!!
!
!!
!
!
!
!
!
!
!
!
!
!
!!
!
! !
!!
!
!
!
!
!
!
!
!
!!
!
!
!!!
!
!
!
!
!!
!
!
!
!!
!
!
!
!
!!
!
!
!
!
!!
!
!
!!!
!
!
!!!
!
!
!
!
!
!
!
!
!
!
!
!
!
!
!!
!
!
!
!
!
!
!
!
!
!
!
!
!
!
!
!
!
!
!
!
!!
!!
!
!!!
!
!
!
!
!
!
!
!
!
!
!
!
!
!!!
!
!
!
!
!!
!
!
!
!
!!!
!!!
!!!
!
!
!
!
!!
!!!
!
!
!
!
!
!!
!
!!
!
!!
!
!
!!
!
!!
!
!
!!
!!
!
!!
!
!
!!
!
!
!
!
!
!!!
!
!
!
!
!
!!
!
!
!
!
!
!!
!
!
!
!
!
!
!
!
!!
! !
!!!
!
!!!
!!
!!
!!!
!!
!
!
!
!
!!
!
!
!
!
!
!
!
!
!
!!
!!
!
!
!!!
!!!!!
!!!!!!
!!!!
!!
!
!!!
!!!
!
!!
!
!
!
!
!
!
!
!
!!
!
!
!
!
!
!!!!
!
!
!!!!!
!!
!!
!
!!
!
!
!
!
!
!
!
!!
!
!
!
!
!
!
!
!!
!
!!
!
!
!
!
!
!
!
!
!
!
!!!
!
!
!
!
!
!
!
!
!
!!
!
!
!
!
!!
!
!
!
!
!!
!
!
!
!!
!
!!
!!
!
!
!
!
!
!
!
!
!
!!
!
!
!!
!
!
!
!
!
!
!
!
!
!
!
!
!
!
!
!
!
!
!
!
!
!
!
!
!
!
!!
!
!!
!
!!
!!!
!
!
!
!!
!
!
!
!
!
!
!
!
!
!
!
!!
!
!
!
!!
!!
!
!
!
!
!
!!!!!
!
!!
!
!!!
!
!
!
!
!
!
!!!
!
!
!
!
!
!!
!
!
!
!
!
!
!
!
!
!
!!
!
!
!
!
!
!
!
!!!
!
!
!
!
!
!
!
!
!
!!!
!
!!!
!!
!!
!
!
!!
!
!
!!
!
!
!
!
!
!
!
!
!
!
!
!!
!
!
!
!
!
!
!
!!
!
!!
!!
!
!
!
!
!
!
!
!
!
!!!
!
!
!!
!
!
!
!
!
!
!
!!
!
!
!
!
!
!
!
!
!!
!
!!
!
!!
!
!
!
!
!
!!
!!
!
!
!!
!!
!
!!!
!
!
!
!
!
!
!
!
!
!
!!
!
!!
!!
!!
!
!
!
!
!!!!!
!
!
!
!
!
!
!
!
!
!!
!
!
!
!
!
!
!!
!
!
!
!
!
!
!
!
!
!
!
!
!
!
!!
!!
!
!
!
!
!
!
!
!
!
!!
!
!
!
!
!
!
!
!
!
!
!
!
!
!
!
!!
!!
!
!
!!
!
!!
!!
!!
!
!
!
!
!
!
!
!
!
!!
!
!
!
!
!
!
!
!!
!
!
!
!
!!!
!
!
!
!
!
!!!
!
!
!
!!!
!
!
!
!!!!
!
!
!!
!
!
!
!!
!
!
!
!!
!
!
!!
!
!
!
!
!
!
!
!!
!
!
!
!
!
!
!
!!
!
!
!
!
!
!
!
!!!
!
!
!
!
!
!
!
!
!
!
!
!
!
!
!
!!
!
!
!
!
!
!
!!
!
!
!
!
!
!
!
!
!!!
!
!!
!
!
!
!
!
!
!
!
!
!
!!
!
!
!
!!!
!
!
!!
!
!
!
!
!
!
!
!
!
!
!!
!!
!
!
!
!
!
!
!
!!
!
!
!
!
!!
!
!
!
!
!
!
!
!
!
!
!
!
!
!
!
!
!
!
!
!
!
!
!
!
!
!
!!
!
!!
!!!
!
!
!
!
!
!
!
!
!
!
!
!
!
!
!
!
!
!
!!
!
!
!
!
!
!!
!
!
!!
!
!!
!
!
!
!!!
!
!
!!
!
!
!
!!
!
!
!
!
!
!
!
!
!
!
!
!
!
!
!
!!
!
!
!
!
!
!
!
!
!
!
!
!
!
!
!!
!
!
!
!
!
!
!
!
!
!
!
!
!
!
!
!
!
!
!
!
!!!
!
!!
!
!
!
!
!
!
!
!
!
!
!
!
!
!
!
!
!
!!
!
!
!!
!
!!
!
!
!
!
!!
!
!
!!
!
!
!!
!!
!!
!
!
!
!
!
!
!
!
!
!
!
!
!
!
!
!
!!
!
!
!
!
!
!
!
!!!
!!
!
!
!!
!!
!
!
!
!
!
!!
!!
!
!
!
!
!
!
!
!
!!
!
!
!
!
!
!
!
!!
!!!!
!
!
!
!
!
!
!
!
!!!
!
!!
!!
!
!
!
!!
!
!
!
!!
!
!
!!
!
!
!
!
!
!!!!
!
!
!
!
!
!
!
!
!
!
!!
!!
!
!!
!
!
!
!!
!
!!
!
!
!
!!!!
!
!
!
!!
!
!!
!!
!
!
!
!
!
!
!
!
!
!
!
!
!
!
!
!
!!!
!!
!
!
!
!
!
!
!
!!
!
!
!
!!!
!
!
!!
!
!
!
!
!
!
!!
!
!
!
!
!
!
!!
!
!
!
!
!
!
!
!
!!
!
!!
!
!
!
!
!
!
!
!
!
!!
!
!
!
!
!!!
!!
!
!
!
!!
!
!!
!!
!
!
!
!
!!!
!
!!
!
!
!
!
!
!
!
!!
!!!
!!
!
!
!
!!
!
!!!
!!
!
!
!
!
!!
!
!
!
!
!!
!
!
!!
!
!
!!!
!!
!
!
!!
!
!
!
!
!
!
!
!
!
!!
!
!!
!
!
!
!
!
!!
!
!
!
!
!
!!
!
!
!!
!
!!
!!!
!!
!!
!
!
!
!
!
!
!
!!
!
!
!
!
!
!
!
!
!!
!!!
!
!!
!!
!
!
!
!
!
!!
!
!
!
!
!
!
!
!
!
!
!
!!
!
!
!!
!
!!
!
!!
!
!
!!
!!!!
!
!
!!
!
!!!!!
!
!
!!!!
!
!
!
!
!
!
!
!
!!!
!!!
!
!
!
!
!
!
!
!!
!!
!
!!
!
!!
!
!!!
!
!
!
!
!
!
!
!
!
!
!
!
!
!
!!
!!
!
!!
!
!
!
!
!
!
!
!
!
!
!!
!
!
!
!
!
!!!
!
!
!!
!
!
!
!
!
!
!!!!
!
!
!!
!!!
!
!
!!!!!
! !
!
!!
!!! !
!
!!!!
!!!
!
!
!
!
!
!
!
!
!
!
!
!
!
!!
!
!!
!
!
!
!
!!
!
!!
!
!
!
!!!
!
!
!!
!
!!
!
!
!
!
!
!
!
!
!
!
!
!
!
!
!
!
!
!
!
!!
!
!
!
!
!
!
!
!
!
!
!!
!
!
!!
!
!
!
!
!
!
!
!
!
!!
!
!
!
!
!
!
!
!
!
!
!
!!
!
!
!
!
!
!
!
!
!
!
!
!
!
!!
!
!!
!
!
!
!
!!
!
!
!
!
!!!!!
!
!!
!
!
!!!!
!
!
!
!
!
!
!
!!
!
!
!!
!
!
!!!
!
!
!
!
!
!
!!
!
!!
!
!
!
!
!
!
!!!!!
!
!
!
!!!!
!!
!
!!
!
!
!
!
!!
!
!
!
!
!
!
!
!
!
!
!
!
!
!!!
!
!
!
!
!
!
!
!!
!
!
!
!
!!
!
!
!
!!
!
!
!
!
!
!
!
!
!
!
!!
!!
!
!
!
!
!
!
!
!
!
!
!
!
!
!
!
!!
!!!
!
!
!
!
!
!
!
!
!
!!!
!
!!!!
!
!
!
!
!
!
!
!
!
!
!
!!!
!
!
!
!
!
!
!
!
!
!
!
!
!
!
!
!
!!
!!
!
!
!!
!
!
!
!
!
!
!
!!
!
!
!
!!
!!
!
!
!
!
!
!
!
!
!
!
!
!!
!
!
!!!!
!
!
!
!
!
!
!
!
!
!!
!!
!!
!
!
!
!
!
!
!
!
!
!!
!
!
!
!
!
!
!
!
!!
!
!
!
!
!
!
!
!
!
!
!
!
!
!
!
!
!!!
!
!
!
!
!
!
!
!
!
!
!
!
!
!
!
!
!
!
!
!
!
!
!!
!
!
!
!!
!
!
!
!
!
!
!
!
!
!
!
!
!
!
!
!
!
!
!
!
!!!!!
!
!!
!!
!
!
!
!!!
!!
!!
!
!!
!
!
!
!
!
!
!
!
!
!
!!
!
!
!
!
!
!
!!
!
!
!
!
!
!
!
!
!
!
!
!
!
!!!
!
!!
!!!!
!
!
!!
!!!!!
!
!
!
!!
!
!
!
!
!
!
!
!
!
!
!
!!!
!
!
!
!
!
!
!
!
!
!
!
!
!
!
!
!!
!
!
!!!
!
!
!
!
!
!
!
!
!
!
!
!
!
!
!
!!
!
!
!
!
!
!
!!
!
!
!
!
!!
!!!
!
!
!
!!
!
!
!
!
!
!
!!
!!
!
!
!
!
!
!
!
!
!!!
!
!!
!
!
!
!
!
!
!
!
!!!
!
!
!
!!
!
!!
!
!
!
!
!
!!
!
!
!!!!
!
!!
!!
!
!
!
!
!
!
!
!
!
!
!
!
!
!
!
!!
!!!
!
!
!!
!
!!!
!!
!!
!
!
!!!
!!!
!
!
!
! !
!!
!!
!!!
!
!
!!
!
!
!
!!
!!
!
!!
!
!
!
!
!!
!
!
!
!
!
!!
!
!!
!
!
!
!!!!
!!
!!!
!
!
!!
!
!
!!
!!
!
!
!!
!
!
!!!
!
!
!
!
!!
!
!!!!
!!
!
!!!
!
!
!
!!
!
!!!!
!
!!!
!
!
!!
!
!
!
!
!
!
!
!
!
!
!
!
!
!
!
!
!
!
!
!
!
!
!
!
!
!
!
!
!
!
!!
!
!
!
!
!
!
!!
!
!
!
!
!
!
!!
!
!
!
!
!
!
!!!
!
!!
!
!
!!
!
!
!
!!!
!
!
!
!
!
!
!
!
!
!
!
!
!
!!
!
!
!
!
!
!
!
!
!
!
!
!
!
!
!
!
!!
!!
!
!!
!
!
!!
!
!
!
!
!!
!
!
!!
!
!
!
!
!!
!
!
!
!
!!
!!!! !
!!
!!
!!
!
!
!
!
!
!
!
!
!
!
!
!
!!
!
!
!
!
!
!
!
!
!
!!
!
!
!
!
!
!
!
!
!
!
!
!!
!
!!
!
!
!
!
!
!
!
!
!
!
!
!
!
!
!!
!
!
!
!
!
!
!
!!!
!
!
!!!!
!
!
!
!!
!!
!
!
!
!
!
!
!
!
!
!
!
!
!
!!
!!!!
!!
!!!
!!
!
!
!
!
!!
!
!
!
!
!
!
!
!
!
!
!
!
!
!
!
!!
!
!
!
!
!!
!
!
!
!
!
!
!
!!
!!!
!
!
!
!!
!!
!
!
!
!
!
!!
!
! !
!
!!
!!
!
!
!
!
!
!
!
!
!
!
!
!
!
!
!
!
!
!
!
!
!
!!
!!!
!
!
!
!
!!
!
!!
!!
!
!
!
!
!
!
!
!
!!
!
!
!
!
!
!
!
!
!
!
!
!!
!!
!
!!!!
!!!
!!!!
!!!
!!
!
!
!
!
!!
!
!!
!
!
!
!
!
!
!
!!
!
!!
!!
!
!
!
!
!
!
!!
!
!!
!
!!
!
!
!
!
!
!!
!
!
!
!
!
!
!
!
!
!
!
!
!
!
!
!
!
!
!
!
!
!
!
!!
!
!
!
!
!!
!
!
!
!
!
!
!
!
!
!
!
!
!
!
!
!
!!
!
!
!
!
!!
!!
!
!
!
!
!!
!
!!
!
!
!
!
!
!
!
!!
!!
!
!
!
!
!
!
!
!
!
!
!!
!
!
!!!
!
!
!!
!!!!!
!
!
!
!
!
!
!
!
!
!
!
!!
!!
!!
!!
!!
!!
!!!!
!
!!!
!
!!
!
!
! !
!!
!
!
!
!
!
!
!!
!
!!
!
!
!
!
!
!
!
!
!!
!!
!
!
!
!
!
!
!
!!
!
!
!
!
!
!
!
!
!
!
!
!
!!
!
!
!
!
!
!!
!!
!
!!
!
!
!
!!
!
!
!
!!
!
!
!
!
!!
!
!
!
!
!
!
!!
!
!
!
!!
!
!!!
!!
!
!
!
!
!
!
!
!
!
!
!!
!
!
!!!
!!
!
!
!
!
!
!!
!
!!
!
!
!
!
!
!!
!
!
!
!
!
!
!
!
!
!
!
!
!
!
!
!!
!
!
!
!
!
!
!
!
!
!
!
!
!
!
!!
!
!
!
!
!
!
!
!
!
!
!
!!!
!!!!!
!!
!
!
!!
!
!
!
!!!
!!
!
!
!
!
!
!
!!!
!!
!
!
!
!
!
!
!!
!
!
!!
!
!
!
!
!
!
!
!
!!
!!
!!
!
!!
!
!
!!
!
!
!!
!
!!!
!
!
!
!
!
!
!
!
!
!
!
!!
!
!
!
!
!
!
!
!
!
!
!
!
!
!
!
!
!
!
!
!!
!!!
!
!
!
!
!
!
!!
!!!
!
!
!
!
!
!!
!
!!
!
!
!
!!!
!
!
!
!
!
!
!
!
!
!
!
!
!
!!!
!!
!
!
!
!
!
!!!
!
!
!!
!
!
!
!
!
!
!
!
!
!
!
!
!
!
!
!
!
!
!
!
!
!
!
!
!
!
!
!
!!
!
!
!
!
!!!
!
!
!!!!!
!
!
!!
!
!
!
!!!
!
!
!
!
!!
!
!
!
!!
!
!!
!
!
!
!
!!!
!!
!
!!
!!!!!
!
!
!
!
!
!
!
!
!
!!!!
!
!
!
!!
!!
!!
!
!
!
!!!
!
!
!
!
!!
!!!
!
!
!
!
!
!
!
!
!
!
!!!
!
!
!
!
!
!
!
!
!
!
!
!
!
!
!
!
!
!
!
!
!
!
!
!
!
!
!!
!!
!
!
!
!
!
!
!
!
!
!
!
!
!
!!
!
!
!
!
!!
!
!
!
!
!
!
!
!!
!
!
!
!
!
!
!
!
!!!
!
!
!!
!
!!
!!
!!
!
!
!
!
!
!
!
!!
!
!
!
!
!
!
!!
!
!
!
!
!
!
!
!
!
!!
!
!
!
!
!
!
!
!
!
!
!
!
!
!
!
!
!
!
!
!
!
!
!
!
!
!
!
!
!
!
!
!
!
!
!
!
!
!
!
!
!
!
!
!
!
!
!
!
!
!!
!
!
!
!
!
!
!
!
!
!
!
!
!
!
!
!
!!
!
!
!!
!
!
!
!
!
!
!
!
!!
!!
!
!
!
!!
!!!!
!
!
!
!
!
!
!
!!
!
!
!
!
!!
!
!
!
!
!
!!
!
!
!!
!
!
!
!
!
!
!!
!
!
!!
!
!!
!
!!
!
!
!
!!
!
!
!
!
!
!
!!
!
!
!
!
!
!
!
!
!!
!
!!
!
!
!
!
!
!
!!
!
!
!
!
!
!
!
!
!
!!
!!
!
!
!
!
!
!
!!
!!!
!
!
!
!!!
!
!!
!
!!
!
!
!
!
!!
!
!
!
!
!
!
!
!
!
!
!
!!
!
!
!
!!
!!
!
!
!
!
!
!
!
!
!!
!
!
!
!
!
!
!
!
!
!
!
!
!!
!
!
!
!
!
!
!
!!
!
!
!
!!
!
!
!
!
!
!
!
!!
!
!
!
!
!
!
!
!
!
!
!
!
!
!
!
!
!
!
!
!
!
!!
!
!
!
!
!
!
!
!
!
!
!!
!
!
!
!
!
!
!
!
!!
!
!
!
!
!
!
!!!
!
!
!
!
!
!
!
!!
!
!!
!!!!!
!!
!!
!
!
!
!!
!
!
!!
!
!
!
!!!
!
!
!
!
!
!
!
!
!
!
!
!
!
!
!!
!!
!
!!!
!
!
!
!
!!
!!
!
!
!
!
!
!
!
!
!
!!
!
!!
!
!
!
!
!!
!!
!
!
!
!
!
!!
!!
!
!!
!
!
!
!
!
!
!!
!!!
!!
!
!
!!!
!!!
!
!
!
!
!
!
!
!
!!
!!
!
!
!!!!
!!
!!
!
!
!
!
!
!!
!
!
!
!
!
!!
!
!
!
!
!
!
!
!
!
!
!!
!
!!
!
!
!
!
!!
!
!
!!!
!
!
!
!
!
!
!
!
!!
!
!
!
!
!!
!
!
!
!!!
!
!
!
!
!
!
!
!
!
!
!
!
!!
!
!
!
!
!
!
!
!
!!
!
!
!
!
!
!
!
!
!!
!!
!
!
!
!
!!
!!
!
!
!!
!!
!
!
!
!!
!
!
!!
!!
!
!
!
!
!
!
!
!
!
!
!
!
!
!
!
!
!
!
!
!
!
!!
!
!
!!
!
!
!
!
!
!!
!
!!!
!
!!!
!
!
!
!!!
!!!!
!
!!!
!
!
!
!
!
!
!
!!
!
!
!
!
!!
!
!
!!!
!
!!
!
!
! !!!!
!
!
!
!
!
!!!
!!
!!
!!!
!
!
!!
!
!
!
!!
!
!
!
!
!
!!
!
!
!!!
!
!!!
!
!
!
!!
!
!
!
!
!
!
!
!!
!
!
!
!
!
!
!
!
!!
!
!
!
!!
!
!
!
!
!
!
!!!
!
!
!
!
!
!
!
!
!
!!
!!!
!
!
!
!
!
!
!
!!!
!
!
!
!
!
!
!
!
!
!
!
!!!
!
!
!
!!
!
!
!
!
!!
!
!
!
!
!
!
!
!
!!
!
!
!
!
!
!
!!
!
!
!!
!
!
!!
!
!
!!
!!
!
!
!!
!!!!!
!
!
!
!
!
!
!
!
!
!
!
!
!
!
!
!
!
!
!
!
!
!
!
!
!
!
!!
!!!
!
!
!
!
!!
!
!
!
!
!
!
!
!
!!
!
!
!
!
!
!
!
!
!
!
!
!
!
!
!
!
!
!
!
!
!
!
!
!
!
!
!
!
!
!
!
!
!
!
!
!
!!
!
!
!!
! !!
!
!
!!
!!
!!!
!
!
!
!!
!!
!
!
!
!!
!
!
!!
!
!
!
!!
!
!!
!!!!
!
!
!!
!
!
!
!!
!!
!
!
!
!
!
!!!
!
!
!
!
!
!!!
!!!
!
!
! !
!
!
!
!
!
!
!
!
!
!
!
!
!
!
!!
!
!
!
!
!
!
!
!
!
!
!
!
!
!
!
!
!
!
!
!
!!!
!!
!
!
!
!!
!
!
!
!
!
!
!
!
!
!
!
!
!
!
!!
!!
!!
!
!
!
!
!
!
!
!
!
!
!
!
!
!
!
!
!
!
!
!
!
!
!
!
!
!
!
!
!
!
!
!!
!
!
!
!
!
!
!
!! !
! !
!
!!
!
!
!
!
!
!
!
!
!
!
!
!
!! !
!
!
!
!
!
!!!! !
!!!
!
!
!!!!!
!
!
!
!
!
!
!!
!
!
!!
!
!!
!
!!!
!
!!
!
!
!
!
!
!
!
!
!
!!!!
!
!!
!
!!
!
!
!!
!
!
!
!
!
!
!
!
!! !
!!!
!!
!!
!
!!
!!
!
!
!
!!
!
!
!!
!
!
!
!!!
!!
!
!
!
!
!
!
!!!
!
!
!!
!
!
!
!
!
!
!
!!!
!
!
!
!
!
!
!
!
!
!
!
!
!!!!
!!
!
!!
!!
!
!
!
!
!
!!!
!
!
!
!
!
!
!
!
!
!
!!
!
!!
!!!!
!
!
!!!
!
!!
!!
!
!
!
!
!
!
!
!
!
!
!!!!
!
!
!
!
!!
!
!
!
!
!
!
!
!!
!!
!
!
!!
!
!
!!
!
!
!!
!
!!
!
!
!
!
!
!!
!
!
!
!
!
!
!
!
!
!
!
!!!
!
!
!!
!
!!
!
!
!
!!
!!!
!!!
!
!
!
!
!
!!
!
!
!
!
!
!
!
!
!
!
!
!
!!
!
!
!
!
!
!
!
!
!
!
!
!
!
!!
!
!
!
!!!!
!
!
!
!
!
!
!
!!!
!
!!
!!
!
!
!
!
!
!
! !
!
!
!
!
!
!
!
!!
!
!
!!
!
!
!
!
!
!
!
!
!
!
!
!
!
!
!
!
!
!
!
!
!
!
!
!
!
!
!
!
!
!
!
!
!
!!
!
!
! !
!
!
!!!
!
!
!
!!!
!
!
!
!
!!
!
!
!
!
!
!
!
!!
!!
!!
!
!
!
!!!
!
!
!
!!
! !!
!!!
!!!
!!
!!
!
!
!
!
!
!
!!
!
!
!
!
!
!
!
!
!
!
!
!
!
!
!
!
!
!
!!
!
!
!
!
!
!
!!
!
!
!
!
!
!
!
!
!
!
!
!
!
!
!
!
!
!
!
!!
!
!
!
!
!
!!
!
!
!
!
!
!
!
!
!
!!
!
!
!
!
!!
!
!
!
!
!
!
!
!
!
!
!
!
!!
!!
!
!!!!
!
!
!
!
!
!
!
!
!
!
!
!!
!
!!
!!
!
!
!
!
!
!
!
!
!
!
!
!
!!
!
!
!
!
!
!
!!
!
!
!
!
!
!
! !
!
!!
!!
!!!
!
!
!
!
!
!!
!
!
!
!
!
!
!
!
!
!
!
!!
!!
!
!
!
!
!
!
!!
!
!
!
!
!
!
!
!!
!!
!!
!
! !
Poverty density(Absolute number of poor)
!
!
!
!
1 Dot = 100 people!
below the poverty line
Pakxe
Sekong
Attapeu
Xamneua
Pakxanh
Thakhek
Phonhong
Huay Xay
Saravane
Xayabury
VIENTIANE
Phonsavan
Phongsaly
Muang Xay
Savannakhet
Luang Namtha
Luang Prabang
Xaisomboun
!.
!.
!.
!.
!.
!.
!.
!.
!.
!.
!.
!.
!.
!.
!.
!.
!.
!.
Map 2: Poverty Density
Sources: Authors’ calculation based on 2012/13 LECS-5 and 2015 Lao PDR Census
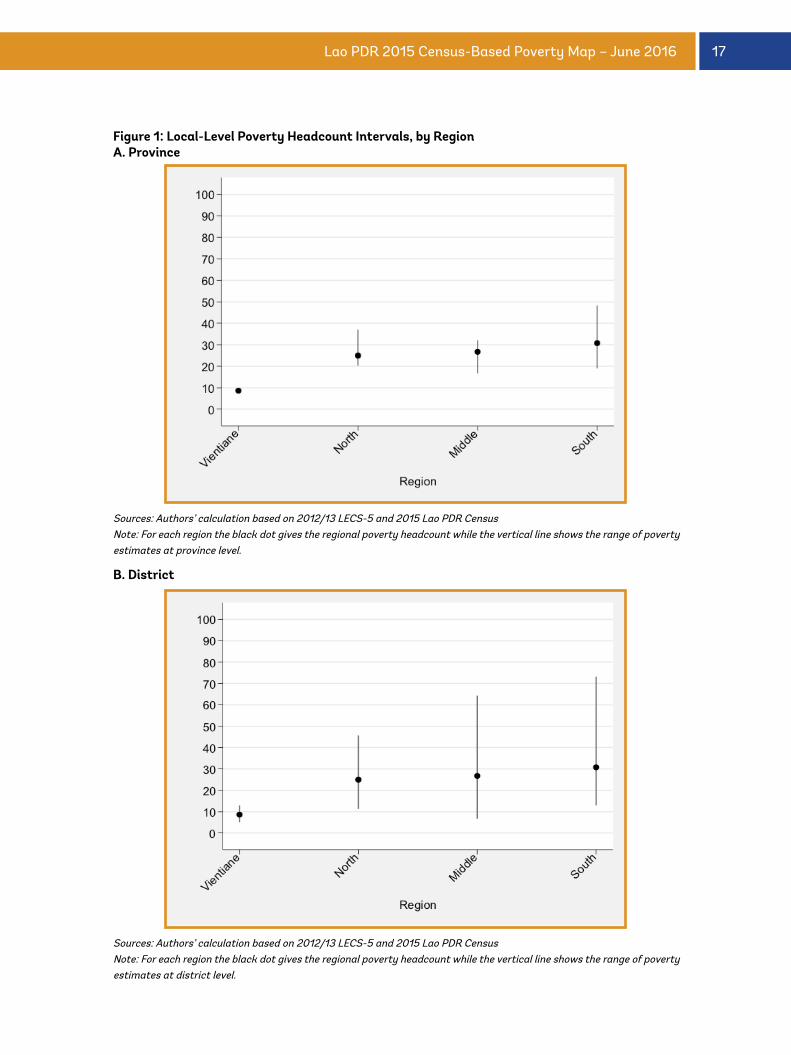
17Lao PDR 2015 Census-Based Poverty Map – June 2016
Figure 1: Local-Level Poverty Headcount Intervals, by RegionA. Province
B. District
Sources: Authors’ calculation based on 2012/13 LECS-5 and 2015 Lao PDR CensusNote: For each region the black dot gives the regional poverty headcount while the vertical line shows the range of poverty estimates at province level.
Sources: Authors’ calculation based on 2012/13 LECS-5 and 2015 Lao PDR CensusNote: For each region the black dot gives the regional poverty headcount while the vertical line shows the range of poverty estimates at district level.
18 Lao PDR 2015 Census-Based Poverty Map – June 2016
Non-Monetary Indicators
The 18 Sustainable Development Goals
(SDGs)4 are currently monitored by around
250 different indicators. Many of them have
already been computed at the national level
in the case of Lao PDR. Having national level
SDG indicators is useful for monitoring trends
but policy-makers prefer disaggregated
figures at the local level. SDG indicators at
these administrative levels permit better
geographical targeting and are therefore likely
to reduce poverty more for a given budget.
However many indicators are only meant
to be computed at the national level (e.g.
proportion of women in parliament). The first
two indicators (poverty headcount and poverty
gap ratio) have already been presented above.
This section presents the results of 29 non-
monetary indicators computed from the 2015
Lao PDR Census at the province and district
levels. Although we could not, in some cases,
compute SDG indicators according to their
official definition, our non-monetary indicators
are all inspired by SDGs even if in many cases
we go beyond them. Since poverty is a multi-
dimensional issue, these 29 indicators should
be seen as complementary to the monetary
poverty map indicators.
Table 1 defines each of these indicators and
presents their computed values at the national
level as well as the average by gender when
appropriate. The province- and district-level
figures are presented in a series of maps (Maps
4 to 24) in Appendix 6. In each case, two
different panels map the figures by province
and district. The index numbers, as shown in
the first column of Table 1, are reproduced in
the Map titles to simplify reading of the maps.
Tables showing point estimates for the same
statistics can be found in Appendix 9, for the
education-related indicators, and Appendix 10
for the other indicators.
In all cases, the different province and district
maps clearly show large spatial disparities
between the different geographical units. Such
spatial heterogeneity means that geographical
targeting could yield significant efficiency
gains if any of these indicators are used for
targeting.
Maps 4 to 14 present the different education-
related indicators while the other ones are
found in Maps 15 to 24. Net school enrolment
rates at the primary and, lower and upper
secondary levels are presented in Maps 6, 7
and 8, respectively. At 75.5% (Table 1), primary
school enrolment rates are clearly on the low
side when compared to other countries. But
that nationwide rate obviously hides large
spatial disparities. Urban districts tend to have
much higher rates while some isolated rural
areas, suffer from very low rates. In particular,
the isolated group of districts in the south-east
part of the country along the Vietnam border
has the lowest enrolment rates. The northern
most districts also present below average
enrolment rates. The same pattern holds for
both lower and upper secondary enrolment but
at much lower levels. This is particularly the
4 Although no data assessment of the different Sustainable Development Goal (SDG) indicators has been performed
yet in Lao PDR, we believe we are presenting most SDG indicators that can be computed from 2015 Lao PDR Census
database. Such data assessment has been done in only a handful of countries, including neighboring Myanmar (see
Coulombe and Dietsch, 2016).
19Lao PDR 2015 Census-Based Poverty Map – June 2016
case of female population. The next three Maps
(9,10 and 11), present the gross enrolment rates
for the same education levels. Having higher
gross rates and net rates clearly shows that
many children either start school at a later age
than planned or do not progress as fast as they
should. Otherwise the geographical pattern for
the net and gross rates are similar.
Since literacy rates depends from past
enrolment rates it is unsurprising that literacy
rates – for both males and females – follow
a geographical pattern similar to the school
enrolment rate (Maps 4 and 5).
For both primary and secondary levels, we
computed the girl-to-boy ratio among children
attending school as a measure of gender
inequality (see Maps 12). Nationwide, the ratio
slightly favours boys at all education levels,
(Table 1). Although these ratios vary widely
across provinces and districts, no geographical
pattern is discernible except that southwest
districts along the Thai border seem to be
closer to gender equality than elsewhere. We
came to the same conclusion – that there is
no discernible geographical pattern – for the
other gender inequality indicator, namely the
proportion of women in wage employment in
the non-agricultural sector (Maps 21).
Out-of-school children is becoming more and
more the focus of policy makers (UIS and
UNICEF, 2015). Maps 13 and 14 shows out-
of-school rates and numbers of out-of-school
children for respectively the 6-11 and 12-18 age
groups. Obviously the geographical pattern is
somehow reciprocal to net or gross enrollment
rate. For both age-groups the northern tip
and the southern part of the country have the
highest rates. However the actual numbers
of out-of-school children would also depend
on the population. Therefore, Vientiane has a
significant number of out-of-school children
even if the rate is not so high.
Maps 15 present the employment5 rate for
the 15 to 64 age group at both administrative
levels, though we concentrate our discussion on
district-level figures – the most disaggregated
level presented in this report. A close
examination reveals a very large spread in
employment rates, from only 61% to a much
higher 92%. No clear pattern emerges from
the maps although districts with lower rates
tend to be found in clusters, particularly in the
case of female in districts close to the capital.
Further investigation focussing on types of
economic activities and infrastructure would
be needed to fully explain that geographical
pattern.
Nationwide, the percentage of self-employed
workers stands at 85% (Table 1), but this figure
conceals huge differences across districts.
Map 16 shows that district-level figures range
from relatively low level in districts around the
capital to almost 100% in most remaining rural
districts.
The unemployment rate among prime-age
individuals (indicator [21]) is rather low at 1.1%,
but the unemployment rate for the younger
population (indicator [20]) is almost four
times higher at 4.2%. Maps 17 and 18 show
5 In this report we define “employment” in its broadest meaning and therefore we include wage earners as well as non-
employee workers such as employers, own account workers and unpaid family workers.
20 Lao PDR 2015 Census-Based Poverty Map – June 2016
that unemployment rates for both groups
have a similar geographical pattern, with high
unemployment rates essentially being a city
phenomenon.
The proportion of non-agricultural workers
reflect the economic transformation of a
countries away from agricultural and toward
manufacturing and services. Maps 19 and
20 show, without surprise, that the capital
Vientiane and other predominately urban
districts have most non-agricultural workers
and that the rural areas remain deeply based
on farming.
The demographic dependence rate is defined
as the proportion of individuals unlikely
to economically active, i.e. the population
below 18 or older than 64 years old. A higher
dependency rate makes households more likely
to be poor, since fewer household members
are breadwinners. Map 21 shows no real
geographical pattern except a lower ratio
in the four major cities and in the districts
surrounding them.
From the Census questionnaire, a series of
infrastructure indicators were calculated and
are presented in Maps 23 & 24. Improved
sanitation, improved source of drinking water,
not using wood as the main source of cooking
fuel, access to electricity and ownership of a
phone all follow a rather similar geographical
pattern although the levels are very different.
For all those indicators rates are much higher
in Vientiane and the surrounding provinces
and districts. Otherwise, households living in
districts along the Thai border are better off
when standard of living is measured by those
physical indicators.
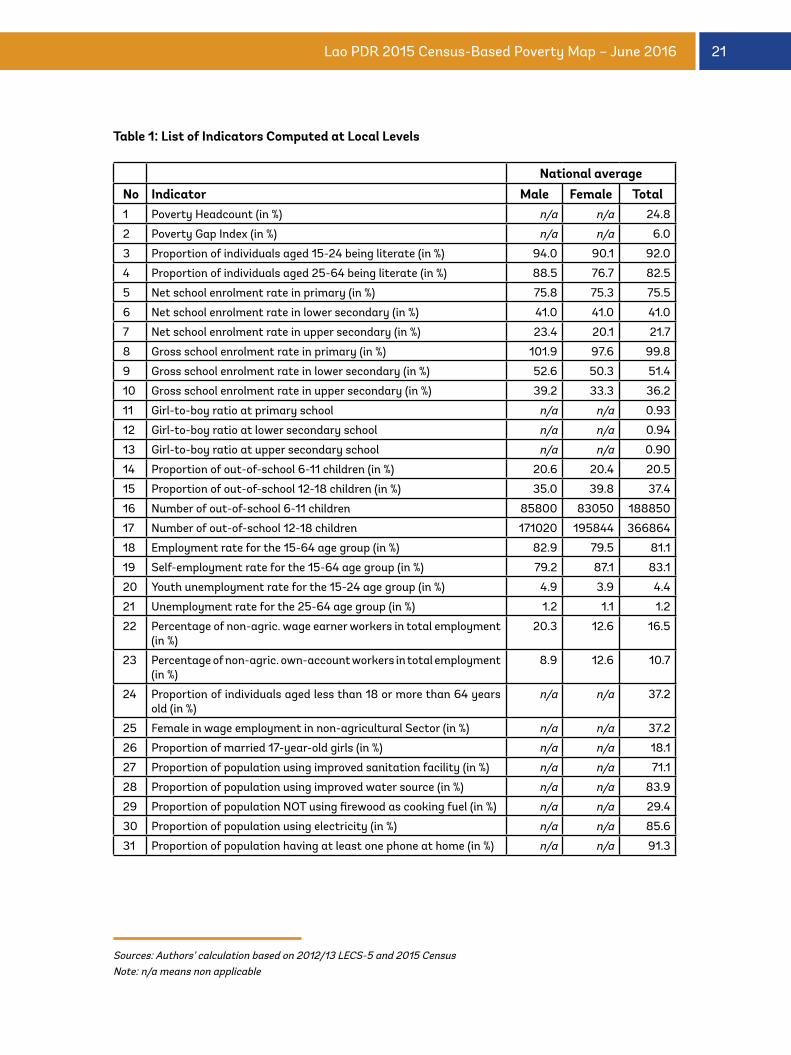
21Lao PDR 2015 Census-Based Poverty Map – June 2016
Table 1: List of Indicators Computed at Local Levels
National averageNo Indicator Male Female Total1 Poverty Headcount (in %) n/a n/a 24.8
2 Poverty Gap Index (in %) n/a n/a 6.0
3 Proportion of individuals aged 15-24 being literate (in %) 94.0 90.1 92.0
4 Proportion of individuals aged 25-64 being literate (in %) 88.5 76.7 82.5
5 Net school enrolment rate in primary (in %) 75.8 75.3 75.5
6 Net school enrolment rate in lower secondary (in %) 41.0 41.0 41.0
7 Net school enrolment rate in upper secondary (in %) 23.4 20.1 21.7
8 Gross school enrolment rate in primary (in %) 101.9 97.6 99.8
9 Gross school enrolment rate in lower secondary (in %) 52.6 50.3 51.4
10 Gross school enrolment rate in upper secondary (in %) 39.2 33.3 36.2
11 Girl-to-boy ratio at primary school n/a n/a 0.93
12 Girl-to-boy ratio at lower secondary school n/a n/a 0.94
13 Girl-to-boy ratio at upper secondary school n/a n/a 0.90
14 Proportion of out-of-school 6-11 children (in %) 20.6 20.4 20.5
15 Proportion of out-of-school 12-18 children (in %) 35.0 39.8 37.4
16 Number of out-of-school 6-11 children 85800 83050 188850
17 Number of out-of-school 12-18 children 171020 195844 366864
18 Employment rate for the 15-64 age group (in %) 82.9 79.5 81.1
19 Self-employment rate for the 15-64 age group (in %) 79.2 87.1 83.1
20 Youth unemployment rate for the 15-24 age group (in %) 4.9 3.9 4.4
21 Unemployment rate for the 25-64 age group (in %) 1.2 1.1 1.2
22 Percentage of non-agric. wage earner workers in total employment (in %)
20.3 12.6 16.5
23 Percentage of non-agric. own-account workers in total employment (in %)
8.9 12.6 10.7
24 Proportion of individuals aged less than 18 or more than 64 years old (in %)
n/a n/a 37.2
25 Female in wage employment in non-agricultural Sector (in %) n/a n/a 37.2
26 Proportion of married 17-year-old girls (in %) n/a n/a 18.1
27 Proportion of population using improved sanitation facility (in %) n/a n/a 71.1
28 Proportion of population using improved water source (in %) n/a n/a 83.9
29 Proportion of population NOT using firewood as cooking fuel (in %) n/a n/a 29.4
30 Proportion of population using electricity (in %) n/a n/a 85.6
31 Proportion of population having at least one phone at home (in %) n/a n/a 91.3
Sources: Authors’ calculation based on 2012/13 LECS-5 and 2015 Census Note: n/a means non applicable
22 Lao PDR 2015 Census-Based Poverty Map – June 2016
Relationship Between the Different Poverty Indicators
It has become customary to suggest that
monetary poverty maps, which provide detailed
information on monetary poverty at low levels
of geographic disaggregation, can be used to
target a wide range of programs. However,
it is not clear whether an education or health
program should also be targeted on the basis of
monetary poverty indicators, as opposed to a
map of education or infrastructure deprivation,
however how that would be defined. This is
why a substantial part of this study consists of
providing different maps based on the 29 non-
monetary indicators that could be computed
from the Population and Housing Census 2015.
In the previous sub-section, we saw that in
many cases the poverty headcount tends
to be weakly associated with non-monetary
indicators – we here formalize our examination
of correlations between the different poverty
indicators. A table of correlations between all
31 poverty indicators previously analysed at
the district level can be found in Appendix 7.
A close examination reveals that correlations
are low in many cases, though some pairs of
indicators are rather highly correlated. For
example, electrification [30] is somehow
correlated with improved sanitation [27]
and phone ownership [31]; but its correlation
with school enrolment depends on the level
(mildly positive with secondary, but lower with
primary).
Overall, the lack of high correlation between
the monetary poverty headcount and
other indicators (employment, education or
infrastructure) clearly reveals the need to use
more than one indicator to properly target the
needy population. For example, we can imagine
that an investment in public infrastructure
could use both infrastructure and poverty
indicators if the objective is to both reduce
poverty and increase access to public services.
23Lao PDR 2015 Census-Based Poverty Map – June 2016
24 Lao PDR 2015 Census-Based Poverty Map – June 2016
This report has documented the construction
of a series of province- and district-level
monetary poverty maps for Lao PDR, based on
the most recent Population and Housing Census
conducted in 2015 and the 2012/13 LECS-5
household survey. These results are consistent
with the ones from the latest Poverty Profile
and therefore can be viewed as an extension
of the poverty profile – a way to operationalise
its results. The monetary poverty maps are
complemented by a series of non-monetary
indicators focussing on employment, education
and infrastructure. All the different indicators
were computed for each of the 18 provinces
and 148 districts of Lao PDR.
However interesting these results may be, they
are only valuable if properly used. How? Among
other possibilities, these results can be used to
design budget allocation rules to be applied
by different administrative levels to their
subdivisions. For example, when the Central
Government has a budget to be distributed
amongst the different districts and wishes to
maximise its effect on poverty alleviation, a key
question is should that budget be distributed?
Based on monetary poverty indicators,
different rules can be adopted.
Using non-monetary indicators to raise the
standard of living of the population can be
easier, although it would necessarily target
with different objectives. For example, if policy-
makers want to improve access to electricity,
it is straightforward to target districts such
as Xaychamphone (in Borikhamxay province)
– along with many others – that have the
lowest access to electricity and incidentally
is also of the poorest district. However
multiple indicators approach would be trickier
in districts such as Samphanh (in Phongsaly
Province) which has a relatively low poverty
headcount ratio but have a massive lack of
access to electricity.
These maps could be a key tool in support of the
decentralisation process currently undertaken
in Lao PDR. For example, we can imagine that
the Government would distribute a budget to
provinces or districts according to their level of
monetary poverty, and then the local authority
would use that budget to prioritise investment
(in health, education, infrastructure etc.)
according to its own local needs, using non-
monetary indicators as guidelines.
Others uses of the poverty map might include
the evaluation of locally targeted anti-poverty
programs, for example monitoring progress in
priority districts. Finally, researchers could use
it in a multitude of ways, such as for studying
relationships between poverty distribution and
different socio-economic outcomes.
IV. Concluding Remarks
25Lao PDR 2015 Census-Based Poverty Map – June 2016
Coulombe, Harold and Quentin Wodon, 2007, Combining Census and household survey data for
better targeting: The West and Central Africa Poverty Mapping Initiative, Findings Africa
Region No. 280, The World Bank, Washington, D.C.
Coulombe, Harold and Marie-Noelle Dietsch, 2016, Readiness of Myanmar’s Official Statistics for
the Sustainable Development Goals, Naw Pyi Taw: CSO and UNDP
Elbers, Chris, Jean O. Lanjouw and Peter Lanjouw, 2003, “Micro-Level Estimation of Poverty and
Inequality” Econometrica, 71(1), 355-364
Epprecht, Michael, Nicholas Minot, Reno Dewina, Peter Messerli, Andreas Heinimann, 2008,
“The Geography of Poverty and Inequality in the Lao PDR” Centre for Development and
Environment CDE, University of Bern, and International Food Policy Research Institute
IFPRI), Bern: Geographica Bernensia.
Foster, J.E., J. Greer and E. Thorbecke, 1984, A Class of Decomposable Poverty Measures,
Econometrica 52: 761-766
Pimhidzai, Obert, Nina Fenton, Phonesaly Souksavath and Vilaysouk Sisoulath, 2014, Poverty
Profile in Lao PDR: Poverty Report for the Lao Consumption and Expenditure, Vientiane:
LSB
Mistiaen, Johan, Berk Ozler, Tiaray Razafimanantena and Jean Razafindravonona, 2002, Putting
Welfare on the Map in Madagascar, Africa Region Working Paper Series, Number 34, The
World Bank. Washington, D.C.
UIS and UNICEF, 2015, Fixing the Broken Promise of Education for All – Findings from the Global
Initiative on Out-of-School Children, Montreal: UNESCO Institute of Statistics.
Zhao, Qinghua and Peter Lanjouw, 2012, Using PovMap 2: A User’s Guide, mimeo, Development
research Group, The World Bank, Washington, D.C.
References
26 Lao PDR 2015 Census-Based Poverty Map – June 2016
Appendix 1: Monetary Poverty Methodology
The basic idea behind the methodology
developed by Elbers, Lanjouw and Lanjouw
(2003) is straightforward. First, a regression
model of log of per-capita expenditure is
estimated using survey data, employing
a set of explanatory variables which are
common to both a survey and a Census. Next,
parameters from the regression are used to
predict expenditure for every household in the
Census. And third, a series of welfare indicators
are constructed for different geographical
subgroups.
The term “welfare indicator” embraces a
whole set of indicators based on household
expenditures. This note emphasises the
poverty headcount (P0), but the usual poverty
and inequality indicators can be computed
(Atkinson inequality measures, generalised
Entropy class inequalities index, FGT poverty
measures and Gini).
Although the idea is rather simple, its proper
implementation requires complex computation
if one is to account for spatial autocorrelation
and heteroskedasticity in the regression
model. Furthermore, proper calculation of the
different welfare indicators and their standard
errors increase the complexity greatly.
The discussion below is divided into three
parts, one for each stage necessary in the
construction of a poverty map. This discussion
borrows from the original theoretical papers of
Elbers, Lanjouw and Lanjouw as well as from
Mistiaen et al. (2002).
First Stage
In the first instance, we need to determine a set
of explanatory variables from both databases
that meet some criteria of comparability. In
order to be able to produce a poverty map
consistent with the associated poverty profile,
it is important to only select variables that are
fully comparable between the Census and the
survey. We start by checking the wording of
the different questions as well as the proposed
answer options. From the set of selected
questions we then build a series of variables
which are tested for comparability. Although
we might want to test the comparability of the
whole distributions of each variable, in practice
we only test the equality of their means. In
order to maximise the predictive power of
the second-stage models, all analyses are
performed at the strata level, including tests
of the comparability of the different variables
on which the definitive models are estimated.
The list of all potential variables and their
equality of means test results are available on
request.
Second Stage
We first model per-capita household
expenditure using the survey database. In
order to maximise accuracy, we estimate the
model separately for the urban areas and rural
areas.
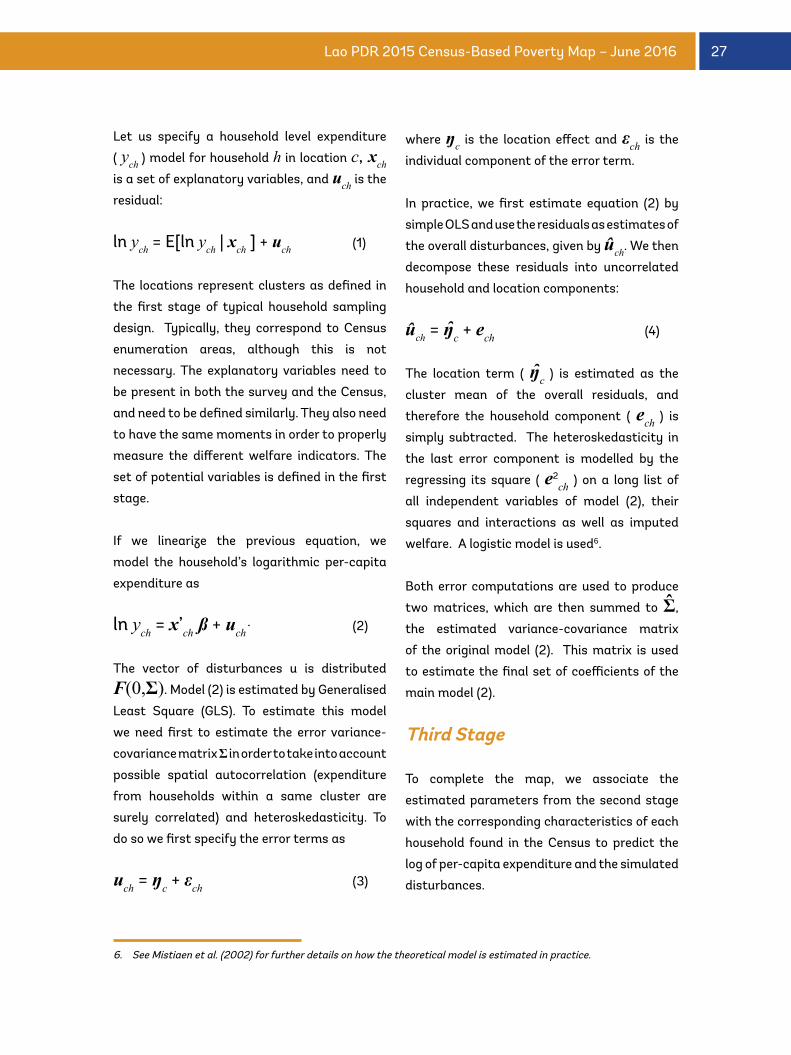
27Lao PDR 2015 Census-Based Poverty Map – June 2016
Let us specify a household level expenditure
( ych ) model for household h in location c, xch
is a set of explanatory variables, and uch is the
residual:
ln ych = E[ln ych | xch ] + uch (1)
The locations represent clusters as defined in
the first stage of typical household sampling
design. Typically, they correspond to Census
enumeration areas, although this is not
necessary. The explanatory variables need to
be present in both the survey and the Census,
and need to be defined similarly. They also need
to have the same moments in order to properly
measure the different welfare indicators. The
set of potential variables is defined in the first
stage.
If we linearize the previous equation, we
model the household’s logarithmic per-capita
expenditure as
ln ych = x’ch ß + uch (2)
The vector of disturbances u is distributed
Ϝ(0,Σ). Model (2) is estimated by Generalised
Least Square (GLS). To estimate this model
we need first to estimate the error variance-
covariance matrix Σ in order to take into account
possible spatial autocorrelation (expenditure
from households within a same cluster are
surely correlated) and heteroskedasticity. To
do so we first specify the error terms as
uch = ŋc + εch (3)
where ŋc is the location effect and εch is the
individual component of the error term.
In practice, we first estimate equation (2) by
simple OLS and use the residuals as estimates of
the overall disturbances, given by ûch. We then
decompose these residuals into uncorrelated
household and location components:
ûch = ŋc + еch (4)
The location term ( ŋc ) is estimated as the
cluster mean of the overall residuals, and
therefore the household component ( еch ) is
simply subtracted. The heteroskedasticity in
the last error component is modelled by the
regressing its square ( е2ch ) on a long list of
all independent variables of model (2), their
squares and interactions as well as imputed
welfare. A logistic model is used6.
Both error computations are used to produce
two matrices, which are then summed to Ʃ,
the estimated variance-covariance matrix
of the original model (2). This matrix is used
to estimate the final set of coefficients of the
main model (2).
Third Stage
To complete the map, we associate the
estimated parameters from the second stage
with the corresponding characteristics of each
household found in the Census to predict the
log of per-capita expenditure and the simulated
disturbances.
6. See Mistiaen et al. (2002) for further details on how the theoretical model is estimated in practice.
28 Lao PDR 2015 Census-Based Poverty Map – June 2016
Since the very complex disturbance structure
has made computation of the variance
of the imputed welfare index intractable,
bootstrapping techniques were used to obtain
a measure of the dispersion of that imputed
welfare index. From the previous stage, a
series of coefficients and disturbance terms
have been drawn from their corresponding
distributions. Then, for each household found
in the Census, we simulate a value of welfare
index ( y rch ) based on the predicted values and
the disturbance terms:
y rch = exp(x'ch ßc + ŋ r
c + ε rch ) (5)
That process is repeated 100 times, each
time redrawing the full set of coefficients and
disturbance terms. The mean of the simulated
welfare index becomes our point estimate
and the standard deviation of our welfare
index is the standard error of these simulated
estimates.
29Lao PDR 2015 Census-Based Poverty Map – June 2016
Photo by Stanislas Fradelizi / World Bank, 2011
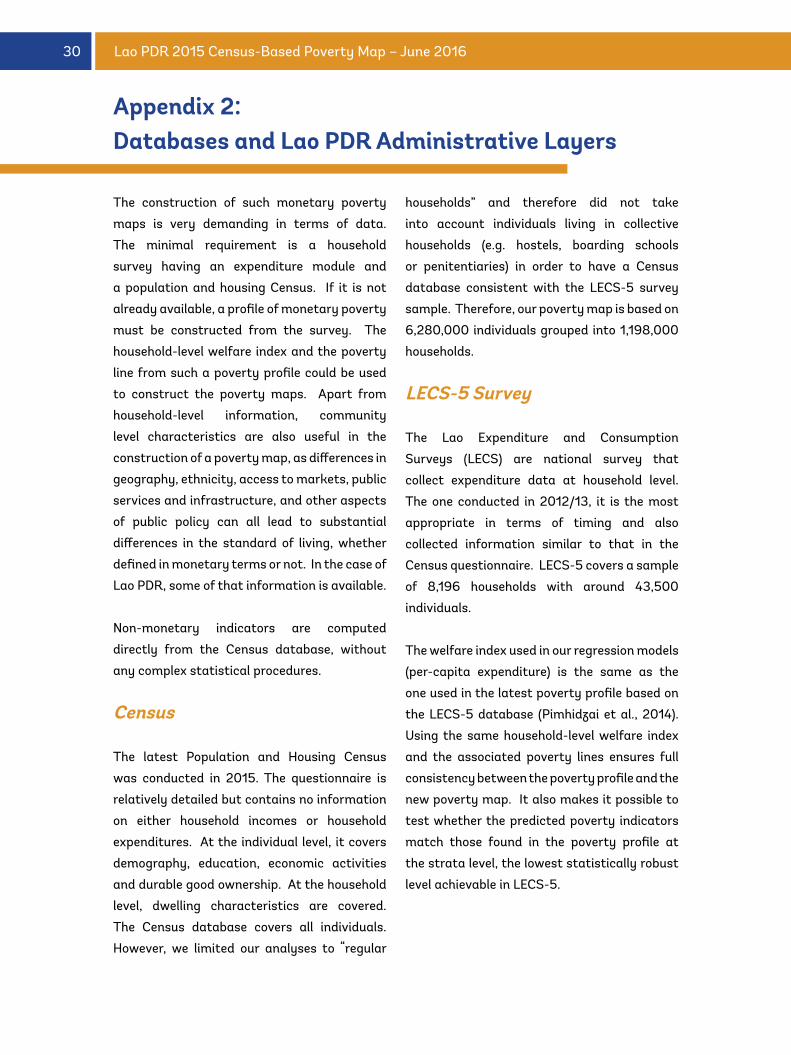
30 Lao PDR 2015 Census-Based Poverty Map – June 2016
The construction of such monetary poverty
maps is very demanding in terms of data.
The minimal requirement is a household
survey having an expenditure module and
a population and housing Census. If it is not
already available, a profile of monetary poverty
must be constructed from the survey. The
household-level welfare index and the poverty
line from such a poverty profile could be used
to construct the poverty maps. Apart from
household-level information, community
level characteristics are also useful in the
construction of a poverty map, as differences in
geography, ethnicity, access to markets, public
services and infrastructure, and other aspects
of public policy can all lead to substantial
differences in the standard of living, whether
defined in monetary terms or not. In the case of
Lao PDR, some of that information is available.
Non-monetary indicators are computed
directly from the Census database, without
any complex statistical procedures.
Census
The latest Population and Housing Census
was conducted in 2015. The questionnaire is
relatively detailed but contains no information
on either household incomes or household
expenditures. At the individual level, it covers
demography, education, economic activities
and durable good ownership. At the household
level, dwelling characteristics are covered.
The Census database covers all individuals.
However, we limited our analyses to “regular
households” and therefore did not take
into account individuals living in collective
households (e.g. hostels, boarding schools
or penitentiaries) in order to have a Census
database consistent with the LECS-5 survey
sample. Therefore, our poverty map is based on
6,280,000 individuals grouped into 1,198,000
households.
LECS-5 Survey
The Lao Expenditure and Consumption
Surveys (LECS) are national survey that
collect expenditure data at household level.
The one conducted in 2012/13, it is the most
appropriate in terms of timing and also
collected information similar to that in the
Census questionnaire. LECS-5 covers a sample
of 8,196 households with around 43,500
individuals.
The welfare index used in our regression models
(per-capita expenditure) is the same as the
one used in the latest poverty profile based on
the LECS-5 database (Pimhidzai et al., 2014).
Using the same household-level welfare index
and the associated poverty lines ensures full
consistency between the poverty profile and the
new poverty map. It also makes it possible to
test whether the predicted poverty indicators
match those found in the poverty profile at
the strata level, the lowest statistically robust
level achievable in LECS-5.
Appendix 2:Databases and Lao PDR Administrative Layers
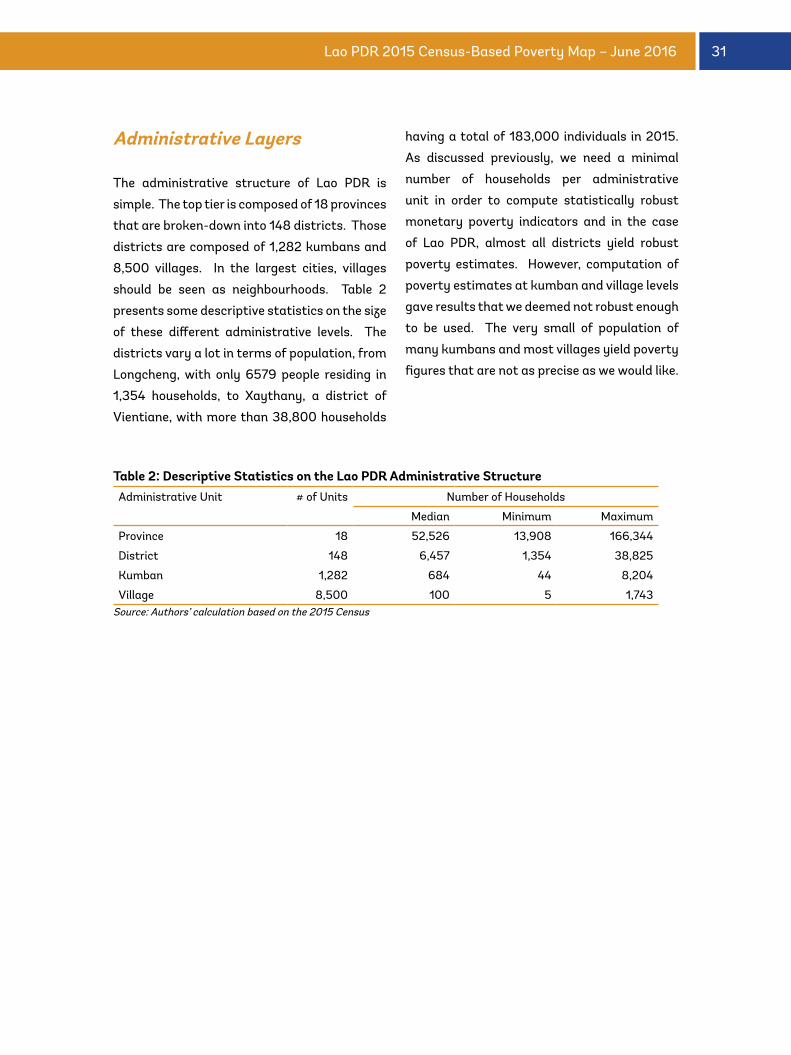
31Lao PDR 2015 Census-Based Poverty Map – June 2016
Administrative Layers
The administrative structure of Lao PDR is
simple. The top tier is composed of 18 provinces
that are broken-down into 148 districts. Those
districts are composed of 1,282 kumbans and
8,500 villages. In the largest cities, villages
should be seen as neighbourhoods. Table 2
presents some descriptive statistics on the size
of these different administrative levels. The
districts vary a lot in terms of population, from
Longcheng, with only 6579 people residing in
1,354 households, to Xaythany, a district of
Vientiane, with more than 38,800 households
having a total of 183,000 individuals in 2015.
As discussed previously, we need a minimal
number of households per administrative
unit in order to compute statistically robust
monetary poverty indicators and in the case
of Lao PDR, almost all districts yield robust
poverty estimates. However, computation of
poverty estimates at kumban and village levels
gave results that we deemed not robust enough
to be used. The very small of population of
many kumbans and most villages yield poverty
figures that are not as precise as we would like.
Table 2: Descriptive Statistics on the Lao PDR Administrative StructureAdministrative Unit # of Units Number of Households
Median Minimum Maximum
Province 18 52,526 13,908 166,344
District 148 6,457 1,354 38,825
Kumban 1,282 684 44 8,204
Village 8,500 100 5 1,743Source: Authors’ calculation based on the 2015 Census
32 Lao PDR 2015 Census-Based Poverty Map – June 2016
In Appendix 1, we describe in detail the
methodology behind computation of monetary
poverty from a theoretical perspective, while
the second appendix presents the required
datasets. The current appendix shows how the
theoretical methodology is applied in practice.
In order to maximise the accuracy of the poverty
estimates we estimate econometric models for
each of the three regions of Lao PDR (Northern,
Central and Southern) broken down into urban
and rural areas, with Vientiane Capital being a
separate strata. A household level expenditure
model has been developed for each of these
strata using explanatory variables which are
common to both the LECS-5 and the Census.
The procedure can be split into three separate
stages:
Stage 1: Aligning the Data
The first task was to make sure the variables
deemed common to both the Census and the
survey really measure the same characteristics.
In the first instance, we compared the questions
and modalities in both questionnaires to
identify potential variables. We then compared
the means of these (dichotomised) variables
and tested whether they were equal using a
95% confidence interval. Restricting ourselves
to these variables should ensure that our
predicted welfare figures will be consistent
with the survey-based poverty profile7. As
noted above, that comparison exercise was
done at strata level. The survey’s two-stage
sample design was taken into account in the
computation of the standard errors.
Stage 2: Survey-Based Regressions
Appendix 4 presents the strata-specific
regression (Ordinary Least Squares) results
based on the 2012/13 LECS-5 survey. The
ultimate choice of independent variables
was based on a backward stepwise selection
model. A check of the results confirmed
that all the coefficients have the expected
sign. As previously indicated, these models
are not for discussion. They are exclusively
prediction models, not determinants of
poverty models that can be analysed in terms
of causal relationships. In the models used
for the poverty map we were only concerned
with the predictive power of the regressors
without regard, for example, to endogenous
variables. We also ran a series of regressions
using the base model residuals as dependent
variables. These results – not shown here – are
used in the last stage in order to correct for
heteroskedasticity8.
Appendix 3:Monetary Poverty Methodology in Practice
7. We also deleted or redefined dichotomic variables less than 0.03 or more than 0.97 to avoid serious multicollinearity
problems in our econometric models.
8. As described in the methodology section and Appendix 1, two statistical problems are likely to violate Ordinary
Least Squares assumptions. Spatial autocorrelation (expenditure from households within a same cluster are surely
correlated, i.e. there are location effects) is minimized by incorporating into the regressions the means of some key
Enumeration Area variables. Heteroskedasticity (error terms are not constant across observations) is corrected by
modelling the error terms. Correcting for these two problems yields unbiased estimates. See Elbers et al. (2002, 2003)
and Mistiaen et al. (2002) for more details.
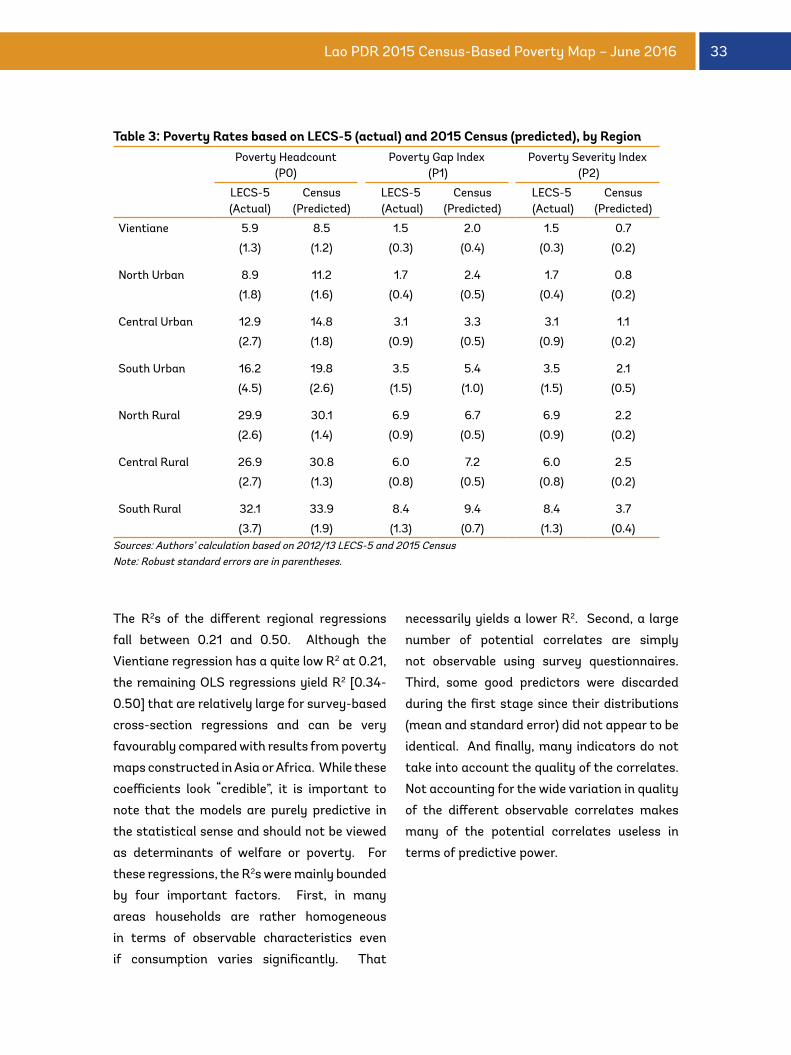
33Lao PDR 2015 Census-Based Poverty Map – June 2016
The R2s of the different regional regressions
fall between 0.21 and 0.50. Although the
Vientiane regression has a quite low R2 at 0.21,
the remaining OLS regressions yield R2 [0.34-
0.50] that are relatively large for survey-based
cross-section regressions and can be very
favourably compared with results from poverty
maps constructed in Asia or Africa. While these
coefficients look “credible”, it is important to
note that the models are purely predictive in
the statistical sense and should not be viewed
as determinants of welfare or poverty. For
these regressions, the R2s were mainly bounded
by four important factors. First, in many
areas households are rather homogeneous
in terms of observable characteristics even
if consumption varies significantly. That
necessarily yields a lower R2. Second, a large
number of potential correlates are simply
not observable using survey questionnaires.
Third, some good predictors were discarded
during the first stage since their distributions
(mean and standard error) did not appear to be
identical. And finally, many indicators do not
take into account the quality of the correlates.
Not accounting for the wide variation in quality
of the different observable correlates makes
many of the potential correlates useless in
terms of predictive power.
Table 3: Poverty Rates based on LECS-5 (actual) and 2015 Census (predicted), by RegionPoverty Headcount
(P0)Poverty Gap Index
(P1)Poverty Severity Index
(P2)
LECS-5(Actual)
Census (Predicted)
LECS-5 (Actual)
Census (Predicted)
LECS-5 (Actual)
Census (Predicted)
Vientiane 5.9 8.5 1.5 2.0 1.5 0.7
(1.3) (1.2) (0.3) (0.4) (0.3) (0.2)
North Urban 8.9 11.2 1.7 2.4 1.7 0.8
(1.8) (1.6) (0.4) (0.5) (0.4) (0.2)
Central Urban 12.9 14.8 3.1 3.3 3.1 1.1
(2.7) (1.8) (0.9) (0.5) (0.9) (0.2)
South Urban 16.2 19.8 3.5 5.4 3.5 2.1
(4.5) (2.6) (1.5) (1.0) (1.5) (0.5)
North Rural 29.9 30.1 6.9 6.7 6.9 2.2
(2.6) (1.4) (0.9) (0.5) (0.9) (0.2)
Central Rural 26.9 30.8 6.0 7.2 6.0 2.5
(2.7) (1.3) (0.8) (0.5) (0.8) (0.2)
South Rural 32.1 33.9 8.4 9.4 8.4 3.7
(3.7) (1.9) (1.3) (0.7) (1.3) (0.4)Sources: Authors’ calculation based on 2012/13 LECS-5 and 2015 Census Note: Robust standard errors are in parentheses.
34 Lao PDR 2015 Census-Based Poverty Map – June 2016
Stage 3: Welfare Indicators9
Based on the results from the previous stage,
we applied the estimated parameters10 to the
Census data to compute a series of poverty
indicators: the headcount ratio (P0), the
poverty gap index (P1) and the poverty severity
index (P2). Table 3 presents estimated poverty
figures for each strata and compares them
with actual figures from the latest survey-
based poverty profiles. For each strata and
poverty indicator, the equality of LECS-5-
based and Census-based indicators cannot
be rejected (using a 95% confidence interval)11.
The difference between the LECS-5-based and
Census-based headcount ratio is minimal in all
cases. Although Census-based poverty figures
can only be compared with the ones provided by
the LECS-5 survey at the strata level, equality
of these poverty figures provides an excellent
test of the reliability of the methodology used
here.
After having established the reliability of the
different predictive models, we estimated
poverty figures for the three disaggregated
levels described in Table 2: province and district.
Before presenting the actual results we need to
determine whether they are precise enough to
be useful. As discussed in the methodological
section, the precision of the poverty estimates
declines as the number of households in the
different administrative units falls. While
we expect district-level poverty estimates to
be precise enough it is legitimate to be more
skeptical about sub-district estimates.
How Low Can We Go?
In order to pass an “objective” judgement on
the precision of these estimates we computed
coefficients of variation for the three top
administrative levels (province, district and
kumban) and then compared them with an
arbitrary but commonly-used benchmark.
Figure 2 presents the headcount incidence
coefficients of variation of province-, district-
and kumban-level estimates and compares
them to a 0.2 benchmark. The lower curve
(represented by xs) in Figure 2 clearly shows
that our province-level headcount poverty
estimates do rather well while the accuracy
of district-level estimates fare very well in
most cases except in a few districts for which
the coefficient of variation is above the 0.2
benchmark. However, the results for the 1282
kumbans clearly show very high coefficients of
variation for most kumbans which pose a real
problem of reliability. Given that single reason
we decided to not present kumban estimates
and even less village ones. Figure 3 plots
these coefficients of variation against poverty
9. Computation of the welfare indicator has been greatly simplified thanks to PovMap 2.0, a computer program especially
written to implement the methodology used here. We used the latest version developed by Zhao and Lanjouw (2012).
10. Apart from regression models explaining the household welfare level, we also estimated a model for the heteroskedasticity
in the household component of the error. We also estimated the parametric distributions of both error terms for the
simulations. See the methodological Appendix for further details.
11. It is worth noting that the standard errors of the mean of the Census-based figures are systematically lower than the
ones calculated from LECS-5.
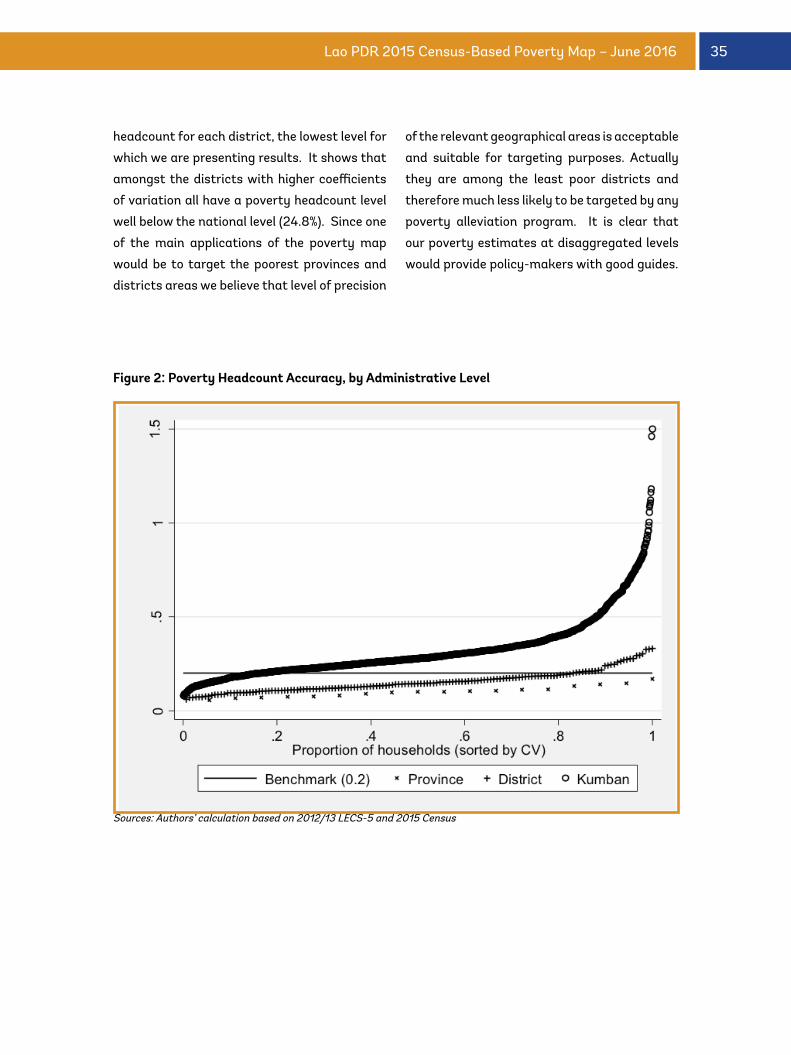
35Lao PDR 2015 Census-Based Poverty Map – June 2016
headcount for each district, the lowest level for
which we are presenting results. It shows that
amongst the districts with higher coefficients
of variation all have a poverty headcount level
well below the national level (24.8%). Since one
of the main applications of the poverty map
would be to target the poorest provinces and
districts areas we believe that level of precision
of the relevant geographical areas is acceptable
and suitable for targeting purposes. Actually
they are among the least poor districts and
therefore much less likely to be targeted by any
poverty alleviation program. It is clear that
our poverty estimates at disaggregated levels
would provide policy-makers with good guides.
Figure 2: Poverty Headcount Accuracy, by Administrative Level
Sources: Authors’ calculation based on 2012/13 LECS-5 and 2015 Census
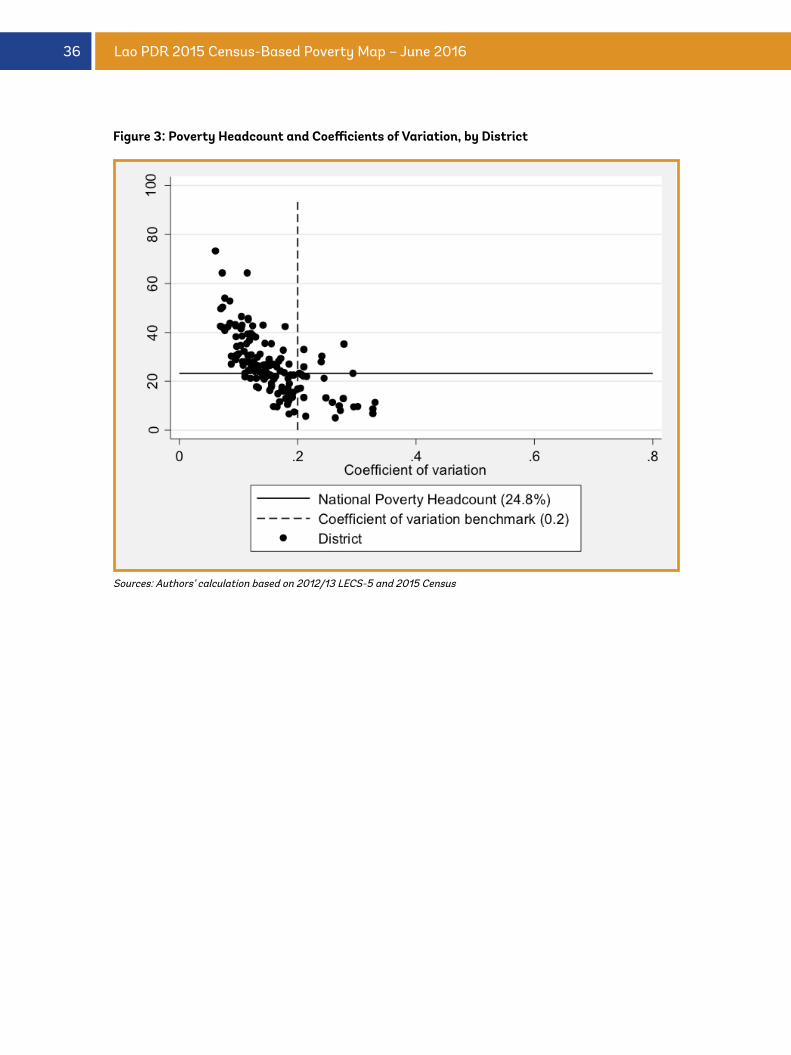
36 Lao PDR 2015 Census-Based Poverty Map – June 2016
Figure 3: Poverty Headcount and Coefficients of Variation, by District
Sources: Authors’ calculation based on 2012/13 LECS-5 and 2015 Census
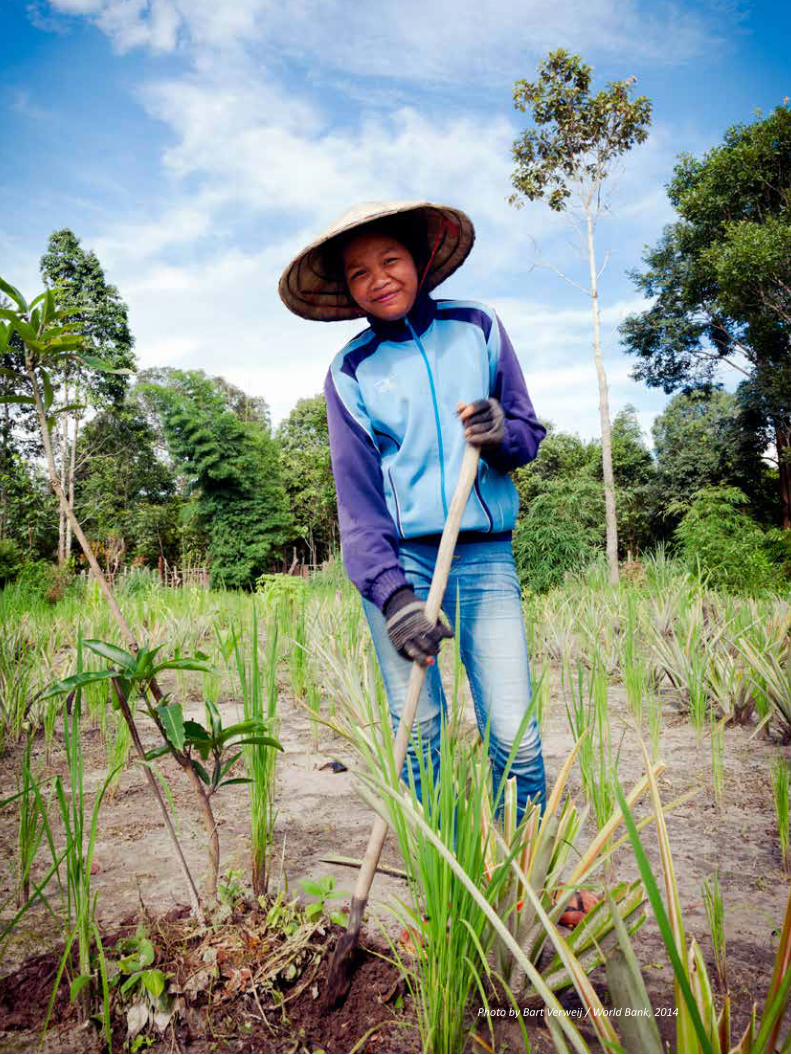
37Lao PDR 2015 Census-Based Poverty Map – June 2016
Photo by Bart Verweij / World Bank, 2014
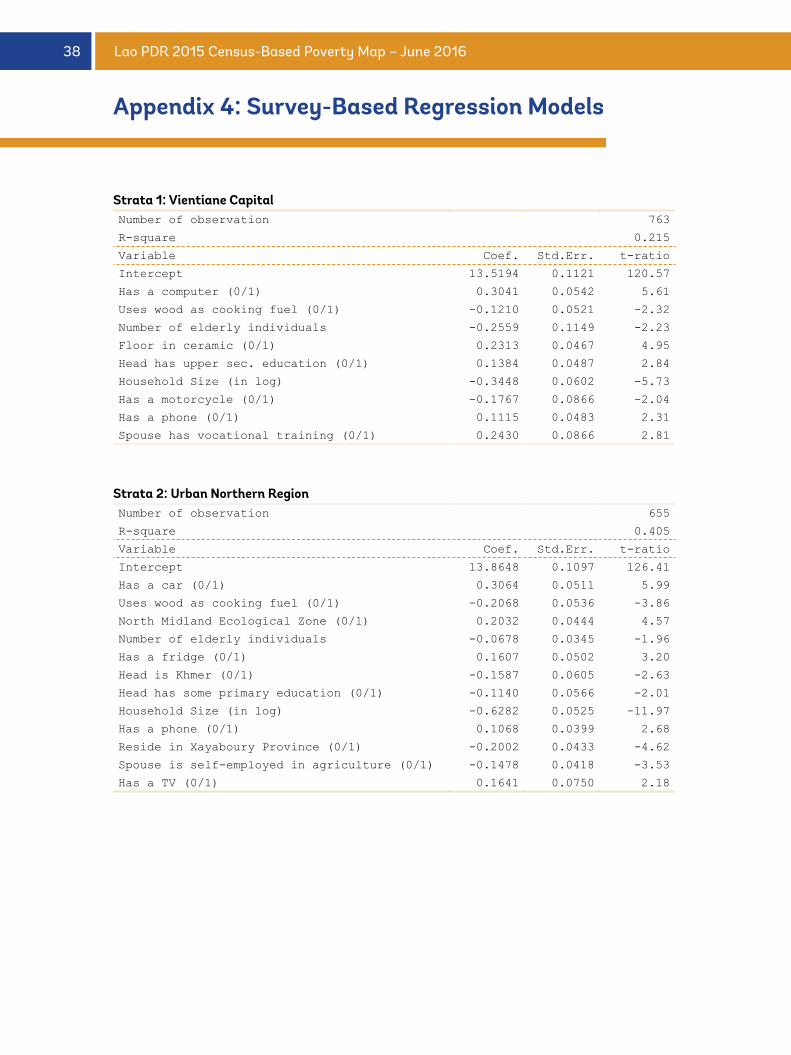
38 Lao PDR 2015 Census-Based Poverty Map – June 2016
Strata 1: Vientiane CapitalNumber of observation 763
R-square 0.215
Variable Coef. Std.Err. t-ratio
Intercept 13.5194 0.1121 120.57
Has a computer (0/1) 0.3041 0.0542 5.61
Uses wood as cooking fuel (0/1) -0.1210 0.0521 -2.32
Number of elderly individuals -0.2559 0.1149 -2.23
Floor in ceramic (0/1) 0.2313 0.0467 4.95
Head has upper sec. education (0/1) 0.1384 0.0487 2.84
Household Size (in log) -0.3448 0.0602 -5.73
Has a motorcycle (0/1) -0.1767 0.0866 -2.04
Has a phone (0/1) 0.1115 0.0483 2.31
Spouse has vocational training (0/1) 0.2430 0.0866 2.81
Strata 2: Urban Northern RegionNumber of observation 655
R-square 0.405
Variable Coef. Std.Err. t-ratio
Intercept 13.8648 0.1097 126.41
Has a car (0/1) 0.3064 0.0511 5.99
Uses wood as cooking fuel (0/1) -0.2068 0.0536 -3.86
North Midland Ecological Zone (0/1) 0.2032 0.0444 4.57
Number of elderly individuals -0.0678 0.0345 -1.96
Has a fridge (0/1) 0.1607 0.0502 3.20
Head is Khmer (0/1) -0.1587 0.0605 -2.63
Head has some primary education (0/1) -0.1140 0.0566 -2.01
Household Size (in log) -0.6282 0.0525 -11.97
Has a phone (0/1) 0.1068 0.0399 2.68
Reside in Xayaboury Province (0/1) -0.2002 0.0433 -4.62
Spouse is self-employed in agriculture (0/1) -0.1478 0.0418 -3.53
Has a TV (0/1) 0.1641 0.0750 2.18
Appendix 4: Survey-Based Regression Models
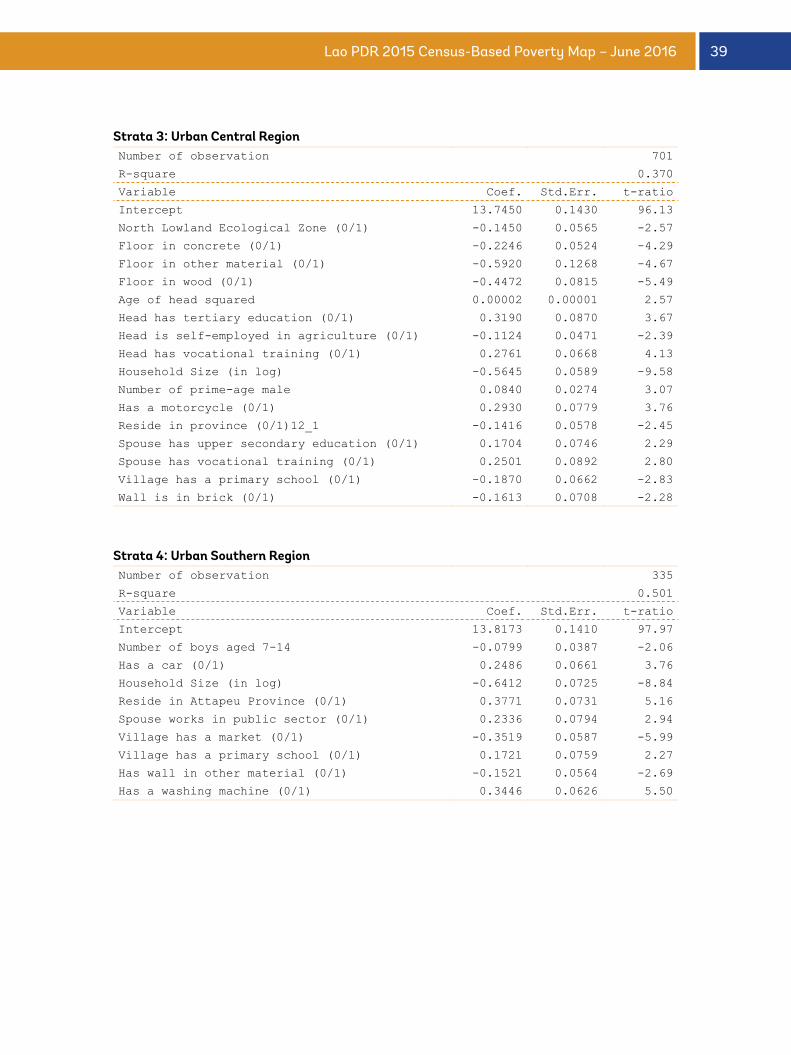
39Lao PDR 2015 Census-Based Poverty Map – June 2016
Strata 3: Urban Central RegionNumber of observation 701
R-square 0.370
Variable Coef. Std.Err. t-ratio
Intercept 13.7450 0.1430 96.13
North Lowland Ecological Zone (0/1) -0.1450 0.0565 -2.57
Floor in concrete (0/1) -0.2246 0.0524 -4.29
Floor in other material (0/1) -0.5920 0.1268 -4.67
Floor in wood (0/1) -0.4472 0.0815 -5.49
Age of head squared 0.00002 0.00001 2.57
Head has tertiary education (0/1) 0.3190 0.0870 3.67
Head is self-employed in agriculture (0/1) -0.1124 0.0471 -2.39
Head has vocational training (0/1) 0.2761 0.0668 4.13
Household Size (in log) -0.5645 0.0589 -9.58
Number of prime-age male 0.0840 0.0274 3.07
Has a motorcycle (0/1) 0.2930 0.0779 3.76
Reside in province (0/1)12_1 -0.1416 0.0578 -2.45
Spouse has upper secondary education (0/1) 0.1704 0.0746 2.29
Spouse has vocational training (0/1) 0.2501 0.0892 2.80
Village has a primary school (0/1) -0.1870 0.0662 -2.83
Wall is in brick (0/1) -0.1613 0.0708 -2.28
Strata 4: Urban Southern RegionNumber of observation 335
R-square 0.501
Variable Coef. Std.Err. t-ratio
Intercept 13.8173 0.1410 97.97
Number of boys aged 7-14 -0.0799 0.0387 -2.06
Has a car (0/1) 0.2486 0.0661 3.76
Household Size (in log) -0.6412 0.0725 -8.84
Reside in Attapeu Province (0/1) 0.3771 0.0731 5.16
Spouse works in public sector (0/1) 0.2336 0.0794 2.94
Village has a market (0/1) -0.3519 0.0587 -5.99
Village has a primary school (0/1) 0.1721 0.0759 2.27
Has wall in other material (0/1) -0.1521 0.0564 -2.69
Has a washing machine (0/1) 0.3446 0.0626 5.50
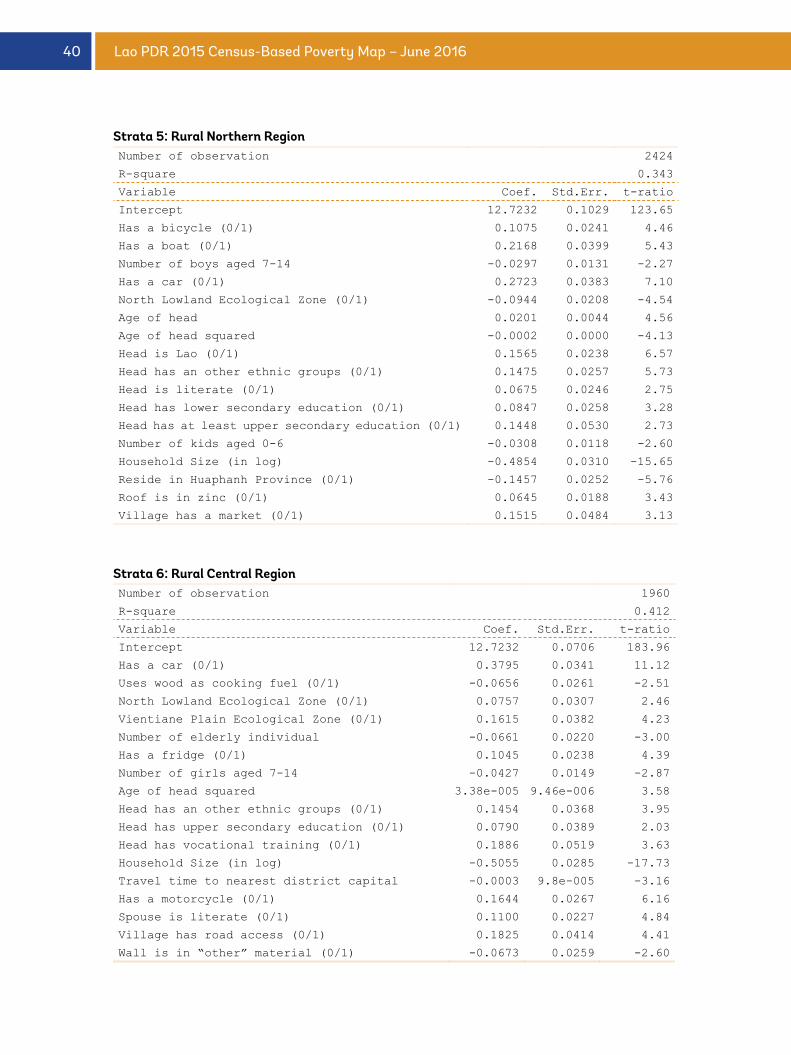
40 Lao PDR 2015 Census-Based Poverty Map – June 2016
Strata 5: Rural Northern RegionNumber of observation 2424
R-square 0.343
Variable Coef. Std.Err. t-ratio
Intercept 12.7232 0.1029 123.65
Has a bicycle (0/1) 0.1075 0.0241 4.46
Has a boat (0/1) 0.2168 0.0399 5.43
Number of boys aged 7-14 -0.0297 0.0131 -2.27
Has a car (0/1) 0.2723 0.0383 7.10
North Lowland Ecological Zone (0/1) -0.0944 0.0208 -4.54
Age of head 0.0201 0.0044 4.56
Age of head squared -0.0002 0.0000 -4.13
Head is Lao (0/1) 0.1565 0.0238 6.57
Head has an other ethnic groups (0/1) 0.1475 0.0257 5.73
Head is literate (0/1) 0.0675 0.0246 2.75
Head has lower secondary education (0/1) 0.0847 0.0258 3.28
Head has at least upper secondary education (0/1) 0.1448 0.0530 2.73
Number of kids aged 0-6 -0.0308 0.0118 -2.60
Household Size (in log) -0.4854 0.0310 -15.65
Reside in Huaphanh Province (0/1) -0.1457 0.0252 -5.76
Roof is in zinc (0/1) 0.0645 0.0188 3.43
Village has a market (0/1) 0.1515 0.0484 3.13
Strata 6: Rural Central RegionNumber of observation 1960
R-square 0.412
Variable Coef. Std.Err. t-ratio
Intercept 12.7232 0.0706 183.96
Has a car (0/1) 0.3795 0.0341 11.12
Uses wood as cooking fuel (0/1) -0.0656 0.0261 -2.51
North Lowland Ecological Zone (0/1) 0.0757 0.0307 2.46
Vientiane Plain Ecological Zone (0/1) 0.1615 0.0382 4.23
Number of elderly individual -0.0661 0.0220 -3.00
Has a fridge (0/1) 0.1045 0.0238 4.39
Number of girls aged 7-14 -0.0427 0.0149 -2.87
Age of head squared 3.38e-005 9.46e-006 3.58
Head has an other ethnic groups (0/1) 0.1454 0.0368 3.95
Head has upper secondary education (0/1) 0.0790 0.0389 2.03
Head has vocational training (0/1) 0.1886 0.0519 3.63
Household Size (in log) -0.5055 0.0285 -17.73
Travel time to nearest district capital -0.0003 9.8e-005 -3.16
Has a motorcycle (0/1) 0.1644 0.0267 6.16
Spouse is literate (0/1) 0.1100 0.0227 4.84
Village has road access (0/1) 0.1825 0.0414 4.41
Wall is in “other” material (0/1) -0.0673 0.0259 -2.60
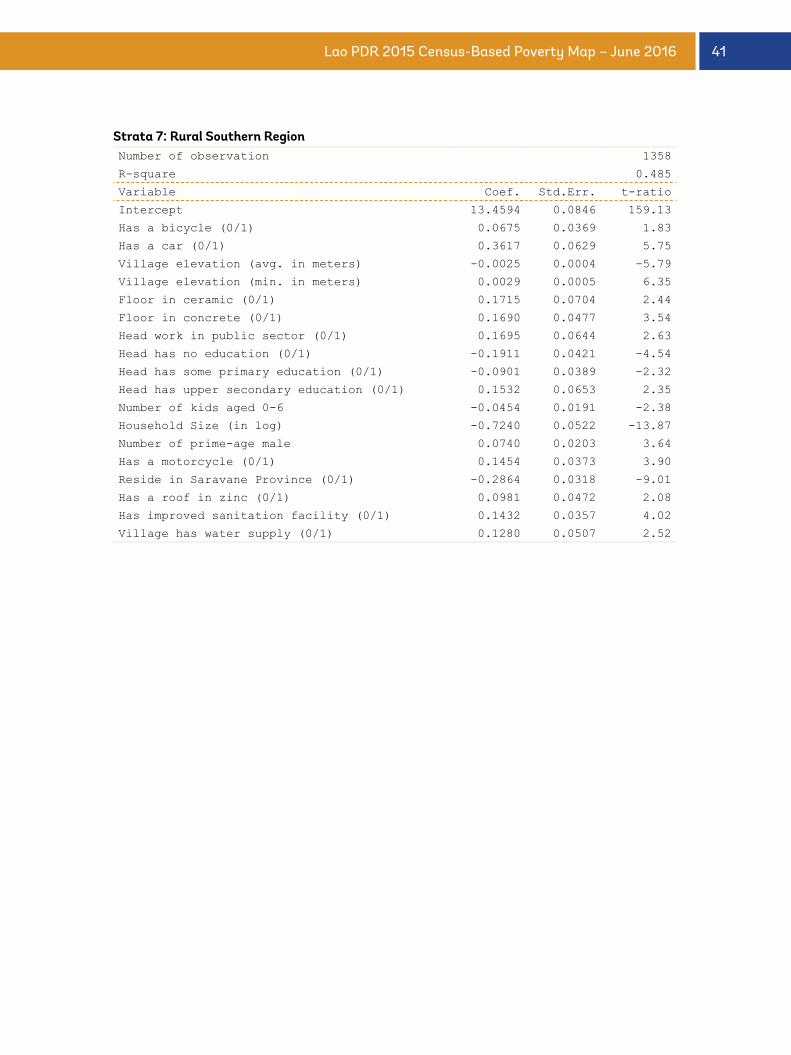
41Lao PDR 2015 Census-Based Poverty Map – June 2016
Strata 7: Rural Southern RegionNumber of observation 1358
R-square 0.485
Variable Coef. Std.Err. t-ratio
Intercept 13.4594 0.0846 159.13
Has a bicycle (0/1) 0.0675 0.0369 1.83
Has a car (0/1) 0.3617 0.0629 5.75
Village elevation (avg. in meters) -0.0025 0.0004 -5.79
Village elevation (min. in meters) 0.0029 0.0005 6.35
Floor in ceramic (0/1) 0.1715 0.0704 2.44
Floor in concrete (0/1) 0.1690 0.0477 3.54
Head work in public sector (0/1) 0.1695 0.0644 2.63
Head has no education (0/1) -0.1911 0.0421 -4.54
Head has some primary education (0/1) -0.0901 0.0389 -2.32
Head has upper secondary education (0/1) 0.1532 0.0653 2.35
Number of kids aged 0-6 -0.0454 0.0191 -2.38
Household Size (in log) -0.7240 0.0522 -13.87
Number of prime-age male 0.0740 0.0203 3.64
Has a motorcycle (0/1) 0.1454 0.0373 3.90
Reside in Saravane Province (0/1) -0.2864 0.0318 -9.01
Has a roof in zinc (0/1) 0.0981 0.0472 2.08
Has improved sanitation facility (0/1) 0.1432 0.0357 4.02
Village has water supply (0/1) 0.1280 0.0507 2.52
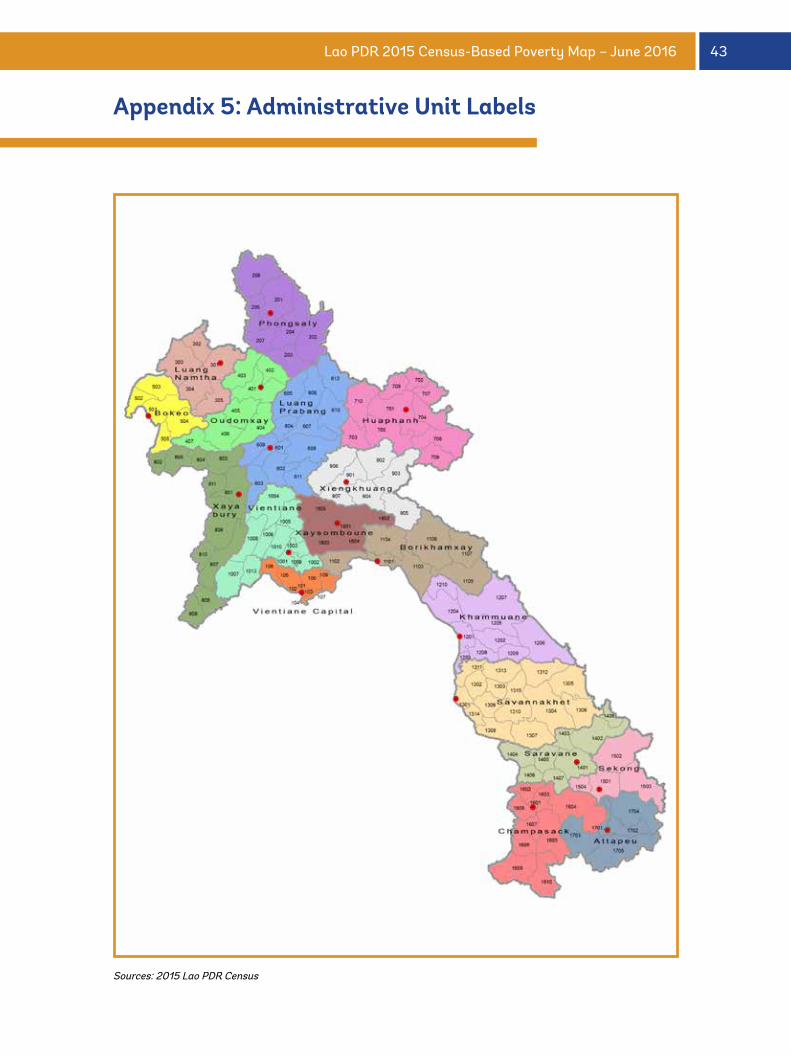
43Lao PDR 2015 Census-Based Poverty Map – June 2016
Appendix 5: Administrative Unit Labels
Sources: 2015 Lao PDR Census
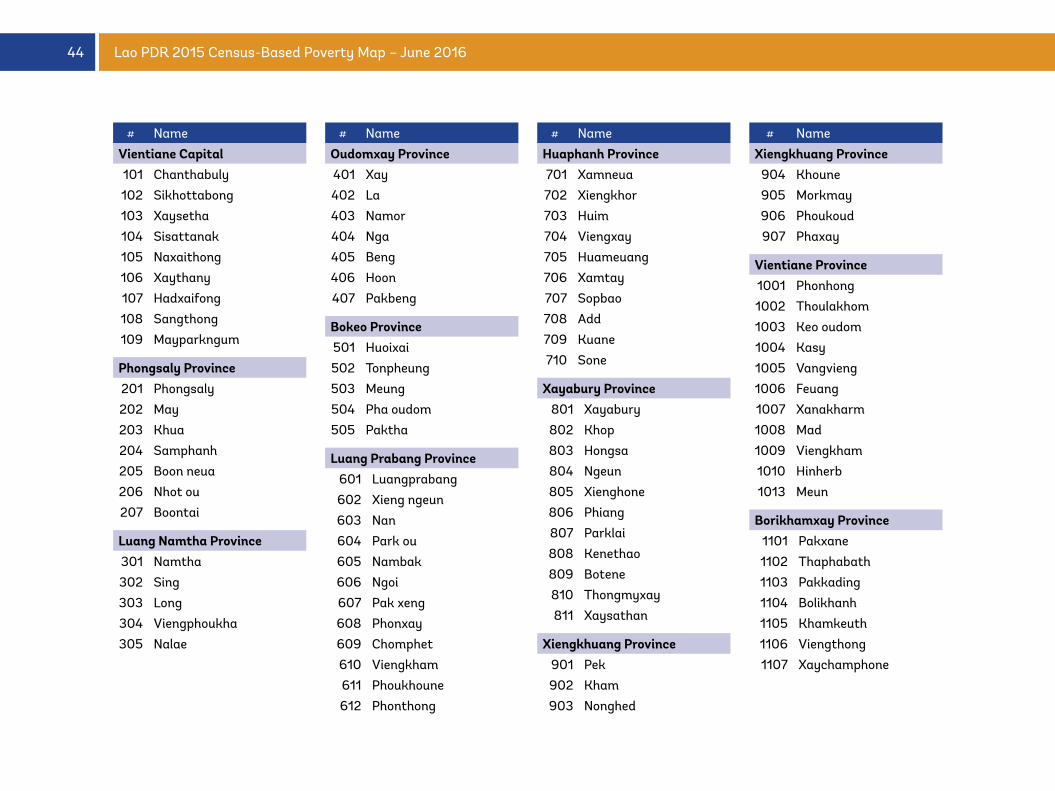
44 Lao PDR 2015 Census-Based Poverty Map – June 2016
# Name
Vientiane Capital 101 Chanthabuly
102 Sikhottabong
103 Xaysetha
104 Sisattanak
105 Naxaithong
106 Xaythany
107 Hadxaifong
108 Sangthong
109 Mayparkngum
Phongsaly Province 201 Phongsaly
202 May
203 Khua
204 Samphanh
205 Boon neua
206 Nhot ou
207 Boontai
Luang Namtha Province 301 Namtha
302 Sing
303 Long
304 Viengphoukha
305 Nalae
# Name
Oudomxay Province 401 Xay
402 La
403 Namor
404 Nga
405 Beng
406 Hoon
407 Pakbeng
Bokeo Province 501 Huoixai
502 Tonpheung
503 Meung
504 Pha oudom
505 Paktha
Luang Prabang Province 601 Luangprabang
602 Xieng ngeun
603 Nan
604 Park ou
605 Nambak
606 Ngoi
607 Pak xeng
608 Phonxay
609 Chomphet
610 Viengkham
611 Phoukhoune
612 Phonthong
# Name
Huaphanh Province 701 Xamneua
702 Xiengkhor
703 Huim
704 Viengxay
705 Huameuang
706 Xamtay
707 Sopbao
708 Add
709 Kuane
710 Sone
Xayabury Province 801 Xayabury
802 Khop
803 Hongsa
804 Ngeun
805 Xienghone
806 Phiang
807 Parklai
808 Kenethao
809 Botene
810 Thongmyxay
811 Xaysathan
Xiengkhuang Province 901 Pek
902 Kham
903 Nonghed
# Name
Xiengkhuang Province 904 Khoune
905 Morkmay
906 Phoukoud
907 Phaxay
Vientiane Province 1001 Phonhong
1002 Thoulakhom
1003 Keo oudom
1004 Kasy
1005 Vangvieng
1006 Feuang
1007 Xanakharm
1008 Mad
1009 Viengkham
1010 Hinherb
1013 Meun
Borikhamxay Province 1101 Pakxane
1102 Thaphabath
1103 Pakkading
1104 Bolikhanh
1105 Khamkeuth
1106 Viengthong
1107 Xaychamphone
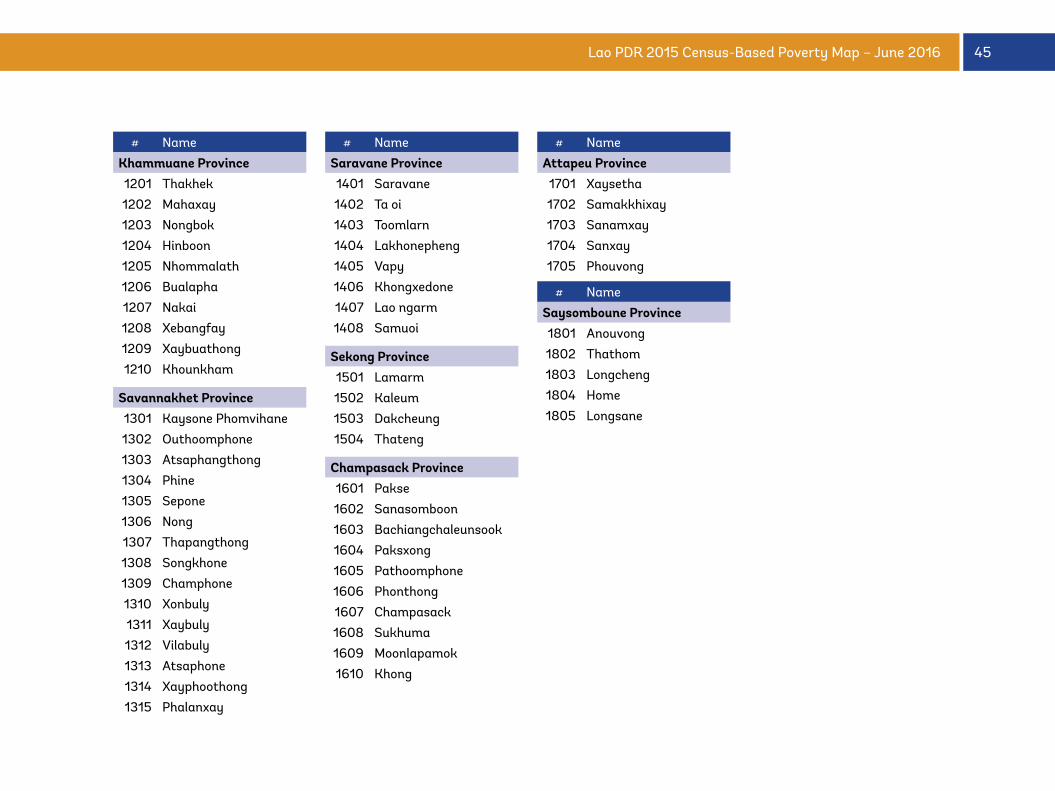
45Lao PDR 2015 Census-Based Poverty Map – June 2016
# Name
Khammuane Province 1201 Thakhek
1202 Mahaxay
1203 Nongbok
1204 Hinboon
1205 Nhommalath
1206 Bualapha
1207 Nakai
1208 Xebangfay
1209 Xaybuathong
1210 Khounkham
Savannakhet Province 1301 Kaysone Phomvihane
1302 Outhoomphone
1303 Atsaphangthong
1304 Phine
1305 Sepone
1306 Nong
1307 Thapangthong
1308 Songkhone
1309 Champhone
1310 Xonbuly
1311 Xaybuly
1312 Vilabuly
1313 Atsaphone
1314 Xayphoothong
1315 Phalanxay
# Name
Saravane Province 1401 Saravane
1402 Ta oi
1403 Toomlarn
1404 Lakhonepheng
1405 Vapy
1406 Khongxedone
1407 Lao ngarm
1408 Samuoi
Sekong Province 1501 Lamarm
1502 Kaleum
1503 Dakcheung
1504 Thateng
Champasack Province 1601 Pakse
1602 Sanasomboon
1603 Bachiangchaleunsook
1604 Paksxong
1605 Pathoomphone
1606 Phonthong
1607 Champasack
1608 Sukhuma
1609 Moonlapamok
1610 Khong
# Name
Attapeu Province 1701 Xaysetha
1702 Samakkhixay
1703 Sanamxay
1704 Sanxay
1705 Phouvong
# Name
Saysomboune Province 1801 Anouvong
1802 Thathom
1803 Longcheng
1804 Home
1805 Longsane
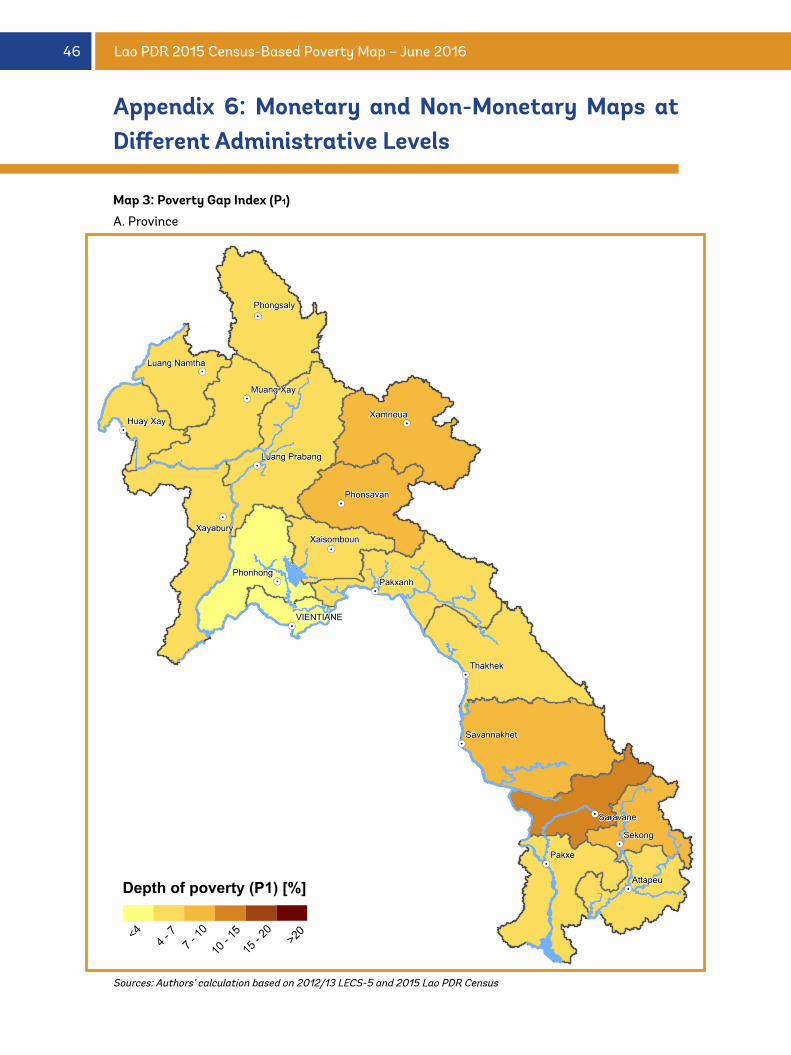
46 Lao PDR 2015 Census-Based Poverty Map – June 2016
Map 3: Poverty Gap Index (P1)A. Province
Sources: Authors’ calculation based on 2012/13 LECS-5 and 2015 Lao PDR Census
Appendix 6: Monetary and Non-Monetary Maps at Different Administrative Levels
4 - 7
7 - 10
10 - 1
5
15 - 2
0<4 >20
Depth of poverty (P1) [%]
Pakxe
Sekong
Attapeu
Xamneua
Pakxanh
Thakhek
Phonhong
Huay Xay
Saravane
Xayabury
VIENTIANE
Phonsavan
Phongsaly
Muang Xay
Savannakhet
Luang Namtha
Luang Prabang
Xaisomboun
!.
!.
!.
!.
!.
!.
!.
!.
!.
!.
!.
!.
!.
!.
!.
!.
!.
!.
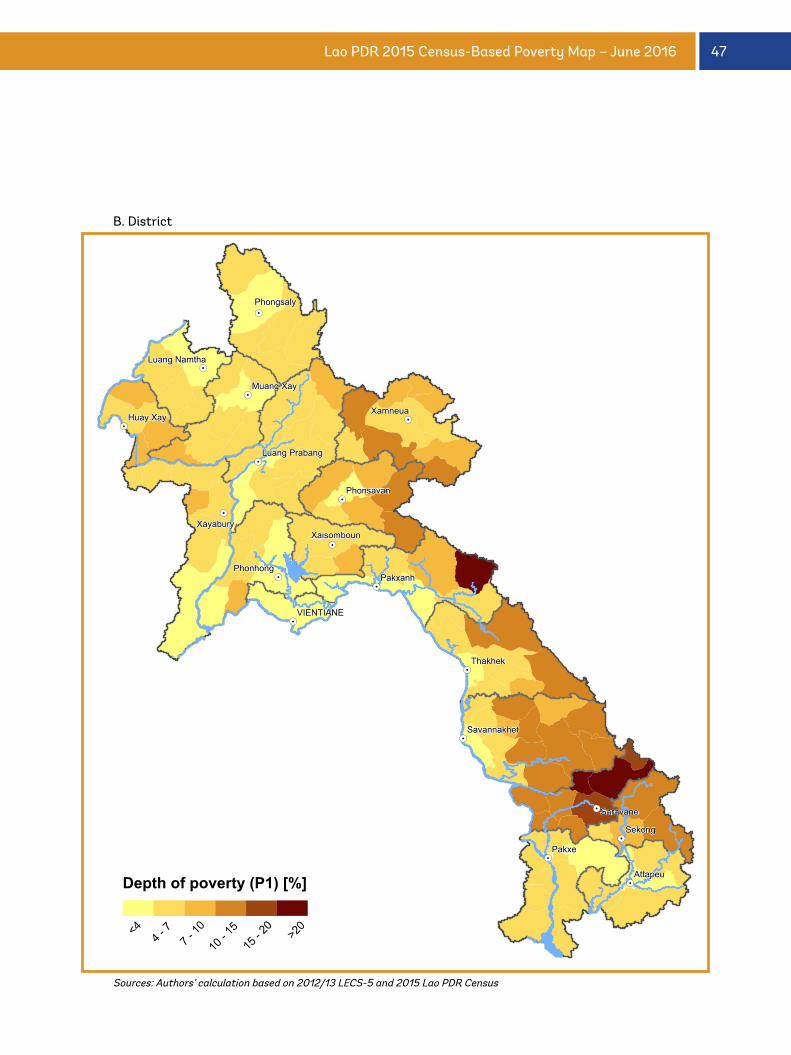
47Lao PDR 2015 Census-Based Poverty Map – June 2016
B. District
Sources: Authors’ calculation based on 2012/13 LECS-5 and 2015 Lao PDR Census
4 - 7
7 - 10
10 - 1
5
15 - 2
0<4 >20
Depth of poverty (P1) [%]
Pakxe
Sekong
Attapeu
Xamneua
Pakxanh
Thakhek
Phonhong
Huay Xay
Saravane
Xayabury
VIENTIANE
Phonsavan
Phongsaly
Muang Xay
Savannakhet
Luang Namtha
Luang Prabang
Xaisomboun
!.
!.
!.
!.
!.
!.
!.
!.
!.
!.
!.
!.
!.
!.
!.
!.
!.
!.
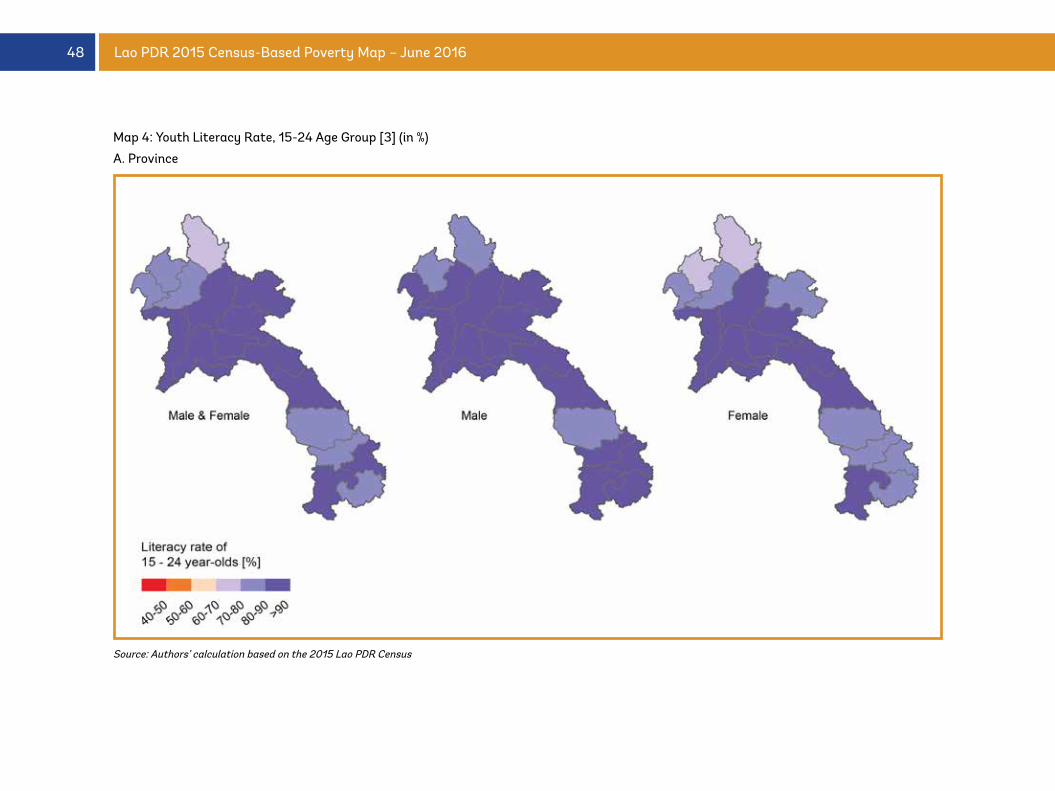
48 Lao PDR 2015 Census-Based Poverty Map – June 2016
Map 4: Youth Literacy Rate, 15-24 Age Group [3] (in %)
A. Province
Source: Authors’ calculation based on the 2015 Lao PDR Census
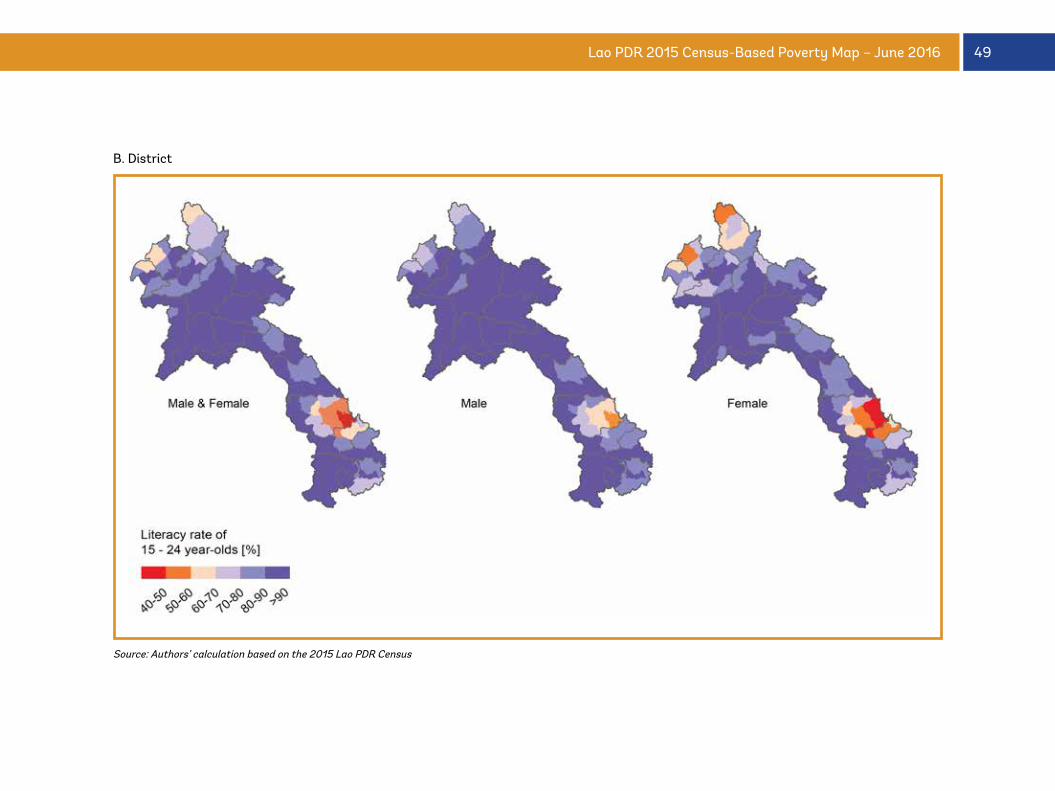
49Lao PDR 2015 Census-Based Poverty Map – June 2016
B. District
Source: Authors’ calculation based on the 2015 Lao PDR Census
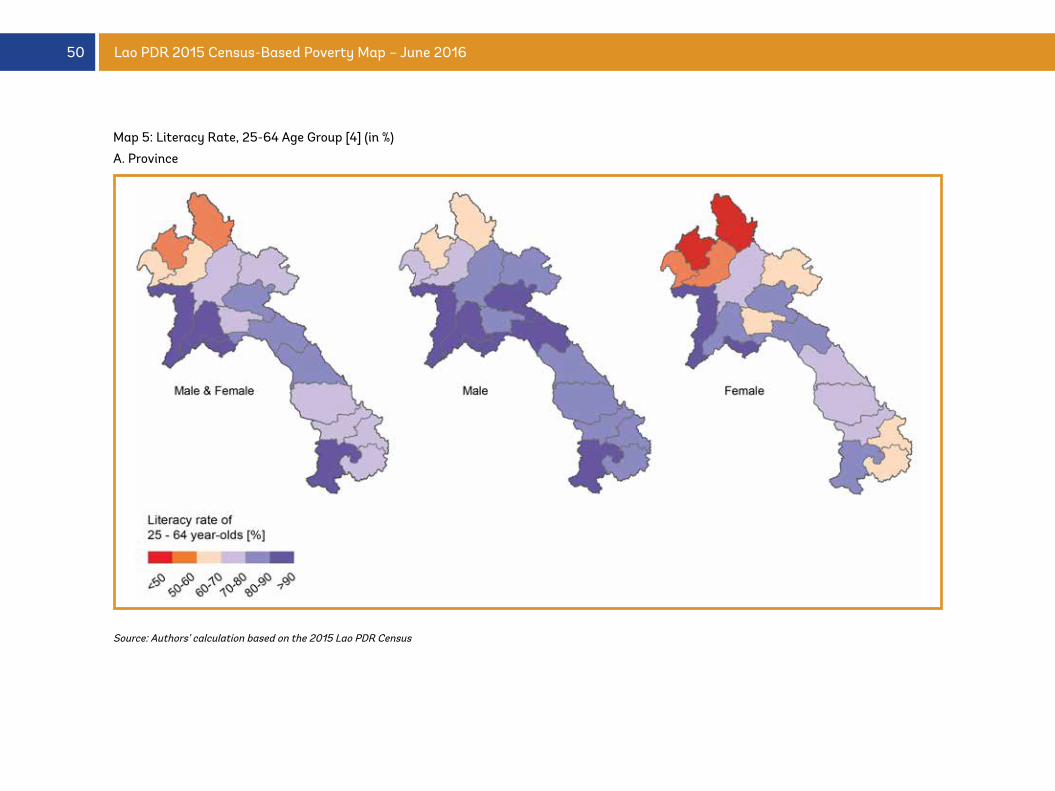
50 Lao PDR 2015 Census-Based Poverty Map – June 2016
Map 5: Literacy Rate, 25-64 Age Group [4] (in %)
A. Province
Source: Authors’ calculation based on the 2015 Lao PDR Census
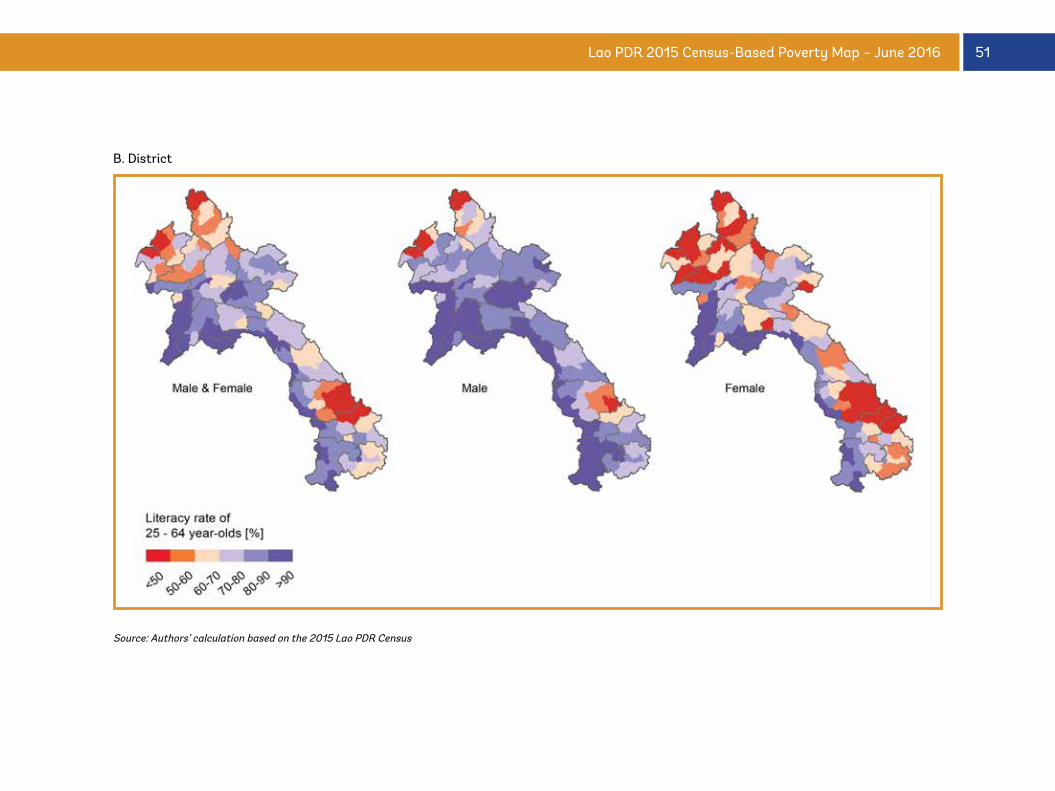
51Lao PDR 2015 Census-Based Poverty Map – June 2016
B. District
Source: Authors’ calculation based on the 2015 Lao PDR Census
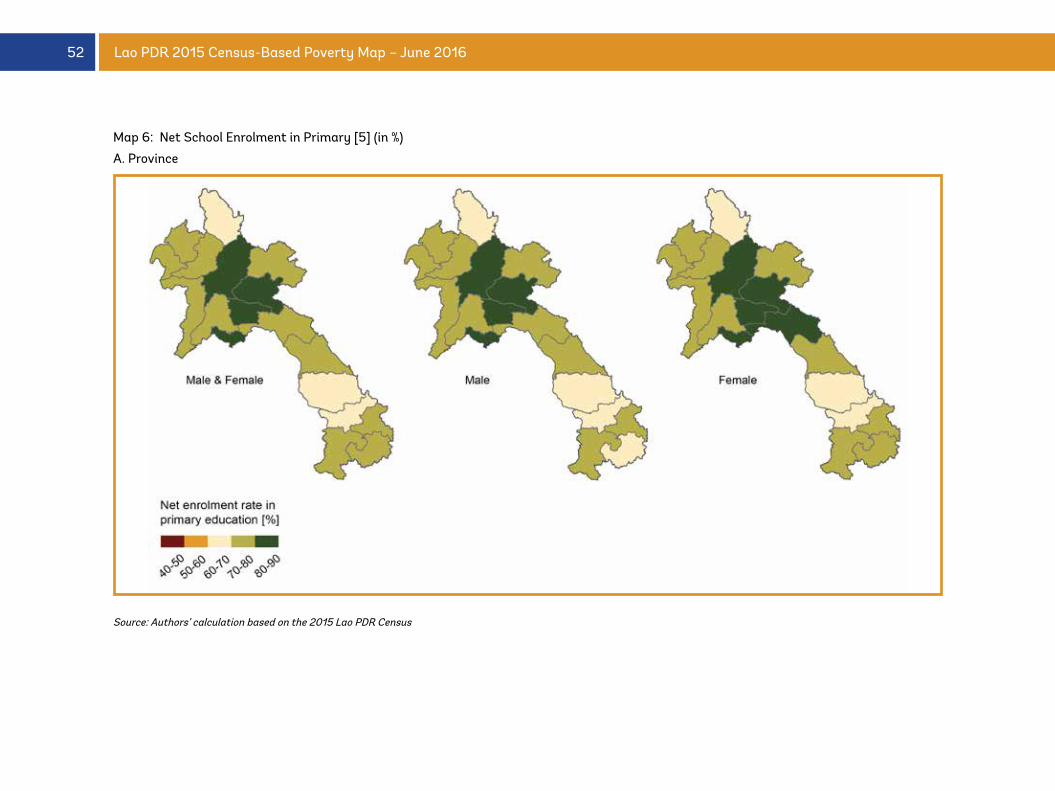
52 Lao PDR 2015 Census-Based Poverty Map – June 2016
Map 6: Net School Enrolment in Primary [5] (in %)
A. Province
Source: Authors’ calculation based on the 2015 Lao PDR Census
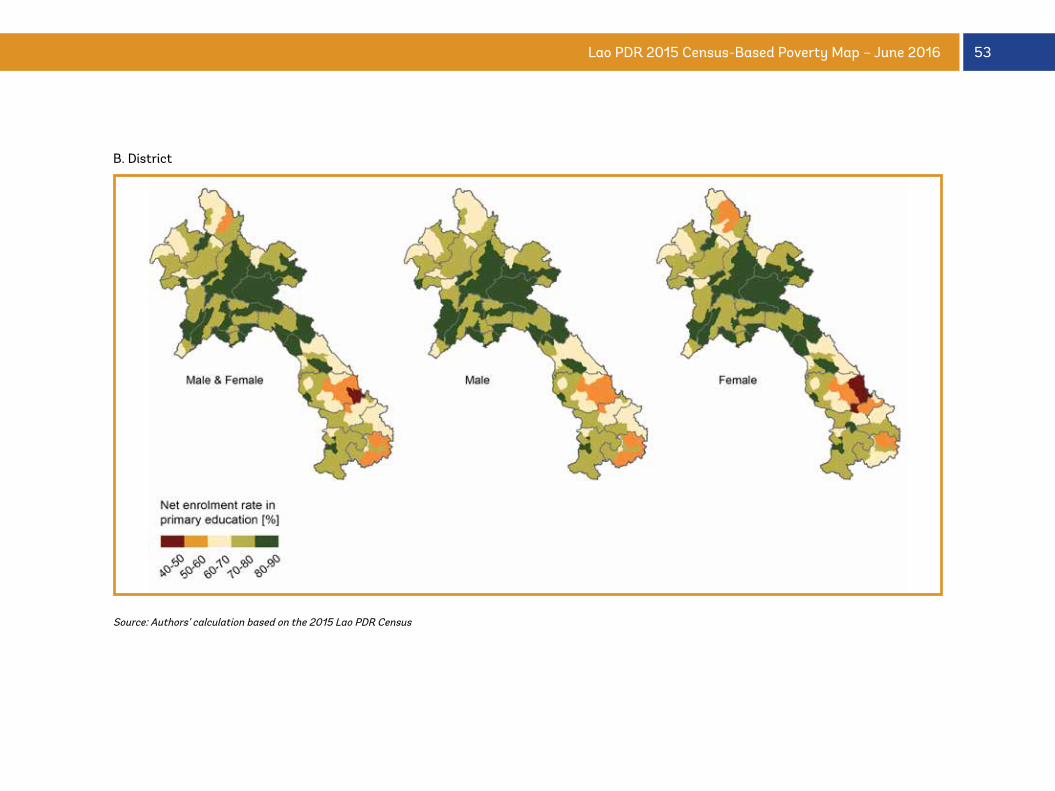
53Lao PDR 2015 Census-Based Poverty Map – June 2016
B. District
Source: Authors’ calculation based on the 2015 Lao PDR Census
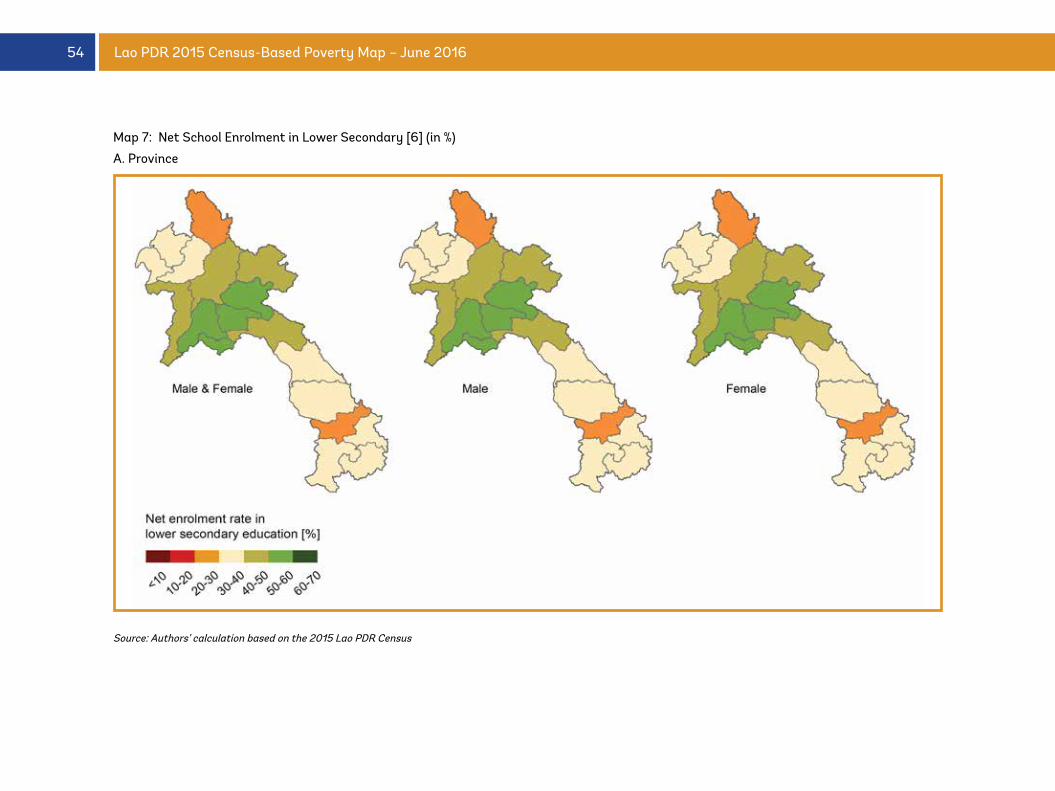
54 Lao PDR 2015 Census-Based Poverty Map – June 2016
Map 7: Net School Enrolment in Lower Secondary [6] (in %)
A. Province
Source: Authors’ calculation based on the 2015 Lao PDR Census
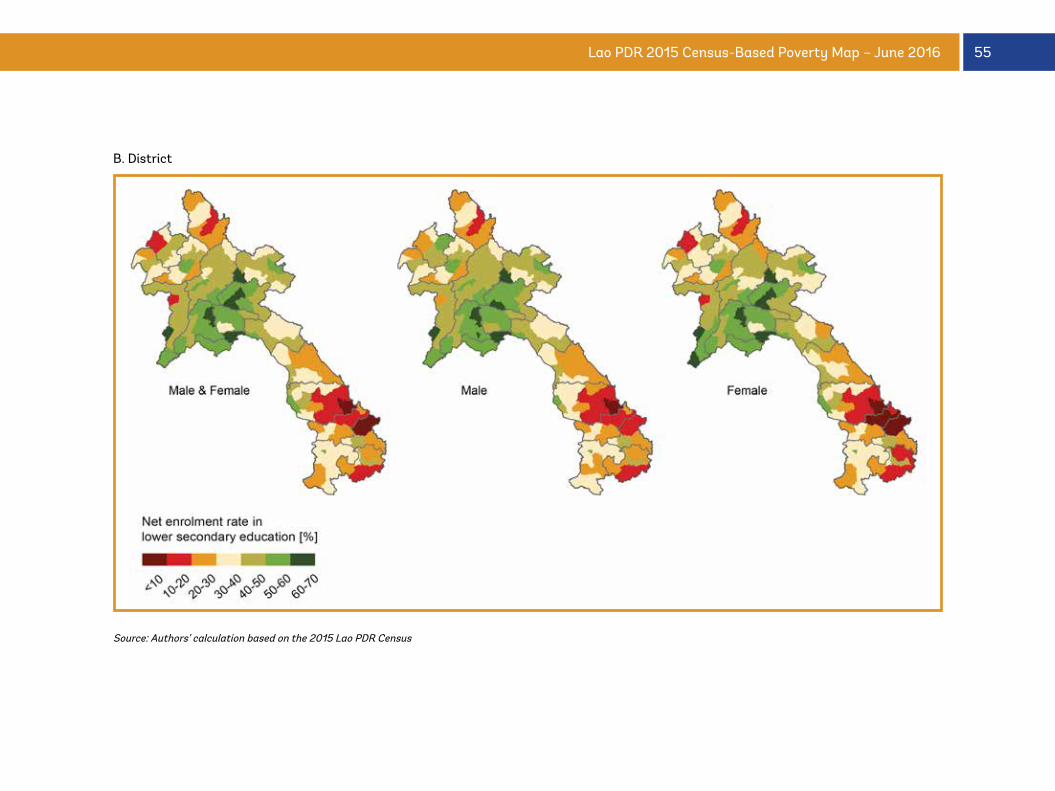
55Lao PDR 2015 Census-Based Poverty Map – June 2016
B. District
Source: Authors’ calculation based on the 2015 Lao PDR Census
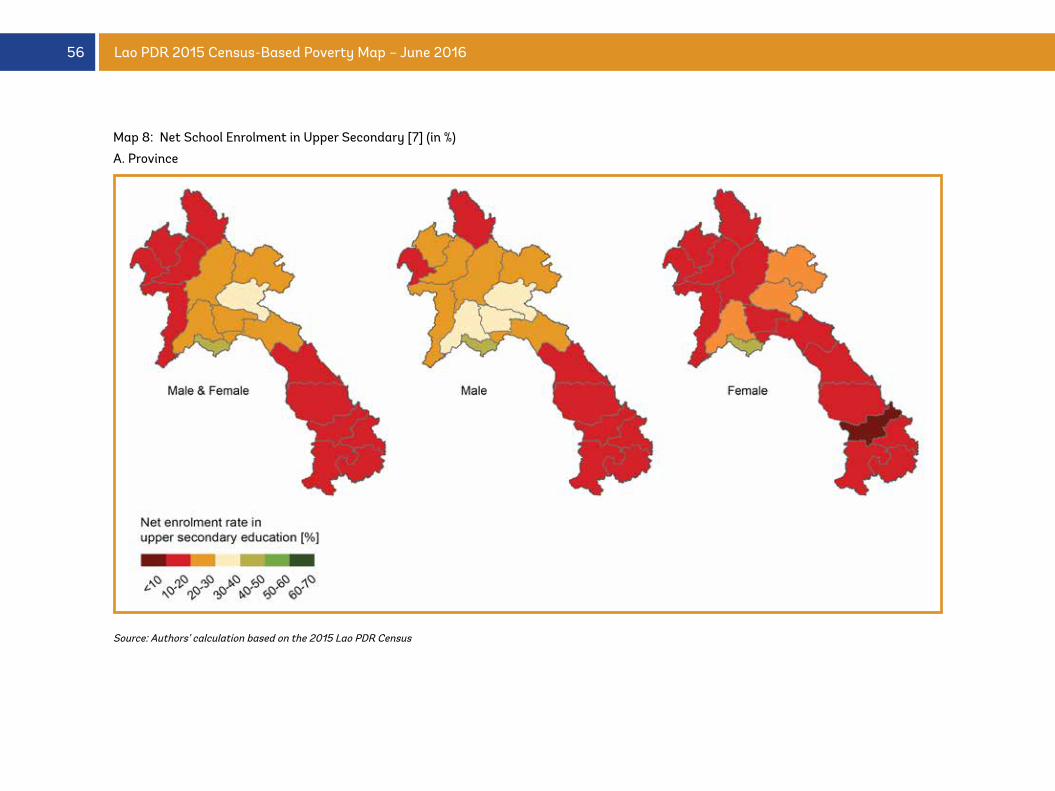
56 Lao PDR 2015 Census-Based Poverty Map – June 2016
Map 8: Net School Enrolment in Upper Secondary [7] (in %)
A. Province
Source: Authors’ calculation based on the 2015 Lao PDR Census
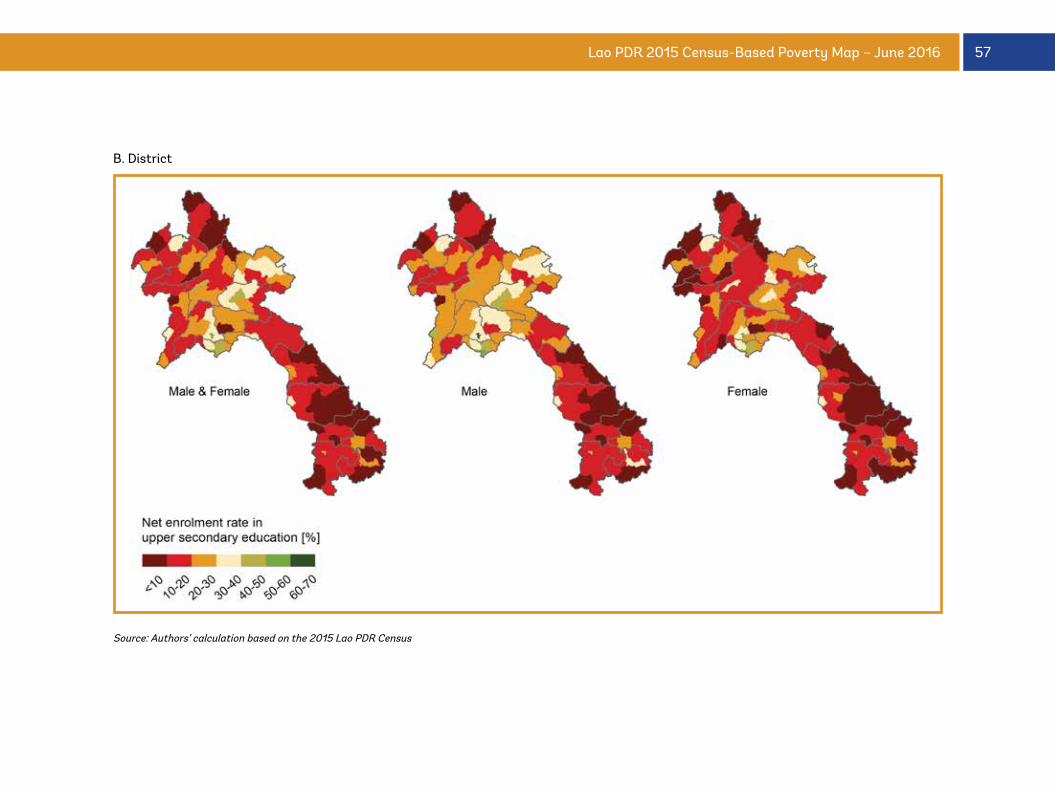
57Lao PDR 2015 Census-Based Poverty Map – June 2016
B. District
Source: Authors’ calculation based on the 2015 Lao PDR Census
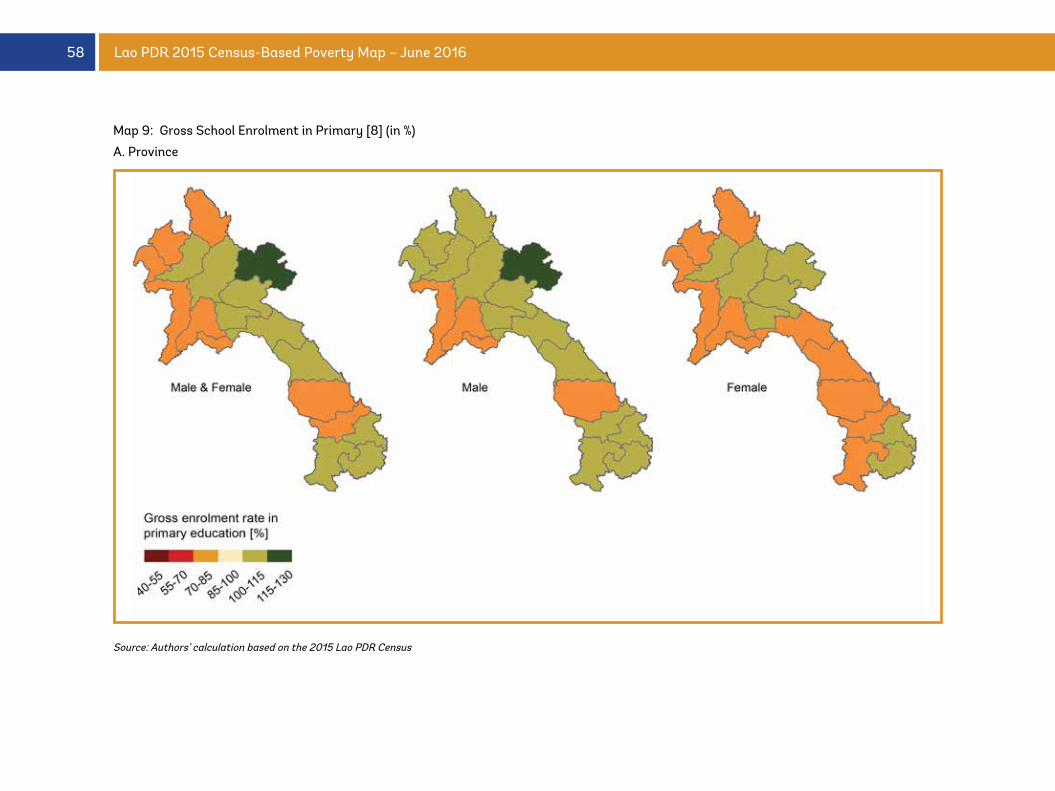
58 Lao PDR 2015 Census-Based Poverty Map – June 2016
Map 9: Gross School Enrolment in Primary [8] (in %)
A. Province
Source: Authors’ calculation based on the 2015 Lao PDR Census
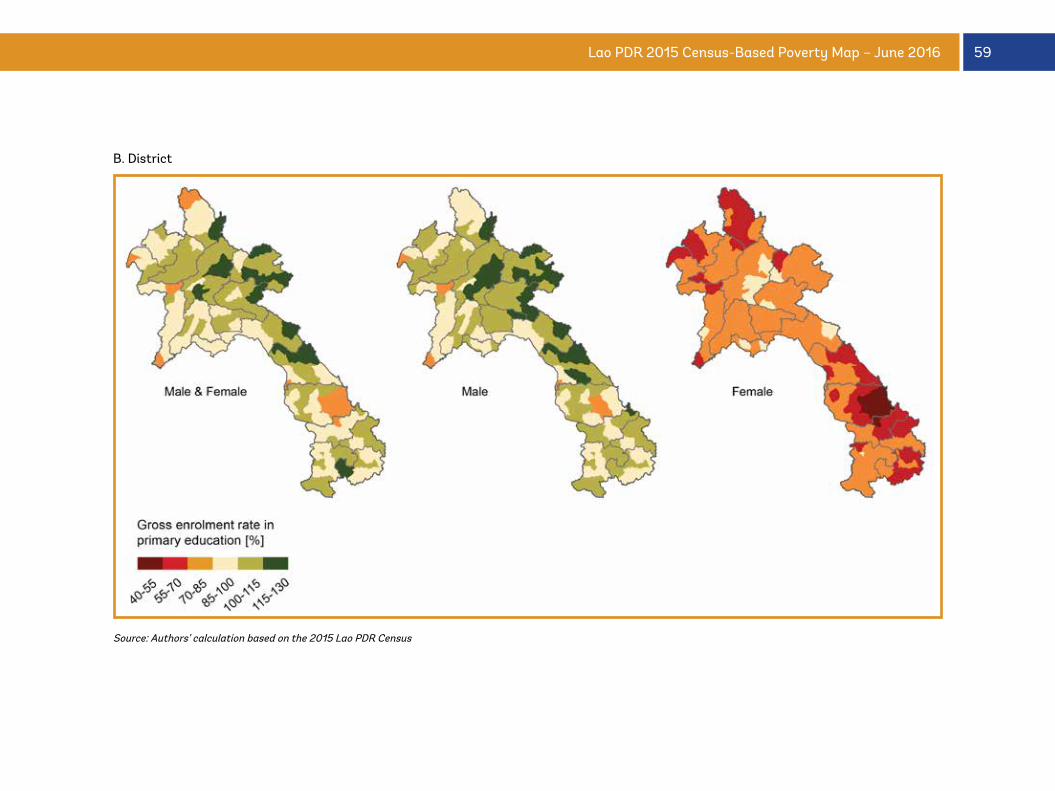
59Lao PDR 2015 Census-Based Poverty Map – June 2016
B. District
Source: Authors’ calculation based on the 2015 Lao PDR Census
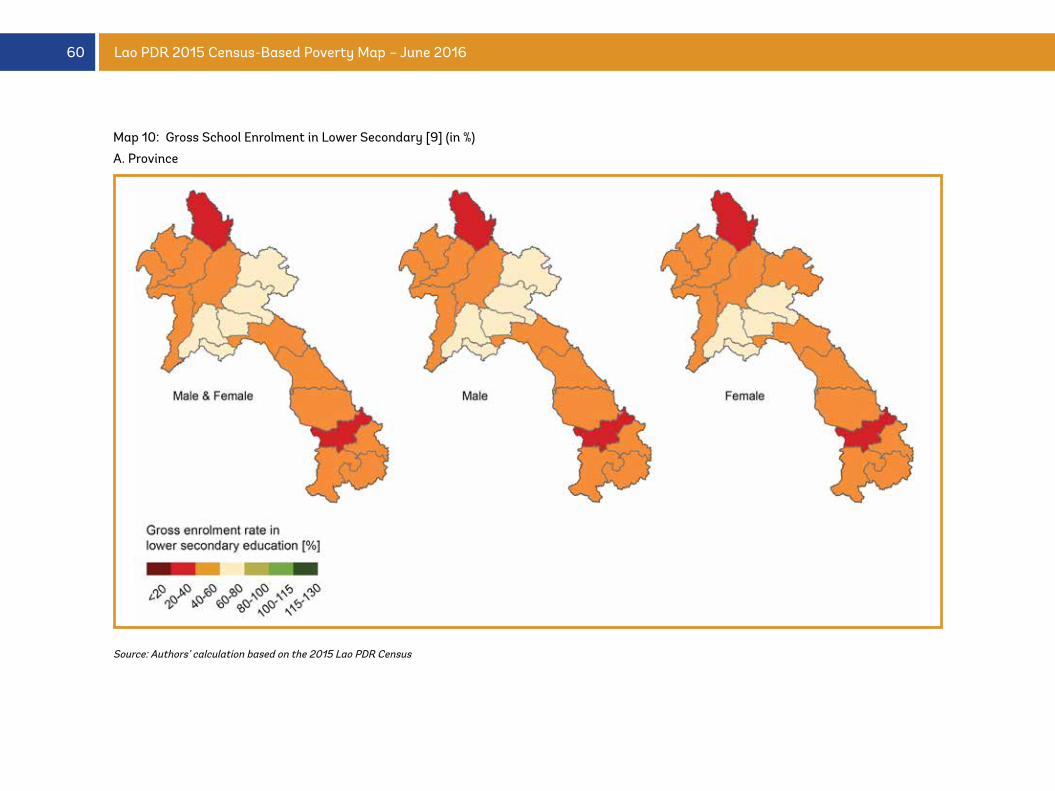
60 Lao PDR 2015 Census-Based Poverty Map – June 2016
Map 10: Gross School Enrolment in Lower Secondary [9] (in %)
A. Province
Source: Authors’ calculation based on the 2015 Lao PDR Census
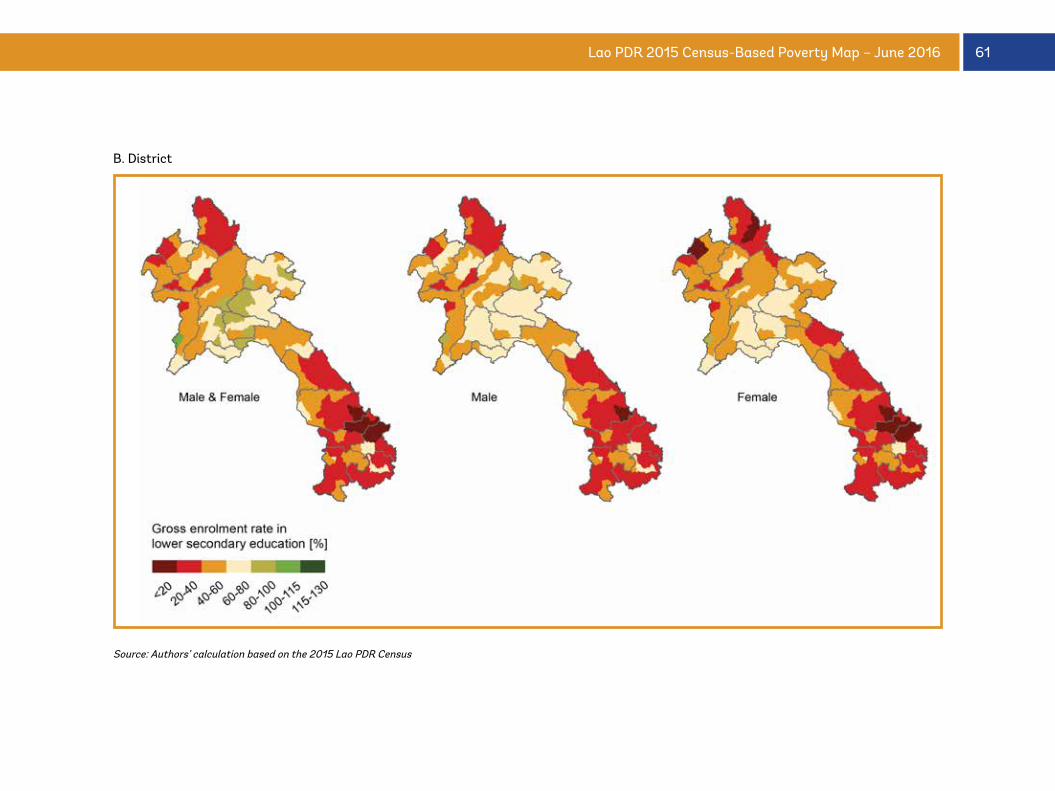
61Lao PDR 2015 Census-Based Poverty Map – June 2016
B. District
Source: Authors’ calculation based on the 2015 Lao PDR Census
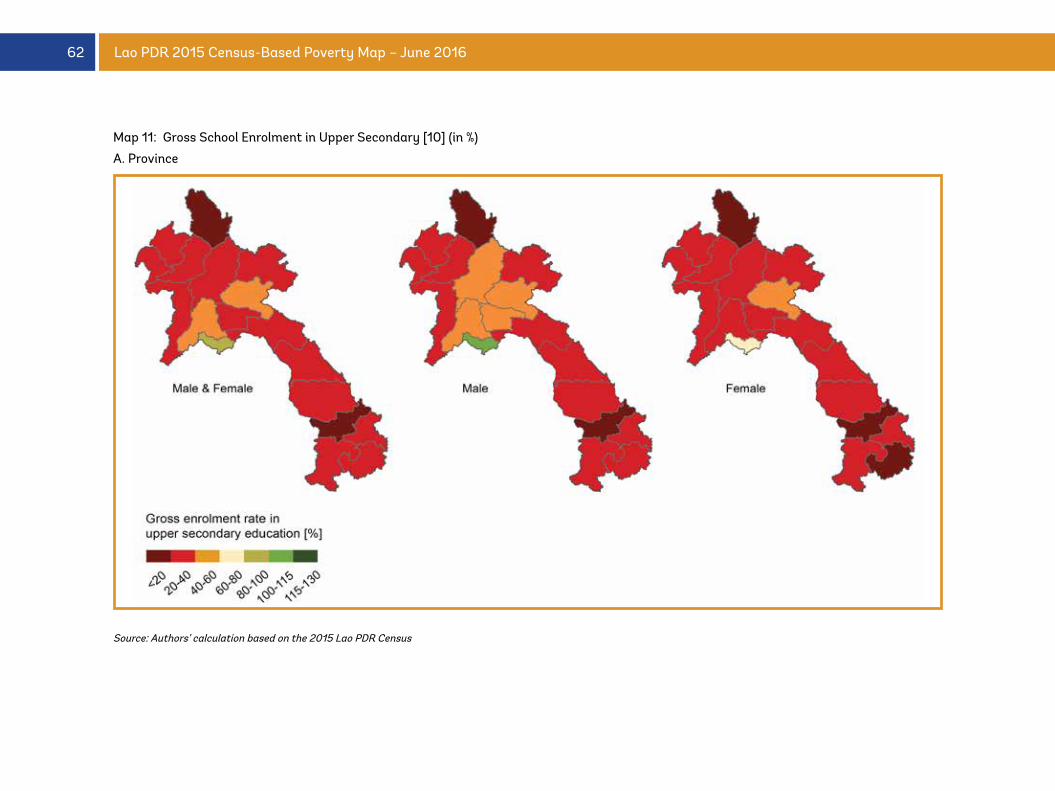
62 Lao PDR 2015 Census-Based Poverty Map – June 2016
Map 11: Gross School Enrolment in Upper Secondary [10] (in %)
A. Province
Source: Authors’ calculation based on the 2015 Lao PDR Census
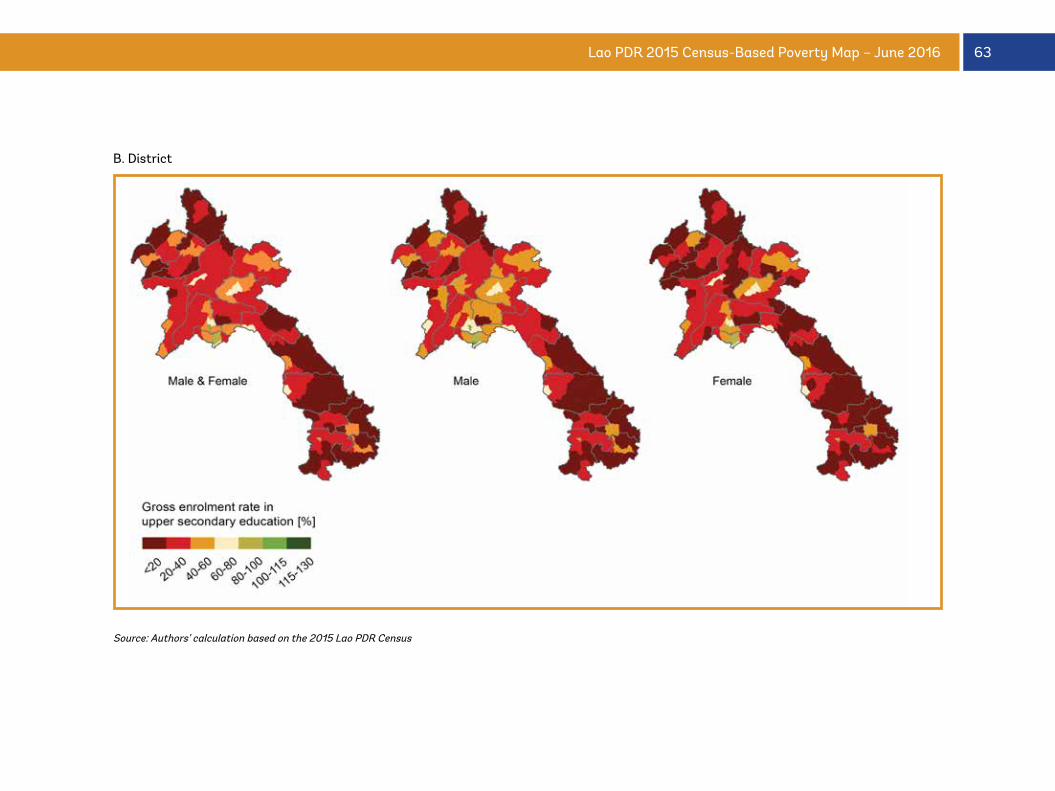
63Lao PDR 2015 Census-Based Poverty Map – June 2016
B. District
Source: Authors’ calculation based on the 2015 Lao PDR Census
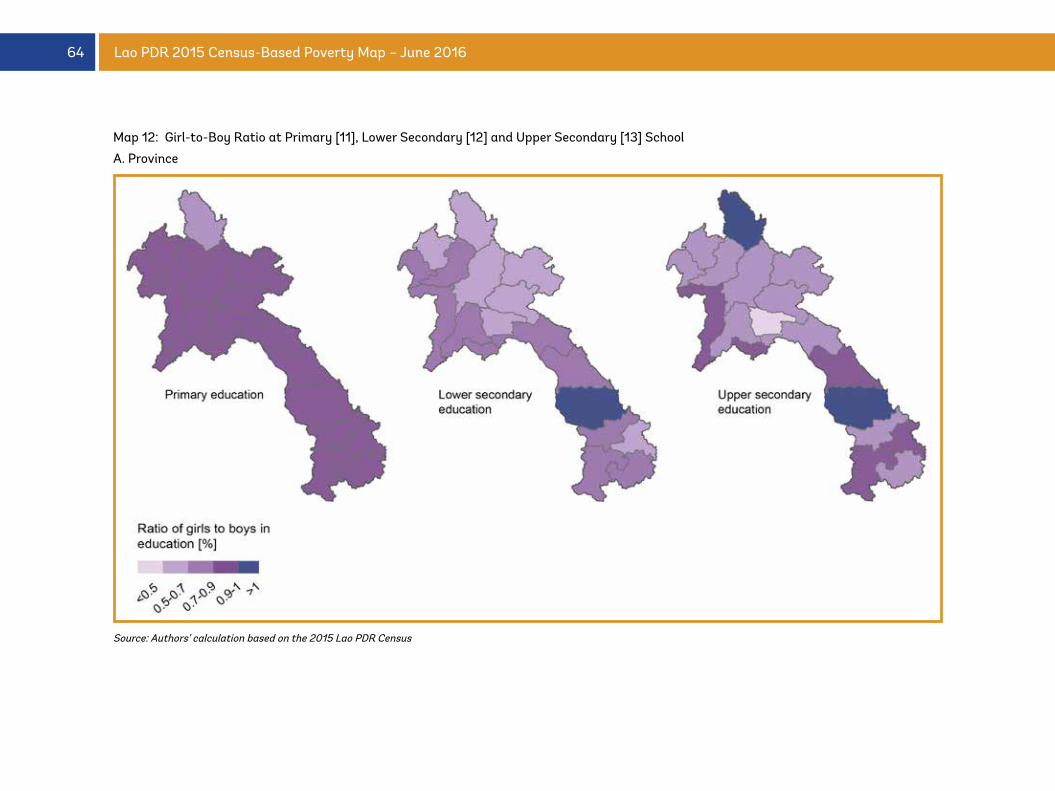
64 Lao PDR 2015 Census-Based Poverty Map – June 2016
Map 12: Girl-to-Boy Ratio at Primary [11], Lower Secondary [12] and Upper Secondary [13] School
A. Province
Source: Authors’ calculation based on the 2015 Lao PDR Census
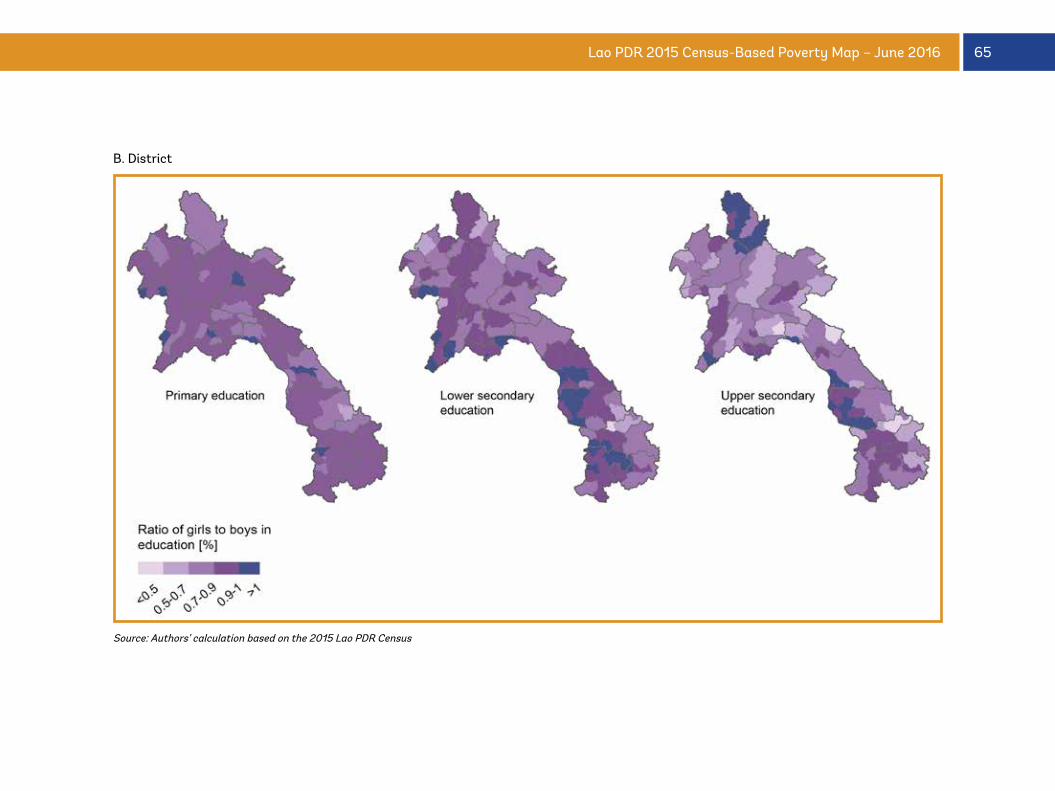
65Lao PDR 2015 Census-Based Poverty Map – June 2016
B. District
Source: Authors’ calculation based on the 2015 Lao PDR Census
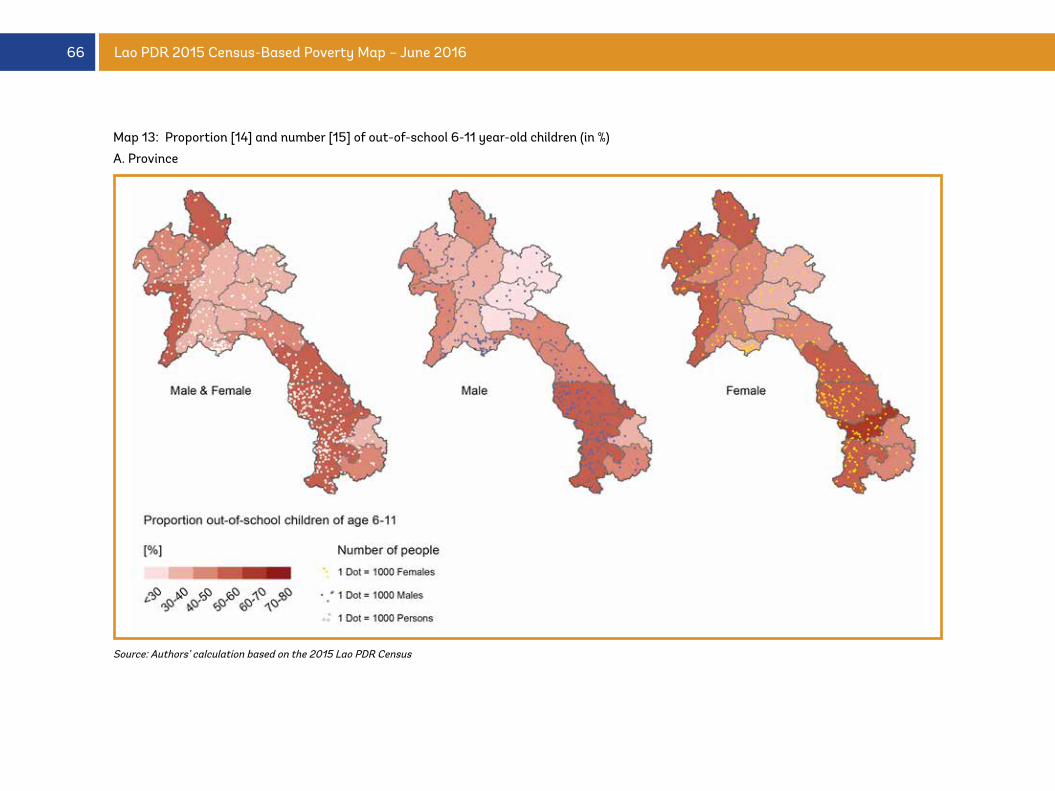
66 Lao PDR 2015 Census-Based Poverty Map – June 2016
Map 13: Proportion [14] and number [15] of out-of-school 6-11 year-old children (in %)
A. Province
Source: Authors’ calculation based on the 2015 Lao PDR Census
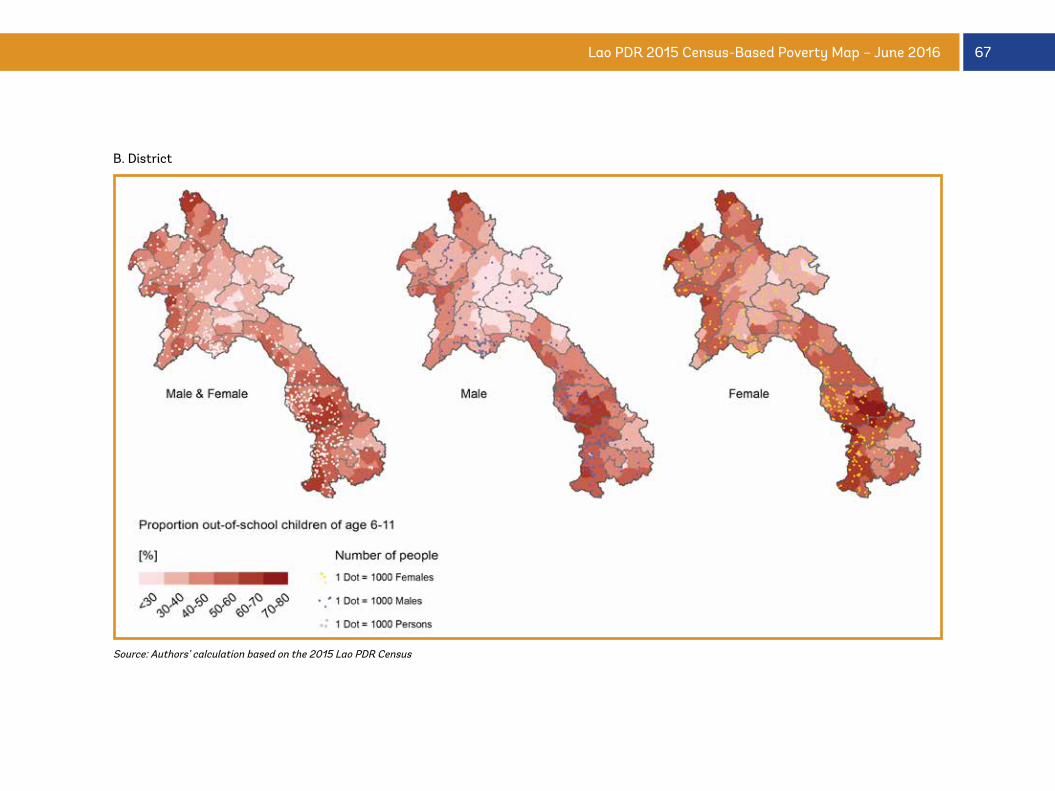
67Lao PDR 2015 Census-Based Poverty Map – June 2016
B. District
Source: Authors’ calculation based on the 2015 Lao PDR Census
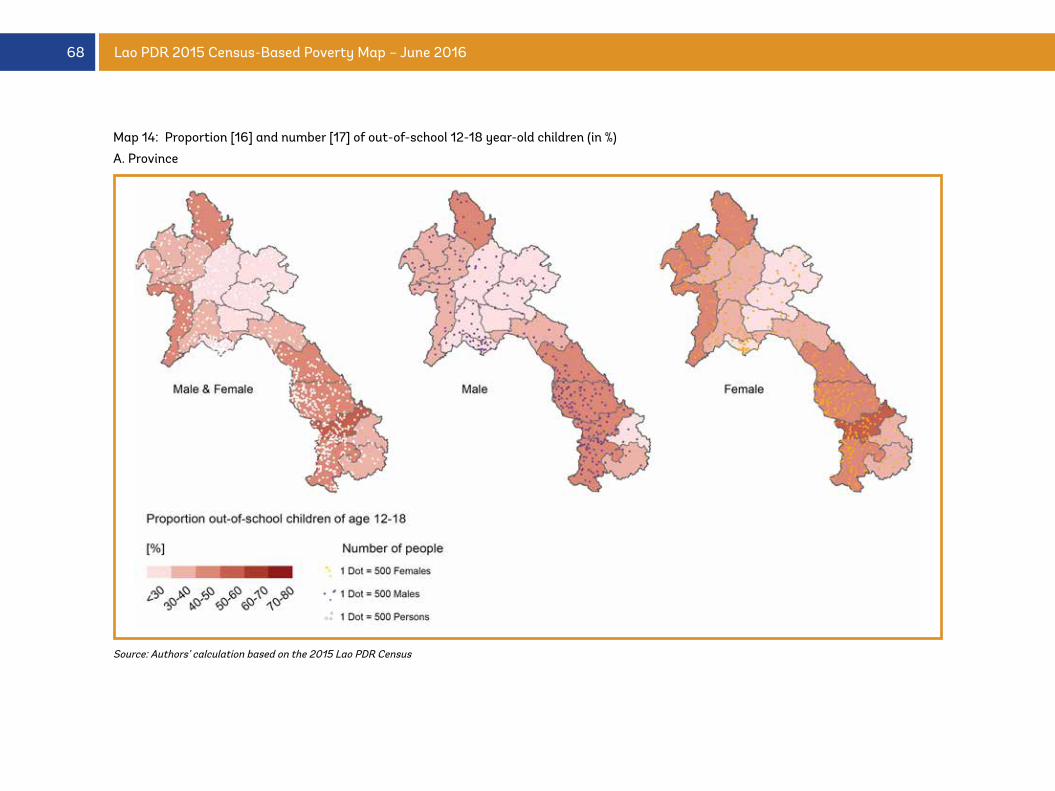
68 Lao PDR 2015 Census-Based Poverty Map – June 2016
Map 14: Proportion [16] and number [17] of out-of-school 12-18 year-old children (in %)
A. Province
Source: Authors’ calculation based on the 2015 Lao PDR Census
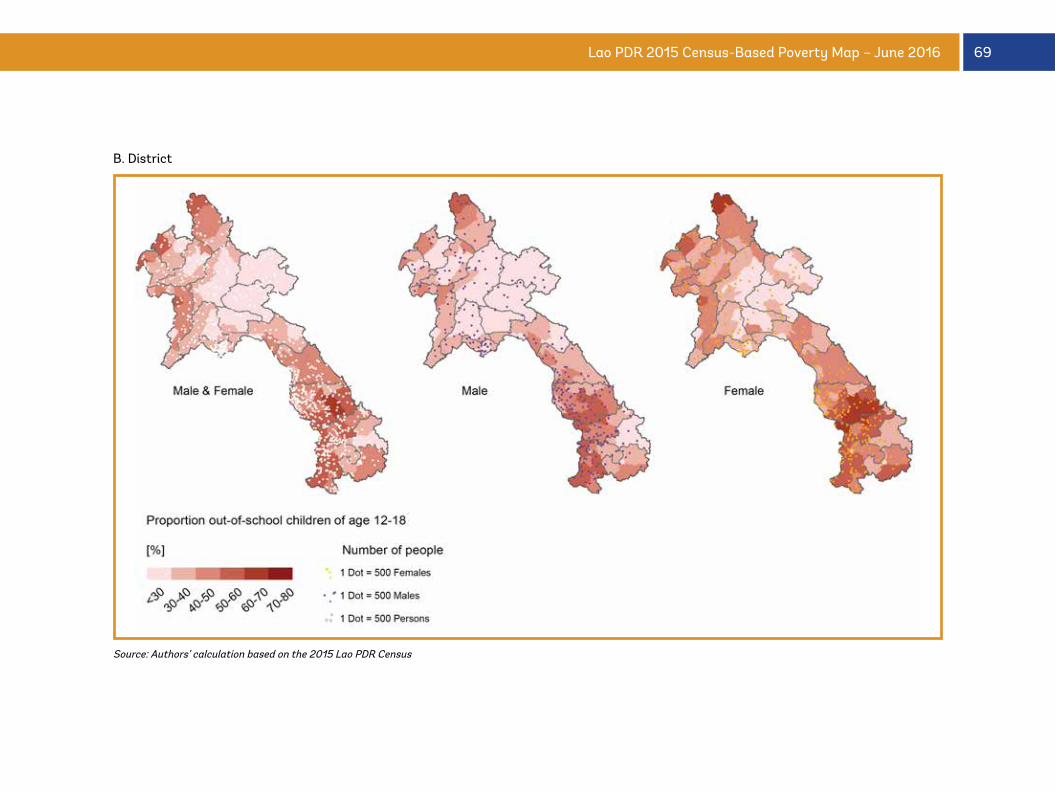
69Lao PDR 2015 Census-Based Poverty Map – June 2016
B. District
Source: Authors’ calculation based on the 2015 Lao PDR Census
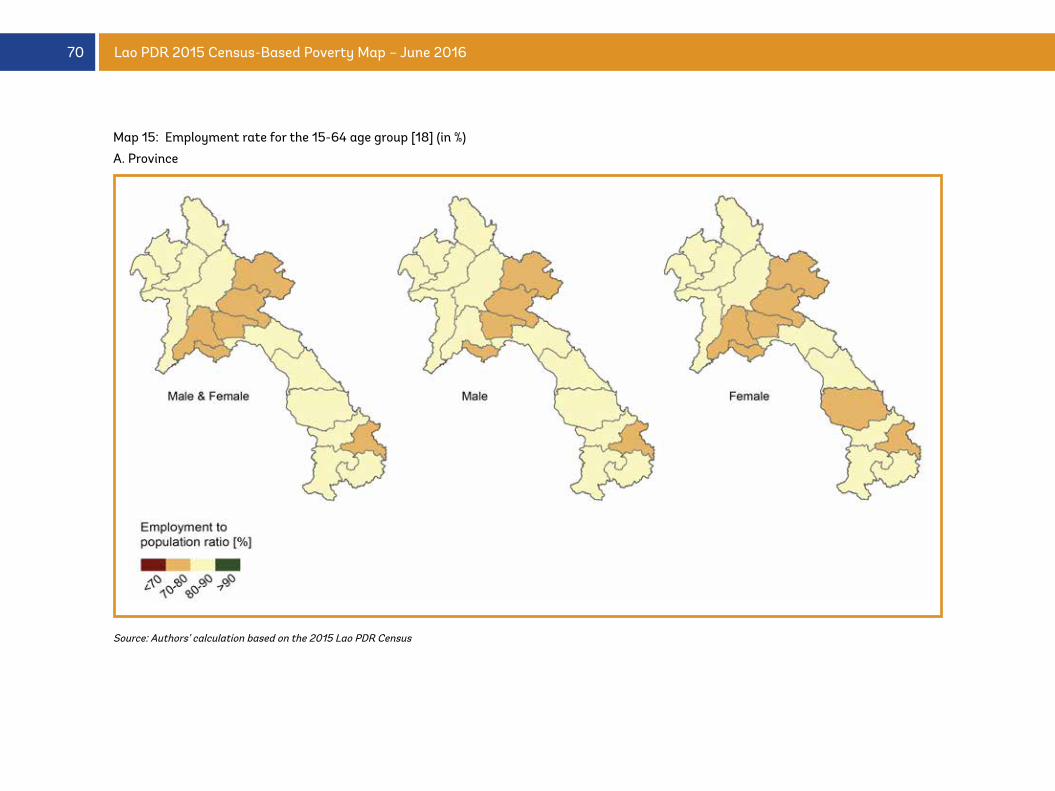
70 Lao PDR 2015 Census-Based Poverty Map – June 2016
Map 15: Employment rate for the 15-64 age group [18] (in %)
A. Province
Source: Authors’ calculation based on the 2015 Lao PDR Census
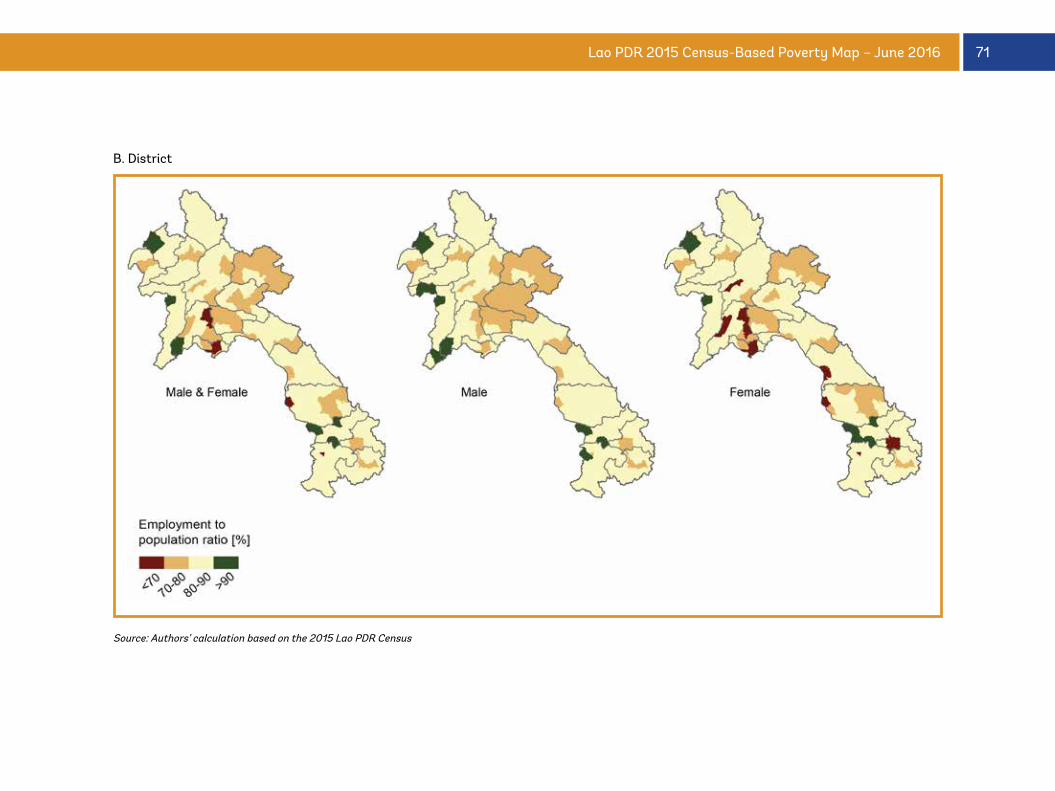
71Lao PDR 2015 Census-Based Poverty Map – June 2016
B. District
Source: Authors’ calculation based on the 2015 Lao PDR Census
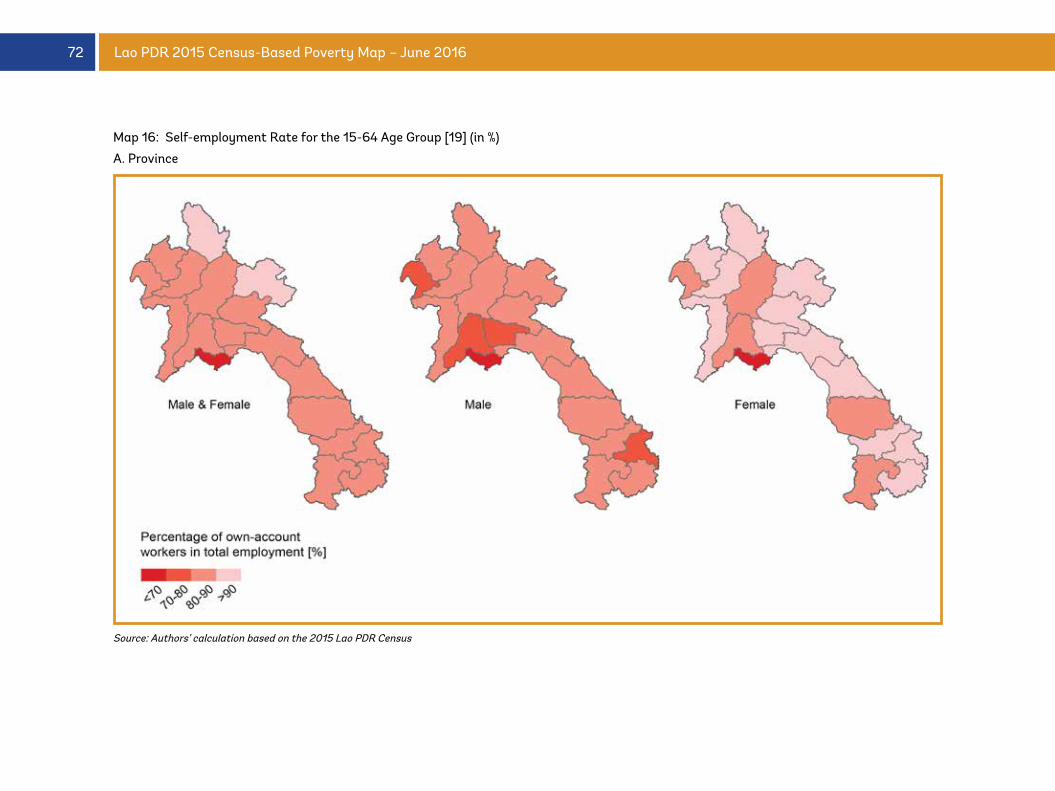
72 Lao PDR 2015 Census-Based Poverty Map – June 2016
Map 16: Self-employment Rate for the 15-64 Age Group [19] (in %)
A. Province
Source: Authors’ calculation based on the 2015 Lao PDR Census
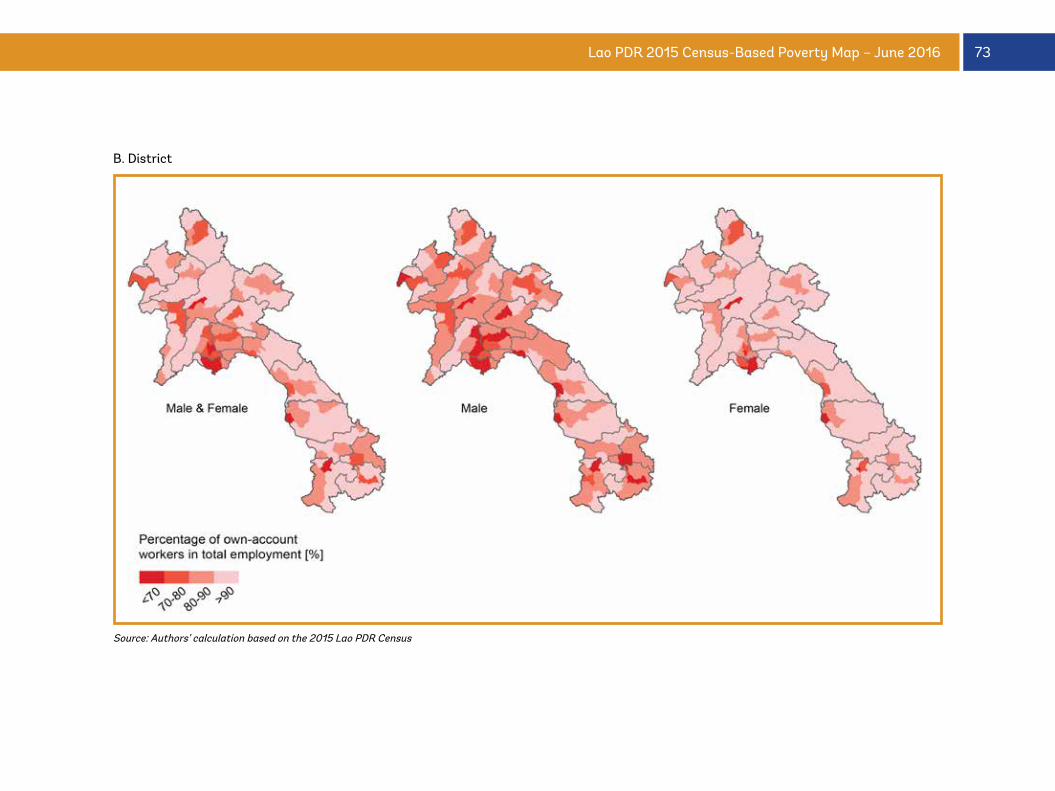
73Lao PDR 2015 Census-Based Poverty Map – June 2016
B. District
Source: Authors’ calculation based on the 2015 Lao PDR Census
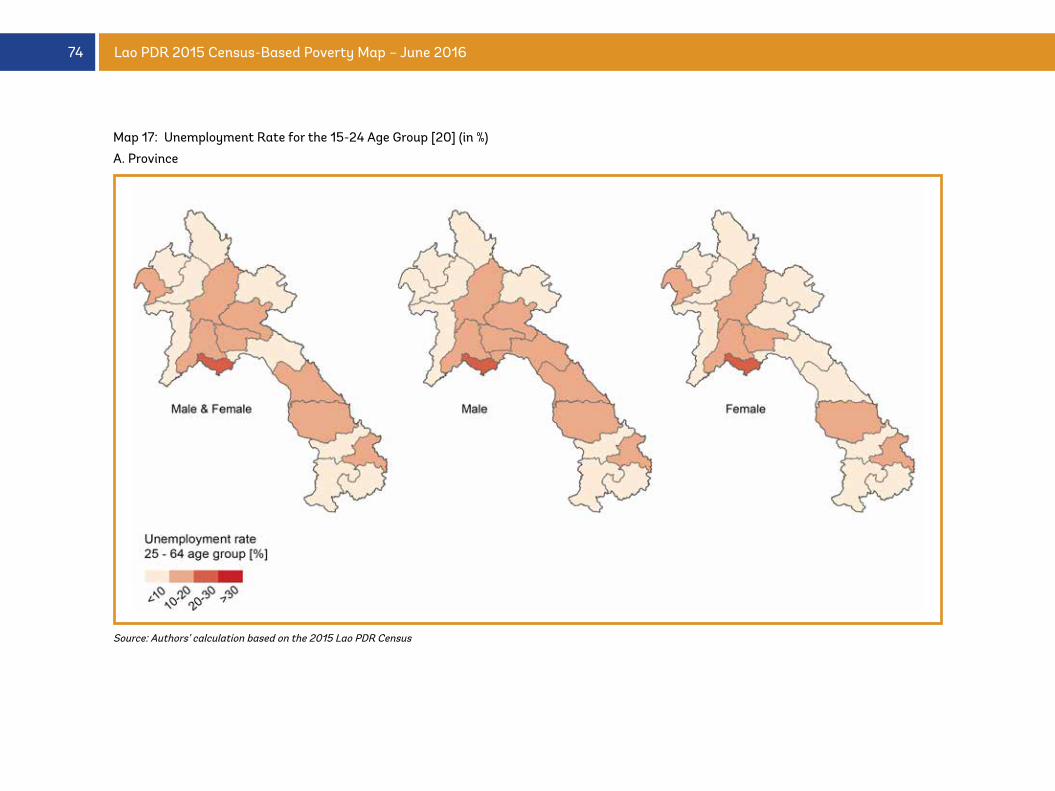
74 Lao PDR 2015 Census-Based Poverty Map – June 2016
Map 17: Unemployment Rate for the 15-24 Age Group [20] (in %)
A. Province
Source: Authors’ calculation based on the 2015 Lao PDR Census
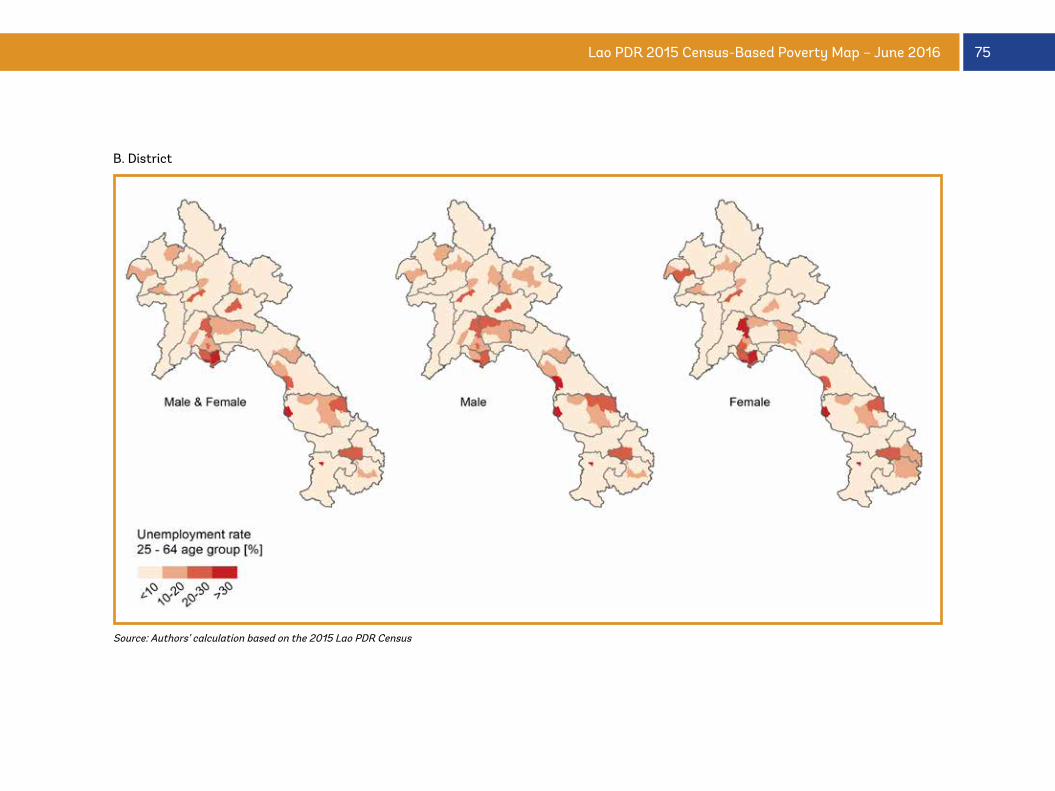
75Lao PDR 2015 Census-Based Poverty Map – June 2016
B. District
Source: Authors’ calculation based on the 2015 Lao PDR Census
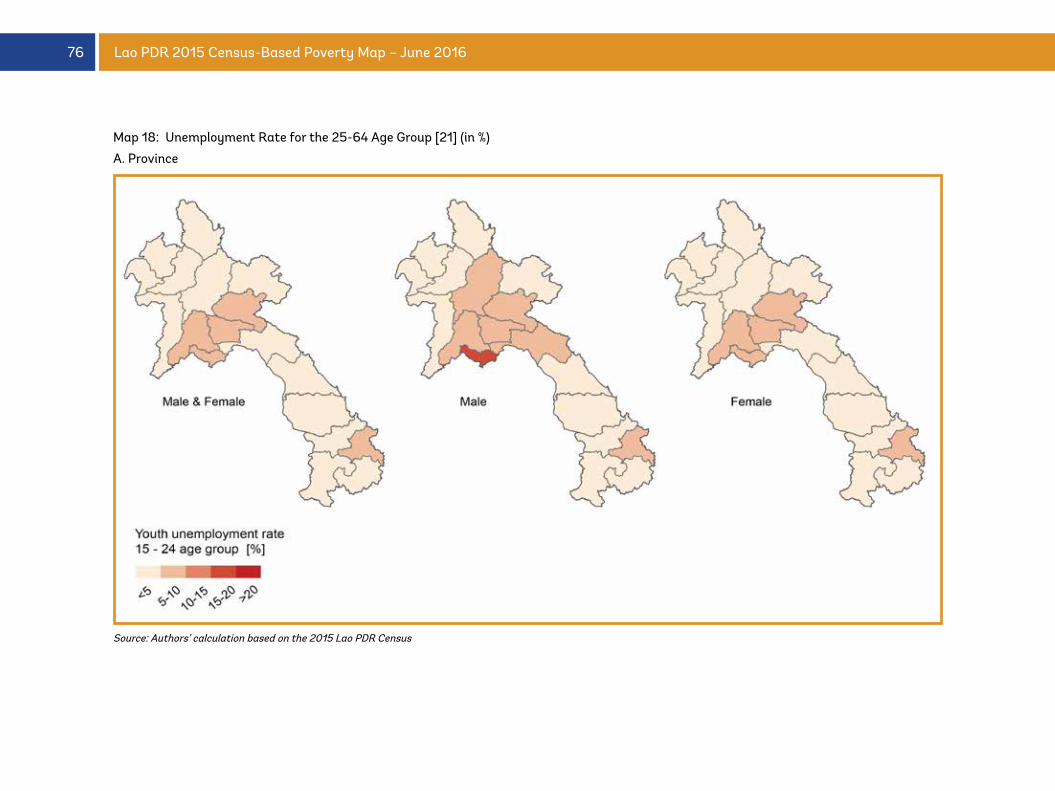
76 Lao PDR 2015 Census-Based Poverty Map – June 2016
Map 18: Unemployment Rate for the 25-64 Age Group [21] (in %)
A. Province
Source: Authors’ calculation based on the 2015 Lao PDR Census
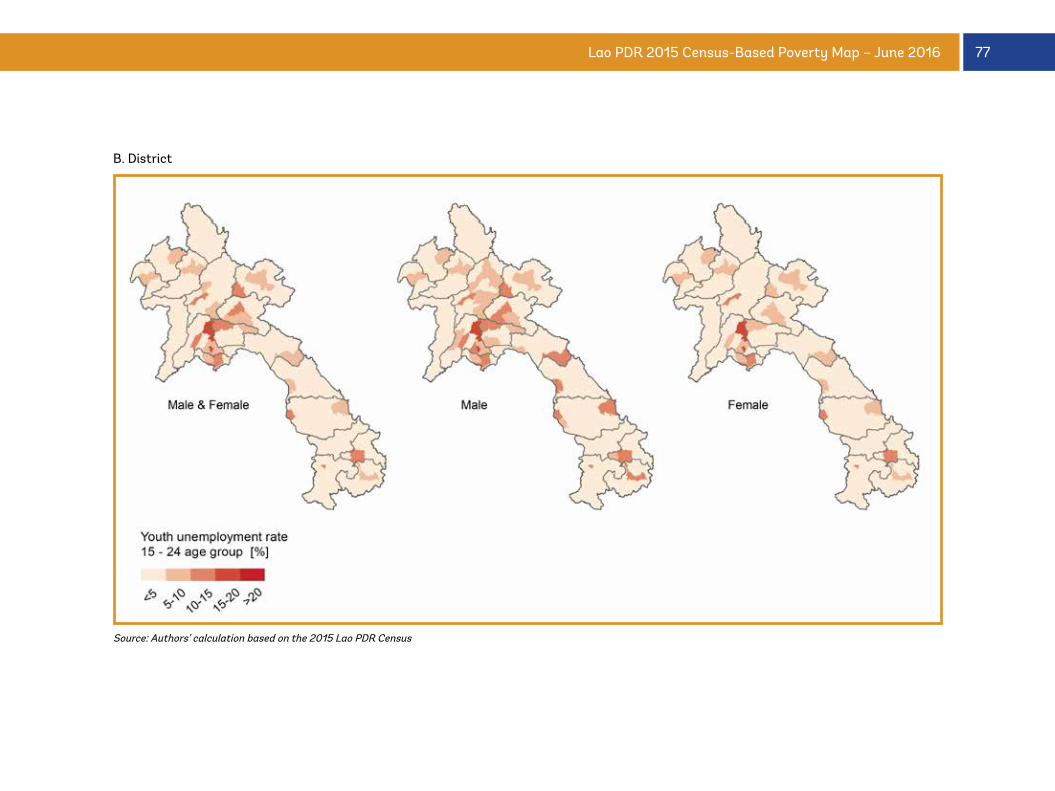
77Lao PDR 2015 Census-Based Poverty Map – June 2016
B. District
Source: Authors’ calculation based on the 2015 Lao PDR Census
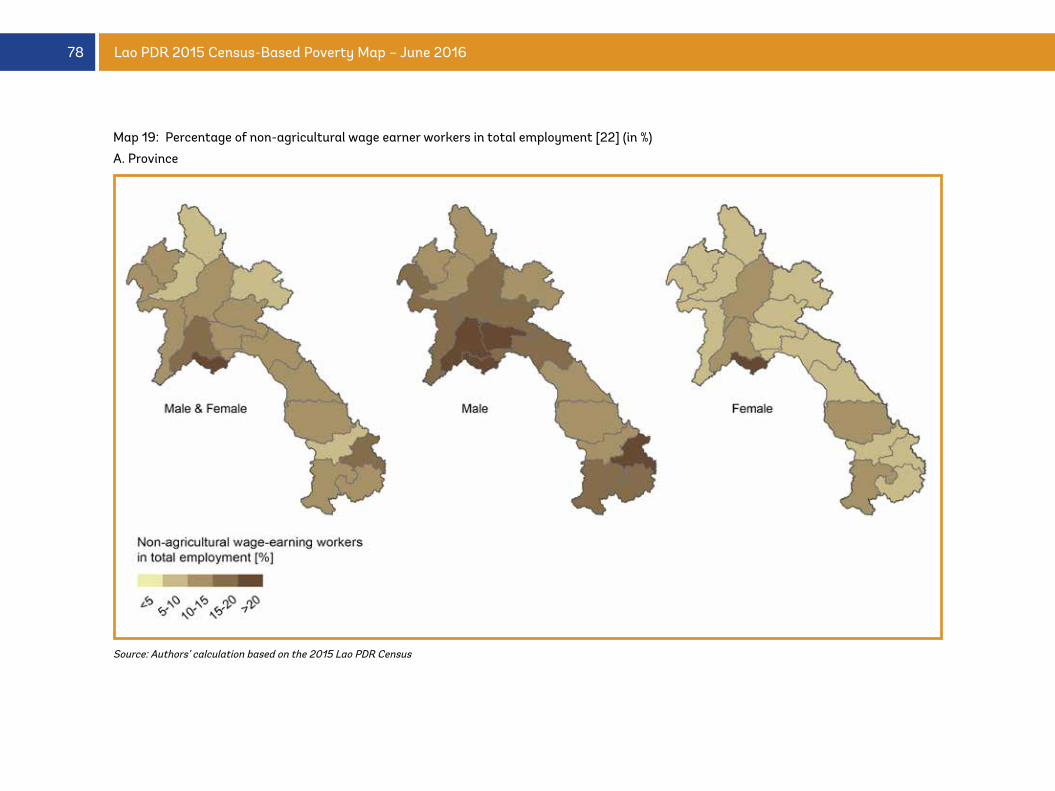
78 Lao PDR 2015 Census-Based Poverty Map – June 2016
Map 19: Percentage of non-agricultural wage earner workers in total employment [22] (in %)
A. Province
Source: Authors’ calculation based on the 2015 Lao PDR Census
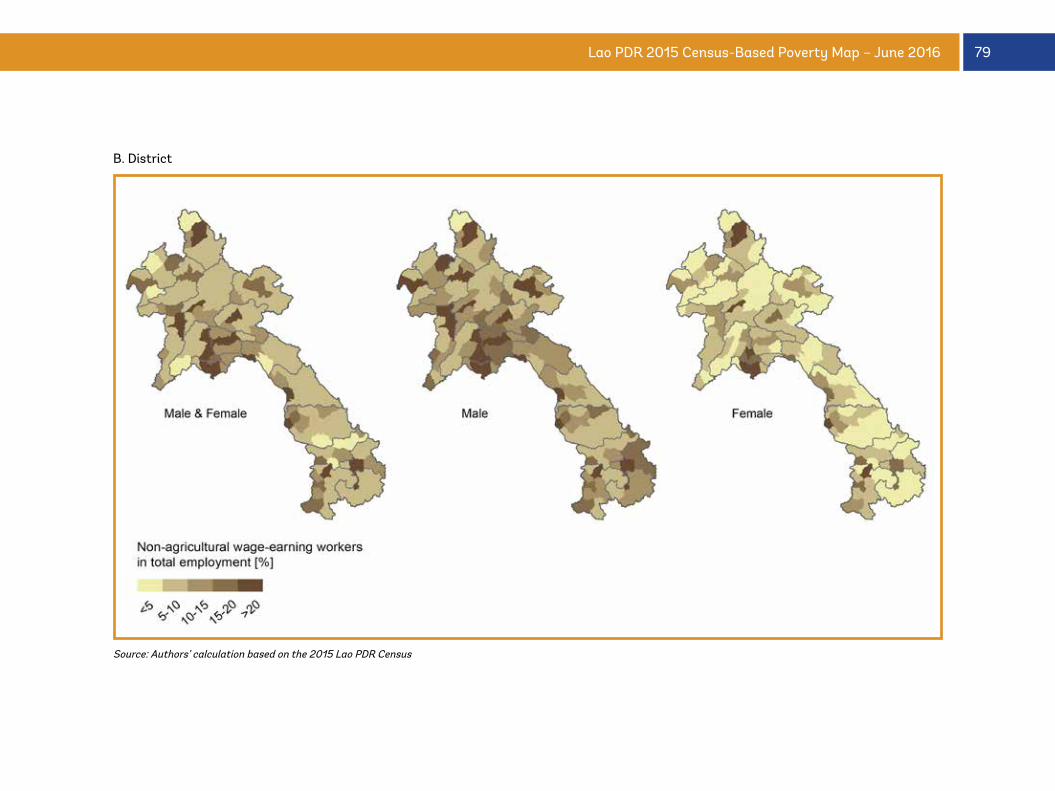
79Lao PDR 2015 Census-Based Poverty Map – June 2016
B. District
Source: Authors’ calculation based on the 2015 Lao PDR Census
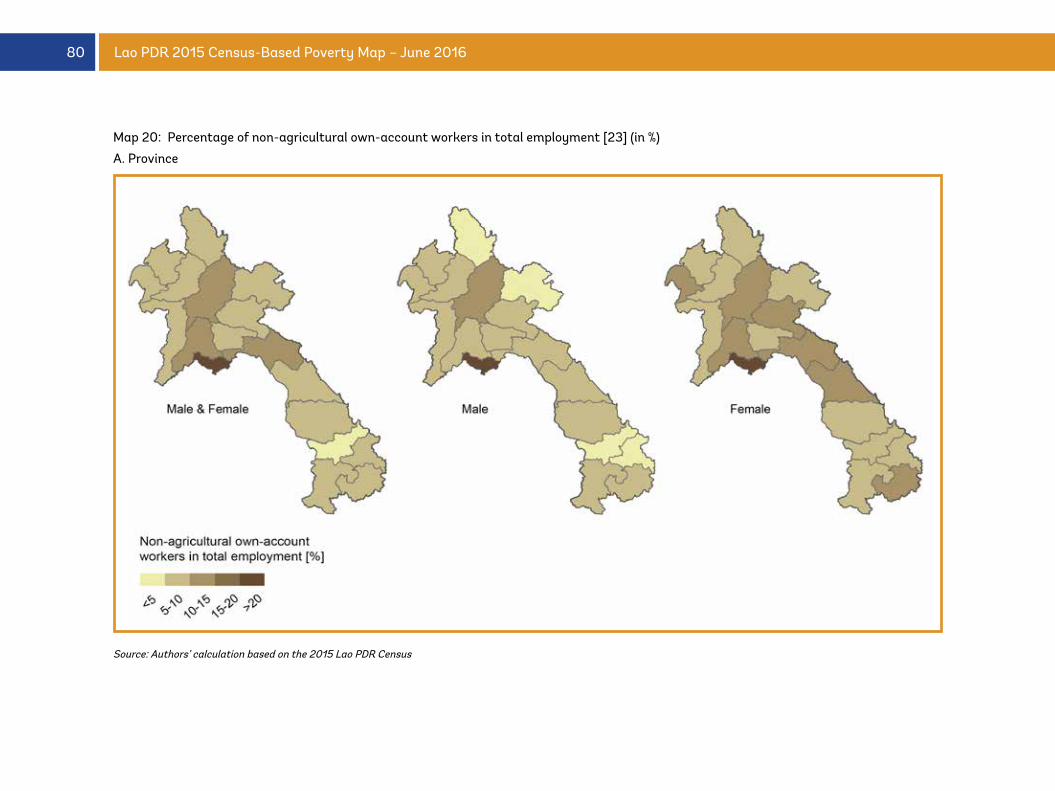
80 Lao PDR 2015 Census-Based Poverty Map – June 2016
Map 20: Percentage of non-agricultural own-account workers in total employment [23] (in %)
A. Province
Source: Authors’ calculation based on the 2015 Lao PDR Census
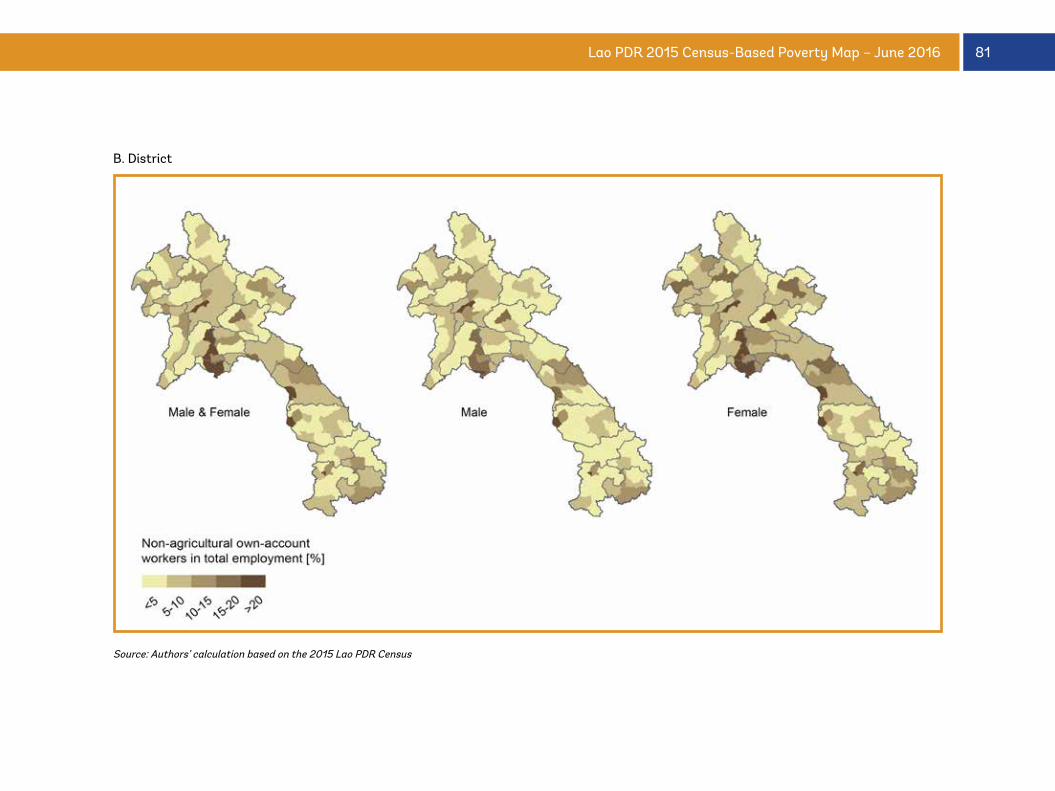
81Lao PDR 2015 Census-Based Poverty Map – June 2016
B. District
Source: Authors’ calculation based on the 2015 Lao PDR Census
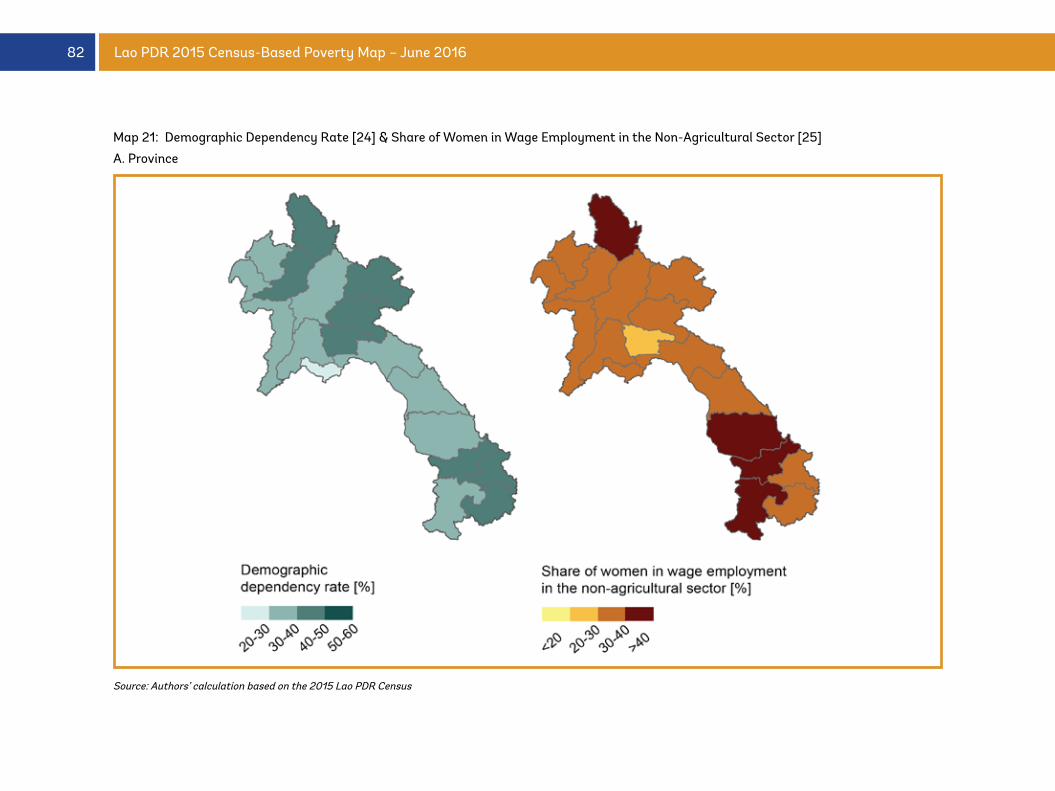
82 Lao PDR 2015 Census-Based Poverty Map – June 2016
Map 21: Demographic Dependency Rate [24] & Share of Women in Wage Employment in the Non-Agricultural Sector [25]
A. Province
Source: Authors’ calculation based on the 2015 Lao PDR Census
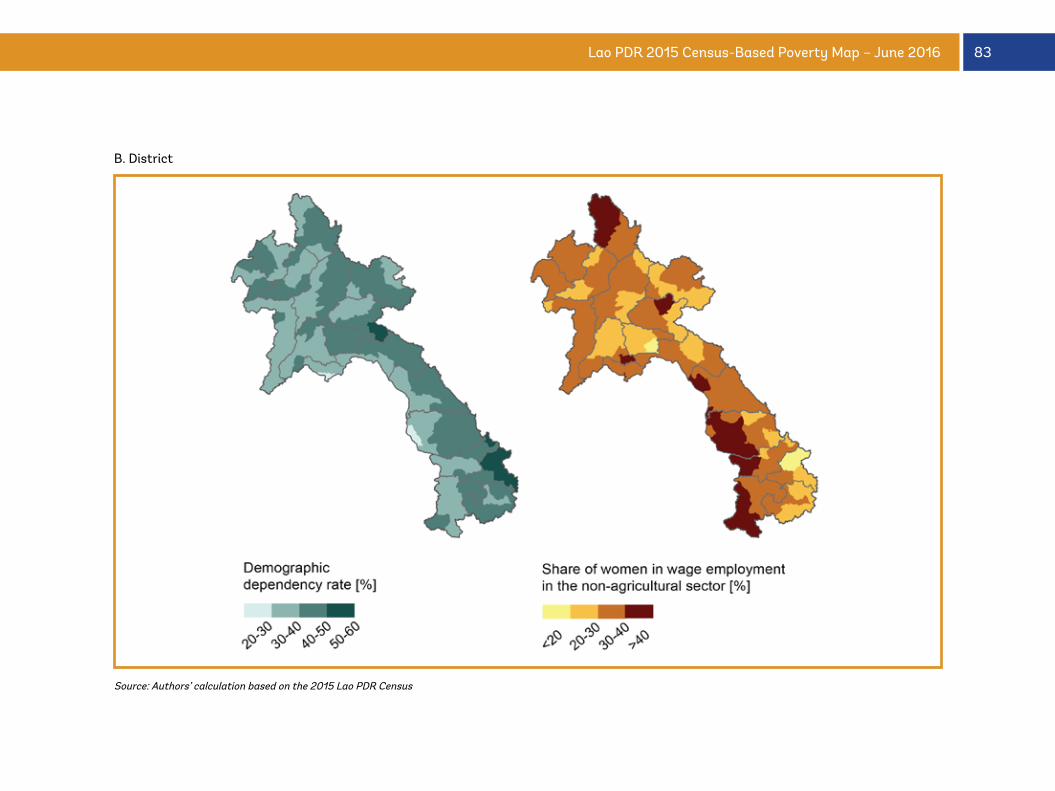
83Lao PDR 2015 Census-Based Poverty Map – June 2016
B. District
Source: Authors’ calculation based on the 2015 Lao PDR Census
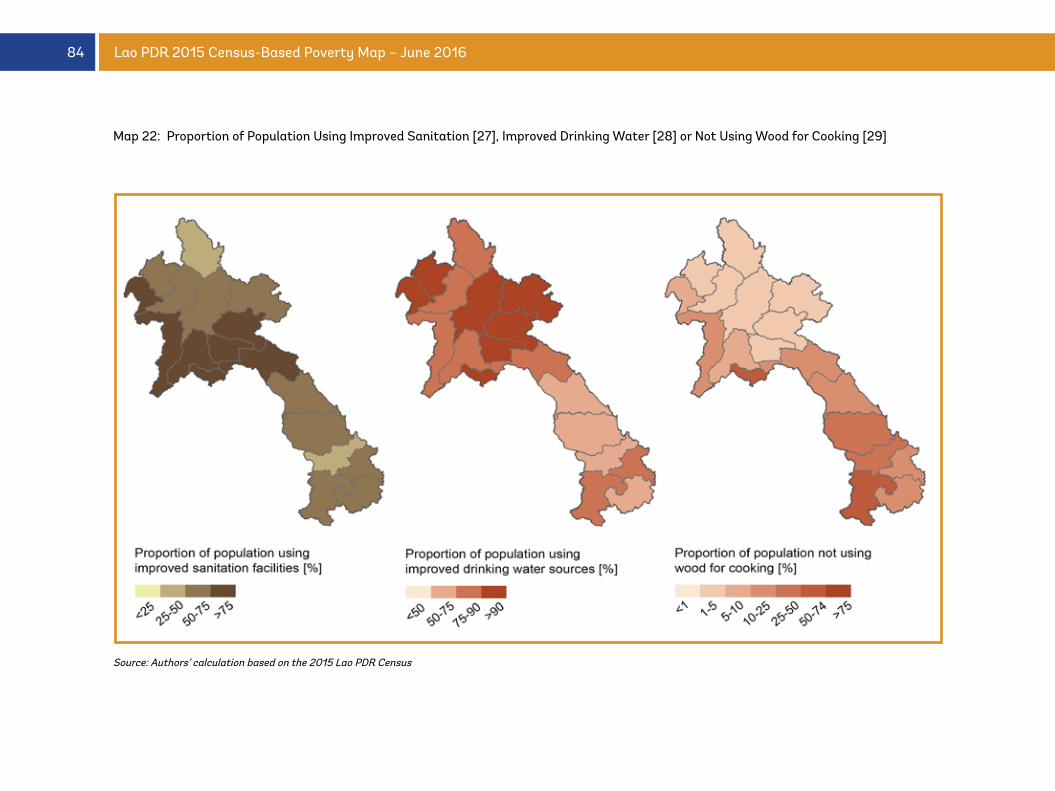
84 Lao PDR 2015 Census-Based Poverty Map – June 2016
Map 22: Proportion of Population Using Improved Sanitation [27], Improved Drinking Water [28] or Not Using Wood for Cooking [29]
Source: Authors’ calculation based on the 2015 Lao PDR Census
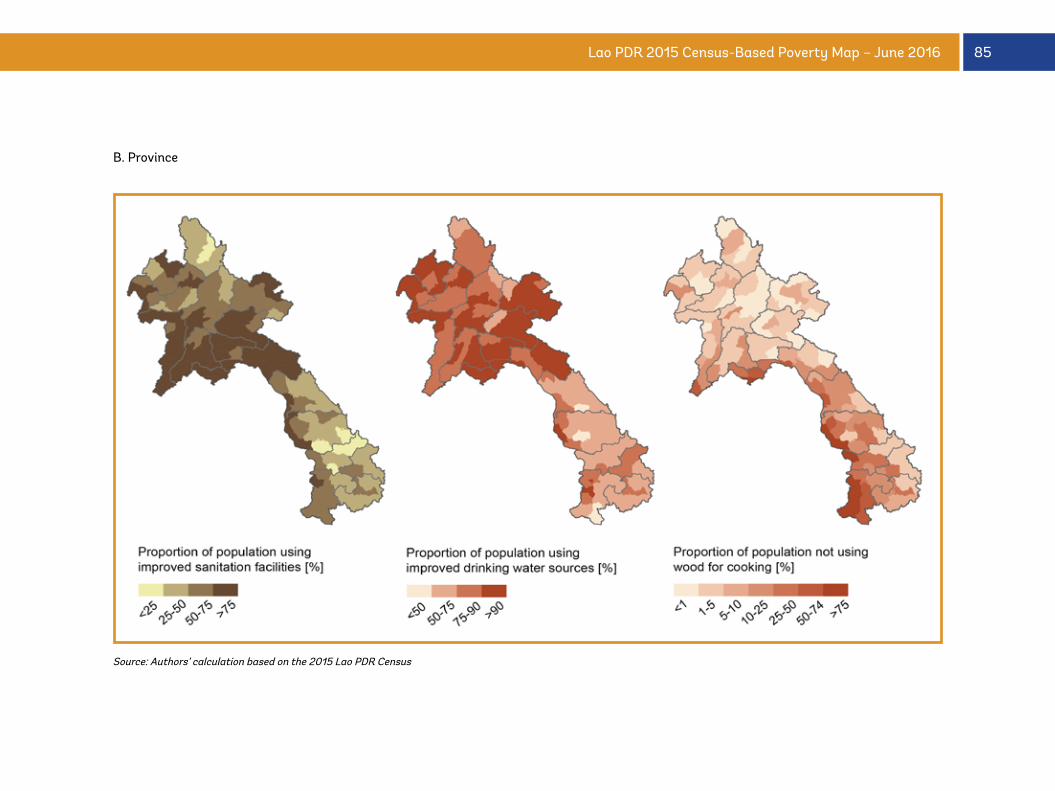
85Lao PDR 2015 Census-Based Poverty Map – June 2016
B. Province
Source: Authors’ calculation based on the 2015 Lao PDR Census
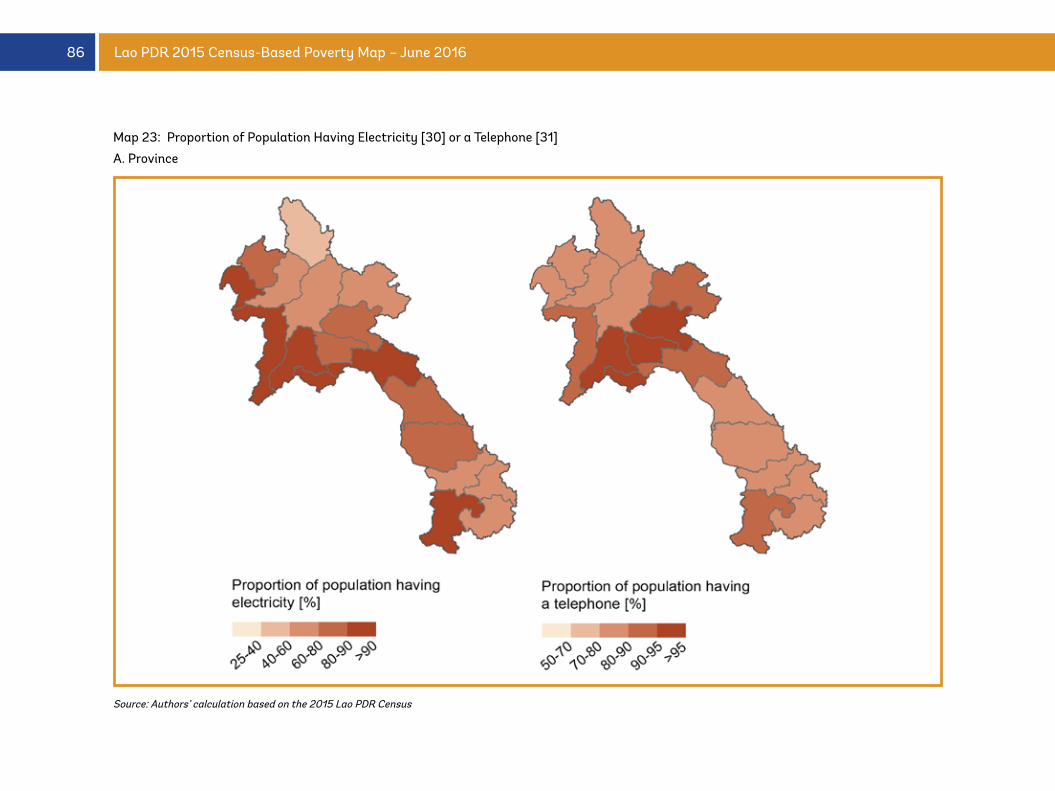
86 Lao PDR 2015 Census-Based Poverty Map – June 2016
Map 23: Proportion of Population Having Electricity [30] or a Telephone [31]
A. Province
Source: Authors’ calculation based on the 2015 Lao PDR Census
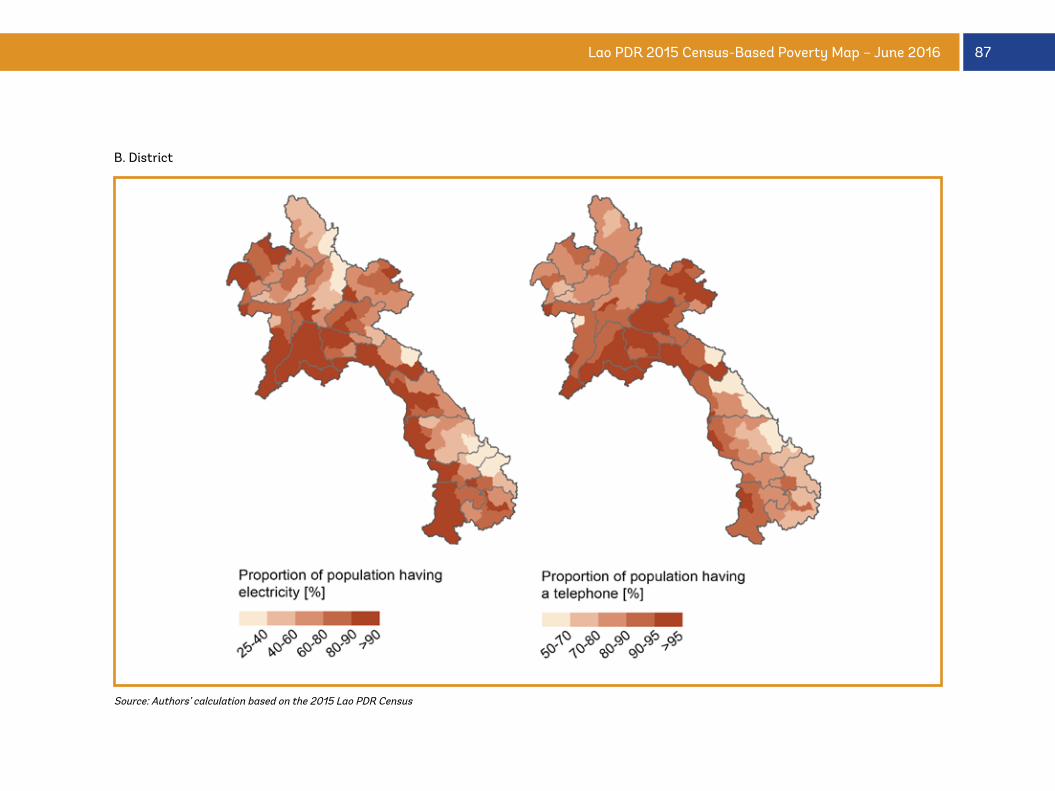
87Lao PDR 2015 Census-Based Poverty Map – June 2016
B. District
Source: Authors’ calculation based on the 2015 Lao PDR Census
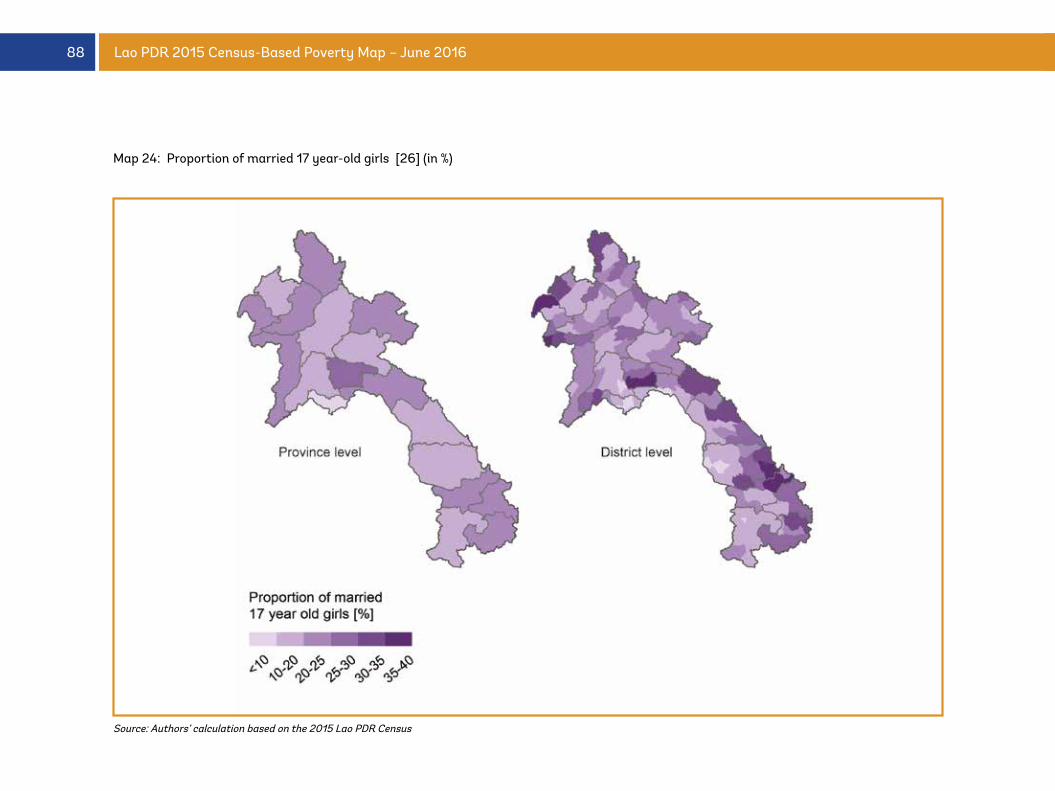
88 Lao PDR 2015 Census-Based Poverty Map – June 2016
Map 24: Proportion of married 17 year-old girls [26] (in %)
Source: Authors’ calculation based on the 2015 Lao PDR Census
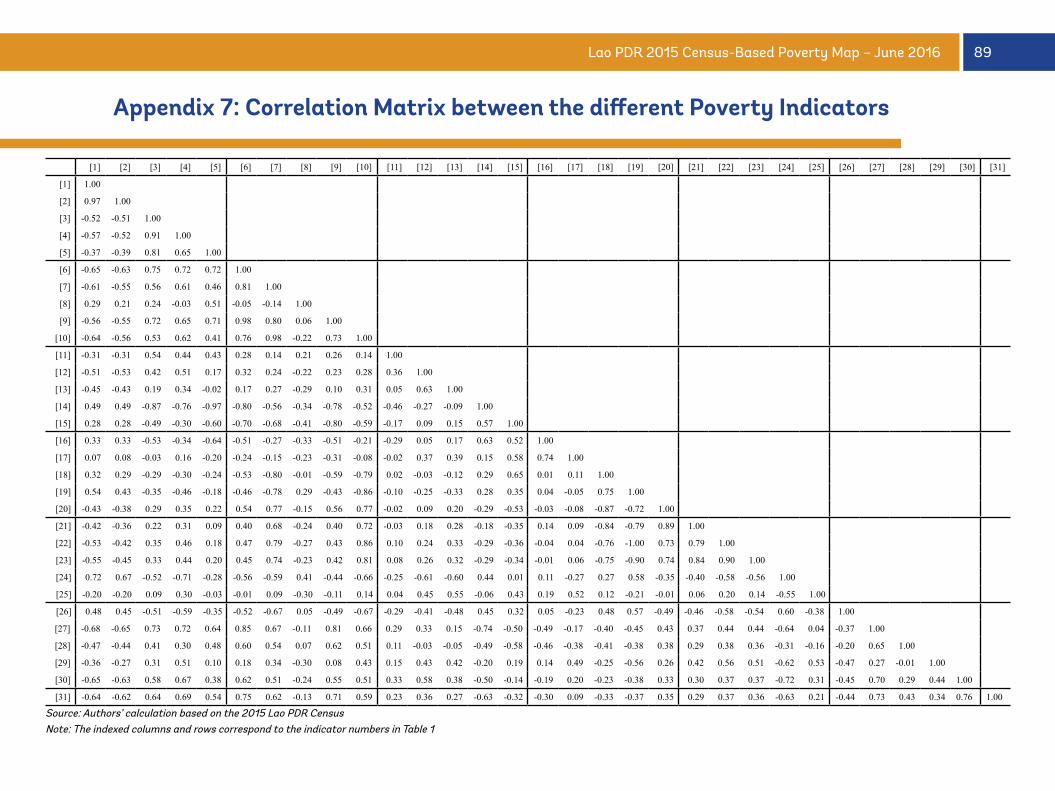
89Lao PDR 2015 Census-Based Poverty Map – June 2016
[1] [2] [3] [4] [5] [6] [7] [8] [9] [10] [11] [12] [13] [14] [15] [16] [17] [18] [19] [20] [21] [22] [23] [24] [25] [26] [27] [28] [29] [30] [31]
[1] 1.00
[2] 0.97 1.00
[3] -0.52 -0.51 1.00
[4] -0.57 -0.52 0.91 1.00
[5] -0.37 -0.39 0.81 0.65 1.00
[6] -0.65 -0.63 0.75 0.72 0.72 1.00
[7] -0.61 -0.55 0.56 0.61 0.46 0.81 1.00
[8] 0.29 0.21 0.24 -0.03 0.51 -0.05 -0.14 1.00
[9] -0.56 -0.55 0.72 0.65 0.71 0.98 0.80 0.06 1.00
[10] -0.64 -0.56 0.53 0.62 0.41 0.76 0.98 -0.22 0.73 1.00
[11] -0.31 -0.31 0.54 0.44 0.43 0.28 0.14 0.21 0.26 0.14 1.00
[12] -0.51 -0.53 0.42 0.51 0.17 0.32 0.24 -0.22 0.23 0.28 0.36 1.00
[13] -0.45 -0.43 0.19 0.34 -0.02 0.17 0.27 -0.29 0.10 0.31 0.05 0.63 1.00
[14] 0.49 0.49 -0.87 -0.76 -0.97 -0.80 -0.56 -0.34 -0.78 -0.52 -0.46 -0.27 -0.09 1.00
[15] 0.28 0.28 -0.49 -0.30 -0.60 -0.70 -0.68 -0.41 -0.80 -0.59 -0.17 0.09 0.15 0.57 1.00
[16] 0.33 0.33 -0.53 -0.34 -0.64 -0.51 -0.27 -0.33 -0.51 -0.21 -0.29 0.05 0.17 0.63 0.52 1.00
[17] 0.07 0.08 -0.03 0.16 -0.20 -0.24 -0.15 -0.23 -0.31 -0.08 -0.02 0.37 0.39 0.15 0.58 0.74 1.00
[18] 0.32 0.29 -0.29 -0.30 -0.24 -0.53 -0.80 -0.01 -0.59 -0.79 0.02 -0.03 -0.12 0.29 0.65 0.01 0.11 1.00
[19] 0.54 0.43 -0.35 -0.46 -0.18 -0.46 -0.78 0.29 -0.43 -0.86 -0.10 -0.25 -0.33 0.28 0.35 0.04 -0.05 0.75 1.00
[20] -0.43 -0.38 0.29 0.35 0.22 0.54 0.77 -0.15 0.56 0.77 -0.02 0.09 0.20 -0.29 -0.53 -0.03 -0.08 -0.87 -0.72 1.00
[21] -0.42 -0.36 0.22 0.31 0.09 0.40 0.68 -0.24 0.40 0.72 -0.03 0.18 0.28 -0.18 -0.35 0.14 0.09 -0.84 -0.79 0.89 1.00
[22] -0.53 -0.42 0.35 0.46 0.18 0.47 0.79 -0.27 0.43 0.86 0.10 0.24 0.33 -0.29 -0.36 -0.04 0.04 -0.76 -1.00 0.73 0.79 1.00
[23] -0.55 -0.45 0.33 0.44 0.20 0.45 0.74 -0.23 0.42 0.81 0.08 0.26 0.32 -0.29 -0.34 -0.01 0.06 -0.75 -0.90 0.74 0.84 0.90 1.00
[24] 0.72 0.67 -0.52 -0.71 -0.28 -0.56 -0.59 0.41 -0.44 -0.66 -0.25 -0.61 -0.60 0.44 0.01 0.11 -0.27 0.27 0.58 -0.35 -0.40 -0.58 -0.56 1.00
[25] -0.20 -0.20 0.09 0.30 -0.03 -0.01 0.09 -0.30 -0.11 0.14 0.04 0.45 0.55 -0.06 0.43 0.19 0.52 0.12 -0.21 -0.01 0.06 0.20 0.14 -0.55 1.00
[26] 0.48 0.45 -0.51 -0.59 -0.35 -0.52 -0.67 0.05 -0.49 -0.67 -0.29 -0.41 -0.48 0.45 0.32 0.05 -0.23 0.48 0.57 -0.49 -0.46 -0.58 -0.54 0.60 -0.38 1.00
[27] -0.68 -0.65 0.73 0.72 0.64 0.85 0.67 -0.11 0.81 0.66 0.29 0.33 0.15 -0.74 -0.50 -0.49 -0.17 -0.40 -0.45 0.43 0.37 0.44 0.44 -0.64 0.04 -0.37 1.00
[28] -0.47 -0.44 0.41 0.30 0.48 0.60 0.54 0.07 0.62 0.51 0.11 -0.03 -0.05 -0.49 -0.58 -0.46 -0.38 -0.41 -0.38 0.38 0.29 0.38 0.36 -0.31 -0.16 -0.20 0.65 1.00
[29] -0.36 -0.27 0.31 0.51 0.10 0.18 0.34 -0.30 0.08 0.43 0.15 0.43 0.42 -0.20 0.19 0.14 0.49 -0.25 -0.56 0.26 0.42 0.56 0.51 -0.62 0.53 -0.47 0.27 -0.01 1.00
[30] -0.65 -0.63 0.58 0.67 0.38 0.62 0.51 -0.24 0.55 0.51 0.33 0.58 0.38 -0.50 -0.14 -0.19 0.20 -0.23 -0.38 0.33 0.30 0.37 0.37 -0.72 0.31 -0.45 0.70 0.29 0.44 1.00
[31] -0.64 -0.62 0.64 0.69 0.54 0.75 0.62 -0.13 0.71 0.59 0.23 0.36 0.27 -0.63 -0.32 -0.30 0.09 -0.33 -0.37 0.35 0.29 0.37 0.36 -0.63 0.21 -0.44 0.73 0.43 0.34 0.76 1.00
Source: Authors’ calculation based on the 2015 Lao PDR CensusNote: The indexed columns and rows correspond to the indicator numbers in Table 1
Appendix 7: Correlation Matrix between the different Poverty Indicators
Photo by Remy Rossi / World Bank, 2013
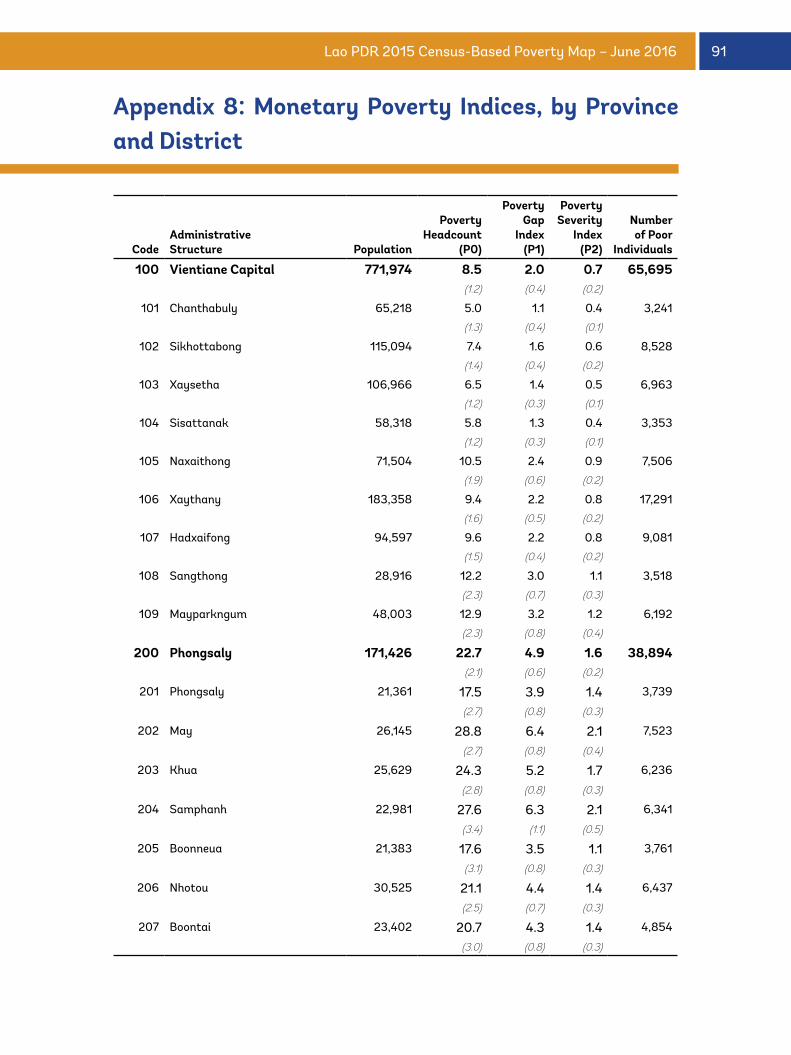
91Lao PDR 2015 Census-Based Poverty Map – June 2016
CodeAdministrativeStructure Population
Poverty Headcount
(P0)
Poverty Gap
Index(P1)
Poverty Severity
Index (P2)
Number of Poor
Individuals
100 Vientiane Capital 771,974 8.5 2.0 0.7 65,695(1.2) (0.4) (0.2)
101 Chanthabuly 65,218 5.0 1.1 0.4 3,241
(1.3) (0.4) (0.1)
102 Sikhottabong 115,094 7.4 1.6 0.6 8,528
(1.4) (0.4) (0.2)
103 Xaysetha 106,966 6.5 1.4 0.5 6,963
(1.2) (0.3) (0.1)
104 Sisattanak 58,318 5.8 1.3 0.4 3,353
(1.2) (0.3) (0.1)
105 Naxaithong 71,504 10.5 2.4 0.9 7,506
(1.9) (0.6) (0.2)
106 Xaythany 183,358 9.4 2.2 0.8 17,291
(1.6) (0.5) (0.2)
107 Hadxaifong 94,597 9.6 2.2 0.8 9,081
(1.5) (0.4) (0.2)
108 Sangthong 28,916 12.2 3.0 1.1 3,518
(2.3) (0.7) (0.3)
109 Mayparkngum 48,003 12.9 3.2 1.2 6,192
(2.3) (0.8) (0.4)
200 Phongsaly 171,426 22.7 4.9 1.6 38,894(2.1) (0.6) (0.2)
201 Phongsaly 21,361 17.5 3.9 1.4 3,739
(2.7) (0.8) (0.3)
202 May 26,145 28.8 6.4 2.1 7,523
(2.7) (0.8) (0.4)
203 Khua 25,629 24.3 5.2 1.7 6,236
(2.8) (0.8) (0.3)
204 Samphanh 22,981 27.6 6.3 2.1 6,341
(3.4) (1.1) (0.5)
205 Boonneua 21,383 17.6 3.5 1.1 3,761
(3.1) (0.8) (0.3)
206 Nhotou 30,525 21.1 4.4 1.4 6,437
(2.5) (0.7) (0.3)
207 Boontai 23,402 20.7 4.3 1.4 4,854
(3.0) (0.8) (0.3)
Appendix 8: Monetary Poverty Indices, by Province and District
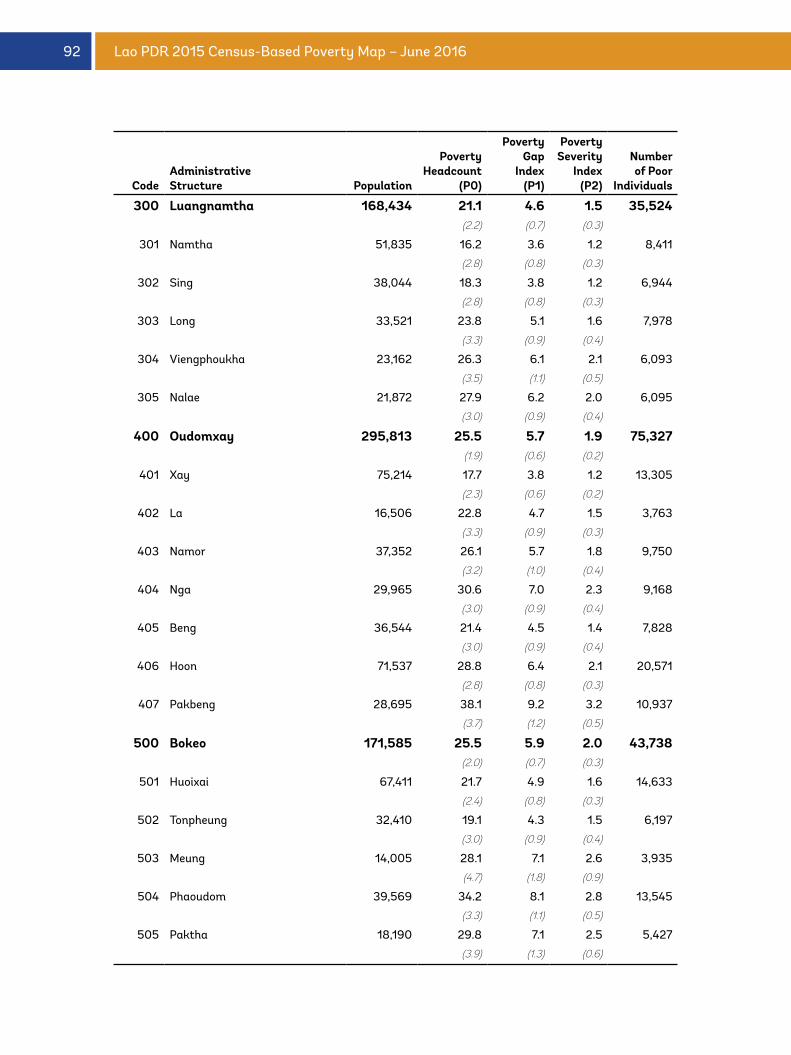
92 Lao PDR 2015 Census-Based Poverty Map – June 2016
CodeAdministrativeStructure Population
Poverty Headcount
(P0)
Poverty Gap
Index(P1)
Poverty Severity
Index (P2)
Number of Poor
Individuals
300 Luangnamtha 168,434 21.1 4.6 1.5 35,524 (2.2) (0.7) (0.3)
301 Namtha 51,835 16.2 3.6 1.2 8,411
(2.8) (0.8) (0.3)
302 Sing 38,044 18.3 3.8 1.2 6,944
(2.8) (0.8) (0.3)
303 Long 33,521 23.8 5.1 1.6 7,978
(3.3) (0.9) (0.4)
304 Viengphoukha 23,162 26.3 6.1 2.1 6,093
(3.5) (1.1) (0.5)
305 Nalae 21,872 27.9 6.2 2.0 6,095
(3.0) (0.9) (0.4)
400 Oudomxay 295,813 25.5 5.7 1.9 75,327 (1.9) (0.6) (0.2)
401 Xay 75,214 17.7 3.8 1.2 13,305
(2.3) (0.6) (0.2)
402 La 16,506 22.8 4.7 1.5 3,763
(3.3) (0.9) (0.3)
403 Namor 37,352 26.1 5.7 1.8 9,750
(3.2) (1.0) (0.4)
404 Nga 29,965 30.6 7.0 2.3 9,168
(3.0) (0.9) (0.4)
405 Beng 36,544 21.4 4.5 1.4 7,828
(3.0) (0.9) (0.4)
406 Hoon 71,537 28.8 6.4 2.1 20,571
(2.8) (0.8) (0.3)
407 Pakbeng 28,695 38.1 9.2 3.2 10,937
(3.7) (1.2) (0.5)
500 Bokeo 171,585 25.5 5.9 2.0 43,738 (2.0) (0.7) (0.3)
501 Huoixai 67,411 21.7 4.9 1.6 14,633
(2.4) (0.8) (0.3)
502 Tonpheung 32,410 19.1 4.3 1.5 6,197
(3.0) (0.9) (0.4)
503 Meung 14,005 28.1 7.1 2.6 3,935
(4.7) (1.8) (0.9)
504 Phaoudom 39,569 34.2 8.1 2.8 13,545
(3.3) (1.1) (0.5)
505 Paktha 18,190 29.8 7.1 2.5 5,427
(3.9) (1.3) (0.6)

93Lao PDR 2015 Census-Based Poverty Map – June 2016
CodeAdministrativeStructure Population
Poverty Headcount
(P0)
Poverty Gap
Index(P1)
Poverty Severity
Index (P2)
Number of Poor
Individuals
600 Luangprabang 418,000 22.9 4.9 1.6 95,575 (1.7) (0.5) (0.2)
601 Luangprabang 82,541 11.5 2.3 0.7 9,532
(2.0) (0.5) (0.2)
602 Xiengngeun 31,689 22.7 4.8 1.5 7,198
(3.2) (0.9) (0.3)
603 Nan 27,992 16.3 3.3 1.0 4,566
(2.5) (0.7) (0.3)
604 Parkou 25,509 21.2 4.3 1.3 5,401
(2.7) (0.8) (0.3)
605 Nambak 67,113 24.1 5.2 1.7 16,191
(3.1) (0.9) (0.4)
606 Ngoi 29,546 27.0 5.8 1.9 7,973
(2.4) (0.7) (0.3)
607 Pakxeng 22,024 30.2 6.7 2.2 6,647
(2.9) (0.9) (0.4)
608 Phonxay 31,802 30.5 6.8 2.2 9,695
(3.5) (1.0) (0.4)
609 Chomphet 29,927 26.5 5.9 1.9 7,943
(2.9) (0.9) (0.4)
610 Viengkham 28,441 30.5 6.8 2.2 8,664
(2.9) (0.9) (0.4)
611 Phoukhoune 22,735 26.7 5.7 1.8 6,061
(3.9) (1.1) (0.5)
612 Phonthong 18,681 30.5 7.2 2.5 5,696
(3.6) (1.1) (0.5)
700 Huaphanh 285,450 37.0 8.5 2.8 105,680 (3.7) (1.2) (0.5)
701 Xamneua 54,960 30.8 7.0 2.3 16,902
(3.7) (1.2) (0.5)
702 Xiengkhor 25,666 38.0 8.5 2.8 9,758
(4.9) (1.5) (0.6)
703 Huim 12,118 29.3 5.9 1.8 3,545
(5.0) (1.4) (0.5)
704 Viengxay 31,298 27.7 5.5 1.7 8,658
(4.2) (1.1) (0.4)
705 Huameuang 32,234 45.6 11.0 3.8 14,711 (5.3) (1.9) (0.8)
706 Xamtay 36,696 39.5 9.2 3.1 14,512 (4.8) (1.6) (0.7)
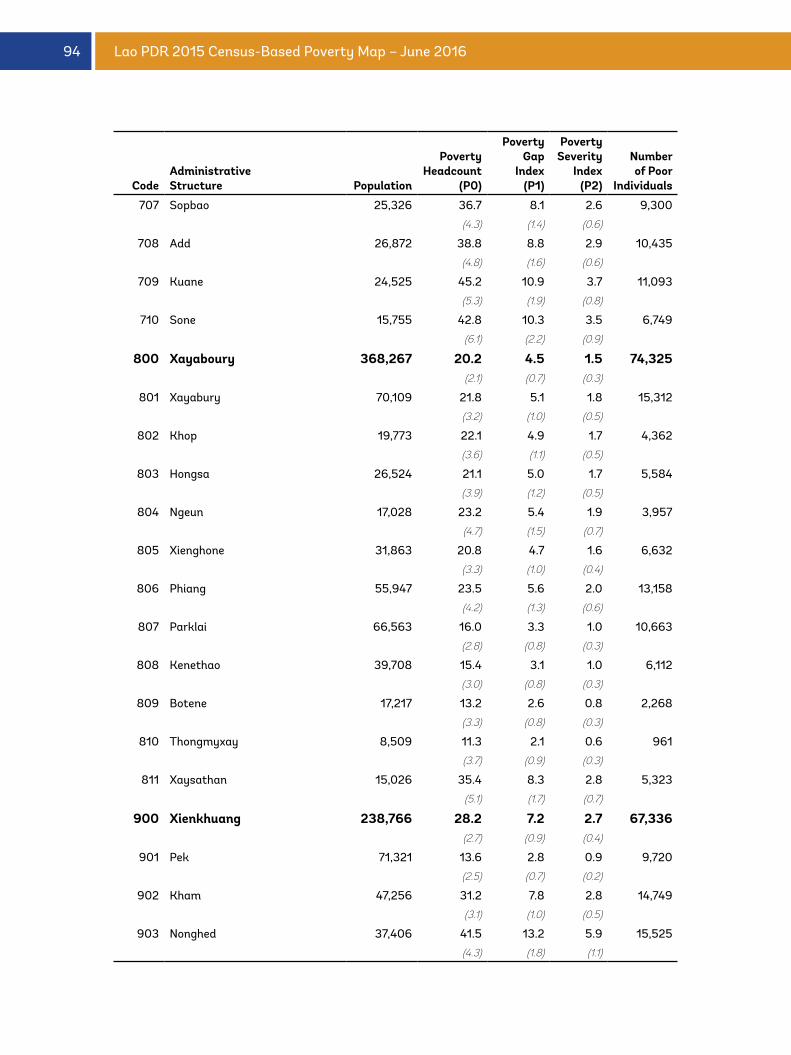
94 Lao PDR 2015 Census-Based Poverty Map – June 2016
CodeAdministrativeStructure Population
Poverty Headcount
(P0)
Poverty Gap
Index(P1)
Poverty Severity
Index (P2)
Number of Poor
Individuals
707 Sopbao 25,326 36.7 8.1 2.6 9,300
(4.3) (1.4) (0.6)
708 Add 26,872 38.8 8.8 2.9 10,435
(4.8) (1.6) (0.6)
709 Kuane 24,525 45.2 10.9 3.7 11,093
(5.3) (1.9) (0.8)
710 Sone 15,755 42.8 10.3 3.5 6,749
(6.1) (2.2) (0.9)
800 Xayaboury 368,267 20.2 4.5 1.5 74,325 (2.1) (0.7) (0.3)
801 Xayabury 70,109 21.8 5.1 1.8 15,312
(3.2) (1.0) (0.5)
802 Khop 19,773 22.1 4.9 1.7 4,362
(3.6) (1.1) (0.5)
803 Hongsa 26,524 21.1 5.0 1.7 5,584
(3.9) (1.2) (0.5)
804 Ngeun 17,028 23.2 5.4 1.9 3,957
(4.7) (1.5) (0.7)
805 Xienghone 31,863 20.8 4.7 1.6 6,632
(3.3) (1.0) (0.4)
806 Phiang 55,947 23.5 5.6 2.0 13,158
(4.2) (1.3) (0.6)
807 Parklai 66,563 16.0 3.3 1.0 10,663
(2.8) (0.8) (0.3)
808 Kenethao 39,708 15.4 3.1 1.0 6,112
(3.0) (0.8) (0.3)
809 Botene 17,217 13.2 2.6 0.8 2,268
(3.3) (0.8) (0.3)
810 Thongmyxay 8,509 11.3 2.1 0.6 961
(3.7) (0.9) (0.3)
811 Xaysathan 15,026 35.4 8.3 2.8 5,323
(5.1) (1.7) (0.7)
900 Xienkhuang 238,766 28.2 7.2 2.7 67,336 (2.7) (0.9) (0.4)
901 Pek 71,321 13.6 2.8 0.9 9,720
(2.5) (0.7) (0.2)
902 Kham 47,256 31.2 7.8 2.8 14,749
(3.1) (1.0) (0.5)
903 Nonghed 37,406 41.5 13.2 5.9 15,525
(4.3) (1.8) (1.1)
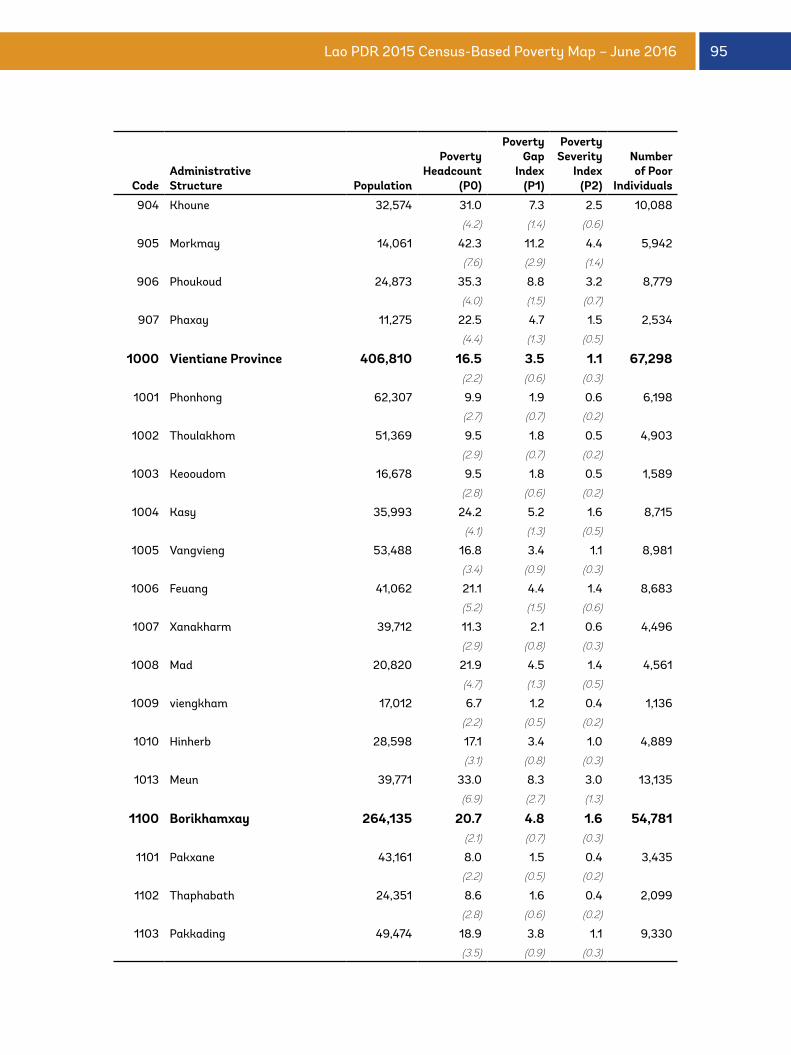
95Lao PDR 2015 Census-Based Poverty Map – June 2016
CodeAdministrativeStructure Population
Poverty Headcount
(P0)
Poverty Gap
Index(P1)
Poverty Severity
Index (P2)
Number of Poor
Individuals
904 Khoune 32,574 31.0 7.3 2.5 10,088
(4.2) (1.4) (0.6)
905 Morkmay 14,061 42.3 11.2 4.4 5,942
(7.6) (2.9) (1.4)
906 Phoukoud 24,873 35.3 8.8 3.2 8,779
(4.0) (1.5) (0.7)
907 Phaxay 11,275 22.5 4.7 1.5 2,534
(4.4) (1.3) (0.5)
1000 Vientiane Province 406,810 16.5 3.5 1.1 67,298 (2.2) (0.6) (0.3)
1001 Phonhong 62,307 9.9 1.9 0.6 6,198
(2.7) (0.7) (0.2)
1002 Thoulakhom 51,369 9.5 1.8 0.5 4,903
(2.9) (0.7) (0.2)
1003 Keooudom 16,678 9.5 1.8 0.5 1,589
(2.8) (0.6) (0.2)
1004 Kasy 35,993 24.2 5.2 1.6 8,715
(4.1) (1.3) (0.5)
1005 Vangvieng 53,488 16.8 3.4 1.1 8,981
(3.4) (0.9) (0.3)
1006 Feuang 41,062 21.1 4.4 1.4 8,683
(5.2) (1.5) (0.6)
1007 Xanakharm 39,712 11.3 2.1 0.6 4,496
(2.9) (0.8) (0.3)
1008 Mad 20,820 21.9 4.5 1.4 4,561
(4.7) (1.3) (0.5)
1009 viengkham 17,012 6.7 1.2 0.4 1,136
(2.2) (0.5) (0.2)
1010 Hinherb 28,598 17.1 3.4 1.0 4,889
(3.1) (0.8) (0.3)
1013 Meun 39,771 33.0 8.3 3.0 13,135
(6.9) (2.7) (1.3)
1100 Borikhamxay 264,135 20.7 4.8 1.6 54,781 (2.1) (0.7) (0.3)
1101 Pakxane 43,161 8.0 1.5 0.4 3,435
(2.2) (0.5) (0.2)
1102 Thaphabath 24,351 8.6 1.6 0.4 2,099
(2.8) (0.6) (0.2)
1103 Pakkading 49,474 18.9 3.8 1.1 9,330
(3.5) (0.9) (0.3)
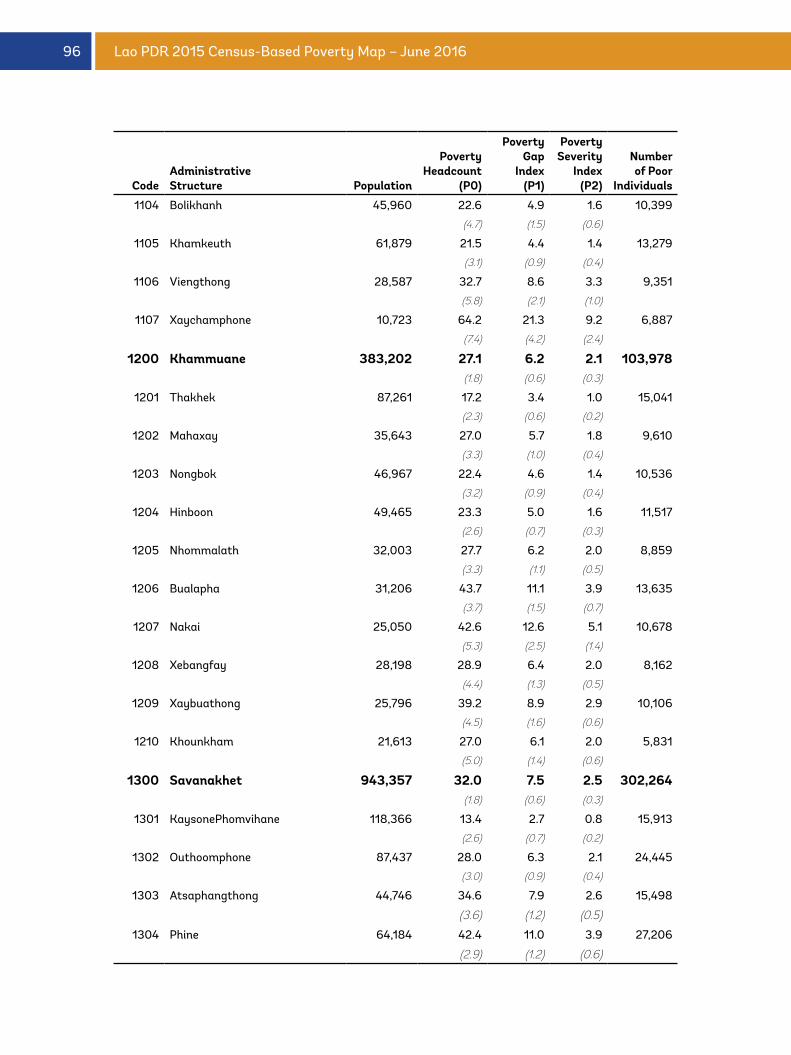
96 Lao PDR 2015 Census-Based Poverty Map – June 2016
CodeAdministrativeStructure Population
Poverty Headcount
(P0)
Poverty Gap
Index(P1)
Poverty Severity
Index (P2)
Number of Poor
Individuals
1104 Bolikhanh 45,960 22.6 4.9 1.6 10,399
(4.7) (1.5) (0.6)
1105 Khamkeuth 61,879 21.5 4.4 1.4 13,279
(3.1) (0.9) (0.4)
1106 Viengthong 28,587 32.7 8.6 3.3 9,351
(5.8) (2.1) (1.0)
1107 Xaychamphone 10,723 64.2 21.3 9.2 6,887
(7.4) (4.2) (2.4)
1200 Khammuane 383,202 27.1 6.2 2.1 103,978 (1.8) (0.6) (0.3)
1201 Thakhek 87,261 17.2 3.4 1.0 15,041
(2.3) (0.6) (0.2)
1202 Mahaxay 35,643 27.0 5.7 1.8 9,610
(3.3) (1.0) (0.4)
1203 Nongbok 46,967 22.4 4.6 1.4 10,536
(3.2) (0.9) (0.4)
1204 Hinboon 49,465 23.3 5.0 1.6 11,517
(2.6) (0.7) (0.3)
1205 Nhommalath 32,003 27.7 6.2 2.0 8,859
(3.3) (1.1) (0.5)
1206 Bualapha 31,206 43.7 11.1 3.9 13,635
(3.7) (1.5) (0.7)
1207 Nakai 25,050 42.6 12.6 5.1 10,678
(5.3) (2.5) (1.4)
1208 Xebangfay 28,198 28.9 6.4 2.0 8,162
(4.4) (1.3) (0.5)
1209 Xaybuathong 25,796 39.2 8.9 2.9 10,106
(4.5) (1.6) (0.6)
1210 Khounkham 21,613 27.0 6.1 2.0 5,831
(5.0) (1.4) (0.6)
1300 Savanakhet 943,357 32.0 7.5 2.5 302,264 (1.8) (0.6) (0.3)
1301 KaysonePhomvihane 118,366 13.4 2.7 0.8 15,913
(2.6) (0.7) (0.2)
1302 Outhoomphone 87,437 28.0 6.3 2.1 24,445
(3.0) (0.9) (0.4)
1303 Atsaphangthong 44,746 34.6 7.9 2.6 15,498
(3.6) (1.2) (0.5)
1304 Phine 64,184 42.4 11.0 3.9 27,206
(2.9) (1.2) (0.6)
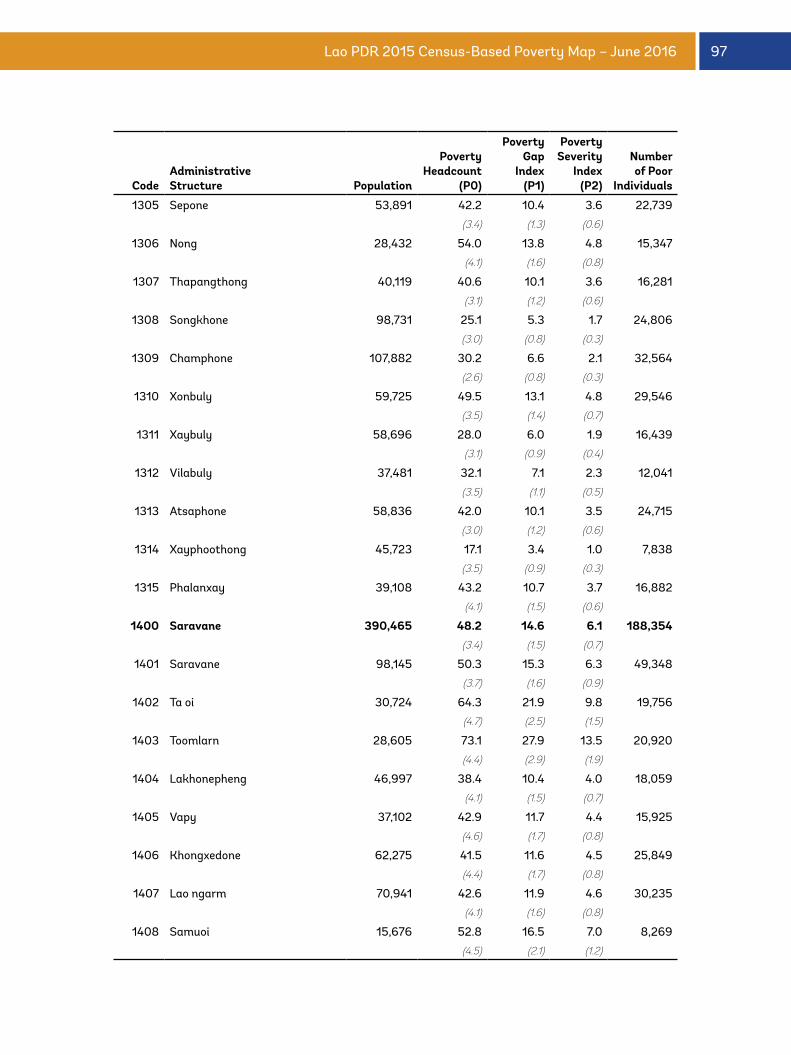
97Lao PDR 2015 Census-Based Poverty Map – June 2016
CodeAdministrativeStructure Population
Poverty Headcount
(P0)
Poverty Gap
Index(P1)
Poverty Severity
Index (P2)
Number of Poor
Individuals
1305 Sepone 53,891 42.2 10.4 3.6 22,739
(3.4) (1.3) (0.6)
1306 Nong 28,432 54.0 13.8 4.8 15,347
(4.1) (1.6) (0.8)
1307 Thapangthong 40,119 40.6 10.1 3.6 16,281
(3.1) (1.2) (0.6)
1308 Songkhone 98,731 25.1 5.3 1.7 24,806
(3.0) (0.8) (0.3)
1309 Champhone 107,882 30.2 6.6 2.1 32,564
(2.6) (0.8) (0.3)
1310 Xonbuly 59,725 49.5 13.1 4.8 29,546
(3.5) (1.4) (0.7)
1311 Xaybuly 58,696 28.0 6.0 1.9 16,439
(3.1) (0.9) (0.4)
1312 Vilabuly 37,481 32.1 7.1 2.3 12,041
(3.5) (1.1) (0.5)
1313 Atsaphone 58,836 42.0 10.1 3.5 24,715
(3.0) (1.2) (0.6)
1314 Xayphoothong 45,723 17.1 3.4 1.0 7,838
(3.5) (0.9) (0.3)
1315 Phalanxay 39,108 43.2 10.7 3.7 16,882
(4.1) (1.5) (0.6)
1400 Saravane 390,465 48.2 14.6 6.1 188,354 (3.4) (1.5) (0.7)
1401 Saravane 98,145 50.3 15.3 6.3 49,348
(3.7) (1.6) (0.9)
1402 Ta oi 30,724 64.3 21.9 9.8 19,756
(4.7) (2.5) (1.5)
1403 Toomlarn 28,605 73.1 27.9 13.5 20,920
(4.4) (2.9) (1.9)
1404 Lakhonepheng 46,997 38.4 10.4 4.0 18,059
(4.1) (1.5) (0.7)
1405 Vapy 37,102 42.9 11.7 4.4 15,925
(4.6) (1.7) (0.8)
1406 Khongxedone 62,275 41.5 11.6 4.5 25,849
(4.4) (1.7) (0.8)
1407 Lao ngarm 70,941 42.6 11.9 4.6 30,235
(4.1) (1.6) (0.8)
1408 Samuoi 15,676 52.8 16.5 7.0 8,269
(4.5) (2.1) (1.2)
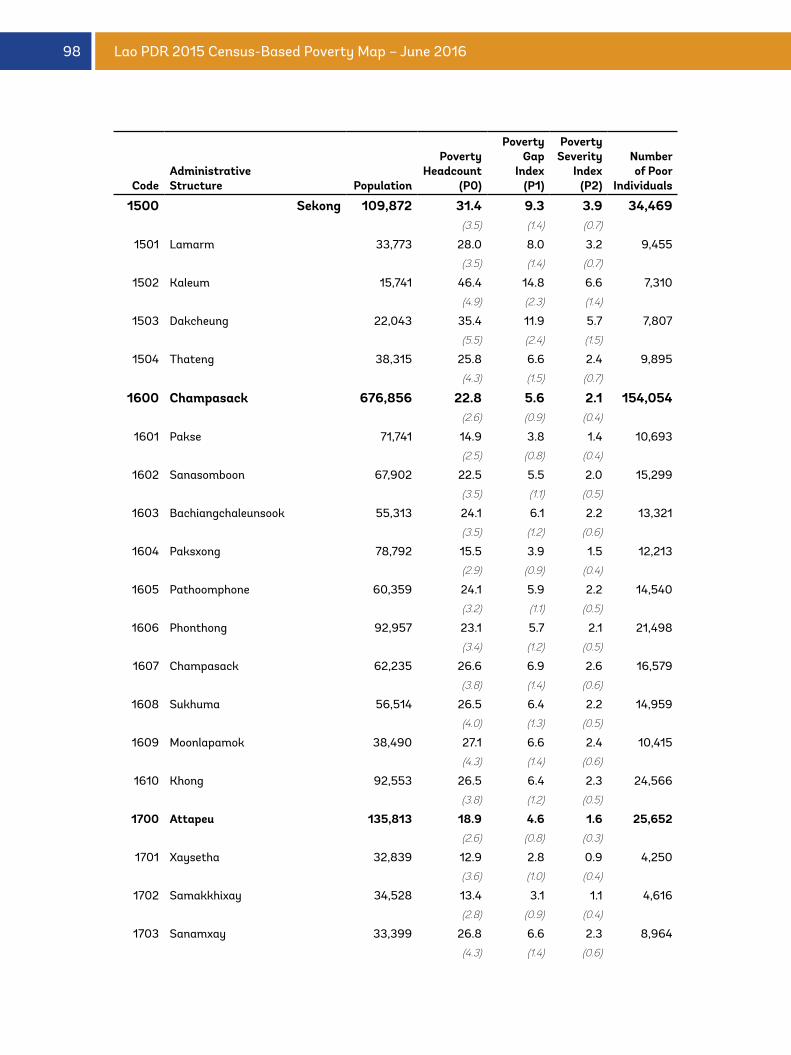
98 Lao PDR 2015 Census-Based Poverty Map – June 2016
CodeAdministrativeStructure Population
Poverty Headcount
(P0)
Poverty Gap
Index(P1)
Poverty Severity
Index (P2)
Number of Poor
Individuals
1500 Sekong 109,872 31.4 9.3 3.9 34,469 (3.5) (1.4) (0.7)
1501 Lamarm 33,773 28.0 8.0 3.2 9,455
(3.5) (1.4) (0.7)
1502 Kaleum 15,741 46.4 14.8 6.6 7,310
(4.9) (2.3) (1.4)
1503 Dakcheung 22,043 35.4 11.9 5.7 7,807
(5.5) (2.4) (1.5)
1504 Thateng 38,315 25.8 6.6 2.4 9,895
(4.3) (1.5) (0.7)
1600 Champasack 676,856 22.8 5.6 2.1 154,054 (2.6) (0.9) (0.4)
1601 Pakse 71,741 14.9 3.8 1.4 10,693
(2.5) (0.8) (0.4)
1602 Sanasomboon 67,902 22.5 5.5 2.0 15,299
(3.5) (1.1) (0.5)
1603 Bachiangchaleunsook 55,313 24.1 6.1 2.2 13,321
(3.5) (1.2) (0.6)
1604 Paksxong 78,792 15.5 3.9 1.5 12,213
(2.9) (0.9) (0.4)
1605 Pathoomphone 60,359 24.1 5.9 2.2 14,540
(3.2) (1.1) (0.5)
1606 Phonthong 92,957 23.1 5.7 2.1 21,498
(3.4) (1.2) (0.5)
1607 Champasack 62,235 26.6 6.9 2.6 16,579
(3.8) (1.4) (0.6)
1608 Sukhuma 56,514 26.5 6.4 2.2 14,959
(4.0) (1.3) (0.5)
1609 Moonlapamok 38,490 27.1 6.6 2.4 10,415
(4.3) (1.4) (0.6)
1610 Khong 92,553 26.5 6.4 2.3 24,566
(3.8) (1.2) (0.5)
1700 Attapeu 135,813 18.9 4.6 1.6 25,652 (2.6) (0.8) (0.3)
1701 Xaysetha 32,839 12.9 2.8 0.9 4,250
(3.6) (1.0) (0.4)
1702 Samakkhixay 34,528 13.4 3.1 1.1 4,616
(2.8) (0.9) (0.4)
1703 Sanamxay 33,399 26.8 6.6 2.3 8,964
(4.3) (1.4) (0.6)
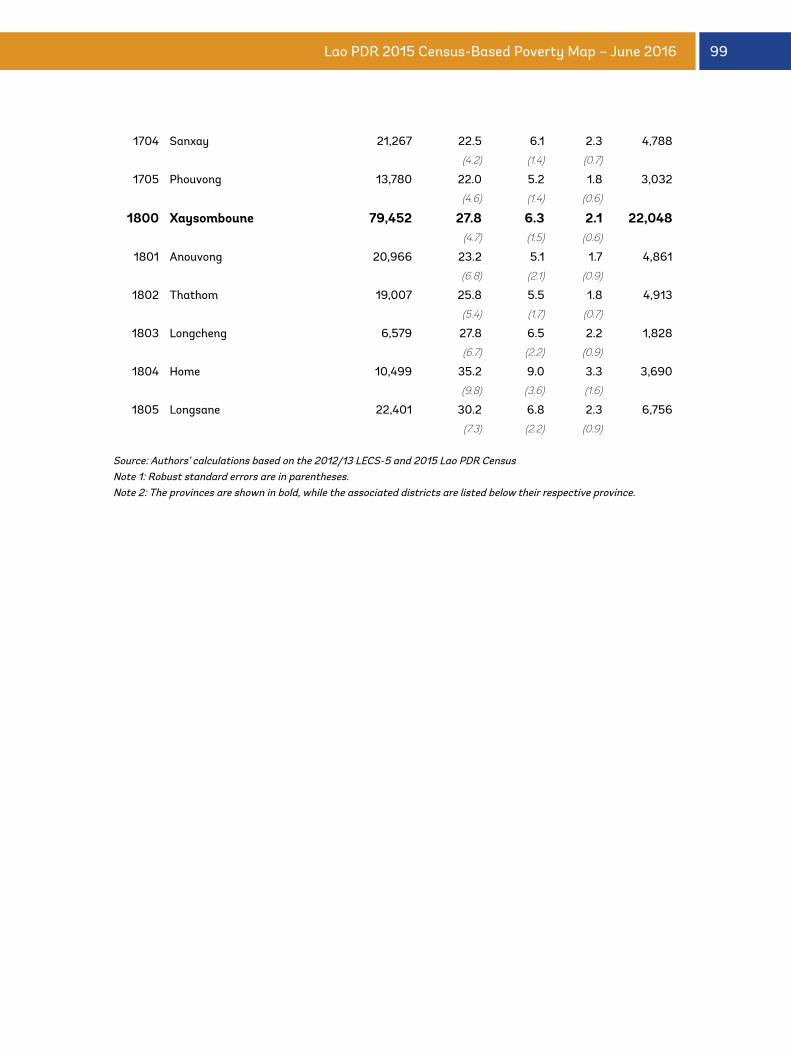
99Lao PDR 2015 Census-Based Poverty Map – June 2016
1704 Sanxay 21,267 22.5 6.1 2.3 4,788
(4.2) (1.4) (0.7)
1705 Phouvong 13,780 22.0 5.2 1.8 3,032
(4.6) (1.4) (0.6)
1800 Xaysomboune 79,452 27.8 6.3 2.1 22,048 (4.7) (1.5) (0.6)
1801 Anouvong 20,966 23.2 5.1 1.7 4,861
(6.8) (2.1) (0.9)
1802 Thathom 19,007 25.8 5.5 1.8 4,913
(5.4) (1.7) (0.7)
1803 Longcheng 6,579 27.8 6.5 2.2 1,828
(6.7) (2.2) (0.9)
1804 Home 10,499 35.2 9.0 3.3 3,690
(9.8) (3.6) (1.6)
1805 Longsane 22,401 30.2 6.8 2.3 6,756
(7.3) (2.2) (0.9)
Source: Authors’ calculations based on the 2012/13 LECS-5 and 2015 Lao PDR CensusNote 1: Robust standard errors are in parentheses.Note 2: The provinces are shown in bold, while the associated districts are listed below their respective province.
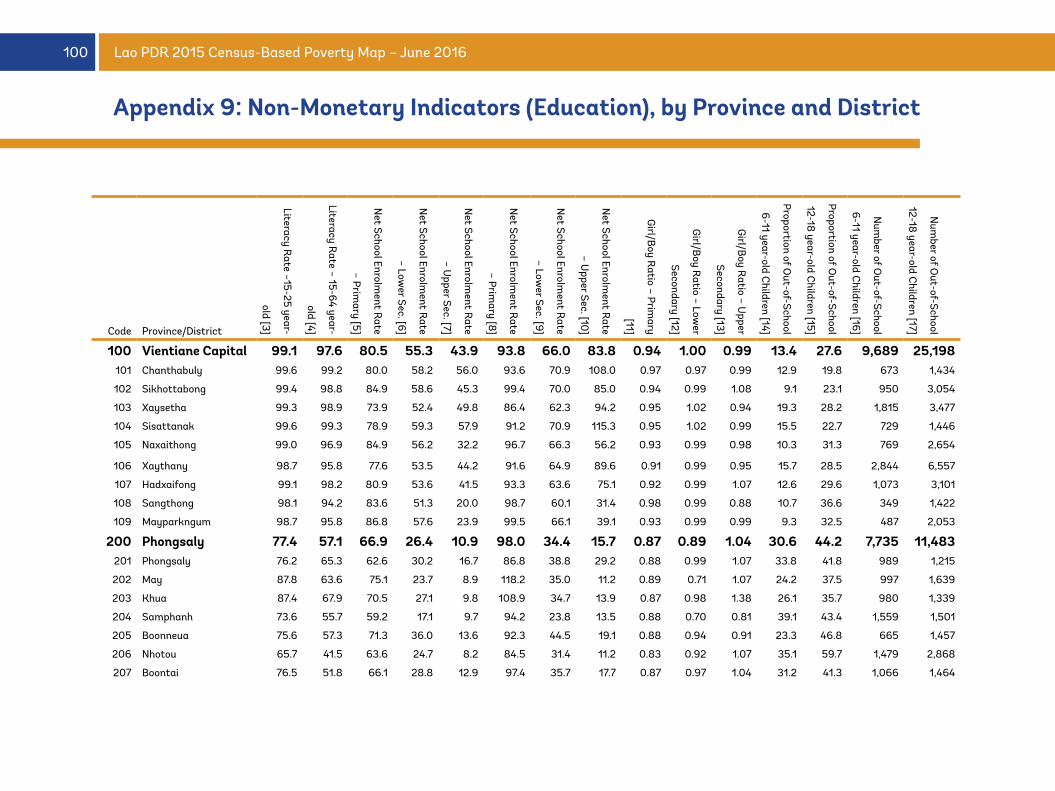
100 Lao PDR 2015 Census-Based Poverty Map – June 2016
Code Province/District
Literacy Rate –15-25 year-
old [3]
Literacy Rate – 15-64 year-
old [4]
Net School Enrolm
ent Rate
– Primary [5]
Net School Enrolm
ent Rate
– Lower Sec. [6]
Net School Enrolm
ent Rate
– Upper Sec. [7]
Net School Enrolm
ent Rate
– Primary [8]
Net School Enrolm
ent Rate
– Lower Sec. [9]
Net School Enrolm
ent Rate
– Upper Sec. [10
]
Girl/B
oy Ratio – Prim
ary
[11]
Girl/B
oy Ratio – Low
er
Secondary [12]
Girl/B
oy Ratio – U
pper
Secondary [13]
Proportion of Out-of-School
6-11 year-old Children [14]
Proportion of Out-of-School
12-18 year-old C
hildren [15]
Num
ber of Out-of-School
6-11 year-old Children [16]
Num
ber of Out-of-School
12-18 year-old C
hildren [17]
100 Vientiane Capital 99.1 97.6 80.5 55.3 43.9 93.8 66.0 83.8 0.94 1.00 0.99 13.4 27.6 9,689 25,198 101 Chanthabuly 99.6 99.2 80.0 58.2 56.0 93.6 70.9 108.0 0.97 0.97 0.99 12.9 19.8 673 1,434
102 Sikhottabong 99.4 98.8 84.9 58.6 45.3 99.4 70.0 85.0 0.94 0.99 1.08 9.1 23.1 950 3,054
103 Xaysetha 99.3 98.9 73.9 52.4 49.8 86.4 62.3 94.2 0.95 1.02 0.94 19.3 28.2 1,815 3,477
104 Sisattanak 99.6 99.3 78.9 59.3 57.9 91.2 70.9 115.3 0.95 1.02 0.99 15.5 22.7 729 1,446
105 Naxaithong 99.0 96.9 84.9 56.2 32.2 96.7 66.3 56.2 0.93 0.99 0.98 10.3 31.3 769 2,654
106 Xaythany 98.7 95.8 77.6 53.5 44.2 91.6 64.9 89.6 0.91 0.99 0.95 15.7 28.5 2,844 6,557
107 Hadxaifong 99.1 98.2 80.9 53.6 41.5 93.3 63.6 75.1 0.92 0.99 1.07 12.6 29.6 1,073 3,101
108 Sangthong 98.1 94.2 83.6 51.3 20.0 98.7 60.1 31.4 0.98 0.99 0.88 10.7 36.6 349 1,422
109 Mayparkngum 98.7 95.8 86.8 57.6 23.9 99.5 66.1 39.1 0.93 0.99 0.99 9.3 32.5 487 2,053
200 Phongsaly 77.4 57.1 66.9 26.4 10.9 98.0 34.4 15.7 0.87 0.89 1.04 30.6 44.2 7,735 11,483 201 Phongsaly 76.2 65.3 62.6 30.2 16.7 86.8 38.8 29.2 0.88 0.99 1.07 33.8 41.8 989 1,215
202 May 87.8 63.6 75.1 23.7 8.9 118.2 35.0 11.2 0.89 0.71 1.07 24.2 37.5 997 1,639
203 Khua 87.4 67.9 70.5 27.1 9.8 108.9 34.7 13.9 0.87 0.98 1.38 26.1 35.7 980 1,339
204 Samphanh 73.6 55.7 59.2 17.1 9.7 94.2 23.8 13.5 0.88 0.70 0.81 39.1 43.4 1,559 1,501
205 Boonneua 75.6 57.3 71.3 36.0 13.6 92.3 44.5 19.1 0.88 0.94 0.91 23.3 46.8 665 1,457
206 Nhotou 65.7 41.5 63.6 24.7 8.2 84.5 31.4 11.2 0.83 0.92 1.07 35.1 59.7 1,479 2,868
207 Boontai 76.5 51.8 66.1 28.8 12.9 97.4 35.7 17.7 0.87 0.97 1.04 31.2 41.3 1,066 1,464
Appendix 9: Non-Monetary Indicators (Education), by Province and District
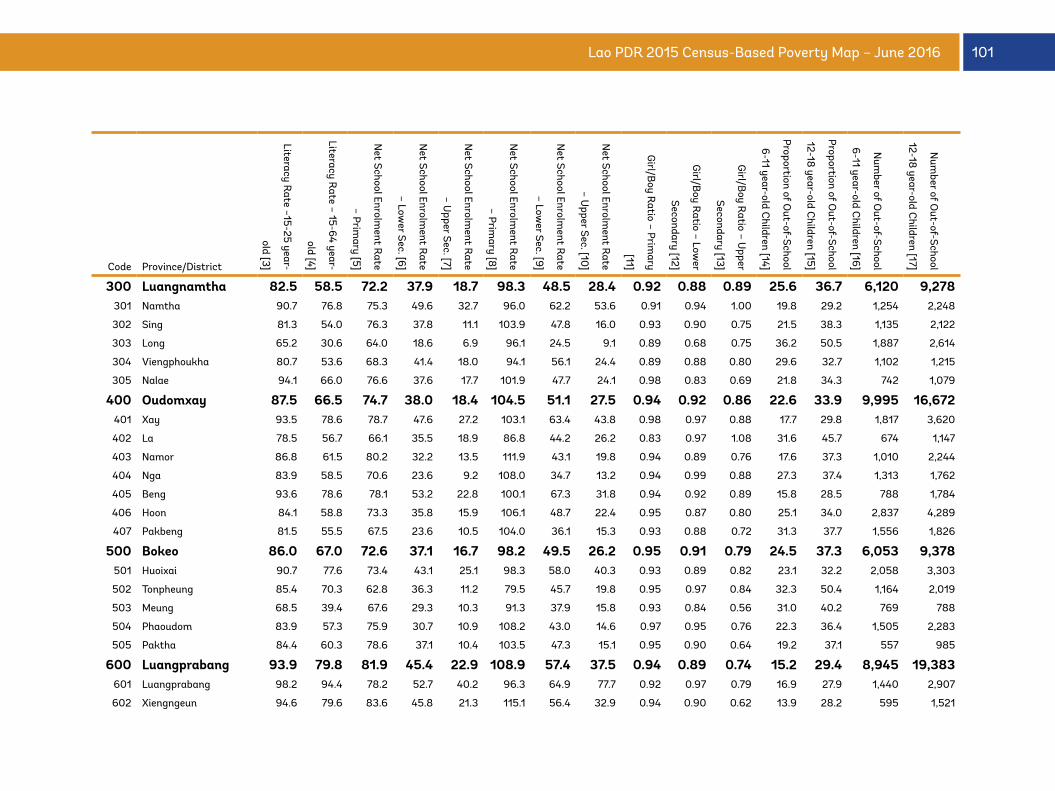
101Lao PDR 2015 Census-Based Poverty Map – June 2016
Code Province/District
Literacy Rate –15-25 year-
old [3]
Literacy Rate – 15-64 year-
old [4]
Net School Enrolm
ent Rate
– Primary [5]
Net School Enrolm
ent Rate
– Lower Sec. [6]
Net School Enrolm
ent Rate
– Upper Sec. [7]
Net School Enrolm
ent Rate
– Primary [8]
Net School Enrolm
ent Rate
– Lower Sec. [9]
Net School Enrolm
ent Rate
– Upper Sec. [10
]
Girl/B
oy Ratio – Prim
ary
[11]
Girl/B
oy Ratio – Low
er
Secondary [12]
Girl/B
oy Ratio – U
pper
Secondary [13]
Proportion of Out-of-School
6-11 year-old Children [14]
Proportion of Out-of-School
12-18 year-old C
hildren [15]
Num
ber of Out-of-School
6-11 year-old Children [16]
Num
ber of Out-of-School
12-18 year-old C
hildren [17]
300 Luangnamtha 82.5 58.5 72.2 37.9 18.7 98.3 48.5 28.4 0.92 0.88 0.89 25.6 36.7 6,120 9,278 301 Namtha 90.7 76.8 75.3 49.6 32.7 96.0 62.2 53.6 0.91 0.94 1.00 19.8 29.2 1,254 2,248
302 Sing 81.3 54.0 76.3 37.8 11.1 103.9 47.8 16.0 0.93 0.90 0.75 21.5 38.3 1,135 2,122
303 Long 65.2 30.6 64.0 18.6 6.9 96.1 24.5 9.1 0.89 0.68 0.75 36.2 50.5 1,887 2,614
304 Viengphoukha 80.7 53.6 68.3 41.4 18.0 94.1 56.1 24.4 0.89 0.88 0.80 29.6 32.7 1,102 1,215
305 Nalae 94.1 66.0 76.6 37.6 17.7 101.9 47.7 24.1 0.98 0.83 0.69 21.8 34.3 742 1,079
400 Oudomxay 87.5 66.5 74.7 38.0 18.4 104.5 51.1 27.5 0.94 0.92 0.86 22.6 33.9 9,995 16,672 401 Xay 93.5 78.6 78.7 47.6 27.2 103.1 63.4 43.8 0.98 0.97 0.88 17.7 29.8 1,817 3,620
402 La 78.5 56.7 66.1 35.5 18.9 86.8 44.2 26.2 0.83 0.97 1.08 31.6 45.7 674 1,147
403 Namor 86.8 61.5 80.2 32.2 13.5 111.9 43.1 19.8 0.94 0.89 0.76 17.6 37.3 1,010 2,244
404 Nga 83.9 58.5 70.6 23.6 9.2 108.0 34.7 13.2 0.94 0.99 0.88 27.3 37.4 1,313 1,762
405 Beng 93.6 78.6 78.1 53.2 22.8 100.1 67.3 31.8 0.94 0.92 0.89 15.8 28.5 788 1,784
406 Hoon 84.1 58.8 73.3 35.8 15.9 106.1 48.7 22.4 0.95 0.87 0.80 25.1 34.0 2,837 4,289
407 Pakbeng 81.5 55.5 67.5 23.6 10.5 104.0 36.1 15.3 0.93 0.88 0.72 31.3 37.7 1,556 1,826
500 Bokeo 86.0 67.0 72.6 37.1 16.7 98.2 49.5 26.2 0.95 0.91 0.79 24.5 37.3 6,053 9,378 501 Huoixai 90.7 77.6 73.4 43.1 25.1 98.3 58.0 40.3 0.93 0.89 0.82 23.1 32.2 2,058 3,303
502 Tonpheung 85.4 70.3 62.8 36.3 11.2 79.5 45.7 19.8 0.95 0.97 0.84 32.3 50.4 1,164 2,019
503 Meung 68.5 39.4 67.6 29.3 10.3 91.3 37.9 15.8 0.93 0.84 0.56 31.0 40.2 769 788
504 Phaoudom 83.9 57.3 75.9 30.7 10.9 108.2 43.0 14.6 0.97 0.95 0.76 22.3 36.4 1,505 2,283
505 Paktha 84.4 60.3 78.6 37.1 10.4 103.5 47.3 15.1 0.95 0.90 0.64 19.2 37.1 557 985
600 Luangprabang 93.9 79.8 81.9 45.4 22.9 108.9 57.4 37.5 0.94 0.89 0.74 15.2 29.4 8,945 19,383 601 Luangprabang 98.2 94.4 78.2 52.7 40.2 96.3 64.9 77.7 0.92 0.97 0.79 16.9 27.9 1,440 2,907
602 Xiengngeun 94.6 79.6 83.6 45.8 21.3 115.1 56.4 32.9 0.94 0.90 0.62 13.9 28.2 595 1,521
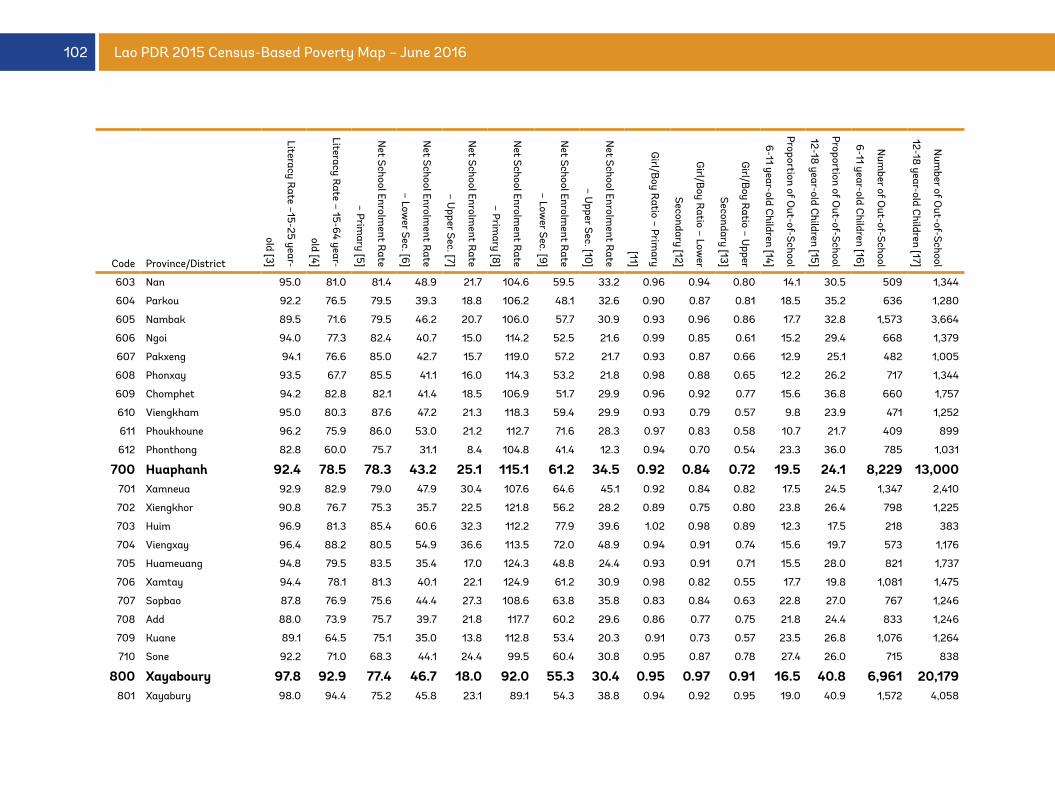
102 Lao PDR 2015 Census-Based Poverty Map – June 2016
Code Province/District
Literacy Rate –15-25 year-
old [3]
Literacy Rate – 15-64 year-
old [4]
Net School Enrolm
ent Rate
– Primary [5]
Net School Enrolm
ent Rate
– Lower Sec. [6]
Net School Enrolm
ent Rate
– Upper Sec. [7]
Net School Enrolm
ent Rate
– Primary [8]
Net School Enrolm
ent Rate
– Lower Sec. [9]
Net School Enrolm
ent Rate
– Upper Sec. [10
]
Girl/B
oy Ratio – Prim
ary
[11]
Girl/B
oy Ratio – Low
er
Secondary [12]
Girl/B
oy Ratio – U
pper
Secondary [13]
Proportion of Out-of-School
6-11 year-old Children [14]
Proportion of Out-of-School
12-18 year-old C
hildren [15]
Num
ber of Out-of-School
6-11 year-old Children [16]
Num
ber of Out-of-School
12-18 year-old C
hildren [17]
603 Nan 95.0 81.0 81.4 48.9 21.7 104.6 59.5 33.2 0.96 0.94 0.80 14.1 30.5 509 1,344
604 Parkou 92.2 76.5 79.5 39.3 18.8 106.2 48.1 32.6 0.90 0.87 0.81 18.5 35.2 636 1,280
605 Nambak 89.5 71.6 79.5 46.2 20.7 106.0 57.7 30.9 0.93 0.96 0.86 17.7 32.8 1,573 3,664
606 Ngoi 94.0 77.3 82.4 40.7 15.0 114.2 52.5 21.6 0.99 0.85 0.61 15.2 29.4 668 1,379
607 Pakxeng 94.1 76.6 85.0 42.7 15.7 119.0 57.2 21.7 0.93 0.87 0.66 12.9 25.1 482 1,005
608 Phonxay 93.5 67.7 85.5 41.1 16.0 114.3 53.2 21.8 0.98 0.88 0.65 12.2 26.2 717 1,344
609 Chomphet 94.2 82.8 82.1 41.4 18.5 106.9 51.7 29.9 0.96 0.92 0.77 15.6 36.8 660 1,757
610 Viengkham 95.0 80.3 87.6 47.2 21.3 118.3 59.4 29.9 0.93 0.79 0.57 9.8 23.9 471 1,252
611 Phoukhoune 96.2 75.9 86.0 53.0 21.2 112.7 71.6 28.3 0.97 0.83 0.58 10.7 21.7 409 899
612 Phonthong 82.8 60.0 75.7 31.1 8.4 104.8 41.4 12.3 0.94 0.70 0.54 23.3 36.0 785 1,031
700 Huaphanh 92.4 78.5 78.3 43.2 25.1 115.1 61.2 34.5 0.92 0.84 0.72 19.5 24.1 8,229 13,000 701 Xamneua 92.9 82.9 79.0 47.9 30.4 107.6 64.6 45.1 0.92 0.84 0.82 17.5 24.5 1,347 2,410
702 Xiengkhor 90.8 76.7 75.3 35.7 22.5 121.8 56.2 28.2 0.89 0.75 0.80 23.8 26.4 798 1,225
703 Huim 96.9 81.3 85.4 60.6 32.3 112.2 77.9 39.6 1.02 0.98 0.89 12.3 17.5 218 383
704 Viengxay 96.4 88.2 80.5 54.9 36.6 113.5 72.0 48.9 0.94 0.91 0.74 15.6 19.7 573 1,176
705 Huameuang 94.8 79.5 83.5 35.4 17.0 124.3 48.8 24.4 0.93 0.91 0.71 15.5 28.0 821 1,737
706 Xamtay 94.4 78.1 81.3 40.1 22.1 124.9 61.2 30.9 0.98 0.82 0.55 17.7 19.8 1,081 1,475
707 Sopbao 87.8 76.9 75.6 44.4 27.3 108.6 63.8 35.8 0.83 0.84 0.63 22.8 27.0 767 1,246
708 Add 88.0 73.9 75.7 39.7 21.8 117.7 60.2 29.6 0.86 0.77 0.75 21.8 24.4 833 1,246
709 Kuane 89.1 64.5 75.1 35.0 13.8 112.8 53.4 20.3 0.91 0.73 0.57 23.5 26.8 1,076 1,264
710 Sone 92.2 71.0 68.3 44.1 24.4 99.5 60.4 30.8 0.95 0.87 0.78 27.4 26.0 715 838
800 Xayaboury 97.8 92.9 77.4 46.7 18.0 92.0 55.3 30.4 0.95 0.97 0.91 16.5 40.8 6,961 20,179 801 Xayabury 98.0 94.4 75.2 45.8 23.1 89.1 54.3 38.8 0.94 0.92 0.95 19.0 40.9 1,572 4,058
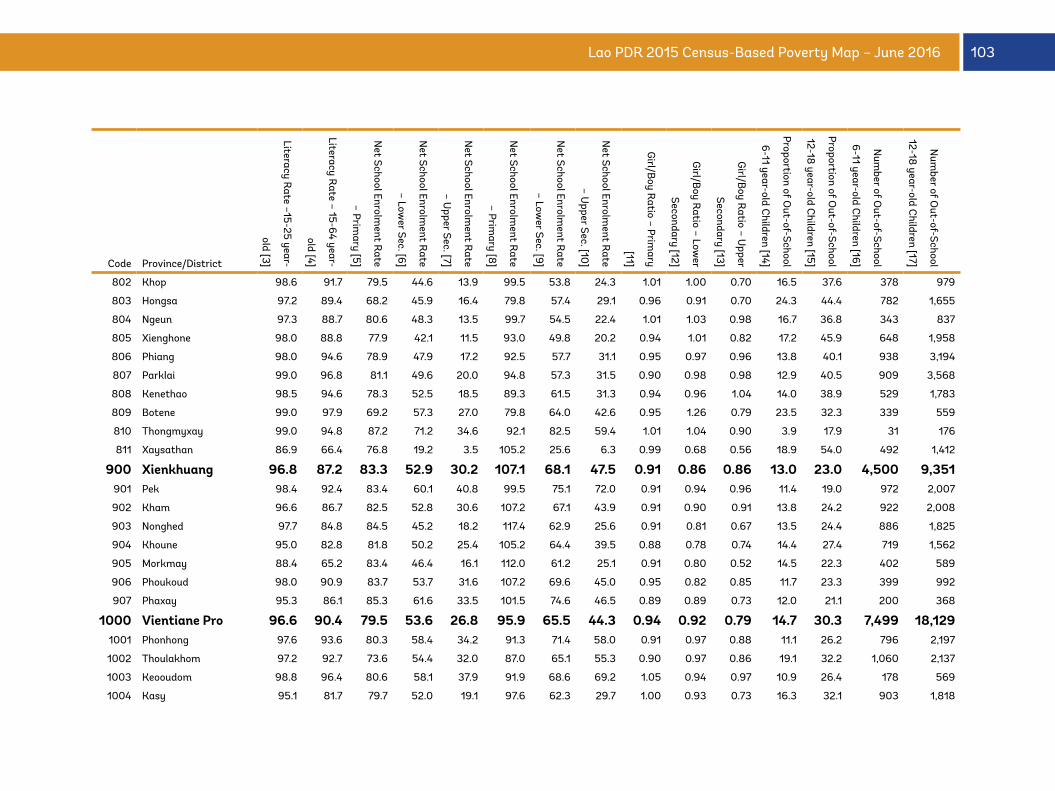
103Lao PDR 2015 Census-Based Poverty Map – June 2016
Code Province/District
Literacy Rate –15-25 year-
old [3]
Literacy Rate – 15-64 year-
old [4]
Net School Enrolm
ent Rate
– Primary [5]
Net School Enrolm
ent Rate
– Lower Sec. [6]
Net School Enrolm
ent Rate
– Upper Sec. [7]
Net School Enrolm
ent Rate
– Primary [8]
Net School Enrolm
ent Rate
– Lower Sec. [9]
Net School Enrolm
ent Rate
– Upper Sec. [10
]
Girl/B
oy Ratio – Prim
ary
[11]
Girl/B
oy Ratio – Low
er
Secondary [12]
Girl/B
oy Ratio – U
pper
Secondary [13]
Proportion of Out-of-School
6-11 year-old Children [14]
Proportion of Out-of-School
12-18 year-old C
hildren [15]
Num
ber of Out-of-School
6-11 year-old Children [16]
Num
ber of Out-of-School
12-18 year-old C
hildren [17]
802 Khop 98.6 91.7 79.5 44.6 13.9 99.5 53.8 24.3 1.01 1.00 0.70 16.5 37.6 378 979
803 Hongsa 97.2 89.4 68.2 45.9 16.4 79.8 57.4 29.1 0.96 0.91 0.70 24.3 44.4 782 1,655
804 Ngeun 97.3 88.7 80.6 48.3 13.5 99.7 54.5 22.4 1.01 1.03 0.98 16.7 36.8 343 837
805 Xienghone 98.0 88.8 77.9 42.1 11.5 93.0 49.8 20.2 0.94 1.01 0.82 17.2 45.9 648 1,958
806 Phiang 98.0 94.6 78.9 47.9 17.2 92.5 57.7 31.1 0.95 0.97 0.96 13.8 40.1 938 3,194
807 Parklai 99.0 96.8 81.1 49.6 20.0 94.8 57.3 31.5 0.90 0.98 0.98 12.9 40.5 909 3,568
808 Kenethao 98.5 94.6 78.3 52.5 18.5 89.3 61.5 31.3 0.94 0.96 1.04 14.0 38.9 529 1,783
809 Botene 99.0 97.9 69.2 57.3 27.0 79.8 64.0 42.6 0.95 1.26 0.79 23.5 32.3 339 559
810 Thongmyxay 99.0 94.8 87.2 71.2 34.6 92.1 82.5 59.4 1.01 1.04 0.90 3.9 17.9 31 176
811 Xaysathan 86.9 66.4 76.8 19.2 3.5 105.2 25.6 6.3 0.99 0.68 0.56 18.9 54.0 492 1,412
900 Xienkhuang 96.8 87.2 83.3 52.9 30.2 107.1 68.1 47.5 0.91 0.86 0.86 13.0 23.0 4,500 9,351 901 Pek 98.4 92.4 83.4 60.1 40.8 99.5 75.1 72.0 0.91 0.94 0.96 11.4 19.0 972 2,007
902 Kham 96.6 86.7 82.5 52.8 30.6 107.2 67.1 43.9 0.91 0.90 0.91 13.8 24.2 922 2,008
903 Nonghed 97.7 84.8 84.5 45.2 18.2 117.4 62.9 25.6 0.91 0.81 0.67 13.5 24.4 886 1,825
904 Khoune 95.0 82.8 81.8 50.2 25.4 105.2 64.4 39.5 0.88 0.78 0.74 14.4 27.4 719 1,562
905 Morkmay 88.4 65.2 83.4 46.4 16.1 112.0 61.2 25.1 0.91 0.80 0.52 14.5 22.3 402 589
906 Phoukoud 98.0 90.9 83.7 53.7 31.6 107.2 69.6 45.0 0.95 0.82 0.85 11.7 23.3 399 992
907 Phaxay 95.3 86.1 85.3 61.6 33.5 101.5 74.6 46.5 0.89 0.89 0.73 12.0 21.1 200 368
1000 Vientiane Pro 96.6 90.4 79.5 53.6 26.8 95.9 65.5 44.3 0.94 0.92 0.79 14.7 30.3 7,499 18,129 1001 Phonhong 97.6 93.6 80.3 58.4 34.2 91.3 71.4 58.0 0.91 0.97 0.88 11.1 26.2 796 2,197
1002 Thoulakhom 97.2 92.7 73.6 54.4 32.0 87.0 65.1 55.3 0.90 0.97 0.86 19.1 32.2 1,060 2,137
1003 Keooudom 98.8 96.4 80.6 58.1 37.9 91.9 68.6 69.2 1.05 0.94 0.97 10.9 26.4 178 569
1004 Kasy 95.1 81.7 79.7 52.0 19.1 97.6 62.3 29.7 1.00 0.93 0.73 16.3 32.1 903 1,818
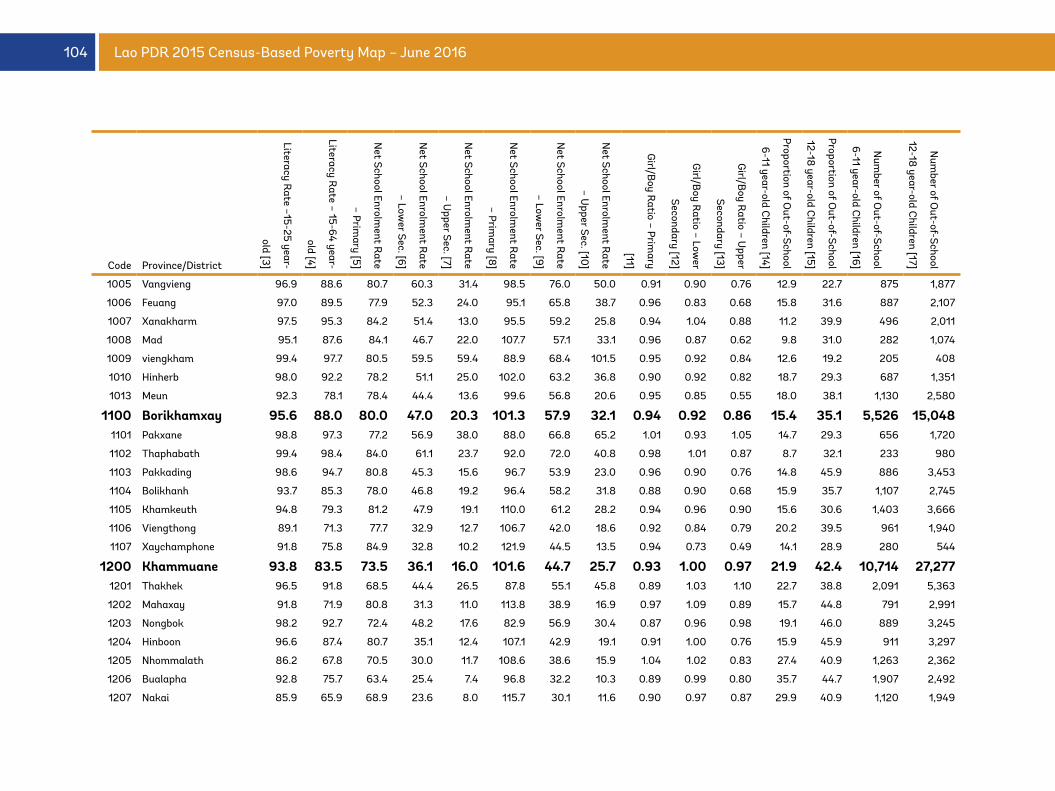
104 Lao PDR 2015 Census-Based Poverty Map – June 2016
Code Province/District
Literacy Rate –15-25 year-
old [3]
Literacy Rate – 15-64 year-
old [4]
Net School Enrolm
ent Rate
– Primary [5]
Net School Enrolm
ent Rate
– Lower Sec. [6]
Net School Enrolm
ent Rate
– Upper Sec. [7]
Net School Enrolm
ent Rate
– Primary [8]
Net School Enrolm
ent Rate
– Lower Sec. [9]
Net School Enrolm
ent Rate
– Upper Sec. [10
]
Girl/B
oy Ratio – Prim
ary
[11]
Girl/B
oy Ratio – Low
er
Secondary [12]
Girl/B
oy Ratio – U
pper
Secondary [13]
Proportion of Out-of-School
6-11 year-old Children [14]
Proportion of Out-of-School
12-18 year-old C
hildren [15]
Num
ber of Out-of-School
6-11 year-old Children [16]
Num
ber of Out-of-School
12-18 year-old C
hildren [17]
1005 Vangvieng 96.9 88.6 80.7 60.3 31.4 98.5 76.0 50.0 0.91 0.90 0.76 12.9 22.7 875 1,877
1006 Feuang 97.0 89.5 77.9 52.3 24.0 95.1 65.8 38.7 0.96 0.83 0.68 15.8 31.6 887 2,107
1007 Xanakharm 97.5 95.3 84.2 51.4 13.0 95.5 59.2 25.8 0.94 1.04 0.88 11.2 39.9 496 2,011
1008 Mad 95.1 87.6 84.1 46.7 22.0 107.7 57.1 33.1 0.96 0.87 0.62 9.8 31.0 282 1,074
1009 viengkham 99.4 97.7 80.5 59.5 59.4 88.9 68.4 101.5 0.95 0.92 0.84 12.6 19.2 205 408
1010 Hinherb 98.0 92.2 78.2 51.1 25.0 102.0 63.2 36.8 0.90 0.92 0.82 18.7 29.3 687 1,351
1013 Meun 92.3 78.1 78.4 44.4 13.6 99.6 56.8 20.6 0.95 0.85 0.55 18.0 38.1 1,130 2,580
1100 Borikhamxay 95.6 88.0 80.0 47.0 20.3 101.3 57.9 32.1 0.94 0.92 0.86 15.4 35.1 5,526 15,048 1101 Pakxane 98.8 97.3 77.2 56.9 38.0 88.0 66.8 65.2 1.01 0.93 1.05 14.7 29.3 656 1,720
1102 Thaphabath 99.4 98.4 84.0 61.1 23.7 92.0 72.0 40.8 0.98 1.01 0.87 8.7 32.1 233 980
1103 Pakkading 98.6 94.7 80.8 45.3 15.6 96.7 53.9 23.0 0.96 0.90 0.76 14.8 45.9 886 3,453
1104 Bolikhanh 93.7 85.3 78.0 46.8 19.2 96.4 58.2 31.8 0.88 0.90 0.68 15.9 35.7 1,107 2,745
1105 Khamkeuth 94.8 79.3 81.2 47.9 19.1 110.0 61.2 28.2 0.94 0.96 0.90 15.6 30.6 1,403 3,666
1106 Viengthong 89.1 71.3 77.7 32.9 12.7 106.7 42.0 18.6 0.92 0.84 0.79 20.2 39.5 961 1,940
1107 Xaychamphone 91.8 75.8 84.9 32.8 10.2 121.9 44.5 13.5 0.94 0.73 0.49 14.1 28.9 280 544
1200 Khammuane 93.8 83.5 73.5 36.1 16.0 101.6 44.7 25.7 0.93 1.00 0.97 21.9 42.4 10,714 27,277 1201 Thakhek 96.5 91.8 68.5 44.4 26.5 87.8 55.1 45.8 0.89 1.03 1.10 22.7 38.8 2,091 5,363
1202 Mahaxay 91.8 71.9 80.8 31.3 11.0 113.8 38.9 16.9 0.97 1.09 0.89 15.7 44.8 791 2,991
1203 Nongbok 98.2 92.7 72.4 48.2 17.6 82.9 56.9 30.4 0.87 0.96 0.98 19.1 46.0 889 3,245
1204 Hinboon 96.6 87.4 80.7 35.1 12.4 107.1 42.9 19.1 0.91 1.00 0.76 15.9 45.9 911 3,297
1205 Nhommalath 86.2 67.8 70.5 30.0 11.7 108.6 38.6 15.9 1.04 1.02 0.83 27.4 40.9 1,263 2,362
1206 Bualapha 92.8 75.7 63.4 25.4 7.4 96.8 32.2 10.3 0.89 0.99 0.80 35.7 44.7 1,907 2,492
1207 Nakai 85.9 65.9 68.9 23.6 8.0 115.7 30.1 11.6 0.90 0.97 0.87 29.9 40.9 1,120 1,949
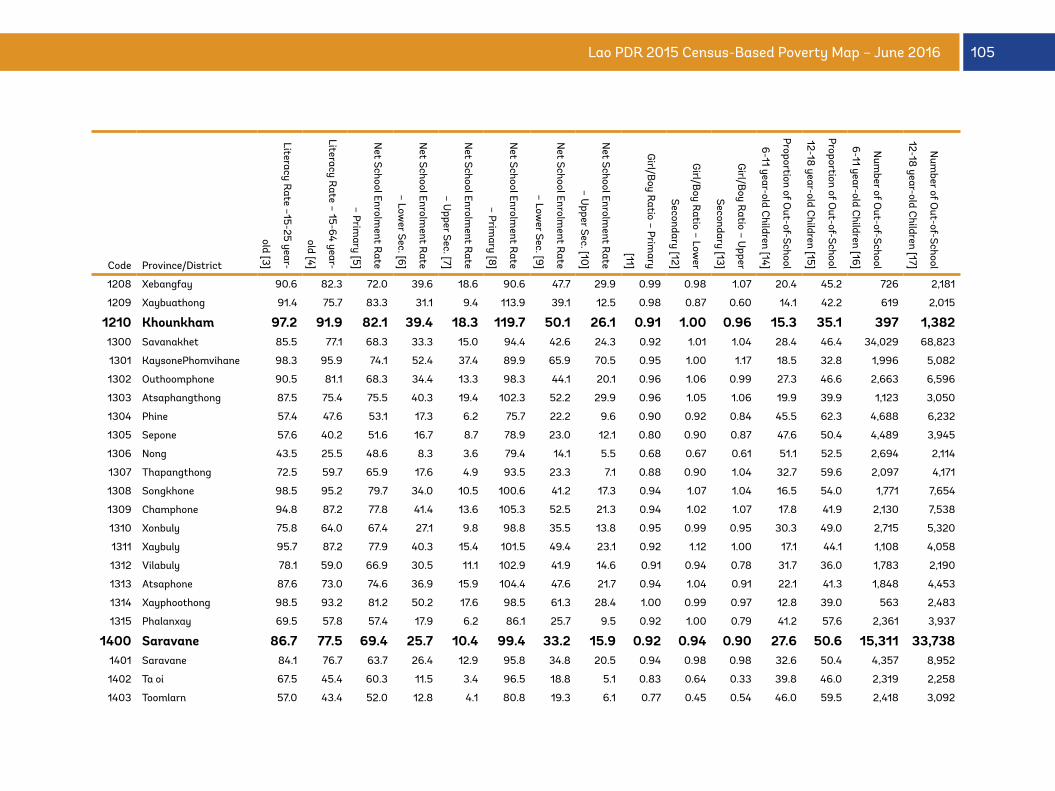
105Lao PDR 2015 Census-Based Poverty Map – June 2016
Code Province/District
Literacy Rate –15-25 year-
old [3]
Literacy Rate – 15-64 year-
old [4]
Net School Enrolm
ent Rate
– Primary [5]
Net School Enrolm
ent Rate
– Lower Sec. [6]
Net School Enrolm
ent Rate
– Upper Sec. [7]
Net School Enrolm
ent Rate
– Primary [8]
Net School Enrolm
ent Rate
– Lower Sec. [9]
Net School Enrolm
ent Rate
– Upper Sec. [10
]
Girl/B
oy Ratio – Prim
ary
[11]
Girl/B
oy Ratio – Low
er
Secondary [12]
Girl/B
oy Ratio – U
pper
Secondary [13]
Proportion of Out-of-School
6-11 year-old Children [14]
Proportion of Out-of-School
12-18 year-old C
hildren [15]
Num
ber of Out-of-School
6-11 year-old Children [16]
Num
ber of Out-of-School
12-18 year-old C
hildren [17]
1208 Xebangfay 90.6 82.3 72.0 39.6 18.6 90.6 47.7 29.9 0.99 0.98 1.07 20.4 45.2 726 2,181
1209 Xaybuathong 91.4 75.7 83.3 31.1 9.4 113.9 39.1 12.5 0.98 0.87 0.60 14.1 42.2 619 2,015
1210 Khounkham 97.2 91.9 82.1 39.4 18.3 119.7 50.1 26.1 0.91 1.00 0.96 15.3 35.1 397 1,382 1300 Savanakhet 85.5 77.1 68.3 33.3 15.0 94.4 42.6 24.3 0.92 1.01 1.04 28.4 46.4 34,029 68,823
1301 KaysonePhomvihane 98.3 95.9 74.1 52.4 37.4 89.9 65.9 70.5 0.95 1.00 1.17 18.5 32.8 1,996 5,082
1302 Outhoomphone 90.5 81.1 68.3 34.4 13.3 98.3 44.1 20.1 0.96 1.06 0.99 27.3 46.6 2,663 6,596
1303 Atsaphangthong 87.5 75.4 75.5 40.3 19.4 102.3 52.2 29.9 0.96 1.05 1.06 19.9 39.9 1,123 3,050
1304 Phine 57.4 47.6 53.1 17.3 6.2 75.7 22.2 9.6 0.90 0.92 0.84 45.5 62.3 4,688 6,232
1305 Sepone 57.6 40.2 51.6 16.7 8.7 78.9 23.0 12.1 0.80 0.90 0.87 47.6 50.4 4,489 3,945
1306 Nong 43.5 25.5 48.6 8.3 3.6 79.4 14.1 5.5 0.68 0.67 0.61 51.1 52.5 2,694 2,114
1307 Thapangthong 72.5 59.7 65.9 17.6 4.9 93.5 23.3 7.1 0.88 0.90 1.04 32.7 59.6 2,097 4,171
1308 Songkhone 98.5 95.2 79.7 34.0 10.5 100.6 41.2 17.3 0.94 1.07 1.04 16.5 54.0 1,771 7,654
1309 Champhone 94.8 87.2 77.8 41.4 13.6 105.3 52.5 21.3 0.94 1.02 1.07 17.8 41.9 2,130 7,538
1310 Xonbuly 75.8 64.0 67.4 27.1 9.8 98.8 35.5 13.8 0.95 0.99 0.95 30.3 49.0 2,715 5,320
1311 Xaybuly 95.7 87.2 77.9 40.3 15.4 101.5 49.4 23.1 0.92 1.12 1.00 17.1 44.1 1,108 4,058
1312 Vilabuly 78.1 59.0 66.9 30.5 11.1 102.9 41.9 14.6 0.91 0.94 0.78 31.7 36.0 1,783 2,190
1313 Atsaphone 87.6 73.0 74.6 36.9 15.9 104.4 47.6 21.7 0.94 1.04 0.91 22.1 41.3 1,848 4,453
1314 Xayphoothong 98.5 93.2 81.2 50.2 17.6 98.5 61.3 28.4 1.00 0.99 0.97 12.8 39.0 563 2,483
1315 Phalanxay 69.5 57.8 57.4 17.9 6.2 86.1 25.7 9.5 0.92 1.00 0.79 41.2 57.6 2,361 3,937
1400 Saravane 86.7 77.5 69.4 25.7 10.4 99.4 33.2 15.9 0.92 0.94 0.90 27.6 50.6 15,311 33,738 1401 Saravane 84.1 76.7 63.7 26.4 12.9 95.8 34.8 20.5 0.94 0.98 0.98 32.6 50.4 4,357 8,952
1402 Ta oi 67.5 45.4 60.3 11.5 3.4 96.5 18.8 5.1 0.83 0.64 0.33 39.8 46.0 2,319 2,258
1403 Toomlarn 57.0 43.4 52.0 12.8 4.1 80.8 19.3 6.1 0.77 0.45 0.54 46.0 59.5 2,418 3,092
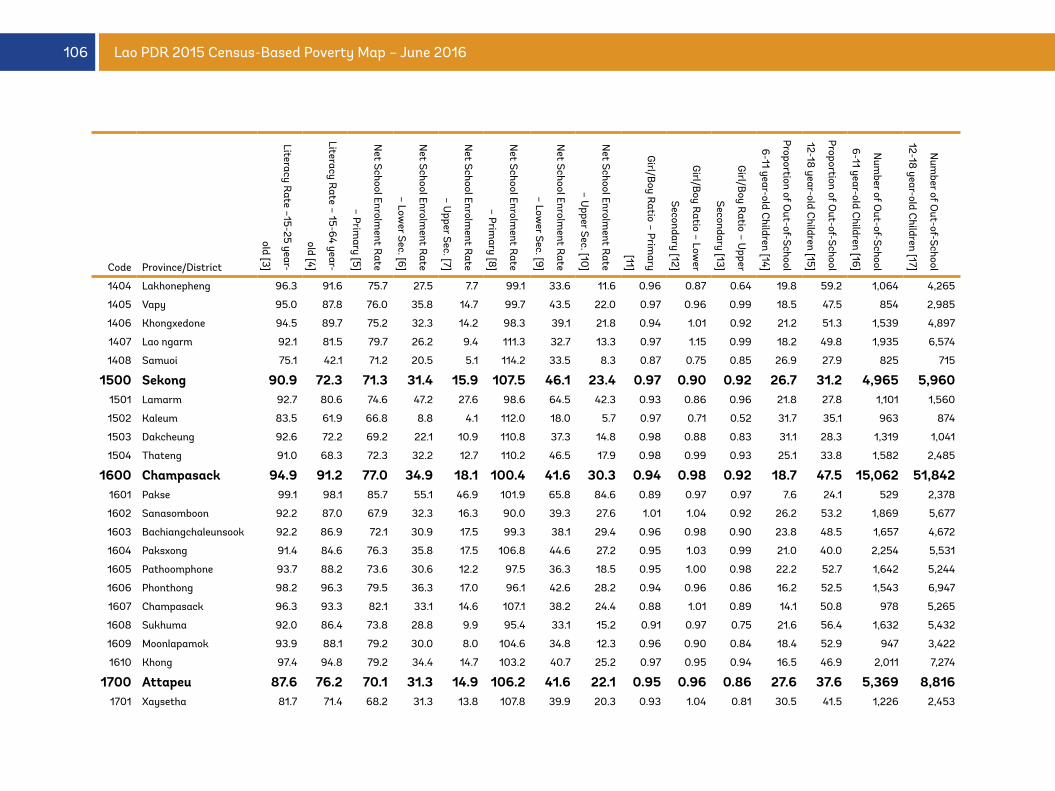
106 Lao PDR 2015 Census-Based Poverty Map – June 2016
Code Province/District
Literacy Rate –15-25 year-
old [3]
Literacy Rate – 15-64 year-
old [4]
Net School Enrolm
ent Rate
– Primary [5]
Net School Enrolm
ent Rate
– Lower Sec. [6]
Net School Enrolm
ent Rate
– Upper Sec. [7]
Net School Enrolm
ent Rate
– Primary [8]
Net School Enrolm
ent Rate
– Lower Sec. [9]
Net School Enrolm
ent Rate
– Upper Sec. [10
]
Girl/B
oy Ratio – Prim
ary
[11]
Girl/B
oy Ratio – Low
er
Secondary [12]
Girl/B
oy Ratio – U
pper
Secondary [13]
Proportion of Out-of-School
6-11 year-old Children [14]
Proportion of Out-of-School
12-18 year-old C
hildren [15]
Num
ber of Out-of-School
6-11 year-old Children [16]
Num
ber of Out-of-School
12-18 year-old C
hildren [17]
1404 Lakhonepheng 96.3 91.6 75.7 27.5 7.7 99.1 33.6 11.6 0.96 0.87 0.64 19.8 59.2 1,064 4,265
1405 Vapy 95.0 87.8 76.0 35.8 14.7 99.7 43.5 22.0 0.97 0.96 0.99 18.5 47.5 854 2,985
1406 Khongxedone 94.5 89.7 75.2 32.3 14.2 98.3 39.1 21.8 0.94 1.01 0.92 21.2 51.3 1,539 4,897
1407 Lao ngarm 92.1 81.5 79.7 26.2 9.4 111.3 32.7 13.3 0.97 1.15 0.99 18.2 49.8 1,935 6,574
1408 Samuoi 75.1 42.1 71.2 20.5 5.1 114.2 33.5 8.3 0.87 0.75 0.85 26.9 27.9 825 715
1500 Sekong 90.9 72.3 71.3 31.4 15.9 107.5 46.1 23.4 0.97 0.90 0.92 26.7 31.2 4,965 5,960 1501 Lamarm 92.7 80.6 74.6 47.2 27.6 98.6 64.5 42.3 0.93 0.86 0.96 21.8 27.8 1,101 1,560
1502 Kaleum 83.5 61.9 66.8 8.8 4.1 112.0 18.0 5.7 0.97 0.71 0.52 31.7 35.1 963 874
1503 Dakcheung 92.6 72.2 69.2 22.1 10.9 110.8 37.3 14.8 0.98 0.88 0.83 31.1 28.3 1,319 1,041
1504 Thateng 91.0 68.3 72.3 32.2 12.7 110.2 46.5 17.9 0.98 0.99 0.93 25.1 33.8 1,582 2,485
1600 Champasack 94.9 91.2 77.0 34.9 18.1 100.4 41.6 30.3 0.94 0.98 0.92 18.7 47.5 15,062 51,842 1601 Pakse 99.1 98.1 85.7 55.1 46.9 101.9 65.8 84.6 0.89 0.97 0.97 7.6 24.1 529 2,378
1602 Sanasomboon 92.2 87.0 67.9 32.3 16.3 90.0 39.3 27.6 1.01 1.04 0.92 26.2 53.2 1,869 5,677
1603 Bachiangchaleunsook 92.2 86.9 72.1 30.9 17.5 99.3 38.1 29.4 0.96 0.98 0.90 23.8 48.5 1,657 4,672
1604 Paksxong 91.4 84.6 76.3 35.8 17.5 106.8 44.6 27.2 0.95 1.03 0.99 21.0 40.0 2,254 5,531
1605 Pathoomphone 93.7 88.2 73.6 30.6 12.2 97.5 36.3 18.5 0.95 1.00 0.98 22.2 52.7 1,642 5,244
1606 Phonthong 98.2 96.3 79.5 36.3 17.0 96.1 42.6 28.2 0.94 0.96 0.86 16.2 52.5 1,543 6,947
1607 Champasack 96.3 93.3 82.1 33.1 14.6 107.1 38.2 24.4 0.88 1.01 0.89 14.1 50.8 978 5,265
1608 Sukhuma 92.0 86.4 73.8 28.8 9.9 95.4 33.1 15.2 0.91 0.97 0.75 21.6 56.4 1,632 5,432
1609 Moonlapamok 93.9 88.1 79.2 30.0 8.0 104.6 34.8 12.3 0.96 0.90 0.84 18.4 52.9 947 3,422
1610 Khong 97.4 94.8 79.2 34.4 14.7 103.2 40.7 25.2 0.97 0.95 0.94 16.5 46.9 2,011 7,274
1700 Attapeu 87.6 76.2 70.1 31.3 14.9 106.2 41.6 22.1 0.95 0.96 0.86 27.6 37.6 5,369 8,816 1701 Xaysetha 81.7 71.4 68.2 31.3 13.8 107.8 39.9 20.3 0.93 1.04 0.81 30.5 41.5 1,226 2,453
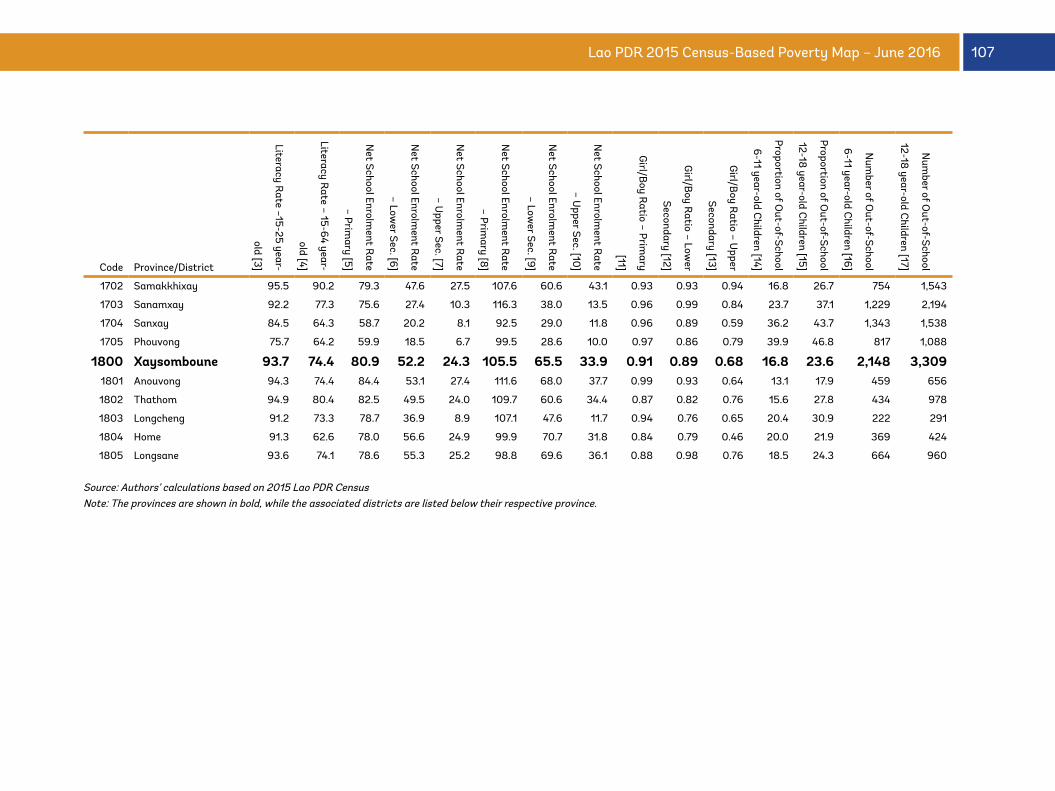
107Lao PDR 2015 Census-Based Poverty Map – June 2016
Code Province/District
Literacy Rate –15-25 year-
old [3]
Literacy Rate – 15-64 year-
old [4]
Net School Enrolm
ent Rate
– Primary [5]
Net School Enrolm
ent Rate
– Lower Sec. [6]
Net School Enrolm
ent Rate
– Upper Sec. [7]
Net School Enrolm
ent Rate
– Primary [8]
Net School Enrolm
ent Rate
– Lower Sec. [9]
Net School Enrolm
ent Rate
– Upper Sec. [10
]
Girl/B
oy Ratio – Prim
ary
[11]
Girl/B
oy Ratio – Low
er
Secondary [12]
Girl/B
oy Ratio – U
pper
Secondary [13]
Proportion of Out-of-School
6-11 year-old Children [14]
Proportion of Out-of-School
12-18 year-old C
hildren [15]
Num
ber of Out-of-School
6-11 year-old Children [16]
Num
ber of Out-of-School
12-18 year-old C
hildren [17]
1702 Samakkhixay 95.5 90.2 79.3 47.6 27.5 107.6 60.6 43.1 0.93 0.93 0.94 16.8 26.7 754 1,543
1703 Sanamxay 92.2 77.3 75.6 27.4 10.3 116.3 38.0 13.5 0.96 0.99 0.84 23.7 37.1 1,229 2,194
1704 Sanxay 84.5 64.3 58.7 20.2 8.1 92.5 29.0 11.8 0.96 0.89 0.59 36.2 43.7 1,343 1,538
1705 Phouvong 75.7 64.2 59.9 18.5 6.7 99.5 28.6 10.0 0.97 0.86 0.79 39.9 46.8 817 1,088
1800 Xaysomboune 93.7 74.4 80.9 52.2 24.3 105.5 65.5 33.9 0.91 0.89 0.68 16.8 23.6 2,148 3,309 1801 Anouvong 94.3 74.4 84.4 53.1 27.4 111.6 68.0 37.7 0.99 0.93 0.64 13.1 17.9 459 656
1802 Thathom 94.9 80.4 82.5 49.5 24.0 109.7 60.6 34.4 0.87 0.82 0.76 15.6 27.8 434 978
1803 Longcheng 91.2 73.3 78.7 36.9 8.9 107.1 47.6 11.7 0.94 0.76 0.65 20.4 30.9 222 291
1804 Home 91.3 62.6 78.0 56.6 24.9 99.9 70.7 31.8 0.84 0.79 0.46 20.0 21.9 369 424
1805 Longsane 93.6 74.1 78.6 55.3 25.2 98.8 69.6 36.1 0.88 0.98 0.76 18.5 24.3 664 960
Source: Authors’ calculations based on 2015 Lao PDR CensusNote: The provinces are shown in bold, while the associated districts are listed below their respective province.
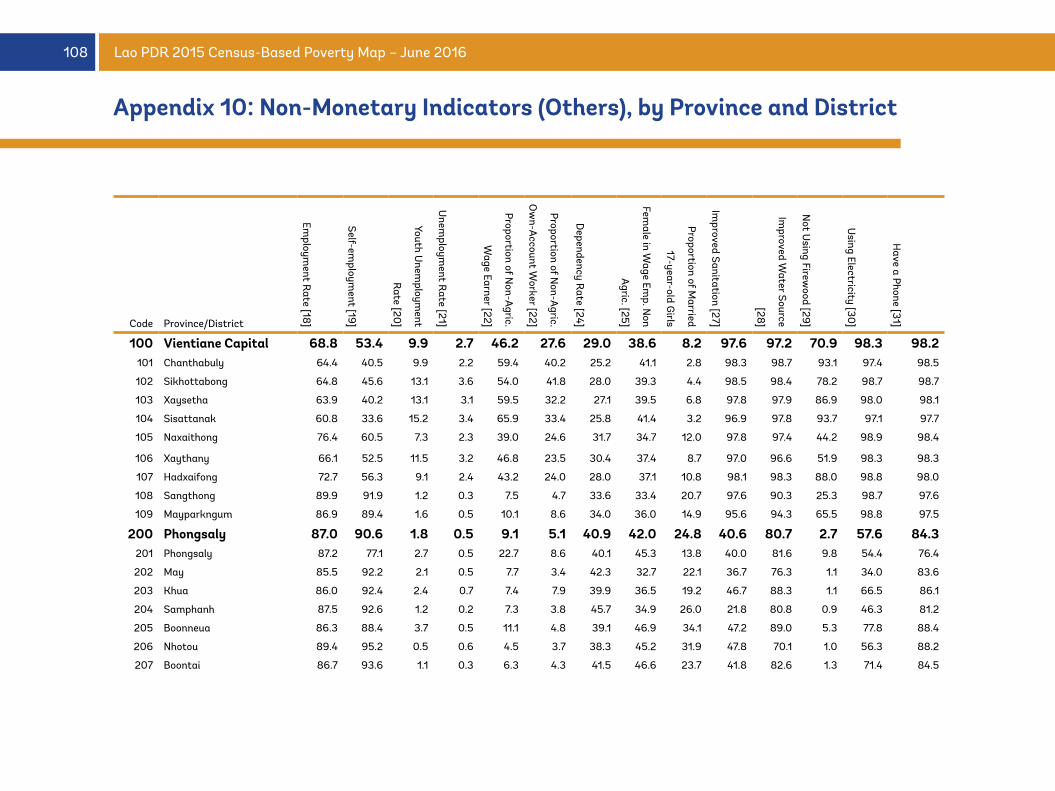
108 Lao PDR 2015 Census-Based Poverty Map – June 2016
Code Province/District
Employm
ent Rate [18]
Self-employm
ent [19]
Youth Unem
ployment
Rate [20
]
Unem
ployment R
ate [21]
Proportion of Non-A
gric.
Wage Earner [22]
Proportion of Non-A
gric.
Ow
n-Account W
orker [22]
Dependency R
ate [24]
Female in W
age Emp. N
on
Agric. [25]
Proportion of Married
17-year-old Girls
Improved Sanitation [27]
Improved W
ater Source
[28]
Not U
sing Firewood [29]
Using Electricity [30
]
Have a Phone [31]
100 Vientiane Capital 68.8 53.4 9.9 2.7 46.2 27.6 29.0 38.6 8.2 97.6 97.2 70.9 98.3 98.2101 Chanthabuly 64.4 40.5 9.9 2.2 59.4 40.2 25.2 41.1 2.8 98.3 98.7 93.1 97.4 98.5
102 Sikhottabong 64.8 45.6 13.1 3.6 54.0 41.8 28.0 39.3 4.4 98.5 98.4 78.2 98.7 98.7
103 Xaysetha 63.9 40.2 13.1 3.1 59.5 32.2 27.1 39.5 6.8 97.8 97.9 86.9 98.0 98.1
104 Sisattanak 60.8 33.6 15.2 3.4 65.9 33.4 25.8 41.4 3.2 96.9 97.8 93.7 97.1 97.7
105 Naxaithong 76.4 60.5 7.3 2.3 39.0 24.6 31.7 34.7 12.0 97.8 97.4 44.2 98.9 98.4
106 Xaythany 66.1 52.5 11.5 3.2 46.8 23.5 30.4 37.4 8.7 97.0 96.6 51.9 98.3 98.3
107 Hadxaifong 72.7 56.3 9.1 2.4 43.2 24.0 28.0 37.1 10.8 98.1 98.3 88.0 98.8 98.0
108 Sangthong 89.9 91.9 1.2 0.3 7.5 4.7 33.6 33.4 20.7 97.6 90.3 25.3 98.7 97.6
109 Mayparkngum 86.9 89.4 1.6 0.5 10.1 8.6 34.0 36.0 14.9 95.6 94.3 65.5 98.8 97.5
200 Phongsaly 87.0 90.6 1.8 0.5 9.1 5.1 40.9 42.0 24.8 40.6 80.7 2.7 57.6 84.3201 Phongsaly 87.2 77.1 2.7 0.5 22.7 8.6 40.1 45.3 13.8 40.0 81.6 9.8 54.4 76.4
202 May 85.5 92.2 2.1 0.5 7.7 3.4 42.3 32.7 22.1 36.7 76.3 1.1 34.0 83.6
203 Khua 86.0 92.4 2.4 0.7 7.4 7.9 39.9 36.5 19.2 46.7 88.3 1.1 66.5 86.1
204 Samphanh 87.5 92.6 1.2 0.2 7.3 3.8 45.7 34.9 26.0 21.8 80.8 0.9 46.3 81.2
205 Boonneua 86.3 88.4 3.7 0.5 11.1 4.8 39.1 46.9 34.1 47.2 89.0 5.3 77.8 88.4
206 Nhotou 89.4 95.2 0.5 0.6 4.5 3.7 38.3 45.2 31.9 47.8 70.1 1.0 56.3 88.2
207 Boontai 86.7 93.6 1.1 0.3 6.3 4.3 41.5 46.6 23.7 41.8 82.6 1.3 71.4 84.5
Appendix 10: Non-Monetary Indicators (Others), by Province and District
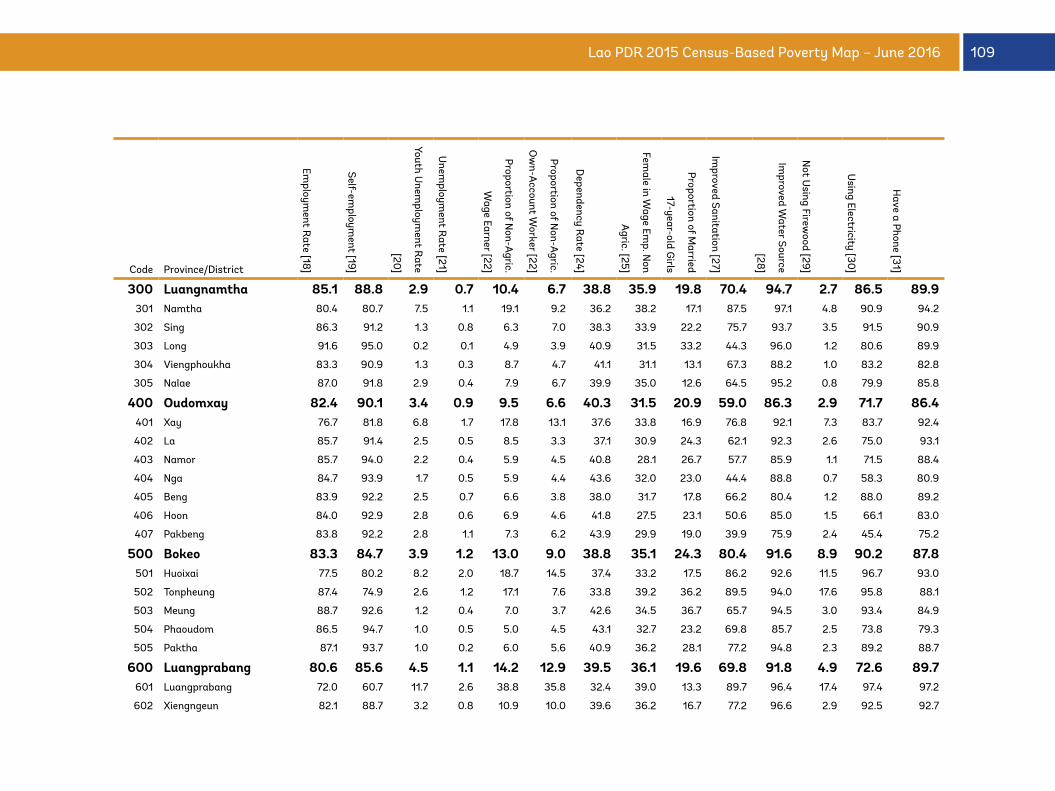
109Lao PDR 2015 Census-Based Poverty Map – June 2016
Code Province/District
Employm
ent Rate [18]
Self-employm
ent [19]
Youth Unem
ployment R
ate
[20]
Unem
ployment R
ate [21]
Proportion of Non-A
gric.
Wage Earner [22]
Proportion of Non-A
gric.
Ow
n-Account W
orker [22]
Dependency R
ate [24]
Female in W
age Emp. N
on
Agric. [25]
Proportion of Married
17-year-old Girls
Improved Sanitation [27]
Improved W
ater Source
[28]
Not U
sing Firewood [29]
Using Electricity [30
]
Have a Phone [31]
300 Luangnamtha 85.1 88.8 2.9 0.7 10.4 6.7 38.8 35.9 19.8 70.4 94.7 2.7 86.5 89.9301 Namtha 80.4 80.7 7.5 1.1 19.1 9.2 36.2 38.2 17.1 87.5 97.1 4.8 90.9 94.2
302 Sing 86.3 91.2 1.3 0.8 6.3 7.0 38.3 33.9 22.2 75.7 93.7 3.5 91.5 90.9
303 Long 91.6 95.0 0.2 0.1 4.9 3.9 40.9 31.5 33.2 44.3 96.0 1.2 80.6 89.9
304 Viengphoukha 83.3 90.9 1.3 0.3 8.7 4.7 41.1 31.1 13.1 67.3 88.2 1.0 83.2 82.8
305 Nalae 87.0 91.8 2.9 0.4 7.9 6.7 39.9 35.0 12.6 64.5 95.2 0.8 79.9 85.8
400 Oudomxay 82.4 90.1 3.4 0.9 9.5 6.6 40.3 31.5 20.9 59.0 86.3 2.9 71.7 86.4401 Xay 76.7 81.8 6.8 1.7 17.8 13.1 37.6 33.8 16.9 76.8 92.1 7.3 83.7 92.4
402 La 85.7 91.4 2.5 0.5 8.5 3.3 37.1 30.9 24.3 62.1 92.3 2.6 75.0 93.1
403 Namor 85.7 94.0 2.2 0.4 5.9 4.5 40.8 28.1 26.7 57.7 85.9 1.1 71.5 88.4
404 Nga 84.7 93.9 1.7 0.5 5.9 4.4 43.6 32.0 23.0 44.4 88.8 0.7 58.3 80.9
405 Beng 83.9 92.2 2.5 0.7 6.6 3.8 38.0 31.7 17.8 66.2 80.4 1.2 88.0 89.2
406 Hoon 84.0 92.9 2.8 0.6 6.9 4.6 41.8 27.5 23.1 50.6 85.0 1.5 66.1 83.0
407 Pakbeng 83.8 92.2 2.8 1.1 7.3 6.2 43.9 29.9 19.0 39.9 75.9 2.4 45.4 75.2
500 Bokeo 83.3 84.7 3.9 1.2 13.0 9.0 38.8 35.1 24.3 80.4 91.6 8.9 90.2 87.8501 Huoixai 77.5 80.2 8.2 2.0 18.7 14.5 37.4 33.2 17.5 86.2 92.6 11.5 96.7 93.0
502 Tonpheung 87.4 74.9 2.6 1.2 17.1 7.6 33.8 39.2 36.2 89.5 94.0 17.6 95.8 88.1
503 Meung 88.7 92.6 1.2 0.4 7.0 3.7 42.6 34.5 36.7 65.7 94.5 3.0 93.4 84.9
504 Phaoudom 86.5 94.7 1.0 0.5 5.0 4.5 43.1 32.7 23.2 69.8 85.7 2.5 73.8 79.3
505 Paktha 87.1 93.7 1.0 0.2 6.0 5.6 40.9 36.2 28.1 77.2 94.8 2.3 89.2 88.7
600 Luangprabang 80.6 85.6 4.5 1.1 14.2 12.9 39.5 36.1 19.6 69.8 91.8 4.9 72.6 89.7601 Luangprabang 72.0 60.7 11.7 2.6 38.8 35.8 32.4 39.0 13.3 89.7 96.4 17.4 97.4 97.2
602 Xiengngeun 82.1 88.7 3.2 0.8 10.9 10.0 39.6 36.2 16.7 77.2 96.6 2.9 92.5 92.7
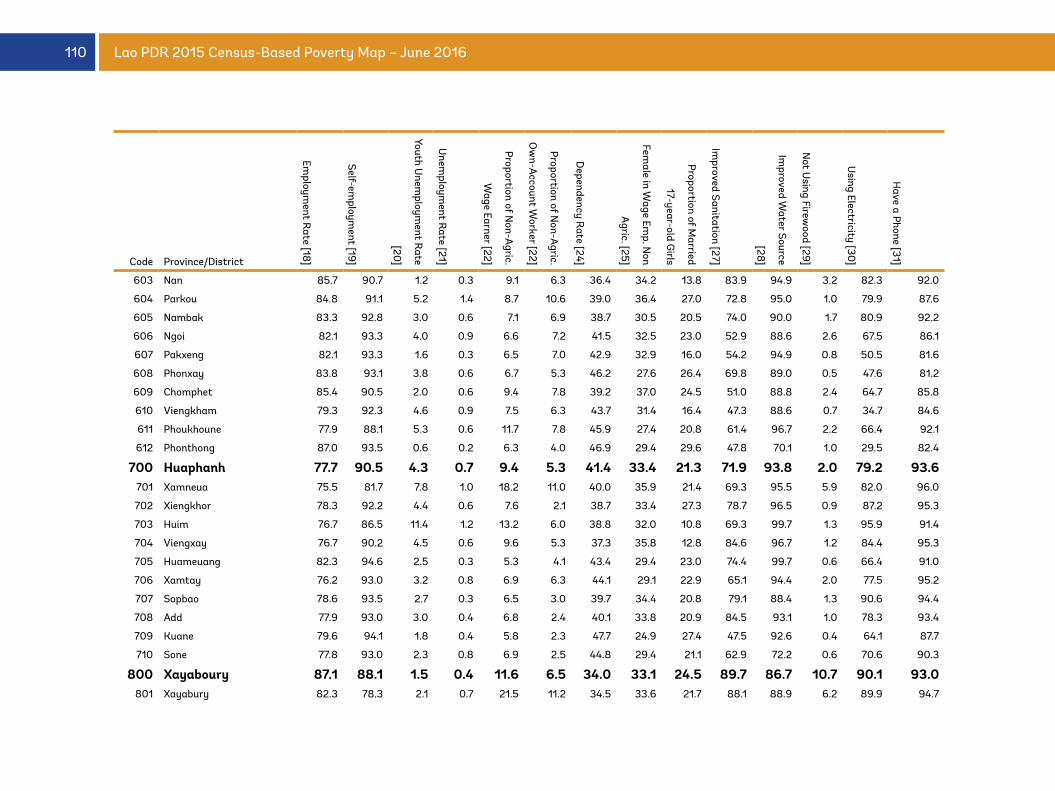
110 Lao PDR 2015 Census-Based Poverty Map – June 2016
Code Province/District
Employm
ent Rate [18]
Self-employm
ent [19]
Youth Unem
ployment R
ate
[20]
Unem
ployment R
ate [21]
Proportion of Non-A
gric.
Wage Earner [22]
Proportion of Non-A
gric.
Ow
n-Account W
orker [22]
Dependency R
ate [24]
Female in W
age Emp. N
on
Agric. [25]
Proportion of Married
17-year-old Girls
Improved Sanitation [27]
Improved W
ater Source
[28]
Not U
sing Firewood [29]
Using Electricity [30
]
Have a Phone [31]
603 Nan 85.7 90.7 1.2 0.3 9.1 6.3 36.4 34.2 13.8 83.9 94.9 3.2 82.3 92.0
604 Parkou 84.8 91.1 5.2 1.4 8.7 10.6 39.0 36.4 27.0 72.8 95.0 1.0 79.9 87.6
605 Nambak 83.3 92.8 3.0 0.6 7.1 6.9 38.7 30.5 20.5 74.0 90.0 1.7 80.9 92.2
606 Ngoi 82.1 93.3 4.0 0.9 6.6 7.2 41.5 32.5 23.0 52.9 88.6 2.6 67.5 86.1
607 Pakxeng 82.1 93.3 1.6 0.3 6.5 7.0 42.9 32.9 16.0 54.2 94.9 0.8 50.5 81.6
608 Phonxay 83.8 93.1 3.8 0.6 6.7 5.3 46.2 27.6 26.4 69.8 89.0 0.5 47.6 81.2
609 Chomphet 85.4 90.5 2.0 0.6 9.4 7.8 39.2 37.0 24.5 51.0 88.8 2.4 64.7 85.8
610 Viengkham 79.3 92.3 4.6 0.9 7.5 6.3 43.7 31.4 16.4 47.3 88.6 0.7 34.7 84.6
611 Phoukhoune 77.9 88.1 5.3 0.6 11.7 7.8 45.9 27.4 20.8 61.4 96.7 2.2 66.4 92.1
612 Phonthong 87.0 93.5 0.6 0.2 6.3 4.0 46.9 29.4 29.6 47.8 70.1 1.0 29.5 82.4
700 Huaphanh 77.7 90.5 4.3 0.7 9.4 5.3 41.4 33.4 21.3 71.9 93.8 2.0 79.2 93.6701 Xamneua 75.5 81.7 7.8 1.0 18.2 11.0 40.0 35.9 21.4 69.3 95.5 5.9 82.0 96.0
702 Xiengkhor 78.3 92.2 4.4 0.6 7.6 2.1 38.7 33.4 27.3 78.7 96.5 0.9 87.2 95.3
703 Huim 76.7 86.5 11.4 1.2 13.2 6.0 38.8 32.0 10.8 69.3 99.7 1.3 95.9 91.4
704 Viengxay 76.7 90.2 4.5 0.6 9.6 5.3 37.3 35.8 12.8 84.6 96.7 1.2 84.4 95.3
705 Huameuang 82.3 94.6 2.5 0.3 5.3 4.1 43.4 29.4 23.0 74.4 99.7 0.6 66.4 91.0
706 Xamtay 76.2 93.0 3.2 0.8 6.9 6.3 44.1 29.1 22.9 65.1 94.4 2.0 77.5 95.2
707 Sopbao 78.6 93.5 2.7 0.3 6.5 3.0 39.7 34.4 20.8 79.1 88.4 1.3 90.6 94.4
708 Add 77.9 93.0 3.0 0.4 6.8 2.4 40.1 33.8 20.9 84.5 93.1 1.0 78.3 93.4
709 Kuane 79.6 94.1 1.8 0.4 5.8 2.3 47.7 24.9 27.4 47.5 92.6 0.4 64.1 87.7
710 Sone 77.8 93.0 2.3 0.8 6.9 2.5 44.8 29.4 21.1 62.9 72.2 0.6 70.6 90.3
800 Xayaboury 87.1 88.1 1.5 0.4 11.6 6.5 34.0 33.1 24.5 89.7 86.7 10.7 90.1 93.0801 Xayabury 82.3 78.3 2.1 0.7 21.5 11.2 34.5 33.6 21.7 88.1 88.9 6.2 89.9 94.7
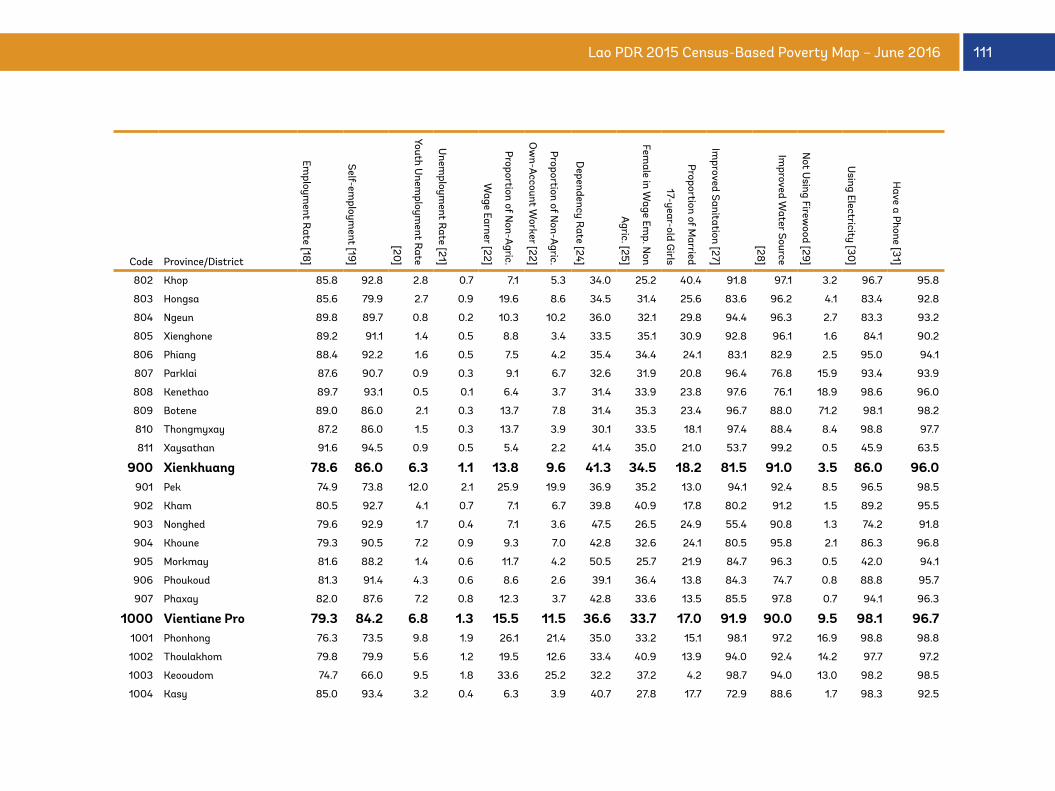
111Lao PDR 2015 Census-Based Poverty Map – June 2016
Code Province/District
Employm
ent Rate [18]
Self-employm
ent [19]
Youth Unem
ployment R
ate
[20]
Unem
ployment R
ate [21]
Proportion of Non-A
gric.
Wage Earner [22]
Proportion of Non-A
gric.
Ow
n-Account W
orker [22]
Dependency R
ate [24]
Female in W
age Emp. N
on
Agric. [25]
Proportion of Married
17-year-old Girls
Improved Sanitation [27]
Improved W
ater Source
[28]
Not U
sing Firewood [29]
Using Electricity [30
]
Have a Phone [31]
802 Khop 85.8 92.8 2.8 0.7 7.1 5.3 34.0 25.2 40.4 91.8 97.1 3.2 96.7 95.8
803 Hongsa 85.6 79.9 2.7 0.9 19.6 8.6 34.5 31.4 25.6 83.6 96.2 4.1 83.4 92.8
804 Ngeun 89.8 89.7 0.8 0.2 10.3 10.2 36.0 32.1 29.8 94.4 96.3 2.7 83.3 93.2
805 Xienghone 89.2 91.1 1.4 0.5 8.8 3.4 33.5 35.1 30.9 92.8 96.1 1.6 84.1 90.2
806 Phiang 88.4 92.2 1.6 0.5 7.5 4.2 35.4 34.4 24.1 83.1 82.9 2.5 95.0 94.1
807 Parklai 87.6 90.7 0.9 0.3 9.1 6.7 32.6 31.9 20.8 96.4 76.8 15.9 93.4 93.9
808 Kenethao 89.7 93.1 0.5 0.1 6.4 3.7 31.4 33.9 23.8 97.6 76.1 18.9 98.6 96.0
809 Botene 89.0 86.0 2.1 0.3 13.7 7.8 31.4 35.3 23.4 96.7 88.0 71.2 98.1 98.2
810 Thongmyxay 87.2 86.0 1.5 0.3 13.7 3.9 30.1 33.5 18.1 97.4 88.4 8.4 98.8 97.7
811 Xaysathan 91.6 94.5 0.9 0.5 5.4 2.2 41.4 35.0 21.0 53.7 99.2 0.5 45.9 63.5
900 Xienkhuang 78.6 86.0 6.3 1.1 13.8 9.6 41.3 34.5 18.2 81.5 91.0 3.5 86.0 96.0901 Pek 74.9 73.8 12.0 2.1 25.9 19.9 36.9 35.2 13.0 94.1 92.4 8.5 96.5 98.5
902 Kham 80.5 92.7 4.1 0.7 7.1 6.7 39.8 40.9 17.8 80.2 91.2 1.5 89.2 95.5
903 Nonghed 79.6 92.9 1.7 0.4 7.1 3.6 47.5 26.5 24.9 55.4 90.8 1.3 74.2 91.8
904 Khoune 79.3 90.5 7.2 0.9 9.3 7.0 42.8 32.6 24.1 80.5 95.8 2.1 86.3 96.8
905 Morkmay 81.6 88.2 1.4 0.6 11.7 4.2 50.5 25.7 21.9 84.7 96.3 0.5 42.0 94.1
906 Phoukoud 81.3 91.4 4.3 0.6 8.6 2.6 39.1 36.4 13.8 84.3 74.7 0.8 88.8 95.7
907 Phaxay 82.0 87.6 7.2 0.8 12.3 3.7 42.8 33.6 13.5 85.5 97.8 0.7 94.1 96.3
1000 Vientiane Pro 79.3 84.2 6.8 1.3 15.5 11.5 36.6 33.7 17.0 91.9 90.0 9.5 98.1 96.71001 Phonhong 76.3 73.5 9.8 1.9 26.1 21.4 35.0 33.2 15.1 98.1 97.2 16.9 98.8 98.8
1002 Thoulakhom 79.8 79.9 5.6 1.2 19.5 12.6 33.4 40.9 13.9 94.0 92.4 14.2 97.7 97.2
1003 Keooudom 74.7 66.0 9.5 1.8 33.6 25.2 32.2 37.2 4.2 98.7 94.0 13.0 98.2 98.5
1004 Kasy 85.0 93.4 3.2 0.4 6.3 3.9 40.7 27.8 17.7 72.9 88.6 1.7 98.3 92.5
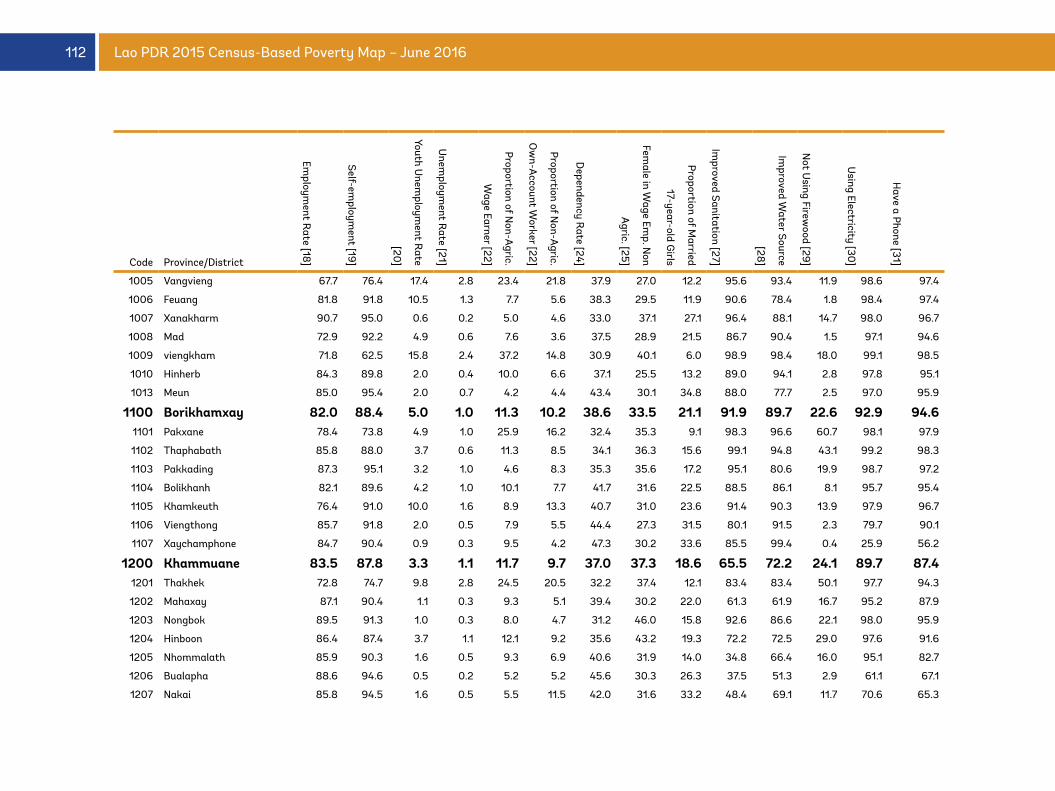
112 Lao PDR 2015 Census-Based Poverty Map – June 2016
Code Province/District
Employm
ent Rate [18]
Self-employm
ent [19]
Youth Unem
ployment R
ate
[20]
Unem
ployment R
ate [21]
Proportion of Non-A
gric.
Wage Earner [22]
Proportion of Non-A
gric.
Ow
n-Account W
orker [22]
Dependency R
ate [24]
Female in W
age Emp. N
on
Agric. [25]
Proportion of Married
17-year-old Girls
Improved Sanitation [27]
Improved W
ater Source
[28]
Not U
sing Firewood [29]
Using Electricity [30
]
Have a Phone [31]
1005 Vangvieng 67.7 76.4 17.4 2.8 23.4 21.8 37.9 27.0 12.2 95.6 93.4 11.9 98.6 97.4
1006 Feuang 81.8 91.8 10.5 1.3 7.7 5.6 38.3 29.5 11.9 90.6 78.4 1.8 98.4 97.4
1007 Xanakharm 90.7 95.0 0.6 0.2 5.0 4.6 33.0 37.1 27.1 96.4 88.1 14.7 98.0 96.7
1008 Mad 72.9 92.2 4.9 0.6 7.6 3.6 37.5 28.9 21.5 86.7 90.4 1.5 97.1 94.6
1009 viengkham 71.8 62.5 15.8 2.4 37.2 14.8 30.9 40.1 6.0 98.9 98.4 18.0 99.1 98.5
1010 Hinherb 84.3 89.8 2.0 0.4 10.0 6.6 37.1 25.5 13.2 89.0 94.1 2.8 97.8 95.1
1013 Meun 85.0 95.4 2.0 0.7 4.2 4.4 43.4 30.1 34.8 88.0 77.7 2.5 97.0 95.9
1100 Borikhamxay 82.0 88.4 5.0 1.0 11.3 10.2 38.6 33.5 21.1 91.9 89.7 22.6 92.9 94.61101 Pakxane 78.4 73.8 4.9 1.0 25.9 16.2 32.4 35.3 9.1 98.3 96.6 60.7 98.1 97.9
1102 Thaphabath 85.8 88.0 3.7 0.6 11.3 8.5 34.1 36.3 15.6 99.1 94.8 43.1 99.2 98.3
1103 Pakkading 87.3 95.1 3.2 1.0 4.6 8.3 35.3 35.6 17.2 95.1 80.6 19.9 98.7 97.2
1104 Bolikhanh 82.1 89.6 4.2 1.0 10.1 7.7 41.7 31.6 22.5 88.5 86.1 8.1 95.7 95.4
1105 Khamkeuth 76.4 91.0 10.0 1.6 8.9 13.3 40.7 31.0 23.6 91.4 90.3 13.9 97.9 96.7
1106 Viengthong 85.7 91.8 2.0 0.5 7.9 5.5 44.4 27.3 31.5 80.1 91.5 2.3 79.7 90.1
1107 Xaychamphone 84.7 90.4 0.9 0.3 9.5 4.2 47.3 30.2 33.6 85.5 99.4 0.4 25.9 56.2
1200 Khammuane 83.5 87.8 3.3 1.1 11.7 9.7 37.0 37.3 18.6 65.5 72.2 24.1 89.7 87.41201 Thakhek 72.8 74.7 9.8 2.8 24.5 20.5 32.2 37.4 12.1 83.4 83.4 50.1 97.7 94.3
1202 Mahaxay 87.1 90.4 1.1 0.3 9.3 5.1 39.4 30.2 22.0 61.3 61.9 16.7 95.2 87.9
1203 Nongbok 89.5 91.3 1.0 0.3 8.0 4.7 31.2 46.0 15.8 92.6 86.6 22.1 98.0 95.9
1204 Hinboon 86.4 87.4 3.7 1.1 12.1 9.2 35.6 43.2 19.3 72.2 72.5 29.0 97.6 91.6
1205 Nhommalath 85.9 90.3 1.6 0.5 9.3 6.9 40.6 31.9 14.0 34.8 66.4 16.0 95.1 82.7
1206 Bualapha 88.6 94.6 0.5 0.2 5.2 5.2 45.6 30.3 26.3 37.5 51.3 2.9 61.1 67.1
1207 Nakai 85.8 94.5 1.6 0.5 5.5 11.5 42.0 31.6 33.2 48.4 69.1 11.7 70.6 65.3
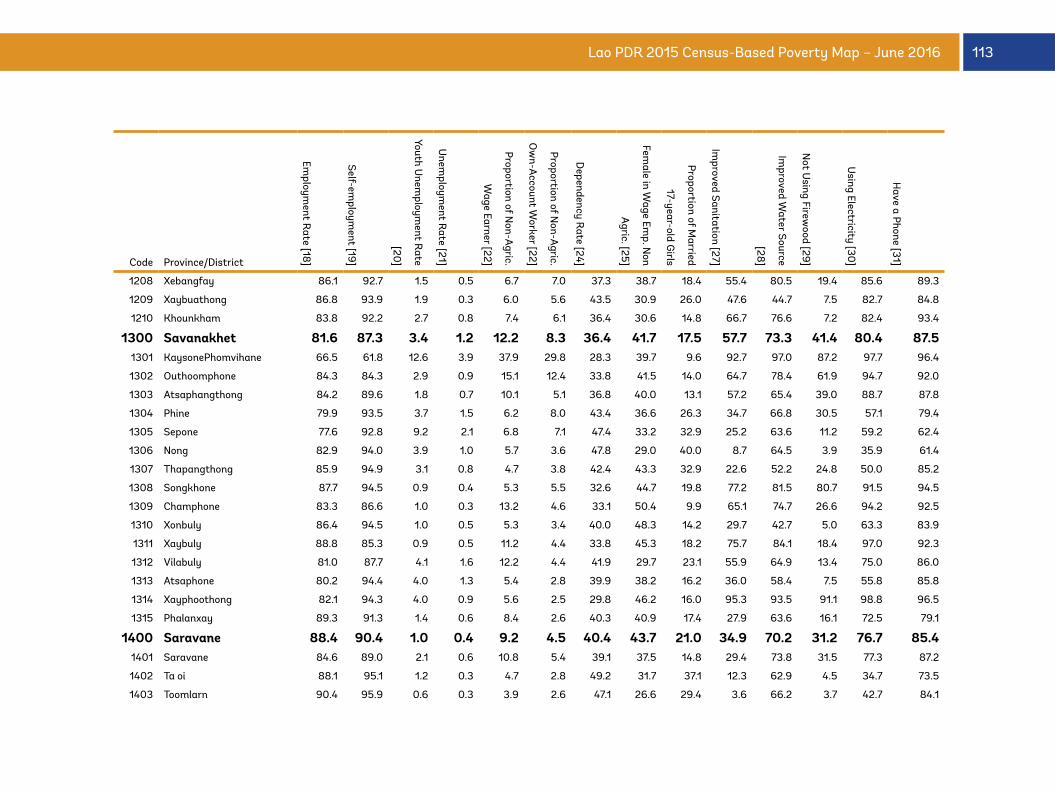
113Lao PDR 2015 Census-Based Poverty Map – June 2016
Code Province/District
Employm
ent Rate [18]
Self-employm
ent [19]
Youth Unem
ployment R
ate
[20]
Unem
ployment R
ate [21]
Proportion of Non-A
gric.
Wage Earner [22]
Proportion of Non-A
gric.
Ow
n-Account W
orker [22]
Dependency R
ate [24]
Female in W
age Emp. N
on
Agric. [25]
Proportion of Married
17-year-old Girls
Improved Sanitation [27]
Improved W
ater Source
[28]
Not U
sing Firewood [29]
Using Electricity [30
]
Have a Phone [31]
1208 Xebangfay 86.1 92.7 1.5 0.5 6.7 7.0 37.3 38.7 18.4 55.4 80.5 19.4 85.6 89.3
1209 Xaybuathong 86.8 93.9 1.9 0.3 6.0 5.6 43.5 30.9 26.0 47.6 44.7 7.5 82.7 84.8
1210 Khounkham 83.8 92.2 2.7 0.8 7.4 6.1 36.4 30.6 14.8 66.7 76.6 7.2 82.4 93.4
1300 Savanakhet 81.6 87.3 3.4 1.2 12.2 8.3 36.4 41.7 17.5 57.7 73.3 41.4 80.4 87.51301 KaysonePhomvihane 66.5 61.8 12.6 3.9 37.9 29.8 28.3 39.7 9.6 92.7 97.0 87.2 97.7 96.4
1302 Outhoomphone 84.3 84.3 2.9 0.9 15.1 12.4 33.8 41.5 14.0 64.7 78.4 61.9 94.7 92.0
1303 Atsaphangthong 84.2 89.6 1.8 0.7 10.1 5.1 36.8 40.0 13.1 57.2 65.4 39.0 88.7 87.8
1304 Phine 79.9 93.5 3.7 1.5 6.2 8.0 43.4 36.6 26.3 34.7 66.8 30.5 57.1 79.4
1305 Sepone 77.6 92.8 9.2 2.1 6.8 7.1 47.4 33.2 32.9 25.2 63.6 11.2 59.2 62.4
1306 Nong 82.9 94.0 3.9 1.0 5.7 3.6 47.8 29.0 40.0 8.7 64.5 3.9 35.9 61.4
1307 Thapangthong 85.9 94.9 3.1 0.8 4.7 3.8 42.4 43.3 32.9 22.6 52.2 24.8 50.0 85.2
1308 Songkhone 87.7 94.5 0.9 0.4 5.3 5.5 32.6 44.7 19.8 77.2 81.5 80.7 91.5 94.5
1309 Champhone 83.3 86.6 1.0 0.3 13.2 4.6 33.1 50.4 9.9 65.1 74.7 26.6 94.2 92.5
1310 Xonbuly 86.4 94.5 1.0 0.5 5.3 3.4 40.0 48.3 14.2 29.7 42.7 5.0 63.3 83.9
1311 Xaybuly 88.8 85.3 0.9 0.5 11.2 4.4 33.8 45.3 18.2 75.7 84.1 18.4 97.0 92.3
1312 Vilabuly 81.0 87.7 4.1 1.6 12.2 4.4 41.9 29.7 23.1 55.9 64.9 13.4 75.0 86.0
1313 Atsaphone 80.2 94.4 4.0 1.3 5.4 2.8 39.9 38.2 16.2 36.0 58.4 7.5 55.8 85.8
1314 Xayphoothong 82.1 94.3 4.0 0.9 5.6 2.5 29.8 46.2 16.0 95.3 93.5 91.1 98.8 96.5
1315 Phalanxay 89.3 91.3 1.4 0.6 8.4 2.6 40.3 40.9 17.4 27.9 63.6 16.1 72.5 79.1
1400 Saravane 88.4 90.4 1.0 0.4 9.2 4.5 40.4 43.7 21.0 34.9 70.2 31.2 76.7 85.41401 Saravane 84.6 89.0 2.1 0.6 10.8 5.4 39.1 37.5 14.8 29.4 73.8 31.5 77.3 87.2
1402 Ta oi 88.1 95.1 1.2 0.3 4.7 2.8 49.2 31.7 37.1 12.3 62.9 4.5 34.7 73.5
1403 Toomlarn 90.4 95.9 0.6 0.3 3.9 2.6 47.1 26.6 29.4 3.6 66.2 3.7 42.7 84.1
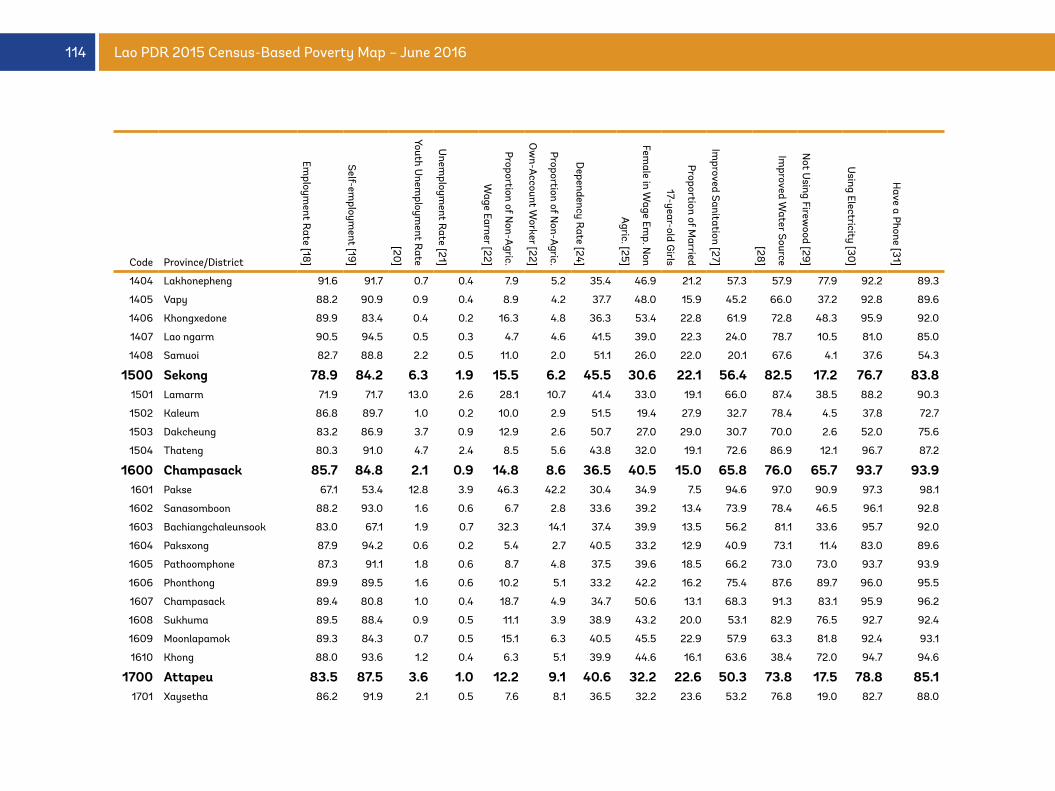
114 Lao PDR 2015 Census-Based Poverty Map – June 2016
Code Province/District
Employm
ent Rate [18]
Self-employm
ent [19]
Youth Unem
ployment R
ate
[20]
Unem
ployment R
ate [21]
Proportion of Non-A
gric.
Wage Earner [22]
Proportion of Non-A
gric.
Ow
n-Account W
orker [22]
Dependency R
ate [24]
Female in W
age Emp. N
on
Agric. [25]
Proportion of Married
17-year-old Girls
Improved Sanitation [27]
Improved W
ater Source
[28]
Not U
sing Firewood [29]
Using Electricity [30
]
Have a Phone [31]
1404 Lakhonepheng 91.6 91.7 0.7 0.4 7.9 5.2 35.4 46.9 21.2 57.3 57.9 77.9 92.2 89.3
1405 Vapy 88.2 90.9 0.9 0.4 8.9 4.2 37.7 48.0 15.9 45.2 66.0 37.2 92.8 89.6
1406 Khongxedone 89.9 83.4 0.4 0.2 16.3 4.8 36.3 53.4 22.8 61.9 72.8 48.3 95.9 92.0
1407 Lao ngarm 90.5 94.5 0.5 0.3 4.7 4.6 41.5 39.0 22.3 24.0 78.7 10.5 81.0 85.0
1408 Samuoi 82.7 88.8 2.2 0.5 11.0 2.0 51.1 26.0 22.0 20.1 67.6 4.1 37.6 54.3
1500 Sekong 78.9 84.2 6.3 1.9 15.5 6.2 45.5 30.6 22.1 56.4 82.5 17.2 76.7 83.81501 Lamarm 71.9 71.7 13.0 2.6 28.1 10.7 41.4 33.0 19.1 66.0 87.4 38.5 88.2 90.3
1502 Kaleum 86.8 89.7 1.0 0.2 10.0 2.9 51.5 19.4 27.9 32.7 78.4 4.5 37.8 72.7
1503 Dakcheung 83.2 86.9 3.7 0.9 12.9 2.6 50.7 27.0 29.0 30.7 70.0 2.6 52.0 75.6
1504 Thateng 80.3 91.0 4.7 2.4 8.5 5.6 43.8 32.0 19.1 72.6 86.9 12.1 96.7 87.2
1600 Champasack 85.7 84.8 2.1 0.9 14.8 8.6 36.5 40.5 15.0 65.8 76.0 65.7 93.7 93.91601 Pakse 67.1 53.4 12.8 3.9 46.3 42.2 30.4 34.9 7.5 94.6 97.0 90.9 97.3 98.1
1602 Sanasomboon 88.2 93.0 1.6 0.6 6.7 2.8 33.6 39.2 13.4 73.9 78.4 46.5 96.1 92.8
1603 Bachiangchaleunsook 83.0 67.1 1.9 0.7 32.3 14.1 37.4 39.9 13.5 56.2 81.1 33.6 95.7 92.0
1604 Paksxong 87.9 94.2 0.6 0.2 5.4 2.7 40.5 33.2 12.9 40.9 73.1 11.4 83.0 89.6
1605 Pathoomphone 87.3 91.1 1.8 0.6 8.7 4.8 37.5 39.6 18.5 66.2 73.0 73.0 93.7 93.9
1606 Phonthong 89.9 89.5 1.6 0.6 10.2 5.1 33.2 42.2 16.2 75.4 87.6 89.7 96.0 95.5
1607 Champasack 89.4 80.8 1.0 0.4 18.7 4.9 34.7 50.6 13.1 68.3 91.3 83.1 95.9 96.2
1608 Sukhuma 89.5 88.4 0.9 0.5 11.1 3.9 38.9 43.2 20.0 53.1 82.9 76.5 92.7 92.4
1609 Moonlapamok 89.3 84.3 0.7 0.5 15.1 6.3 40.5 45.5 22.9 57.9 63.3 81.8 92.4 93.1
1610 Khong 88.0 93.6 1.2 0.4 6.3 5.1 39.9 44.6 16.1 63.6 38.4 72.0 94.7 94.6
1700 Attapeu 83.5 87.5 3.6 1.0 12.2 9.1 40.6 32.2 22.6 50.3 73.8 17.5 78.8 85.11701 Xaysetha 86.2 91.9 2.1 0.5 7.6 8.1 36.5 32.2 23.6 53.2 76.8 19.0 82.7 88.0
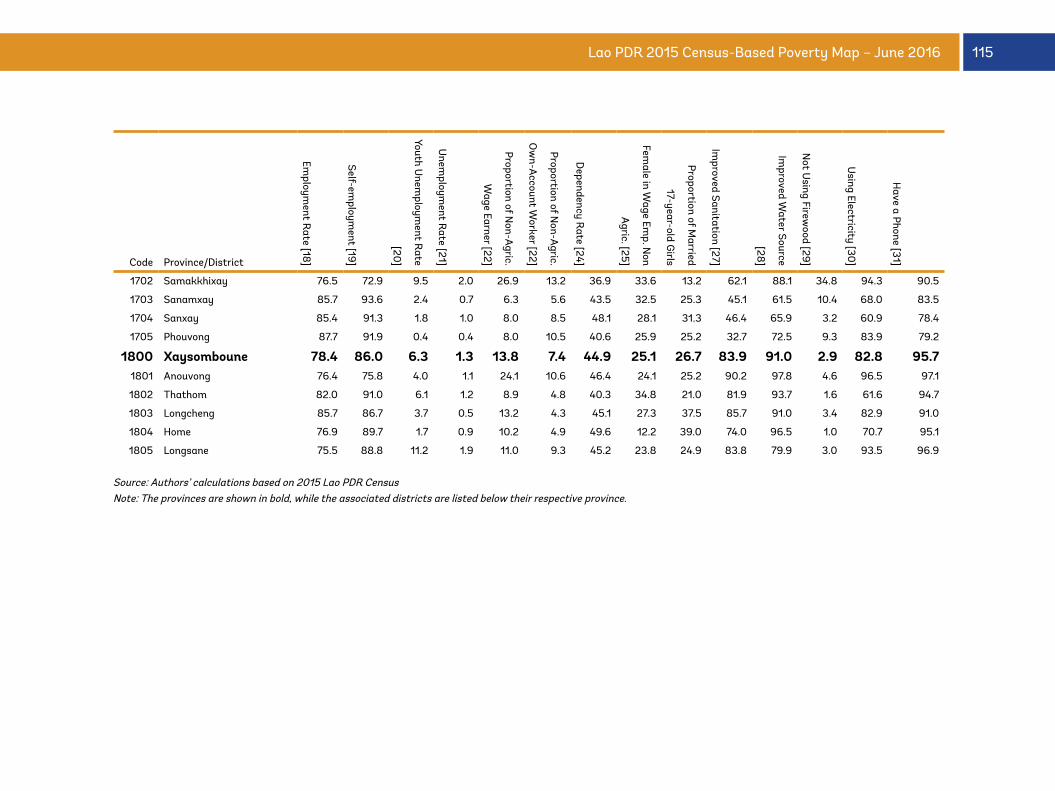
115Lao PDR 2015 Census-Based Poverty Map – June 2016
Code Province/District
Employm
ent Rate [18]
Self-employm
ent [19]
Youth Unem
ployment R
ate
[20]
Unem
ployment R
ate [21]
Proportion of Non-A
gric.
Wage Earner [22]
Proportion of Non-A
gric.
Ow
n-Account W
orker [22]
Dependency R
ate [24]
Female in W
age Emp. N
on
Agric. [25]
Proportion of Married
17-year-old Girls
Improved Sanitation [27]
Improved W
ater Source
[28]
Not U
sing Firewood [29]
Using Electricity [30
]
Have a Phone [31]
1702 Samakkhixay 76.5 72.9 9.5 2.0 26.9 13.2 36.9 33.6 13.2 62.1 88.1 34.8 94.3 90.5
1703 Sanamxay 85.7 93.6 2.4 0.7 6.3 5.6 43.5 32.5 25.3 45.1 61.5 10.4 68.0 83.5
1704 Sanxay 85.4 91.3 1.8 1.0 8.0 8.5 48.1 28.1 31.3 46.4 65.9 3.2 60.9 78.4
1705 Phouvong 87.7 91.9 0.4 0.4 8.0 10.5 40.6 25.9 25.2 32.7 72.5 9.3 83.9 79.2
1800 Xaysomboune 78.4 86.0 6.3 1.3 13.8 7.4 44.9 25.1 26.7 83.9 91.0 2.9 82.8 95.71801 Anouvong 76.4 75.8 4.0 1.1 24.1 10.6 46.4 24.1 25.2 90.2 97.8 4.6 96.5 97.1
1802 Thathom 82.0 91.0 6.1 1.2 8.9 4.8 40.3 34.8 21.0 81.9 93.7 1.6 61.6 94.7
1803 Longcheng 85.7 86.7 3.7 0.5 13.2 4.3 45.1 27.3 37.5 85.7 91.0 3.4 82.9 91.0
1804 Home 76.9 89.7 1.7 0.9 10.2 4.9 49.6 12.2 39.0 74.0 96.5 1.0 70.7 95.1
1805 Longsane 75.5 88.8 11.2 1.9 11.0 9.3 45.2 23.8 24.9 83.8 79.9 3.0 93.5 96.9
Source: Authors’ calculations based on 2015 Lao PDR CensusNote: The provinces are shown in bold, while the associated districts are listed below their respective province.