Embed Size (px)
Citation preview

Leadership Atlanta
December 2, 2010
1 Examine the Data for Education in Georgia
2 Economic Impact of Georgia Non-Graduates
3 Strengthening the Birth to Work Pipeline
4 What Can We Do?

Examine the Data for Education in Georgia
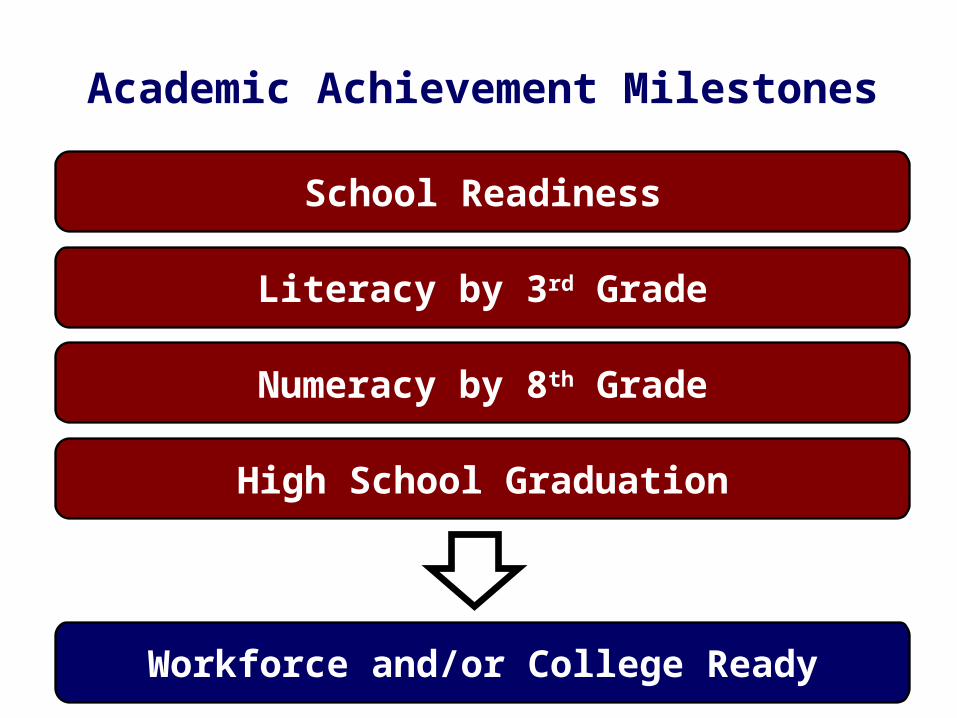
Academic Achievement Milestones
School Readiness
Literacy by 3rd Grade
Numeracy by 8th Grade
High School Graduation
Workforce and/or College Ready
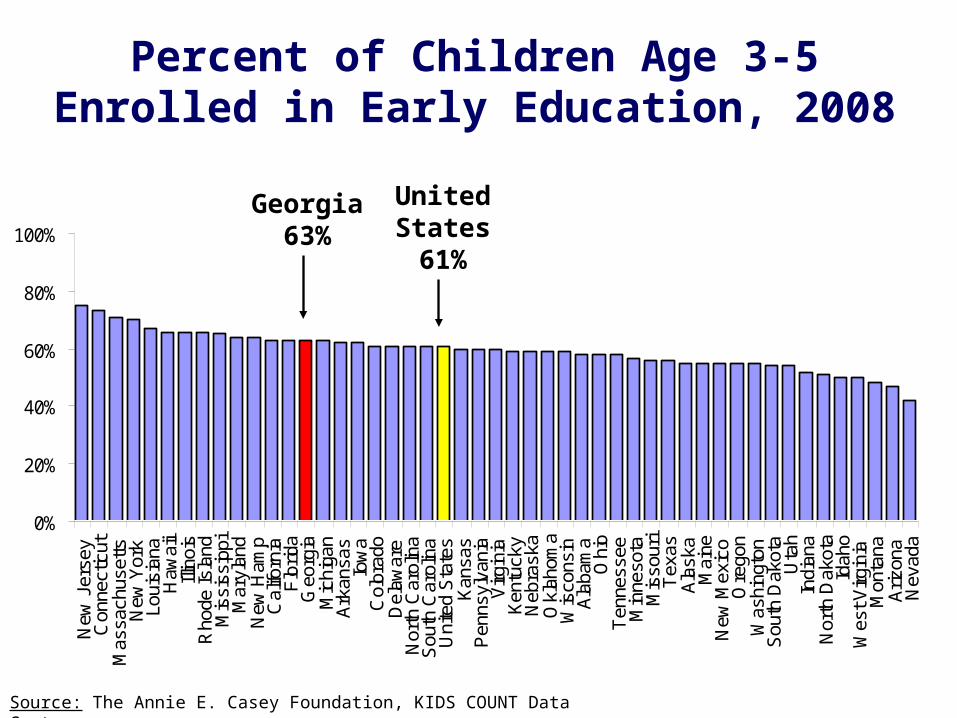
Percent of Children Age 3-5 Enrolled in Early Education, 2008
Source: The Annie E. Casey Foundation, KIDS COUNT Data Center.
0%
20%
40%
60%
80%
100%
New
Jer
sey
Con
nect
icut
Mas
sach
uset
tsN
ew Y
ork
Loui
sian
aH
awai
iIll
inoi
sR
hode
Isla
ndM
issi
ssip
piM
aryl
and
New
Ham
pC
alifo
rnia
Flo
rida
Geo
rgia
Mic
higa
nA
rkan
sas
Iow
aC
olor
ado
Del
awar
eN
orth
Car
olin
aS
outh
Car
olin
aU
nite
d S
tate
sK
ansa
sP
enns
ylva
nia
Virg
inia
Ken
tuck
yN
ebra
ska
Okl
ahom
aW
isco
nsin
Ala
bam
aO
hio
Ten
ness
eeM
inne
sota
Mis
sour
iT
exas
Ala
ska
Mai
neN
ew M
exic
oO
rego
nW
ashi
ngto
nS
outh
Dak
ota
Uta
hIn
dian
aN
orth
Dak
ota
Idah
oW
est V
irgin
iaM
onta
naA
rizon
aN
evad
a
Georgia63%
UnitedStates61%
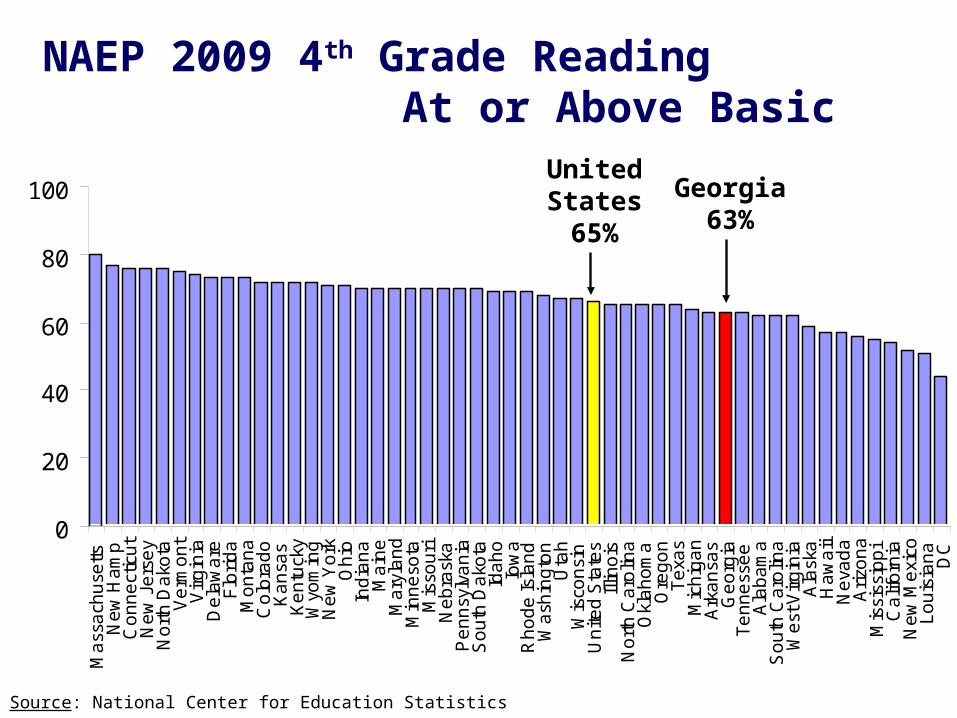
NAEP 2009 4th Grade Reading At or Above Basic
Source: National Center for Education Statistics
0
20
40
60
80
100
Ma
ssa
chu
setts
Ne
w H
am
pC
on
ne
ctic
ut
Ne
w J
ers
ey
No
rth
Da
kota
Ve
rmo
nt
Vir
gin
iaD
ela
wa
reF
lori
da
Mo
nta
na
Co
lora
do
Ka
nsa
sK
en
tuck
yW
yom
ing
Ne
w Y
ork
Oh
ioIn
dia
na
Ma
ine
Ma
ryla
nd
Min
ne
sota
Mis
sou
riN
eb
rask
aP
en
nsy
lva
nia
So
uth
Da
kota
Ida
ho
Iow
aR
ho
de
Isla
nd
Wa
shin
gto
nU
tah
Wis
con
sin
Un
ited
Sta
tes
Illin
ois
No
rth
Ca
rolin
aO
kla
ho
ma
Ore
go
nT
exa
sM
ich
iga
nA
rka
nsa
sG
eo
rgia
Te
nn
ess
ee
Ala
ba
ma
So
uth
Ca
rolin
aW
est
Vir
gin
iaA
lask
aH
aw
aii
Ne
vad
aA
rizo
na
Mis
siss
ipp
iC
alif
orn
iaN
ew
Me
xico
Lo
uis
ian
aD
C
Georgia63%
UnitedStates65%
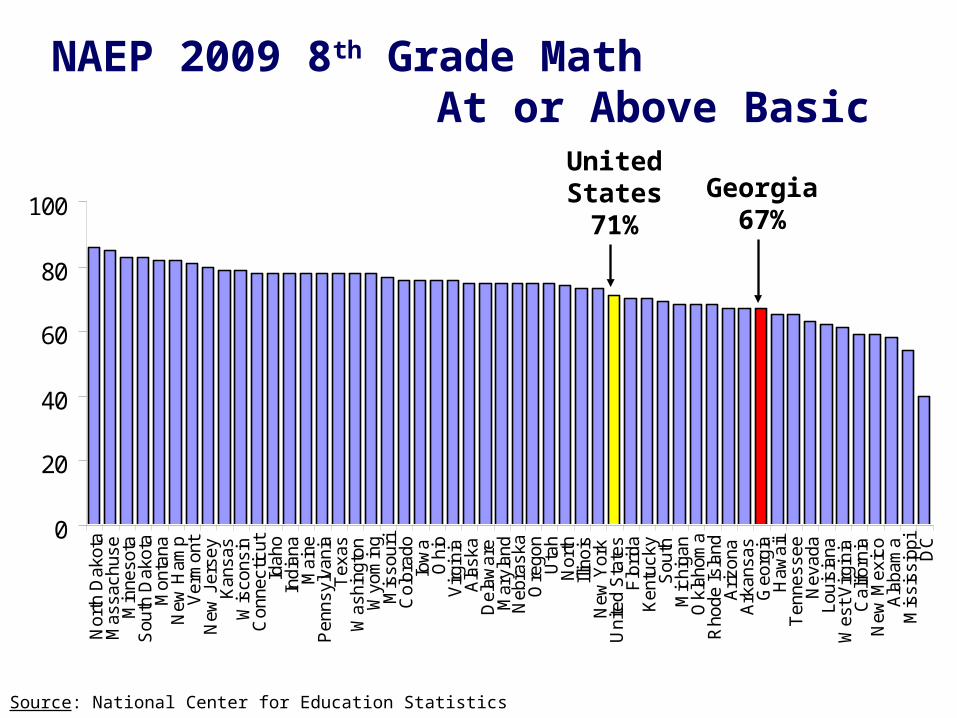
NAEP 2009 8th Grade Math At or Above Basic
Source: National Center for Education Statistics
0
20
40
60
80
100
Nor
th D
akot
aM
assa
chus
eM
inne
sota
Sou
th D
akot
aM
onta
naN
ew H
amp
Ver
mon
tN
ew J
erse
yK
ansa
sW
isco
nsin
Con
nect
icut
Idah
oIn
dian
aM
aine
Pen
nsyl
vani
aT
exas
Was
hing
ton
Wyo
min
gM
isso
uri
Col
orad
oIo
wa
Ohi
oV
irgin
iaA
lask
aD
elaw
are
Mar
ylan
dN
ebra
ska
Ore
gon
Uta
hN
orth
Illin
ois
New
Yor
kU
nite
d S
tate
sF
lorid
aK
entu
cky
Sou
thM
ichi
gan
Okl
ahom
aR
hode
Isla
ndA
rizon
aA
rkan
sas
Geo
rgia
Haw
aii
Ten
ness
eeN
evad
aLo
uisi
ana
Wes
t Virg
inia
Cal
iforn
iaN
ew M
exic
oA
laba
ma
Mis
siss
ippi
DC
UnitedStates71%
Georgia67%
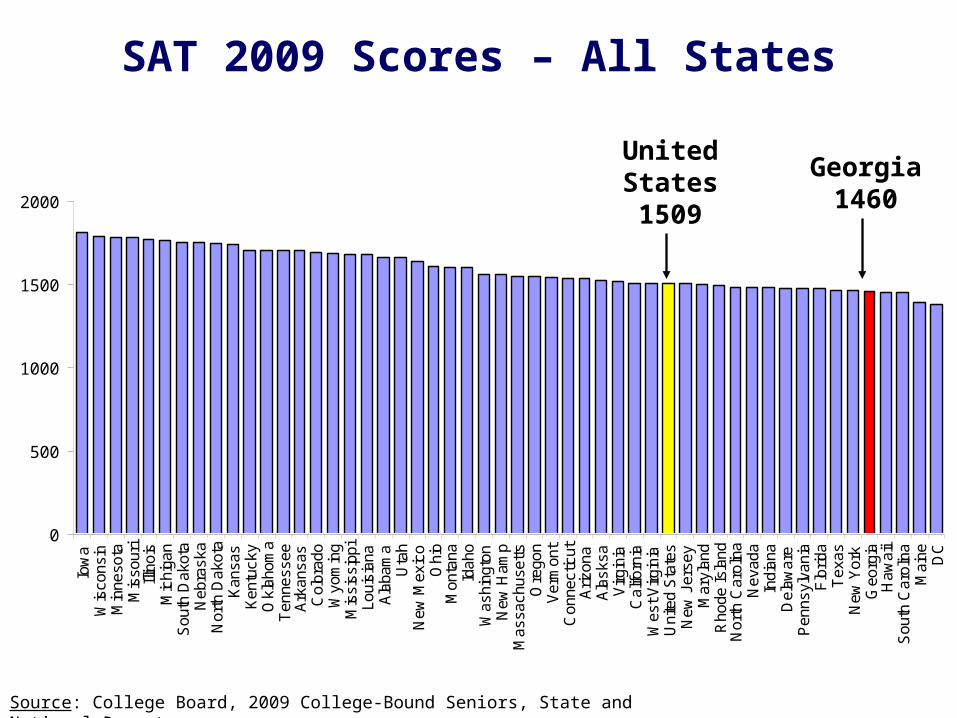
SAT 2009 Scores – All States
Source: College Board, 2009 College-Bound Seniors, State and National Reports.
0
500
1000
1500
2000
Iow
aW
isco
nsin
Min
neso
taM
isso
uri
Illin
ois
Mic
higa
nS
outh
Dak
ota
Neb
rask
aN
orth
Dak
ota
Kan
sas
Ken
tuck
yO
klah
oma
Ten
ness
eeA
rkan
sas
Col
orad
oW
yom
ing
Mis
siss
ippi
Loui
sian
aA
laba
ma
Uta
hN
ew M
exic
oO
hio
Mon
tana
Idah
oW
ashi
ngto
nN
ew H
amp
Mas
sach
uset
tsO
rego
nV
erm
ont
Con
nect
icut
Ariz
ona
Ala
sksa
Virg
inia
Cal
iforn
iaW
est V
irgin
iaU
nite
d S
tate
sN
ew J
erse
yM
aryl
and
Rho
de Is
land
Nor
th C
arol
ina
Nev
ada
Indi
ana
Del
awar
eP
enns
ylva
nia
Flo
rida
Tex
asN
ew Y
ork
Geo
rgia
Haw
aii
Sou
th C
arol
ina
Mai
ne DC
UnitedStates1509
Georgia1460
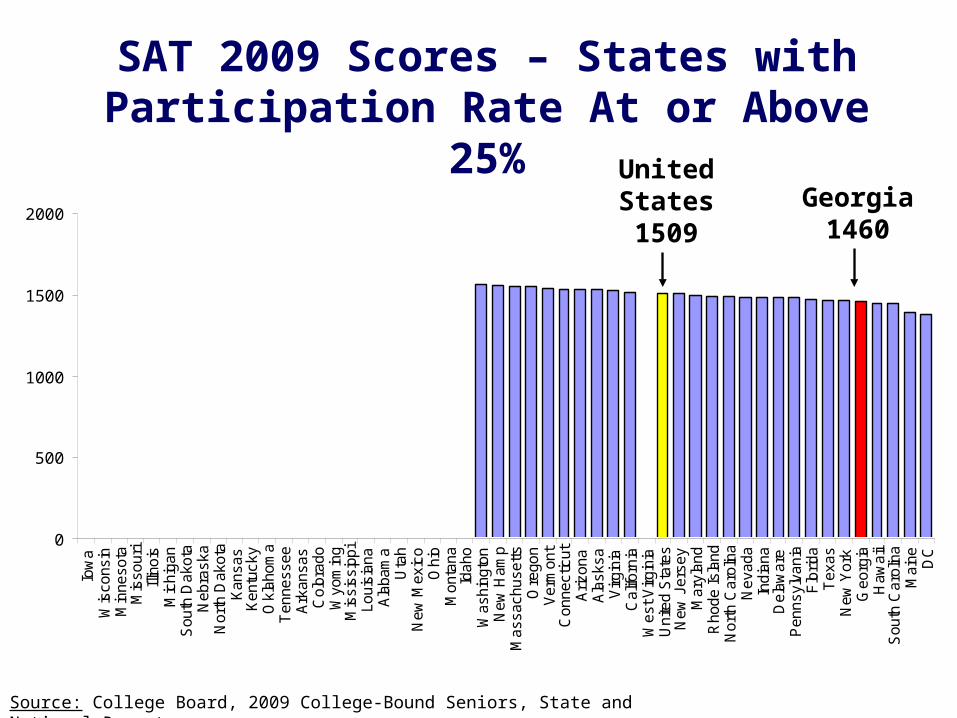
SAT 2009 Scores – States with Participation Rate At or Above 25%
Source: College Board, 2009 College-Bound Seniors, State and National Reports.
0
500
1000
1500
2000
Iow
aW
isco
nsin
Min
neso
taM
isso
uri
Illin
ois
Mic
higa
nS
outh
Dak
ota
Neb
rask
aN
orth
Dak
ota
Kan
sas
Ken
tuck
yO
klah
oma
Ten
ness
eeA
rkan
sas
Col
orad
oW
yom
ing
Mis
siss
ippi
Loui
sian
aA
laba
ma
Uta
hN
ew M
exic
oO
hio
Mon
tana
Idah
oW
ashi
ngto
nN
ew H
amp
Mas
sach
uset
tsO
rego
nV
erm
ont
Con
nect
icut
Ariz
ona
Ala
sksa
Virg
inia
Cal
iforn
iaW
est V
irgin
iaU
nite
d S
tate
sN
ew J
erse
yM
aryl
and
Rho
de Is
land
Nor
th C
arol
ina
Nev
ada
Indi
ana
Del
awar
eP
enns
ylva
nia
Flo
rida
Tex
asN
ew Y
ork
Geo
rgia
Haw
aii
Sou
th C
arol
ina
Mai
ne DC
UnitedStates1509
Georgia1460
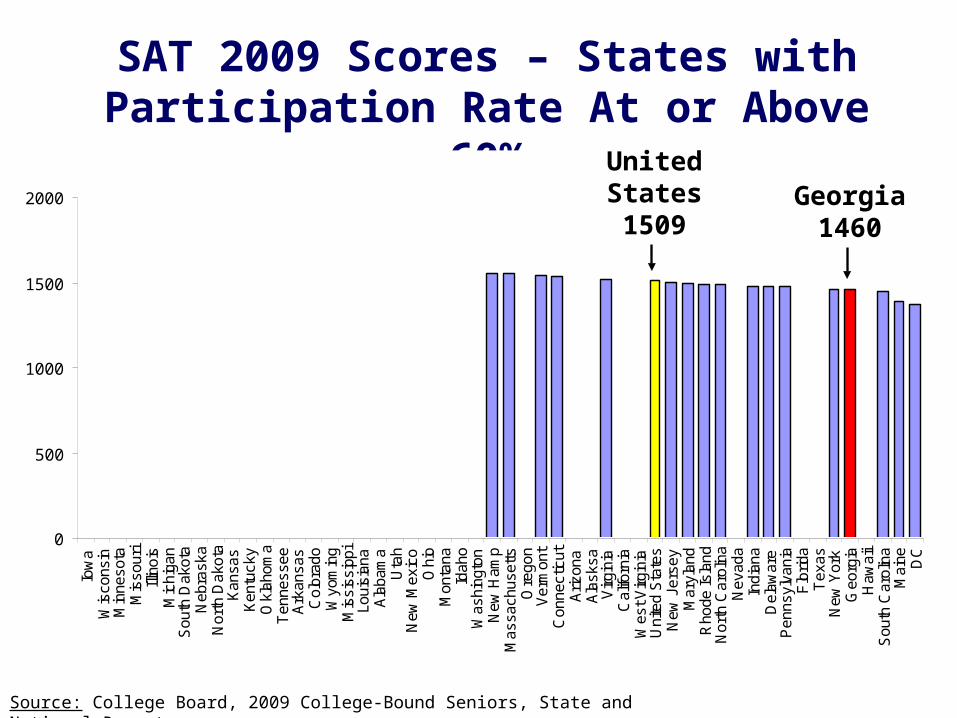
SAT 2009 Scores – States with Participation Rate At or Above 60%
Source: College Board, 2009 College-Bound Seniors, State and National Reports.
0
500
1000
1500
2000
Iow
aW
isco
nsin
Min
neso
taM
isso
uri
Illin
ois
Mic
higa
nS
outh
Dak
ota
Neb
rask
aN
orth
Dak
ota
Kan
sas
Ken
tuck
yO
klah
oma
Ten
ness
eeA
rkan
sas
Col
orad
oW
yom
ing
Mis
siss
ippi
Loui
sian
aA
laba
ma
Uta
hN
ew M
exic
oO
hio
Mon
tana
Idah
oW
ashi
ngto
nN
ew H
amp
Mas
sach
uset
tsO
rego
nV
erm
ont
Con
nect
icut
Ariz
ona
Ala
sksa
Virg
inia
Cal
iforn
iaW
est V
irgin
iaU
nite
d S
tate
sN
ew J
erse
yM
aryl
and
Rho
de Is
land
Nor
th C
arol
ina
Nev
ada
Indi
ana
Del
awar
eP
enns
ylva
nia
Flo
rida
Tex
asN
ew Y
ork
Geo
rgia
Haw
aii
Sou
th C
arol
ina
Mai
ne DC
UnitedStates1509
Georgia1460
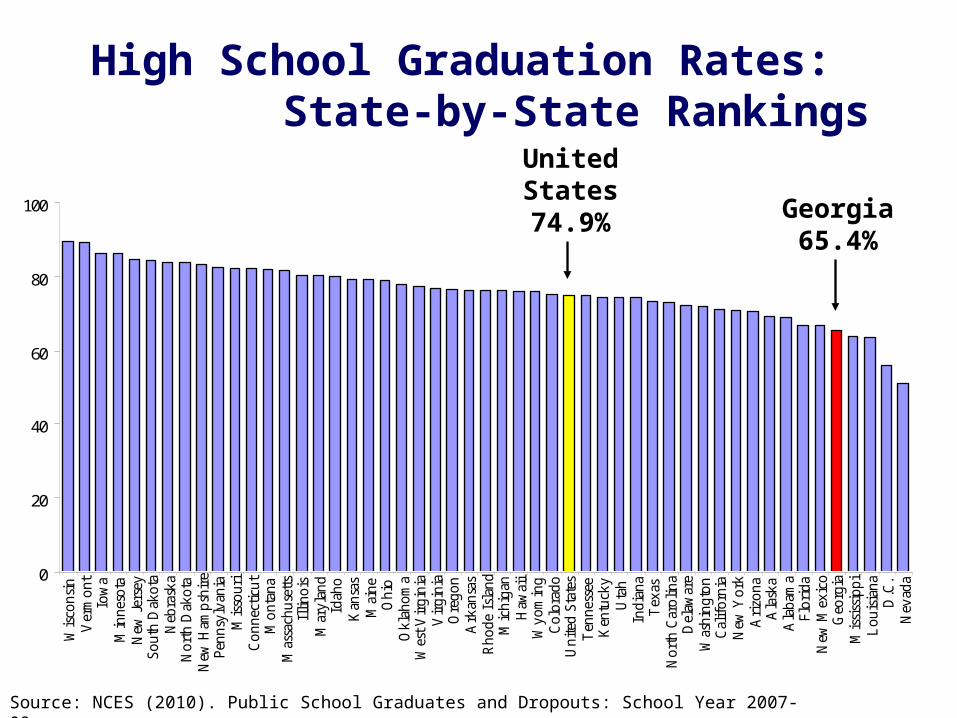
Source: NCES (2010). Public School Graduates and Dropouts: School Year 2007-08.
0
20
40
60
80
100
Wis
con
sin
Ver
mo
nt
Iow
aM
inn
eso
taN
ew J
erse
yS
ou
th D
ako
taN
ebra
ska
No
rth
Dak
ota
New
Ham
psh
ire
Pen
nsy
lvan
iaM
isso
uri
Co
nn
ecti
cut
Mo
nta
na
Mas
sach
use
tts
Illi
no
isM
ary
lan
dId
aho
Kan
sas
Mai
ne
Oh
ioO
kla
ho
ma
Wes
t V
irg
inia
Vir
gin
iaO
reg
on
Ark
ansa
sR
ho
de
Isla
nd
Mic
hig
anH
awai
iW
yo
min
gC
olo
rad
oU
nit
ed S
tate
sT
enn
esse
eK
entu
cky
Uta
hIn
dia
na
Tex
asN
ort
h C
aro
lin
aD
elaw
are
Was
hin
gto
nC
alif
orn
iaN
ew Y
ork
Ari
zon
aA
lask
aA
lab
ama
Flo
rid
aN
ew M
exic
oG
eorg
iaM
issi
ssip
pi
Lo
uis
ian
aD
.C.
Nev
ada
UnitedStates74.9% Georgia
65.4%
High School Graduation Rates: State-by-State Rankings
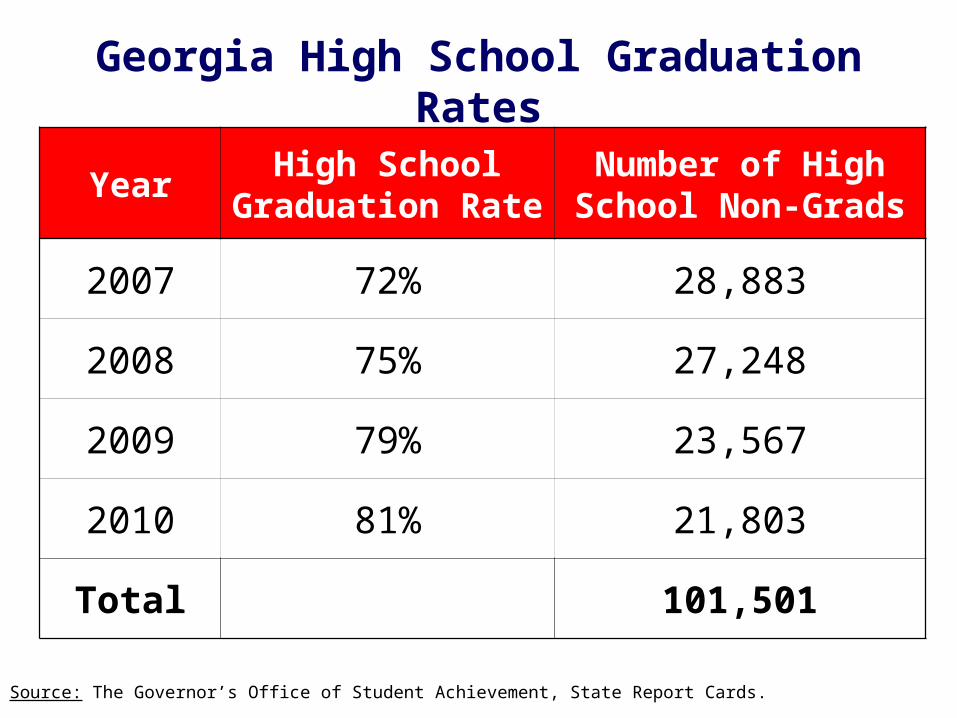
Georgia High School Graduation Rates
Source: The Governor’s Office of Student Achievement, State Report Cards.
YearHigh School
Graduation RateNumber of High
School Non-Grads
2007 72% 28,883
2008 75% 27,248
2009 79% 23,567
2010 81% 21,803
Total 101,501

Economic Impact ofGeorgia Non-Graduates
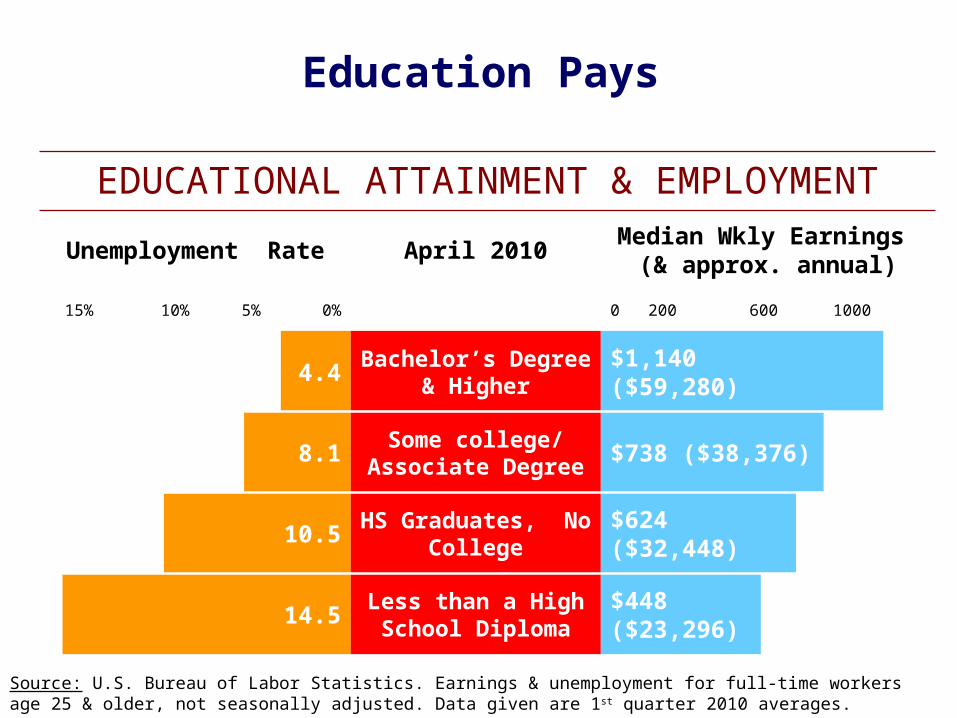
Education Pays
Source: U.S. Bureau of Labor Statistics. Earnings & unemployment for full-time workers age 25 & older, not seasonally adjusted. Data given are 1st quarter 2010 averages.
EDUCATIONAL ATTAINMENT & EMPLOYMENT
Unemployment Rate April 2010Median Wkly Earnings
(& approx. annual)
15% 10% 5% 0% 0 200 600 1000
4.4Bachelor’s
Degree & Higher$1,140 ($59,280)
8.1Some college/
Associate Degree$738 ($38,376)
10.5HS Graduates,
No College$624 ($32,448)
14.5Less than a High School Diploma
$448 ($23,296)
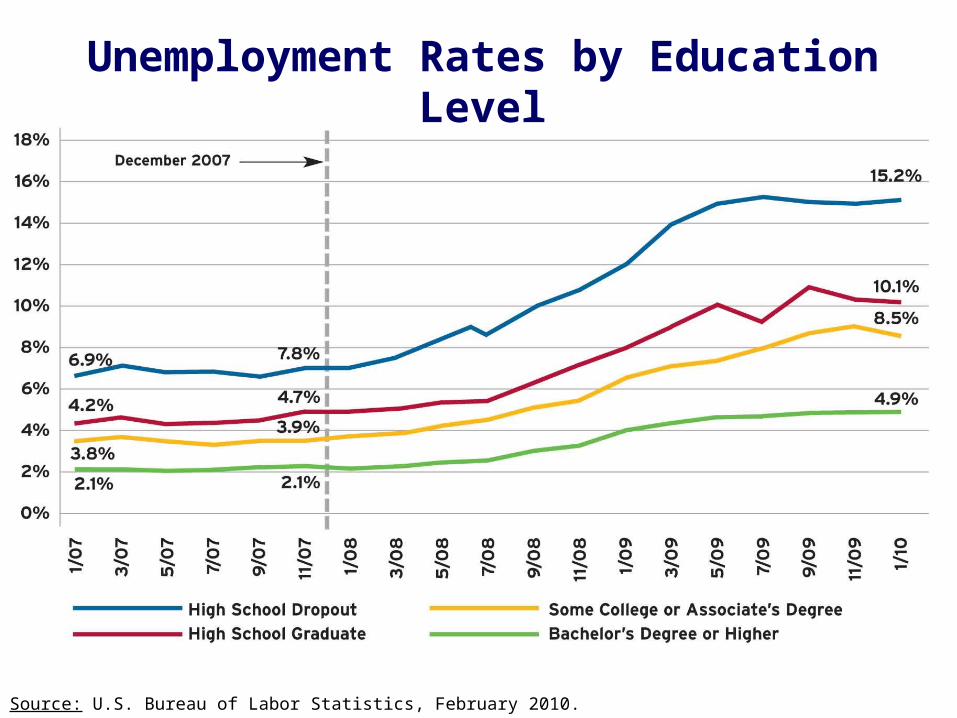
Unemployment Rates by Education Level
Source: U.S. Bureau of Labor Statistics, February 2010.
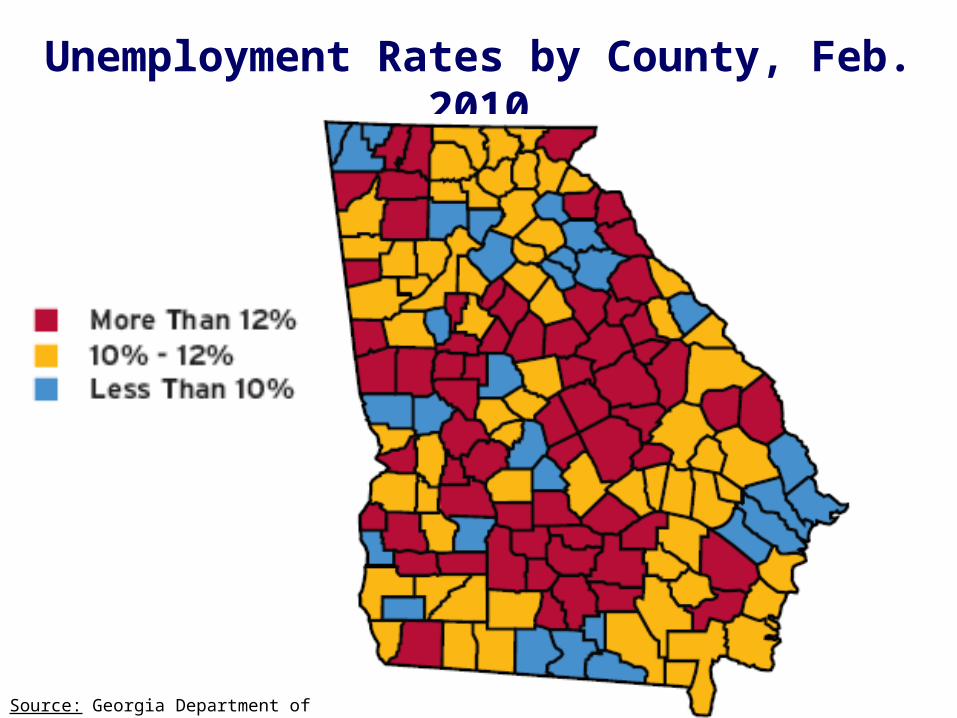
Unemployment Rates by County, Feb. 2010
Source: Georgia Department of Labor
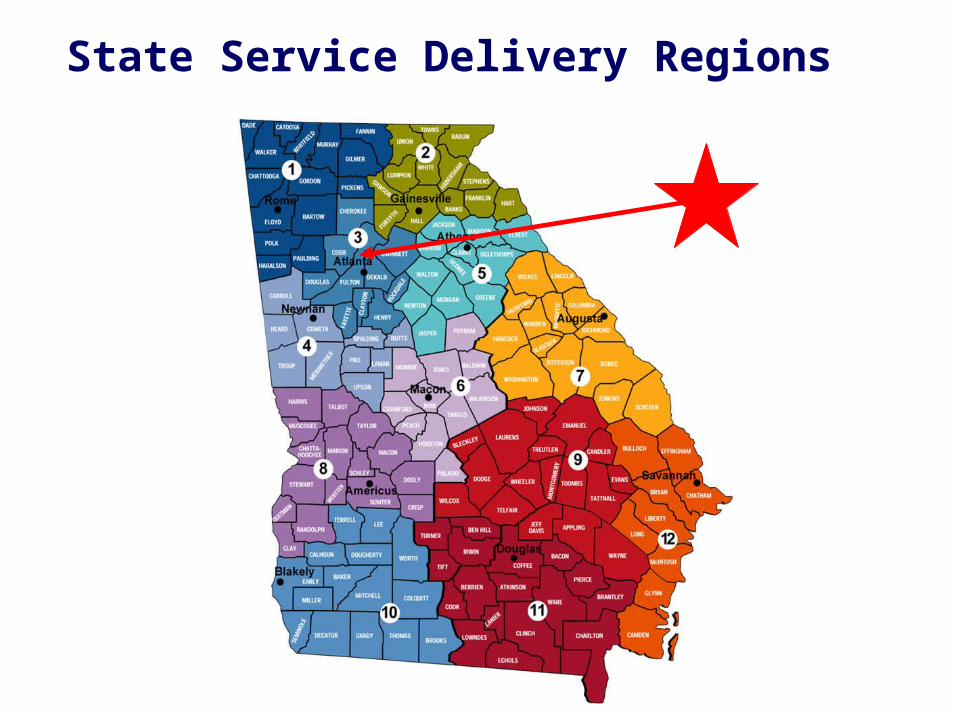
State Service Delivery Regions
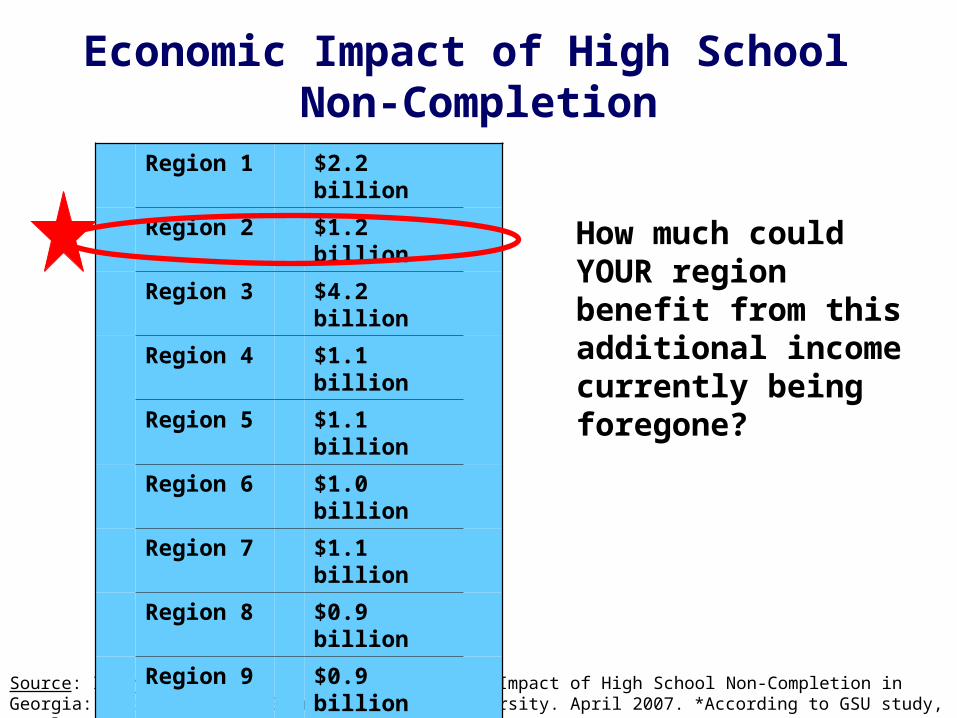
Economic Impact of High School Non-Completion
How much could YOUR region benefit from this additional income currently being foregone?
Source: Isley, P. & Hill, J. “Updated Economic Impact of High School Non-Completion in Georgia: 2005 Estimate,” Georgia Southern University. April 2007. *According to GSU study, totals may not add due to rounding.
Region 1 $2.2 billion
Region 2 $1.2 billion
Region 3 $4.2 billion
Region 4 $1.1 billion
Region 5 $1.1 billion
Region 6 $1.0 billion
Region 7 $1.1 billion
Region 8 $0.9 billion
Region 9 $0.9 billion
Region 10 $2.0 billion
Region 11 $1.0 billion
Region 12 $1.1 billion
TOTAL $18 billion*
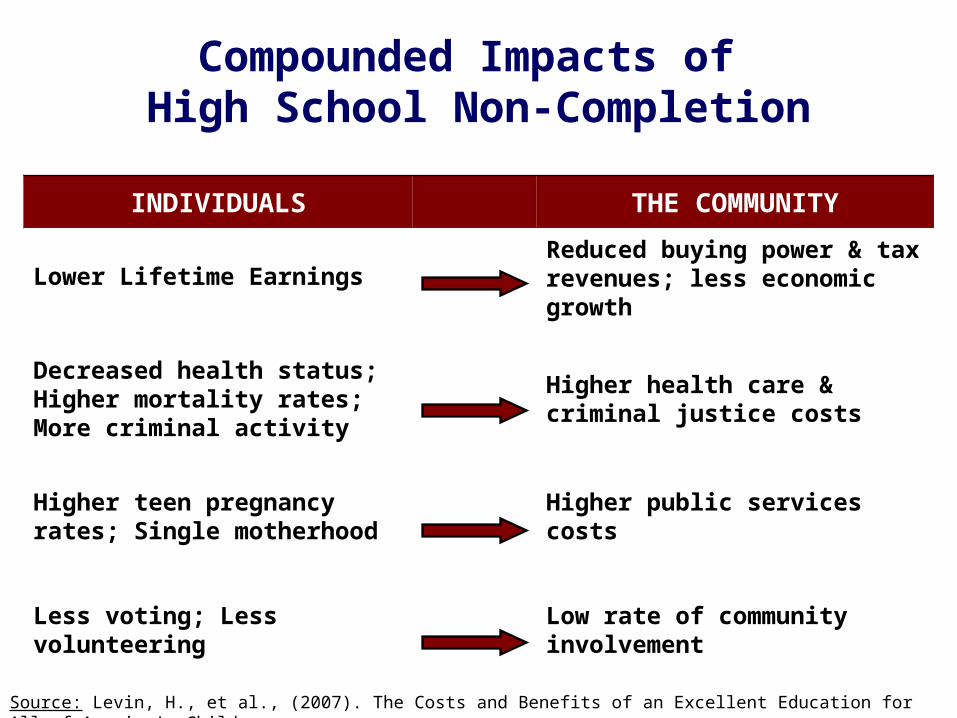
Compounded Impacts of High School Non-Completion
Source: Levin, H., et al., (2007). The Costs and Benefits of an Excellent Education for All of America’s Children.
INDIVIDUALS THE COMMUNITY
Lower Lifetime Earnings Reduced buying power & tax revenues; less economic growth
Decreased health status; Higher mortality rates; More criminal activity
Higher health care & criminal justice costs
Higher teen pregnancy rates; Single motherhood
Higher public services costs
Less voting; Less volunteeringLow rate of community involvement

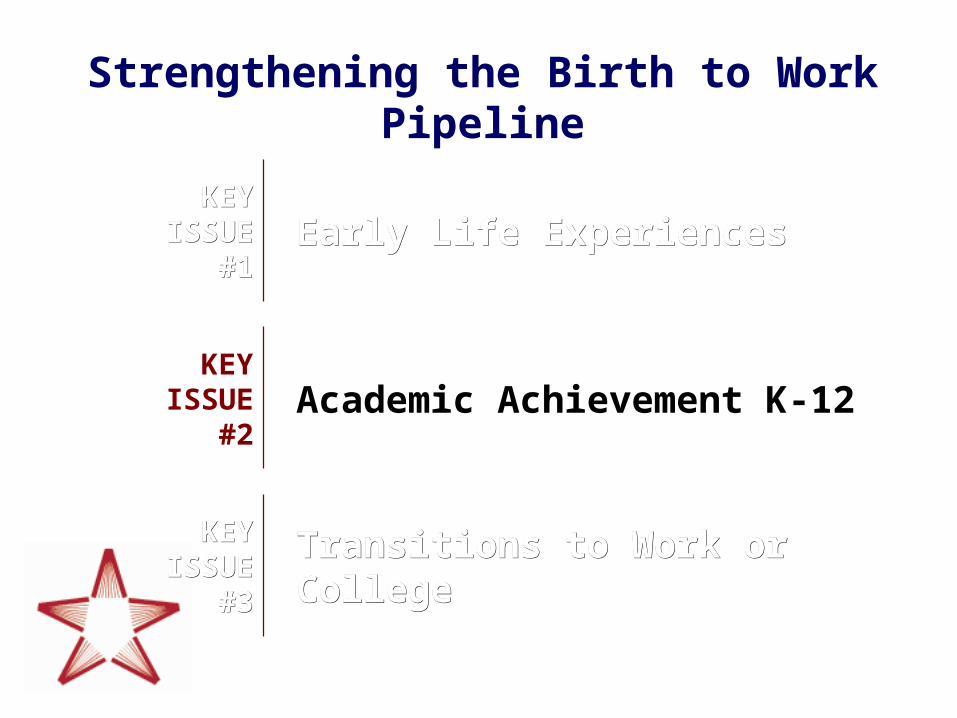
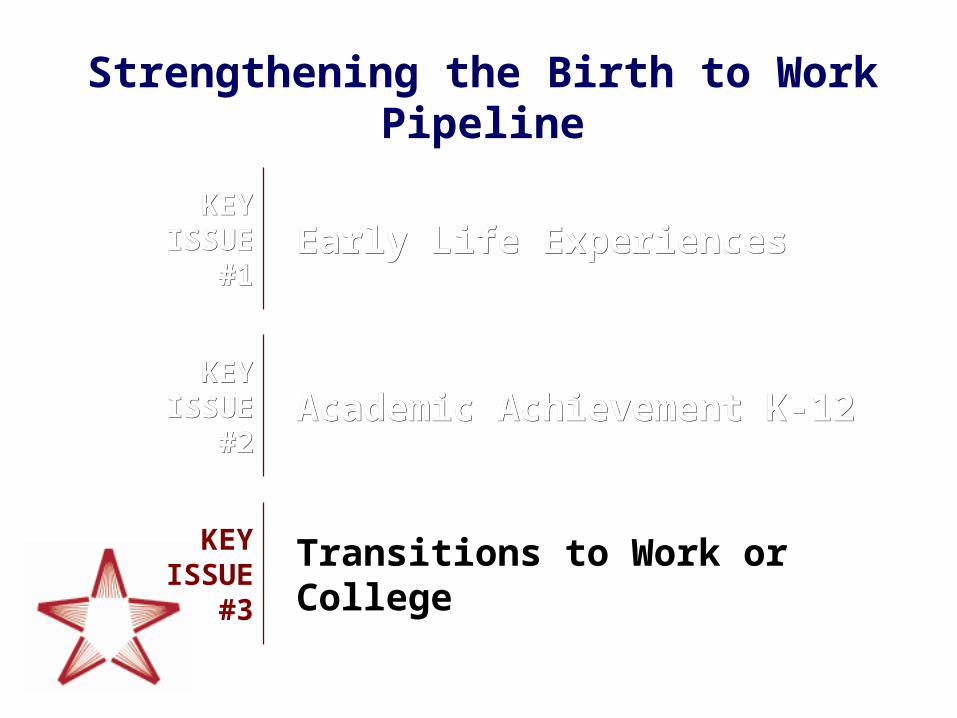
Strengthening the Birth to Work Pipeline
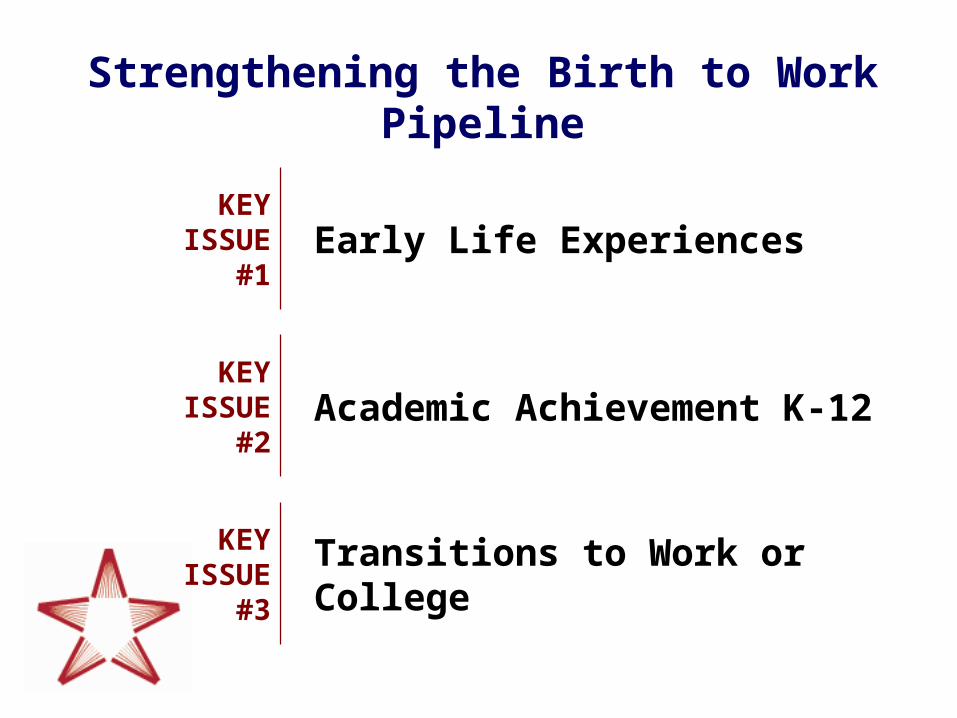
Strengthening the Birth to Work Pipeline
KEY ISSUE
#1Early Life Experiences
KEY ISSUE
#2Academic Achievement K-12
KEY ISSUE
#3Transitions to Work or College
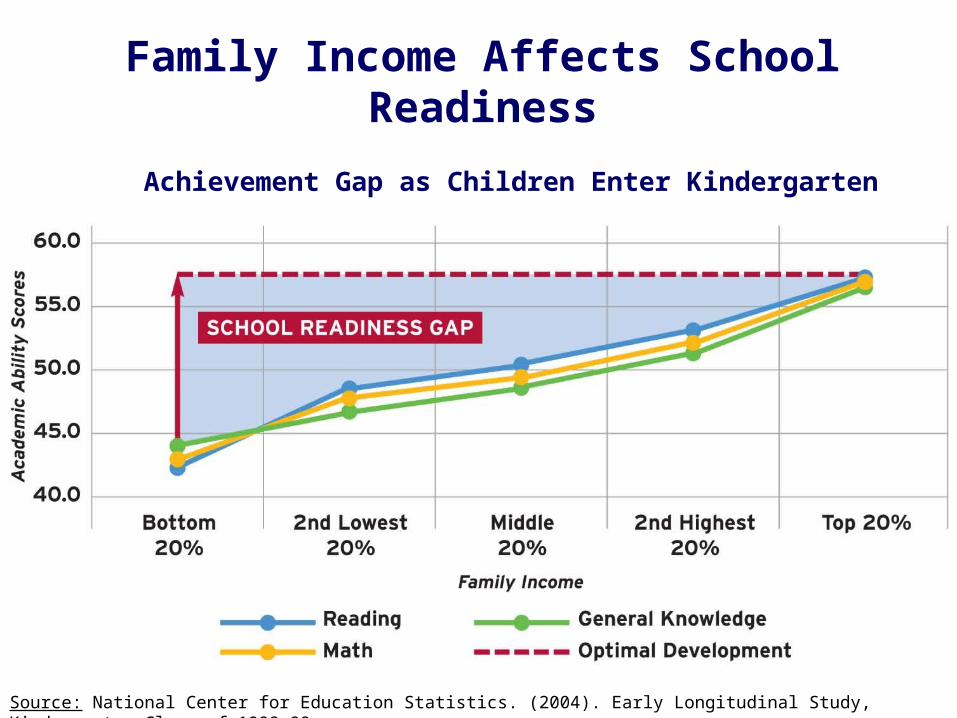
Family Income Affects School Readiness
Source: National Center for Education Statistics. (2004). Early Longitudinal Study, Kindergarten Class of 1998-99.
Achievement Gap as Children Enter Kindergarten
0
200
400
600
800
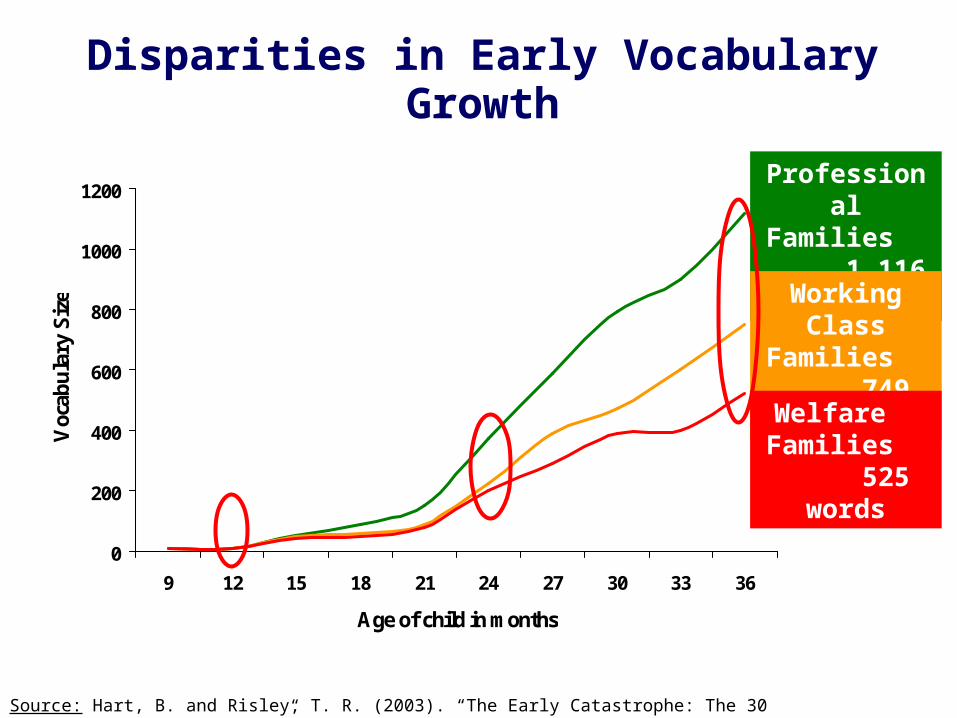
1000
1200
9 12 15 18 21 24 27 30 33 36
Age of child in months
Voc
abu
lary
Siz
eDisparities in Early Vocabulary Growth
Source: Hart, B. and Risley, T. R. (2003). “The Early Catastrophe: The 30 Million Word Gap by Age 3.”
Professional Families 1,116 words
Working Class Families 749 words
Welfare Families 525 words
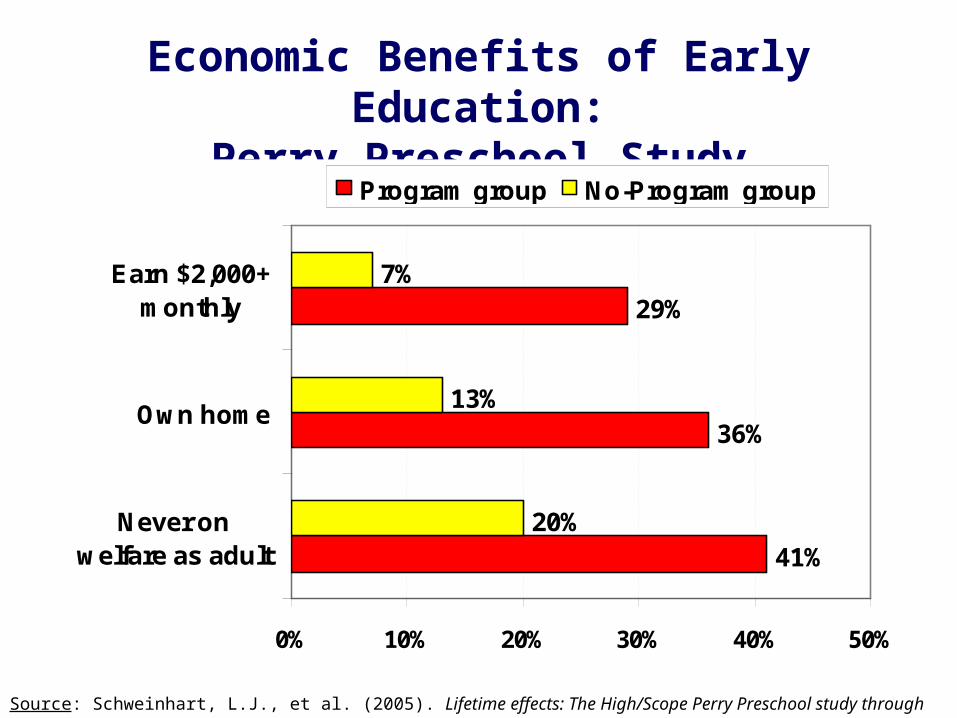
Economic Benefits of Early Education:Perry Preschool Study
41%
36%
29%
20%
13%
7%
0% 10% 20% 30% 40% 50%
Never onwelfare as adult
Own home
Earn $2,000+monthly
Program group No-Program group
Source: Schweinhart, L.J., et al. (2005). Lifetime effects: The High/Scope Perry Preschool study through age 40.
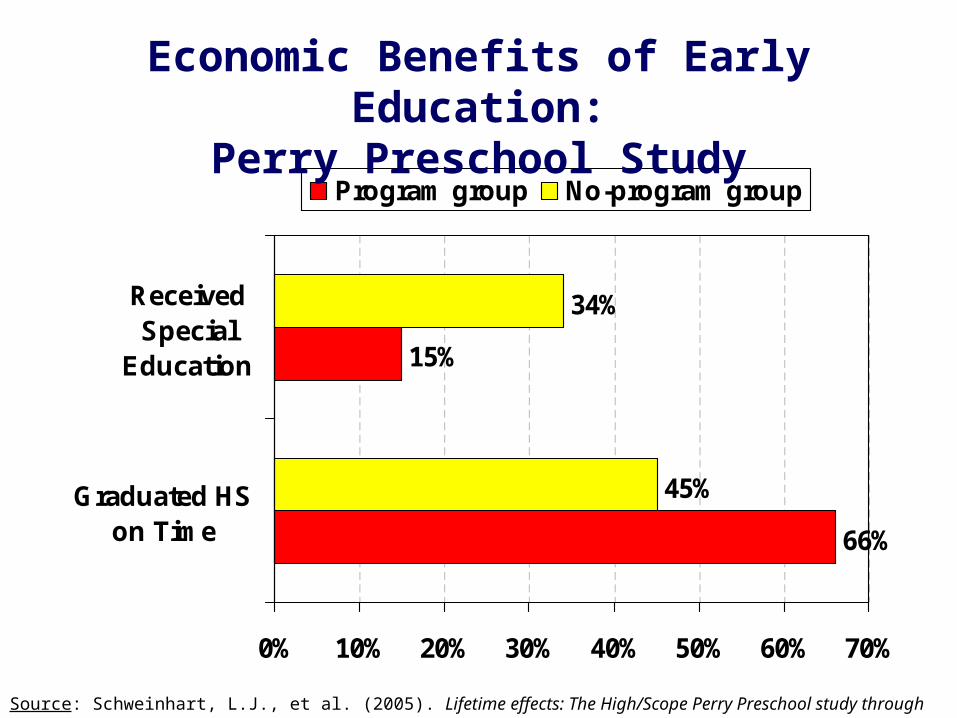
66%
15%
45%
34%
0% 10% 20% 30% 40% 50% 60% 70%
Graduated HSon Time
ReceivedSpecial
Education
Program group No-program group
Economic Benefits of Early Education:Perry Preschool Study
Source: Schweinhart, L.J., et al. (2005). Lifetime effects: The High/Scope Perry Preschool study through age 40.
Strengthening the Birth to Work Pipeline
KEY KEY ISSUE ISSUE
#1#1Early Life ExperiencesEarly Life Experiences
KEY ISSUE
#2Academic Achievement K-12
KEY KEY ISSUE ISSUE
#3#3Transitions to Work or CollegeTransitions to Work or College
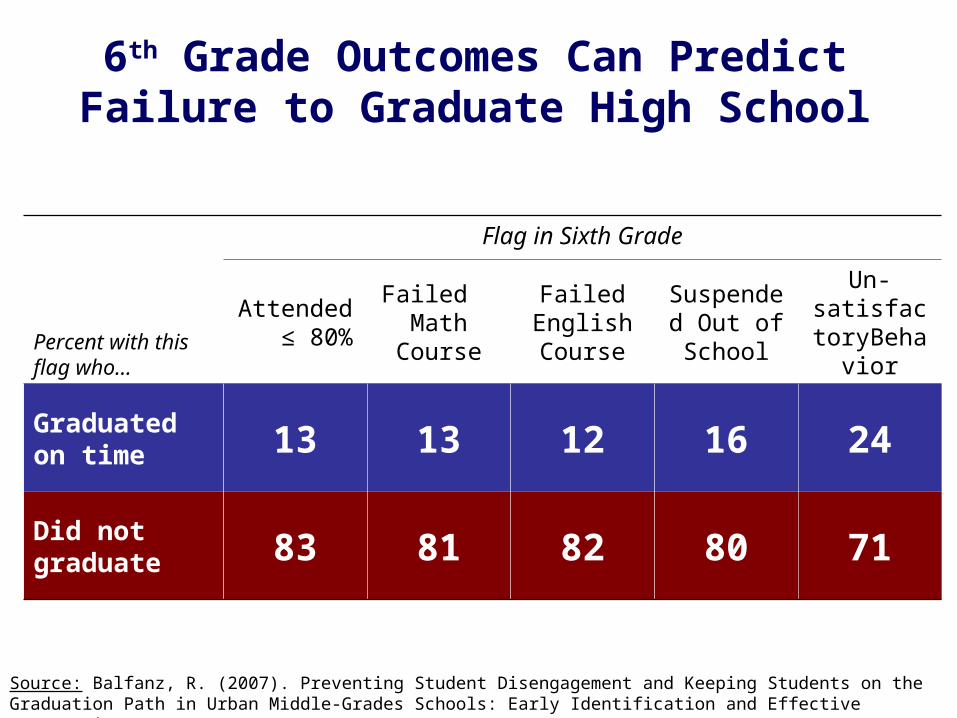
6th Grade Outcomes Can Predict Failure to Graduate High School
Source: Balfanz, R. (2007). Preventing Student Disengagement and Keeping Students on the Graduation Path in Urban Middle-Grades Schools: Early Identification and Effective Intervetions.
Flag in Sixth Grade
Percent with this flag who…
Attended ≤ 80%
Failed Math
Course
Failed English Course
Suspended Out of School
Un-satisfactory
Behavior
Graduated on time 13 13 12 16 24
Did not graduate 83 81 82 80 71
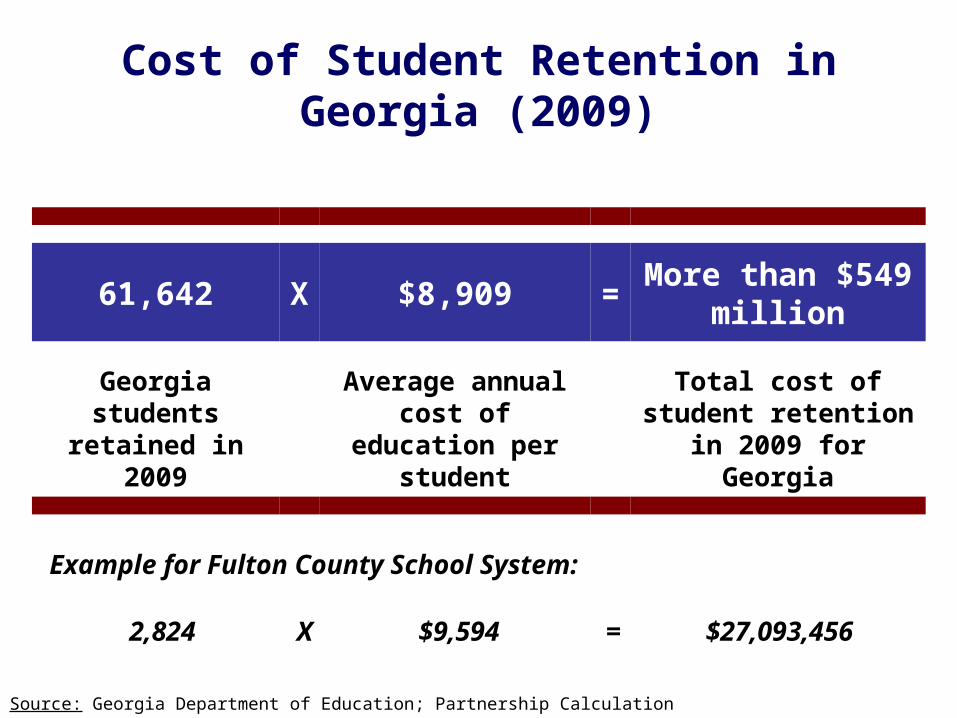
Cost of Student Retention in Georgia (2009)
61,642 X $8,909 =More than $549
million
Georgia students retained in 2009
Average annual cost of education
per student
Total cost of student retention in 2009 for
Georgia
Source: Georgia Department of Education; Partnership Calculation
Example for Fulton County School System:
2,824 X $9,594 = $27,093,456
Essential Building Blocks of High Performing States
Higher Standards
Rigorous Curriculum
Clear Accountability System
Statewide Student Information System
Leadership Training
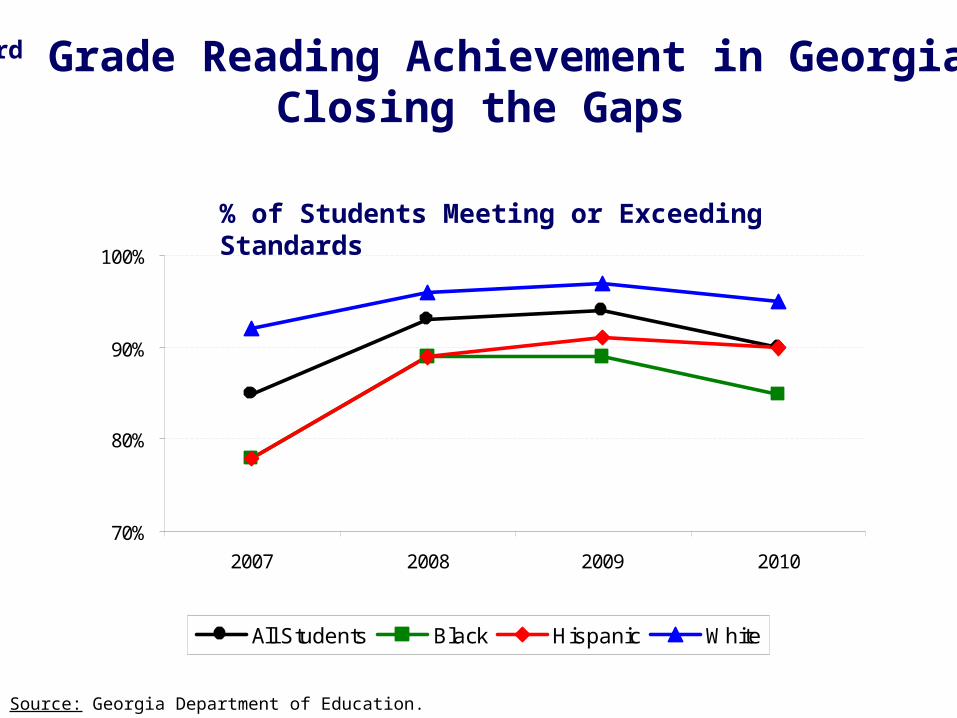
3rd Grade Reading Achievement in Georgia:Closing the Gaps
70%
80%
90%
100%
2007 2008 2009 2010
All Students Black Hispanic White
Source: Georgia Department of Education.
% of Students Meeting or Exceeding Standards
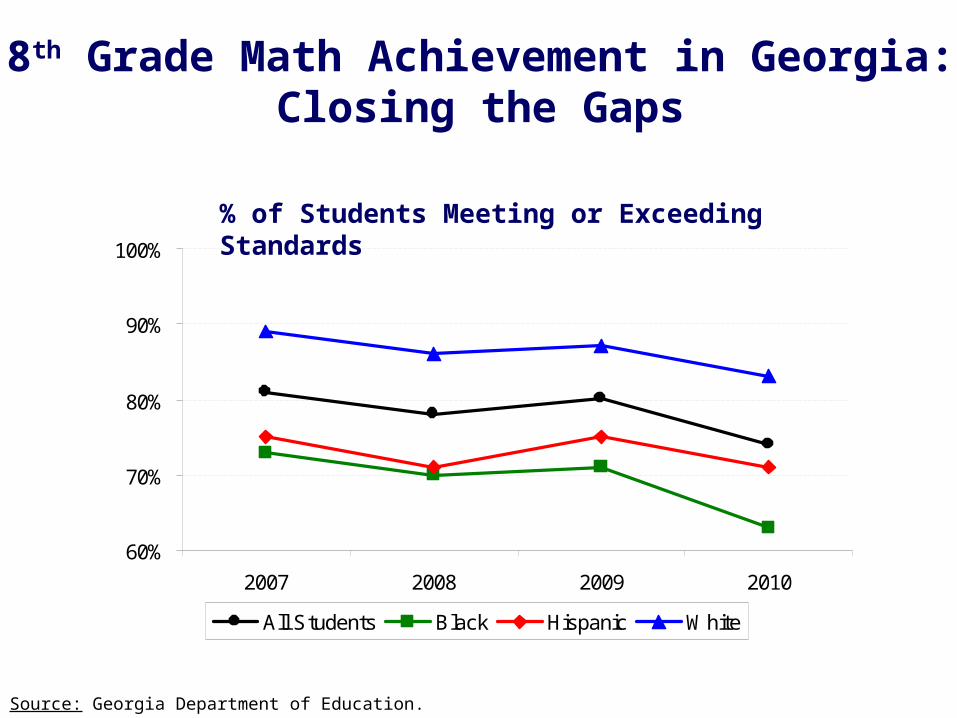
60%
70%
80%
90%
100%
2007 2008 2009 2010
All Students Black Hispanic White
8th Grade Math Achievement in Georgia:Closing the Gaps
Source: Georgia Department of Education.
% of Students Meeting or Exceeding Standards
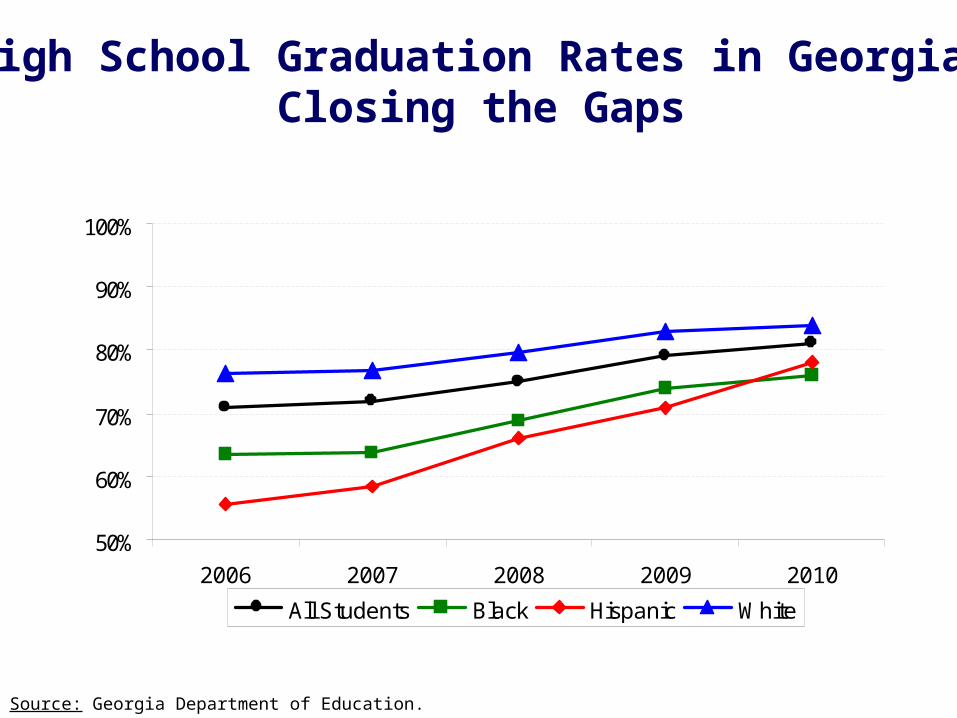
50%
60%
70%
80%
90%
100%
2006 2007 2008 2009 2010
All Students Black Hispanic White
High School Graduation Rates in Georgia:Closing the Gaps
Source: Georgia Department of Education.
Strengthening the Birth to Work Pipeline
KEY KEY ISSUE ISSUE
#1#1Early Life ExperiencesEarly Life Experiences
KEY KEY ISSUE ISSUE
#2#2Academic Achievement K-12Academic Achievement K-12
KEY ISSUE
#3Transitions to Work or College
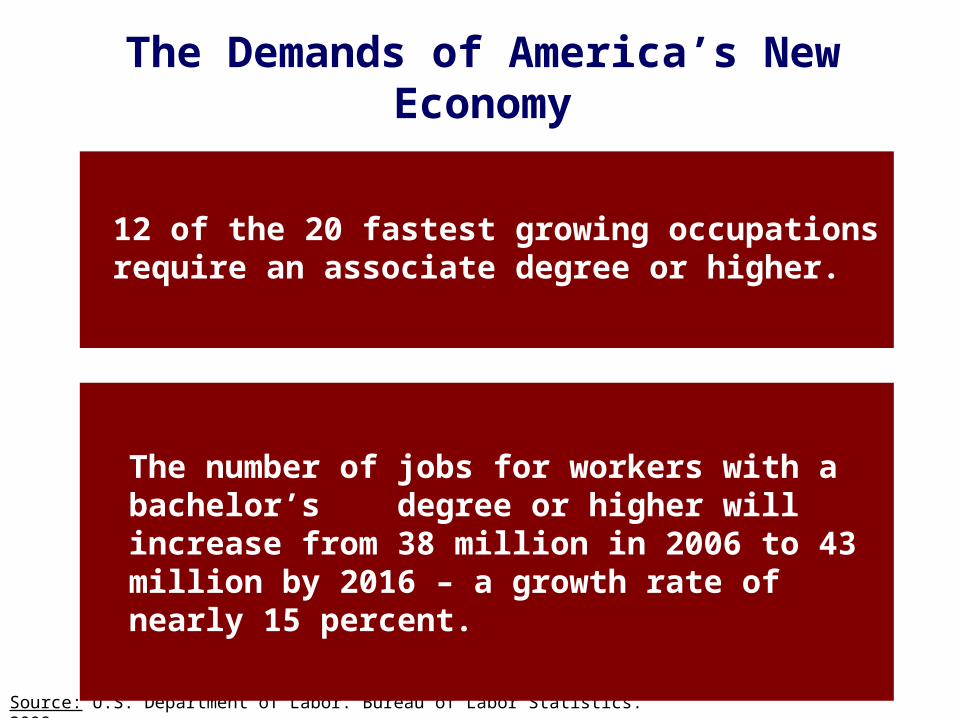
Source: U.S. Department of Labor. Bureau of Labor Statistics. 2009.
The Demands of America’s New Economy
The number of jobs for workers with a bachelor’s degree or higher will increase from 38 million in 2006 to 43 million by 2016 – a growth rate of nearly 15 percent.
12 of the 20 fastest growing occupations require an associate degree or higher.
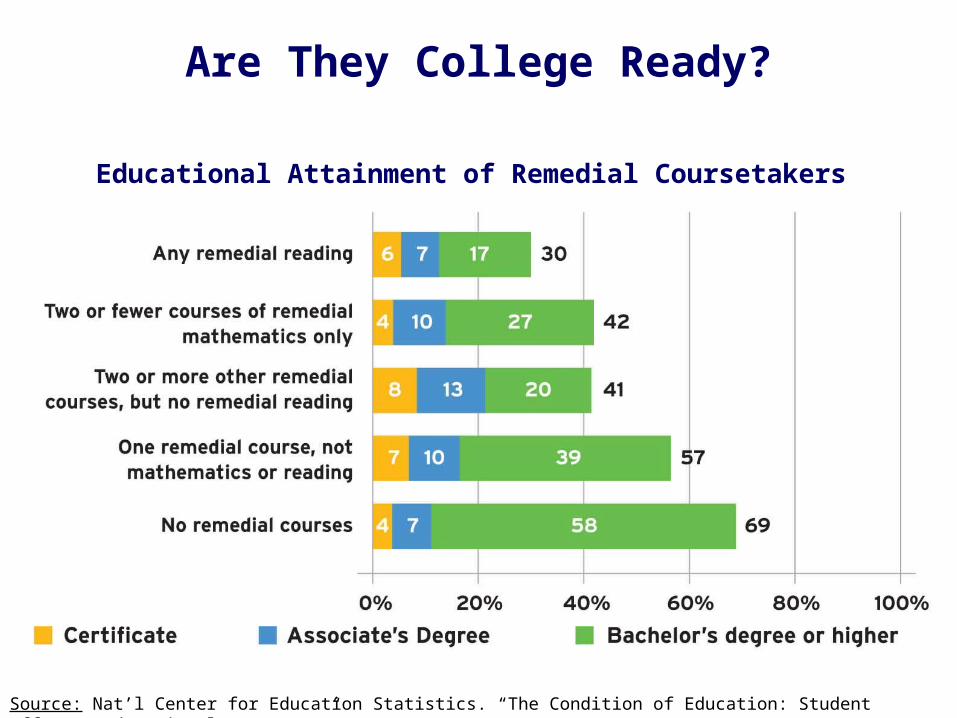
Are They College Ready?
Source: Nat’l Center for Education Statistics. “The Condition of Education: Student Effort & Educational Progress.” 2004
Educational Attainment of Remedial Coursetakers
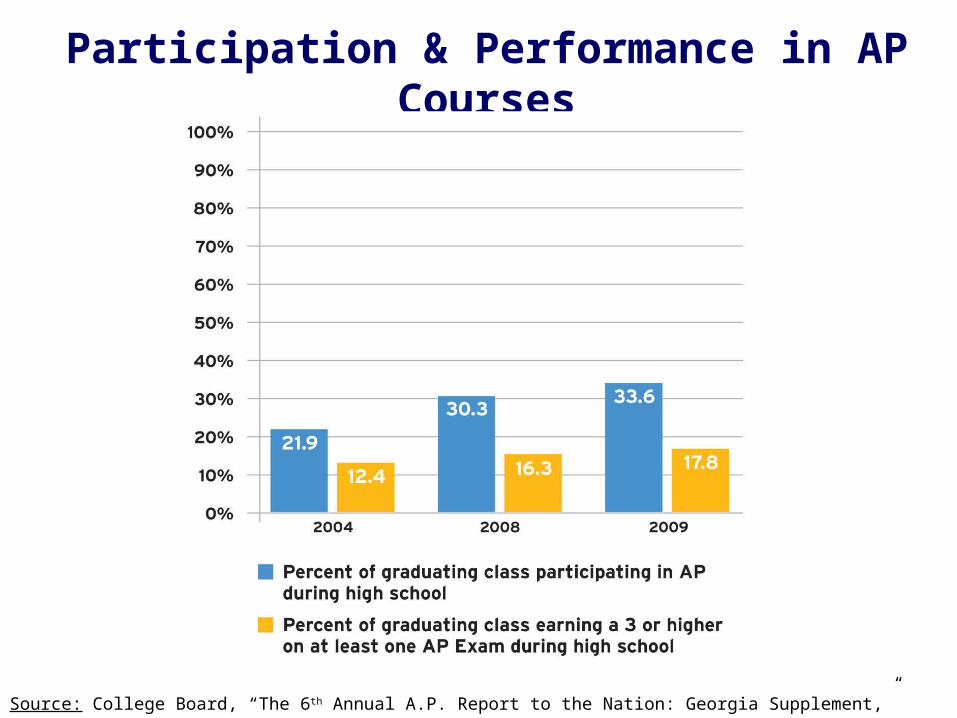
Source: College Board, “The 6th Annual A.P. Report to the Nation: Georgia Supplement,” 2010.
Participation & Performance in AP Courses

What Can We Do?
Look at the Data for your Community
KIDS COUNT Data
Georgia Family Connection Partnership
www.gafcp.org
School and System Comparisons
Georgia School Council Institute
www.georgiaeducation.org
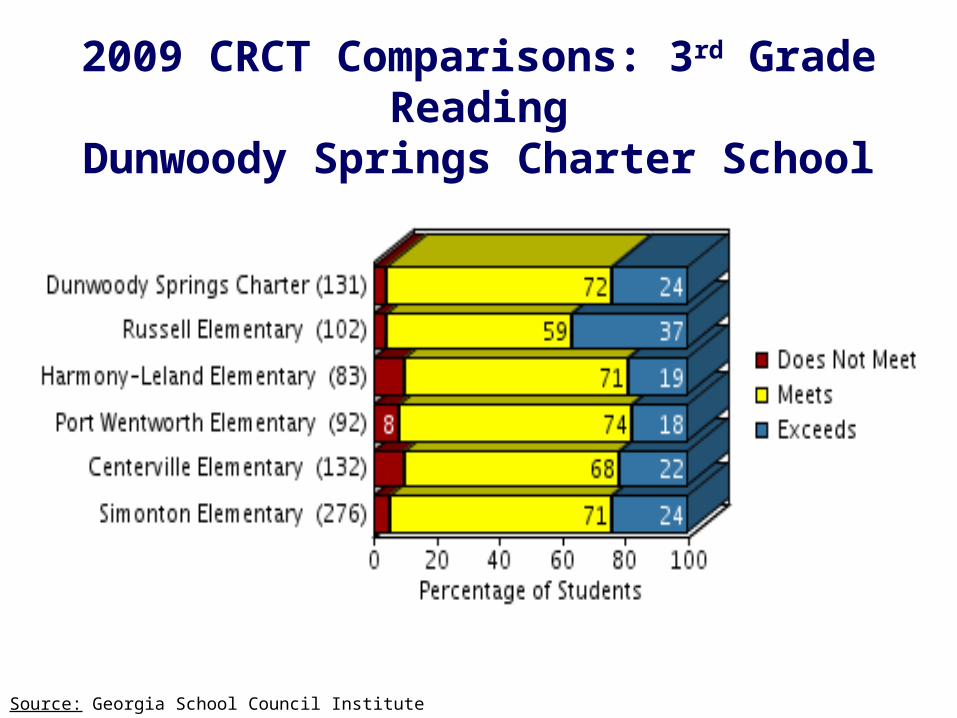
2009 CRCT Comparisons: 3rd Grade ReadingDunwoody Springs Charter School
Source: Georgia School Council Institute
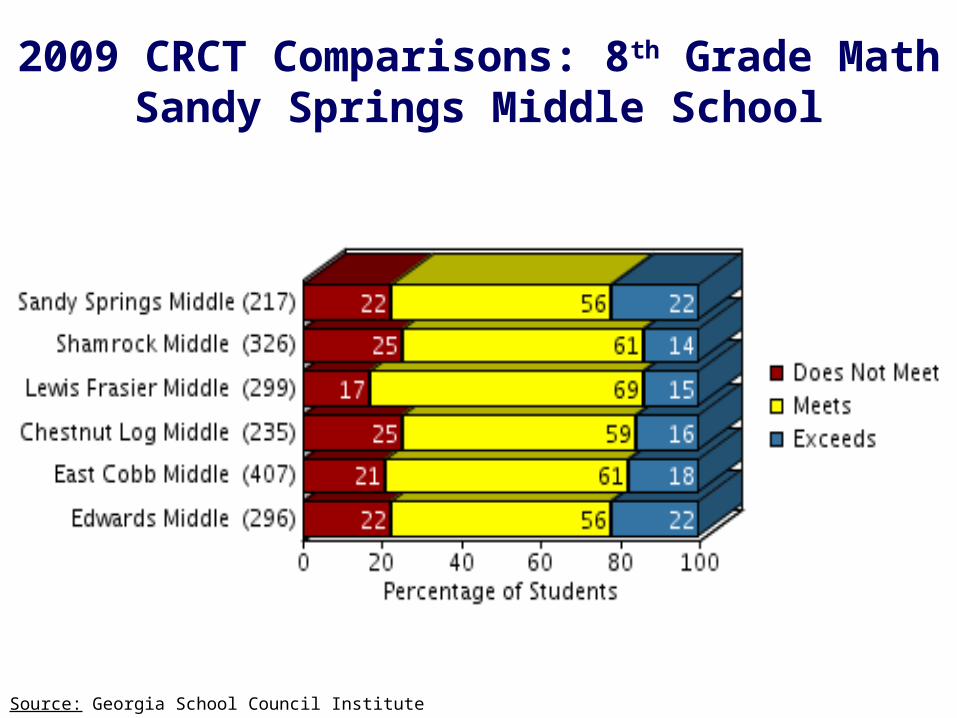
2009 CRCT Comparisons: 8th Grade MathSandy Springs Middle School
Source: Georgia School Council Institute
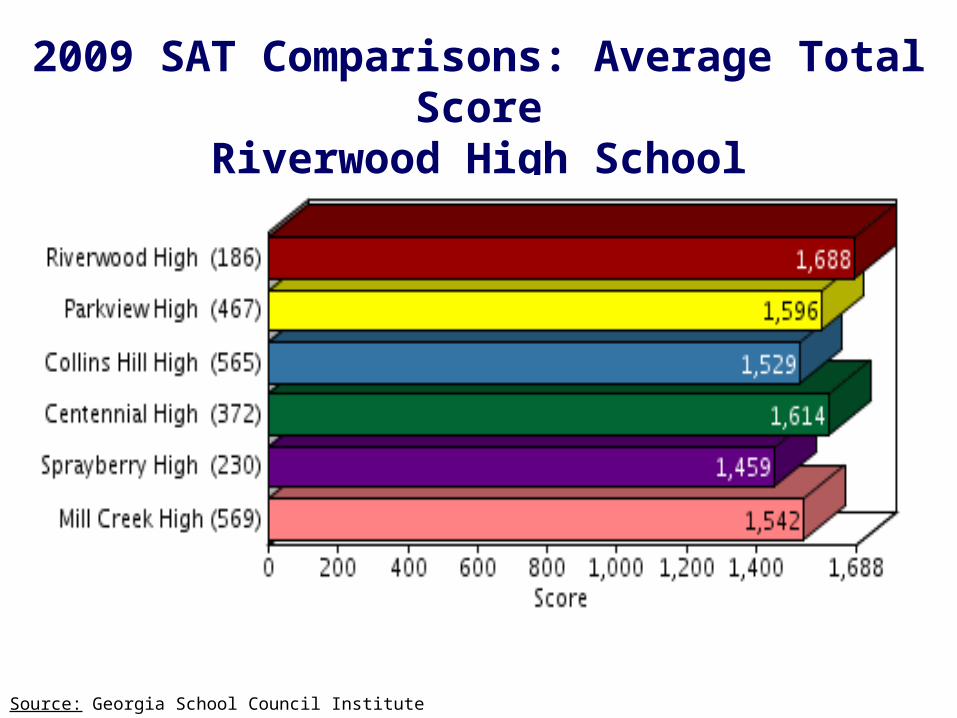
2009 SAT Comparisons: Average Total ScoreRiverwood High School
Source: Georgia School Council Institute
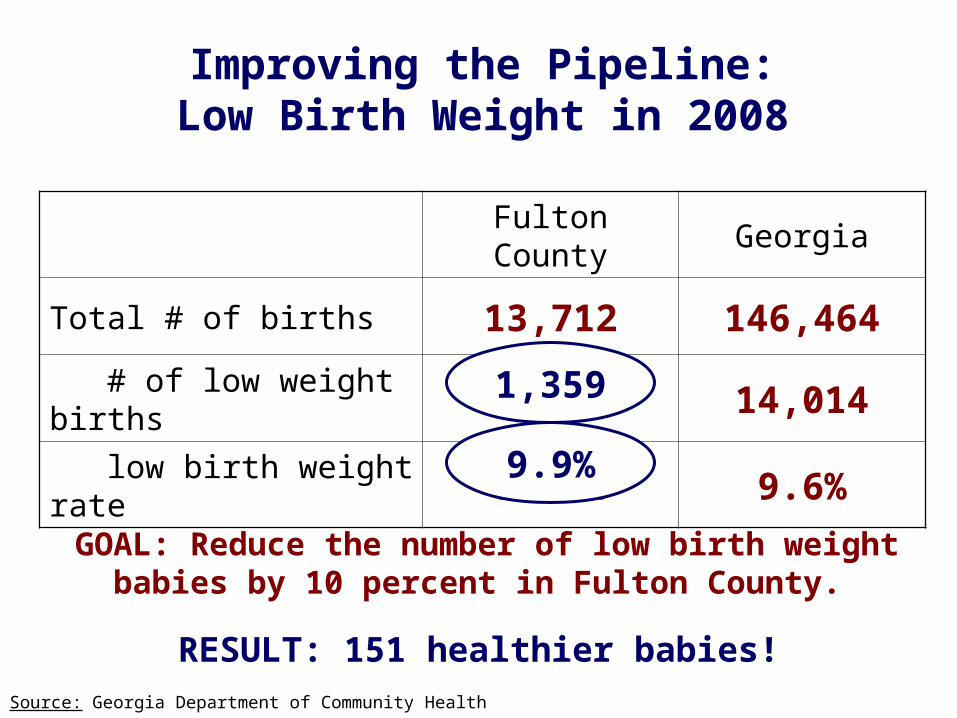
Improving the Pipeline:Low Birth Weight in 2008
GOAL: Reduce the number of low birth weight babies by 10 percent in Fulton County.
Fulton County Georgia
Total # of births 13,712 146,464
# of low weight births 1,510 14,014
low birth weight rate 11.0% 9.6%
RESULT: 151 healthier babies!Source: Georgia Department of Community Health
1,359
9.9%
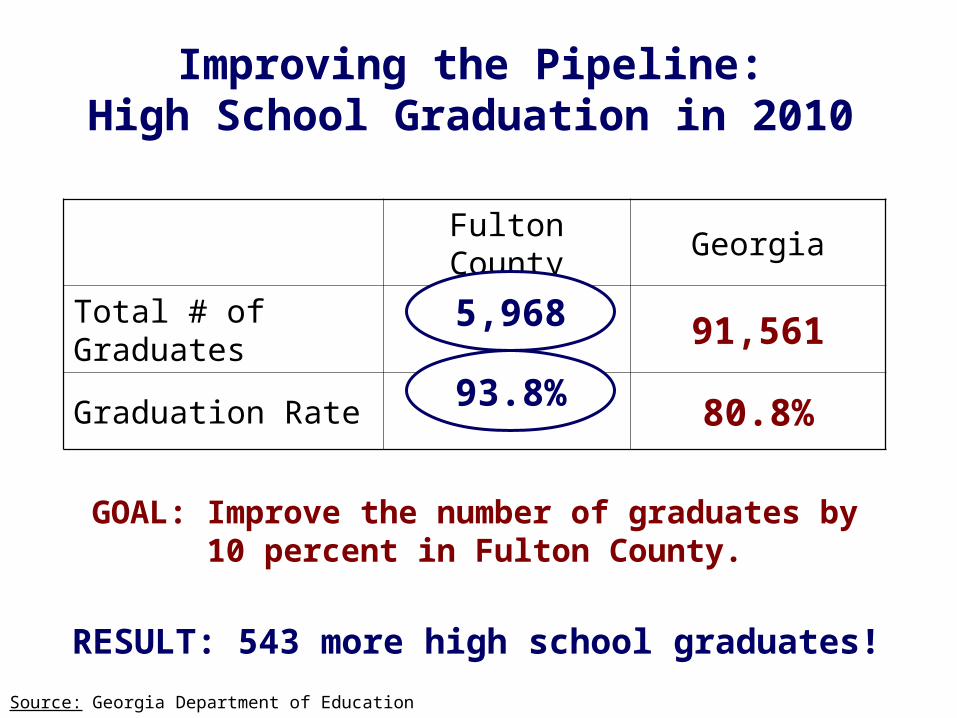
Improving the Pipeline:High School Graduation in 2010
GOAL: Improve the number of graduates by 10 percent in Fulton County.
Fulton County Georgia
Total # of Graduates 5,425 91,561
Graduation Rate 85.3% 80.8%
RESULT: 543 more high school graduates!
Source: Georgia Department of Education
5,968
93.8%
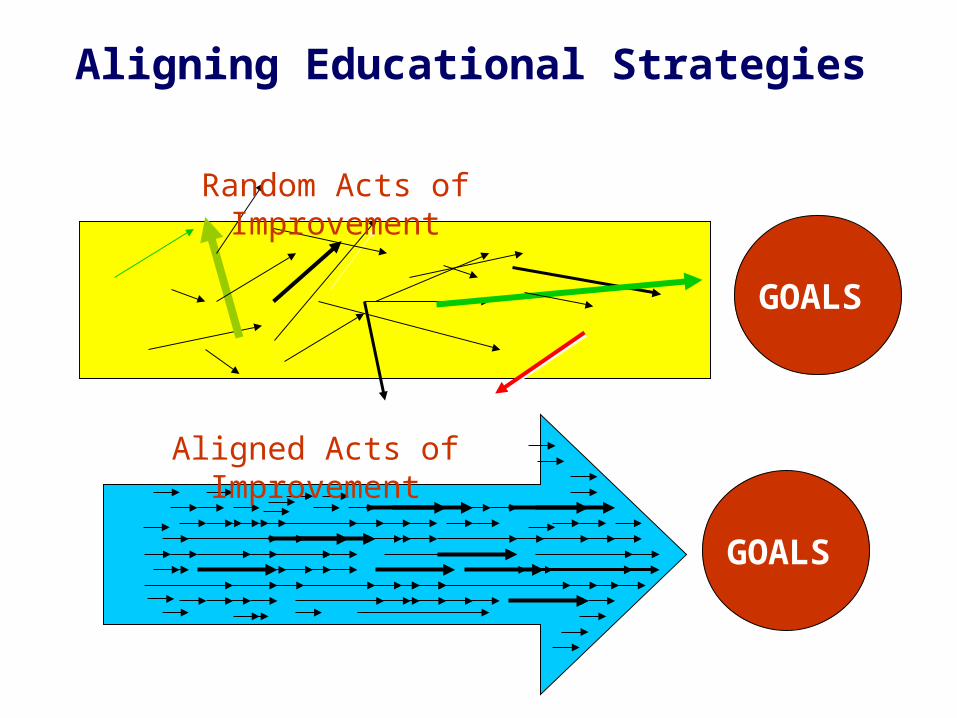
Aligning Educational Strategies
Aligned Acts of Improvement
Random Acts of Improvement
GOALS
GOALS
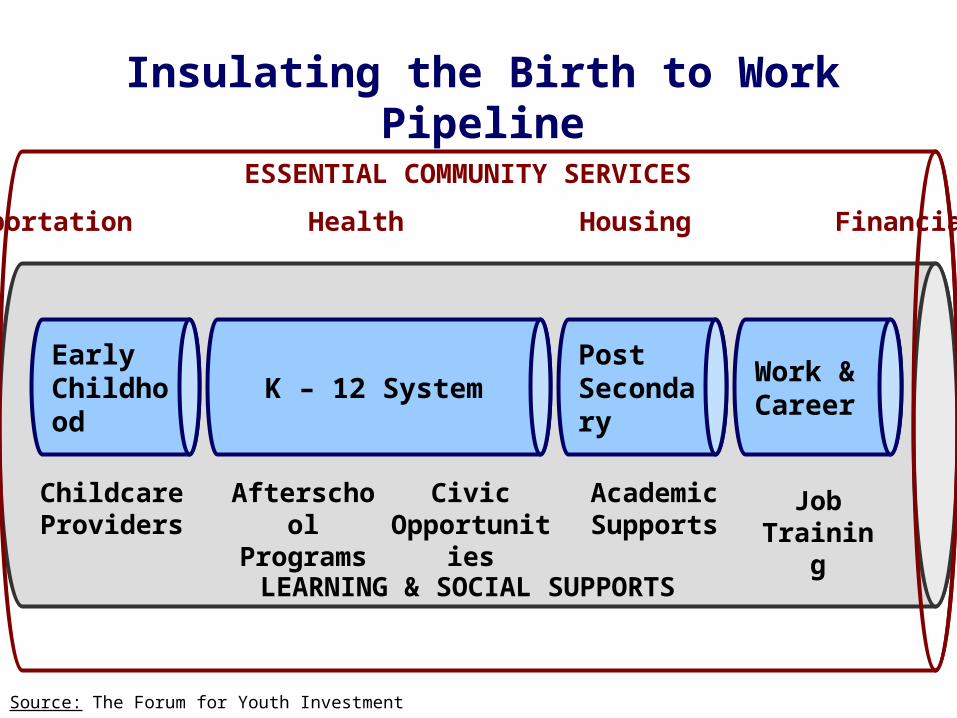
Insulating the Birth to Work Pipeline
LEARNING & SOCIAL SUPPORTS
Childcare Providers
Afterschool Programs
Academic Supports
Job Training
Civic Opportunities
Early Childhood
K – 12 SystemPost Secondary
Work & Career
ESSENTIAL COMMUNITY SERVICES
Transportation Health Housing Financial
Source: The Forum for Youth Investment
The Georgia Partnership is grateful to Georgia Natural Gas for its funding support.
Visit our website at www.gpee.org.


![I Georgia I Old sweet I Georgia GEORGIA ON the whole MY ...files.meetup.com/1338639/Georgia On My Mind [F] Pet.pdf · I Georgia I Old sweet I Georgia GEORGIA ON the whole MY MIND](https://img.pdfslide.net/doc/110x75/5b75d8c57f8b9ad8518df6a5/i-georgia-i-old-sweet-i-georgia-georgia-on-the-whole-my-files-on-my-mind-f.jpg)