Embed Size (px)
Citation preview

NASA Contractor Re
?'
//! ///z / -
r
ii
I
Lunar Dust T
Potential Inte
Power System
and
With
.ents
Cynthia M. Katzan and J(,ards
CONTRACT NAS3-25266
NOVEMBER 1991
C(:,',.p_NLNI5 Firlcl :;_..f)_r_ ('3v' r(.ru.:,
Technol -_'.;y) t_ 2 [., C$CL03 ;_,
,_I/VI
, ;.-L] _

!:
NASA Contractor Report 4404
Lunar Dust Transport and
Potential Interactions With
Power System Components
Cynthia M. Katzan
Sverdrup Technology, Inc.
Lewis Research Center Group
Brook Park, Ohio
Jonathan L. Edwards
Marshall University
Huntington, West Virginia
Prepared for
Lewis Research Center
under Contract NAS3-25266
National Aeronautics and
Space Administration
Office of Management
Scientific and Technical
Information Program
1991


Summary ........................................................................................ 1
Introduction ...................................................................................... 1
Properties of Lunar Dust ............................................................................. 1
Natural Mechanisms for Lunar Dust Transport ........................................................... 3
Dust Suspension Caused by Human Activity ............................................................. 4
Walking ........................................................................................ 4
Rover Operation .................................................................................. 6
Mining and Construction .......................................................................... 8
Spacecraft Landing ................................................................................. 8
Astronaut Observations on Descent ................................................................. 8
Apollo Erosion Scars .............................................................................. 9
Surveyor IIl .................................................................................... 11
Dust Accumulation From Spacecraft Landing and Launch ................................................. 17
Modeling Accumulation Distributions for Spacecraft Landing ............................................ 17
Independent Predictions of Particle Trajectories and Fluxes for Spacecraft Landing ........................... 20
Estimating the Effects of Spacecraft Launch .......................................................... 20
Scaling to Other Engine Thrusts ..................................................................... 21
Lunar Dust Accumulation With Time ................................................................ 21
Correlation of Dust Accumulation and Power Component Performance ....................................... 22
Radiator Performance ............................................................................. 22
Photovoltaic Array Performance ..................................................................... 24
Performance Penalties With Time .................................................................... 26
Implications and Alternatives ......................................................................... 26
Summary of Results ................................................................................. 27
Acknowledgments .................................................................................. 28
Appendix A--Symbols .............................................................................. 29
Appendix B--Lunar Particle Size Distribution ........................................................... 31
iii PRECEDING PAGE BLANK NOT FILMED

Appendix C--Modeling Relative Transmittance of a Dust-Covered Surfacefor Particles of Difference Sizes and Shapes ..........................................................
References ........................................................................................
33
35
iv
Summary
The lunar surface is covered by a thick blanket of fine dust.
This dust may be readily suspended from the surface and
transported by a variety of mechanisms. As a consequence,
lunar dust can accumulate on sensitive power components,
such as photovoltaic arrays and radiator surfaces, reducing
their performance. In addition to natural mechanisms, human
activities on the Moon will disturb significant amounts oflunar dust. Of all the mechanisms identified, the most serious
is rocket launch and landing. The return of components from
the Surveyor III provided a rare opportunity to observe the
effects of the nearby landing of the Apollo 12 lunar module.The evidence proved that significant dust accumulation
occurred on the Surveyor at a distance of 155 m. From
available information on particle suspension and transport
mechanisms, a series of models was developed to predict dustaccumulation as a function of distance from the lunar module.
The accumulation distribution was extrapolated to a futureltmar lander scenario. These models indicate that accumulation
is expected to be substantial even as far as 2 km from the
landing site. Estimates of the performance penalties associated
with lunar dust coverage on radiators and photovoltaic arraysare presented. Because of the lunar dust adhesive and cohesive
properties, the most practical dust defensive strategy appearsto be the protection of sensitive components from the arrival
of lunar dust by location, orientation, or barriers.
Introduction
The harsh lunar environment will provide many challenges
to the designers of a manned lunar base. Such challenges
include identifying and compensating for the biological effects
of low gravity, preventing ultraviolet (UV) degradation of
materials, preparing for temperature extremes, and protecting
against solar flares, meteoroid impact, and ionizing radiation.
However, despite their potential impact, relatively little
attention has been given to the consequences of operating a
manned lunar base in a dusty environment.After only hours on the lunar surface, the Apollo astronauts
observed that lunar dust was the source of certain aggravating
operational problems. They reported that it had the capacity
to get everywhere. The O-ring seals of their suit gloves andhelmets became "bogged down with dust," and dust interfered
with their mechanical pulleys and zippers (Apollo 12 Technical
Crew Debriefings, 1969). During the rover operations, cameras
became obscured, and rover batteries and radiators had to be
brushed clean at every stop (Morris, 1973). A color contrast
chart was dropped and rendered useless, because lunar dust
simply does not wipe off readily. For the Apollo Program,
lunar dust problems were troublesome but tolerable, and did
not severely jeopardize mission objectives.
However, to assure successful 30-yr mission capabilities
for a manned lunar base, the effects of lunar dust transport
must be given serious consideration during base design and
operations planning. Of the many dust-sensitive base compo-
nents, lunar dust accumulation may have the greatest impact
on critical power system surfaces such as photovoltaic arraysand radiator surfaces.
Photovoltaic and radiator surfaces are of particular interest
because they are vulnerable to the accumulation of lunar dust,
and they are critical in furnishing required power. The twomost likely candidates for a permanent lunar base power
source are photovoltaic array/regenerative fuel cell combi-
nations and nuclear reactors. Thus, the potential interferenceof lunar dust with the performance of these components will
pose significant implications on the lunar base configuration.
Even in the event that alternate power systems are developed
for the lunar base, the susceptibility of photovoltaic arrays
and radiators to dust accumulation will still be an important
issue. Temporary solar arrays may be deployed to power
operations until construction of a permanent power system is
complete, and radiators will have a significant role in any heat
rejection associated with the conditioning, distribution, andmanagement of power. The effects of dust on other sensitive
surfaces, such as windows, lenses, reflectors, and antennas,
may also be derived from an understanding of the effects of
lunar dust accumulation on power system surfaces.
After a brief description of lunar soil, this report presents
several mechanisms by which lunar particles may be suspended
from the Moon's surface. Of these, launch and landing are
expected to be the greatest threat to power system surfaces.
As such, they are the primary focus of this report. The
available evidence for dust suspension by spacecraft landing
is presented, and particle trajectories and accumulations are
estimated. Finally, the dust-related penalties in powercomponent performance are projected.
Properties of Lunar Dust
The surface gravitation on the Moon is about one-sixth that
on Earth--roughly 1.63 m/s 2. This is too weak to retain an

almosphere,exceptfortraceHe,H2,Ne,andAr,andevensmalleramountsofCO 2 and H20. The atmospheric pressureat the lunar surface was observed to be less than 8x 10⁻⁹ tort
during the Apollo 12 mission (West, Wright, and Euler, 1977).
Some of these gases are trapped in the soil during the cold
lunar night (100 K), and escape as the surface heats up from
the sun. At the hottest point of the lunar day, when the surface
temperatures peak at 400 K, the "atmospheric" concentradonof He is only 2×10³ atoms/era 3 (Taylor, 1975). The trace
gases, therefore, offer no protection against micrometeoroids,
solar wind, or cosmic and solar radiation.
The lunar "regolith" is the blanket of soil and rocks 3 to20 m thick that covers the lunar surface. Its components
range in size from very fine dust to enormous "blocks" that
have no observable organization into layers. Often solitary
rocks dot an expanse of fine soil. Approximately 70 wt % of
the regolith is composed of silty soil of particles less than1 mm in diameter (J. Graf, 1989, NASA Johnson Space
Center, Houston, TX, personal communication); 50 wt % of
the soil is finer than 50 _m (see fig. 1, taken from Smith
and West, 1983).
The size, morphology, and compositional mixing of the
regolith material are the result of complex natural comminution
(destruction) and agglutination (construction) processes
occurring over geologic time. These include meteoroid impact,
thermal cycling, creep, and solar wind erosion.The regolith is composed of several minerals that are also
found on Earth. Among the main minerals are familiar basaltic
components: plagioclases (mostly anorthite), olivine, and
pyroxenes. Other minerals, such as ilmenite, cristobalite, and
apatite, and natural metals, like Fe and Ni, are also observed.
In addition, as much as 20 wt % of the soil may be glassy
material, ranging in color from orange to green to black
(Morris et al., 1983). The relative amounts of these minerals
vary somewhat between the two main topographical regions:the mafia, or "seas," and the highland regions. 1 It is thought
that roughly 3.5 billion years ago fresh basalt flows covered
the mafia, causing the soil there to be richer in Fe, Ti, and
Mg--mostly in the form of ilmenite (FeTiO3), olivine
((Mg,Fe)2Si04), and other minerals. In contrast, the highlands
may contain as much as 60 wt % anorthite (CaA12Si2Os) ,whereas the maria may only contain 35 wt % (Inculet and
Criswell, 1979). The chemical compositions of typical soils
from the highlands and maria are compared in table I. Because
compositional variations are very localized, it appears that
there is little lateral mixing between regions (Papike, Simon,
and Laue, 1982).
The overall particle size range of lunar soil is shown in
figure 1. From this it can be seen that mare soils (Apollo 11
and 12), highland soils (Apollo 14), and material from the
mare-highland interface (Apollo 15) do not differ greatly in
overall particle size. However, some differences in com-
TABLE i.--TYPICAL LUNAR SOIL COMPOSITION
[Data taken from Morris et al., 1983.]
Major compositional Maria, a Highlands, b
elements wt % wt %
sio_TiO 2
AI203
Cr203FeO
MnO
MgOCaO
Na20
K20
40.09
9.23
10.70
.49
17.85
.24
9.92
10.59
.36
.08
44.2
.26
29.4
2.96
.6
16.30
.73
.11
aSoil 71060, Apollo 17.
bSoil 67710, Apollo 16.
position with particle size have been discussed by Papike,
Simon, and Laue (1972). Particles smaller than 10 lam tend
to be enriched in A1203, most likely because of the sus-ceptibility of feldspars (anorthite) to comminution relative to
olivine and the pyroxenes. For the same mason, this size
fraction is also enriched in CaO, Na20, K20, Th, and light
rare earth elements, while being depleted in Sc, MgO, MnO,
and FeO. From 10 to 90 I.an, the AI203 content decreases, but
from 90 to 1000 lam, the A1203 content again increases. Thisincrease is attributed to the abundance of agglutinates (welded
particle clumps), which are composed of very fine particles.
The concentrations of Sc, MgO, MnO, and FeO increase from
10 to 90 _rn and decrease from 90 to 1000 lam, accordingly.Because of the unusual erosion mechanisms on the Moon,
the particle morphology is unlike that which is usually found
on Earth. Lunar particles range in shape from spherical glass
beads to highly vesicular 2 agglutinates, largely because of the
lOO
80
t,_
2o
o.001 .01 .1 1
Particle size, mm
Figure 1.--Grain size distribution for lunar soil. Samples from Apollo 11,
12, 14, and 15 all fall within this band (Smith and West, 1983).
tThe near side of the Moon has both maria and highlands. The far side is almost exclusively highlands.
2"Vesicular" refers to a morphology much like lava rock, characterized by many pockets or cavities.
2

effectsofhypervelocitymeteoroidimpacts.Theseimpactsresultin particlecomminutionbycrushingandvaporizingparticlesinthetargetarea.Conversely,hypervelocityimpactsarealsoresponsiblefor vapor-andmelt-weldingparticlestogethertoformagglutinates.
Agglutinatesareaveryimportantcomponentofthelunarregolith.Asmuchas50or60percentofthesoilisagglutinated(D.S.McKay,1989,NASAJohnsonSpaceCenter,Houston,TX,personalcommunication),andconsequentlythreeorfourmineralsareusuallypresentineveryparticle.In addition,
agglutinates tend to have tortuous morphologies depending
on the size of their substituent grains. The result is an overall
soil equivalent surface area ratio of 60 (the average particle
has 60 times the surface area of a sphere of the same mass)
(Carrier, 1990). This high surface area affects such properties
as cohesion, compressibility, and shear strength.
Soils that have the highest fraction of agglutinates are termed
"mature." Maturity is quantified by the ratio of Fe metal toFe oxides (material with Fe:FeO < 30 is classified as immature,
30 < Fe:FeO < 60 as submature, and Fe:FeO > 60 as mature).
Because a mature soil has been more completely "worked" by
natural forces, its agglutinate chemical composition is closer
to the bulk composition than is true for immature soils. Also,in mature soils there is said to be a balance between
comminution and agglutination processes so that the particle
size distribution is at a steady state (McKay, Fruland, andHeiken, 1974).
Through various lunar soil mechanics experiments, it was
learned that lunar soil exhibits strong cohesive forces. The
main forces between lunar particles are van der Waals and
electrostatic interactions. Generally speaking, van der Waals
forces include attractions associated with permanent dipoles,
dipoles induced by an external polarity, and dispersion forces
(often called London-van der Waals dispersion) which arise
from instantaneous dipoles between neighboring atoms or
groups of atoms. Van der Waals forces generally predominate
over other forces for very small particles, such as those which
make up the bulk of the regolith.
However, electrostatic forces are also important because
the lunar soil is electrically insulating. The electrical conductiv-ity at 27 °C is in the neighborhood of 10 -13 to 10 -16 _-lml
from dc measurements (Strangway, 1969). (As a reference of
comparison, for polytetrafluoroethylene this value is roughly10 -16 _-lm-1.) Electrostatic forces are generally broken down
into classical coulombic effects and contact potential. Contactpotential is related to the difference in work function between
two materials in contact, which can induce electrons to move
from the higher work function material to the other. For lunar
soil, London-van der Waals dispersion forces and contact
potential are the dominating forces. The vacuum environment
of the Moon tends to enhance the magnitudes of both these
forces, because gas is not available to compensate charges.As a result, lunar particle cohesion has been estimated to be
roughly 0.035 to 0.05 N/cm 2 from lunar surface experiments
(Jaffe et ai., 1969). As an illustration, trenches carved
17.5 cm deep into the lunar surface retained vertical walls
without sliding (Scott, Robertson, and Clary, 1967). On Earth,
this degree of cohesion is often simulated with wet sand.The adhesion of lunar particles to a surface is driven by the
same types of forces. During the Apollo missions, adhesive
forces were observed to vary somewhat with the surface type,from roughly 0.01 to 0.1 N/cm 2 for metallic surfaces to about
0.1 N/cm 2 for painted surfaces. Lunar particle adhesion to
teflon is somewhere in between (Nickel and Carroll, 1972).
According to the Apollo astronauts, lunar dust clung
tenaciously to everything it contacted, and removal effortswere futile.
Natural Mechanisms for
Lunar Dust Transport
Because of the lack of atmosphere, particle suspension and
transport on the Moon do not occur by familiar terrestrialmechanisms. Two natural mechanisms have been identified
that are unique to the lunar environment and which may poten-
tially contribute to lunar dust accumulation on power surfaces.
The first is meteoroid impact into the lunar surface. Zook
et al. (1984, 1985) proposed that many lunar particles are
sprayed out as "secondary ejecta" with each primary meteoroid
impact. They correlated an anomalously high incidence of
small lunar impact craters (especially smaller than 7 prn) with
the showers of secondary ejecta. The number of these
secondary ejecta depends on the size and velocity of the
incoming meteoroid, but a single typical hypervelocity
meteoroid impacting at 20 km/s may eject 100 to 1000 times
its mass in secondary particles, depending on its angle (H.A.Zook, 1989, NASA Johnson Space Center, Houston, TX,
personal communication). The estimated cumulative primary
meteoroid flux is shown in figure 2, and the associatedsecondary flux is shown in figure 3 (data taken from West,
Wright, and Euler, 1977). According to these estimates, for
104 -"6
_" lo2
•"o E "c'-
• _="o o_ 100o.__
8t_.$ o 10-2
_Ec _
,0-6tO -- - " for 10-12<m-<10 -6 " - " "_
c_v
lO--8 I I I I I I10-12 10-10 10-8 10-6 10-4 10-2 100
Meteoroidmass, g
Figure 2.--Cumulative meteoroid flux at the lunar surface. (Equations taken
from West, Wright, and Euler, 1977.)

Particle
velocity,km/s
0110.25
1.00
Particlesize,10-2 10-I 100 101 102 103 104
1014
R'_Ect_ -_"6 • 1010
===_ _ 10a
¢__ 1060 ©'_"
10410-14 10-13 10-12 10-11 10-10 10-9 10-8
Particlemass,g
Figure 3.--Lunar secondary ejecta distribution. (Data taken from West,
WrighL and Euler, 1977.)
example, every square meter of the Moon's surface is impacted
by an average of 95 primary meteoroids, 1 ng or bigger, each
year. More than 30 million lunar secondary ejecta that are
1 ng or bigger are suspended with a velocity of 1.0 km/sfrom these primary impacts. (The lunar escape velocity is
2.3735 km/s.) From figures 2 and 3 it is possible to extrapolate
that roughly 10-7 and 10 -1 g/m2-yr of material is transported
through primary and secondary ejecta, respectively. Though
relatively infrequent, the effects of secondary, and therefore
also primary, impacts could contribute to the accumulation of
dust on surfaces over the 30-yr lifetime of a lunar base.The second natural mechanism for suspending lunar dust is
an electrostatic effect at the Moon's sunset terminator (the
boundary between the lit and unlit sides of the Moon). This
effect has been proposed by Criswell and his colleagues as an
explanation for a phenomenon known as "horizon glow": a
thin, bright streak traces the horizon in photographs of thelunar sunset. This streak is attributed to the diffraction of
light off a low cloud of lunar particles. According to Criswell(1973) and Pelizzari and Criswell (1978), soil particles on the
sunlit side near the terminator become positively charged
because of the photoelectric effect from solar UV radiation.
These charged particles hop up and over to the dark side ofthe terminator, where some of the photoelectrons have
accumulated. The result is a "churning" of soil as the terminator
progresses across the Moon, with particles hopping 3 to
30 cm from the lunar surface. By this theory, a projected300 g/m 2 of lunar soil is electrostatically levitated each year.
This rate of transport was estimated to be roughly 6x10⁷
greater than the rate of primary meteoroids, and 2x10⁵ times
greater than the rate of secondary micrometeoroids (Rermilsonand Crisweli, 1974), consistent with the accumulations derived
from figures 2 and 3. 3
The effects of these natural dust-suspending mechanisms
may be potentially serious to power components on a lunarbase. They are eternal processes and geographically wide-
spread; their sources fall outside human control. Moreover,
additional natural mechanisms may exist that have not yet
been observed, but which will also contribute to dust suspen-
sion. However, compared with those mechanisms asso-
ciated with human activity on the lunar surface, the effects of
natural dust-suspending mechanisms appear decidedly minor.
Dust Suspension Caused
by Human Activity
Four areas of human activity have been identified which are
potentially threatening to dust-sensitive power surfaces. These
activities are predicted to locally suspend substantially greateramounts of dust than natural mechanisms. Although it is cer-
tain that these activities will be standard to lunar base operation,
their extent and frequency are subject to base objectives and
design. The dust transported by human activity will be dis-cussed in order of increasing severity.
Walking
The fast human-related mechanism is simply walking on
the lunar surface. The Apollo astronauts indicated that this
was not accomplished in the same manner as on Earth--
instead, in low gravity and with large protective boots,
walking is rather a side-to-side wobbling with occasional
shuffling. This is inevitably accompanied by the kicking ofthe fine lunar material, either forward or to the side. Because
there is no atmosphere, the majority of the particles move in
fan-like sprays, spreading out from the boot at an angle
corresponding to the kick direction. This effect can easily beseen on video footage of the astronauts' lunar walks. In fact,
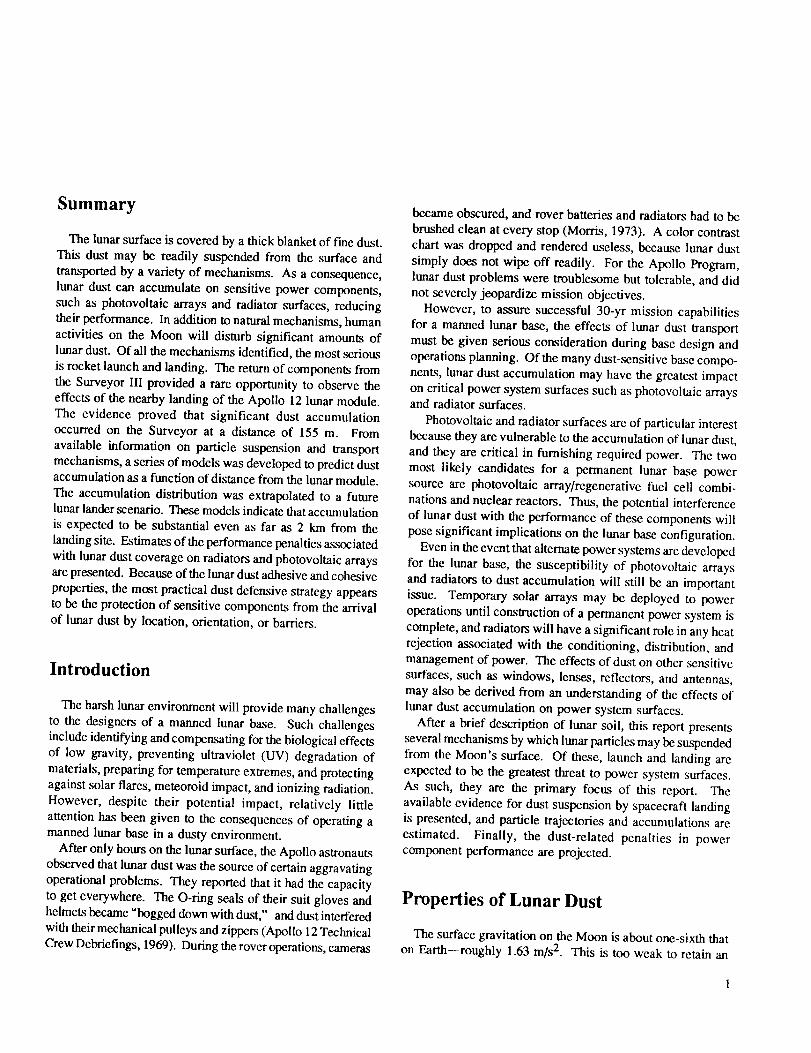
each astronaut acquired substantial coverage on his leggings
from the dust sprays of the other astronaut (me fig. 4).
Assuming Earthlike mobility and a normal pace of 4 mph
(1.8 m/s), the boot velocity in a normal walking kick might be
on the order of 3.6 m/s. Space suit design may evolve tomatch this degree of mobility, and therefore the resultant
particle sprays could reach comparable speeds for each hobble
•l'he electrostaticlevitation of dusthas also been suggested by the Lunar Ejecta and Meteorite(LEAM) experimentdeployedby Apollo 17. A conspicuousincrease in the particle event rateoccurs with each lunation, lasting roughly 70hr. Although the actual electric potentials across the terminator are stillunknown, preliminarylaboratory experimentshaveeonftrmed that such levitation is possible with charged gold particles (Rheo, Berg, and Woff, 1977).
Alternative explanations of this phenomencttare few. One that may be worthyof mention is the reflection off raisedlandscapefeatures which are located onthe "dark side" of the terminator but whichstill receive the low angle light from the setting sun because of their height (Allen, 1969).
ORIGINAl: PAGE
BLACK AND WHITE PHOTOGRAP_I
Figure 4.--Photograph of Apollo astronaut Conrad inspecting the Surveyor III spacecraft. The lunar module is visible in the background. The astronaut's
leggings and gloves are covered with lunar dust from activities on the Moon's surface (AS12-48-7133).

and shuffle. The disturbed particles will experience pure
Newtonian motion, independent of size or shape. The
maximum range will be achieved by those particles kicked at
45 ° , according to simple projectile mechanics:
v02sin 2_range = (1)
g
where v0 is the initial particle velocity, ¢p is the ejectionangle with respect to the surface, and g, the lunar surface
gravitation constant, is 1.63 m/s 2. (A complete symbols list
is provided in appendix A.) The maximum particle height is
determined when the initial motion is entirely vertical (that is,
when the vertical component of the initial velocity, V0y, equals
v0), and it is solved when vertical velocity, vy(t), is zero:
vy(t) = Voy -gt=O t = v°y = 2.2 s (2)g
where t indicates time in seconds;
y=Voyt-g-_--_2 =4 m (3)
This range and height are considerably greater than observed
on Earth, since there are not enough gas molecules to moderate
lunar particle trajectories. Perhaps the most important concernabout walking is that it will be a close-range source of lunar
dust for sensitive power components. The construction,
maintenance, and repair of power facilities will all require
some degree of direct astronaut contact. Consequently, the
dust accumulation may be directly related to the self-sufficiency
of the power facilities.
Rover Operation
The lunar roving vehicles are likely to disturb significantly
more lunar dust than walking. In low-gravity experiments,
the amount of dust produced by the slow turning of a roverwheel in simulated lunar dust was extensive (Mullins, 1971-
also see the associated videotapes in the Washington National
Records Center, roll # 0-2890-91,92, 93, accession # 255-80-
0901, location 03-07-04-2- I, box I 1, cans 103-105, 108, 109).
From these studies, it was determined that dust is not just cast
out the back of the wheel, but also gets carded over the wheel
and "poured" off the front, sprayed out the side, tumbledthrough the mesh wheel, and bulldozed before the wheel.
When there is no slip between the wheel and soil, the greatest
velocity is attained by those particles hurled off the top of
the wheel. Their net velocity is the summation of the veloc-
ity vector associated with the wheel's rotation Vrot and the
translational velocity vector Vtrans, which each have the
magnitude and direction of Vrove r. The Apollo lunar roverswere designed to travel at a maximum of 3.56 m/s (8 mph)
(Baker, 1971) so these particles have speeds of up to7.12 m/s in the forward direction. If for some reason such a
particle were to have an elastic collision with another rover
component at an oblique impact angle of 45 °, it can be shown
that the particle's direction would be changed to 45 ° from the
horizontal, with no loss in magnitude. The 45 ° trajectory will
yield the maximum horizontal distance, and therefore theparticle could travel as far as 31 m (103 ft) from the wheel'sinitial location.
By far, however, the bulk of the disturbed dust is ejected inthe form of a characteristic "rooster tail." In this discussion
a fenderless wheel will be assumed in order to demonstrate
the potential for dust transport, and thus the importance of
careful fender design. Through simple laws of projectile
motion, and assuming no slip, it can be shown that the particles
that make up this plume are actually moving forward with therover, and not "backward." In other words, the sum of the
rotational and translational velocity components always has a
positive ._ component:
Vtotal =- (Vrot -_ Vtrans )3_ + (Vrot)) _
----(Vrove r COS{_) + V r.... )._ + (Vrove r Sil'l{_)f2
(4)
For these calculations, the positive ; direction is the direction
of the rover's motion, and 0 defines the point on the wheel atthe instant when the particle is released. 4 The distance traveled
by an ejected particle is a fimction of O:
x--2(Vrovo,)2(1-cosO)(sinO)g
(5)
This distance is measured from the wheel's instantaneous
point of contact with the lunar surface when the particle was
ejected. The vertical and horizontal positions of the particle
at the instant of ejection relative to this origin are neglected.
Consequently, dust particles ejected at angles beyond 180 °
are not projected.
Figure 5 shows particle distance versus wheel angle O at
ejection. The maximum distance is attained by particles
ejected when O equals 120 °. These particles actually travel
20.4 m (67 ft), landing ahead of the rover. Such particlescould become a threat when a rover drives toward a solar
array or radiator structure. The accumulation of dust at different
distances is difficult to establish. However, assuming particles
ejected at all O with equal frequency (a gross simplification),
it is reasonable to expect the accumulation distribution
to be inversely proportional to the derivative, dr/dO, of
4Note that O does not necessarily correspond to the ejection angle. The ejection angle results from the sum of the vectors associated with rotational and
translational motion.
25 _
v ,
E 20 - Vlrans_ _-_
10 -G,0¢,-
s"O
0 30 60 go 120 150 180
Wheel angle at ejection, 0, d_j
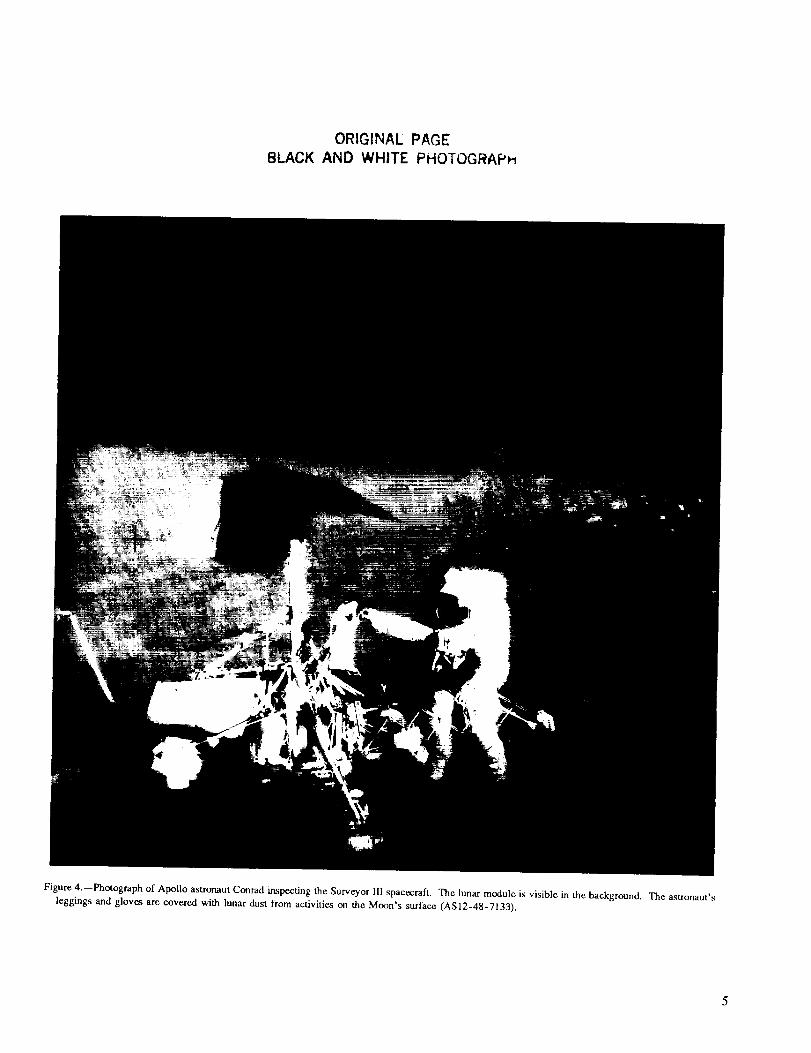
Figure 5.--Predicted distance traveled by particles ejected at va_s angles
by a fenderless lunar roving vehicle moving at 3.56 m/s.
equation (5). That is, the greater the change in distance
between falling particles for a given change in ejection angle,
the lower the accumulation at that distance. Thus the dust
accumulation distribution N(O), in mass/area, is given by
(6)
The distribution N(O) has been converted to N(x) and plotted
in figure 6. As can be seen, a large number of particles land
both in the vicinity of the wheel, as well as at a distance of
20.4 m ahead of the wheel's original location. Physically, this
occurs because at O = 0 ° dust particles have no velocity and
because at O = 120 ° (corresponding to dust projected 20.4 m)
there is great insensitivity to ejection angle. With a more real-
istic ejection distribution, the dominance of these particles in
the accumulation distribution will be tempered. Nevertheless,
O.
"5
c
ell
tr
\I I
0 2 4I I I I I I I6 8 10 12 14 16 18 20
Distance from site of ejection, m
I22
Figure 6.--Predicted particle accumulation distribution as a function of dis-
tance from the site of ejection from a f_nderless lunar rover wheel movingat 3.56 m/s. A uniform ejection distribution has been assumed. At most,
particles travel 20.4 m in the forward direction when there is no slip.
E
Eg
"O
t_o.
OO
e-
8 E Vrot = Vlotal _-_6
7-2
-4-
xo/-8 I_1 I I I I
0 30 60 90 120 150 180
Ejection angle, O,deg
Figure 7.--Predicted distance traveled by particles ejected from a fenderless
rover at various wheel angles, assuming 100-percoat slip on the lunar
surface. In this example, the wheel rotational velocity has a magnitudev = 3.56 rn/s.
this illustrates the extreme importance of proper fender
design, and may impact the selection of solar or nuclear
power for surface vehicles.
In Apollo video footage of a "test drive" of the rover on the
lunar surface, the dust sprays were particularly dramatic during
sharp turns and bounding on rough terrain. These dramatic
sprays occur when there is momentary slip between the wheel
and surface. Under such conditions, the rotational component
of motion may make up as much as 100 percent of the motion
transferred from the wheel to the particle. In the case of
100 percent slip (100 percent rotation and no translational
motion), particles leaving at a wheel angle between 0 ° and
90 ° do indeed travel backward, and those leaving at O greater
than 90 ° move in the forward direction. Distance is maximized
when O is 45 ° or 135 ° (see fig. 7). If it is assumed that the
magnitude of the rotational velocity vector is on the order of
3.56 m/s, particles can travel up to 8 m (26 ft), backward or
forward. It is more likely that during "free-wheeling" the
rotational velocity is considerably greater. In a manner similar
to that discussed earlier, the accumulation distribution is related
to the inverse of the change in distance with ejection angle
(see fig. 8). This profile is dominated by those particles
ejected at 45 ° and 135 ° when a uniform ejection distribu-
tion is employed. However, the accumulation distribution is
expected to reflect a greater number of short-distance tra-
jectories when the ejection distribution is skewed to smaller
angles, where fender design is critical but difficult.
The ejection of dust by moving vehicles appears to be
inevitable, because of the coarse terrain and the overwhelm-
ing presence of dust. The use of surface vehicles in facility
maintenance and general base transportation may often bring
this source of suspended dust dangerously close to power
components. The extent to which the next generation of lunar
rovers disturb dust depends in part on their design, but perhaps
even more critically on their role as an integral part of base
operation.
7

-o
O.
"6
.ga
E¢:
"41:=
tr
I
JI I I I I
-8 -4 -2 0 2 4 6 8
Distancefrom originalposition,m
Figure 8.--Predicted particle accumulation distribution as a function of
distance from the site of ejection from a fonderless lunar rover wheel
spinning at 3.56 m/s with 100-percent slip. A uniform ejection distribu-
tion has been assumed. At most, particles travel 8 m in the positive and
negative x direction.
Mining and Construction
Mining and construction will also be important contributors
to dust suspension on the Moon. Their effects may be themost difficult to assess for several reasons: (1) The actual
resources to be mined and the methods for doing so have not
been established; (2) the building types proposed thus far
range from "habitrail" units transported from Earth to buried
inflated bubble chambers covered with lunar sandbags; and
finally, (3) many subactivities are involved in both mining
and construction. However, it can be assumed that large,
powerful, but slow-moving, vehicles will be employed with
the versatility to accomplish several different tasks. These
vehicles will probably not attain the speeds of the rovers orhave great agility, so particle speeds are not expected to
exceed 7.12 m]s. However, their main functions will be mass
manipulation of lunar soil, and thus dust disturbance is
guaranteed. Between mining and construction, there will
likely be much "earthmoving," digging, dumping, andtransporting of soil. Mining may be reserved for remote
areas, but the refining and processing may need to be performed
near sources of power, and enormous loads of lunar material
will need to be transported in and out of the vicinity of power
facilities. Construction may be a continual process as the
lunar base evolves. It will include clearing obstructions in
new areas and constructing habitats, laboratories, processing
plants, storage warehouses, and the power facilities themselves.
Multibody collisions may enable some fractions of small
particles to reach high velocities, and therefore also great
distances, unlike on Earth where atmospheric drag quickly
slows down such fast, small particles. Dusty as a terrestrial
construction site is, a lunar construction site or mining area
will be considerably worse because of the unchecked travel ofparticles under vacuum and the weaker surface gravity.
Spacecraft Landing
Perhaps the single most significant human activity that
suspends lunar dust is the ascent and descent of spacevehicles at the lunar surface. A recent study estimated that
approximately 48 missions from Earth (manned and
unmanned) will be necessary to establish a lunar base over
6 yr (Lunar Base Launch and Landing Facility Conceptual
Design, 1988). In addition, planners forecast that a trip will
be required at least every 6 mo to satisfy the maintenanceneeds of base facilities and personnel. These trips could sum
to more than 108 landings and 108 launches during the 30-yr
lifetime of a lunar base. According to the observations of the
Apollo astronauts (discussed next), the amount of dust
produced on landing is enormous. The possible dust problems
associated with spacecraft launch and landing on the lunar
surface are thus of primary concern.
Astronaut Observations on Descent
The reports of the Apollo missions hold some very valuableinformation regarding the dust disturbed by the landing of the
lunar module (LM). During the first two lunar landings, the
Apollo astronauts were amazed by great sprays of dust on
descent (Apollo 12 Technical Crew Debriefings, 1969). First
observed by Apollo 11 astronauts at about 25 m (82 ft), the
streaking dust eventually resulted in a total loss of visibility
by 2.7 m (9 ft) (Scott et al., 1970). This effect was sodisorienting that later Apollo missions incorporated a quicker
descent with a translational motion to maintain visibility (see
fig. 9). Nonetheless, both Apollo 12 and 14 astronauts first
observed dust at 33 m (108 ft) from the lunar surface (Mitchell
et al., 1971). Actually, the dust easily reached 37 m if the
4-m distance from the LM observation windows to the footpadis included.
With the use of simple Newtonian projectile theory, the
minimal initial velocity roy of these fhst particles can beestimated for the particle elevations observed. The initial
velocity is
v0,:_ =llm/s (7)
where g, the lunar surface gravitation constant, is 1.63 m]s 2,
and Ymax is 37 m.It may be assumed that other particles are traveling with
angled trajectories whose vertical component was initially
11 m/s. The maximum horizontal distance achieved by those
particles moving at 45 ° would be
x= _xlv0yr-x_/212/sin 2_ = 148.5 mg
(8)
Consequently, when dust streaks are first at 33 m, a dust cloudexists below which is at least 297 m in diameter.

15
I [] Apollo11© Apollo12A Apollo14 ..-- Streakingfully
/:I / developedlO
E _ "_//I-- Loss of visibility
,/.N
;2 Probe shadow
s P,obe Lossof ]/ snaoow visibility-7 r_
I I I0 5 10 15
Horizontaldistance,m
Figure9.--A comparisonof the final approachprof'desof the Apollo 11, 12,and 14 lunar raodules. Dust was fLrStobserved on the Apollo 1| at25 m (64 s before touchdown), and on the Apollos 12 and 14 at 33 rn(52 and 44 s before touchdown, respectively). The Apollo 14 was ableto maintain visibility through touchdown (Mitchell et al., 1971).
As the LM continues to approach the surface, the engineblast focuses on a smaller and smaller area of soil. The dust
particles reach greater velocities and, therefore, greaterhorizontal distances.
Although the laws of pure Newtonian motion are indepen-dent of particle size, particle ejection may be size-dependent.
Any size sorting of lunar dust particles occurs in the momen-
tum transfer between the exhaust gases and soil, and in the
complex aerodynamic processes in the turbulent exhaust zone.
Therefore, it might be reasonable to expect that larger parti-
cles do not travel as far or attain the velocities of very small
particles. Once the particles are clear of this zone and exper-
ience only the vacuum of the lunar environment, however,
motion is purely Newtonian. In the absence of almosphere,
there is no friction or drag or any other size-selective effect.
Apollo Erosion Scars
Other effects of the Apollo LM landings are the scars and
grooving in the soil surface caused by engine blast. For each
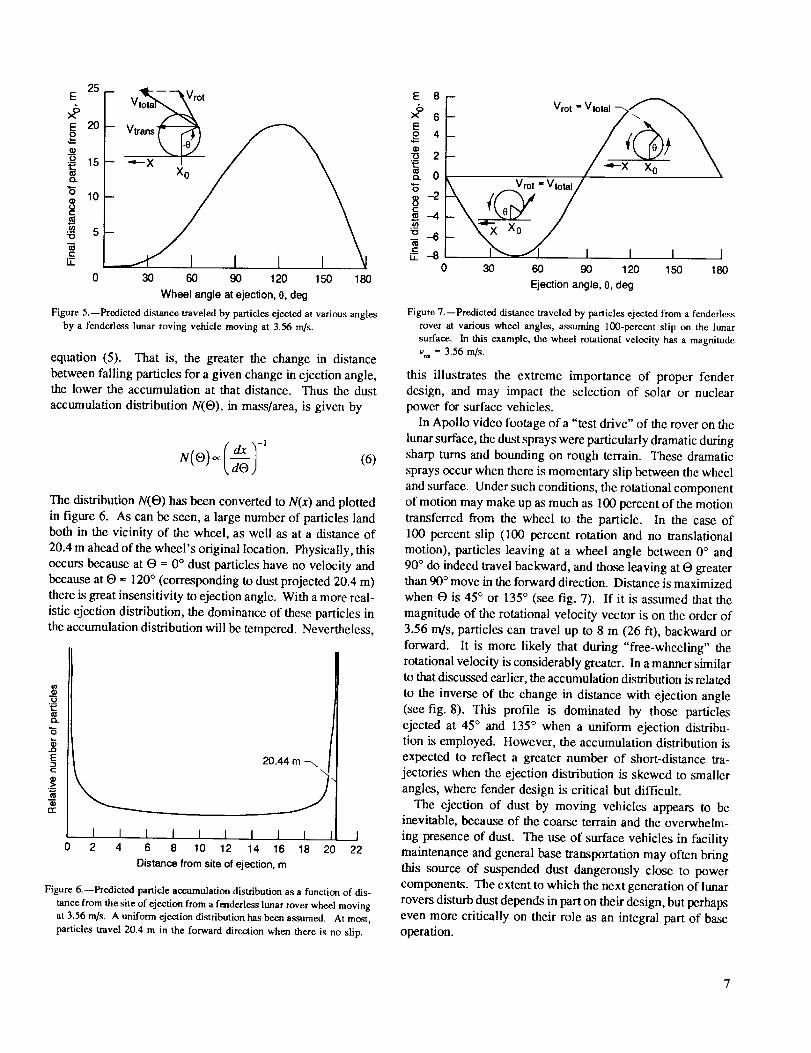
Apollo landing, a great erosion track traced the approach
(fig. 10) and culminated in a shallow pit under the engine bell.
In the specific case of the Apollo 14, the surface erosion is
visible in post-landing photographs taken with a low sun
angle. The descent engine produced roughly 13 400 N
(3000 lbf) of ttLrust until 2 s after contact. The eroded area has
a sandblasted roughness superimposed on a radial "grooving"
pattern (figs. 11 and 12). The deepest area is displaced about
1 m from the center of the resting engine bell, where the LM
momentarily hovered (Mitchell et al., 1971). This burn is
estimated from the photographs to have a depth of 10 cm anda diameter of 220 cm; the edge is ill-defined, since particles
far beyond this were also disturbed during descent. In anycase, from this burn alone a bulk volume of approximately
444 liters (16 ft 3) was removed as calculated from the equation
for the volume of a spherical segment of one base:
h/t(3r 2 +h 2 )Vss = 444 012 cm 3 (9)
6
The bulk lunar soil density increases with depth to a maximumof about 1.75 g/cm 3 below 60 cm. In the top 15 cm, the
average bulk density is approximately 1.5 g/cm 3 (Carrier,
1990). Thus, 666 kg of soil was blasted from this burn.
The average mass of a lunar soil particle weighted to the
probability of occurrence can be roughly estimated with the
following relation:
(10)
The relative number of particles of each size N(D) is
developed in appendix B. In establishing the mass of each
size particle, re(D), the particles are assumed to be sphericalfor simplicity, and the material density is taken to be 3 g/cm 3
after Duke et ai. (1970):
1000 I.tm
m,,o= j" N(O)[,<O)]dO=1 lam
lO00_m
3 3g /i'D 3
11.tm
x[ I00 cm I I06 lagll
L k--T-jjIOOOIxm
llxm
1000_.m
- lnD2
1gm
= 3.25 x 10 -5 gg]particle
dD
(11)
The 666 kg of lunar soil that was removed and dispersed from
the region directly under the engine bell alone corresponds to
a large number of particles:
ORIGINAL PAGE
BLACK AND WHITE PHOTOGRAP_
Figure 10.--Erosion track, 40 to 50 fl east of the Apollo lunar module landing site (AS12-46-6781).
10

ORIGINAL P A g ::-"
8LA_ AN_D __-ilTg PHOi:OGf_AEH
Figure l l.--Composite photograph showing the eroded area beneath the engine bell of the Apollo 14 lunar module (S-71-25423).
109 _tg/kg
(666 kg)-3.25 x 10_ _ I.tg / particle- 2.05x10 _6particles (12)
If these particles were distributed homogeneously over the
region defined in equation (8) by a 148.5-m radius, the resultingdeposition would be 9.6 g/m 2, or 3x10¹¹ particles/m 2.
Surveyor III
The Surveyor III provides a singular opportunity to observe
some of the effects of the landing of an Apollo LM. The
Surveyors were a series of unmanned exploratory craft sent to
develop soft-landing technology and to study the lunar surface
environment prior to the Apollo missions. The Surveyor III,
like the other Surveyors, was equipped with a special television
camera to transmit images of rock formations, craters, and
soil color and texture. In addition, the Surveyor III had a
retractable shovel for performing impact tests, u'ench tests,
and other manipulations of the lunar soil under camera
observation (refer again to fig. 4) (Jaffe and Steinbacher,
1969; Milwitzky and Dwornik, 1967).
On April 20, 1967, the Surveyor III touched down in theeastern part of the Oceanus Procellarum. After two hops it
came to rest on the inner edge of a 200-m crater later known
as "Surveyor Crater." It transmitted 6326 pictures of thelunar surface before it became inactive on May 3, 1967, in
preparation for lunar night, and has been silent ever since
(Milwitzky, 1969).
Thirty-one months later, in November 1969, the Apollo 12came to the same crater in the Oceanus Procellarum. One of
its missions was to achieve a pin-point lunar landing at a
preselected site. At the same time it afforded the opportunityfor scientific evaluation of the long-term effects of the lunar
environment on the Earth-made materials of the Surveyor 111.
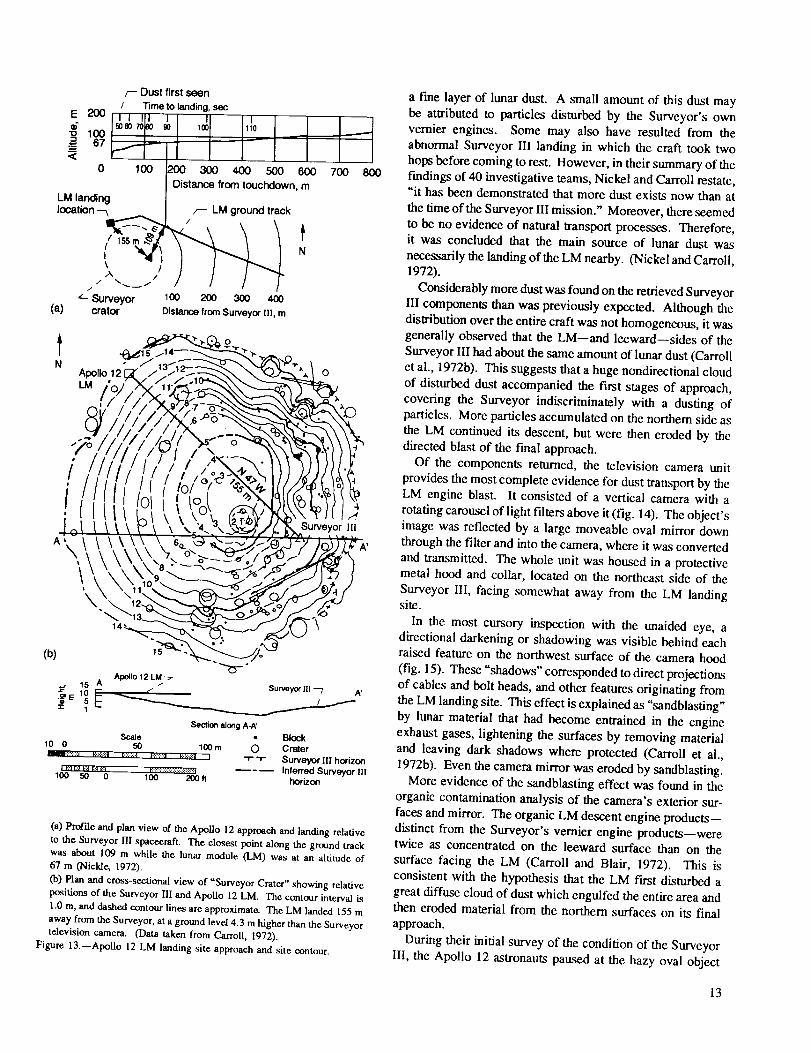
The Apollo 12 approached from the east, crossing the
northern edge of the crater, and touched down on the northwest
rim, 155 m (509 ft) away. (See fig. 13.) During its approach,
the LM was as close as about 67 m above a point on the
ground located roughly 109 m from the Surveyor.
During their second exlravehicular activity (EVA), the
Apollo 12 astronauts, Charles Conrad and Alan Bean, visited
the Surveyor III to take photographs and to retrieve some of
its components for later study. The following were removed
with a pair of shearing cutters and returned in the Surveyor
tote bag (Carroll et al., 1972a):
(1) The complete television camera with its associated
optical, electronic, mechanical, and structural components
(2) The sampler scoop, with 6.5 g of adhering lunar soil
(3) A 19.7-cm section of unpainted aluminum tube from a
sensor support strut
(4) A 10-cm length of aluminum tubing (painted with white
inorganic paint) from the camera support strut(5) A 13-cm length of television cable, with aluminized
plastic wrapping
During the general inspection of these parts it became clear
that almost all exposed surfaces were partially covered with
1!

ORIGINAL PAGE
BLACK AND WHITE PHOTOGRAPH
/
Figure 12.--Closeup photograph of the erosion caused by the exhaust plume of the Apollo 14 descent engine during touchdown (AS14-66-9261).
12
f-- Dust firstseen/ Timeto landing,sec
E 200 II I I5oeo/_Jo go loo
,<o loo
LM landing
location--_ ..
A /
" Surveyor(a) crator
I110
I_ 300 400 500 600Distance from touchdown, m
LM groundtrack
N
DistancefromSurveyorhi, rn
N
LM
70O 8OO
0
/i
SurveyorIf!
Section along A-A'
Scale • Block
10 0 50 100m O Crater_:.:.:.:.:, _:.:.:.:.:,_.:.:.:.:._z.:.:.:.:.=_:.:.:.:.:,i '-r-'-t- SurveyorIll horizon
_=..................... InlerredSurveyor]H100 50 0 100 200tt horizon
(a) Prof'deand planview of the Apollo 12 approach andlanding relativeto the Surveyor Ill spacecraft. The closest point along the ground trackwas about 109 m while the lunar module (LM) was at an altitude of67 m (Nickle, 1972).Co)Plan and cross-sectional view of "Surveyor Crater" showing relativep_itions of the Surveyor IlI and Apollo 12 l.aM. The contour interval is1.0 m, maddashed contour lines are approximate. The LM landed155maway from the Surveyor, at a ground level 4.3 mhigher than the Surveyortelevision camera. (Data taken from Carroll, 1972).
Figure 13.--Apollo 12 LM landing site approachand site contour.
a fine layer of lunar dust. A small amount of this dust may
be attributed to particles disturbed by the Surveyor's own
vernier engines. Some may also have resulted from the
abnormal Surveyor III landing in which the craft took two
hops before coming to rest. However, in their summary of the
findings of 40 investigative teams, Nickel and Carroll restate,"it has been demonstrated that more dust exists now than at
the time of the Surveyor II1 mission." Moreover, there seemed
to be no evidence of natural transport processes. Therefore,it was concluded that the main source of lunar dust was
necessarily the landing of the LM nearby. (Nickel and Carroll,1972).
Considerably more dust was found on the retrieved Surveyor
III components than was previously expected. Although the
distribution over the entire craft was not homogeneous, it was
generally observed that the LM--and leeward--sides of the
Surveyor III had about the same amount of lunar dust (Carroll
et al., 1972b), This suggests that a huge nondirectional cloud
of disturbed dust accompanied the first stages of approach,
covering the Surveyor indiscriminately with a dusting of
particles. More particles accumulated on the northern side as
the LM continued its descent, but were then eroded by the
directed blast of the fmal approach.
Of the components returned, the television camera unit
provides the most complete evidence for dust transport by the
LM engine blast. It consisted of a vertical camera with a
rotating carousel of light filters above it (fig. 14). The object's
image was reflected by a large moveable oval mirror down
through the filter and into the camera, where it was convertedand transmitted. The whole unit was housed in a protective
metal hood and collar, located on the northeast side of the
Surveyor III, facing somewhat away from the LM landingsite.
In the most cursory inspection with the unaided eye, adirectional darkening or shadowing was visible behind eachraised feature on the northwest surface of the camera hood
(fig. 15). These "shadows" corresponded to direct projections
of cables and bolt heads, and other features originating from
the LM landing site. This effect is explained as "sandblasting"
by lunar material that had become entrained in the engine
exhaust gases, lightening the surfaces by removing material
and leaving dark shadows where protected (Carroll et al.,
1972b). Even the camera mirror was eroded by sandblasting.
More evidence of the sandblasting effect was found in the
organic contamination analysis of the camera's exterior sur-
faces and mirror. The organic LM descent engine products--
distinct from the Surveyor's vernier engine products--weretwice as concentrated on the leeward surface than on the
surface facing the LM (Carroll and Blair, 1972). This is
consistent with the hypothesis that the LM first disturbed a
great diffuse cloud of dust which engulfed the entire area andthen eroded material from the northern surfaces on its final
approach.
During their initial survey of the condition of the Surveyor
III, the Apollo 12 astronauts paused at the hazy oval object
13

ORIGINAL PAGE
BLACK AND WHITE PHOTOGRAPH
Figure 14.--Surveyor 11I camera. The finger swipe of astronaut Conrad is vmible in the camera's mirror (AS12-48-7131).
14

,3_;GINf_L PA3£
BLACK AND WHITE PHOI-OGRAPH
(a) ....... 0
(a) Various camera attachmentsand cables.(b) Closeup of a bolt head.
Figure 15.--Evidence of particle impact shadows on the Surveyor III television camera housing. (Data taken from Cour-Palais el. al., 1972.)
they thought should be the shiny camera mirror. With a wipe
of a gloved finger, they saw the smooth reflective surface they
expected beneath a layer of lunar dust. (Refer again to fig. 14;
also see fig. 16.) It has since been established that the primary
cause for the "veiling glare" and contrast attenuation in the
returned mirror is the presence of lunar dust on its surface(Carroll et al., 1972b). Erosion and organic contamination are
very minor contributors.
Because of the angled final resting attitude of the mirror, its
dust coverage is smoothly graded--heaviest at the top and
lightest at the bottom. The lunar material was removed with
successive "peels" of an acetate replicating tape for analysis.
Except for a rare fleck of Earth-origin, all particles conformed
to the elemental, mineralogical, and morphological
characteristics of lunar soil. Particles between 0.3 and 3 Brn
account for almost 90 percent of the total mass of dust
accumulated on the mirror surface. Very few particles werefound which were greater than 4 prn (Carroll et ai., 1972a,
1972b; Rennilson, Holt, and Moll, 1972).
The camera filter wheel was recessed in the hood collar.
Nevertheless, it was also covered with a dust, which resulted
in a transmittance loss of 25 percent (Nickel and Carroll,
1972). Mathematical interpretations predict a surface dust
coverage of 25 percent (Carroll and Blair, 1972). Here the
particles size of the lunar fines ranged from less than 1 prn
(approximately 50 percent of the particles) up to 40 Nn(Nickel and Carroll, 1972). From reflectance data and filter
transmittance measurements, it is estimated that 10-5 to
10 -4 g/cm 2 of lunar material was deposited on these filters
as a result of the landing of the LM 155 m away (Carroll andBlair, 1972).
Various regions of the painted camera hood were analyzed
for dust coverage. The composition profiles produced by
sputter-ion source mass spectroscopy indicate that a dust layeras thick as 8.7 pm accumulated on the visor top, and a 7.2-[.tm
layer was deposited on the lower section facing the LM
(Satkiewicz and Marmo, 1972). Overall, Carroll and Blairestimated that no less than 10 -3 g/cm 2 of lunar soil arrived at
15

ORIGINA[ PAGE
BLACK AND WHITE PHOTOGRAPH
Figure 16.--Surveyor I11 television camera mirror showing a coating of fine-grained lunar material covering its entire surface. The f'mger swipe was
made by &_tronaut Conrad prior to its removal and return (Niekle, 1972),
16
the Surveyor III, though some merely sandblasted instead of
accumulating (Carroll and Blair, 1972).
Under microscopic evaluation many types of microcraters
or pits were observed on a variety of surfaces. None of these
pits has been positively identified as the result of hypervelocity
micrometeoroid impact (Carroll et al., 1972a). Some pits
found on painted aluminum tubing were attributed to poresin the coating, which are not a function of the lunar environ-
ment (Anderson et al., 1972). On the glass optical filters, the
deepest pits were consistent with the manufacturing andpolishing techniques (Brownlee, Bucher, and Hodge, 1972).
However, of those pits that were attributed to the Surveyor's
tenure on the Moon, most were traced to the impact of dust
particles excited by the LM descent. The presence of lunar
material was confirmed by detection of Ca, Ti, and Fe in the
pits (Anderson et al., 1972). Also, the direction of impact
correlates with the LM approach and descent.By the shadowing of screwheads, cables, and other hardware,
it was clear that the majority of the dust generation occurred
at touchdown, that lunar particles were ejected almost hori-
zontally, and that the trajectories were well-collimated. One
group of investigators estimated an average particle velocity
of approximately 40 ntis based on the alignment of the sha-
dows with the LM location (Nickle and Carroll, 1972). Jaffe
predicted 70 m/s, also by the crisp shadows on the camera
housing (Jaffe, 1972). Another group judged the dust velocityto be in excess of 100 ntis--their conclusion considered
the dust trajectory to be only slightly affected by lunar gra-vity (Cour-Palais et al., 1972).
Since these estimates describe the average particle velocities
during final descent as interpreted by the markings on the
Surveyor 155 m away, it is likely that particles may have beentraveling considerably faster than this. Particularly those
particles which experienced the direct engine blast are candi-
dates for much greater velocities. The camera's smooth optical
filters provided a special opportunity to refine an upper limit
on the particle velocities. These filters did not have a direct
view of the landing site, and yet it was observed that parti-cles impacted with even distribution over their 160 ° field
of view. The result was an average filter pit density of 200pits/cm 2 of the size 0.5 lam to 10 0rn. (This corresponds to
an impact rate of 800 impacts/cm2-yr-(2rc s0--this is
1000 times greater than the rate expected for primary micro-
meteoroids (Nickel and Carroll, 1972).) Consequently,
Brownlee's team concluded that most of these impacts resulted
during the transverse east-west approach of the LM (duringwhich the closest distance was 109 m at a height of 67 m)
(Brownlee, Bucher, and Hodge, 1972). They determined that
in order to produce the observed fractures in the glass surface,
a l-lain particle must have impacted with a velocity of roughly2 km/s or more. By the pit characteristics--irregular
depressions or dents with signs of plastic flow and chipped
rims--the incoming particle velocity was therefore appraised
to be in the range 0.3 to 2 km/s (671 to 4470 mph), a
conservative estimate of later touchdown conditions. The pitshape was consistent with the necessarily low angle of impact
to reach the partially protected filters. In addition to the
impact angle, the initial ejection angle must also have been at,
or slightly below, the horizontal, since the Surveyor III camera
was roughly 5 m below the rim of the crater (Brownlee,
Bucher, and Hodge, 1972). Therefore, the dust disturbed
during the f'mal touchdown would be expected to have at least
a comparable velocity and degree of collimation.
Prior to the Apollo 12 mission, it was generally assumedthat 500 ft would be a sufficient distance to land one craft
without affecting another. However, one of the unanimous
conclusions of the many investigators who studied the returned
Surveyor components was that dust is a considerable factor at
these distances. They emphasize that this issue must receivefuture attention because the presence of dust, even in small
amounts, can significantly affect the thermal control and opticalperformance of critical hardware.
Dust Accumulation From Spacecraft
Landing and Launch
Modeling Accumulation Distributions for Spacecraft
Landing
From the previous sections it is clear that large amounts of
lunar dust are suspended by the descent (and probably ascent)
of a spacecraft on the lunar surface. This dust travels fast and
far, and accumulates indiscriminately on nearby surfaces. The
magnitude of dust accumulation with distance from a landing
event is of critical importance in the prediction of photovoltaicarray and radiator performance.
Even with the Apollo and Surveyor experiences with lunar
dust, expected dust accumulation remains an elusive and
difficult quantity to establish. This is largely due to the
sandblasting effects of final touchdown which removed some
of the dust acquired on Surveyor III surfaces during the earlier
stages of LM approach and descent. Consequently, a value
for the total amount of dust arriving at a certain distance is
impossible to obtain. In addition, because of the complex dis-
turbance processes, particle trajectories are myriad. Dust
accumulation as a function of the distance from a landing site
may only be projected from the available information from
these missions, and extrapolated as well as possible to futurelunar base scenarios.
To prepare a base model for dust accumulation as a function
of distance from the LM, the clues available from the Surveyor
components were cut and pasted together to generate a model
for particle velocity distribution. The velocity distributionwas converted to a particle distance distribution, which was
summed over the possible range of angles to arrive at an
accumulation with distance. Finally this accumulationdistribution was scaled to correlate with the observed accumu-
lation on the Surveyor III.
The Surveyor evidence indicates that most particles disturbed
during touchdown have a velocity between 40 and 100 m/s at
a distance of 155 m from the landing site of an Apollo LM,
17

withanaveragevelocityof70m/s.Therearealsoparticleswhicharriveinexcessof 2000m/s,producingtheobservedpittinginglasssurfaces.Fromtheshapesofthesepitsandthe"shadowing"of boltsandcables,it wasdeducedthatthetrajectorieswerewell-collimatedatanangleofapproximately0°. ThismaybeanunderstatementofthedisturbancecausedbytheLM'sfinaltouchdown,thestageofdescentwhentheparticlesareejectedwiththegreatestenergyunderthedirectblastof thedescentengine.Nevertheless,it isareasonableplacetostartin theabsenceofmoredata.
Fromthisinformation,threevelocitydistributionsweregenerated.All arenormal,bell-curvedistributionsof theform
N(v o) = C exp -0.5
where v 0 is the ejected particle velocity, and 13, the meanvalue, is taken tobe 70 m/s. In model 1, the standard deviation
t_ is assigned to be 500 m/s, which corresponds to the casewhen as many as 1 in 10 000 particles travels at a velocity
greater than or equal to 2000 m/s to account for observed
pitting. The associated curve is very flat, and less than
5 percent of model 1 particles fall in the range 40 to
100 m/s (see fig. 17). A standard deviation of 100 wasselected for model 2. This describes the case in which a
greater fraction of all particles, (23.6 percent) fall between 40and 100 m/s, but less than 0.001 percent are faster than
2000 m/s. For comparison, model 3 was assigned to have a
standard deviation of 44.8, which would correspond to a
population in which 50 percent of the particles had a velocity
between 40 and 100 m/s (the observed velocity range), and
much less than 0.001 percent had a velocity of 2000 m/s or
greater. Table II summarizes the differences among the three
models. Of these, model 2 may be the best simulation of the
actual scenario as described by the Surveyor components; if
the real distribution were as "flat" as model 1, it is unlikely
that the three groups of investigators would all have estimated
the average velocity to be within 60 m/s of each other. Also,
model 1 predicts the greatest number of fast particles, which
would have produced more damage than observed. In the
other extreme, it does not seem reasonable for the particle
velocity to be as sharply defined as predicted by model 3.The velocity distributions were normalized over distance
values from zero to infinity, assuming radial symmetry aroundthe LM. From the laws of Newtonian motion, values of
velocity can be converted to distance by
(13)
Here _ is the ejection angle and g, the lunar gravitation, is1.63 m/s 2. Since the particle trajectories are known to be
"B
E
tr
\
Standard
Model deviation,
_, m/s
1 500.02 100.03 44.8
0 500 1000 1500
Particle velocity, rn/s
Figure 17.--Three models of the particle velocity distribution of lunar dust
distributed by the f'mal touchdown of the Apollo lunar module.
nearly horizontal, $ values from 0 ° to 1° were considered.The result is a series of distributions--each describing the
number of particles that travel distance x for a given O--of theform
N(x)=c exp-05 (14)
An example for model 2 is shown in figure 18, where the
curves for three different angles are plotted and normalized
for all positive x. They, therefore, give only the relative
number of particles with distance. They illustrate, however,
the great sensitivity of the distribution to ejection angle;
particles ejected with _ = 1° travel roughly 2 orders of
magnitude farther than those with _ = 0.01 °.
Finally, the relative number of particles was summed over100 angles between 0° and 1° to give a total number of
particles arriving at each distance. The total number of particles
was then modified to number per square centimeter by themultiplication of a constant. Another constant converted
number of particles to mass in milligrams per square centimeter.The constants are not really critical, since the last step required
scaling the curves, one for each model, to intersect the value
18

TABLE iI.--PARTICLE VELOCITY DISTRIBUTION MODELS FOR NORMAL DISTRIBUTION
[Mean velocit, ', [_, 70 nat's]
Model Standard
Deviation
O',
m/s
50O
100
44.8
Probability of
velocity of
40 to 1O0 m/s,
percent
4.78
50
23.6
Probability of
velocity greater than
2000 m/s,percent
< 0.01
<< 0.001
<<< 0.O01
Particle velocity distribution
function, F(x), after
normafi zation
0.00143 cxp [-(x- 70)2/500 O00]
0.00945 exp [-(x- 70)2/2000]0.00524 exp l-(x-70)214014]
Q)"Det_Q.
"6
EZ_t-
.,g>_t_
tr
="
L.
B_=
m
10-1
Figure 1&--Particle distance distribution of lunar dust distributed by the
final touchdown of the Apollo lunar module as predicted by model 2. The
distribution's dependence on ejection angle 0 is significant: the maximum
distance can vary by roughly two orders of magnitude between 0 = 0-01°
and _) = 1°. Since the curves are normalized over all distance, actual
aocumuladons cannot yet be determined.
1 mg/cm 2 at 155 m. Recall that this is the estimated amount
of dust remaining on the Surveyor. Because this value does
not account for particles that were sandblasted away, thecurves (shown in fig. 19) are likely to underestimate the net
accumulation through this scaling process. Nevertheless, the
models show in a general way that after experiencing several
lunar landings a surface could easily acquire a substantialamount of dust.
In figure 19 the accumulation curves peak at a distance near
100 m from the landing site. This peak may be attributed to
the contribution of those particles ejected at very low angles.
Beyond this peak, the accumulation curves drop off
exponentially, according to equation (14). Model 1, which
has a very large standard deviation, predicts an enormous
accumulation even at 10 km, whereas model 3 predicts the
accumulation at that distance to be essentially negligible. At
1 km, the accumulation according to models 1, 2, and 3 are0.83, 0.14, and 0.001 mg/cm 2, respectively. As mentioned,
model 2 represents the most reasonable interpretation at this
time, but it bears confirmation by more lunar data.It is interesting to note that the Moon's escape velocity is
2.3735 km/s. Therefore, by any model, every landing will
launch some lunar particles into orbit. This also means that
even surfaces that are quite far away from a landing event
may experience reduced performance due to dust accumulation.In addition to traveling great distances, the faster particles
can also inflict surface damage in the form of impact pits.
Unfortunately, such particle trajectories are not moderated by
flight through a gaseous environment as they are on Earth.
However, it is not clear whether these pits will necessarily
degrade performance. For photovoltaic arrays, provided the
protective cover-material is thick enough to prevent solar
cell damage, a roughened surface may still allow nearly nor-
mal performance via diffuse rather than specular solar
2.0
1.5
t_
E
"5Eo_ 1.0
"O
rl
.5
Model 1
i \\\\\ \\ _ Model 2
Model 3 _,_
_" "I'- .'T, .-"-,-'F ,-"-, ---r-1--I
0 500 1000 1500 2000 2500
Distance from LM, m
Figure 19.--Estimated lunar dust accumulation resulting from the lunar
module final tc_achdowrt. These curves were all scaled to have the value
of 1 mg/cm 2 at a distance of 155 m from the landing site, which is the
best available estimate from the Surveyor Ill returned components.
19

illumination.In the case of radiators, special high-emittance
surface coatings may be eroded--or conversely, the
roughening may provide additional surface area, such as
achieved through arc-texturing techniques (Banks et al.,1988). For either surface, the more definite problem appears
to be occlusion from incoming or outgoing electromagnetic
radiation by a coverage of particles.
Independent Predictions of Particle Trajectories
and Fluxes for Spacecraft Landing
Under a contract for NASA Johnson Space Center, Eagle
Engineering, Inc., evaluated the factors that needed to be
considered in the planning of a lunar launch and landing
facility. Among the issues discussed in their reports was the
tossing of lunar dust by the exhaust plume (see Phillips et al.,1988, and Lunar Base Launch & Landing Facility Conceptual
Design, 1988). Using a 50 000-N LM-type engine as a base-
line model, they predicted the sizes, trajectories, and fluxes of
the lofted particles by assessing the direct drag acceleration
by the plume. Though the nature of the calculations were notincluded in their reports, the results are worthy of mention as
an independent evaluation of particle accumulation.
Table III shows a summary of some of the predictions made
by the Eagle group. As an example, they anticipated a 50-_m
particle to travel 2 km and impact with a velocity of
125 m/s. By their analysis, larger particles do not travel asfar, or attain such velocities. Particles greater than 5 mm are
too large to be ejected by the plume.
The Eagle group estimated particle flux by calculating the
number of 50-gm particles needed to produce a 50-percent
obscuration. By their model, at 1 m roughly 0. I impacts areexpected per cm2-s (see fig. 20); the final 10-m descent of a
typical landing event may last 5 s. For larger particles, the
flux is lower. This is reported as a conservative estimate.
From these results, Phillips et al. predict that surfaces within
200 to 400 m would receive substantial pitting from a
50 000-N descent engine and that glass surfaces, in particular,
would be rendered "unusable." They predict that after one
landing, glass objects 2 km away will sustain only 0.1-percent
surface pitting, but that this could worsen to a noticeable
haze after numerous landings (Lunar Base Launch & Landing
Facility Conceptual Design, 1988). Although these results donot provide a direct estimate of the accumulation, they give
the general idea that, under the influence of a 50 000-N
engine, a measurable number of particles will reach surfacesat distances of 2 km.
Estimating the Effects of Spacecraft Launch
Launch is generally a quicker process than landing, since
after an explosive burst of propellants the lunar surface is left
quickly behind in contrast to a gradual controlled entry. Also
navigation and orientation are not involved in launch until the
later stages. Therefore, the exposure of the surface to direct
20
TABLE IlL--ESTIMATED PARTICLE
SUSPENSION BY
A 50 000-N LM-TYPE ENGINE
(Eagle Engineering, Inc., 1988)
Particle Impact
diameter, distance,
4.0 202.0 401,5 501.0 750.5 1500.25 3250.075 12000.050 2000
Impact
velocity,
m/s
10152o253550
100125
_oo
_ _ -
1ooo -
I l _ I -l
2_ 40O 6_ 8_ 10_Distan_fromLandernozzle, m
Figure 20.--Predicted particle flux distributiort for a 50 000-N lunar-module-
type engine for 50-0m particles (Eagle Engineering, Inc., 1988).
engine blast occurs over a shorter period. For two equivalent
engines of the same dimension and thrust, the launch engine
may be assumed to suspend less dust than the landing engine.
However, the thrust levels required for launch are typically
greater than those for landing, since braking against momentum
and gravity is less energy intensive than accelerating from rest
to above escape velocity. These inequities complicate the
comparison. In addition, nozzle diameter and height also play
a role in the degree of exposure of soil to exhaust gases. For
instance, in the case of the Apollo launches, the lower portion
of the LM consisting of the descent propulsion system and the
landing gear was left behind, after serving as a launchpad
from which to lift off. Consequently, the soil was not asdirectly exposed to the exhaust blast during ascent. The
design of future lunar excursion vehicles has not yet been
established to determine if such protection would be, present.Apollo launch footage available from cameras that were left
behind on the lunar surface shows dramatic streaks cxtending
horizontally from under the plume. The particles are obviously
moving with great velocities. Considering that the ascent
engine produces greater thrust over a shorter exposure, the net
number of particles suspended during latmch and landing may

have been comparable in the case of the Apollo missions. For
future missions, engine design--both thrust and physical
dimensions--will determine whether launch or landing will
cause more severe lunar dust suspension.
Scaling to Other Engine Thrusts
According to the Eagle group, an increase in thrust is directly
proportional to an increase in the distance that disturbed
particles will travel. Using this relationship, one can extrapolateboth the authors' models and the Eagle models to other descent
engine situations. For example, for a final touchdownthrust of 13 400 N, which was nominal for the Apollo LM's
(Hammock, Cuttle, and Fisher, 1973), the Eagle model would
predict that 50-1am particles would travel 536 m.
Similarly, the authors' models 1, 2, and 3 may be scaled todescribe the particle accumulation for different descent engine
sizes. Table IV shows the anticipated thrusts for "excursion
vehicle" engines currently under consideration for servicing afuture lunar base (B.A. Palaszewski, 1990, Launch Vehicle
Research Branch, NASA Lewis Research Center, Cleveland,
OH, personal communication). In equations (13) and (14), xwould be multiplied by the appropriate ratio of new thrust to
13 400 N in order to correct for engine size. The particle
distance distribution would accordingly stretch along the dis-
tance axis. In addition, a greater number of particles would
be disturbed by a higher thrust engine. Since flux is related
to the square of distance, flux is also related to the square of
thrust. Therefore, the entire right side of equation (14) is
squared. The result is an equation describing the anticipated
dust accumulation resulting from a single landing of a modem
excursion vehicle. For the sake of simplicity, it may beassumed that the same particle flux and accumulation
distribution result from the launch of this vehicle, even though
the thrust is greater. With the adoption of a possible scheduleof base service missions, the accumulation distribution can be
plotted as a function of time.
TABLE IV.--ANTICIPATED THRUST LEVELS FOR
FUTURE LUNAR EXCURSION VEHICLES
Desce_nt
Ascent
Apollo LM
N204]hydrazineand aUDMH
Proposed Proposed
o_2 O_Alpropulsion propulsion
Thrust level, N
b13 400 c26 800 c18 000
dl 5 600 c76 000 c420 000
aUnsymrnetrical dirnethylhydrazine.
bHammock et al., 1973.
CB.A. Palaszewski, 1990, Launch Vehicle Research Branch,
NASA Lewis Research Center, Cleveland, OH, personal
communication.
dHum_'ies and Taylor, 1973.
Lunar Dust Accumulation With Time
Consider a hypothetical scenario: the construction of the
lunar base is complete, and though the base is largely self-
sufficient, service missions from Earth are required twice a
year to deliver necessary materials for maintenance of crew
and facilities. The excursion craft uses O2/H 2 propulsion,which provides 26 800 N of thrust on landing at the lunar
surface. (This is twice the thrust of an Apollo LM descent
engine.) It is supposed that an equivalent dust disturbance is
generated during launch as is produced on landing, even
though the ascent thrust levels are on the order of 76 000 N.
After 5 yr, then, effectively 20 such craft have landed at the
base. The resulting dust accumulation dislribution thereforehas the form
Equation (15) is plotted in figure 21 for models 1, 2 and 3.
According to model 2, the most representative interpretation,
objects 1 km from the landing site will acquire a dust coverageof 3 mg/cm 2 after 5 yr. Figure 22 indicates, more generally,the dust accumulation distribution as a function of time for a
number of different distances from the landing site for this
same scenario. In short, it is clear that greater engine thrusts
and multiple landings lead quickly to increased particleaccumulations.
Correlation of Dust Accumulation and
Power Component Performance
Radiator Performance
Using a simple model, one can compare the power radi-ated from a dust-covered radiator with that from a clean one
(fig. 23). Consider an ideal case in which there is no
competing absorption of solar radiation by either the radiator
or the dust layer (for example, let the radiators in question be
vertical, oriented along the Moon's equator). As a crude
simplification, it is assumed that the interface between the
radiator and dust layer is ideal, such that the first monolayer
of particles receives heat from the radiator surface with 100-
percent efficiency. To penetrate through the rest of the dust
layer, the heat is both conducted across contacting particle
surfaces and radiated from particle to particle. A thermal
gradient will exist across the dust layer, and the radiation of
heat into space will be limited by the resulting temperatureat the dust surface. It is assumed that the dust accumulated
on the radiator surface is not compacted, similar to the top
21
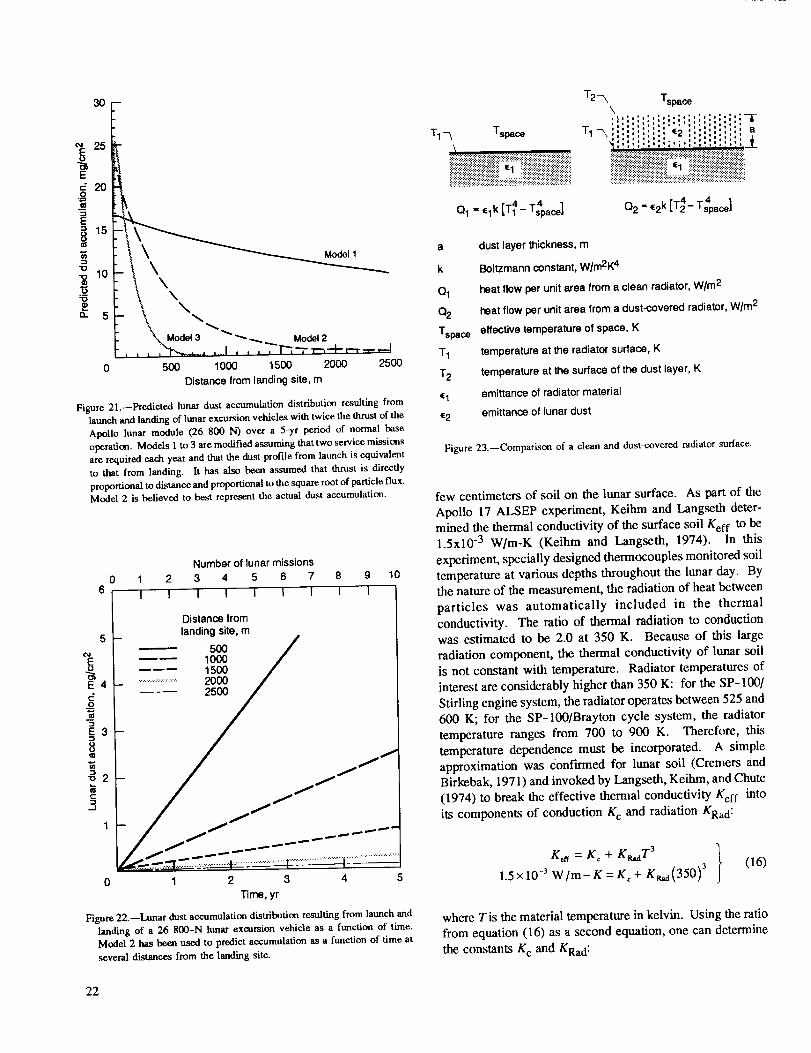
g20
Is==
if_
I _'*_"-........... Model2
0 500 10O0 1500 2000 2500
Distance from landing site, m
Figure 21.--Predicted lunar dust accumulation distribution resulting fromlaunch and landing of lunar excursion vehicles with twice the thrustof the
Apollo lunar module (26 800 IN) over a 5-yr period of normal baseopemtiun. Models 1 to 3 are modified assuming that two service missions
are required each year and that the dust profile from launch is equivalent
to that from landing. It has also been assumed that thrust is direedy
proportional to distance and proportional to the square root of particle flux.Model 2 is believed to best represent the actual dust accumulation.
Number of lunar missions
0 1 2 3 4 5 6 7 8 9 10
6 I l I I I I I I I I
Distance from
5 landing site, m
- /5O010001500 /
c0
x_ 2 - jJc
" _ J_1
0 1 2 3 4 5
Time, yr
Figure 22.--Lunar dust accumulation distribution resultingfrom launch andlanding of a 26 800-N lunar excursion vehicle as a function of time.Model 2 has _ used to predict accumulationas a function of time atseveral distances from the landing site.
TI _ Tspace
::::::::::::::::::::::::::::::::::::::::::::::::::::::::::::::::::::::::::::::::::::::::::::::
::::::::::::::::::::::::::::::::::::::1 ::::::::::::::::::::::::::::::::::::::
Ol " "1 k [ T4- Ts4pace]
T2"-_ Tspace\
_a','=" "g" • ° ° "0" °|", ,,,,,.,,,,,.,.,,,,. ,,, ,:-6-T1 ,',','.',', .,,. ,., ,-_,,,,,,,,,,::_: c2 :,,,,,,,,:,,g:, a
,,,:.,,:,,,,,,; ;.,,,:,,,',,, :.,,_._ .............................._.........:._. ......-_
i:i:':_:F.:_:!:i:i::.:_:!:!:!:;::.:i:;:!::.:1 ":i:i:i:i:;:£:i:;:i:!:!:£-::.:':i¢i::.:i:i
Q2 ""2 k [T;- Ts4pace]
a
k
Q1
Q_
Tspace
T1
T2
_2
dust layer thickness, m
Boltzmann constant, W/m2K 4
heat flow per unit area from a clean radiator, W/m 2
heat flow per unit area from a dust-covered radiator, W/m 2
effective temperature of space, K
temperature at the radiator surface, K
temperature at the surface of the dust layer, K
emfftance of radiator material
emittance of lunar dust
Figure 23.--Comparison of a clean and dust-covered radiator surface.
few centimeters of soil on the lunar surface. As part of the
Apollo 17 ALSEP experiment, Keihm and Langseth deter-
mined the thermal conductivity of the surface soil Kef f to be
1.5x10 -3 W]m-K (Keihm and Langseth, 1974). In this
experiment, specially designed thermocouples monitored soil
temperature at various depths throughout the hmar day. By
the nature of the measurement, the radiation of heat between
particles was automatically included in the thermal
conductivity. The ratio of thermal radiation to conduction
was estimated to be 2.0 at 350 K. Because of this large
radiation component, the thermal conductivity of lunar soil
is not constant with temperature. Radiator temperatures of
interest are considerably higher than 350 K: for the SP-100/
Stirling engine system, the radiator operates between 525 and
600 K; for the SP-lOO/Brayton cycle system, the radiator
temperature ranges from 700 to 900 K. Therefore, this
temperature dependence must be incorporated. A simple
approximation was confirmed for lunar soil (Cremers and
Birkebak, 1971) and invoked by Langseth, Keihm, and Chute
(1974) to break the effective thermal conductivity Kef f into
its components of conduction K c and radiation KRad:
Kar = K¢ + KR,aT _
1.5 x 10 -3 W/m- K = K, + K_u a (350) 3(16)
where Tis the material temperature in kelvin. Using the ratio
from equation (16) as a second equation, one can determine
the constants K c and KRad:
22

Kc = 0.5x10 -3 W/m-K
KRad = 2.33x10 -11 W/m- K 4
(17)
The heat equation provides a direct derivation of the dust
layer thickness while adjusting the thermal conductivity for
different temperature ranges:
Q= -(K¢ + K_dT3)d-_ (18)
where Q ks heat flow per unit area from the dust surface in
watts per meters squared and a ks the dust layer thickness in
meters. Since Q is constant through the layer at steady state,
equation (18) can be integrated as follows:
f T: I R.dT' =- (Kc+ - K_T+ (19)
0 T_ 4- ""IT2
Therefore, a becomes simply
(20)
For a given set of conditions, the values of Q are established
from the Stephan-Boltzmann equation, T2 is subsequentlycalculated, and the associated thickness a is determined. A
sample calculation is shown for a high-emittance radiator
surface (e.g., arc-textured copper, arc-textured niobium,
pyrolytic graphite, or carbon-carbon composite) at 800 K witha state-of-the-art emittance of 0.85:
o,= - (21)
The effective temperature of space from the perspective of a
vertical radiator on the Moon may be taken to be in theneighborhood of 222 K, which includes the solar radiation
reflected from the Moon and the surface temperature itself,
averaged over a lunar cycle. Since the Stephan-Boltzmannconstant k ks 5.67x 10 -10 W/m2-K 4,
Qa = 19 624 W/m 2 (22)
If a coverage of lunar dust causes a 25-percent reduction in
heat rejected by the radiator, for example, the temperature at
the surface of the dust is hack-calculated from the same
Stephan-Boltzmann relation:
075Q,= 2k(r; - r,;.) (23)
where £2 is the emittance of lunar dust. This value, known
to be very high, has been measured in the range between 0.9
and 0.95 (Logan et al., 1972), so 0.93 will be used. For this
case, the resulting T2 is 728 K. Equation (18) is then used to
predict that a dust layer thickness of 54 _ma would cause this
25-percent reduction in performance. Similar calculations
were used to obtain the curves in figures 24 and 25, for both
the Stirling engine and Brayton cycle systems.
An especially interesting result is produced from these
calculations: at very small dust thicknesses, the radiator's
performance is actually enhanced by the presence of lunar
dust. This might be expected on the basis of our assumption
of good thermal contact with the first dust layer and the factthat the emittance of lunar dust exceeds that of the best radiator
surfaces. When the dust layer is so thin that the thermalbarriers are negligible, this improved radiation works to an
advantage. Beyond a certain thickness, however, the poor
heat transfer by conduction becomes magnified by many
particle interfaces. Therefore, there is no performance penalty
for a Brayton cycle radiator unless the dust layer exceeds
11 _lrn; for a Stirling engine radiator, the threshold is 12 Inn.
As a point of reference, some parts of the Surveyor III retained
as much as 8.7 )am of lunar dust after the sandblasting effects
of the Apollo 12 landing (Satkiewicz and Marmo, 1972). It
should be noted that in reality a dust layer may include particles
from less than I jarn to 1000 _ma, but dust thickness a is meant
to represent an average layer thickness.
The assumption that the interface between the radiator
surface and the dust particles provides no additional thermal
resistance ks perhaps optimistic. However, if the radiator
surface is roughened, the increased contact area might
contribute to enhanced thermal contact. It is possible that
the constants K c and KRa d have subtle variations with
temperature which are ancillary to the variation of Kef f, butthese are not expected to be significant relative to the T3
contribution. The effective temperature of space Tspace mayactually be lower or higher, depending on the radiatororientation and on the associated view factor to the lunar
surface, mountains, the sun, and the Earth; however, it is a
secondary effect compared with the T14 term. It is assumedthat even a vertical radiator will accumulate lunar dust, as
confirmed by the astronaut experiences.
Though these preliminary calculations bear experimental
confirmation, they predict a rather serious threat to radiator
performance by the presence of lunar dust, particularly in
light of the particle fluences estimated in the previous section.
The same types of performance degradation can be expectedfor photovoltaic surfaces as well.
23
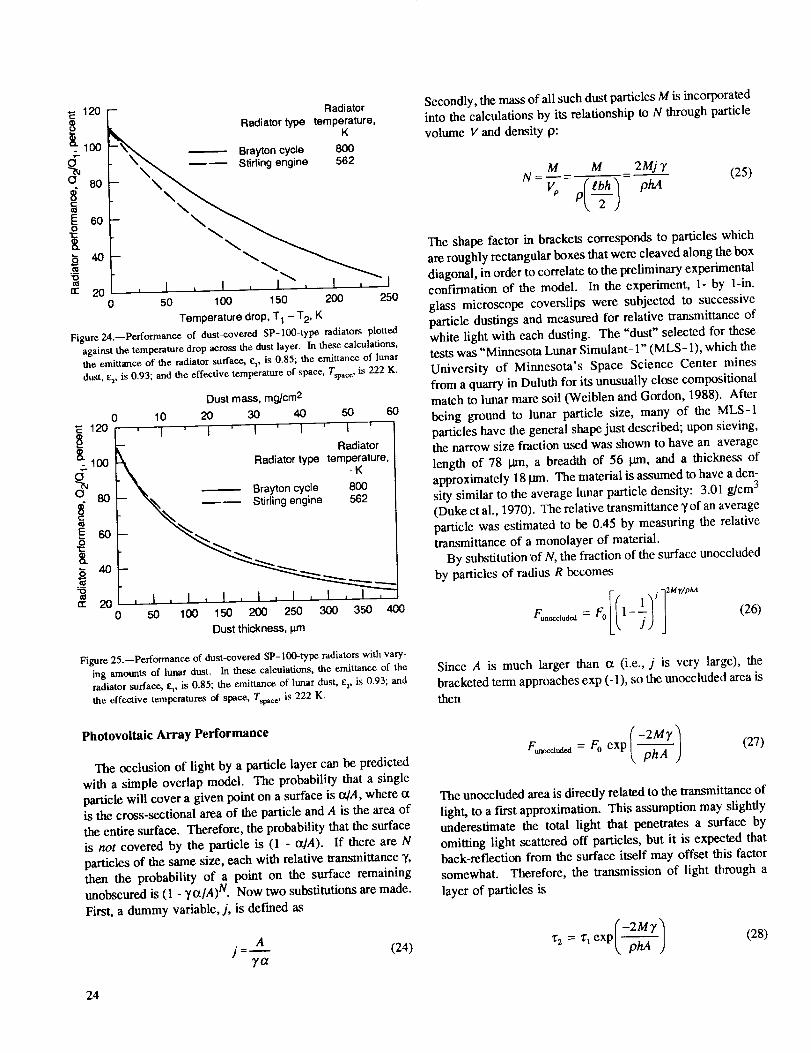
•--120®
o
I_10 o°
(2 80
C
6o0
a: 20
Radiator
Radiator type temp_ature,
Braytoncycle 86(X_2
.- . .0 50 100 150 200 250
Temperature drop, T1- T2, K
Figure 24.--Performance of dust-covered SP-lOO-type radiatorsplottedagainst the temperature drop across the dust layer. In these calculations,the emittance of the radiator surface, £3, is 0.85; the emittance of lunardust, t:2, is 0.93; and the effective temperature of space, Tspac¢,is 222 K.
Dust mass, mg/cm2
0 10 20 30 40 50 60E 120
o 8o
E 60
_ 40°_"0
w 200
' I ' I ' I ' I ' I '
_" Radiator
._. Radiator type tem.Pel_ature,
_ _, Braytoncycle 800
? "_ Stiflingengine 562
• _'. _.._
j I ,50 100 150 200 250 300 350 400
Dust thickness,prn
Figure25.--Performance of dust-covered SP- 100-type radiators with vary-ing amounts of lunar dust. lit these calculations, the emittance of theradiator surface, E:1,is 0.85; the emittance of lunar dust, E:z,is 0.93; andthe effective temperatures of space, Ts0aee,is 222 K.
Photovoltaic Array Performance
The occlusion of light by a particle layer can be predicted
with a simple overlap model. The probability that a single
particle will cover a given point on a surface is oqA, where (2
is the cross-sectional area of the particle and A is the area of
the entire surface. Therefore, the probability that the surface
is not covered by the particle is (1 - a/A). If there are N
particles of the same size, each with relative transmittance 7,
then the probability of a point on the surface remainingunobscured is (1 - 7ct/A) N. Now two substitutions are made.
First, a dummy variable, j, is deemed as
Aj - (24)
7a
Secondly, the mass of all such dust particles M is incorporatedinto the calculations by its relationship to N through particle
volume V and density p:
(25)
The shape factor in brackets corresponds to particles which
are roughly rectangular boxes that were cleaved along the box
diagonal, in order to correlate to the preliminary experimental
confirmation of the model. In the experiment, 1- by 1-in.
glass microscope coverslips were subjected to successive
particle dnstings and measured for relative transmittance of
white light with each dusting. The "dust" selected for these
tests was "Minnesota Lunar Simulant-1" (MLS-1), which the
University of Minnesota's Space Science Center mines
from a quarry in Duluth for its unusually close compositionalmatch to lunar mare soil (Weiblen and Gordon, 1988). After
being ground to lunar particle size, many of the MLS-1particles have the general shape just described; upon sieving,
the narrow size fraction used was shown to have an average
length of 78 pin, a breadth of 56 lain, and a thickness of
approximately 18 larn. The material is assumed to have a den-
sity similar to the average lunar particle density: 3.01 g/cm 3
(Duke et al., 1970). The relative transmittance _/of an average
particle was estimated to be 0.45 by measuring the relative
transmittance of a monolayer of material.
By substitution of N, the fraction of the surface unoccluded
by particles of radius R becomes
F_o_l_d_ = Fo 1- (26)
Since A is much larger than ct (i.e., j is very large), the
bracketed term approaches exp (-1), so the unoccluded area isthen
Fur_t,_,z = Fo exp (-2M'y/_, pha )
(27)
The unoccluded area is directly related to the transmittance of
light, to a first approximation. This assumption may slightly
underestimate the total light that penetrates a surface by
omitting light scattered off particles, but it is expected thatback-reflection from the surface itself may offset this factor
somewhat. Therefore, the transmission of light through a
layer of particles is
(28)
24
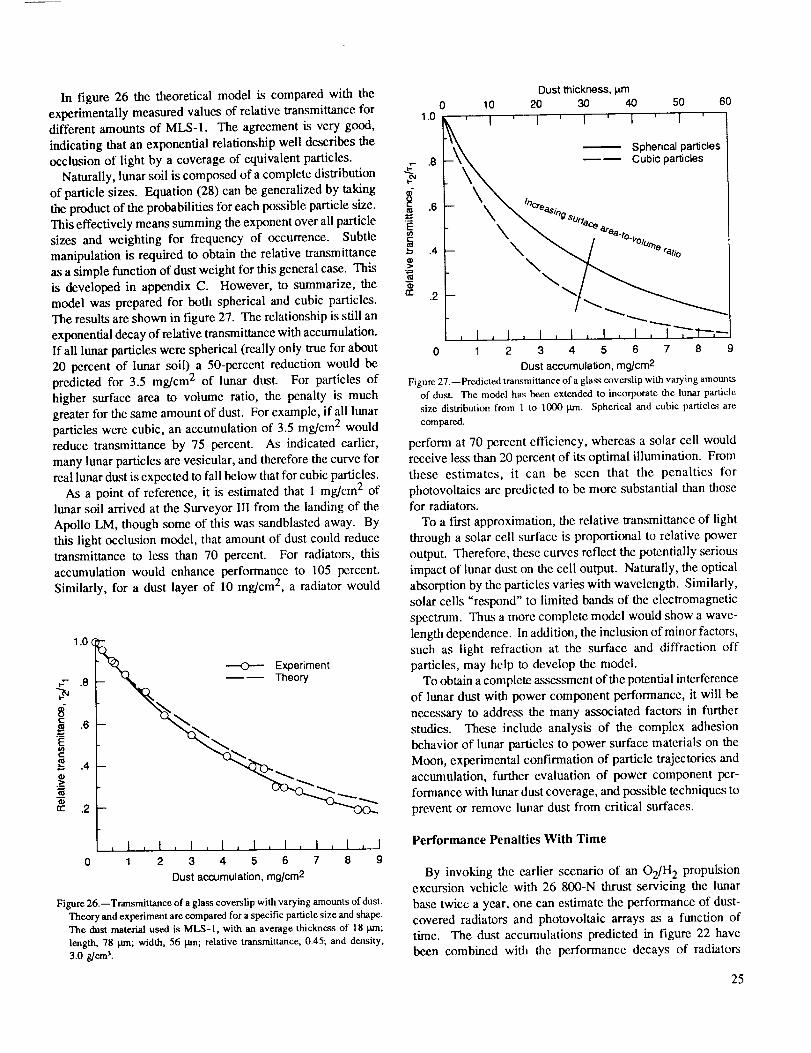
In figure26thetheoreticalmodelis comparedwiththeexperimentallymeasuredvaluesofrelativetransmittancefordifferentamountsof MLS-1.Theagreementisverygood,indicatingthatanexponentialrelationshipwelldescribestheocclusionof lightbyacoverageof equivalentparticles.
Naturally,lunarsoiliscomposedofacompletedistributionofparticlesizes.Equation(28)canbegeneralizedbytakingtheproductoftheprobabilitiesforeachpossibleparticlesize.Thiseffectivelymeanssummingtheexponentoverallparticlesizesandweightingfor frequencyof occurrence.Subtlemanipulationisrequiredtoobtaintherelativetransmittanceasasimplefunctionofdustweightforthisgeneralcase.Thisis developedin appendixC. However,to summarize,themodelwaspreparedforbothsphericalandcubicparticles.Theresultsareshowninfigure27.Therelationshipisstillanexponentialdecayofrelativetransmittancewithaccumulation.If alllunarparticleswerespherical(reallyonlytrueforabout20percentof lunarsoil)a 50-percentreductionwouldbepredictedfor 3.5mg/cm2 of lunardust. Forparticlesofhighersurfaceareato volumeratio,thepenaltyis muchgreaterforthesameamountofdust.Forexample,if alllunarparticleswerecubic,anaccumulationof 3.5mg/cm2wouldreducetransmittanceby 75percent.As indicatedearlier,manylunarparticlesarevesicular,andthereforethecurveforreallunardustisexpectedtofallbelowthatforcubicparticles.
Asapointof reference,it isestimatedthat1mg/cm2oflunarsoilarrivedattheSurveyorIII fromthelandingoftheApolloLM,thoughsomeof thiswassandblastedaway.Bythislightocclusionmodel,thatamountof dustcouldreducetransmittanceto lessthan70percent.Forradiators,thisaccumulationwouldenhanceperformanceto 105percent.Similarly,for adustlayerof 10mg/cm2,a radiatorwould
1.0_
.8
t-.6
E¢1¢..
.4
.>_
rr .2
m
_ Experiment
_ 'q_ _ Theory
I, I, I, I, I, I, I , I , I1 2 3 4 5 6 7 8 9
Dust accumulation, mg/cm2
Figure 26.--Transmittance of a glass coverslip with varying amounts of dust.
Theory and experiment are compared for a specific particle size and shape.
The dust material used is MLS-1, with an average thickness of 18 pro;
length, 78 lain; width, 56 _m; relative transmittance, 0.45; and density,
3.0 g/era 3.
Dust thickness, i.tm0 10 20 30 40 50 6O
1.0 ' I ' I ' I ' I ' I '
- - Sphericalparticles
-\k - - Cubic particles
.6 _ \_iOg serfaOe_ea.tOvolutherati
.4 - "\\
.2-
, I , I , I , I , I , I , I ,'T'I'-,--
0 1 2 3 4 5 6 7 8 9
Dust accumulation, mgJcm2
Figure 27.--Predicted tmrmmittanceof a glasscoverslip with varying amountsof dust. The model has been extended to incorporate the lunar particlesize distribution from 1 to 1(300_.n. Spherical and cubic particl_ arecompared.
perform at 70 percent efficiency, whereas a solar cell would
receive less than 20 percent of its optimal illumination. Fromthese estimates, it can be seen that the penalties for
photovoltaics are predicted to be more substantial than thosefor radiators.
To a first approximation, the relative transmittance of light
through a solar cell surface is proportional to relative power
output. Therefore, these curves reflect the potentially serious
impact of lunar dust on the cell output. Naturally, the optical
absorption by the particles varies with wavelength. Similarly,solar cells "respond" to limited bands of the electromagnetic
spectrum. Thus a more complete model would show a wave-
length dependence. In addition, the inclusion of minor factors,such as light refraction at the surface and diffraction off
particles, may help to develop the model.To obtain a complete assessment of the potential interference
of lunar dust with power component performance, it will be
necessary to address the many associated factors in furtherstudies. These include analysis of the complex adhesion
behavior of lunar particles to power surface materials on the
Moon, experimental confirmation of particle trajectories and
accumulation, further evaluation of power component per-
formance with lunar dust coverage, and possible techniques to
prevent or remove lunar dust from critical surfaces.
.8
E
"6t_
r't"
Performance Penalties With Time
By invoking the earlier scenario of an O2/H 2 propulsionexcursion vehicle with 26 800-N thrust servicing the lunar
base twice a year, one can estimate the performance of dust-
covered radiators and photovoitaic arrays as a function oftime. The dust accumulations predicted in figure 22 have
been combined with the performance decays of radiators
25

(fig.25)andphotovoltaicarrays(fig.27)toindicaterelation-shipsbetweenperformanceanddistance,andperformanceandtime.In figure28,model2hasbeendevelopedtoshowtheperformanceof Stirlingengineradiatorsandphoto-voltaicarraysasafunctionofdistancefromthelandingsiteafter5yr (10missions).Forbothradiatorsandarrays,theperformanceisgreatlyreducedwithin500mofthelaunchpad,andgraduallyimproveswithdistance.By1km,thepredictedpenaltiesforradiatorsareverysmall,if it isassumedthat no
thermal barrier exists between the dust layer and the radiator.
For photovoltaic arrays, the dust accumulation from 10 lunar
missions can be expected to reduce performance to roughly
40 percent at 1 km and 90 percent at 2 km.
Figure 29 shows the progressive degradation in Stirlingengine radiator performance over time for various distances,
as derived from model 2. As discussed previously, when the
accumulation is less than l l-lam thick, the theoretical
performance is enhanced by the high emittance of lunar soil.For radiators within 1 kin, however, the dust accumulation
resulting from 10 surface missions is sufficient to inhibit heat
rejection and degrade performance.
The comparable plot of photovoltaic array performance
with time is shown in figure 30. Arrays located within 1 km
of the landing site, in particular, experience rapid deterioration
in performance in 5 yr. An array at 500 m will be reduced to
85 percent of original performance after 3 mo; at 1 km and
1.5 km, performance will degrade to 85 percent by 1 yr and
2.5 yr, respectively. From these projections it is clear thatdust from lunar excursion vehicles alone constitutes an
enormous threat to power system components. Additional
dust suspended by rovers and mining and construction
operations will significantly magnify the predicted degradation.
Furthermore, although inconsequential individually, the
accumulations resulting from primary and secondary meteoroidimpacts, electrostatic levitation at the terminator, and humanactivities on foot will also contribute to the net deterioration
of component performance.
Implications and Alternatives
The most obvious way to reduce lunar dust accumulation
might be to position power components as faraway as possible
from the center of base activity. The reduced exposure to dust
must be balanced against the penalties of cabling power great
distances. At best, the resulting compromise will still leave
power components vulnerable to a number of dust sources
unless additional measures are incorporated.
Unfortunately, evidence indicates that lunar dust adheres
readily to a variety of surfaces. Mechanical removal techniques
would be astronaut-intensive and logistically very difficult
because of the large surface areas necessarily involved.
Restoring surfaces to original clean condition is not likely,
and removal processes could abrade the surfaces. For these
reasons, removal would be performed only rarely, and yet it
1.2
1.08
.8
R .6
"_ .4
n.-
.2
m
-- Stirlingengine _
//
I Photovoltaic /f
array /
500 1000 1500 2000 2500
Distance from landing site, m
Figure 28.--Predicted radiator and photovoitaic array performance with dis-
tance from landing site after 5 yr (10 missions) of a 26 800-N excursion
vehicle. It was assumed that the dust profile produced by launch is
equivalent to that from landing, and that thrust is proportional to distance
and to the square root of particle flux. Data was derived from model 2.
1.10
1.05
e-
_ 1.00
® .95Q.
"_ .90
__ .85
.80
.750
Distance fromlanding site,
m
50010001500
............... 20002500
Numberof lunar missions0 1 2 3 4 5 6 7 8 9 10
_ __.
_ _
I I I I1 2 3 4 5
Time,yr
Figure 29.--Predicted Stirling engine radiator performance after the accumu-
lation of lunar dust resulting from the launch and landing of 26 800-N
lunar excursion vehicles. This projection, derived from model 2,
compares radiator performance as a function of time for different distances
from the landing site. Notice that small accumulations actually enhance
performance, providing that the dust/radiator interface is not a thermalbarrier.
26

1.2
1.0
_, .6
rr .2
Distancefromlandingsite,
m
50010001500
............... 20002500
Numberof lunarmissions1 2 3 4 5 6 7 8 9 10
I I I I I I I I I
I I I I1 2 3 4 5
Time,yr
Figure 30.--Predicted photovohaic array performance after the accumulation
of dust resulting from the launch and landing of 26 800-N lunar excursion
vehicles. This projection, derived from model 2, compares array perfor-
mance as a function of time for different distances from the landing site.
is likely to be unacceptable to allow surfaces to acquire dust
accumulations that would periodically reduce performance.
Consequently, the solution to lunar dust accumulation on
sensitive surfaces becomes one of prevention rather thanremoval.
Therefore, a defensive position is recommended against
dust accumulation. First, where possible, dust suspensionshould be reduced to a minimum. In some cases this could be
accomplished by simple measures, such as improved fenders
for surface roving vehicles, more flexible spacesuits, or
restricted access to sensitive areas. On a grander scale, base
layout could be designed specifically to reduce dust suspension,
separating power components as far as possible from rocket
activity, perhaps using natural landspace features for protection.
Launchpads might be glazed, and tracks or compacted roads
could be constructed for regular traffic routes. It could be
helpful to lay platforms in access areas and to separate hmar
ores from regolith material in situ so that minimal amounts of
soil are transported to the central base area. Unfortunately,
this degree of defense may require more resources and man-
power--both in the design stages and in actual baseconstruction--than is available.
For dust that is inevitably suspended despite all measures,
an extra defensive strategy may be necessary. Protectivemechanical barriers or dust screens might be used to prevent
penetration into the vicinity of sensitive equipment. Such
screens could be activated by a signal from a flag made of a
piezoelectric film, like polyvinylidene difluoride (J. Graf,
1990, NASA Johnson Space Center, Houston, TX, personal
communication; and Amato, 1989). When the dust subsides,
the screens could be withdrawn. Lunar particles may be
triboelectrically charged during disturbances like rocket blasts,
and therefore an electrostatic fence might be a method for
diverting these particles from photovoltaic arrays or radiators.
A high voltage, altemating potential could prevent dust buildup
on the fence itself, while deflecting both positively and
negatively charged particles. Preliminary laboratory studies
will help to establish the charge of disturbed lunar particles as
well as the motion of these particles under the influence of anelectric field in vacuum.
Summary of Results
The Moon is a hazardous place for surfaces sensitive to dust
accumulation. The transport of large amounts of lunar dust
can be expected. Aside from natural sources of suspended
dust, several forms of human activity on a lunar base, including
walking, operating surface vehicles, mining and construction,
and most importantly, rocket launch and landing, will disturb
significant amounts of dust. Components returned from the
Surveyor III proved that significant accumulation had occurred
at a distance of 155 m from an Apollo lunar landing. From
shadowing and pitting, the average particle velocity was
estimated to be between 40 and 100 m/s, arriving at an angle
of almost 0° during touchdown. From this evidence, the
overall particle velocity distribution was modeled for three
cases, and accumulation distributions were subsequently
derived. These distributions predict that surfaces will acquiresubstantial accumulations of lunar dust from a lunar module-
type descent engine even up to distances of 2 kin. Future
lunar excursion vehicles that would service a permanent base
are likely to require higher thrust levels and to descend and
ascend frequently. As an example, the dust accumulation
distribution resulting from the launch and landing of a
26 800-N vehicle has been predicted as a function of time
and distance from the landing site. With the additionalcontributions of other human activities, lunar dust accumulation
on sensitive surfaces is likely to be an enormous problem--
particularly for power system components. Therefore, the use
of photovoltaic arrays and radiators will be successful provided
lunar dust effects are considered in their design and use.
Otherwise, the performance penalties could be severe.
Two models were developed to estimate the associated
performance reduction of radiator surfaces and photovoltaic
arrays. Both predict exponential decay with increasing
accumulation. For radiators, very thin dust layers may actually
enhance performance because of the high emissivity of lunardust if the first layer is in intimate thermal contact with the
radiator. A layer of more than about 11 larn would limit the
ejection of heat because the thermal conductivity of lunar soil
is extremely poor. The model for photovoltaic arrays estimates
27

thereductioninrelativepoweroutputbycalculatingtherelativelight transmittancethrougha dust layer. The general
exponential relationship between transmittance and dust
accumulation was confirmed by preliminary experimentalmeasurements. The penalties for both photovoltaic and radiator
surfaces are significant from dust accumulations that can be
reasonably expected from normal lunar base activities. Lunar
particle adhesive forces are reported to be so strong that dust
removal techniques are likely to be unsuccessful. Therefore,
a defensive position against accumulation is recommended.
Such an approach might include barriers, electrostatic particle
fences, glazed launchpads, compacted roads, and improved
vehicle fenders in addition to strategic placement of power
components on a lunar base.
Acknowledgments
The authors wish to gratefully acknowledge Curtis Stidham,
Sverdrup Technology, Inc., and Bruce Banks, NASA Lewis
Research Center, for their insight into lunar rover particle
ejection and many other useful discussions. The authors also
thank Robert Siegel, NASA Lewis Research Center, for his
helpful guidance in heat transfer calculations.
Lewis Research Center
National Aeronautics and Space Administration
Cleveland, Ohio, May 30, 1991
28
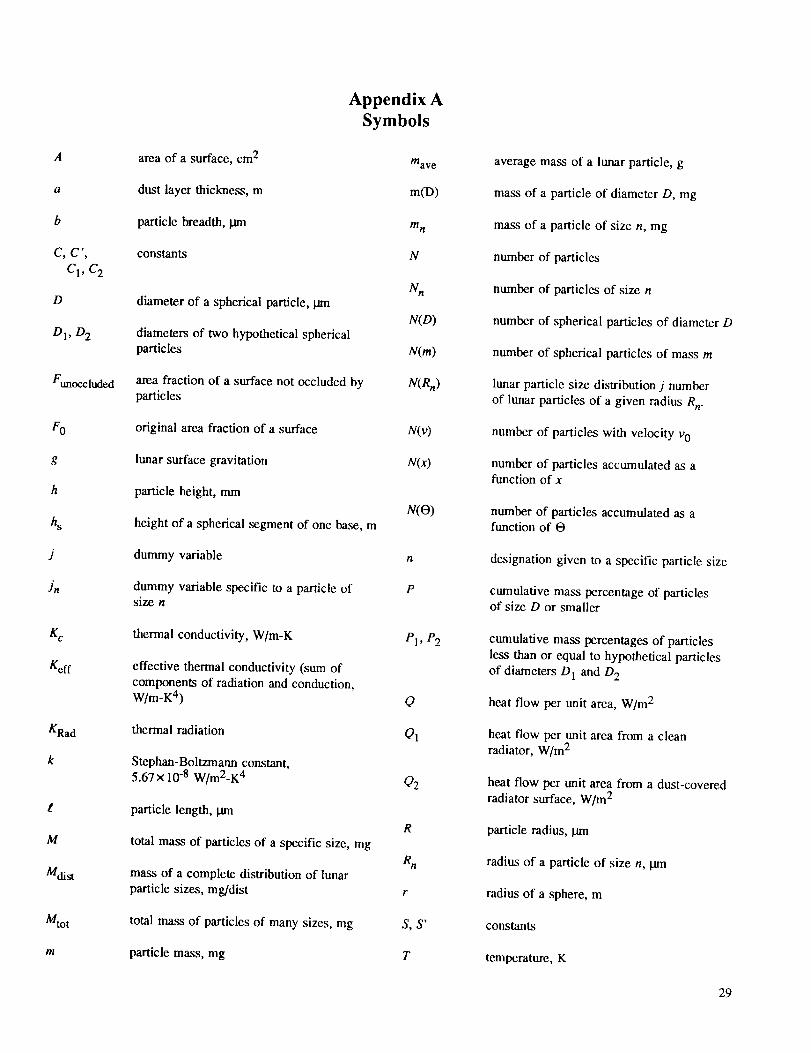
A
a
b
C,C',
Q, C2
D
D 1, D 2
Funoccluded
g
h
hs
J
Jn
r ff
KRad
k
t
M
Mdist
Mtot
m
area of a surface, cm 2
dust layer thickne_, m
particle breadth, pm
constants
diameter of a spherical particle,
diameters of two hypothetical spherical
particles
area fraction of a surface not occluded byparticles
original area fraction of a surface
lunar surface gravitation
particle height, mm
height of a spherical segment of one base, m
dummy variable
dummy variable specific to a particle ofsize n
thermal conductivity, W/m-K
effective thermal conductivity (sum of
components of radiation and conduction,W/m-K 4)
thermal radiation
Stephan-Boltzmann constant,
5.67 x 10 -8 W/m2-K 4
particle length, _rn
total mass of particles of a specific size, mg
mass of a complete distribution of lunar
particle sizes, mg/dist
total mass of particles of many sizes, mg
particle mass, mg
Appendix A
Symbols
mare
m(D)
?tl n
N
N,,
N(D)
N(m)
N(R,,)
N(v)
N(x)
N(O)
n
P
P1, P2
Q
QI
Q2
R
r
S,S'
T
average mass of a lunar particle, g
mass of a particle of diameter D, mg
mass of a particle of size n, mg
number of particles
number of particles of size n
number of spherical particles of diameter D
number of spherical particles of mass m
lunar particle size distribution j number
of lunar particles of a given radius Rn.
number of particles with velocity v 0
number of particles accumulated as afunction of x
number of particles accumulated as afunction of O
designation given to a specific particle size
cumulative mass percentage of particlesof size D or smaller
cumulative mass percentages of particles
less than or equal to hypothetical particles
of diameters D 1 and D 2
heat flow per unit area, W/m 2
heat flow per unit area from a cleanradiator, W/m 2
heat flow per unit area from a dust-covered
radiator surface, W/m 2
particle radius, prn
radius of a particle of size n, I.tm
radius of a sphere, m
constants
temperature, K
29

Tspace
rl
r2
t
V
Vrot
Vtrans
v0
Voy
Vy(t)
average effective temperature of space fora vertical radiator on the lunar surface
aligned with the lunar ecliptic
temperature at the surface of a clean
radiator, K
temperature at the surface of a dust layer
on a radiator, K
time, s
volume of a particle, lam3
volume of a particle of size n, ]am3
volume of a spherical segment of one
base, m 3
component of a particle's velocity vectorassociated with a rover wheel's rotation, m/s
lunar roving vehicle's velocity vector, m/s
total velocity vector of a particle ejected froma rover wheel, m/s
component of a particle's velocity vectorassociated with the translational motion of
a rover wheel, m/s
initial particle velocity, m/s
initial particle velocity in the verticaldirection, m/s
particle velocity in the vertical direction asa function of time
horizontal distance traveled by a particle
ejected by a lunar rover wheel, m
Ymax
Zn
(X
Otn
Y
e2
®
"_2
unit vector in the x direction
vertical position in a particle trajectory, m;unit vector in the y direction
maximum height of particle trajectory, m
diagonal of a cubic particle of size n, larn
cross-sectional area of a particle, cm 2
cross-sectional area of a particle of sizen, cm 2
mean velocity in normal-type velocitydistribution, m/s
relative transmittance of a lunar particle
emittance of a radiator surface
emittance of lunar dust
rover wheel angle def'ming the point of
particle ejection
material density of a particle, g/cm 3
standard deviation in normal-type velocity
distribution, m/s
optical transmittance of a clean surface
optical transmittance of a dust-coveredsurface
particle ejection angle
30

Appendix BLunar Particle Size Distribution
The data available about the particle size distribution of
lunar soil is always presented as a "cumulative weight
percentage distribution" -- that is, as "percent freer by weight"
as a function of particle size. This is directly related to the
method by which the distribution is measured: a knownamount of lunar soil is sieved through a succession of meshes
with smaller and smaller openings. The total weight (these
authors prefer to use "mass") of material that passes through
a screen is plotted against that size opening. Considering theintricacies of handling and weighing minute quantities of
particles, different laboratories show general agreement for
similar soils. Consistently, the entire distribution lies between
1 mm and roughly 1 Inn. The cumulative mass percentage of
particles is fairly logarithmically linear with particle size.
The negative slope indicates that the soil is heavily skewedtoward finer size fractions.
Occasionally it is more useful to have a particle size dis-
tribution in the form "number of particles" versus particle size
or particle mass. This distribution can be achieved through
manipulation of the cumulative percentage distribution.
Consider figure 31--for every size interval AD, the corre-
sponding AP is defined as P1 (the percent of particles of mass
less than that associated with D1) , subtracted from P2 (the
percent of particles of mass less than that associated with D2) ,
which yields AP (the total mass percent falling between D 1
and D2). In the limit as AD_,0, the mass percent of allparticles of size D is dP/dD evaluated at D. Since the abso-
lute mass of particles only differs from the mass percent of
particles of size D by the constant "total mass/100," we can
treat dP/dD as the absolute mass of particles. For a general
particle size D,
dP
dD N(O)[m(D)] (B1)
where m(D) is the mass per particle of size D, and N(D) is the
number of particles of size D, which we are trying to establish.
Mass is generally related to the cube of particle size--the
constants associated with density and shape can be ignored
for the time being. Therefore,
N(D) (D 3 )dD (B2)
Since the distribution P is logarithmic in D, dP/dDo_ I/D.
Therefore, the number of particles of a given size becomes
1
N(D) o_D----Y (B3)
Any neglected constants are automatically accounted for bynormalizing the distribution function over all particles, from
1 to 1000 [am:
100o/am t000 _m
I=C, f I"-_-dD- -CtD-3 ID4 3 =C,3
1/am I pan
for C 1 = 3 (B4)
So finally,
3
N(D) = D-"; (B5)
100 --
E 80 -
>- 60
° / °°°
0 [ I , I ,I,l,I I i I,l,l,I I , 1,1,1,]
100 101 102 103 104
Particle size. prn
Figure31.--Example of a cumulative mass percentage distribution; thestandard format of a lunar particle size distribution.
Particle mass, g
10-12 10-10 10-8 10-6 10-4 10-2
102 I I I I I® .o
-_ 10 0
"_. 10-2
"610-4
.0
lo-8 ic
lo-8_ 10-10
n- 10_12 ___
10 0 101 10 2 10 3
Particle size, p.m
Figure 32.--Lunar particle size distribution, derived from a cumulative weight
percentage distribution and normalized from 1 to 1000 [an to show relative
number of panicles of a given size.
31

givestherelative number of particles for a given size D. This
is shown in figure 32.The distribution can also be written as a function of particle
mass N(m), using the relation
D o_ml/3 (B6)
N (m ) = m -'/3 (B7)
Again this is easily normalized. Assuming spherical particlesof material density 3 g/cm 3, the limits of integration become
1.57×10 -12 g (1-_ma particles) and 1.57x10 -3 g (1-mm
particles).
157X10 -3 g 1.57 X 10 -3 1 t
1--c2 I1-57x10-12 g 1.57 x 10¹²
C2 = 1.16×10 -4
(138)
N(m)=l.16xlO-*(m -_¢3) (B9)
This is also shown in figure 32.
As a final note it should be mentioned that although particles
smaller than 1 l.an are normally off the end of cumulative
particle size distributions (and are, therefore, not included in
these modified distributions), their numbers may actually be
significant. In fact, large numbers of submicrometer particleshave been observed in many microscopic investigations. The
inconsistency occurs because the finest particles adhere very
tenaciously to larger particles, both because of the frictionalelectrostatics created by sieve shakers and because of
laboratory moisture. Consequently, these fine particles do
not penetrate the screens despite their size. Unforumately this
size fraction of unestablished population may represent those
particles most readily transported and accumulated on
vulnerable power surfaces.
32

Appendix C
Modeling Relative Transmittance of a Dust-Covered
Surface for Particles of Different Sizes and Shapes
The general model for the relative transmittance of a surface
with a given weight of dust is developed in much the same
way as for the specific case in which only one particle size is
present. Now, however, the probability terms for all possible
sizes are multiplied together:
(C1)
Each term corresponds to the probability that a particle with
cross-sectional area otn, does not cover an imaginary point on
the total surface A. Then N n is the number of particles of sizen. If the particles are spherical, then
= m_....__,_ m, _ 3m, A _ 3m,j,7
N. V.p 4trR3p 4zR2R.pA 4R.pA (C2)3
where M n is the total weight of all particles of size n, Vn isthe volume of a particle of size n, p is a particle's density, and
the dummy variable Jn is ?A/Otn, as before. The relativetransmittance then becomes
r- . 3..__
/ra3%7
Each bracketed term equals exp (-1) by the following:
(C3)
1..I/,±71°j. --> _L _" J. ) J = exp (-a) (c4)
Recall, A>>tXn, and so j is large. Therefore, the relativetransmittance simplifies to
-- - + m2 + "" (C5)g L4PA _ R2 R )j
In order to proceed further, a more useful form of m n is
necessary, in terms of the measurable value Mtot, the totalmass of dust:
(C6)
In this equation, the bracketed term is the number of particles
of a given size n. The function N(Rn) may be recognized asthe distribution function of lunar soil normalized for all radii
from 0.5 to 500 larn. The parameter Mdist is the effectivemass of one complete distribution of lunar soil, related toN(R) as follows:
Me_ ' = f N(R)V.pdRall R
500 gm
0.5ktm
--4(3×10⁹)(,n500- .0.5t= 1.63 x 10 -g lag / dist (C7)
Combining all the constants in equation (C5) as S yields arelative transmittance of
Z'-L2: exp1-37 (Mto,)SFN (R,) R_ + N(R 2) R_ +Z1 [ 4pA " L R1 R2
• "" +N(R.)-_]} (C8)
The solution to the series of terms in brackets in equation (C8)
is found by integrating for all R
_'2="t'l exp[ ___A7(Mtot) S allfN(R)RZdRR
33

500_m 1
siam1-- (C9)
exP[4-'-_A(Mt°t)S-_(-_R)o.sp.m_ ]
The values for 7 and p, 0.45 and 3.0 g/cm 3, respectively, are
substituted; and units are adjusted to give the predicted relative
transmittance for spherical particles:
where Mtot/A can be measured experimentally in mg/cm 2.
Similarly, a model is developed for cubic particles of the
same size distribution. For this case, particle length zn corre-sponds to the cube diagonal. Because of the different shapefactor, equation (C4) looks like
_'2
= exppA[ zl Zz
(c11)
and Mdist equals 1.196x 10 -8 mg/distribution. Equation (C7)takes the form
7:2 = exp I-a/-3?' (Mta)S'
x + N(ZzI"2+...+N(z,,)7.2
(c12)
Integrating over all z, yields
= exp
1000p.m 1-_'3Y (Mto t 3__az--;; )s,f z_
1gm
(C13)
The curves for the spherical and cubic particle models are
shown in figure 25.
34

References
Allen, L.H.: The Lunar Sunset Phenomenon. Surveyor: Program Results,
NASA SP- 184, 1969, pp. 413-418.
Amato, I.: Fantastic Plastic. Science News, vol. 136, no. 21, Nov. 18, 1989,
pp. 328-329.
Anderson, D.L., et al.: Particle Impact and Optical Property Analysis of the
Surfaces of Surveyor 3 Materials. Analysis of Surveyor 3 Material and
Photographs Returned by Apollo 12, NASA SP-284, 1972, pp. 76-88.
Apollo 12 Technical Crew Debriermgs 0.1), Dec. 1, 1969, Manned Spacecraft
Center, Houston TX.
Baker, D.: Lunar Roving Vehicle: Design Report. Spaceflight, vol. 13, no. 7,
July 1971, pp. 234-240.
Banks, B.A., et al: Arc-Textured Metal Surfaces for High Thermal Emittance
Space Radiators. NASA TM- 100894, 1988.
Brownlee, D.E.; Bucher, W.; and Hodge, P. : Primary and Secondary M icrome-
teoroid Impact Rate on the Lunar Surface; A Direct Measurement. Analysis
of Surveyor 3 Material and Photographs Returned by Apollo 12, NASA
SP-284, 1972, pp. 143-151.
Carrier, D.: Gootechuleal Considerations. The Lunar Source Book, G.H.
Heiken, D.T. Vaniman, and B.M. French, eds., Cambridge University Press,
Chap. 7.2, 1991.
Carroll, W.F.; and Blair, Jr., P.M.: Lunar Dust and Radiation Darkening of
Surveyor 3 Surfaces. Analysis of Surveyor 3 Material and Photographs
Returned by Apollo 12, NASA SP-284, 1972, pp. 23-28.
Carroll, W.F., et al.: Retumext Surveyor 3 Hardware: Engineering Results.
Analysis of Surveyor 3 Material and Photographs Returned by Apollo 12,
NASA SP-284, 1972a, pp. 15-21.
Carroll, W.F., et al: Introduction. Analysis of Surveyor II1 Material and
Photographs Returned by Apollo 12, NASA SP-284, 1972b, pp. 1-8.
Cour-Palais, B.G., et al.: Results of Examination of the Returned Surveyor 3
Samples for Particulate Impacts. Analysis of Surveyor 3 Material and
Photographs Returned by Apollo 12, NASA SP-284, 1972, pp. 158-167.
Cremers, C.J.; and Birkebak, R.C.: Thermal Conductivity of Fin_ From
Apollo 12. Proc. 2nd Lunar Science Conference, Vol. 3, MIT Press, 1971,
pp. 2311-2315.
Criswell, D.R.: Horizon-Glow and the Motion of Lunar Dust. photon and
Particle Interactions With Surfaces in Space, R.J.L. Grard, ed., D. Reidel
Pub. Co., Dordrecht-Holland, 1973, pp. 545-556.
Duke, M.B., et al.: Lunar Soil: Size Distribution and Mineralogical Constitu-
ents. Science, vol. 167, Jan. 30, 1970, pp. 648-650.
Hammock, W.R., Jr., Currie, E.C.; and Fisher, A.E.: Apollo Experience
Report--Descent Propulsion System. NASA TN D-7143, 1973.
Humphries, C.E.; and Taylor, R.E.: Apollo Experience Report--Ascent
Propulsion System. NASA TN D-7082, 1973.
Inculet, I.I.; and Criswell, D.R.: Electrostatic Beneficiation of Ores on the
Moon Surface. Electrostatics 1979, J. Lowell, ed., Institute of Physics,
Bristol, England, 1979, pp. 45-53.
Jaffe, L.D.: Blowing of Lunar Soil by Apollo 12: Surveyor 3 Evidence.
Analysis of Surveyor 3 Material and Photographs Returned by Apollo 12,
NASA SP-284, 1972, pp. 94-96.
Jaffe, L.D., et al: Principal Scientific Results From the Surveyor Program.
Surveyor: Program Results. NASA SP- 184, 1969, pp. 13-17 (Also, Icarus,
vol. 12, pp. 156-160).
Jaffe, L.D.; and Steinbacher, R.H.: Introduction. Surveyor: Program Results.
NASA SP-184, 1969, pp. 1-12.
Keihm, S.J.; and Langseth, M.G., Jr.: Surface BrightnessTemperatures at the
Apollo 17 Heat Flow Site: Thermal Conductivity of the Upper 15 cm of
Regolith. Proc. 4th Lunar Science Conference, W.A. Gose, ed., Pergamon
Press, 1973, Vol. 3, pp. 2503-2513. (Also, Geochim. Cosmochim. Acta,
Suppl. 4).
Langseth, M.G., Jr.; Keihrn, S.J.; and Chute, J.L., Jr.: Heat Flow Experiment.
Apollo 17 Preliminary Science Report, NASA SP-330, 1974, pp. 9-1 to9-24.
Logan, L.M., et al.: Midinfrared Emission Spectra of Apollo 14 and 15 Soils
and Remote Compositional Mapping of the Moon. Proc. 3rd Lunar Science
Conference., Vol. 3, D.R. Criswdl, ed., MIT Press, 1972, pp. 3069-3076.
(Also, Geochim. Cosmochim. Acta, Suppl. 3).
Lunar BaseLaunch and Landing Facility Conceptual Design. (EEI-88-178,
Eagle Engineering Inc.; NASA Contract NAS9-17878),NASA CR- 172049,
1988.
McKay, D.S.; Fruland, R.M.; and Heiken, G.H.: Grain Size and the Evolutionof Lunar Soils. Proc. 5th Lunar Science Conference, Vol. l, W.AGose, ed.,
Pergamon Press, 1974, pp. 887-906.
Milwitz.ky, B.: Preface. Surveyor Program Results, NASA SP-184, 1969,
pp. v-vii.
Milwitzky, B., and Dwornik, S.E.: Introduction. Surveyor I11: A Preliminary
Report, NASA SP-146, 1967, pp. 3-7.
Mitchell, J.K., et al.: Soil Mechanics Experiment. Apollo 14 Preliminary
Science Report, NASA SP-272, 1971, pp. 87-108.
Morris, O.: Apollo 17 Mission Report. NASA TM X-69292, JSC-07904,
1973.
Morris, R.V., et al.: Handbook of Lunar Soils, Part I: Apollo 11 - 15, and Part
11: Apollo 16-17. JSC-19069, NASA Johnson Space Center, July 1983.
Mullis, C.H.: A Study and Analysis of the MSFC Lunar Roving Vehicle Dust
Profile Test Program. NASA CR- 121075, 1971.
Nickle, N.L.: Dynamic Considerations of Dust on the Television Camera
Mirror. Analysis of Surveyor 3 Material and Photographs Returned by
Apollo 12, NASA SP-284, 1972, pp. 51-59.
Nickel, N.L, and Carroll, W.F.: Summary and Conclusions. Analysis of
Surveyor I[I Material and Photographs Returned by Apollo 12, NASA
SP-284, 1972, pp. 9-13.
Papike, J.J.; Simon, S.B.; and Laul, J.C.: The Lunar Regolith: Chemistry,
Mineralogy, and Petrology. Rev. Geophys. Space Phys., vol. 20, no. 4, Nov.
1982, pp. 761-826.
Pelizzari, M.A.; and Criswell, D.R.: Lunar Dust Transport by Photoelectric
Charging at Sunset. Proc. 9th Lunar Planetary Science Conference, Vol. 3,
R.B. Merrill, ed., Pergamon, 1978, pp. 3225-3227.
Phillips, P.G.; Simonds, C.H.; and Stump, W.R.: Lunar Base Launch and
Landing Facilities Conceptual Design. Lunar Bases & Space Activities in
the 21st Century, Apr. 1988, Houston, TX, Paper No. LBS-88-196.
Rennilson, J.J.; and CrisweU, D.R.: Surveyor Observations of Lunar Horizon-
Glow. The Moon, Vol. 10, June 1974, pp. 121-142.
Rennilson, J.; Holt, H.; and Moll, K.: Changes in Optical Properties of the
Surveyor 3 Camera, Analysis of Smweyor 3 Material and Photographs
Returned by Apollo 12, NASA SP-284, 1972, pp. 60-76.
Rhee, J.W.; Berg, O.E.; and Wolf, H.: Electrostatic Dust Transport and Apollo
17 LEAM Experiment. COSPAR Space Research, Vol. 17, Pergamon
Press, 1977, pp. 627-629.
Satkiewicz, F.G.; and Marmo, F.F.: Sputter-lon Source Mass Spectrometer
Analysis of Samples Cut From the Surveyor 3 Camera. Analysis of
Surveyor 3 Material and Photographs Returned by Apollo 12, NASA
SP-284, 1972, pp. 91-94.
Scott, R.F., et al.: Preliminary Geologic Investigation of the Apollo 12 Landing
Site: Mechanical Properties of the Lunar Regolith. Apollo 12 Preliminary
Science Report, NASA SP-235, 1970, pp. 161-182.
Scott, R.F.; Roberson, F.I.; and Clary, M.C.: Soil Mechanics Surface Sampler:
Lunar Surface Tests and Results, Surveyor Ill: A Preliminary Report,
NASA SP- 146, 1967, pp. 61-93.
Smith, R.E., and We,st, G.S., compilers: Space and Planetary Environment
Criteria Guidelines for Use in Space Vehicle Development, Vol. l, 1982
Revision, NASA TM-82A78, 1983.
Strangway, D.W.: Moon: Electrical Properties of the Uppermost Layers.
Science, vol. 165, Sept. 5, 1969, pp. 1012-1013.
Taylor, S.R.: Lunar Science: A Post-Apollo View. Pergamon Press, New
York, 1975.
35

Weiblon, P.W.; and Gordon, K.L.: Characteristics of a Simulant for Lunar
Surface Materials. Lunar Bases & Space Activities in the 21 st Century, April
1988, Houston TX, Paper No. LBS-88-213.
West, G.S. Jr.; Wright; J.J.; and Euler, H.C., eds.: Space and Planetary Criteria
Guiddines for Use in Space Vehicle Development. NASA TM-78119-
REV., 1977.
Zook, H.A., et al.: The Interplanetary Micrometeorold Flux and Lunar Primary
and Secondary Mieroeratea's. Properties and Interactions of Interplanetary
Dust, R.H. Giese and P. L,amy, eds., D. Reidel Pub. Co., Dordrechl-Holland,
1985, pp. 89-96.
Zook, FI.A., et al.: Lunar Primary and Secondary Microcratets and the
Micrometeoroid Flux. 15th Lunar and Planetary Science Conference, 1984,
pp. 965-966.
36


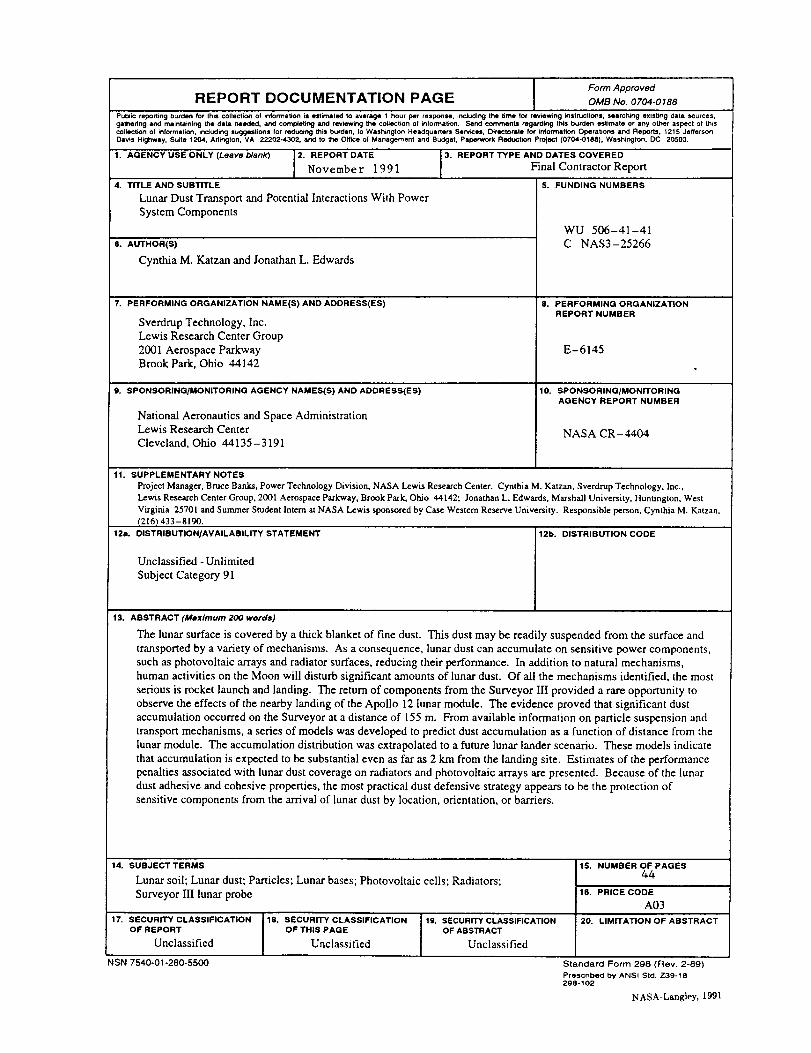
Form Approved
REPORT DOCUMENTATION PAGE OMBNo.0704-0188Public reporttng burden for this cOlleclion of information is estimatsd to average 1 hour per response, including the time tot revmwing inslructio_s, searching existing data sources,gathering and maintaining the data needed, and completing and reviewing the coltact_onof intor'mat,_n. Send comments regarding this burden estimate or any other aspect ot thiscollection of information, including $uggeelione for reducing this burden. Io Washington Headqua_ers Services, Oitectorllta for information Operations and Reporl$, 1215 JeffersonDavis H_ghwey, Sukte 1204, Arlington. VA 22202-4302, and to _ Office ol Management and Budget, Papenvork Reduction Project (0704-0188), Washington, DC 20503.
1. AGENCY USE ONLY (Leave #/ank') 2. REPORT DATE i 3. REPORT TYPE AND DATES COVERED
November 19 91 Final Contractor Report
4. TITLE AND SUBTITLE 5. FUNDING NUMBERS
Lunar Dust Transport and Potential Interactions With Power
System Components
6. AUTHOR(S)
Cynthia M. Katzan and Jonathan L. Edwards
7. PERFORMINGORGANIZATIONNAME(S)AND ADDRESS(ES)
Sverdrup Technology, Inc.
Lewis Research Center Group
2001 Aerospace ParkwayBrook Park, Ohio 44142
9. SPONSORING/MONITORINGAGENCY NAMES(S)ANDADDRESS(ES)
National Aeronautics and Space AdministrationLewis Research Center
Cleveland, Ohio 44135-3191
WU 506-41-41
C NAS3-25266
8. PERFORMING ORGANIZATION
REPORT NUMBER
E-6145
10. SPONSORING/MONITORINGAGENCY REPORT NUMBER
NASA CR-4404
11, SUPPLEMENTARY NOTES
Project Manager, Bruce Banks, Power Technology Division, NASA Lewis Research Center. Cynthia M. Katzan, Sverdrup Technology, Inc.,
Lewis Research Center Group, 2001 Aerospace Parkway, Brook Park, Ohio 44142; Jonathan L. Edwards. Marshall University, Huntington, West
Virginia 25701 and Summer Student Intern at NASA Lewis sponsored by Case Western Reserve University. Responsible person, Cynthia M. Katzan.
(216) 433-8190.
12a. DISTRIBUTION/AVAILABILITY STATEMENT
Unclassified - Unlimited
Subject Category 91
12b. DISTRIBUTION CODE
13. ABSTRACT (Meximum 200 wolds)
The lunar surface is covered by a thick blanket of fine dust. This dust may be readily suspended from the surface and
transported by a variety of mechanisms. As a consequence, lunar dust can accumulate on sensitive power components,
such as photovohaic arrays and radiator surfaces, reducing their performance. In addition to natural mechanisms,
human activities on the Moon will disturb significant amounts of lunar dust. Of all the mechanisms identified, the most
serious is rocket launch and landing. The return of components from the Surveyor III provided a rare opportunity to
observe the effects of the nearby landing of the Apollo 12 lunar module. The evidence proved that significant dust
accumulation occurred on the Surveyor at a distance of 155 m. From available information on particle suspension and
transport mechanisms, a series of models was developed to predict dust accumulation as a function of distance from the
lunar module. The accumulation distribution was extrapolated to a future lunar lander scenario. These models indicate
that accumulation is expected to be substantial even as far as 2 km from the landing site. Estimates of the performance
penalties associated with lunar dust coverage on radiators and photovoltaic arrays are presented. Because of the lunar
dust adhesive and cohesive properties, the most practical dust defensive strategy appears to be the protection of
sensitive components from the arrival of lunar dust by location, orientation, or barriers.
14. SUBJECT TERMS
Lunar soil; Lunar dust; Particles; Lunar bases; Photovoltaic cells; Radiators;
Surveyor III lunar probe
17. SECURITY CLASSIFICATION
OF REPORT
Unclassified
NSN 7540-01-280-5500
18. SECURITY CLASSIFICATIONOF THIS PAGE
Unclassified
15. NUMBER OF PAGES44
i16. PRICE CODE
A03
19. SECURITY CLASSIFICATION 20. LIMITATION OF ABSTRACT
OF ABSTRACT
Unclassified
Standard Form 298 (Rev. 2-89)
Prescribed by ANSI Std, Z39-18298-102
NASA-Lmagley, 1991