Embed Size (px)
Citation preview
Manage your design! Tools and traceability for designing in RUP for Business Intelligence projects
| Manage your design!
Version control
0.1 Monday, 9 October 2006
Start Report
1.0 Friday, 22 December 2006
Concept document
1.1 Tuesday, 9 Januari 2007
Final document
Name author(s): B.R.L. van Baardwijk
| Manage your design!
Manage your design! Tools and traceability for designing in RUP for Business Intelligence projects
Name author: B.R.L. van Baardwijk
Company name: Capgemini Nederland B.V.
Study: Informatics
Place: Utrecht
Date: October 09, 2006
© 2006 Capgemini. No part of this document may be modified, deleted or expanded by any process or means without prior written approval from Capgemini
| Manage your design!
Preface This report is the final milestone for my graduation at the Avans Hogeschool in Breda. I have studied informatics there from 2002 to 2006, and I will graduate on System Management. This research is conducted for Capgemini Utrecht, and more specifically for the Business Intelligence (BI) practices. I feel lucky to have had the opportunity to do my graduation internship at Capgemini. I really enjoyed meeting new people, learning about Business Intelligence and writing this report. The report is especially written for the management of the business intelligence (BI) practices. It is, however, interesting for anyone working in BI projects at Capgemini.
Most of all, I would like to thank Alex Aalberts, my mentor at Capgemini, for taking the time to support me and giving me valuable insights into RUP for BI. Although he was continuously ‘running’ from one client to the other, he always found the time to help me. Thanks Alex!
Secondly, I would like to thank Evert-Jan de Voogd, my teacher, for supporting me from a distance and giving me comments for improvement. I would also like to thank a dozen colleagues from Capgemini for taking the time to help me, especially Jan Paul Fillié and Sandra Wennemers. The most valuable information came from conversations with them.
I would like to conclude by explaining the title of this report; Manage your design! During the development of Business Intelligence systems, important models and designs are developed with tools like Word and Powerpoint. This makes it very difficult to manage changes in designs and to determine how models relate to each other. This research proposes a solution to improve management of these designs.
| Manage your design!
Management summary The Rational Unified Process (RUP) is the standard method for software development used by Capgemini worldwide. Until now, the Business Intelligence practices have not used this method, due to the fact that it is not entirely usable for developing BI systems. Therefore, the RUP is now being adapted to fit for Data Warehouse projects. This new method is called “RUP for BI”.
Although the method is nearly finished, two main issues remain. The first issue lies in the following. The RUP is based on the use of a standard set of tools, called the Rational Toolset. This toolset contains a tool for modeling functional and technical design specifications, Rational Rose. However, this tool cannot be used for designing BI systems because the UML specification does not support (dimensional) data modeling and dataflow modeling. Therefore, this research aims on finding a suitable modeling tool to support the functional- and technical design of BI systems. Such a tool should either be integrated with Rational tools for requirements management, configuration management and change management, or provide for this functionality itself.
The second issue is that in current Data Warehouse projects, designs like a star schema, architecture and even ETL processes are often “designed” in Word or Powerpoint. This obstructs the possibility to manage dependencies between models and manage changes in system requirements.
The following problem statement is derived from the issues above:
How can a RUP for BI model, showing project elements and its dependencies, be supported by modeling tool(s)?
To be able to provide the answer to this question, a traceability model is proposed. The purpose of traceability is to understand the source of requirements (which data elements are linked to which requirement?). The model consists of all the BI specific project elements and their dependencies. It visualizes which elements need to be designed in the development process. From this model, the functional areas of a tool are derived. These are: requirements management, datamodel, dataflow model, BI environment, data integration/ETL, deployment model and functional architecture.
Subsequently, a tool selection method (PBA from Capgemini) has been used to find a suitable tool. A wide range of tools have been evaluated on functionality and usability. These were narrowed down to four tools, which were then assessed in further detail, on functionality, usability, deployment & compatibility, vendor, cost and support.
Only one tool proved to be suitable to support RUP for BI; Sybase Powerdesigner. It provides extensive data modeling functionality but also visual data mapping, requirements management, a repository that enables configuration management, impact analysis for change management and UML modeling (interesting for deployment model). The functionality is very complete and the tool makes traceability manageable, by specifying every element once and linking it to requirements. According to Gartner, Powerdesigner had a 34% market share in 2005.
By assessing to which extent the tools cover the traceability model and how tools should be used in conjunction with other tools, the main problem statement can be answered through the following conclusion:
| Manage your design!
Sybase Powerdesigner is the most suitable modeling tool in the market. Using Powerdesigner in combination with a DBMS, ETL tool and BI suite of choice, makes it possible to fully support the RUP for BI lifecycle while managing traceability, making the Rational tools more or less redundant.
To approach the practical side of RUP for BI, a project scenario supported by Powerdesigner is formulated in this report.
This research is the starting point for further investigation. Sybase Powerdesigner is evaluated on functionality and outline usability. The following step is to thoroughly test the functionality with a group of BI experts. This can be achieved by using the project scenario and documentation of existing projects. This should lead to the final decision, whether Powerdesigner should be used as the new modeling standard within the BI practices. If so, the project scenario should be adapted and further detailed, to provide an input for project members.

| Manage your design!
Table of Contents1 Introduction 1
1.1 Introduction 1 1.2 Problem indication 1 1.3 Problem statement 2 1.4 Research questions 3 1.5 Structure of the report 3
2 Theoretical framework 4
2.1 Introduction 4 2.2 Business intelligence systems 4
2.2.1 Introduction 4 2.2.2 Business Intelligence 4 2.2.3 The Data Warehouse 5 2.2.4 The BI project 8 2.2.5 Summary 10
2.3 The Rational Unified Process 10 2.3.1 Introduction 10 2.3.2 Backgrounds 10 2.3.3 Principles and best practices 11 2.3.4 Project Lifecycle 11 2.3.5 Disciplines 13 2.3.6 Process Notation Elements 14 2.3.7 The Rational Toolset 15 2.3.8 Use cases 15 2.3.9 Summary 15
2.4 RUP for BI 15 2.4.1 Introduction 15 2.4.2 Why RUP for BI? 16 2.4.3 Requirements discipline 16 2.4.4 Analysis and design discipline 17 2.4.5 Implementation discipline 18 2.4.6 Summary 18
2.5 Context of the research 18 2.5.1 Introduction 18 2.5.2 What is a modeling tool? 19 2.5.3 Why use a modeling tool? 19 2.5.4 Rational toolset 20

| Manage your design!
2.6 Summary 20
3 Traceability 22
3.1 Introduction 22 3.2 The concept of traceability 22 3.3 Areas of specification 22
3.3.1 Configuration and change management 23 3.4 Explanation of the model 23 3.5 Artifacts 24 3.6 Summary 24
4 Selection methodology 25
4.1 Introduction 25 4.2 The PBA method 25 4.3 Research structure 25
4.3.1 Pre-study phase 25 4.3.2 Requirements phase 25 4.3.3 Package selection phase 25 4.3.4 Process model 26
4.4 Summary 26
5 Research definition and results 27
5.1 Introduction 27 5.2 Pre-study 27
5.2.1 The requirements 27 5.2.2 Selection of tools 27 5.2.3 The longlist 28
5.3 Requirements definition 30 5.3.1 Detailed requirements 30 5.3.2 Shortlist 30 5.3.3 Reference model 30
5.4 Package selection 30 5.4.1 Tool tests 31 5.4.2 Evaluation 31
6 Conclusions and recommendations 36
6.1 Introduction 36 6.2 Traceability 36 6.3 Modeling tools 36
6.3.1 Configuration and change management 37 6.4 Conclusions 38 6.5 Recommendations 38

| Manage your design!
7 Project scenario 39
7.1 Using Sybase Powerdesigner in a project 39 7.1.1 Requirements discipline 39 7.1.2 Analysis & design discipline 39 7.1.3 Implementation discipline 40 7.1.4 Other 40 7.1.5 Project overview 41 7.1.6 Traceability covered 42
References 43
Appendix A: artifacts and traceability i
Appendix B: longlist and shortlist iii

| Manage your design!
1
1 Introduction
1.1 Introduction In this chapter, the topic of research for this study will be introduced. The problem indication is formulated in section 1.2. The problem indication leads to the formulation of the problem statement, which will be provided in section 1.3.
1.2 Problem indication Within Capgemini RUP is chosen as the standard method for software development. RUP is a method based on iterative development in especially Object Oriented environments. It focuses on making risks manageable. This is achieved by standardizing as many aspects of projects as possible. For example:
• Detailed descriptions of activities, which point out in detail per role, discipline and phase which activities should be carried out in a project;
• Templates, guidelines and examples of milestone products (called artifacts in RUP);
• Focus on removing specified risks as early as possible and proving the feasibility of solutions;
• The use of tooling to connect the needs and features to the underlying ‘software requirements’ (functional specifications) and to relate those to the design models of the technical components to build;
The Business Intelligence (BI) practices wish to make use of RUP for the development of BI systems. However, the standard RUP method is not completely suited for Business Intelligence. RUP is based on Object Orientation and Use Cases, which respectively describe the technical composition of the solution and the interaction of the user with the system. Within Business Intelligence the definition of a system is based on the information that is made available to the end users (by means of analyses or reporting), the sources from which this information is transformed and how it is transformed. This is visualized in so called dataflows (source, transformations and reportmodel). The dynamic part is thus within the system itself and not in the interaction with the users.
Within Business Intelligence projects the Function point Analysis for DWH (FPA for DWH) is used. This is a method to calculate the scale of BI projects based on the NESMA FPA. This method also uses the concept of dataflows as mentioned above.
The adjustments that are made in RUP to shape ‘RUP for BI’ are mainly the activities in the ‘requirements’ and ‘analysis and design’ disciplines. Within these disciplines, BI specific activities and artifacts are described and specified on outlines. The ‘traditional’ RUP uses the Rational toolset to model requirements, specifications and designs. These tools offer the ability to drill down on specifications from different angles. Next to that, the tools are (integrally) used for configuration and change management.
A research should point out the possibilities of different modeling tools that can be used to support the design and development process of Business Intelligence applications (while using RUP for BI). This could concern tools used for:
| Manage your design!
2
• Designing and managing functional specifications of dataflows (ETL components, data models, cubes, reports, workflows etcetera) 1;
• Designing and managing technical specifications of dataflows (ETL components, data models, cubes, reports, workflows etcetera) 1;
• Requirements management2;
• Change management3;
• Configuration management3.
The goal is to develop a method of working within RUP of BI projects, which can be used to specify and manage all components and levels of a design (requirements, functional, technical), preferably by using tools that enable approaching specifications from different angles (e.g. a table is part of a datamodel, part of a dataflow, is filled by an ETL process and is derived from a functional requirement).
Priority The focus of the research is the following:
1.
• Describing a model which depicts the dependencies between project elements and artifacts;
• Give recommendations on modeling tools that can be used to design and manage functional- and technical specifications and view designs from different angles.
If possible within the time available:
2.
• Give recommendations about tools that enable tracing specifications back to the requirements level. In concrete terms; view how a textual system requirement is linked to the corresponding functional and technical specifications.
3.
• Give recommendations about tools that can provide for configuration- and change management within RUP for BI projects. The most important aspects of these disciplines are version- and release management; it does not concern modeling tools.
1.3 Problem statement The problem statement derived from the problem indication in the previous section is:
How can a RUP for BI model, showing project elements and its dependencies, be supported by modeling tool(s)?
| Manage your design!
3
1.4 Research questions In order to provide an answer to the problem statement, the following research questions have been designed:
Research question I: how should all the project elements in the artifacts of RUP for BI and their corresponding dependencies be captured in a model?
Research question II: which modeling tools enable traceability of the different models designed in the development process of Business Intelligence applications using RUP for BI?
Subquestion I: To which extent do these tools support configuration and change management in RUP for BI projects?
1.5 Structure of the report Basic knowledge of Business Intelligence and data warehousing is required in order to understand the project elements of RUP and how they relate to each other. This is the starting point of the theoretical background provided in chapter two. After the explanation of these concepts, the Rational Unified Process (RUP) method for system development is explained in a nutshell, followed by a detailed description of RUP for BI and how this method deviates from the standard RUP. This concludes chapter two. Chapter three goes into the concept of traceability, it explains how the project elements specific for Business Intelligence are related to each other. A visual representation, the traceability model, is proposed for this purpose. Thereafter, the research methodology (PBA) is discussed in chapter four. It describes which method is chosen for the purpose of tool selection. Chapter five, subsequently, explains how the method was used and elaborates on the results of the research. The conclusions and recommendations are discussed in chapter six, followed by a project scenario, describing how to use the selected tool in practice, in chapter seven.
| Manage your design!
4
2 Theoretical framework
2.1 Introduction This chapter outlines the theoretical framework for this research. It consists of four sections. The first section explains the purposes and components of Business Intelligence (BI) / Data Warehouse systems. Next to that it describes how this is applied practically. The second one describes the basics of the system development method “Rational Unified Process” (RUP), which is used as the standard method within Capgemini. The third section describes how RUP is adapted to fit Business Intelligence projects (RUP for BI). The definition of a modeling tool and why it is useful is explained in section four.
The theoretical background provides a comprehensible story of what Business Intelligence is and how RUP (for BI) could support the development of BI systems. Although, it is a useful introduction to readers without prior knowledge of Business Intelligence and RUP (for BI), a background in IT, and more accurately databases and system development in general, is expected.
In some cases www.wikipedia.com is used as a reference. Although this is not always the most reliable source, the articles about data warehousing and related subjects used for the theoretical background are very complete and accurate. Moreover, the articles are mostly based on the books of Inmon and Kimball, whom are the best known experts in data warehousing.
2.2 Business intelligence systems
2.2.1 Introduction In this section the concept of Business Intelligence (BI) is explained. It describes the structure of a Data Warehouse system and the individual components. After that a short description of used tools and models is given. Finally, a few conclusions are drawn.
2.2.2 Business Intelligence It is crucial that organisations have reliable information to make effective and good quality business decisions. In this sense, “Business Intelligence is a broad category of applications and technologies for gathering, providing access to, and analyzing data for the purpose of helping enterprise users make better business decisions.” …“Once business intelligence is gathered effectively and used proactively you can make decisions that benefit your organization before the competition does.”
According to Capgemini [Capgemini1, 2004], there are four types of purposes for Business Intelligence, namely:
• Corporate performance management;
integrally steering the company, on every level, based on well defined and well reported key performance indicators.
• Customer Relationship Management (CRM);
| Manage your design!
5
Operational CRM puts the customer approach first, but analytical CRM aims to use the available customer data to determine customer value, chances of response, chances of churn etc.
• Detection of fraud;
• Risk management.
The process of gathering and analyzing data has three main obstacles. The first one is that the data is often stored in various locations like operational applications and external resources. Here we find the essence of Business Intelligence because “the sum of data from these various systems contains extra information that is strategically valuable.” [Capgemini1, 2004]. The second one is that the database designs of operational systems were not optimized for information analysis and reporting. Finally, the processing load of reporting could reduce the response time of the operational systems. The Data Warehouse system offers a solution to these obstacles.
2.2.3 The Data Warehouse In the 1980’s Bill Inmon defined the universally accepted definition of a Data Warehouse [Inmon, 2001]: “a subject-oriented, integrated, time variant and non-volatile collection of data used in strategic decision making.”
The following terms should be clarified:
• Subject-oriented, means that the data in the database is organized so that all the data elements relating to the same real-world event or object are linked together;
• Time-variant, means that the changes to the data in the database are tracked and recorded so that reports can be produced showing changes over time;
• Non-volatile, means that data in the database is never over-written or deleted, but retained for future reporting;
• Integrated, means that the database contains data from most or all of an organization’s operational applications, and that this data is made consistent.
Thus, the DWH is a database with historic data focused on decision support. But why is a Data Warehouse needed for decision support? The database of the source systems is designed to support OLTP, Online Transaction Processing. This is a standard, normalized database structure. OLTP is designed for transactions, which means that inserts, updates and deletes must be fast. However, this kind of structure is not suited for analytical purposes called Online Analytical Processing (OLAP). The reason for this is that standard OLTP systems usually only hold data as long as it is “current” or active. For example, an order is moved to the order history when it is completed. But to retrieve the statistical information, a database structure with aggregated, summarized data is needed. A single record, for example an order, is not very interesting. Statistical information always covers a certain period of time like month or year. The structure of a Data Warehouse is designed to support this, e.g. in a star or snowflake database model (dimensional modeling). This is explained in section 2.2.4.
| Manage your design!
6
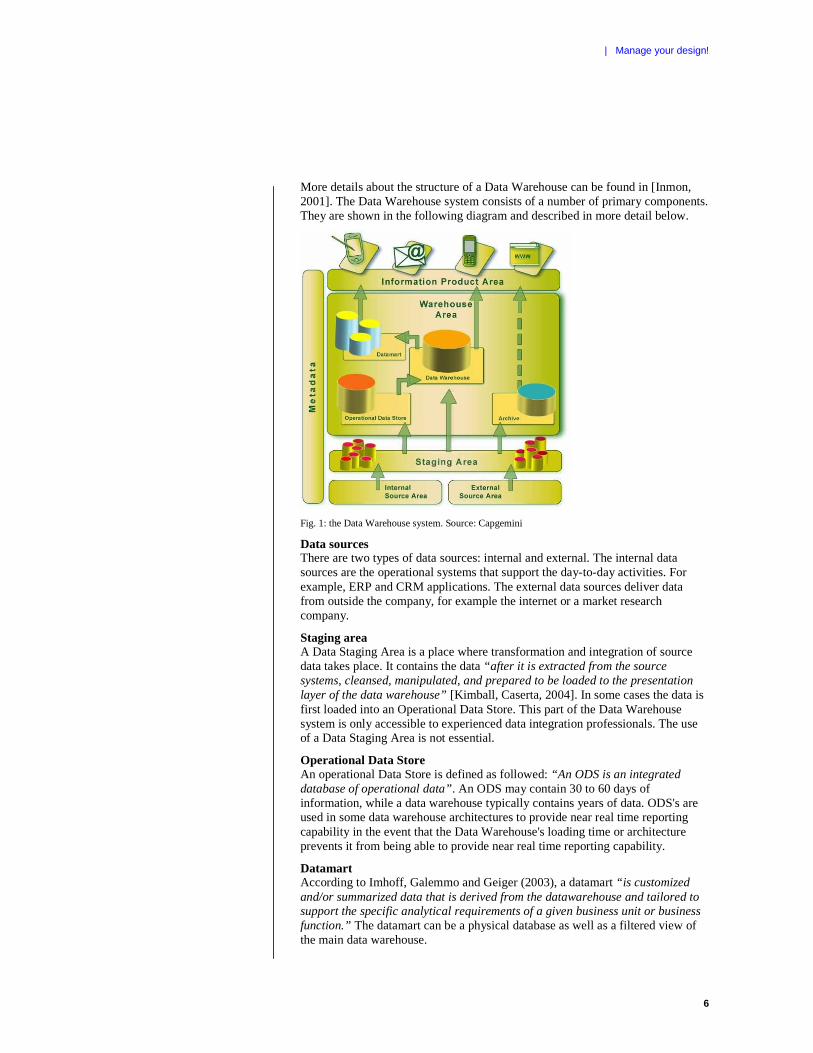
More details about the structure of a Data Warehouse can be found in [Inmon, 2001]. The Data Warehouse system consists of a number of primary components. They are shown in the following diagram and described in more detail below.
Fig. 1: the Data Warehouse system. Source: Capgemini
Data sources There are two types of data sources: internal and external. The internal data sources are the operational systems that support the day-to-day activities. For example, ERP and CRM applications. The external data sources deliver data from outside the company, for example the internet or a market research company.
Staging area A Data Staging Area is a place where transformation and integration of source data takes place. It contains the data “after it is extracted from the source systems, cleansed, manipulated, and prepared to be loaded to the presentation layer of the data warehouse” [Kimball, Caserta, 2004]. In some cases the data is first loaded into an Operational Data Store. This part of the Data Warehouse system is only accessible to experienced data integration professionals. The use of a Data Staging Area is not essential.
Operational Data Store An operational Data Store is defined as followed: “An ODS is an integrated database of operational data”. An ODS may contain 30 to 60 days of information, while a data warehouse typically contains years of data. ODS's are used in some data warehouse architectures to provide near real time reporting capability in the event that the Data Warehouse's loading time or architecture prevents it from being able to provide near real time reporting capability.
Datamart According to Imhoff, Galemmo and Geiger (2003), a datamart “is customized and/or summarized data that is derived from the datawarehouse and tailored to support the specific analytical requirements of a given business unit or business function.” The datamart can be a physical database as well as a filtered view of the main data warehouse.
| Manage your design!
7
Metadata Metadata is, simply put, data about data. It describes extra information about a piece of data. Metadata is used not only to inform operators and users of the data warehouse about its status and the information held within the data warehouse, but also as a means of integration of incoming data and a tool to update and refine the underlying DW model. Metadata is collected from every part of the system. Examples of data warehouse metadata include table and column names, their detailed descriptions, their connection to business meaningful names, the most recent data load date, the business meaning of a data item and the number of users that are logged in currently.
To ensure that tools can communicate and import/export metadata from and to each other, metamodels are developed. A metamodel is a standard that describes how the metadata for a certain model is structured. A model always conforms to a unique metamodel.
The Object Management Group (OMG) is a consortium, originally aimed at setting standards for distributed object-oriented systems, and is now focused on modeling (programs, systems and business processes) and model-based standards. OMG defined the UML modeling standard followed by related standards for Meta-Object Facility (MOF). The Common Warehouse Metamodel (CWM) is a standard for metadata models in data warehousing.
To make metadata traceable, it is necessary to have a common metadata infrastructure. However, according to Alex Aalberts, the CWM specification is currently not mature enough to use it effectively. Between tools of the same vendor it might be useable, but when trying to exchange metadata compliant to the CWM specification between tools from different vendors, it often causes difficulties. Because of the importance of metadata, the use of standards is taken into account during the tool selection in chapter five.
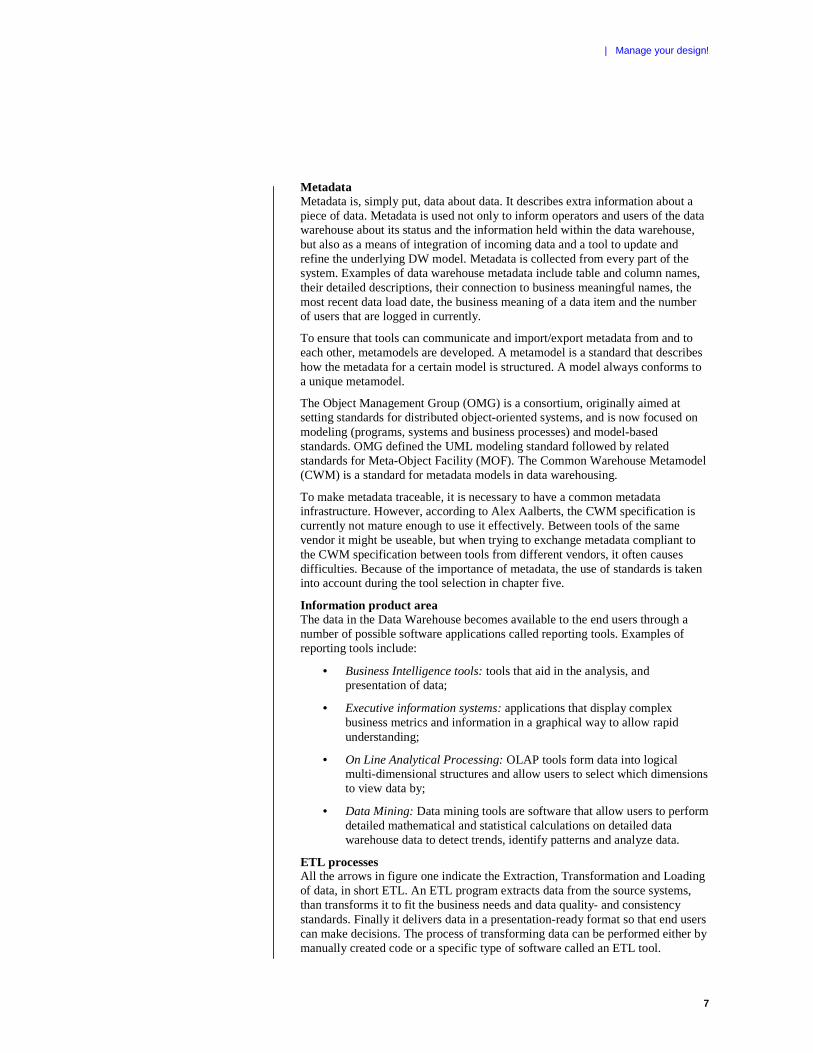
Information product area The data in the Data Warehouse becomes available to the end users through a number of possible software applications called reporting tools. Examples of reporting tools include:
• Business Intelligence tools: tools that aid in the analysis, and presentation of data;
• Executive information systems: applications that display complex business metrics and information in a graphical way to allow rapid understanding;
• On Line Analytical Processing: OLAP tools form data into logical multi-dimensional structures and allow users to select which dimensions to view data by;
• Data Mining: Data mining tools are software that allow users to perform detailed mathematical and statistical calculations on detailed data warehouse data to detect trends, identify patterns and analyze data.
ETL processes All the arrows in figure one indicate the Extraction, Transformation and Loading of data, in short ETL. An ETL program extracts data from the source systems, than transforms it to fit the business needs and data quality- and consistency standards. Finally it delivers data in a presentation-ready format so that end users can make decisions. The process of transforming data can be performed either by manually created code or a specific type of software called an ETL tool.
| Manage your design!
8
Archive A data archive keeps data indefinitely on permanent media with the purpose of having all the data at hand. The data archive stores all the data whereas the Data Warehouse contains only the dataset that is currently useful. A data archive is of minor importance to the Data Warehouse system.
Advantages of the Data Warehouse The Data Warehouse is able to combine data from different sources, in one place. The benefit of this is that it enhances end-user access to data spread company-wide. Also, with the use of reporting tools the decision makers can produce trend reports, which in turn can lead to better decisions and higher productivity. Another potential advantage is that it provides an infrastructure that could support changes to data and replication of the changed data back into the operational systems. Databases are structured to store data efficiently; data warehouses and datamarts are structured for reporting purposes. The structure focuses on performance optimization and reporting needs.
2.2.4 The BI project To approach the practical side of the theory, this subsection describes the outlines of a current BI development project. Currently, there is no real method used for developing BI solutions. However, there are always a few recurring phases and deliverables. The most important ones are described here. This helps placing the BI specific parts defined for RUP into context, later on (section 2.4).
The description of a project outline is based on the theory that Ralph Kimball explains in his book “The Data Warehouse Lifecycle Toolkit” [Kimball, 1998], as well as the practical experience of Capgemini colleagues.
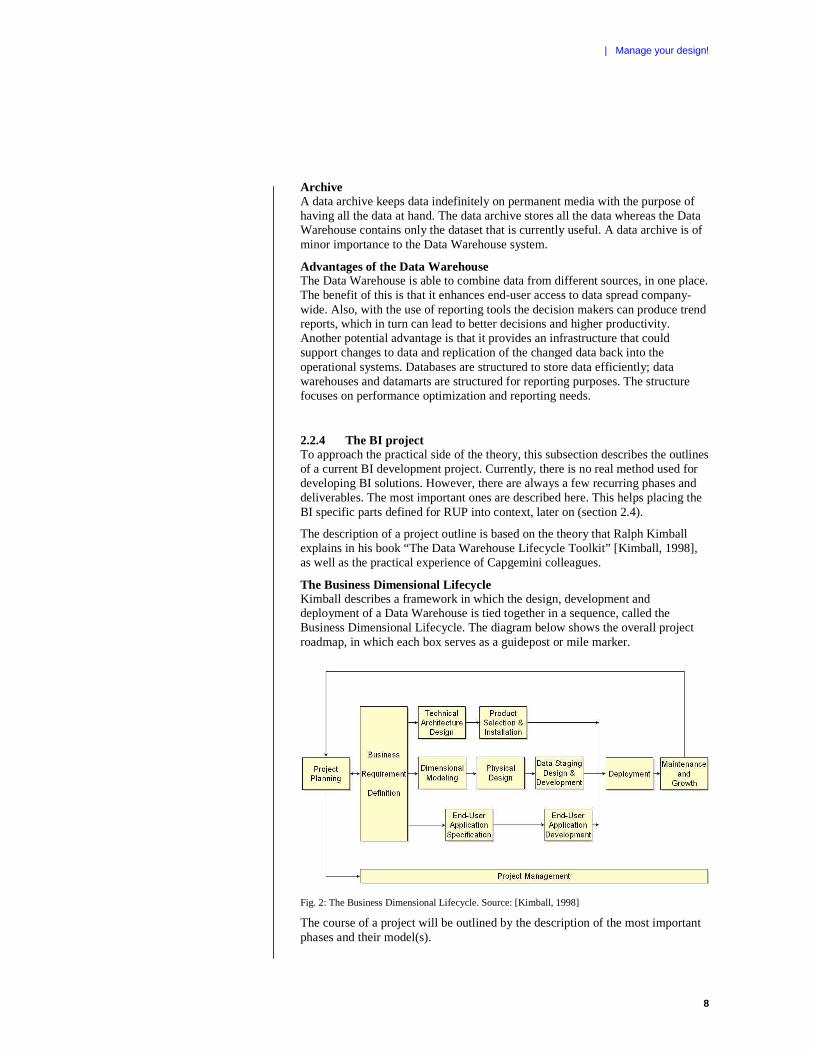
The Business Dimensional Lifecycle
Kimball describes a framework in which the design, development and deployment of a Data Warehouse is tied together in a sequence, called the Business Dimensional Lifecycle. The diagram below shows the overall project roadmap, in which each box serves as a guidepost or mile marker.
Fig. 2: The Business Dimensional Lifecycle. Source: [Kimball, 1998]
The course of a project will be outlined by the description of the most important phases and their model(s).
| Manage your design!
9
Business requirement definition In this phase the business requirements are determined and a data audit is performed to make an inventory of the existing data sources.
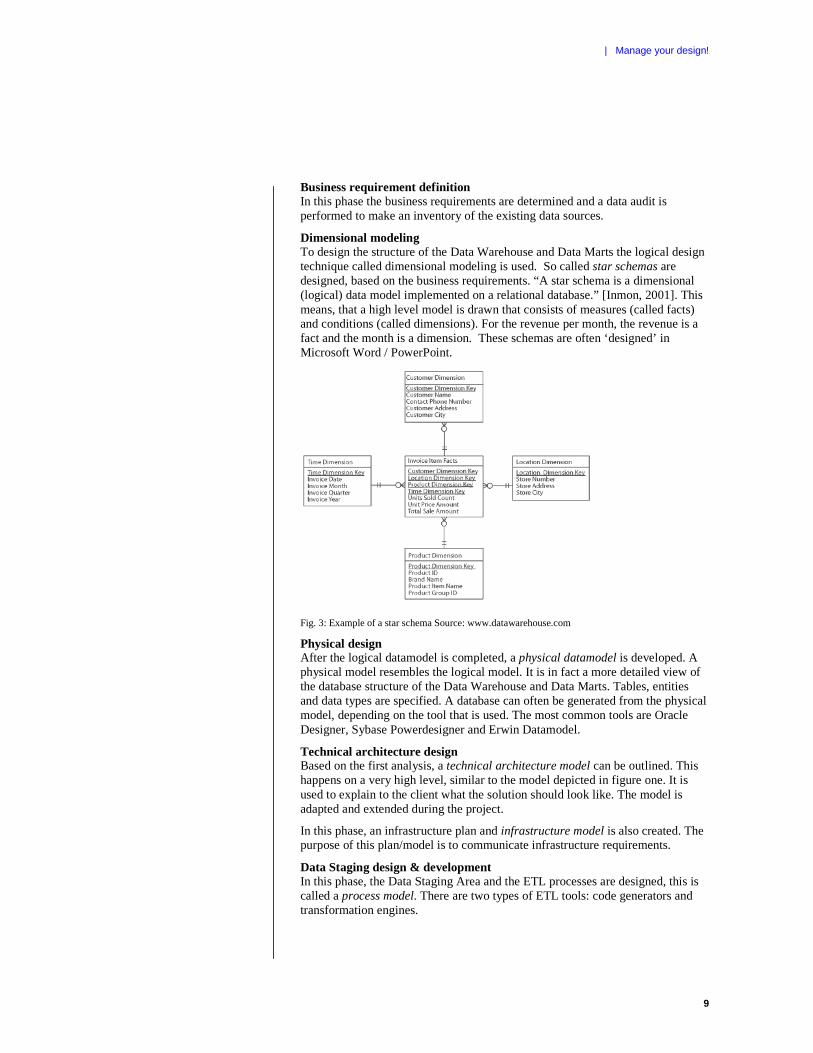
Dimensional modeling To design the structure of the Data Warehouse and Data Marts the logical design technique called dimensional modeling is used. So called star schemas are designed, based on the business requirements. “A star schema is a dimensional (logical) data model implemented on a relational database.” [Inmon, 2001]. This means, that a high level model is drawn that consists of measures (called facts) and conditions (called dimensions). For the revenue per month, the revenue is a fact and the month is a dimension. These schemas are often ‘designed’ in Microsoft Word / PowerPoint.
Fig. 3: Example of a star schema Source: www.datawarehouse.com
Physical design After the logical datamodel is completed, a physical datamodel is developed. A physical model resembles the logical model. It is in fact a more detailed view of the database structure of the Data Warehouse and Data Marts. Tables, entities and data types are specified. A database can often be generated from the physical model, depending on the tool that is used. The most common tools are Oracle Designer, Sybase Powerdesigner and Erwin Datamodel.
Technical architecture design Based on the first analysis, a technical architecture model can be outlined. This happens on a very high level, similar to the model depicted in figure one. It is used to explain to the client what the solution should look like. The model is adapted and extended during the project.
In this phase, an infrastructure plan and infrastructure model is also created. The purpose of this plan/model is to communicate infrastructure requirements.
Data Staging design & development In this phase, the Data Staging Area and the ETL processes are designed, this is called a process model. There are two types of ETL tools: code generators and transformation engines.
| Manage your design!
10
The code generator compiles the code and generates an executable that runs on a server. Important generator tools are Minerva MetaSuite and Oracle Warehouse Builder.
A transformation engine loads the sourcedata and executes the designed ETL processes on the data. The most popular tool is Informatica PowerCenter. Other ETL-tools are Microsoft Information Services and IBM Ascential.
Unfortunately ETL processes are often still designed in Word because a modeling tool does not support this and the designers are not trained to use the ETL environment itself. The visual ETL models are then copied into an ETL environment by the ETL developer.
Traceability Because the different elements of the project are often defined in different tools, it is complicated to trace elements back to each other. For instance, if the requirements are stored in Word, the star schemas in Powerpoint, the logical/physical models in Erwin and the ETL in Powercentre; it becomes very difficult to trace back an ETL component to a system requirement. This, in turn, makes it difficult to determine if you delivered exactly what was requested by the client.
2.2.5 Summary The Data Warehouse offers a solution to the Business Intelligence questions of an organization. It is used to aggregate and transform data from source systems into a structure that supports analytical processing. A range of tools is available on the market to design the different data models that are involved in the design of a DWH environment. However, not all clients own the right tools and are willing to invest in them. Sometimes, this leads to designs in Word / PowerPoint, which in turn leads to information that is not linked to each other, inefficient working and / or the loss of overview.
The goal of this research is to find (modeling) tools that support RUP for BI and offer the possibility to drill down on specifications from different angles. This means that the information in different models should be linked together.
2.3 The Rational Unified Process
2.3.1 Introduction This section gives an introduction to the Rational Unified Process. It handles the most important concepts and gives a description of the phases and disciplines. The goal is to provide basic information about RUP so that it can be compared to the RUP for BI method, which will be the subject of the next section.
All of the text in this section is constructed of information from either Wikipedia [Wikipedia3, 2006], the RUP knowledgebase [IBM corp., 2003] or the RUP Awareness training material [Capgemini2, 2006].
2.3.2 Backgrounds The Rational Unified Process (RUP) is an iterative software development process created by the Rational Software Corporation, now a division of IBM.
| Manage your design!
11
The RUP is not a single concrete prescriptive process, but rather an adaptable process framework, intended to be tailored by the development organizations and software project teams that will select the elements of the process that are appropriate for their needs.
The creators and developers of the process focused on diagnosing the characteristics of different failed software projects; by doing so they tried to recognize the root causes of these failures. They also looked at the existing software engineering processes and their solutions for these symptoms.
Project failure is caused by a combination of several symptoms, though each project fails in a unique way. The outcome of their study was a system of software best practices they named the Rational Unified Process.
The Process was designed with the same techniques the team used to design software; it has an underlying object-oriented model, using Unified modeling Language (UML).
2.3.3 Principles and best practices RUP is based on a set of software development principles and best practices, for instance:
• Develop software iteratively
Each iteration is a complete miniature waterfall process, starting with a re-evaluation of requirements and ending with integrated and executable software. As a result, design flaws are discovered early in the development process;
• Manage requirements
The goal of managing requirements is to achieve traceability between requirements and design;
• Use component based architecture
Component-based architectures allow economically significant reuse;
• Visually model software
Models make it possible to get a concise, high-level view of the system without having to analyze the code;
• Verify software quality
The RUP focuses on meeting the expected level of quality and provides test workflows to measure this level;
• Control changes to software
RUP defines methods to control, track and monitor changes.
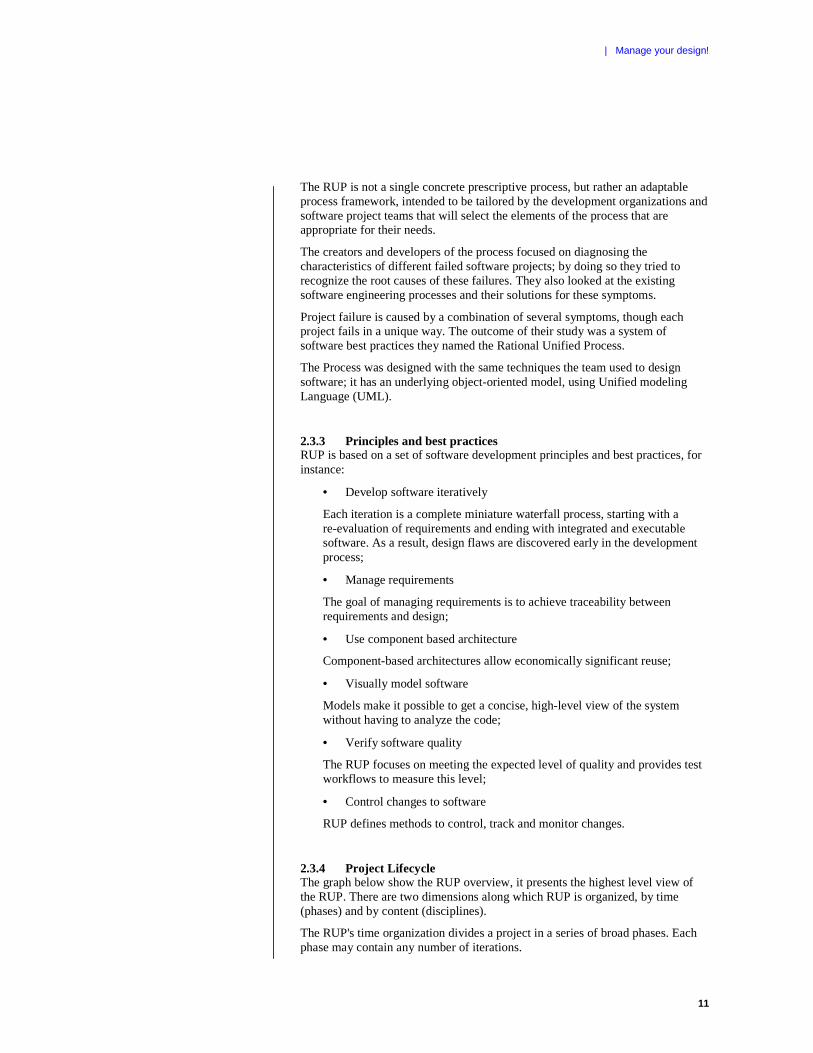
2.3.4 Project Lifecycle The graph below show the RUP overview, it presents the highest level view of the RUP. There are two dimensions along which RUP is organized, by time (phases) and by content (disciplines).
The RUP's time organization divides a project in a series of broad phases. Each phase may contain any number of iterations.
| Manage your design!
12
When you look at the graph, you notice that during the iterations of each phase, some disciplines receive more emphasis than others. For example, in the Inception phase, Business modeling and Requirements figure prominently. In the Construction phase, Implementation and Test disciplines are most prominent.
Fig. 4: The RUP overview. Source: RUP 2003
Inception phase The Inception phase determines the scope and requirements for the proposed application. The purpose of Inception is to achieve agreement among all the stakeholders about the lifecycle objectives for the project. This phase is mostly significant for new projects where major business and/or requirement risks must be addressed before the project can go ahead.
Elaboration phase The Elaboration phase removes most of the project risk by producing a working architecture. The purpose of Elaboration is to baseline the architecture of the system, thus providing a stable basis for the bulk of the design and implementation work done in the Construction phase.
Construction phase In this phase the main focus goes to the development of components and other features of the system being designed. This is the phase when the bulk of the coding takes place. In larger projects, several construction iterations may be developed in an effort to divide the use cases into manageable segments that produce demonstrable prototypes.
This phase produces the first external release of the software. Its conclusion is marked by the Initial Operational Capability Milestone.
Transition phase In the transition phase, the product has moved from the development organization to the end user. The activities of this phase include training of the end users and maintainers and beta testing of the system to validate it against the end users' expectations. The product is also checked against the quality level set in the Inception phase. If it does not meet this level, or the standards of the end users, the entire cycle in this phase begins again.
| Manage your design!
13
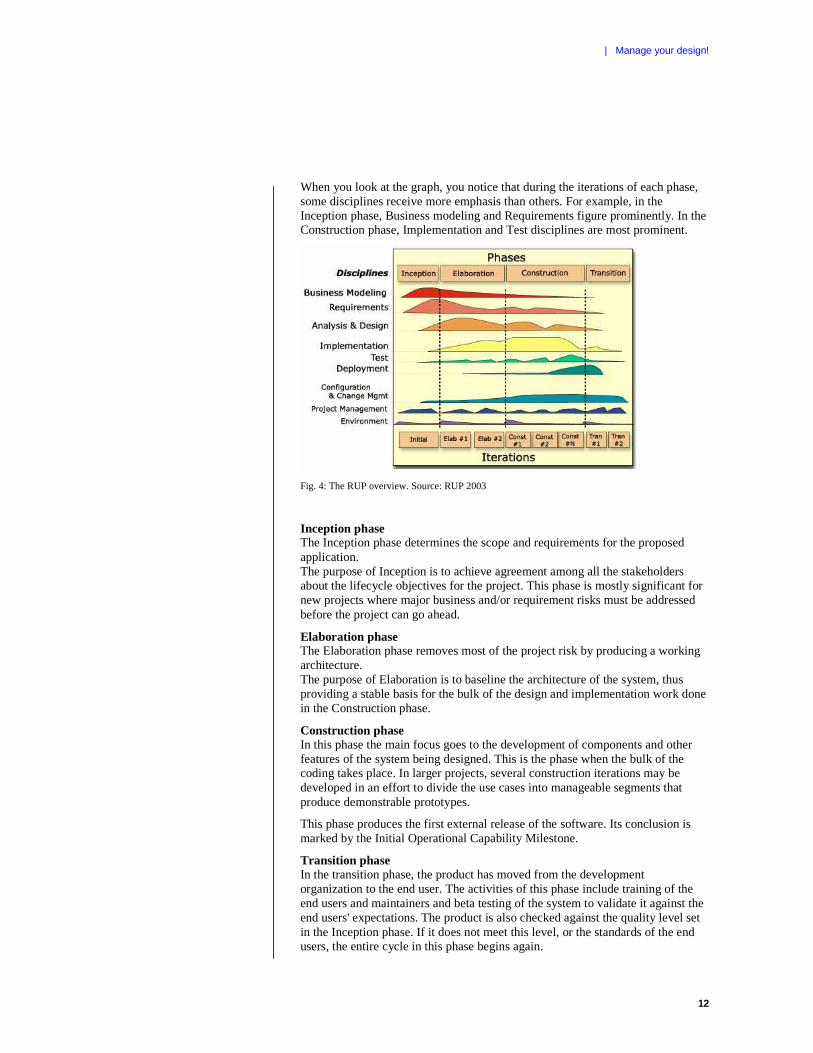
If all objectives are met, the Product Release Milestone is reached and the development cycle ends.
Milestone goals
Fig. 5: The criteria by which phases are assessed Source: RUP 2003
2.3.5 Disciplines A discipline is a collection of related activities that are related to a major ‘area of concern’ within the overall project. There are 9 disciplines within the RUP:
Business modeling To understand the structure and the dynamics of the organization in which a system is to be deployed and to understand current problems in the target organization and identify improvement potentials.
Requirements To establish and maintain agreement with the customers and other stakeholders on what the system should do.
Analysis and design To transform the requirements into a design of the system-to-be; to evolve a robust architecture.
Implementation To define the organization of the code, in terms of implementation subsystems organized in layers.
To implement the design elements in terms of implementation elements (source files, binaries, executables, and others).
To test the developed components as units.
To integrate the results produced by individual implementers (or teams), into an executable system.
Test Testing focuses primarily on evaluating or assessing product quality.
Project Management Planning, staffing, executing, and monitoring projects.
| Manage your design!
14
Configuration & change management Control change to, and maintain the integrity of, a project’s artifacts.
Deployment Roll out, installation, make the software product available.
Environment Develop the software development process and provide the software development organization with the software development environment (both processes and tools).
2.3.6 Process Notation Elements A process is described in terms of who (role), what (artifact) and how (activity).
A role defines the behavior and responsibilities of an individual, or a set of individuals working together as a team. This is an important distinction because it is natural to think of a worker as the individual or the team itself. In the Rational Unified Process, the worker is more of a role that defines how the individuals should carry out the work.
An artifact is something you produce in the course of developing a software product. It includes the source code itself as well as the models, documents and other products of the life cycle. The UML provides notation for representing many of the artifacts of the development process.
An activity is the smallest piece of work that is relevant. It is not reasonable to do only part of an activity. Dividing the work in this manner makes it easier to monitor development. It is better (easier) to know that the project has completed three out of five activities rather than 60% of one activity.
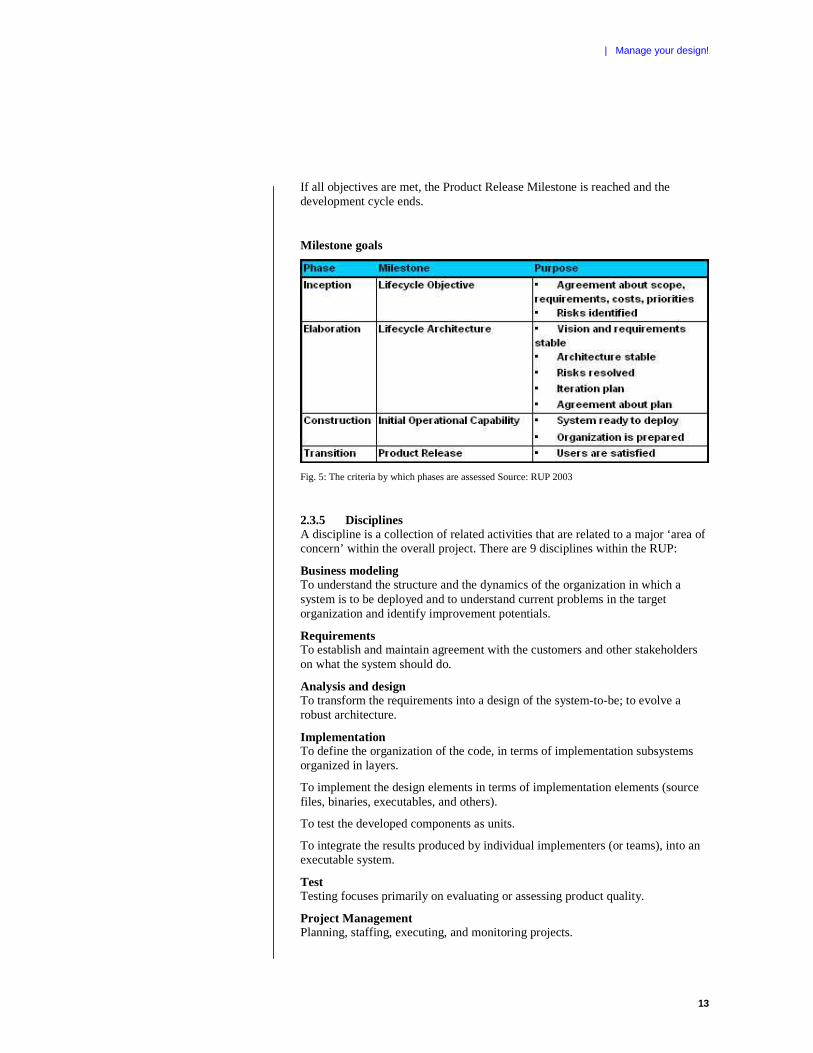
Figure six describes the basic elements of RUP.
Fig. 6: The basic elements of RUP. Source: RUP 2003
A workflow is a sequence of activities that produces a result of observable value. For each discipline, an activity diagram is presented. This diagram shows the workflow, expressed in terms of workflow details.
Activities, steps, and associated guidelines provide general guidance to the practitioner. To go one step further, tool mentors are an additional means of
| Manage your design!
15
providing guidance by showing how to perform the steps using a specific software tool. Tool mentors are provided in the RUP, linking its activities with tools in the Rational Toolset.
2.3.7 The Rational Toolset The RUP is supported by a range of tools called the Rational Toolset. The tools are designed to work with UML standards and are capable of documenting dependencies though requirements, specifications and designs. The toolset includes tools for requirements management, modeling, testing, change management and configuration management.
2.3.8 Use cases Managing requirements is one of the six best practices. In particular, the Rational Unified Process captures and manages functional requirements in a Use-Case model. Use-Cases are a key concept within the process. They are used throughout the development cycle as a driver for many activities, flowing information through several models, and encouraging consistency across these models.
2.3.9 Summary The Rational Unified Process is an adaptable process framework which is based on a set of software development principles and best practices. It focuses on object-oriented development, developing iteratively and managing requirements while making use of the UML modeling standards. It describes the requirements of a system with use-cases. The RUP is supported by a variety of tools called the Rational Toolset. This toolset is capable of tracking data through different models and tools and managing dependencies.
2.4 RUP for BI
2.4.1 Introduction To make the RUP suitable for developing Business Intelligence/Data Warehouse environments it has to be adapted. There are two main reasons for this. Firstly, RUP uses use-cases to describe the interaction of the user with the system (core functionality of OLTP applications) whereas BI uses data flows to describe the transformation of data from source systems to a data warehouse or reporting environment (core functionality of BI applications). Secondly, RUP is meant for the development of Object Oriented (OO) applications, BI systems are not OO; they are based on aggregated summarized datasets instead of objects and classes.
This leads to the adaptation of three disciplines of the RUP. The other six can be used without changing them. The requirements, analysis and design and the implementation discipline need to be adapted. This section describes the added value of RUP, for BI projects and the differences between the original RUP and RUP for BI in the corresponding disciplines.
The basis for RUP for BI is the Capgemini version of RUP 2003. In this Capgemini version some additions/alterations were made to the project management discipline to align RUP 2003 with the internal Capgemini project governance guidelines (Deliver). This means that the Capgemini specific
| Manage your design!
16
reporting templates and project management activities/processes are included. This version is the ‘mandatory’ RUP approach for Capgemini.
The descriptions of the BI specific artifacts in this section are based on RUP for BI training material [Capgemini3, 2006] and the ADC BI development case [Capgemini4, 2006].
2.4.2 Why RUP for BI? Using RUP for Business intelligence projects has several advantages. The most important focus of RUP is reducing risks. In this aspect, RUP for BI is about being able to mitigate risks and being in control of BI projects. Furthermore, BI projects can be accelerated through standardization and the use of best practices. Everybody in the project uses the same work methods, standards, guidelines and templates. This leads to a higher predictability of BI projects. Also, the function point analysis for BI can be used in conjunction with RUP for BI, because it uses dataflows to determine the scale of the system.
RUP offers a complete and rich approach, so the BI community only has to make changes to the part best known to them, the BI specific design and build activities. Maintenance has to take place on BI parts only; all other changes follow the RUP/central approach.
2.4.3 Requirements discipline The purpose of this discipline is to establish and maintain agreement with the customers and other stakeholders on what the system should do. It defines the outlines of the system requirements. Next to that, a BI (report) model for the system is defined, focusing on the needs and goals of the users. The products of this discipline can be considered as the ‘functional design’.
The three BI specific artifacts that are developed here are:
Dataflow model A model describing the system in terms of dataflows. This model gives a global overview of all data sources, targets and reporting/analysis environment and the data streams from identified sources to the target BI scheme. The dataflow model is a model of the system's intended transformations and processes and its environment, and is useful to create understanding between the customer and the developers. It is used as an essential input to activities in analysis, design, and test.
It can be used early in the inception phase to outline the scope of the system, as well as during the elaboration phase. The dataflow model is refined by more detailed flows of events during the construction phase.
Dataflows A dataflow is a part of the dataflow model. It is described by its source(s), its target(s) and the specific business rules/transformation that apply to that dataflow.
Dataflows are identified and possibly briefly outlined early in the inception phase, to help in defining the scope of the system. The dataflows that are relevant for the analysis or the architectural design of the system are then described in detail within the Elaboration phase. The remaining dataflows are described in detail within the Construction phase.

| Manage your design!
17
Supplementary specifications The Supplementary Specification artifact captures system requirements that are not readily captured in behavioral requirements artifacts such as dataflow specifications. Examples are volumes of source systems, integrity problems and issues, error processing requirements, summarization of balancing requirements, reconciliation requirements and other data control and audit requirements. It is practically similar to “non-functional specifications”.
2.4.4 Analysis and design discipline The analysis and design discipline has two purposes. Analysis focuses on finding objects or concepts in the problem domain (what). Design focuses on defining software objects and how they collaborate to fulfill requirements (how).
The BI specific artifacts in this discipline are:
Design Model The design model is a package describing the realization of dataflows, and serves as an abstraction of the implementation model and its buildable component. The design model is used as essential input to activities in implementation and test. The design model consists of all buildable components (=tables, mappings, workflows, etc.) of the system. These components are linked together in various ways:
• via dataflows (data dependent);
• via workflows (time/status dependent);
• via layers (implementation dependent).
It contains:
• Dataflow realization: describes how a particular dataflow is realized within the design model, per collaborating buildable components (=tables, mappings, workflows, etc.) of the system is described of which objects this component consists;
• Design components: a description of a database object, mapping or workflow;
• Datamodel: physical model of the DWH/DM structure. Derived from conceptual and logical models in the requirements discipline;
• Workflows/design flows: specifies a set of components that collaborates to realize (part of) a BI design model;
• BI model.
The design model primarily sets the architecture, but is also used as a vehicle for analysis during the elaboration phase. It is then refined by detailed design decisions during the construction phase. The design model can be compared to the ‘technical design’. BI Model A BI model specifies the services offered by a part of the system, for example a data model, an OLAP cube or a report definition.
BI Models are created in the elaboration phase, and define the important 'seams' in the system. All BI Models are architecturally significant. The BI model is a part of the design model.
| Manage your design!
18
BI Architecture Document The BI Architecture Document provides a comprehensive architectural overview of the system, using a number of different architectural views to depict different aspects of the system. These views are for example: component view, dataflow view, deployment view, logical view. In the standard RUP there is a use-case view, this view is replaced by the dataflow view.
2.4.5 Implementation discipline The purpose of this discipline is to implement the design elements in terms of implementation elements (etl flows, jobs, tables, semantic layers, cubes, reports, and others). The system integration is planned using an implementation model. The BI specific artifact in this discipline is:
Implementation flow An implementation flow is a set of implementation elements. Implementation flows structure the Implementation Model by dividing it into smaller parts that can be separately integrated and tested. The implementation flow replaces the “implementation subsystem” artifact in RUP.
2.4.6 Summary RUP is being adapted for Business Intelligence to reduce risks in BI projects and to accelerate these projects through the use of standards and best practices. Making RUP suitable for BI involves adapting the requirements, analysis & design and implementation discipline. In the requirements discipline a dataflow model is outlined and the separate dataflows are described. Non-functional requirements are captured in the supplementary specifications. In the analysis and design discipline the most important artifact is the BI design model which describes the different components of the system and the dataflow realizations. This is more or less the technical specification of the system. The architecture is also defined in this discipline. The implementation discipline plans the system integration using an implementation model.
Chapter three describes how the separate, BI specific project elements (requirements, dataflow etc.) are related to each other in a traceability model. All the artifacts consist of one or more elements in the model. How each artifact is covered is represented in appendix A.
2.5 Context of the research
2.5.1 Introduction As described in the problem statement, this research focuses on finding a (modeling) tool or a set of (modeling) tools to support the definition of requirements and functional/technical specifications. This raises the following questions:
• What is a modeling tool;
• Why would a modeling tool be used;
• Does the Rational toolset provide a (suitable) modeling tool?
| Manage your design!
19
2.5.2 What is a modeling tool? A modeling tool offers the possibility to design a visual representation of (a part of) a system. In this context this can for instance be a dimensional model or ETL flow. It is used to make the system comprehensible for every person involved in the project. Another purpose of a model can be to build a part of the system (e.g. generating a database from the physical datamodel or executing an ETL flow). Therefore there are two types of tools that are used to design models; the modeling tool and the development tool (or environment). The modeling tool is only used to visually design models. The development tool however, is also capable of developing (a part of) the system like a database or ETL job.
2.5.3 Why use a modeling tool? Within the BI practices it is common to visually model in Microsoft Word or PowerPoint. This leads to isolated designs that are not related to other designs or requirements. Sometimes development tools like Sybase Powerdesigner and Oracle Designer are used. There is no real standard tool that is used. The disadvantage of this is that most of the project members often have to learn using a new development environment, or just stick to Microsoft Word/Powerpoint.
In a software development project, the project manager should always want to be sure he delivers exactly what the customer asks; that the software requirements are met. When using different modeling tools that are not capable of exchanging data about models (metadata), it becomes very difficult to trace delivered functionality back to data components or requirements. This is called traceability. A good traceability helps to ensure that the delivered products are in line with the requirements and makes impact analysis on changes reliable.
Using a standard (set of) modeling tool(s) not only means less education of personnel and a more comprehensible way of working; but also creates the possibility to define a standard way of working with tools while keeping traceability manageable. Chapter four goes into detail concerning the concept of traceability.

| Manage your design!
20
2.5.4 Rational toolset The Rational toolset consists of an integrated set of tools, shown in figure seven.
Fig. 7: The Rational Toolset. Source: ADC Portal Capgemini
In the middle is RequisitePro, a database for documenting requirements. Changes in the system requirements are managed by ClearQuest (change management) and ClearCase handles the versioning of requirements and files developed during a project (configuration management). TestManager is used for testing, based on Use Cases (dataflows in RUP for BI) and requirements. Rose is a modeling tool based on the UML specification. UML does not provide a description for modeling dataflows or dimensional models.
Although it seems unlikely that the complete toolset, that is standard within RUP, can be used for Business Intelligence projects, many aspects look interesting and usable. Therefore, chapter five (research results) answers the following questions; is Rational Rose suitable for modeling BI systems? Is it possible to replace Rose with another tool? Is it possible/useful to use the other tools for RUP for BI?
2.6 Summary This chapter outlined the three most significant theoretical areas; Business Intelligence systems, RUP and RUP for BI. All BI systems consist of a few basic components. These are the source systems, staging area, datawarehouse, datamart, ETL flows and the BI reporting environment.
The Business Dimensional Lifecycle [Kimball, 1998], describes the process of developing a Business Intelligence application. First the business requirements are determined and the datasources are mapped. Next the dimensional datamodel
| Manage your design!
21
is designed and the architecture is outlined. The dimensional model forms the basis for the physical model which describes the database structure. After that, a process model will describe all the ETL processes involved. The design of the end-user application takes place parallel to this phase. The disadvantage of this lifecycle is that it does not describe tools that can be used or how to manage a project, it is not really a software development method.
The Rational Unified Process is an extensive method for software development that focuses on risk reduction and using best practices. RUP is divided along two dimensions; by time (phases) and by content (disciplines). It uses UML to model visually. This is made possible by the support of a collection of tools, called the Rational toolset. In this toolset there are tools to support every discipline in the RUP (e.g. business modeling, project management and configuration management). The method is very complete and is supported by a lot of documentation that provides best practices, templates, guidelines, workflows and tool support. However it is not entirely applicable for BI projects without adapting it.
The problem lies in the fact that RUP uses use-cases to describe the interaction of the user with the system whereas BI uses data flows to describe the transformation of data from source systems to a data warehouse or reporting environment. Next to that, RUP is meant for the development of Object Oriented (OO) applications, BI systems are not OO.
This problem can be solved by adapting the requirements, analysis & design and implementation discipline. For this purpose, a number of BI specific artifacts are defined. In these artifacts a number of BI specific models are used (e.g. dimensional models, dataflow models). While the RUP for BI method is nearly completed, one problem still remains. UML does not describe how to model things as dimensions, dataflows, ETL processes etc. Therefore, it is uncertain if the Rational toolset provides the capability for designing these models.
This research focuses on the finding a tool or a set of tools that can be used to design these models within RUP for BI while guarding traceability.
| Manage your design!
22
3 Traceability
3.1 Introduction In this chapter the concept of traceability is introduced. Within RUP projects traceability plays a significant role. First, the concept is explained in section 3.2, subsequently the areas of specification within RUP for BI are defined in 3.3. Paragraph 3.4 proposes a model for traceability of project elements. In 3.5 the relation with artifacts of RUP for BI is drawn. The chapter concludes with a summary provided in section 3.6.
3.2 The concept of traceability Within the RUP traceability is defined as “the ability to trace a project element to other related project elements, especially those related to requirements.” Typical traceability items include different types of requirements, analysis and design model elements, test artifacts etc.
The purpose of traceability is to help:
• Understand the source of requirements;
• Manage the scope of the project;
• Manage changes to requirements;
• Assess the project impact of a change in a requirement;
• Verify that all requirements of the system are fulfilled by the implementation;
• Verify that the application does only what it was intended to do.
Traceability is also of value for this research. The goal is to find (modeling) tools that capture, manage and keep dependencies between requirements, functional and technical specifications so that it is possible to view the designs from different angles. In others words, these tools should make it possible to trace design elements back to related design elements. In realizing this, it is crucial to determine what the traceability/design elements are and how they relate to each other.
3.3 Areas of specification After close examination of the available RUP for BI documentation, it is possible to distinguish seven areas of specification within a BI project:
• Requirements: managing stakeholder needs and supplementary specifications;
• Dataflow: source, target and transformation definition;
• Datamodel: design phases of the (dimensional) datamodels;
• Data Integration/ETL: ETL components and flows (further, more technical, specification of dataflow);

| Manage your design!
23
• BI reporting environment: cubes, universes, report definitions etc;
• Deployment model: physical location of attributes, this is a UML model;
• (Functional) architecture: software components, external properties and their relationships.
These areas are all related to each other to a certain extent and all have their specific visual models (except requirements) and textual specification. A tool, or set of tools, should offer the possibility to model these seven areas of specification (or most of them) while keeping traceability possible. The traceability of project elements, defined within RUP for BI, is shown in the traceability model, visualized in figure eight.
3.3.1 Configuration and change management In respect to the sub question of research question two, the aspects of configuration and change management are also taken into account during the selection of tools. Configuration management mainly covers versioning of models and files. Change management enforces rules for introducing changes in the system. These aspects are relevant for all levels of design; requirements, functional and technical specifications. Therefore, they are not part of the traceability model but encompass all the project elements.
3.4 Explanation of the model
Fig. 8: Traceability model
The traceability model helps understand how the (BI specific) design elements trace back to the stakeholder needs. Every stakeholder need (e.g. monthly profit figures per region) is translated in either a dataflow or a supplementary (non-functional) specification. The dataflow consists of source tables, target
| Manage your design!
24
dimensions and business rules/transformations. These tables are defined in a datasource model, often an ERD. The target entity design starts as a conceptual model and evolves to a logical model during the functional specification. Next, the dataflow is extended with a dataflow realization, a more technical description of the dataflow/ETL components. The ETL flow describes the flow between these components. The supplementary specs can be traced back to the ETL components. The dataflow realization describes the source and target tables. In this stage the physical model is developed. The BI environment is a view on the datamodels. The deployment attributes consist of tables, components and flows. The deployment model describes the physical location of these attributes. The functional architecture is a not represented in the model, it is a high-level overview of the DWH components, similar to what is shown in figure one.
3.5 Artifacts All the elements displayed in the model are part of one or more artifacts, defined in RUP for BI. A table, for instance, is a deployment attribute, as well as a part of the database model, the BI design model and the BI model. In appendix A the model displays where the RUP for BI artifacts are within the model. This is done to link the RUP for BI theory to the model and make it more comprehensible.
3.6 Summary Traceability is the ability to trace project elements to related project elements. It enables the management of changes to requirements. To find a tool or set of tools that is suitable to support RUP for BI, it is crucial to determine what these specific project elements are and how they relate to each other. Based on the RUP for BI documentation, it is possible to distinguish seven areas of specification. These areas consist of one or more elements and each element can be represented in one or more areas. For instance; a table is part of a datamodel, as well as an ETL flow and a cube. The traceability model visualizes the elements within these seven areas and their traceability.

| Manage your design!
25
4 Selection methodology
4.1 Introduction This chapter goes into depth concerning the software selection methodology used for this research. This particular method will be used to select a toolset based on the model that has been established in the previous chapter. In section 4.2 the method is introduced. Thereafter, section 4.3 discusses the structure of the research. Finally, 4.4 will provide a summary for this chapter.
4.2 The PBA method The package selection- and –implementation method of Capgemini is Perform Package-based Applications, in short PBA. PBA divides a project in phases and activities. Every project is different. Therefore, it is possible to shape PBA so that it fits the specific project. The method consists of three main phases: package selection/information analysis, realization (building of additional functionality) and implementation.
PBA uses a so called ‘four tracks’ approach that describes four areas of activities within a project. These four areas are organisation, package, development and environment. Every activity within the project is performed in one of these areas.
The process model combines the activities with the areas and phases. This model is shown in the next section where it is adapted to fit this research.
4.3 Research structure This research focuses on the selection of a package. The realization and implementation phase are out of scope. The selection/information analysis phase itself consists of three phases: pre-study, determine requirements and package selection.
4.3.1 Pre-study phase In this phase the problem situation is explored and analysed. This has been done in the previous chapters. This leads to a longlist of available packages/tools based on global requirements. In the methodology, the selection project lifecycle starts after this phase is concluded. It is therefore not part of the method itself.
4.3.2 Requirements phase The purpose of this phase is to determine what the system should do in terms of functionality. Based on the global requirements from the prior phase, the detailed requirements are defined. Now the longlist can be brought back to a shortlist. A reference model describes the implications of the implementation for the organization.
4.3.3 Package selection phase Selecting a package based on the vendors offer is the first goal of this phase. The second goal is to test the package to determine if it meets the requirements.

| Manage your design!
26
However, the first goal is out of scope for this research. The conclusion of this research will be a recommendation for a tool or several tools and a workflow description, without acquiring a specific offer from a vendor.
4.3.4 Process model The project specific process model is shown in figure nine.
Fig. 9: process model
The longlist forms the milestone of the pre-study and triggers the requirements definition phase. The reference model leads to the final phase, the package selection.
4.4 Summary Perform Package-based Applications is the standard package selection- and –implementation method of Capgemini. It is a flexible method that can be adapted to the specific situation. There are a number of (optional) phases and activities prescribed in the method. Only the package selection/information analysis phase is used for this research. This phase consists of the pre-study, requirements definition and package selection.
The next chapter describes how the PBA method was used to select suitable modeling tools.

| Manage your design!
27
5 Research definition and results
5.1 Introduction
In this chapter the research results are elaborated. In section 5.2 the results of the pre-study phase are given. The milestone of this phase is the longlist, which can be found in appendix B. Also, the criteria for further research are defined, which leads to the shortlist in 5.3 (appendix B). In this shortlist the detailed requirements are filled in for each tool. The results of the tool evaluation and tests are discussed in section 5.4. Finally, a summary is provided in section 5.5
5.2 Pre-study
The pre-study phase is not a part of the PBA method. A successfully concluded pre-study marks the start of the selection project lifecycle. The phase consist of a the following activities; outlining the requirements, selection of tools and creating the longlist.
5.2.1 The requirements The high-level requirements define the functional areas which a tool should support. These functional areas are based on the areas of specification formulated in section 3.3. The individual requirements are derived from the theory explained in chapter two and the traceability model. The list of requirements can be found in appendix B: the longlist.
5.2.2 Selection of tools A wide variety of modeling tools, ETL tools and BI suites are evaluated for functionality. Not every evaluated tool was added to the longlist. Key factors for adding a tool were the ability to develop (dimensional) datamodels on conceptual, logical and physical level, and/or the importance to the BI industry. For instance, ERwin does not have the capability to model the conceptual level datamodel but it is one of the most used tools in the industry, and therefore added to the list. The tools that are evaluated were selected because they were mentioned in conversations with colleagues, in Gartner or Forrester reports, articles or on related websites (e.g. www.dmreview.com).
The tools are evaluated on functionality and usability. Usability means how suitable the product is for the purposes defined in the problem indication. When a BI suite, for instance, has all the functionality needed but spread out over several tools and just as a small part of the functionality, the usability is very low. To represent the selection criteria, the following classification is used:
Excellent: Good: Reasonable: Mediocre: Poor: Doubtful: ?
These selection criteria are used to determine if a tool should be selected for the shortlist.
| Manage your design!
28
UML? The Unified Modeling Language (UML) specification does not offer the possibility to model dimensional datamodels (or dataflows). However, [Luján-Mora, Trujillo, 2006] describe a technique to use UML for modeling data warehouses by using the component diagrams and deployment diagrams of the UML. This could mean that, for instance, Rational Rose would be suitable for data modeling purposes.
Although this technique offers a solution, it also raises some objections. Firstly, there are already other standards for data modeling (ER, IDEF1x), why adapt UML for this purpose? Secondly, BI colleagues are already experienced in using other modeling notations for data modeling; it would be very time-consuming to teach them how to use UML for this. Tools are meant to support the software development lifecycle. Using UML would only lead to working less efficiently and adapting your own method of working to be able to use a tool. For this reasons, it is not recommended to use UML for data modeling purposes. UML tools are therefore not included on the longlist.
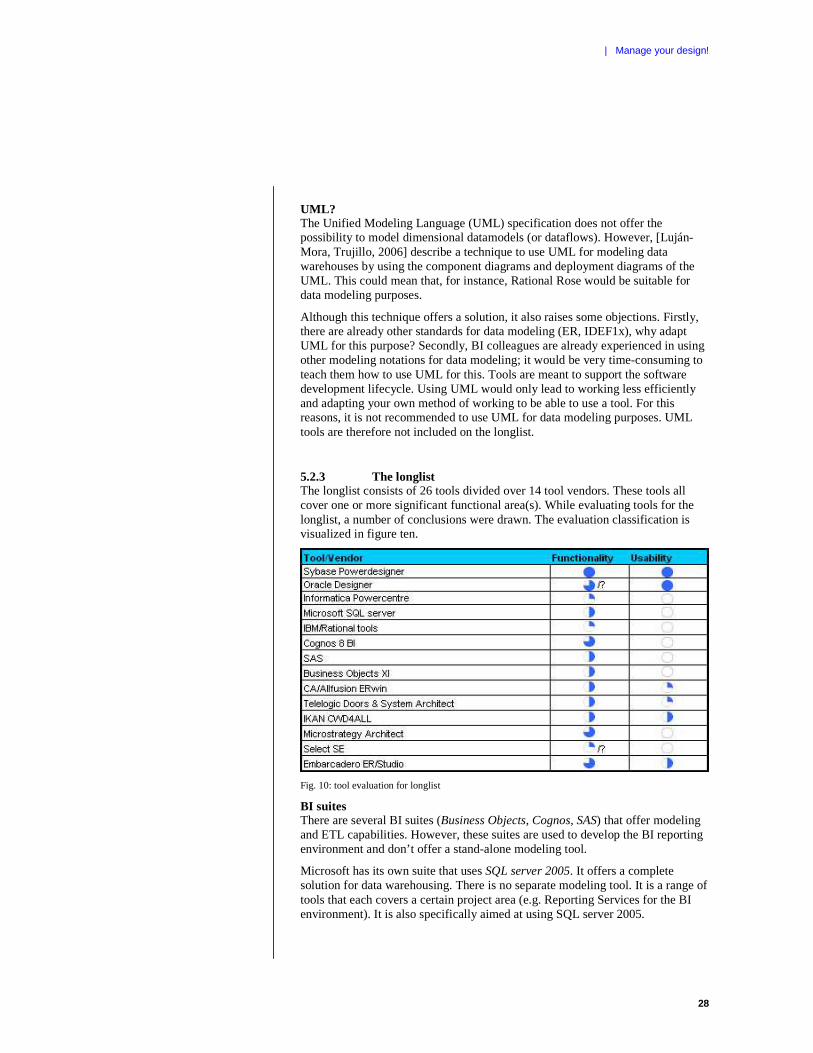
5.2.3 The longlist The longlist consists of 26 tools divided over 14 tool vendors. These tools all cover one or more significant functional area(s). While evaluating tools for the longlist, a number of conclusions were drawn. The evaluation classification is visualized in figure ten.
Fig. 10: tool evaluation for longlist
BI suites There are several BI suites (Business Objects, Cognos, SAS) that offer modeling and ETL capabilities. However, these suites are used to develop the BI reporting environment and don’t offer a stand-alone modeling tool.
Microsoft has its own suite that uses SQL server 2005. It offers a complete solution for data warehousing. There is no separate modeling tool. It is a range of tools that each covers a certain project area (e.g. Reporting Services for the BI environment). It is also specifically aimed at using SQL server 2005.
| Manage your design!
29
Drawing tool Microsoft Visio is a drawing tool that offers a wide variety of diagrams. It is however, not a modeling tool that is able to re-use data elements or keep dependencies. Therefore it is not suitable for documenting system specifications while keeping traceability possible.
ETL tools There is no standard modeling notation for ETL. The lack of a standard makes it impossible to use a modeling tool for ETL. Therefore, ETL tools always offer the functionality to model the ETL processes as well as the execution of the ETL jobs. Informatica Powercentre is the market leader in ETL tools.
Data modeling tools There are several tools that aim specifically at data modeling. The best known is ERwin. This tool offers logical and physical data modeling capabilities. Other tools like Telelogic System Architect and Select SE offer more or less the same functionality. Although popular tools in the BI community, they lack the functionality to design the conceptual datamodel and the dataflows between models.
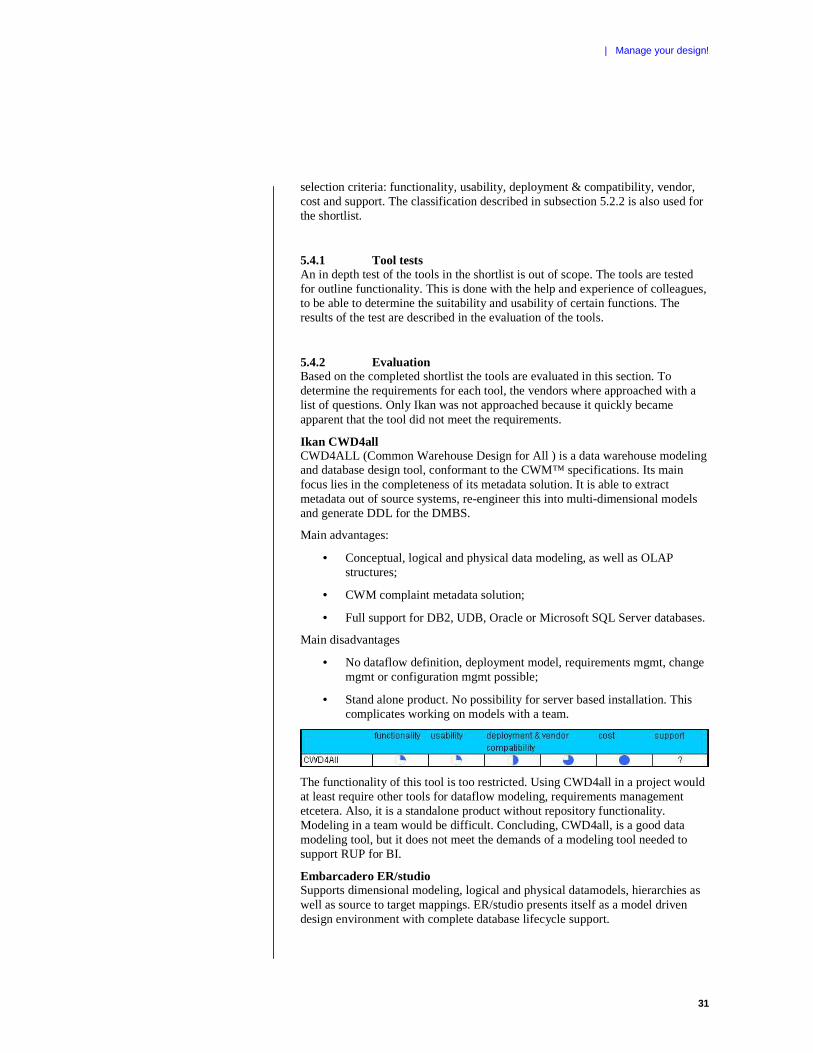
Tools like Ikan CWD4all, Microstrategy Architect and Embarcadero ER/studio enable the conceptual level modeling. However, CWD4all does not offer dataflow modeling and Architect can only be used within the Microstrategy Suite. ER/studio does offer the possibility to describe a high level data mapping between models, but this is limited and only textual.
Sybase Powerdesigner has by far the most functionality integrated in one tool. Next to designing conceptual, logical and physical datamodels, there is a mapping editor tool that enables the visual and textual specification of dataflows/mappings between datamodels. Furthermore, it has a requirements management tool that makes traceability to dataflows and datamodels possible. Next to that, it supports UML.
Oracle Designer is a product with functionality similar to Sybase Powerdesigner. However, Oracle does not provide much information about this product. Even a basic list of features cannot be found on their website. According to Maurice Jutte, an Oracle expert within Capgemini, this is due to the desire of Oracle to stop further development of this product. Since 2003, there has not been a real change in functionality. Oracle wants to build most of Designers functionality into its Warehousebuilder en JDeveloper products, which are development environments.
Longlist conclusions There are four tools that offer enough functionality to be a potentially suitable modeling tool, after the first evaluation. The most important ones are Sybase Powerdesigner and Oracle Designer. The reliability of the Oracle product is questionable however, due to the strategy of Oracle to stop development of the product. The third one is Ikan’s CWD4all. This product offers extensive data modeling capabilities, but lacks dataflow functionality. The last one is Embarcadero ER/studio. Although not well-known within the community, it offers a complete data modeling solution as well as the capability to textually describe data mappings between source and target datamodels. These four tools will be examined in further detail in the shortlist. Furthermore, the Rational tools Requisite Pro, ClearCase, ClearQuest are also added to the shortlist for comparison.
| Manage your design!
30
5.3 Requirements definition In the requirements phase, the detailed requirements are specified. The four tools selected from the longlist are evaluated to determine to which extent they meet the detailed requirements. This activity shapes the shortlist. The reference model describes the impact of the implementation for the organisation.
5.3.1 Detailed requirements The detailed requirements are divided into a few categories;
• General: what is the current version of the product, in which packages is the product available and what package would be recommended;
• Compatibility: import/export options, which DBMS are supported, which modeling and metadata standards are supported;
• Deployment: installation options: can the product be installed on a ppt (Capgemini laptop) or is a server-based installation possible? Which platforms are supported and, relating to research objective two, what are version & change management capabilities;
• Vendor information: address, location, contact person etcetera;
• Conditions: purchase options, license structure and the average costs per year when using ten licenses for three years;
• Vendor support: support, training options.
All the detailed requirements can be found in the shortlist in appendix B.
5.3.2 Shortlist The Rational tools are added as a separate column to the shortlist. More specific, Requisite Pro (requirements mgmt), ClearCase (configuration mgmt) and ClearQuest (Change mgmt). These products are standard within Capgemini RUP projects. Although the tools are definitly not a ‘natural fit’for bi projects, they are added to this comparison to display the added value. The usability of these tool is described in section 5.4.
5.3.3 Reference model A reference model describes the impact of the implementation for the organization. However, in this particular case, the impact is not in the implementation of the modeling tool but in the adoption of the RUP for BI method within the BI practices.
For this situation, the reference model is adapted to a project scenario. This is a practically oriented specification of how a specific tool or set of tools should be used within the context of a project. This project scenario is formulated based on the experience of colleagues and the RUP for BI documentation. Because the scenario is based on the recommended tools, this specification is formulated in a separate chapter after the conclusions, chapter seven.
5.4 Package selection In this section the tools are evaluated based on the detailed requirements and the tests performed on the tools. The tools are evaluated based on the following
| Manage your design!
31
selection criteria: functionality, usability, deployment & compatibility, vendor, cost and support. The classification described in subsection 5.2.2 is also used for the shortlist.
5.4.1 Tool tests An in depth test of the tools in the shortlist is out of scope. The tools are tested for outline functionality. This is done with the help and experience of colleagues, to be able to determine the suitability and usability of certain functions. The results of the test are described in the evaluation of the tools.
5.4.2 Evaluation Based on the completed shortlist the tools are evaluated in this section. To determine the requirements for each tool, the vendors where approached with a list of questions. Only Ikan was not approached because it quickly became apparent that the tool did not meet the requirements.
Ikan CWD4all CWD4ALL (Common Warehouse Design for All ) is a data warehouse modeling and database design tool, conformant to the CWM™ specifications. Its main focus lies in the completeness of its metadata solution. It is able to extract metadata out of source systems, re-engineer this into multi-dimensional models and generate DDL for the DMBS.
Main advantages:
• Conceptual, logical and physical data modeling, as well as OLAP structures;
• CWM complaint metadata solution;
• Full support for DB2, UDB, Oracle or Microsoft SQL Server databases.
Main disadvantages
• No dataflow definition, deployment model, requirements mgmt, change mgmt or configuration mgmt possible;
• Stand alone product. No possibility for server based installation. This complicates working on models with a team.
The functionality of this tool is too restricted. Using CWD4all in a project would at least require other tools for dataflow modeling, requirements management etcetera. Also, it is a standalone product without repository functionality. Modeling in a team would be difficult. Concluding, CWD4all, is a good data modeling tool, but it does not meet the demands of a modeling tool needed to support RUP for BI.
Embarcadero ER/studio Supports dimensional modeling, logical and physical datamodels, hierarchies as well as source to target mappings. ER/studio presents itself as a model driven design environment with complete database lifecycle support.
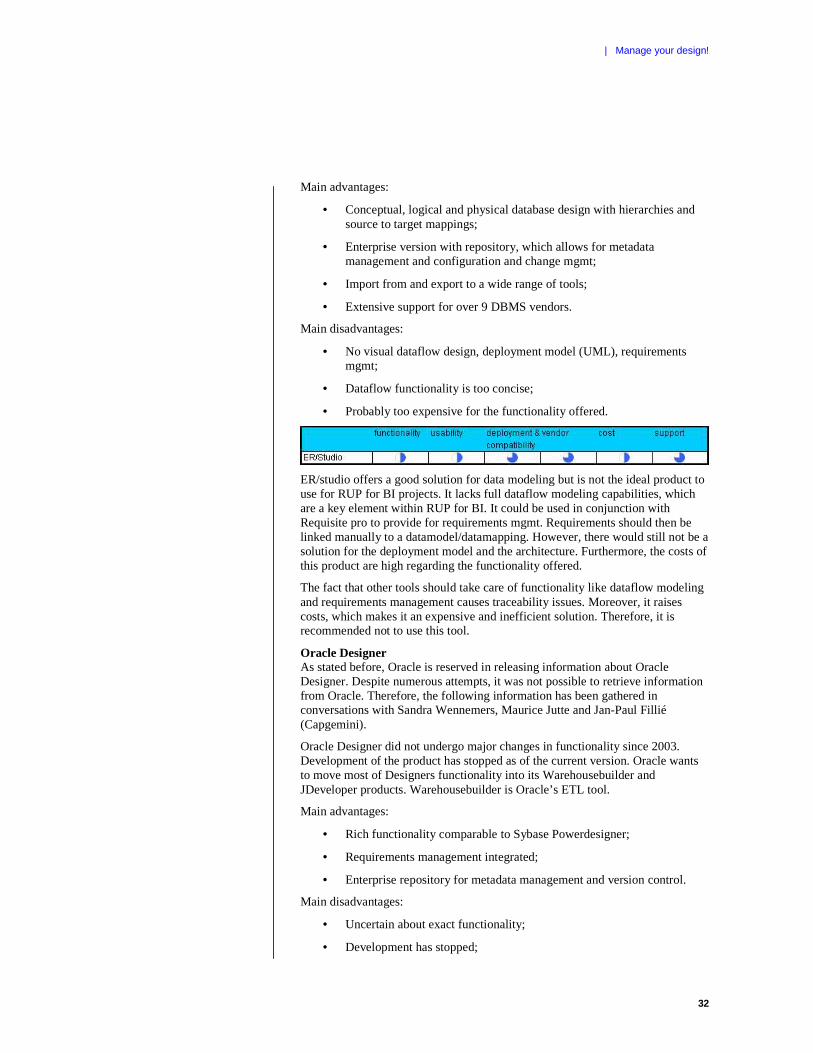
| Manage your design!
32
Main advantages:
• Conceptual, logical and physical database design with hierarchies and source to target mappings;
• Enterprise version with repository, which allows for metadata management and configuration and change mgmt;
• Import from and export to a wide range of tools;
• Extensive support for over 9 DBMS vendors.
Main disadvantages:
• No visual dataflow design, deployment model (UML), requirements mgmt;
• Dataflow functionality is too concise;
• Probably too expensive for the functionality offered.
ER/studio offers a good solution for data modeling but is not the ideal product to use for RUP for BI projects. It lacks full dataflow modeling capabilities, which are a key element within RUP for BI. It could be used in conjunction with Requisite pro to provide for requirements mgmt. Requirements should then be linked manually to a datamodel/datamapping. However, there would still not be a solution for the deployment model and the architecture. Furthermore, the costs of this product are high regarding the functionality offered.
The fact that other tools should take care of functionality like dataflow modeling and requirements management causes traceability issues. Moreover, it raises costs, which makes it an expensive and inefficient solution. Therefore, it is recommended not to use this tool.
Oracle Designer As stated before, Oracle is reserved in releasing information about Oracle Designer. Despite numerous attempts, it was not possible to retrieve information from Oracle. Therefore, the following information has been gathered in conversations with Sandra Wennemers, Maurice Jutte and Jan-Paul Fillié (Capgemini).
Oracle Designer did not undergo major changes in functionality since 2003. Development of the product has stopped as of the current version. Oracle wants to move most of Designers functionality into its Warehousebuilder and JDeveloper products. Warehousebuilder is Oracle’s ETL tool.
Main advantages:
• Rich functionality comparable to Sybase Powerdesigner;
• Requirements management integrated;
• Enterprise repository for metadata management and version control.
Main disadvantages:
• Uncertain about exact functionality;
• Development has stopped;
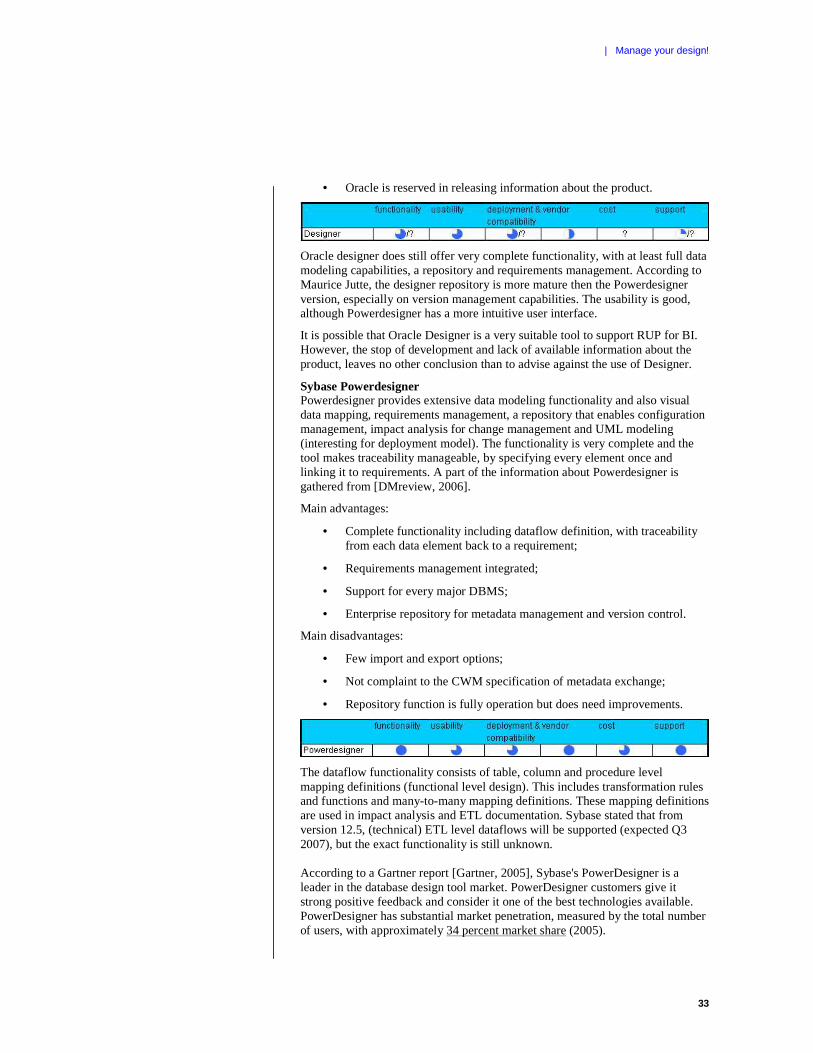
| Manage your design!
33
• Oracle is reserved in releasing information about the product.
Oracle designer does still offer very complete functionality, with at least full data modeling capabilities, a repository and requirements management. According to Maurice Jutte, the designer repository is more mature then the Powerdesigner version, especially on version management capabilities. The usability is good, although Powerdesigner has a more intuitive user interface.
It is possible that Oracle Designer is a very suitable tool to support RUP for BI. However, the stop of development and lack of available information about the product, leaves no other conclusion than to advise against the use of Designer.
Sybase Powerdesigner Powerdesigner provides extensive data modeling functionality and also visual data mapping, requirements management, a repository that enables configuration management, impact analysis for change management and UML modeling (interesting for deployment model). The functionality is very complete and the tool makes traceability manageable, by specifying every element once and linking it to requirements. A part of the information about Powerdesigner is gathered from [DMreview, 2006].
Main advantages:
• Complete functionality including dataflow definition, with traceability from each data element back to a requirement;
• Requirements management integrated;
• Support for every major DBMS;
• Enterprise repository for metadata management and version control.
Main disadvantages:
• Few import and export options;
• Not complaint to the CWM specification of metadata exchange;
• Repository function is fully operation but does need improvements.
The dataflow functionality consists of table, column and procedure level mapping definitions (functional level design). This includes transformation rules and functions and many-to-many mapping definitions. These mapping definitions are used in impact analysis and ETL documentation. Sybase stated that from version 12.5, (technical) ETL level dataflows will be supported (expected Q3 2007), but the exact functionality is still unknown. According to a Gartner report [Gartner, 2005], Sybase's PowerDesigner is a leader in the database design tool market. PowerDesigner customers give it strong positive feedback and consider it one of the best technologies available. PowerDesigner has substantial market penetration, measured by the total number of users, with approximately 34 percent market share (2005).
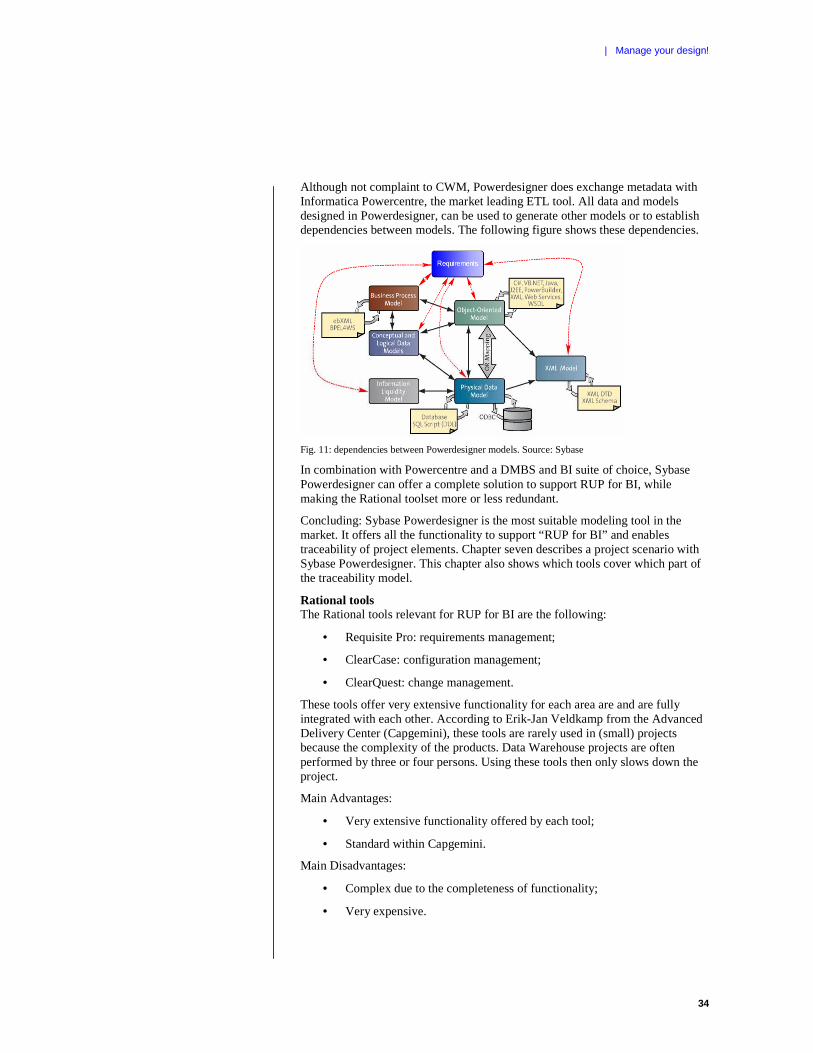
| Manage your design!
34
Although not complaint to CWM, Powerdesigner does exchange metadata with Informatica Powercentre, the market leading ETL tool. All data and models designed in Powerdesigner, can be used to generate other models or to establish dependencies between models. The following figure shows these dependencies.
Fig. 11: dependencies between Powerdesigner models. Source: Sybase
In combination with Powercentre and a DMBS and BI suite of choice, Sybase Powerdesigner can offer a complete solution to support RUP for BI, while making the Rational toolset more or less redundant.
Concluding: Sybase Powerdesigner is the most suitable modeling tool in the market. It offers all the functionality to support “RUP for BI” and enables traceability of project elements. Chapter seven describes a project scenario with Sybase Powerdesigner. This chapter also shows which tools cover which part of the traceability model.
Rational tools The Rational tools relevant for RUP for BI are the following:
• Requisite Pro: requirements management;
• ClearCase: configuration management;
• ClearQuest: change management.
These tools offer very extensive functionality for each area are and are fully integrated with each other. According to Erik-Jan Veldkamp from the Advanced Delivery Center (Capgemini), these tools are rarely used in (small) projects because the complexity of the products. Data Warehouse projects are often performed by three or four persons. Using these tools then only slows down the project.
Main Advantages:
• Very extensive functionality offered by each tool;
• Standard within Capgemini.
Main Disadvantages:
• Complex due to the completeness of functionality;
• Very expensive.
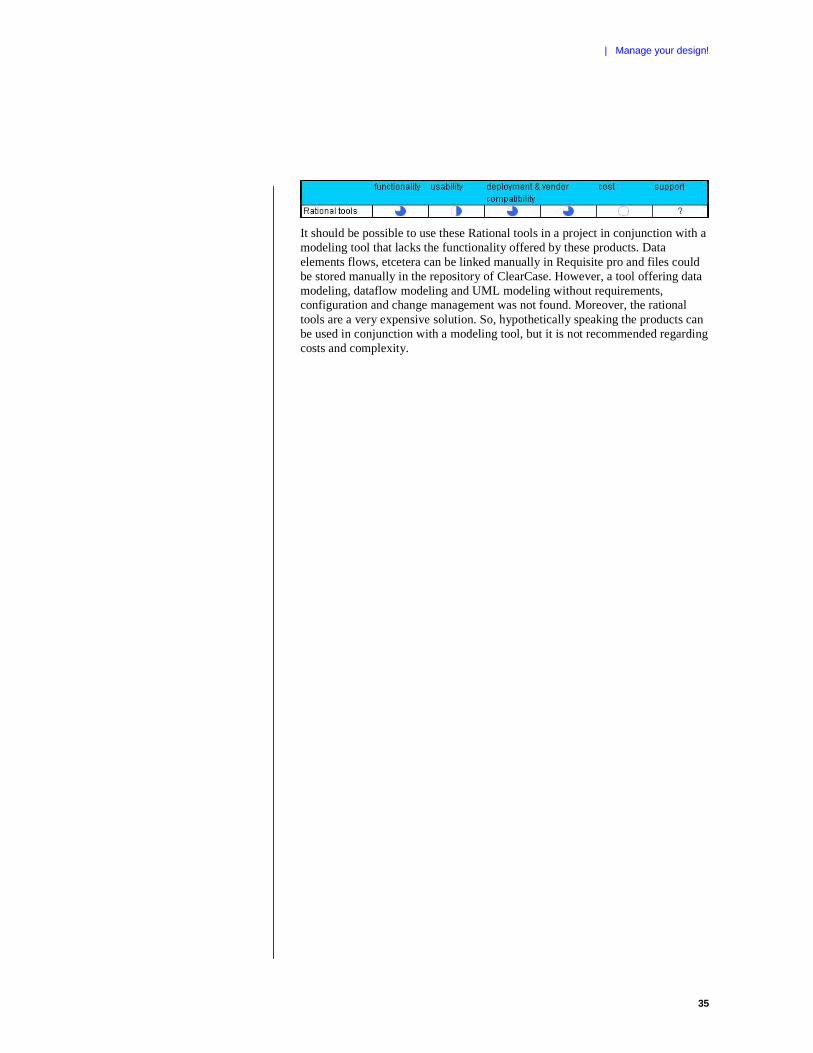
| Manage your design!
35
It should be possible to use these Rational tools in a project in conjunction with a modeling tool that lacks the functionality offered by these products. Data elements flows, etcetera can be linked manually in Requisite pro and files could be stored manually in the repository of ClearCase. However, a tool offering data modeling, dataflow modeling and UML modeling without requirements, configuration and change management was not found. Moreover, the rational tools are a very expensive solution. So, hypothetically speaking the products can be used in conjunction with a modeling tool, but it is not recommended regarding costs and complexity.
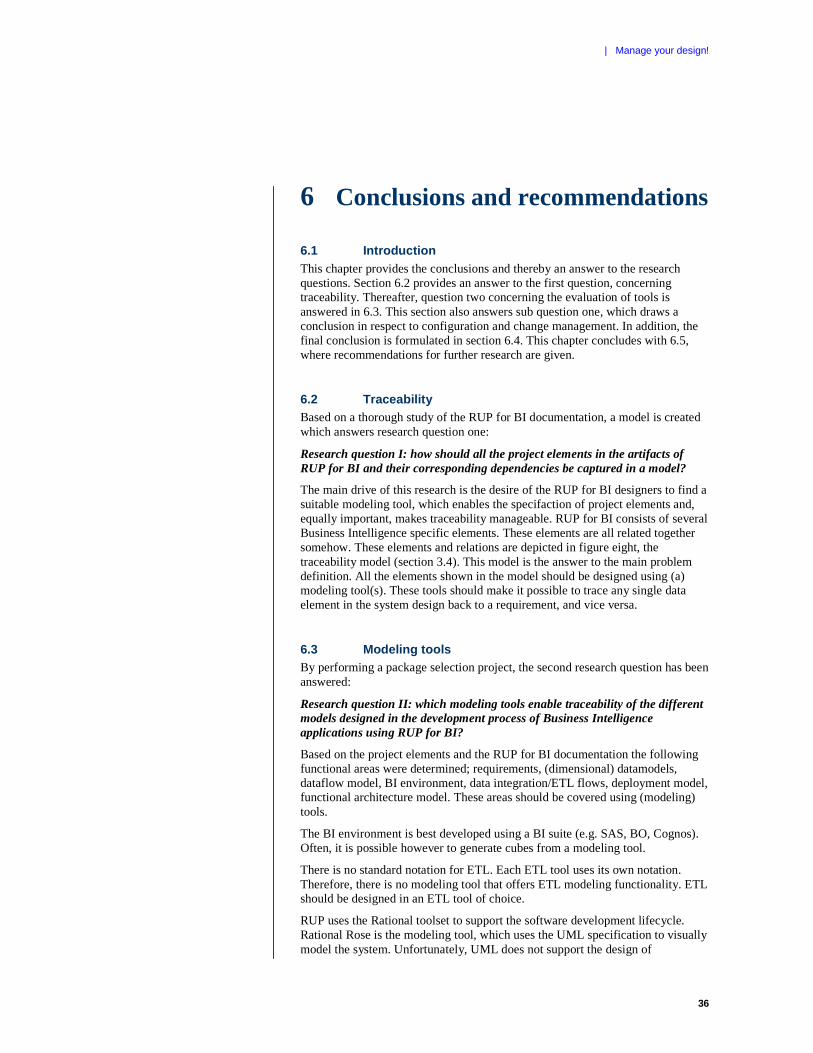
| Manage your design!
36
6 Conclusions and recommendations
6.1 Introduction This chapter provides the conclusions and thereby an answer to the research questions. Section 6.2 provides an answer to the first question, concerning traceability. Thereafter, question two concerning the evaluation of tools is answered in 6.3. This section also answers sub question one, which draws a conclusion in respect to configuration and change management. In addition, the final conclusion is formulated in section 6.4. This chapter concludes with 6.5, where recommendations for further research are given.
6.2 Traceability Based on a thorough study of the RUP for BI documentation, a model is created which answers research question one:
Research question I: how should all the project elements in the artifacts of RUP for BI and their corresponding dependencies be captured in a model?
The main drive of this research is the desire of the RUP for BI designers to find a suitable modeling tool, which enables the specifaction of project elements and, equally important, makes traceability manageable. RUP for BI consists of several Business Intelligence specific elements. These elements are all related together somehow. These elements and relations are depicted in figure eight, the traceability model (section 3.4). This model is the answer to the main problem definition. All the elements shown in the model should be designed using (a) modeling tool(s). These tools should make it possible to trace any single data element in the system design back to a requirement, and vice versa.
6.3 Modeling tools By performing a package selection project, the second research question has been answered:
Research question II: which modeling tools enable traceability of the different models designed in the development process of Business Intelligence applications using RUP for BI?
Based on the project elements and the RUP for BI documentation the following functional areas were determined; requirements, (dimensional) datamodels, dataflow model, BI environment, data integration/ETL flows, deployment model, functional architecture model. These areas should be covered using (modeling) tools.
The BI environment is best developed using a BI suite (e.g. SAS, BO, Cognos). Often, it is possible however to generate cubes from a modeling tool.
There is no standard notation for ETL. Each ETL tool uses its own notation. Therefore, there is no modeling tool that offers ETL modeling functionality. ETL should be designed in an ETL tool of choice.
RUP uses the Rational toolset to support the software development lifecycle. Rational Rose is the modeling tool, which uses the UML specification to visually model the system. Unfortunately, UML does not support the design of
| Manage your design!
37
dimensional datamodels and dataflows. Rational Rose should therefore be replaced by another modeling solution. Other significant Rational tools are RequisitePro (requirements management), ClearCase (configuration management) and ClearQuest (change management). These tools can be used in combination with a modeling tool.
A wide range of tools are evaluated based on the functional areas specified above. Four tools offered enough functionality for further investigation; Embarcadero ER/studio, IKAN CWD4all, Oracle Designer and Sybase Powerdesigner. After the first selection the requirements were detailed, taking deployment, usability, compatibility, costs and training possibilities into account. This led to the following conclusions:
• CWD4all has an extensive metadata solution but does not offer enough functionality to be a suitable solution;
• ER/studio has powerful datamodeling capabilities but lacks detailed, visual dataflow modeling and requirements management. Therefore it needs to be complemented with other tools which obstructs traceability and makes it an expensive solution.
• Oracle Designer covers most of the functional areas and is perhaps a suitable tool. The issue here is that Oracle does not release much information about this product. The development of the product has stopped and Oracle wants to move the functionality into its Jdeveloper and Warehousebuilder tools. Due to this, use of Designer cannot be recommended.
• Sybase Powerdesigner covers all the functional areas specified. Moreover, it manages traceability with its requirements module and uses a repository for metadata management. Powerdesigner is the only tool suitable to support RUP for BI.
6.3.1 Configuration and change management The subquestion of research question two is handled in this section:
Subquestion I: To which extent do these tools support configuration and change management in RUP for BI projects?
Configuration management is, most importantly, the ability to keep versioning of files/models under control. Change management enforces rules to implement changes in a system. Powerdesigner supports both. Version management is implemented in the repository. All files are stored and managed in this repository, making team-based modeling possible. Change management is enabled through the impact analysis functionality, which describes how a change in the system impacts other parts related to that change.
ClearCase and ClearQuest offer extensive capabilities for, respectively, configuration and change management. These products are very complete, this is however also their disadvantage. It makes the tools complex, and as a results they are not often used within small projects in spite of the fact that it is the standard for Capgemini. Powerdesigner makes these functionalities more practical and applicable.
| Manage your design!
38
6.4 Conclusions The problem statement for this research can now be answered. The statement is:
How can a RUP for BI model, showing project elements and its dependencies, be supported by modeling tool(s)?
Sybase Powerdesigner is the most suitable modeling tool in the market to support RUP for BI. It offers the following functionality:
• Requirements management;
• Datamodeling on conceptual, logical and physical level. Hierarchies are suppported;
• Dataflow modeling with table, column and procedure level mapping definitions. Including transformation rules and functions and many-to-many mapping definitions;
• Repository for metadata management and versioning control;
• Impact analysis functionality to support change management;
• UML modeling to specify the deployment model;
• So called “free model” which can be used to model a functional architecture;
• All of these models are linked to eachother making traceability possible.
Using Powerdesigner in combination with a DBMS, ETL tool and BI suite of choice makes it possible to fully support the RUP for BI lifecycle while managing traceability. To approach the practical side of RUP for BI, a project scenario supported by Powerdesigner is formulated in chapter seven. This chapter also shows how tools cover the elements of the traceability model.
6.5 Recommendations This research is the starting point for further investigation. Sybase Powerdesigner is evaluated on functionality and outline usability. The following step is to thoroughly test the functionality with a group of BI experts. This can be achieved by using the scenario in chapter seven and documentation of existing projects.
This should lead to the final decision, whether Powerdesigner should be used as the new modeling standard within the BI practices. If so, the project scenario should be adapted and further detailed, to provide an input for project members.
The traceability model can be used in projects to help understand what the project elements are and how they are related.
| Manage your design!
39
7 Project scenario
7.1 Using Sybase Powerdesigner in a project This scenario describes how a project could be supported by Sybase Powerdesigner. The, for RUP for BI adapted, disciplines and their corresponding roles, artifacts and activities are linked to the use of tools. Testing is not included in this scenario. Further research must point out which test tool to use and how to integrate this into the scenario.
7.1.1 Requirements discipline In this discipline, the System Analyst develops the requirements management plan from the stakeholder requests. These requests and the supplementary specifications are managed in the requirements management tool of Sybase Powerdesigner. Synchronization with Word is possible. Every request/specification is stored separately in a matrix. For each stakeholder request a dataflow is developed which is connected to the corresponding request in the matrix (the development of a dataflow is described in the third paragraph). This makes traceability possible.
The System Analyst also describes a conceptual and high-level logical datamodel for the Data Warehouse/ Data marts in this discipline. This is done in Powerdesigner. The models should be linked to the requirements for traceability purposes. The data in the datamodels is stored in a server-based enterprise repository to define a common data vocabulary, so that every data element is only described once. The repository also stores metadata, offers capabilities for role-based security on models and sub-models, version control configuration management and difference reports between models and versions.
A high level data mapping is designed based on the data model and the selected source systems. The System Analyst uses Powerdesigner to drag from a data source definition (database or other, represented as a Powerdesigner Physical Data Model) to the Warehouse target and create table and column level mapping definitions. This is the Dataflow model (high level) artifact. These dataflows are then named and linked to a requirement. The Software Architect prioritizes the dataflows to determine which dataflows are to be analyzed in the current iteration. The flows are constantly refined and detailed during the project lifecycle. This is the responsibility of the requirements specifier.
One of the major issues of this discipline is managing changes in requirements. If a change should be made in the requirements, the System Analyst uses Powerdesigner to make an impact analysis for the change. This offers the possibility to view how every model is affected by the changing requirement, and to anticipate on this. Furthermore, the System Analyst is responsible for managing traceability between requirements and models.
7.1.2 Analysis & design discipline This discipline starts with defining a candidate architecture. The Sofware Architect performs the architectural analysis. A product of this activity is the deployment model artifact. The visual representation of the deployment model, a UML model, is made in Powerdesigner. In this phase the (ETL) designer performs the dataflow analysis, where the data elements in the source systems

| Manage your design!
40
are mapped to the (now detailed) logical data model. This is the final design phase of the dataflow that can be performed with Powerdesigner, which leads to the dataflow realization artifact. This activity includes naming design elements and specifying transformation rules and functions. These mapping definitions can be used in impact analysis and as documentation for the warehouse ETL designer. Project experience should point out what the limits of Powerdesigner exactly are in designing the dataflows.
The (ETL) Designer role is responsible for designing dataflows, flows and components. An ETL tool is used for defining and designing the design component and design flow artifacts. There is currently no modeling tool that offers the possibility to export dataflow designs to an ETL environment. This is partly due to a lack of standards notation for ETL components. Therefore the Designer uses the ETL documentation of Powerdesigner. ETL flows should be named and linked to the corresponding requirements. Also, all files produced by the ETL environment should be stored in the Powerdesigner repository for versioning control (depending on the project size).
Designing logical/physical datamodels is done in Powerdesigner. The Database designer uses the Design component artifact as input to the Database design. The physical datamodel is designed in Powerdesigner and generated into a database using a DBMS.
In the Design BI model activity the BI designer develops and prototypes the (dimensional) BI model in the form of universes, working cubes or example reports. Cubes can be designed in Powerdesigner; it is up to the responsible role to decide whether to use a BI tool or Powerdesigner for this. In the context of traceability, it is advised to use Powerdesigner. All cube, universe and report files can be stored in the Powerdesigner repository for versioning control (depending on the project size). It is necessary to textually link report definitions (made in a BI tool) to requirements for traceability and impact analysis.
7.1.3 Implementation discipline The Integrator makes use of the versioning capabilities of the Powerdesigner repository. He uses the latest developed components to compile builds and is responsible for the system integration.
7.1.4 Other At the start of a project, the configuration manager should get the responsibility of managing traceability. This task will include documenting dependencies between requirements, dataflows, ETL flows, report definitions, etc. with the help of Powerdesigner.
Every project member that does not need to use Powerdesigner but does need to view the models can use the viewer version which can be downloaded for free from the Sybase website.

| Manage your design!
41
7.1.5 Project overview The table below shows which roles produce which artifact in a certain project area and which tool supports this.
Fig. 12: Project artifacts covered by tools.
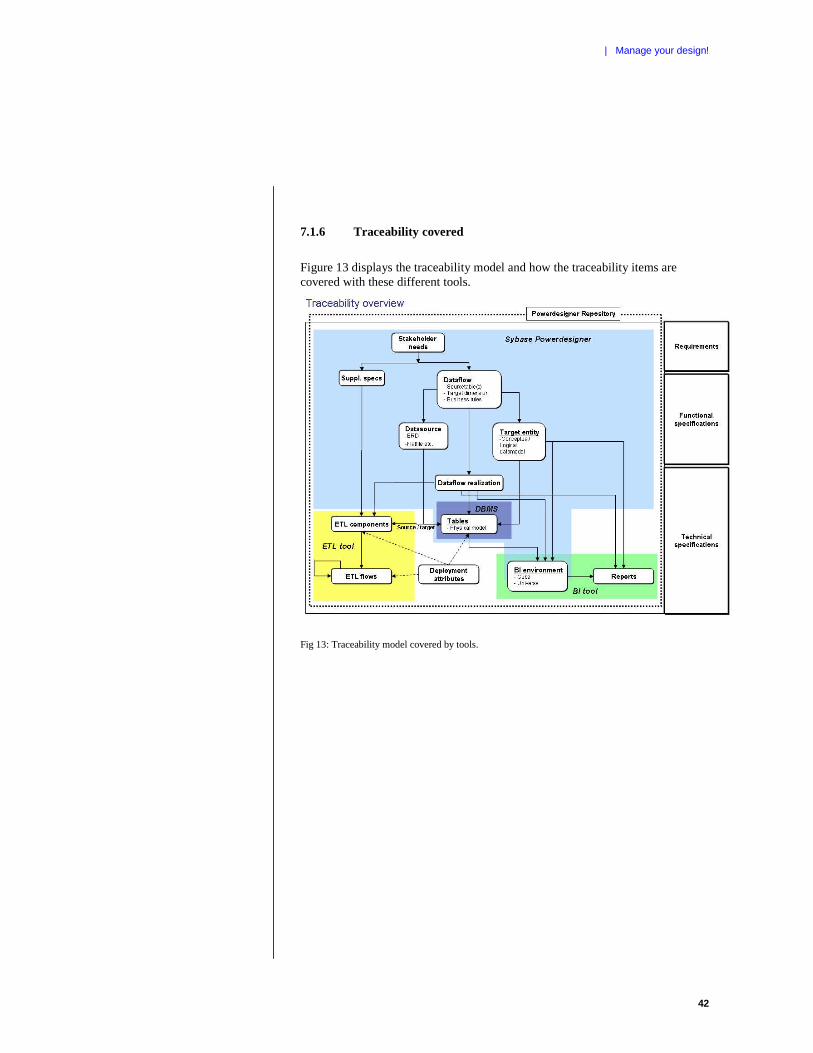
| Manage your design!
42
7.1.6 Traceability covered
Figure 13 displays the traceability model and how the traceability items are covered with these different tools.
Fig 13: Traceability model covered by tools.
| Manage your design!
43
References
Literature Capgemini1, Introductie Business Intelligence en Data Warehousing (training material). 2004.
Capgemini2, RUP Awareness (training material). 2005.
Capgemini3, RUP for BI (training material). 2006.
Capgemini4, Developmentcase ADC BI (all documents). 2006. https://troom.capgemini.com/BIFactory/Developmentcase%20ADC%20BI/Forms/AllItems.aspx.
DMReview, moving to Powerdesigner from Erwin (webseminar), December 2006. http://www.dmreview.com/web/archive/06/112006syb/sybase.cfm?sourcecode=P1dmd112906.
Gartner, Vendor rating: Sybase, 2005. Capgemini, 2005.
IBM corp., Rational Unified Process 2003®. Version 2003.06.13. Capgemini, 2006.
Inmon, W.H., Building the Data Warehouse, Third Edition. Wiley Publishing, Inc., 2001.
Kimball, R., and Caserta, J., The Datawarehouse ETL toolkit. Wiley Publishing, Inc., 2004.
Kimball, R., et al., The Data Warehouse Lifecycle Toolkit. Wiley Publishing, Inc, 1998.
Luján Mora, S., and Trujillo, J., Physical modeling of Data Warehouses using UML. Journal of Database Management, Vol. 17, Issue 2, 2004. Capgemini references
Alex Aalberts: my mentor at Capgemini. I spoke to him at least once a week about the progress of the research. He is also one of the designers of RUP for BI, he explained and clarified a lot of the theory of RUP for BI.
Jan Paul Fillié: also a designer of RUP for BI. I talked with him about the technical side of RUP for BI.
Sandra Wennemers: an experienced data architect. I talked several times with her about the progress. We primarely discussed (new) ideas with eachother.
Stefan van Duin: BI/DWH thought leader. Discussed project elements and dependencies with him.
Eric-Jan Veldkamp: Tool specialist ADC. I talked to him about the use of Rational tools within the ADC.
Maurice Jutte: Oracle BI expert. I talked to him about Oracle designer and Sybase Powerdesigner.
Tom van Maanen: ETL expert. Spoken about ETL standards and tools.

| Manage your design!
44
Jaap Hartholt: person responsible for all RUP trainings within the Academy. I presented my ideas to him and discussed them.
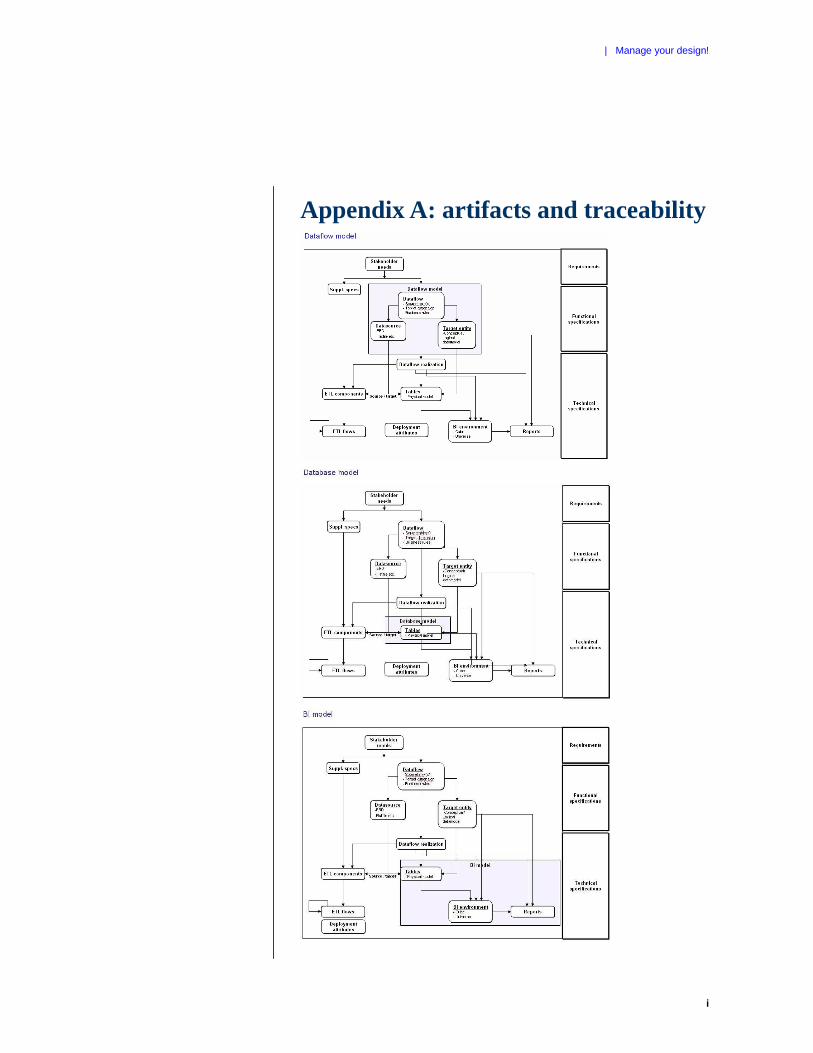
| Manage your design!
i
Appendix A: artifacts and traceability

| Manage your design!
ii

| Manage your design!
iii
Appendix B: longlist and shortlist
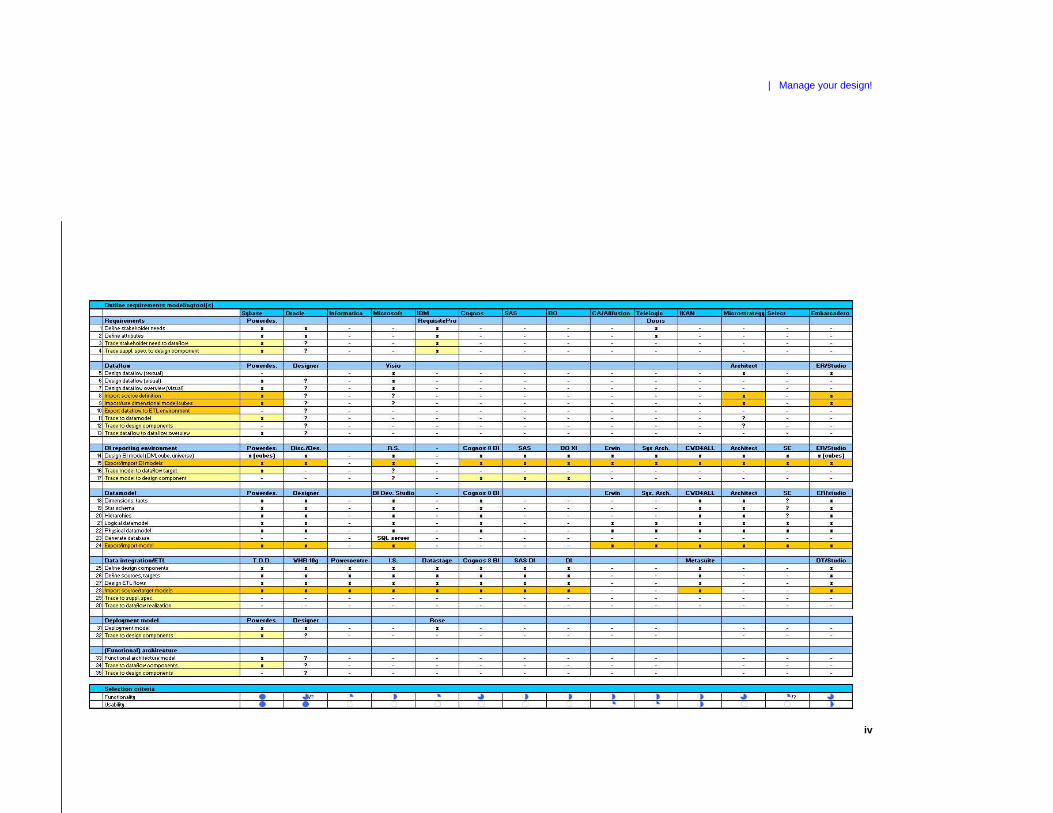
| Manage your design!
iv

| Manage your design!
v

vi
About Capgemini and the Collaborative Business Experience
Capgemini, one of the world’s foremost providers of Consulting, Technology and Outsourcing services, has a unique way of working with its clients, called the Collaborative Business Experience.
Backed by over three decades of industry and service experience, the Collaborative Business Experience is designed to help our clients achieve better, faster, more sustainable results through seamless access to our network of world-leading technology partners and collaboration-focused methods and tools. Through commitment to mutual success and the achievement of tangible value, we help businesses implement growth strategies, leverage technology and thrive through the power of collaboration. Capgemini employs approximately 61,000 people worldwide and reported 2005 global revenues of 6,954 million euros.
The Capgemini Group is headquartered in Paris.
www.capgemini.com